managing risk in a bull market dr. hugo banziger€¦ · managing risk in a bull market ... trading...
TRANSCRIPT

Chief Risk Officer
Managing Risk in a Bull Market
Goldman Sachs European Financials ConferenceLisbon, 14 June 2007
Dr. Hugo Banziger
Investor Relations 06/07 · 2
Agenda
Outstanding performance1
Outlook for major risk buckets2
Summary4
Update on Basel II3

Investor Relations 06/07 · 3
First quarter 2007 results Strong profit growth and outperformance against key targets
(1) 2003-2004 underlying; 2005 as per target definition: excludes restructuring activities and substantial gains from industrial holdings; from 2006 as per revised target definition: excludes significant gains (net of related expenses) / charges
(2) 2003-2005 reported; from 2006 as per revised target definition: excludes significant gains (net of related expenses) / chargesNote: 2003-2005 based on U.S. GAAP, 2006 onwards based on IFRS
3.22.84.0
6.1
2.6
8.3
2003 2004 2005 2006 1Q07
Income before income taxesIn EUR bn
22%1.6
3.52.5
1.42.1
6.1
2003 2004 2005 2006 1Q07
Net incomeIn EUR bn
29%
13 16
3125
4140
2003 2004 2005 2006 1Q07
Pre-tax RoE (target definition)(1)
In %1ppt
1Q2006
3.882.31
4.53
6.95
2.87
10.24
2003 2004 2005 2006 1Q07
Diluted EPS (target definition)(2)
In EUR
35%

Investor Relations 06/07 · 4
5.7
12.9
7.2
2002 - 2006
1.30 1.50 1.70
2.50
4.00
Delivery to shareholders
Dividend per share
20062002 2003 2004 2005
In EUR
Cash returned to shareholdersIn EUR bn
Share retirements
Dividends
32% CAGR

Investor Relations 06/07 · 5
139 153189183172
148
3.13.23.9
10.8
4.86.6
9.7
4.3 2.72.5 2.42.6
2002 2003 2004 2005 2006 1Q07
De-risked the bank…
Deleveraged the bank, reduced alternative assetsStreamlined risk management Reduced LLPs and costs, loan losses now retail-driven
Significant reduction in credit losses
Provision for credit lossesLoan book development
994
2,108
1,063
307 350 29898
2001 2002 2003 2004 2005 2006 1Q07
CIB PCAM CI / ReconciliationLoan book Problem loans Alternative assets
(1)
(2)
In EUR mIn EUR bn, at period end
(1) After deconsolidation of EUROHYPO (EUR 56 bn) and DFS (EUR 6 bn)(2) Deconsolidation of EUROHYPO (EUR 1.3 bn)Note: 2006 & 2007 figures according to IFRS

Investor Relations 06/07 · 6
…and focussed on strict balance sheet discipline
CorporatesFinancial Institutions
economic profit
2002 2004 2006
Loan Screening Committees introduced more disciplined approach to loan origination, pricing and distribution and helped to achieve RoE targets
economic loss
2002 2004 2006
economic profit
Total Financial InstitutionsThereof Non Bank Financial Institutions Thereof German MidCapsTotal Corporates
Economic profit development 2002 – 1Q2007
1Q071Q07

Investor Relations 06/07 · 7
Disciplined approach in market risk management…Efficiency further improved and loss-making days down
VaR & EC levels only moderately up despitesignificant volume increaseRisk efficiency measured in sales & trading revenues/Ø VaR further improved and well above peersTrading day losses at DB down compared to 2005 and below peer averageHigh rate of new product approvals well managedSeveral new product types integrated (structured, Emerging Markets, credit)
(1) Company information; Sales & Trading revenues / VaR per trading day in %; converted to 99% confidence level, 1-day holding period(2) Company information
Sales & Trading revenues / Ø VaR(1)
Loss-making days 2005 & 2006(2)
100102 1Q2006 1Q2007
10 20 30 40 50 60
2005 2006
Deu
tsch
eB
ank
Cre
dit
Sui
sse
Mer
rill
Lync
h
Citi
grou
p
JPM
orga
n
Mor
gan
Sta
nley
Bea
rS
tear
ns
Gol
dman
Sac
hs
Lehm
anB
roth
ers
Lehman BrothersUBS
Deutsche BankMerrill Lynch
Credit SuisseMorgan Stanley
CitigroupJP Morgan
Goldman Sachs

Investor Relations 06/07 · 8
…and strict management of operational risksOverall level of losses contained in growth phase
Strong growth in net income & transaction volumes since 2004…..…however, Operational Risk losses have been containedResult of strengthened “top level” control culture- Increased risk transparency &
governance- Implementation of lessons learned & low
impact loss targets- Invigorated risk monitoring techniques
Focused on-going targeted initiatives include- IT capacity forecasting & modelling- Operations process simulation- Refinement & consolidation of Group
Polices & Procedures
Transaction volumes* OR losses (rhs)Qtr net income (lhs)
In % of trans. volume*
In % of net income
2004 2005 2006
Net income, transaction volumes* and losses
1Q2007
2004 2005 2006
Losses in % of net income & transaction volumes*
1Q2007
* Transactions indexed to 1Q2004; based on CIB average daily trades, PCB Online Banking Transactions and PCB Securities & Custody Trades

Investor Relations 06/07 · 9
… Pandemic risk strategy
Pandemic & cyber risk managementPreparedness & prevention through strategy & governance
Phases 1 to 3 Phases 4 to 6
■ Plan business strategy■ Order cleaning supplies & PPE■ Assess vendor readiness■ Educate staff■ Maintain Intelligence sources
■ Invoke crisis management ■ Invoke Asian Influenza plan■ Review business strategy■ Communicate to staff
Preparation for pandemic event
Four-phased corporate action plan aligned with international SOS and WHO
Regional planning groups with strong business representation since 1Q2006
Supervised by tight governance structure
Prevention of cyber attacksPro-active network intelligence collectionContinuous vulnerability probes, pre-empting new exploits & penetration techniquesAnomaly detection, root cause determination, remediationFraud detection, close liaison with criminal investigators globally
AssymetricAmorphous
Threats
Integrated DefenseToolkit
Hidden web analysis
Vulnerability probes
Deep incident analysis
Firewalls
Patch management
Staff education
Impenetrable
Secure
Fully Functional
DB IT Infrastructure &
Framework
Cyber risk strategy
Port Scans
DDOS
Viruses/Worms
Trojans/Bots
SPAM/Phishing
E-mail Wiretapping
Spyware
Social Engineering

Investor Relations 06/07 · 10
Market RiskCredit Risk Operational Risk Business Risk
Interest RatesFX Rates Default Rates
0.00%
1.00%
2.00%
3.00%
4.00%
5.00%
6.00%
7.00%
0.00
0.50
1.00
1.50
2.00
2.50
3.00
3.50
4.00
4.50
5.00
0.8
0.9
1
1.1
1.2
1.3
1.4
Loss distributions
Examples of risks for DB
Basevs.
Stress
P&L Capital
Integrated planning Comprehensive stress testing
Integrated risk profile and capital managementNewly formed CaR committee ensures proper capital control
Risk appetite
Economic Capital usageStress testingLimits, e,g,- VaR- Credit holds- Alternative
Assets portfolio
Business targets
RevenuegrowthCost-IncomeratioTechnologyHeadcount
Capital efficiencyRWA consumptionRoE & Value Creation

Investor Relations 06/07 · 11
Build on our competitive edge in CIB
Continue to invest in organic growth and ‘bolt-on’ acquisitions
Further grow our ‘stable’ businesses in PCAM and GTB
Maintain our cost, risk, capital and regulatory discipline
Management Agenda Phase 3
2006 – 2008:Leveraging our global platform for accelerated growth
Maintaining discipline is pre-condition for successful Phase 3

Investor Relations 06/07 · 12
Agenda
Outstanding performance1
Outlook for major risk buckets2
Summary4
Update on Basel II3

Investor Relations 06/07 · 13
Leveraged Finance: Fundamentals underpin market ‘euphoria‘...Despite aggressive leverage, balance sheets remain sound
Aggressive deal structures have generated a slew of cautionary press articles– “Junk Bonds May Repeat Crash of 2002 on LBO Credits?”
(Bloomberg)– “The era of cheap credit goes the way of all bubbles ”
(Financial Times)LBO markets show no signs of slowing with record transaction volumes Aggressive leverage fuelled by rising valuations and liquidityCompetitive conditions introduce weaker structures (e.g. covenant lite) and higher demand for equity bridgesHowever, EBITDA growth has outpaced leverageNew institutional investors seeking yield are driving unprecedented flows into asset classPrivate Equity firms have large reserves of capital Market resiliency tested with February equity sell-off and sub prime correction
(1) Quarter on Quarter EBITDA growth of public filing issuers of leveraged loans(2) Average Current Debt/EBITDA Ratio of Outstanding Institutional Loans
In USD bn
LBO Volume Number of Deals
LBO Transaction Volumes
57 52 41 4794
13085
233
2220
175 168
123
51 4367
133 134178
57
1998 1999 2000 2001 2002 2003 2004 2005 2006 1Q07
EBITDA Growth(1)
6.45.5 5.6 6.0
5.4
-2.4%
15.0%
4.3%9.4%
3.4%
0.9%
36.8%
17.5%
24.5%
16.7%
2002 2003 2004 20062005
Outstanding Leverage(2)
EBITDA GrowthLeverage Growth
Private Equity Fund Raising and Unutilized Capital
1987 1989 1991 1993 1995 1997 1999 2001 2003 2005 2007
In USD bn
1987 1990 1993 19991996 2002 2005 2007
35030025020015010050
Amounts RaisedAmounts InvestedAmounts Capital
Chart Sources: S&P – Leveraged Commentary & Data/Thomson Venture Economics/NVCA/DB

Investor Relations 06/07 · 14
High underwriting standards - most loans above par after syndicationExpanded scope of hedging program for larger “final holds"Focus on concentration risk drives 20% reduction in hold portfolio since 2005 despite record volume Hold risk limited to senior secured loans with low historical Loss Given Default rate (<15%)Macro hedges on the portfolio to mitigate losses on underwriting riskEquity bridges limited to top tier sponsors, subject to strict portfolio limitsHedge funds:- Maintenance of proper collateral and
strong documentation standards - Sophisticated stress testing tools in place
…and we continue to focus on de-riskingPrudent risk management addresses market challenges
DifferenceExpectedActualUnderwriter
87654321
0.33%4.49%4.82%Merrill Lynch
(1.43)%5.38%3.95%CIBC(0.74)%4.68%3.95%Deutsche Bank(0.78)%4.39%3.61%Banc of Amerika
0.35%4.47%4.82%Goldman Sachs
(0.41)%4.63%4.21%Citigroup(0.53)%4.70%4.17%JP Morgan
(1.75)%5.06%3.31%Lehman Brothers
Adjusted annual default rates by underwriter(3)
(1) Reflects Risk Management’s view at respective point in time; changes in composition are not reflected / restated (2) Credit provisions over loans and guarantees, Q1 2007 annualised(3) Fridson Vision LLC, defaults of new issuances from 1997-2003, actual and expected, average, three-year, cumulative, default rate
Hold portfolio(1) and provision development(2)
2002 2003 2004 2005 1Q20072006
Hold portfolio Credit provisions (in bps)

Investor Relations 06/07 · 15
Preparing for next downturnInternational loan book
Book better diversified than in the past with concentration risk substantially reducedIn 2007, moved a portion of loan book to Fair Value under IFRS to neutralize marked-to-market volatility on hedge book~45% hedge ratio (CDS / CLO hedges over mid/l-term committed limits)
LEMG hedges (international book)(3)Loan book(1) and provision development(2)
CDS CLOCash loans Credit provisions (in bps)
In EUR bn, at period end
2002 2003 2004 2005 2006 1Q07
18
9 9 1034 34 37
143 25 25 263
717
26
2002 2003 2004 2005 2006 1Q07
(1) Reflects Risk Management’s view at respective point in time; changes in composition are not reflected / restated(2) Credit provisions over loans and guarantees; 1Q2007 annualised(3) Figures may not add up due to rounding

Investor Relations 06/07 · 16
Above the hurdle rate!German MidCaps loan book
2001-2005: Streamlined lending policy, introduction of LEMG, sharp cut of production costsBook well diversified, only limited sector risk; risk costs currently significantly below PBC’sIncreased cross-selling: Cash lending important, but only one of many products ~40% hedge ratio achieved with further CLOs under way (CLO hedges vs. mid/l-term committed limits)GATE program (currently EUR ~4.9 bn): New market for investors seeking diversification
Revenue developmentLoan book(1) and provision development(2)
Capital market sales Other GTB
Corporate bankruptcies in Germany (in '000)(3)Cash loans Credit provisions (in bps)
2005 2006 1Q07
73%72%67%
Corp. Finance (excl. lending) Lending (LEMG + CF)Other Share of non-lending revenues
(4)
293038 39 39
37
2002 2003 2004 2005 2006 1Q07
(1) Reflects Risk Management’s view at respective point in time;changes in composition are not reflected / restated
(2) Credit provisions over loans and guarantees, 1Q2007 annualised
(3) Source: Statistisches Bundesamt, "Insolvenzen in Deutschland"; 1Q2007 annualised(4) Annualised

Investor Relations 06/07 · 17
PBC loan losses increased, but covered by high marginsContinued improvement through technology and innovative collection tools
Credit engines accurately predicting credit lossesInnovative collection tools and technology have shown further reduction of delinquency ratioLoan losses in PBC now a function of volume, sufficiently covered by marginsMargins are shrinking – focus on higher return consumer products and improvement of pricing costsPlatform allowed further growth in Germany (Berliner Bank / Norisbank) and abroad (new markets)
Loan book(1) and provision development(2) Margin development PBC
Consumer Smallcommercial
Mortgage
Consumer delinquencies in Germany (in '000)(3)Cash loans Credit provisions (in bps)
Average margin (bps) Credit provisions (bps – annualised)
106
21 34
4969
92
2002 2003 2004 2005 2006 Q107
(1) Reflects Risk Management’s view at respective point in time; changes in composition are not reflected / restated. norisbank included as of Dec 2006, Berliner Bank as of 1Q2007
Dec-02
Dec-03
Dec-04
Dec-05
Dec-06
Mar-07
Dec-02
Dec-03
Dec-04
Dec-05
Dec-06
Mar-07
Dec-02
Dec-03
Dec-04
Dec-05
Dec-06
Mar-07
(2) Credit provisions over loans and guarantees, 1Q2007 annualised(3) Source: Statistisches Bundesamt, "Insolvenzen in Deutschland";
1Q2007 annualised
Investor Relations 06/07 · 18
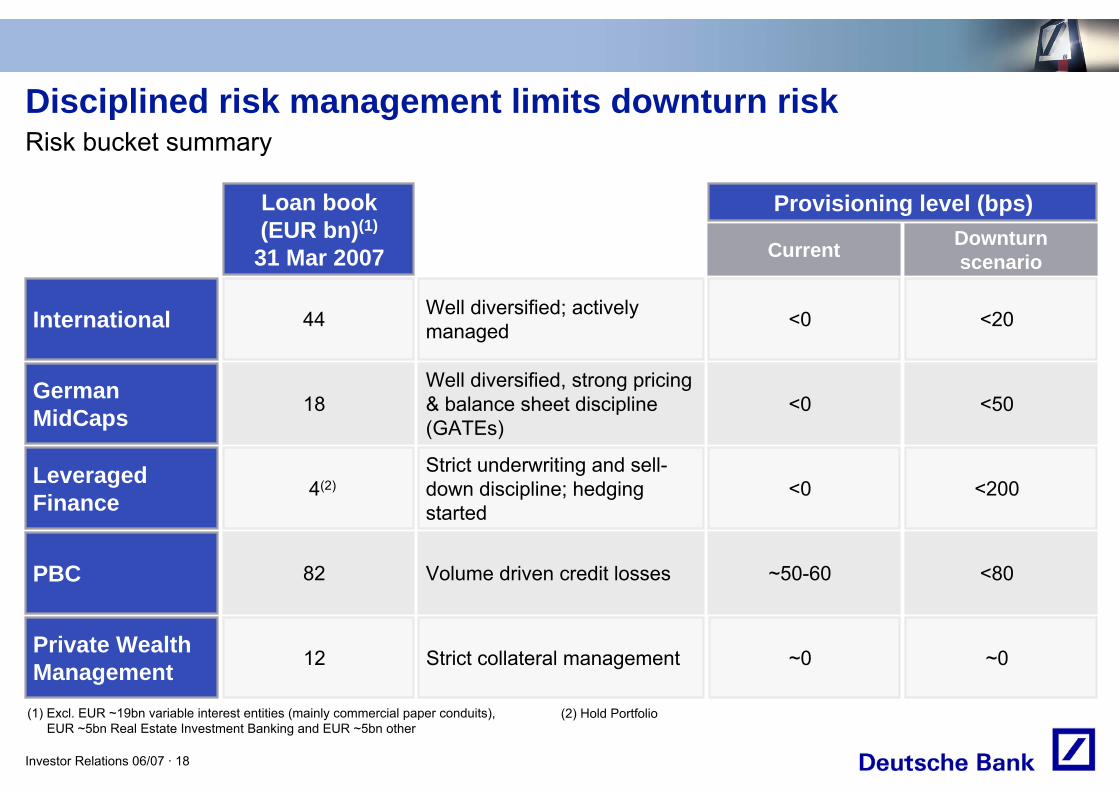
Disciplined risk management limits downturn riskRisk bucket summary
International
German MidCaps
Leveraged Finance
PBC
Well diversified; actively managed <0
Well diversified, strong pricing & balance sheet discipline (GATEs)
<0
Strict underwriting and sell-down discipline; hedging started
Volume driven credit losses
<0
~50-60
Current
Private Wealth Management Strict collateral management ~0
<20
<50
<200
<80
Downturn scenario
~0
44
18
4(2)
82
Loan book (EUR bn)(1)
31 Mar 2007
12
Provisioning level (bps)
(1) Excl. EUR ~19bn variable interest entities (mainly commercial paper conduits), EUR ~5bn Real Estate Investment Banking and EUR ~5bn other
(2) Hold Portfolio

Investor Relations 06/07 · 19
Agenda
Outstanding performance1
Outlook for major risk buckets2
Summary4
Update on Basel II3

Investor Relations 06/07 · 20
Update on Basel II Based on 1Q2007 figures, positive impact on Tier 1 ratio expected
(1) Financial instruments for capital creation under adverse credit conditions
Through the cycle, Basel II capital will fluctuate Tier 1 ratio expected to benefitUnder Basel II, capital is a function of business volume and risk profile As a result, dynamic capital management required:- Increased hybrid issuance- Development of contingent capital(1)
Unmanaged Tier 1 ratio (historical simulation)
Bulk of expected capital relief under Basel II derives from PBC division, while CIB capital demand more or less unchanged
Basel IIBasel I
RWA Tier 1 capital Tier 1 ratio
1985 1990 1995 20052000
StressAverage
Standard Deviation
Tier
1 ra
tio
9.0%
6.0%4Q06 1Q07 4Q06 1Q07
8.5 8.7
4Q06 1Q07

Investor Relations 06/07 · 21
Contributing to capital buffer to mitigate Basel II volatility
Structure: 5-year senior FRN with conversion right intoTier 1 (inside 15% hybrid limit)
Format: Private placementSize: EUR 200mConversion: At DB’s sole discretion during 5y, only constraint
by a minimum senior rating of BBB+/Baa1Tier 1: Perpetual non-call 10-year hybrid with step up Tier 1 pricing: Market pricing on conversion day via dealer pollInvestors: European credit funds
Structure: Perpetual non-call 10-year Upper Tier II with conversion right into Tier 1 (outside 15% hybrid limit)
Format: SEC registeredSize: USD 800mConversion: At DB’s sole discretion during first 5y
(subject to no arrears in coupon)Tier 1: Perpetual non-call 10-year without step up Tier 1 pricing: 6.55% fixed for life (as Upper Tier 2)Investors: US institutional investors (mainly preferred funds)
Successful issuance of first contingent capital note (EUR 200m) in March, followed by another issue (USD 800m) in May Both notes can be exchanged into Tier 1 capital at the sole discretion of the bank- Note I starts as 5-year senior Floating
Rate - Note II starts as Perpetual non-call 10-
year Upper Tier 2 While the Tier 1 pricing for the first contingent capital note is subject to the market level on conversion day, the pricing for the second contingent capital note is fixed at issue date
First contingent capital issues successfully placed
DB Contingent Capital Trust I
DB Contingent Capital Trust II

Investor Relations 06/07 · 22
Agenda
Outstanding performance1
Outlook for major risk buckets2
Summary4
Update on Basel II3

Investor Relations 06/07 · 23
Summary
2006/07 onwards: By maintaining discipline, Deutsche Bank will be able to:
Keep credit provisions low and retail-driven
Support organic growth initiatives and make them successful
Deploy acquisition capital wisely and profitably
Preserve strong BIS Tier 1 capital ratio
2004 - 2005
Strict balance sheet discipline helped achieve RoE targets
2000 - 2003
De-leverage the Bank and reduce costs

Investor Relations 06/07 · 24
Cautionary statements
Unless otherwise indicated, the information provided herein has been prepared under International Financial Reporting Standards (IFRS). It may be subject to adjustments based on the preparation of the full set of financial statements for 2007. The segment information is based on IFRS 8: ‘Operating Segments’. IFRS 8, whilst approved by the International Accounting Standards Board (IASB), has yet to be endorsed by the European Union.
This presentation also contains forward-looking statements. Forward-looking statements are statements that are not historical facts; they include statements about our beliefs and expectations and the assumptions underlying them. These statements are based on plans, estimates and projections as they are currently available to the management of Deutsche Bank. Forward-looking statements therefore speak only as of the date they are made, and we undertake no obligation to update publicly any of them in light of new information or future events.
By their very nature, forward-looking statements involve risks and uncertainties. A number of important factors could therefore cause actual results to differ materially from those contained in any forward-looking statement. Such factors include the conditions in the financial markets in Germany, in Europe, in the United States and elsewhere from which we derive a substantial portion of our trading revenues, potential defaults of borrowers or trading counterparties, the implementation of our management agenda, the reliability of our risk management policies, procedures and methods, and other risks referenced in our filings with the U.S. Securities and Exchange Commission. Such factors are described in detail in our SEC Form 20-F of 27 March 2007 on pages 9 through 15 under the heading "Risk Factors." Copies of this document are readily available upon request or can be downloaded from www.deutsche-bank.com/ir.
This presentation contains non-IFRS financial measures. For a reconciliation to directly comparable figures reported under IFRS refer to the 1Q2007 Financial Data Supplement, which is accompanying this presentation and available on our Investor Relations website at www.deutsche-bank.com/ir.