managing the benefits and risks of mobile computing - · pdf filemanaging the benefits and...
TRANSCRIPT
Managing the Benefits and Risks of Mobile Computing
December 2011
IT Policy Compliance Group
Contents
Executive Summary Overview 3
The Benefits and Risks of Mobile Computing 3
Guidance and Recommendations 3
Organization of Report 4
Detailed Benchmark Findings Background and Introduction 5
Use of Smartphones and Tablet Computers in the Workplace 5
Use of Mobile Devices by Size and Outcome of Organizations 6
Benchmarked Outcomes 7
Business Benefits of Smartphone and Tablet Computer Use 8
Applications Driving the Use of Mobile Devices 9
Business Risks of Smartphone and Tablet Computer Use 10
Policies and Practices Governing Mobile Device Use in the Workplace 11
Operational Challenges Contributing to Business Risks 12
Legal and Regulatory Challenges Contributing to Business Risks 13
Action Taken to Manage the Risks 14
Limiting the Number of Employees Who Use Mobile Devices 15
Practices that Determine Outcomes 16
Controls Used to Manage Risks 17
Consistency of Assessments and Reporting 18
Spend on Information Security and Outcomes 19
Back to the Future 20
Summary Observations 20
Appendix Expected Changes in Device Use in the Workplace 2011 to 2013 22
Additional Resources 24
About the Research 25
About IT Policy Compliance Group 26
3
Managing the Benefits and Risks of Mobile Computing
3
Executive Summary
Overview
This report covers findings from primary research conducted by the IT Policy Compliance Group (ITPCG) about
using Smartphones and Tablet computers in the workplace The report provides a birds-eye view into what other
organizations are doing about using Smartphones and Tablet computers in the workplace along with business
benefits being achieved risks being experienced and what the organizations are doing differently The guidance
and recommendations contained in this report are based on the actions and practices being implemented by the
organizations achieving the best-in-class results
The Benefits and Risks of Mobile Computing
The business benefits of using Smartphones and Tablet computers to access information and applications include
higher levels of revenue and profitability improved access to business information and improved to business
applications from any location
Profile of Best-in-Class Organizations
More business benefits
Highest revenue and profit levels compared to peers
More immediate access to relevant business information and applications
Fewer business risks
Lowest loss or theft rates involving sensitive information
Lowest level of business disruptions than peers
Whatrsquos different about best performers
More employees using Smartphones and Tablet computers
IT manages Smartphones and Tablet computers
Employees use their own Smartphones
Tablet computers are furnished to employees
More practices to manage risk
More controls to manage risk
More frequent training and assessments
More frequent reporting
Higher spend on information security
The business risks of using these devices include higher
levels of loss or theft of sensitive information unauthorized
access to information and applications and the loss of
governance or control over sensitive business information
applications risks and audits
Applications driving the use of mobile devices
Email and collaborative applications
Office productivity applications
Sales force automation applications
Guidance and Recommendations
Primary action to limit business risks
Use of Smartphones in the workplace is limited
to specifically authorized employees
Policies and practices to implement
IT manages all Smartphones and Tablet computers
Authorized employees use their own Smartphones
Tablet computers to are furnished to employees
Managing the Benefits and Risks of Mobile Computing
4
Considerations to evaluate
Requirements of your information security audits
Due-care and due-diligence requirements imposed by legal and regulatory requirements
Cross-border data privacy and ownership issues that impact data ownership legal and regulatory mandates
Practices defining better and best outcomes
Limit access to sensitive information and applications for authorized mobile devices and employees
Geo-track devices especially Smartphones
Prohibit the use of custom ROMs and unauthorized App -markets or -sites
Deliver security awareness training and measure its effectiveness with employees
Regularly scan mobile devices with anti-virus and anti-malware
Protect and backup information on the devices
Wipe and lock stolen and lost devices as soon as being notified by employees
Investigate the availability of patching for company-owned devices
Use frequent controls and configuration testing to reduce gaps and limit risks
Consider vendor carrier and manufacturer histories of support or updates for non-company owned devices
Increase spend on information security beyond your peers
Organization of the Report There are four sections to this report as follows
Executive Summary Key findings and recommendations from the research Detailed Benchmark Findings Detailed findings from the research Appendix and Additional Resources Additional research findings sources of information organizations publications and topical resources Research Background S cope coverage sample sizes and demographics of the research findings contained in this report
Managing the Benefits and Risks of Mobile Computing
5
Detailed Benchmark Findings
Background and Introduction The most recent research conducted by the IT Policy Compliance Group (ITPCG) focuses on Mobile computing specifically on the benefits risks challenges policies practices challenges and actions being taken by organizations and employees using Smartphones and Tablet computers in the workplace to accomplish their jobs
As with other research conducted by ITPCG some of the outcomes measured include revenue and profit business downtime related to IT failures and disruptions audit deficiencies found in IT and the loss or theft of sensitive information Findings contained in this report include results from primary quantitative and qualitative research conducted by the Group In addition additional resources are listed after the Appendix for those seeking additional topical information
As we found from large on-site polling events during 2011 the use of Smartphones to access information and applications in the workplace is a contentious and visceral hot-topic for Information Technology (IT) risk audit and legal managers who are responsible for helping their organizations succeed while also ensuring adequate protections and controls are in place to safeguard the interests of the organization
The ITPCG hopes the findings from this research contribute some clarity toward successful strategies and practices to more effectively manage the benefits and risks of Mobile computing mdash going forward
Use of Smartphones and Tablet Computers in the Workplace The use of Smartphones by organizations to access information and applications in the workplace is stunningly high 8-in-10 (79 percent) of all organizations currently use Smartphones for this purpose However the high rate of Smartphone use is not matched by Tablet computers where the use of these devices to access information and applications is currently less than 4-in-10 (35 percent) organizations (Figure 1)
In addition non-scientific sampling conducted at large on-site events yielded consistent ranges from 7-in-10 to as many of 9-in-10 organizations currently using Smartphones to access information and applications while the rates for Tablet computers were found to be between 2-in-10 and 5-in-10 organizations
Figure 1 Use of smartphones and tablet computers
Nearly 8-in-10 organizations use
Smartphones to access information and
application in the workplace Yet less than half of these are
using Tablet computers
Source IT Policy Compliance Group 2011
Almost everyone we interviewed said that mobile phones mdash especially Smartphones mdash have been used in their business for years with many citing the use of RIM-based Blackberry devices having the longest tenure
Managing the Benefits and Risks of Mobile Computing
6
In general the security and management tools for the Blackberry phones are well liked by IT internal audit and legal counsel and risk managers But the phones are apparently showing their age Many cited the recent availability of Applersquos iPhone and Googlersquos Android Smartphones as driving-factors behind an increase in use of non-Blackberry Smartphones by employees during the past two years even in organizations not supporting these devices
The use of Tablet computers appears to be rather recent as old as one-to-two years according to many interviewed While some people cited using smaller-form notebook computers more than five years ago it is the Apple iPad that struck the nerve of most in one-on-one discussions and focus groups
Interestingly the research reveals the rate of growth between Smartphones and Tablet computers is expected to be different during the next two years Smartphones are expected to stabilize at about 8-in-10 organizations through 2013 while Tablet computers are expected to climb by almost 15 percent to nearly one-in-two organizations by 2013
Use of Mobile Devices by Size and Outcome of Organizations The use of mobile devices by organizations varies by size with less use more common by smaller organizations and more use of these devices among larger organizations
Use of mobile devices by size The level of Smartphone use among small organizations mdash at 63 percent mdash is much lower than the industry-average of 79 percent of organizations Similarly the level of use of Tablet computers among small organizations mdash at 16 percent mdash is much smaller than the industry-average of 35 percent of organizations
Use of mobile devices is related to size and
outcomes There is more use of mobile devices among the large and better outcomes and
less use of mobile devices among the small
and worse outcomes
Among midsize organizations the use Smartphones and Tablet computers is close to approximating the average use levels with 82 percent of midsize organizations using Smartphones and 42 percent of midsize organizations using Tablet computers
Large organizations are more likely to be using Smartphones and Tablet computers Ninety-two percent of large organizations are using Smartphones to access information and applications This is accompanied by almost half (49 percent) of these organizations already using Tablet computers (Figure 2)
Figure 2 Use of smartphones and tablet computers
Source IT Policy Compliance Group 2011
Use of mobile devices by outcomes The use of mobile devices mdash Smartphones and Tablet computers mdash by outcomes is similar to use by size Organizations experiencing worse and worst outcomes are less likely to be using Smartphones and Tablet computers while those with better and best outcomes are more likely to be using mobile devices to access information and applications
The outcomes being experienced by organizations measure a range of metrics including profitability revenue business downtime audit deficiencies and loss of sensitive information among other factors
Managing the Benefits and Risks of Mobile Computing
7
Benchmarked Outcomes Almost 2-in-10 organizations (18 percent) experience the worst outcomes These organizations are experiencing the largest declines in revenue and profit the most business downtime due to IT failures and problems the highest level of audit deficiencies to correct in IT and the highest rates of loss or theft of sensitive information
Seven-in-ten organizations (70 percent) are operating with average outcomes involving changes in revenue and profit that range from negative to positive with higher levels of business downtime more deficiencies to correct and more events involving the loss or theft of sensitive information occurring during the past year
About 1-in-10 organizations (12 percent) experience the best outcomes this includes the highest increases in revenue and profit during the past year the lowest levels of business downtime due to failures or problems in IT the fewest deficiencies to correct in IT to pass audits and the fewest events involving the theft or loss of sensitive information (Figure 3)
Figure 3 Benchmarked outcomes
Source IT Policy Compliance Group 2011
Size outcomes and mobile device use An inspection of the extreme outcomes (worst and best) indicates a direct relationship between size outcomes and device use with more small businesses experiencing worst outcomes and lower rates of mobile device usage and much larger organizations experiencing better outcomes and higher rates of mobile device use
Small businesses 63 percent use Smartphones 16 percent use Tablet computers The results for small firms 29 percent experience the worst outcomes (60 percent higher than all organizations) 59 percent experience average outcomes (16 percent lower than all organizations) and 12 percent experience the best outcomes (the same as all organizations) There is unfortunately a higher tendency among 3-in-10 small organizations to be experiencing the worst outcomes
Midsize organizations 82 percent use Smartphones 42 percent use Tablet computers The results for midsize firms 18 percent experience the worst outcomes (the same as all organizations) 77 percent experience average outcomes (10 percent higher than all organizations) and five percent experience the best outcomes (58 percent lower than all organizations) Although not overweight on the negative or positive side of the outcome ledger there is a decided tendency toward slightly worse outcomes among midsize organization
Midsize organizations 92 percent use Smartphones 49 percent use Tablet computers The results for large organizations five percent experience the worst outcomes (73 percent lower than all organizations) 76 percent experience average outcomes (nine percent higher than all organizations) and 19 percent experience the best outcomes (58 percent higher than all organizations) The much lower incident rate of worse outcomes and higher rate of better outcomes reveals a tendency toward slightly better outcomes among large organizations
What is intriguing about the use of mobile devices size and outcomes is the range of actions taken practices implemented and controls used to manage risk by size and outcome In general the larger the organization the more likely it is to be implementing more of the actions practices and controls of organizations achieving the best outcomes In the interest of providing clarity around what is working to deliver better results from the use Mobile computing in the workplace most of the findings in this report will focus on whatrsquos different by outcomes
Managing the Benefits and Risks of Mobile Computing
8
Business Benefits of Smartphones and Tablet Computers The biggest benefits of using Smartphones and Tablet computers include being able to access business information from any location improved communications access to business applications and access to suppliers and partners from anywhere (Table 1)
Table 1 Business benefits of smartphones and tablets
Largest Benefits
Improvements in access to business information from any location
Improvements in communications from any location
Access to business applications from any location
Access to supplierspartners from any location
Source IT Policy Compliance Group 2011
Although not among the majority other benefits cited by best performers include the ability to improve customer sales and service from any location and the ability to reduce capital expenses The least likely benefits of using Smartphones and Tablet computers include the ability to reduce operating expenses and increases in flexibility adaptability and flexibility (Figure 4)
Figure 4 Business benefits of smartphones and tablet computers
The biggest benefits access to information
communications access to business
applications access to suppliers and partners
Source IT Policy Compliance Group 2011
A lopsided result for agility flexibility and adaptability occurs between outcomes experienced and the ranking of this benefit A larger number of average performing organizations find agility flexibility and adaptability to be more beneficial than best performers The other significant variation occurs where reductions to operating expenses are rated less beneficial among worst and best performing organizations and more beneficial by a majority of average performing firms
Smaller organizations less likely to be using Smartphones and Tablet computers are more likely to be among those experiencing the least benefits In comparison midsize organizations whose rate of use of mobile devices is lower than large organizations claim far higher benefits than larger competitors with far more use and experience Interestingly one of the benefits claimed by midsize organizations is out of proportion to the experience of others increases in agility flexibility and adaptability
Managing the Benefits and Risks of Mobile Computing
9
Although improved access to information is listed as a primary benefit in most cases information is only available after applications provide access to underlying information For this reason the research delves into the relationship between applications being used with Smartphones and Tablet computers
Applications Driving the Use of Mobile Devices The applications currently driving the use of Smartphones and Tablet computers include Email and mobile collaboration office productivity and sales force automation applications (Table 2)
Table 2 Applications driving the use of mobile devices
Most important applications
Email and mobile collaboration applications
Office productivity applications
Sales force automation applications
Source IT Policy Compliance Group 2011
Other applications cited as benefits but not by majorities of the best performers include voice and text communications financial applications customer sales and service as well as video- and audio- conferencing communications The least likely applications being used with Mobile devices include those for social media interactions and business continuity and disaster recovery (Figure 5)
Figure 5 Applications driving the use of mobile devices
The applications driving the use of
mobile devices email collaboration office
productivity and sales force automation
Source IT Policy Compliance Group 2011
Lopsided result occurs for voice and text communication applications the best and worst performing organizations value voice and text communications more highly while fewer average performers value these as highly
In addition more average performing organizations rate the use of social media applications more highly than do worst and best performing organizations
With the exception of voice and text communications smaller organizations are less likely to be using Smartphones and Tablet computers for a wider variety of applications to access information Given the more common use of mobile devices among those with better outcomes one expects to see more value being ascribed to more applications providing access to more critical business information among large and best performing organizations
Managing the Benefits and Risks of Mobile Computing
10
Although the benefits of Smartphones and Tablet computers are helping best performers mdash and proportionately more large organizations mdash to post higher revenue and profit levels due to immediate access to information and sharing of information with others these benefits come with business risks most notably the loss or theft of sensitive information unauthorized access to sensitive business information and a loss of control or a loss of governance
Business Risks of Smartphones and Tablet Computers The primary business risks related to the use of Smartphones and Tablet computers include the loss or theft of sensitive information and unauthorized access to sensitive business information or applications and a loss of control over data applications risks and audits (Table 3)
Table 3 Business risks of smartphones and tablet computers
Largest business risks
Loss or theft of sensitive information
Unauthorized access to sensitive information or applications
Loss of governance ndash or control ndash over data applications risks and audits
Source IT Policy Compliance Group 2011
The other major business risk cited by a majority of those experiencing the best outcomes includes the loss or theft of the devices themselves and the unintentional disclosure of sensitive information that occurs through these devices (Figure 6)
Figure 6 Business risks of smartphones and tablet computers
The business risks loss or theft of
sensitive information unauthorized access loss of control over
data applications risks and audits
Source IT Policy Compliance Group 2011
The lowest business risks are found to be customer defections due to misuse or failure of the devices followed by geo-tracking of employees or customers Although the numbers rank geo-tracking of employees as a low business risk one-on-one interviews conducted with several senior managers reveal geo-tracking to be a growing risk especially for high-ranking executives and in cases where teams of people from an organization are converging in one geographic area
Lopsided results for loss of devices and fraud are considered lower risks among average performing organizations but more risk among the best and worst performing organizations Interviews revealed that most organizations consider Smartphones to be disposable as long as the information on these devices is protected from use or reuse
Managing the Benefits and Risks of Mobile Computing
11
Larger organizations tend to focus more on the impacts the devices have on customer loyalty repeat business revenue and profitability These are larger concerns in banking retail and transportation industries where entirely new mobile device Apps is being used by customers of firms in these industries
In addition to the business risks the research findings reveal very significant differences in policies and practices being implemented by organizations covering a range of activities including who owns mobile devices whether employees are encouraged or allowed to use their own devices and whether IT manages Smartphones and Tablet computers
Policies and Practices Governing Mobile Device Use in the Workplace The dominant polices and practices governing the use of mobile devices differ considerably with those experiencing best and average outcomes exhibiting more similar policies and practices Among the best and average performers IT is in charge of managing all devices employee owned or not (Table 4)
Table 4 Polices and practices
Outcomes Smartphones Tablet computers
Worst Use of mobile devices is unknown Employees use their own devices
Average IT manages employee-owned devices IT manages company-issued devices
Best IT manages employee-owned devices IT manages company-issued devices
Source IT Policy Compliance Group 2011
Among the worst performers the dominant culture is one where the use of mobile devices is largely unknown unregistered or unreported and employees are allowed to use their own devices
Among average and best performers the dominant policies and practices are very different IT manages the devices while employees are allowed to use their own Smartphones employees must use company-supplied Tablet computers (Figure 7)
Figure 7 Polices and practices
Source IT Policy Compliance Group 2011
Where IT is involved in managing Smartphones and Tablet computers better and best outcomes are more predominant whereas when IT is not managing mobile devices the predominant outcomes are worse and worst
Of the almost 4-in-10 organizations where employees use Tablet computers to access information and applications at work about one-third (33 percent) furnish and provision Tablet computers for employees slightly less than 40 percent allow employees to bring and use their own Smartphones to work and another 30 percent simply do not know how many Tablet computers are being used by employees
Worse results occur among organizations that do not know how many Smartphones are being used In addition several operational challenges are found to be directly related to more mdash or less mdash business risk related to the use of these Mobile devices
Managing the Benefits and Risks of Mobile Computing
12
Operational Challenges Contributing to Business Risks The primary operational challenges contributing to increased business risk from the use of Smartphones and Tablet computers include a) malicious software that can shut down or take-over mobiles devices b) ineffective vulnerability configuration and penetration testing for mobile devices c) an inability to detect or prevent rogue applications from operating on mobile devices and d) an inability to wipe-clean or lock stolen devices (Table 5)
Table 5 Operational challenges
Outcomes Primary operational challenges
Worst Inability to wipe or lock stolen devices
Average Malicious software
Vulnerability configuration penetration testing
Rogue applications
Best Malicious software
Vulnerability configuration penetration testing
Rogue applications
Inability to wipe or lock stolen devices
Source IT Policy Compliance Group 2011
Malicious software is ranked by 8-in-10 organizations as the factor most contributing to business risk After this ineffective practices for managing vulnerabilities configurations and penetration tests and an inability to detect or prevent rogue applications are rated most highly as contributing to increased business risk from the use of mobile devices (Figure 8)
Figure 8 Operational challenges
Operational challenges malicious software vulnerability
scanning configuration testing pen-testing
rogue software wipe or lock stolenlost
devices patching and remediation
Source IT Policy Compliance Group 2011
Detecting mobile devices and wiping data or locking stolen devices are ranked very highly by worst and best performing organizations and ranked much less highly as an operational challenge resulting in elevated business risks among average performing organizations
The lopsided difference is especially evident for the inability to wipe sensitive information or lock lost or stolen devices this is a challenge for 25 percent of the worst of the average performers whereas it a challenge leading to increased business risk by 50 percent of the best performers and nearly 60 percent of the worst performers
Managing the Benefits and Risks of Mobile Computing
13
In addition to operational challenges contributing to elevated business risks the benchmarks also identify legal and regulatory challenges that are contributing to increased business risk Often called a binary problem mdash you adhere to and report on a specific regulation or not mdash the findings reveal the challenges are larger than concerns about failing to comply with a single regulatory mandate or legal ruling
Legal and Regulatory Challenges Contributing to Business Risks The legal and regulatory challenges contributing to business risks from the use of Smartphones and Tablet computers include a) an inability to conduct information security audits and b) exposure to civil or criminal action due to inadequate due-care findings (Table 6)
Table 6 Legal and regulatory challenges
Outcomes Primary operational challenges
Worst Inability to comply with cross-border data privacy mandates
Average Inability to conduct information security audits
Exposure to civilcriminal actions due to inadequate due-care
Best Inability to conduct information security audits
Exposure to civilcriminal actions due to inadequate due-care
Inability to comply with cross-border data privacy mandates
Loss of ownership of data due to differences in jurisdictions
Source IT Policy Compliance Group 2011
After these two the primary challenges include an inability to comply with cross-border data privacy regulations or law loss of ownership of data due to differences in legal jurisdictions and an inability to deliver forensics information for investigations (Figure 9)
Figure 9 Legal and regulatory challenges
Legal and regulatory challenges information
security audits inadequate due-care
cross-border data privacy loss of
ownership over data
Source IT Policy Compliance Group 2011
Complying with cross-border data privacy regulations are challenges for worst and best performers but less of a challenge among average performing companies
Managing the Benefits and Risks of Mobile Computing
14
Organizations do not willingly engage in behavior whose risks are large enough to outweigh benefits Not as stark as a ldquoflight or fightrdquo reaction the primary action being taken to manage the risks of using Smartphones and Tablet computers reveal much about the outcomes organizations are experiencing
Action Taken to Manage the Risks The primary action taken to manage the risks of using mobile devices is to simply limit the number of employees who can use the devices mdash Smartphones and Tablet computers mdash to access applications and information in the workplace This action is shared by those with the best and average outcomes about 8-in-10 organizations However the primary action being taken by the worst performers is to ignore or discount the risk posed to the business from the use of these mobile devices (Table 7)
Table 7 Actions taken to manage the risks
Outcome Primary action taken to manage the risks
Worst Ignore or discount business risks associated with use of mobile devices
Average Limit the use of mobile devices to specific employees
Best Limit the use of mobile devices to specific employees
Source IT Policy Compliance Group 2011
In contrast the worst performers are not purposely limiting the use of mobile devices to specific employees rather these firms are ignoring or discounting the business risks or are trying to cover the business risks with existing or new insurance contracts
Fewer average better or best performing organizations are limiting the use of these devices and are ignoring or discounting the business risks involved (Figure 10)
Figure 10 Actions taken to manage the risks
Action taken to manage the risks limit number of employees that are allowed to use Smartphones or Tablet
computers in the workplace
Source IT Policy Compliance Group 2011
Limiting the use of mobile devices is a double-edged sword because the benefits tangible benefits include increases in revenue and profitability Although not tracked in these studies research from complementary longitudinal and non-longitudinal studies indicate that customer satisfaction and retention rates are also higher among the best performers The core issue for most organizations is the tradeoff between benefits and risks The obvious issue for most organizations is finding an optimal balance or tradeoff between risks and benefits
Managing the Benefits and Risks of Mobile Computing
15
Limiting the Number of Employees Who Use Mobile Devices Despite the benefits of using mobile devices the business risks are purposely keeping low the number of employees using these mobile devices in the workplace The number of employees using Smartphones to access information and applications is a rather low 3-in-10 people (33 percent) despite the high 8-in-10 (79 percent) number of organizations using these devices Similarly the average number of employees using Tablet computers to access information and applications is just 1-in-5 people (22 percent) among the 35 percent of organizations using these devices (Figure 11)
Figure 11 Use of mobile devices by employees
It is the use of Smartphones by
employees that are being artificially
restricted because of the business risks
Source IT Policy Compliance Group 2011
The use of mobile Smartphones is being artificially limited by organizations due to the risks involved Whether it is the simple visual depiction contained in Figure 11 or the ratio of employees to organizations using the devices or the range of employees using the devices it is clear that it is the use of Smartphones by employees to access information and applications that are being artificially restricted (Table 8)
Table 8 Use of mobile devices by employees
Employee use for 65 of
organizations
Employee use for 95 of
organizations
Ratio of employee use to organization use
Smartphones 31 to 36 29 to 38 42
Tablet computers 18 to 27 14 to 31 63
Source IT Policy Compliance Group 2011
Thus the calculus of determining who uses and who does not use Smartphones to access information and applications at an organization is as much a determination of business need and value as much as it is an evaluation of business risk
As part of the research the Group delved into additional practices organizations implement to see if there are other factors responsible for better mdash or worse mdash outcomes associated with the use of Mobile devices
Managing the Benefits and Risks of Mobile Computing
16
Practices that Determine Outcomes The primary practices being implemented to manage business risks for the employees who are using Smartphones and Tablet computers include limiting access to sensitive information or applications geo-tracking and locating lost or stolen devices protecting and backing-up information from mobile devices wiping sensitive information from stolen or lost mobile devices preventingrecording unauthorized logins from mobile devices delivering security-awareness training to employees who use mobile devices and prohibiting access to Apps-markets Apps-sites and custom ROMs on mobile devices (Table 9)
Table 9 Practices implemented to manage the risks
Priority Practices determining outcomes
1 Limit access to sensitive information and applications
2 Geo-track devices to aid in recovery or destruction of information
3 Protect and backup information from devices
4 Wipe stolen or lost devices of information and credentials
5 Prevent and record unauthorized logon attempts
6 Deliver and measure policy and security awareness training for users
7 Prohibit custom ROMs for rooted devices and access to App-markets
Source IT Policy Compliance Group 2011
As the research uncovered the range of practices implemented to manage business risks are directly related to outcomes Far more of the best performing organizations have more employees using these devices are spending more on information security and are more likely to be implementing most of these practices The reverse was also found to be true the worst performers are simply not implementing the practices or are implementing a few rather than all (Figure 12)
Figure 12 Practices implemented to manage the risks
Practices that determine outcomes
limit access geo-track devices protect and backup data wipe
devices that are lost or stolen prevent
unauthorized logons deliver training no
ROMs or App-markets
Source IT Policy Compliance Group 2011
Managing the Benefits and Risks of Mobile Computing
17
Controls Used to Manage Risks Controls are used in business to assist with the execution of business strategy to manage business outcomes and to manage risk In the case of managing risks related to the use of mobile devices to access information and applications the controls employed by the best performers include using antivirus andor anti-malware scans of the devices encrypting sensitive information on the devices preventing unauthorized people and devices from accessing sensitive information and applications patching mobile device systems-level software where possible and testing configurations of the devices (Table 10)
Table 10 Controls used to manage risks
Priority Controls used to manage the risks
1 Use anti-virus and anti-malware
2 Protect sensitive information on devices with encryption
3 Prevent unauthorized devices and people from accessing informationapplications
4 Patch systems software on devices where possible
5 Test configurations and settings on devices
Source IT Policy Compliance Group 2011
Of the controls tested by the research the one implemented by a clear majority of the best performers is the use of anti-virus andor anti-malware scans The least commonly implemented control among these best performers is the use of virtual private networking (VPN) although interviews revealed many respondents were using some form of VPN with Smartphones in the workplace
In contrast several controls are either not implemented or are less likely implemented by the worst performers These include the scanning of ROMs on mobile devices scanning of vulnerabilities on mobile devices conducting penetration tests on mobile devices patching systems-level software where possible and using virtual private networking (Figure 13)
Figure 13 Controls used to manage risks
Controls to use anti-virusanti-malware encryption checks and limits on unauthorized
devicespeople patches and
configuration testing
Source IT Policy Compliance Group 2011
Managing the Benefits and Risks of Mobile Computing
18
Interestingly the biggest complaint the Group found in the interviews was due to ldquothe lack of patches to update the Android operating systemrdquo For this reason alone we found that many organizations had developed a ldquono Androidrdquo policy or told its users that Android phones could no longer be used Another practice found to significantly impact outcomes is how frequently organizations conduct assessments
Consistency of Assessments and Reporting The rate at which controls to manage risks are monitored assessed and reported on is directly related to outcomes For example the findings reveal significant differences from annual to monthly rates with those conducting less frequent assessments being among the majority of the worst performers and those with the most frequent assessments being among the best performers (Table 11)
Table 11 Rate of assessment and reporting
Outcome Average rate of assessment and reporting
Worst Once every twelve months
Average Once every four-to-five months
Best Once every month or less
Source IT Policy Compliance Group 2011
Mirroring findings in related research the rate at which controls are monitored assessed and compared against a range of conditions including policies prioritized risks threats gold-standards regulatory requirements and internal configuration baselines among others defines
1) When organizations find gaps in controls and procedures
2) Whether risks are larger than expected
3) Whether organizations are able to take appropriate action
4) Whether organizations are able to reduce business risks
When looked at from the perspective of size the research reveals many organizations may not have the tools to automate such assessments or are simply choosing to conduct annual audit review assessments rather than ongoing business risk assessments (Figure 14)
Figure 14 Rate of assessment and reporting
The best performers consistently assess
and report on controls and risks more
frequently
Source IT Policy Compliance Group 2011
Managing the Benefits and Risks of Mobile Computing
19
In addition to the rate of assessment and reporting another defining practice responsible for outcomes is found to be spending on information security by organizations
Spend on Information Security and Outcomes Worst performers are spending 60 percent less than average while the best performers are spending 60 percent more than average performers (Table 12)
Table 12 Spend on information security
Outcome Relative spend on information security compared with average performers
Worst 04
Average 10
Best 16
Source IT Policy Compliance Group 2011
In addition to the relative difference in spend on information security there are large differences in the percentage of the IT budget spent on information security While the range of spend among the worst is from zero to slightly more than 5 of the IT budget the average spent by the worst is less than three percent In contrast average performers spend 75 percent and best performers are spending 12 percent on average (Figure 15)
Figure 15 Spend on information security
The best performers spend a larger
percentage of a larger IT budget on
information security
Source IT Policy Compliance Group 2011
The amount spent is more revealing when considering the actual IT budgets IT budgets among worst performers is just 30 percent of what average performers spend on IT while the amount spent on IT by the best performers is more than 30 percent higher than the average performers
Thus smaller percentages of much smaller annual IT budgets are characteristic of spending on information security by the worst performers while larger percentages of much larger annual IT budgets are characteristic of spending on information security by the best performers
Spending on information security among some of the worst performers actually bottomed-out during the latter half of 2011 When combined with no controls on mobile devices and a culture that is ignoring or discounting the business risks related to the use of Mobile devices it is possible that 2012 could be a year with some negative brand-wrecking events for some of these organizations The best performers will be happy to have positioned themselves differently
Managing the Benefits and Risks of Mobile Computing
20
Back to the Future Is the adoption of Mobile computing a repeat of what occurred in the 1980s Back then it was connecting PCs via local networks to provide office workers with access to information that could be analyzed and acted on in local work groups Today it is about wirelessly interconnecting Mobile devices enabling anyone to share and act on information from any location If today is any indication of what happened in the 1980s then the use of these new powerful pocket-sized but supercharged Mobile devices is likely to change to shape of computing as we know it today
The use of Smartphones by 8-in-10 organizations could likely grow And the use of these devices by employees artificially restricted to 33 percent for now will likely grow as management systems and security controls become more standardized
But we are in a high-growth expansionary phase where Phone manufacturers and carriers are incented to cannibalize products they shipped just last year or as recently as last month leaving consumers employees and organizations with devices that are out of date and may never be updated with systems-level software that would otherwise cure security vulnerabilities
Unfortunately there is no standard Android phone unless you purchase a Google Nexus phone which will be updated by Google directly But the majority of Android phones purchased by consumers and employees are not stock Google Android phones Instead the vast majority of Android phones are overlaid by supplier goo-gads carrier changes along with unexpected and unwanted mdash Carrier IQ mdash additions The carriers and phone manufacturers are incented by the sale of new hardware bling and new service contracts
Encouraged by Google and the profit margins from the latest hardware bling and service contracts the carriers and phone manufacturers continue to develop their own versions of Android What the carriers and phone manufacturers are not incented to do is to deploy software updates to the Android operating system to their customers and so they donrsquot Instead they find it less expensive to lure their customers into an upgrade to a new device on contract two years later
There are more stable and routinely updated
operating systems shipping with
Smartphones from Applersquos iOS RIMrsquos
Blackberry and Windows phone
Eventually these problems and others may resolve themselves but it could be another few years mdash or more mdash of frustration before anything resembling stability in the Android operating system is common and enterprise-ready management tools and security controls are available for these new wonders of the information age
In the meantime there are much more stable mdash and routinely updated mdash operating systems shipping with Smartphones from Applersquos iOS RIMrsquos Blackberry and Windows phone None of these suffer the same problems afflicting Android phones
Whatever you do remember the lessons about what worked mdash and what didnrsquot mdash with earlier generational-changes such as the advent of PCs or the dawn of Internet-computing This longer-term perspective and the lessons will come in handy in formulating strategy and tactics as the use of Mobile computing expands in your workplace
Summary Observations Based on the outcomes being achieved by the best performing organizations
The business benefits of using Smartphones and Tablet computers include
Improved access to business information from any location
Improved customer retention and satisfaction levels and
Higher levels of revenue and profitability when compared with peers
The business risks of using mobile computing devices include
Loss or theft of sensitive information
Unauthorized access to information and applications
Loss of governance or control over sensitive business information business applications business risks and audits
Managing the Benefits and Risks of Mobile Computing
21
The primary information and applications currently being used with mobile devices include
Email and collaborative applications
Office productivity applications
Sales force automation applications
The primary actions to take to limit business risks include
Limit the use of Smartphones in the workplace to specifically approved employees
Fewer than 50 percent of employees currently use Smartphonersquos among the best performers
Policies and practices to implement include
Have IT manage all Tablet computers and Smartphones
Allow approved employees to use their own Smartphones
Furnish Tablet computers to employees
Considerations to evaluate include
Mobile devices are another part of the requirements of your information security audits
Compare your due-care requirements to defend against legal inquiry
Identify your cross-border data privacy and ownership requirements
Practices to implement include
Limit the use of Smartphones to access information and applications to approved employees
Limit access to sensitive information and applications for mobile devices
Geo-track devices especially Smartphones
Prohibit the use of custom ROMs and unapproved App-marketssites
Deliver security awareness training and measure effectiveness with employees
Scan mobile devices with anti-virus and anti-malware
Protect and backup information on the devices
Wipe and lock stolen and lost devices as soon as notified by employees
Investigate the availability of patching as part of device evaluations
Use frequent controls and configuration testing to reduce gaps and limit risks
Increase spend on information security beyond your peers
Managing the Benefits and Risks of Mobile Computing
22
Appendix Expected Changes in Device Use in the Workplace 2011 to 2013 Respondents were asked to identify changes that are most likely going to occur in organizational and employee uses of Smartphones and Tablet computers between 2011 and 2013 As projections these forecasts of user and organizational expectations are reflections of current sentiment
The use of Smartphones by organizations is expected to remain the same between 2011 and 2013 at 79 percent of all organizations However the use of Smartphones to access information and applications by employees is expected to increase from 33 percent to 39 percent (Table 13)
Table 13 Device use 2011 to 2013
Device being used Use by organizationsemployees
2011 2013 Change in use
Organizational use 79 79 -0- Smartphones
Employee use 33 39 6 increase
Organizational use 35 49 14 increase Tablet computers
Employee use 22 32 10 increase
Source IT Policy Compliance Group 2011
Unlike Smartphones the use of Tablet computers is expected to increase for organizations and employees from an average rate of 35 percent to 49 percent for organizations and from 22 to 32 for employees The increases are larger than the sample error of seven percent
After an increase in employees using both devices what is rather intriguing is an expected downtrend in the use of Smartphones among organizations with the best outcomes The decline in the use of Smartphones among best performers is expected to be from 85 percent to 73 percent mdash a decrease of 12 percent mdash from 2011 to 2013 (Figure 16)
Figure 16 Expected changes in device use
Source IT Policy Compliance Group 2011
The explanation for the overall rate of decline of Smartphone use among best performing organization can be found from declines in the uses of iPhone and Windows Phone platforms and much more significant declines in the use of Android and Blackberry phones
At the time the research was being carried out RIM was suffering from blackouts in its services around the World with rolling service-outages that occurred across multiple continents during a one-week period The general consensus of many people we spoke with at the time was the service-outages ldquoare the final event I need to make the switch when my subscription period is duerdquo On the other hand others simply replaced their Blackberry devices that week and did not wait until their subscription was due for renewal
Unlike the RIM Blackberry platforms we found consistently strong disaffection with Android devices due to the inability to obtain updates for the Android operating system without having to root devices and hope for the best using custom ROMs
Managing the Benefits and Risks of Mobile Computing
23
These problems left many saying things like ldquoI bought a pig in a poke never againrdquo Others took matters into their own hands rooted their phones and installed updated versions of Android over the Internet from a number of different development sites none of which were blessed by carriers phone manufacturers or their IT staff
IT managers the Group spoke with identified an utter lack of management tools for Android devices too many versions of Android and a complete lack of vulnerability testing for the devices The inability to update and cure security-problems were just some of the problems identified by IT managers the Group spoke with The upshot for many were two common reactions to the use of Android in the enterprise 1) if it was already deployed the common reaction was to pull back support for Android and convert to other supported Smartphones and 2) if Android was not already deployed wait for Android to become enterprise-ready (Table 14)
Table 14 Reaction to Android phones in the workplace
Status of Android Smartphones
Reaction
Already deployed Pull-back and convert to other Smartphones
If not already deployed Wait for Android to become enterprise-ready
Source IT Policy Compliance Group 2011
When it comes to Tablet computers the sentiment about expected changes in use of different platforms reveals Android Tablet computers likely to see the biggest gains between now and 2013 followed by healthy gains in the use of other Tablet computers The only sentiment indicating significant declines appear to be related to Android and Blackberry Smartphones (Figure 17)
Figure 17 Expected changes in platform use
Source IT Policy Compliance Group 2011
The outlook of current sentiment regarding use of different platforms by 2013 clearly indicates the best performers are predisposed to ditch Android and Blackberry phones and significantly increase the use of iPad Tablet computers
By contrast the worst performers are predisposed to increase use of Smartphones and Tablet computers across the board and with the exception of Blackberry phones increase other mobile device platforms among average performers
Managing the Benefits and Risks of Mobile Computing
24
Additional Resources Numerous sources of related information are available for those interested in pursuing more information on a wide range of topics related to Smartphones and Tablet computers The following are but a small sample of related information perspectives and insight The authors of these articles have no relationship with the ITPCG Android Security See httpdeveloperandroidcomguidetopicssecuritysecurityhtml Android Orphans Visualizing a Sad History of Support See httptheunderstatementcompost11982112928android-orphans-visualizing-a-sad-history-of-support A Look into Mobile Device Security httpwwwsymanteccomcontentenusaboutmediapdfssymc_mobile_device_security_june2011pdfom_ext_cid=biz_socmed_twitter_facebook_marketwire_linkedin_2011Jun_worldwide_mobilesecuritywp Carrier IQ what it is what it isnrsquot and what you need to do httpwwwengadgetcom20111201carrier-iq-what-it-is-what-it-isnt-and-what-you-need-to CIS Apple iOS configuration benchmarks httpbenchmarkscisecurityorgen-usroute=downloadsbrowsecategorybenchmarksmobileiphone Current Android Malware httpforensicsspreitzenbarthdepage_id=254 DISA STIGs for Smartphones - unclassified httpiasedisamilstigsnet_perimeterwirelesssmartphonehtml iOS Hardening Configuration Guide Department of Defence Intelligence and Security Australian Government httpwwwdsdgovaupublicationsiOS_Hardening_Guidepdf Mac OS X and iOS Security httpdeveloperapplecomlibrarymacdocumentationSecurityConceptualSecurity_OverviewArchitectureArchitecturehtmlapple_refdocuidTP30000976-CH202-TPXREF101 Mobile Malware Why Fraudsters are Two Steps Ahead httpwwwtrusteercomblogmobile-malware-why-fraudsters-are-two-steps-ahead Rootkit called Carrier IQ discovered phoning home with user data httpwwwzdnetcomblogapplerootkit-called-carrier-iq-discovered-phoning-home-with-user-data11792 RIM launches Blackberry Fusion to Secure Android and Apple devices httpbusinessfinancialpostcom20111129rim-launching-blackberry-mobile-fusion-to-secure-iphone-android-devices Smartphone Security httpwwwenisaeuropaeuactapplication-securitysmartphone-security-1 The Spy Files Map httpwikileaksorgThe-Spyfiles-The-Maphtml Ten Steps to Secure Your Mobile Devices httpswikiinternet2educonfluencedisplayitsg2Mobile+Device+Security
Why Your Phone is Insecure by Design httpwwwforbescomsitesandygreenberg20110812codebreaker-karsten-nohl-why-your-phone-is-insecure-by-design
Managing the Benefits and Risks of Mobile Computing
25
About the Research Topics researched by the IT Policy Compliance Group (IT PCG) are part of an ongoing calendar established in consultation with Advisory General and Charter members of the Group as well as from findings compiled from ongoing research In addition to specific tracking questions common to each benchmark the research is designed to uncover the relationship between business results outcomes being experienced by organizations actions taken practices implemented and capabilities organizations use to respond
The qualitative research findings presented in this report are from numerous focus groups one-on-one interviews and meetings held with larger audiences throughout 2011 The quantitative findings contained in this report are from primary research studies conducted with 210 organizations in North America during late 2011
The maximum error for the sample findings for the benchmark findings contained in this report is +- seven percent The primary focus of analysis contained in this report is to present the largest differences between the outcomes experienced and similarly aligned findings that are most responsible for the differences in outcomes Instead of relying on differences that are within or close to the sample errors the effort has been to focus on the largest differences For example instead of focusing on differences involving +- 10 percent the findings covered in this report tend to focus on the largest differences in the range of 50 percent or more
The findings covering the use of Mobile computing are representative of organizations in North America and cannot be construed or inferred to represent current usage or plans for Mobile computing outside of North America However the findings covering the performance outcomes benefits and risks of Mobile computing the practices to manage the business risks and the controls to manage the risks match findings from similar studies covering other geographies outside of North America including findings from Latin America South America Europe Africa the Middle East Asia and Oceania
Industries represented The quantitative research includes representation from the following industries advertising accounting services aerospace agriculture apparel architecture automotive banking chemicals computer equipment and peripherals computer software and services construction consumer durable goods distribution education engineering services entertainment financial services food and beverage government (local state and federal level public administration) government (defense and intelligence) health medical and dental services insurance law enforcement management services media scientific and consulting services manufacturing pharmaceuticals public relations publishing real estate rental and leasing services retail trade telecommunications equipment telecommunication services transportation warehousing travel accommodation and hospitality services utilities waste management and wholesale trade Five industries represent 47 percent of the sample These include Banking Education Financial and Accounting Services Manufacturing and Retail Trade Another 27 industries represent the other 53 percent of the sample none of which represents more than five percent of the sample
Revenue or agency budgets of participating organizations Size of the organizations participating in the most recent benchmarks is somewhat evenly distributed although slightly fewer represent midsize organizations Thirty-six percent of the organizations represented by the findings have annual revenues or agency budgets that are less than $50 million Another twenty-nine percent of the sample has annual revenues or agency budgets between $50 million and $999 million The remaining thirty-five percent of the sample has annual revenues or agency budgets that are $1 billion or more
Functional areas of responsibility Thirty-five percent of the qualified participants for the benchmark work in IT with another 30 percent work in finance or internal controls The remaining 35 percent of the qualified participants work in a wide variety of functions from business line management senior management product design and development legal compliance sales marketing procurement logistics and customer services among other functions
Job titles of participants Thirty-five percent of the participants in the benchmark are senior managers with titles that include CEO CIO CFO or Vice president Thirty-eight percent are managers or directors and twenty-seven percent are staff in their organizations
Managing the Benefits and Risks of Mobile Computing
About IT Policy Compliance Group The mission of the IT Policy Compliance Group is to promote actionable findings based on evidence to assist organizations with delivering more value less risk and achieve IT policy and compliance objectives related to the use of information systems The Group Web site at wwwitpolicycompliancecom features quick two-minute self-assessments to compare outcomes and practices against onersquos industry peers and best performing organizations research reports continuing professional education conferences and seminars member and knowledge centers related research from around the World and resources including standards and frameworks associations government and regulators
The Grouprsquos research is designed to help IT risk legal financial and internal audit professionals to
Benchmark results and efforts against peers and best-in-class performers
Identify key drivers challenges and responses to improve results
Determine the applicability and use of specific capabilities to improve results
Identify best practices based on results and experience of peers
The Group relies upon its members and advisors for its research and editorial calendar
IT Policy Compliance Group Charter Members
The Institute of Symantec Corporation Internal Auditors ISACA 350 Ellis Street 247 Maitland Avenue 3701 Algonquin Road Suite 1010 Mountain View CA 94043 Altamonte Springs FL 32701 Rolling Meadows IL 60008 +1 (650) 527 8000 +1 (407) 937 1100 +1 (847) 253 1545 wwwsymanteccom wwwtheiiaorg wwwisacaorg infosymanteccom iiatheiiaorg infoisacaorg
Computer Security Institute Protiviti IT Governance Institute 600 Harrison Street New York Office 3701 Algonquin Road Suite 1010 San Francisco CA 94107 1290 Avenue of the Rolling Meadows IL 60008 +1 (415) 947 6320 Americas 5th Floor +1 (847) 660 5600 wwwgocsicom New York New York 10104 wwwitgiorg csicmpcom +1 (212) 603 8300 infoitgiorg wwwprotiviticom infoprotiviticom
IT Policy Compliance Group Affiliate Members and Advisors A current list of Affiliate Members and Advisors to the Group can be found on the IT Policy Compliance Group website
26
Founded in 2005 the IT Policy Compliance Group conducts benchmark research focused on delivering fact-based guidance on the steps that can be taken to improve results Benchmark results are reported through wwwitpolicycompliancecom for the benefit of members
IT Policy Compliance Group
Contacts Managing Director Jim Hurley Telephone +1 (216) 373 7010 jhurleyitpolicycompliancecom Managing Editor John Ortbal Telephone +1 (847) 444 0344 jortbalitpolicycompliancecom wwwitpolicycompliancecom
December 2011
The information contained in this publication has been obtained from sources that the IT Policy Compliance Group believes to be reliable but is not guaranteed Research publications reflect current conditions that are subject to change without notice
Copyright copy 2011 IT Policy Compliance Group Names and logos may be trademarks of their respective owners All rights reserved 1211 293167003
32
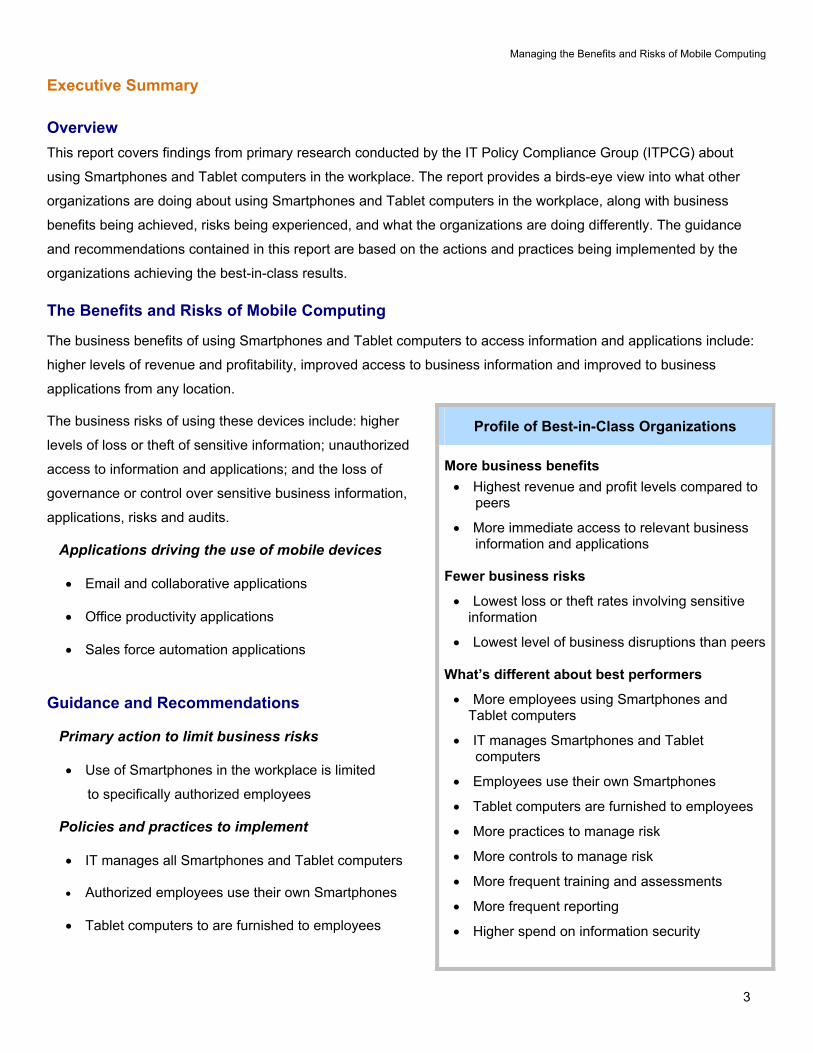
Managing the Benefits and Risks of Mobile Computing
3
Executive Summary
Overview
This report covers findings from primary research conducted by the IT Policy Compliance Group (ITPCG) about
using Smartphones and Tablet computers in the workplace The report provides a birds-eye view into what other
organizations are doing about using Smartphones and Tablet computers in the workplace along with business
benefits being achieved risks being experienced and what the organizations are doing differently The guidance
and recommendations contained in this report are based on the actions and practices being implemented by the
organizations achieving the best-in-class results
The Benefits and Risks of Mobile Computing
The business benefits of using Smartphones and Tablet computers to access information and applications include
higher levels of revenue and profitability improved access to business information and improved to business
applications from any location
Profile of Best-in-Class Organizations
More business benefits
Highest revenue and profit levels compared to peers
More immediate access to relevant business information and applications
Fewer business risks
Lowest loss or theft rates involving sensitive information
Lowest level of business disruptions than peers
Whatrsquos different about best performers
More employees using Smartphones and Tablet computers
IT manages Smartphones and Tablet computers
Employees use their own Smartphones
Tablet computers are furnished to employees
More practices to manage risk
More controls to manage risk
More frequent training and assessments
More frequent reporting
Higher spend on information security
The business risks of using these devices include higher
levels of loss or theft of sensitive information unauthorized
access to information and applications and the loss of
governance or control over sensitive business information
applications risks and audits
Applications driving the use of mobile devices
Email and collaborative applications
Office productivity applications
Sales force automation applications
Guidance and Recommendations
Primary action to limit business risks
Use of Smartphones in the workplace is limited
to specifically authorized employees
Policies and practices to implement
IT manages all Smartphones and Tablet computers
Authorized employees use their own Smartphones
Tablet computers to are furnished to employees
Managing the Benefits and Risks of Mobile Computing
4
Considerations to evaluate
Requirements of your information security audits
Due-care and due-diligence requirements imposed by legal and regulatory requirements
Cross-border data privacy and ownership issues that impact data ownership legal and regulatory mandates
Practices defining better and best outcomes
Limit access to sensitive information and applications for authorized mobile devices and employees
Geo-track devices especially Smartphones
Prohibit the use of custom ROMs and unauthorized App -markets or -sites
Deliver security awareness training and measure its effectiveness with employees
Regularly scan mobile devices with anti-virus and anti-malware
Protect and backup information on the devices
Wipe and lock stolen and lost devices as soon as being notified by employees
Investigate the availability of patching for company-owned devices
Use frequent controls and configuration testing to reduce gaps and limit risks
Consider vendor carrier and manufacturer histories of support or updates for non-company owned devices
Increase spend on information security beyond your peers
Organization of the Report There are four sections to this report as follows
Executive Summary Key findings and recommendations from the research Detailed Benchmark Findings Detailed findings from the research Appendix and Additional Resources Additional research findings sources of information organizations publications and topical resources Research Background S cope coverage sample sizes and demographics of the research findings contained in this report
Managing the Benefits and Risks of Mobile Computing
5
Detailed Benchmark Findings
Background and Introduction The most recent research conducted by the IT Policy Compliance Group (ITPCG) focuses on Mobile computing specifically on the benefits risks challenges policies practices challenges and actions being taken by organizations and employees using Smartphones and Tablet computers in the workplace to accomplish their jobs
As with other research conducted by ITPCG some of the outcomes measured include revenue and profit business downtime related to IT failures and disruptions audit deficiencies found in IT and the loss or theft of sensitive information Findings contained in this report include results from primary quantitative and qualitative research conducted by the Group In addition additional resources are listed after the Appendix for those seeking additional topical information
As we found from large on-site polling events during 2011 the use of Smartphones to access information and applications in the workplace is a contentious and visceral hot-topic for Information Technology (IT) risk audit and legal managers who are responsible for helping their organizations succeed while also ensuring adequate protections and controls are in place to safeguard the interests of the organization
The ITPCG hopes the findings from this research contribute some clarity toward successful strategies and practices to more effectively manage the benefits and risks of Mobile computing mdash going forward
Use of Smartphones and Tablet Computers in the Workplace The use of Smartphones by organizations to access information and applications in the workplace is stunningly high 8-in-10 (79 percent) of all organizations currently use Smartphones for this purpose However the high rate of Smartphone use is not matched by Tablet computers where the use of these devices to access information and applications is currently less than 4-in-10 (35 percent) organizations (Figure 1)
In addition non-scientific sampling conducted at large on-site events yielded consistent ranges from 7-in-10 to as many of 9-in-10 organizations currently using Smartphones to access information and applications while the rates for Tablet computers were found to be between 2-in-10 and 5-in-10 organizations
Figure 1 Use of smartphones and tablet computers
Nearly 8-in-10 organizations use
Smartphones to access information and
application in the workplace Yet less than half of these are
using Tablet computers
Source IT Policy Compliance Group 2011
Almost everyone we interviewed said that mobile phones mdash especially Smartphones mdash have been used in their business for years with many citing the use of RIM-based Blackberry devices having the longest tenure
Managing the Benefits and Risks of Mobile Computing
6
In general the security and management tools for the Blackberry phones are well liked by IT internal audit and legal counsel and risk managers But the phones are apparently showing their age Many cited the recent availability of Applersquos iPhone and Googlersquos Android Smartphones as driving-factors behind an increase in use of non-Blackberry Smartphones by employees during the past two years even in organizations not supporting these devices
The use of Tablet computers appears to be rather recent as old as one-to-two years according to many interviewed While some people cited using smaller-form notebook computers more than five years ago it is the Apple iPad that struck the nerve of most in one-on-one discussions and focus groups
Interestingly the research reveals the rate of growth between Smartphones and Tablet computers is expected to be different during the next two years Smartphones are expected to stabilize at about 8-in-10 organizations through 2013 while Tablet computers are expected to climb by almost 15 percent to nearly one-in-two organizations by 2013
Use of Mobile Devices by Size and Outcome of Organizations The use of mobile devices by organizations varies by size with less use more common by smaller organizations and more use of these devices among larger organizations
Use of mobile devices by size The level of Smartphone use among small organizations mdash at 63 percent mdash is much lower than the industry-average of 79 percent of organizations Similarly the level of use of Tablet computers among small organizations mdash at 16 percent mdash is much smaller than the industry-average of 35 percent of organizations
Use of mobile devices is related to size and
outcomes There is more use of mobile devices among the large and better outcomes and
less use of mobile devices among the small
and worse outcomes
Among midsize organizations the use Smartphones and Tablet computers is close to approximating the average use levels with 82 percent of midsize organizations using Smartphones and 42 percent of midsize organizations using Tablet computers
Large organizations are more likely to be using Smartphones and Tablet computers Ninety-two percent of large organizations are using Smartphones to access information and applications This is accompanied by almost half (49 percent) of these organizations already using Tablet computers (Figure 2)
Figure 2 Use of smartphones and tablet computers
Source IT Policy Compliance Group 2011
Use of mobile devices by outcomes The use of mobile devices mdash Smartphones and Tablet computers mdash by outcomes is similar to use by size Organizations experiencing worse and worst outcomes are less likely to be using Smartphones and Tablet computers while those with better and best outcomes are more likely to be using mobile devices to access information and applications
The outcomes being experienced by organizations measure a range of metrics including profitability revenue business downtime audit deficiencies and loss of sensitive information among other factors
Managing the Benefits and Risks of Mobile Computing
7
Benchmarked Outcomes Almost 2-in-10 organizations (18 percent) experience the worst outcomes These organizations are experiencing the largest declines in revenue and profit the most business downtime due to IT failures and problems the highest level of audit deficiencies to correct in IT and the highest rates of loss or theft of sensitive information
Seven-in-ten organizations (70 percent) are operating with average outcomes involving changes in revenue and profit that range from negative to positive with higher levels of business downtime more deficiencies to correct and more events involving the loss or theft of sensitive information occurring during the past year
About 1-in-10 organizations (12 percent) experience the best outcomes this includes the highest increases in revenue and profit during the past year the lowest levels of business downtime due to failures or problems in IT the fewest deficiencies to correct in IT to pass audits and the fewest events involving the theft or loss of sensitive information (Figure 3)
Figure 3 Benchmarked outcomes
Source IT Policy Compliance Group 2011
Size outcomes and mobile device use An inspection of the extreme outcomes (worst and best) indicates a direct relationship between size outcomes and device use with more small businesses experiencing worst outcomes and lower rates of mobile device usage and much larger organizations experiencing better outcomes and higher rates of mobile device use
Small businesses 63 percent use Smartphones 16 percent use Tablet computers The results for small firms 29 percent experience the worst outcomes (60 percent higher than all organizations) 59 percent experience average outcomes (16 percent lower than all organizations) and 12 percent experience the best outcomes (the same as all organizations) There is unfortunately a higher tendency among 3-in-10 small organizations to be experiencing the worst outcomes
Midsize organizations 82 percent use Smartphones 42 percent use Tablet computers The results for midsize firms 18 percent experience the worst outcomes (the same as all organizations) 77 percent experience average outcomes (10 percent higher than all organizations) and five percent experience the best outcomes (58 percent lower than all organizations) Although not overweight on the negative or positive side of the outcome ledger there is a decided tendency toward slightly worse outcomes among midsize organization
Midsize organizations 92 percent use Smartphones 49 percent use Tablet computers The results for large organizations five percent experience the worst outcomes (73 percent lower than all organizations) 76 percent experience average outcomes (nine percent higher than all organizations) and 19 percent experience the best outcomes (58 percent higher than all organizations) The much lower incident rate of worse outcomes and higher rate of better outcomes reveals a tendency toward slightly better outcomes among large organizations
What is intriguing about the use of mobile devices size and outcomes is the range of actions taken practices implemented and controls used to manage risk by size and outcome In general the larger the organization the more likely it is to be implementing more of the actions practices and controls of organizations achieving the best outcomes In the interest of providing clarity around what is working to deliver better results from the use Mobile computing in the workplace most of the findings in this report will focus on whatrsquos different by outcomes
Managing the Benefits and Risks of Mobile Computing
8
Business Benefits of Smartphones and Tablet Computers The biggest benefits of using Smartphones and Tablet computers include being able to access business information from any location improved communications access to business applications and access to suppliers and partners from anywhere (Table 1)
Table 1 Business benefits of smartphones and tablets
Largest Benefits
Improvements in access to business information from any location
Improvements in communications from any location
Access to business applications from any location
Access to supplierspartners from any location
Source IT Policy Compliance Group 2011
Although not among the majority other benefits cited by best performers include the ability to improve customer sales and service from any location and the ability to reduce capital expenses The least likely benefits of using Smartphones and Tablet computers include the ability to reduce operating expenses and increases in flexibility adaptability and flexibility (Figure 4)
Figure 4 Business benefits of smartphones and tablet computers
The biggest benefits access to information
communications access to business
applications access to suppliers and partners
Source IT Policy Compliance Group 2011
A lopsided result for agility flexibility and adaptability occurs between outcomes experienced and the ranking of this benefit A larger number of average performing organizations find agility flexibility and adaptability to be more beneficial than best performers The other significant variation occurs where reductions to operating expenses are rated less beneficial among worst and best performing organizations and more beneficial by a majority of average performing firms
Smaller organizations less likely to be using Smartphones and Tablet computers are more likely to be among those experiencing the least benefits In comparison midsize organizations whose rate of use of mobile devices is lower than large organizations claim far higher benefits than larger competitors with far more use and experience Interestingly one of the benefits claimed by midsize organizations is out of proportion to the experience of others increases in agility flexibility and adaptability
Managing the Benefits and Risks of Mobile Computing
9
Although improved access to information is listed as a primary benefit in most cases information is only available after applications provide access to underlying information For this reason the research delves into the relationship between applications being used with Smartphones and Tablet computers
Applications Driving the Use of Mobile Devices The applications currently driving the use of Smartphones and Tablet computers include Email and mobile collaboration office productivity and sales force automation applications (Table 2)
Table 2 Applications driving the use of mobile devices
Most important applications
Email and mobile collaboration applications
Office productivity applications
Sales force automation applications
Source IT Policy Compliance Group 2011
Other applications cited as benefits but not by majorities of the best performers include voice and text communications financial applications customer sales and service as well as video- and audio- conferencing communications The least likely applications being used with Mobile devices include those for social media interactions and business continuity and disaster recovery (Figure 5)
Figure 5 Applications driving the use of mobile devices
The applications driving the use of
mobile devices email collaboration office
productivity and sales force automation
Source IT Policy Compliance Group 2011
Lopsided result occurs for voice and text communication applications the best and worst performing organizations value voice and text communications more highly while fewer average performers value these as highly
In addition more average performing organizations rate the use of social media applications more highly than do worst and best performing organizations
With the exception of voice and text communications smaller organizations are less likely to be using Smartphones and Tablet computers for a wider variety of applications to access information Given the more common use of mobile devices among those with better outcomes one expects to see more value being ascribed to more applications providing access to more critical business information among large and best performing organizations
Managing the Benefits and Risks of Mobile Computing
10
Although the benefits of Smartphones and Tablet computers are helping best performers mdash and proportionately more large organizations mdash to post higher revenue and profit levels due to immediate access to information and sharing of information with others these benefits come with business risks most notably the loss or theft of sensitive information unauthorized access to sensitive business information and a loss of control or a loss of governance
Business Risks of Smartphones and Tablet Computers The primary business risks related to the use of Smartphones and Tablet computers include the loss or theft of sensitive information and unauthorized access to sensitive business information or applications and a loss of control over data applications risks and audits (Table 3)
Table 3 Business risks of smartphones and tablet computers
Largest business risks
Loss or theft of sensitive information
Unauthorized access to sensitive information or applications
Loss of governance ndash or control ndash over data applications risks and audits
Source IT Policy Compliance Group 2011
The other major business risk cited by a majority of those experiencing the best outcomes includes the loss or theft of the devices themselves and the unintentional disclosure of sensitive information that occurs through these devices (Figure 6)
Figure 6 Business risks of smartphones and tablet computers
The business risks loss or theft of
sensitive information unauthorized access loss of control over
data applications risks and audits
Source IT Policy Compliance Group 2011
The lowest business risks are found to be customer defections due to misuse or failure of the devices followed by geo-tracking of employees or customers Although the numbers rank geo-tracking of employees as a low business risk one-on-one interviews conducted with several senior managers reveal geo-tracking to be a growing risk especially for high-ranking executives and in cases where teams of people from an organization are converging in one geographic area
Lopsided results for loss of devices and fraud are considered lower risks among average performing organizations but more risk among the best and worst performing organizations Interviews revealed that most organizations consider Smartphones to be disposable as long as the information on these devices is protected from use or reuse
Managing the Benefits and Risks of Mobile Computing
11
Larger organizations tend to focus more on the impacts the devices have on customer loyalty repeat business revenue and profitability These are larger concerns in banking retail and transportation industries where entirely new mobile device Apps is being used by customers of firms in these industries
In addition to the business risks the research findings reveal very significant differences in policies and practices being implemented by organizations covering a range of activities including who owns mobile devices whether employees are encouraged or allowed to use their own devices and whether IT manages Smartphones and Tablet computers
Policies and Practices Governing Mobile Device Use in the Workplace The dominant polices and practices governing the use of mobile devices differ considerably with those experiencing best and average outcomes exhibiting more similar policies and practices Among the best and average performers IT is in charge of managing all devices employee owned or not (Table 4)
Table 4 Polices and practices
Outcomes Smartphones Tablet computers
Worst Use of mobile devices is unknown Employees use their own devices
Average IT manages employee-owned devices IT manages company-issued devices
Best IT manages employee-owned devices IT manages company-issued devices
Source IT Policy Compliance Group 2011
Among the worst performers the dominant culture is one where the use of mobile devices is largely unknown unregistered or unreported and employees are allowed to use their own devices
Among average and best performers the dominant policies and practices are very different IT manages the devices while employees are allowed to use their own Smartphones employees must use company-supplied Tablet computers (Figure 7)
Figure 7 Polices and practices
Source IT Policy Compliance Group 2011
Where IT is involved in managing Smartphones and Tablet computers better and best outcomes are more predominant whereas when IT is not managing mobile devices the predominant outcomes are worse and worst
Of the almost 4-in-10 organizations where employees use Tablet computers to access information and applications at work about one-third (33 percent) furnish and provision Tablet computers for employees slightly less than 40 percent allow employees to bring and use their own Smartphones to work and another 30 percent simply do not know how many Tablet computers are being used by employees
Worse results occur among organizations that do not know how many Smartphones are being used In addition several operational challenges are found to be directly related to more mdash or less mdash business risk related to the use of these Mobile devices
Managing the Benefits and Risks of Mobile Computing
12
Operational Challenges Contributing to Business Risks The primary operational challenges contributing to increased business risk from the use of Smartphones and Tablet computers include a) malicious software that can shut down or take-over mobiles devices b) ineffective vulnerability configuration and penetration testing for mobile devices c) an inability to detect or prevent rogue applications from operating on mobile devices and d) an inability to wipe-clean or lock stolen devices (Table 5)
Table 5 Operational challenges
Outcomes Primary operational challenges
Worst Inability to wipe or lock stolen devices
Average Malicious software
Vulnerability configuration penetration testing
Rogue applications
Best Malicious software
Vulnerability configuration penetration testing
Rogue applications
Inability to wipe or lock stolen devices
Source IT Policy Compliance Group 2011
Malicious software is ranked by 8-in-10 organizations as the factor most contributing to business risk After this ineffective practices for managing vulnerabilities configurations and penetration tests and an inability to detect or prevent rogue applications are rated most highly as contributing to increased business risk from the use of mobile devices (Figure 8)
Figure 8 Operational challenges
Operational challenges malicious software vulnerability
scanning configuration testing pen-testing
rogue software wipe or lock stolenlost
devices patching and remediation
Source IT Policy Compliance Group 2011
Detecting mobile devices and wiping data or locking stolen devices are ranked very highly by worst and best performing organizations and ranked much less highly as an operational challenge resulting in elevated business risks among average performing organizations
The lopsided difference is especially evident for the inability to wipe sensitive information or lock lost or stolen devices this is a challenge for 25 percent of the worst of the average performers whereas it a challenge leading to increased business risk by 50 percent of the best performers and nearly 60 percent of the worst performers
Managing the Benefits and Risks of Mobile Computing
13
In addition to operational challenges contributing to elevated business risks the benchmarks also identify legal and regulatory challenges that are contributing to increased business risk Often called a binary problem mdash you adhere to and report on a specific regulation or not mdash the findings reveal the challenges are larger than concerns about failing to comply with a single regulatory mandate or legal ruling
Legal and Regulatory Challenges Contributing to Business Risks The legal and regulatory challenges contributing to business risks from the use of Smartphones and Tablet computers include a) an inability to conduct information security audits and b) exposure to civil or criminal action due to inadequate due-care findings (Table 6)
Table 6 Legal and regulatory challenges
Outcomes Primary operational challenges
Worst Inability to comply with cross-border data privacy mandates
Average Inability to conduct information security audits
Exposure to civilcriminal actions due to inadequate due-care
Best Inability to conduct information security audits
Exposure to civilcriminal actions due to inadequate due-care
Inability to comply with cross-border data privacy mandates
Loss of ownership of data due to differences in jurisdictions
Source IT Policy Compliance Group 2011
After these two the primary challenges include an inability to comply with cross-border data privacy regulations or law loss of ownership of data due to differences in legal jurisdictions and an inability to deliver forensics information for investigations (Figure 9)
Figure 9 Legal and regulatory challenges
Legal and regulatory challenges information
security audits inadequate due-care
cross-border data privacy loss of
ownership over data
Source IT Policy Compliance Group 2011
Complying with cross-border data privacy regulations are challenges for worst and best performers but less of a challenge among average performing companies
Managing the Benefits and Risks of Mobile Computing
14
Organizations do not willingly engage in behavior whose risks are large enough to outweigh benefits Not as stark as a ldquoflight or fightrdquo reaction the primary action being taken to manage the risks of using Smartphones and Tablet computers reveal much about the outcomes organizations are experiencing
Action Taken to Manage the Risks The primary action taken to manage the risks of using mobile devices is to simply limit the number of employees who can use the devices mdash Smartphones and Tablet computers mdash to access applications and information in the workplace This action is shared by those with the best and average outcomes about 8-in-10 organizations However the primary action being taken by the worst performers is to ignore or discount the risk posed to the business from the use of these mobile devices (Table 7)
Table 7 Actions taken to manage the risks
Outcome Primary action taken to manage the risks
Worst Ignore or discount business risks associated with use of mobile devices
Average Limit the use of mobile devices to specific employees
Best Limit the use of mobile devices to specific employees
Source IT Policy Compliance Group 2011
In contrast the worst performers are not purposely limiting the use of mobile devices to specific employees rather these firms are ignoring or discounting the business risks or are trying to cover the business risks with existing or new insurance contracts
Fewer average better or best performing organizations are limiting the use of these devices and are ignoring or discounting the business risks involved (Figure 10)
Figure 10 Actions taken to manage the risks
Action taken to manage the risks limit number of employees that are allowed to use Smartphones or Tablet
computers in the workplace
Source IT Policy Compliance Group 2011
Limiting the use of mobile devices is a double-edged sword because the benefits tangible benefits include increases in revenue and profitability Although not tracked in these studies research from complementary longitudinal and non-longitudinal studies indicate that customer satisfaction and retention rates are also higher among the best performers The core issue for most organizations is the tradeoff between benefits and risks The obvious issue for most organizations is finding an optimal balance or tradeoff between risks and benefits
Managing the Benefits and Risks of Mobile Computing
15
Limiting the Number of Employees Who Use Mobile Devices Despite the benefits of using mobile devices the business risks are purposely keeping low the number of employees using these mobile devices in the workplace The number of employees using Smartphones to access information and applications is a rather low 3-in-10 people (33 percent) despite the high 8-in-10 (79 percent) number of organizations using these devices Similarly the average number of employees using Tablet computers to access information and applications is just 1-in-5 people (22 percent) among the 35 percent of organizations using these devices (Figure 11)
Figure 11 Use of mobile devices by employees
It is the use of Smartphones by
employees that are being artificially
restricted because of the business risks
Source IT Policy Compliance Group 2011
The use of mobile Smartphones is being artificially limited by organizations due to the risks involved Whether it is the simple visual depiction contained in Figure 11 or the ratio of employees to organizations using the devices or the range of employees using the devices it is clear that it is the use of Smartphones by employees to access information and applications that are being artificially restricted (Table 8)
Table 8 Use of mobile devices by employees
Employee use for 65 of
organizations
Employee use for 95 of
organizations
Ratio of employee use to organization use
Smartphones 31 to 36 29 to 38 42
Tablet computers 18 to 27 14 to 31 63
Source IT Policy Compliance Group 2011
Thus the calculus of determining who uses and who does not use Smartphones to access information and applications at an organization is as much a determination of business need and value as much as it is an evaluation of business risk
As part of the research the Group delved into additional practices organizations implement to see if there are other factors responsible for better mdash or worse mdash outcomes associated with the use of Mobile devices
Managing the Benefits and Risks of Mobile Computing
16
Practices that Determine Outcomes The primary practices being implemented to manage business risks for the employees who are using Smartphones and Tablet computers include limiting access to sensitive information or applications geo-tracking and locating lost or stolen devices protecting and backing-up information from mobile devices wiping sensitive information from stolen or lost mobile devices preventingrecording unauthorized logins from mobile devices delivering security-awareness training to employees who use mobile devices and prohibiting access to Apps-markets Apps-sites and custom ROMs on mobile devices (Table 9)
Table 9 Practices implemented to manage the risks
Priority Practices determining outcomes
1 Limit access to sensitive information and applications
2 Geo-track devices to aid in recovery or destruction of information
3 Protect and backup information from devices
4 Wipe stolen or lost devices of information and credentials
5 Prevent and record unauthorized logon attempts
6 Deliver and measure policy and security awareness training for users
7 Prohibit custom ROMs for rooted devices and access to App-markets
Source IT Policy Compliance Group 2011
As the research uncovered the range of practices implemented to manage business risks are directly related to outcomes Far more of the best performing organizations have more employees using these devices are spending more on information security and are more likely to be implementing most of these practices The reverse was also found to be true the worst performers are simply not implementing the practices or are implementing a few rather than all (Figure 12)
Figure 12 Practices implemented to manage the risks
Practices that determine outcomes
limit access geo-track devices protect and backup data wipe
devices that are lost or stolen prevent
unauthorized logons deliver training no
ROMs or App-markets
Source IT Policy Compliance Group 2011
Managing the Benefits and Risks of Mobile Computing
17
Controls Used to Manage Risks Controls are used in business to assist with the execution of business strategy to manage business outcomes and to manage risk In the case of managing risks related to the use of mobile devices to access information and applications the controls employed by the best performers include using antivirus andor anti-malware scans of the devices encrypting sensitive information on the devices preventing unauthorized people and devices from accessing sensitive information and applications patching mobile device systems-level software where possible and testing configurations of the devices (Table 10)
Table 10 Controls used to manage risks
Priority Controls used to manage the risks
1 Use anti-virus and anti-malware
2 Protect sensitive information on devices with encryption
3 Prevent unauthorized devices and people from accessing informationapplications
4 Patch systems software on devices where possible
5 Test configurations and settings on devices
Source IT Policy Compliance Group 2011
Of the controls tested by the research the one implemented by a clear majority of the best performers is the use of anti-virus andor anti-malware scans The least commonly implemented control among these best performers is the use of virtual private networking (VPN) although interviews revealed many respondents were using some form of VPN with Smartphones in the workplace
In contrast several controls are either not implemented or are less likely implemented by the worst performers These include the scanning of ROMs on mobile devices scanning of vulnerabilities on mobile devices conducting penetration tests on mobile devices patching systems-level software where possible and using virtual private networking (Figure 13)
Figure 13 Controls used to manage risks
Controls to use anti-virusanti-malware encryption checks and limits on unauthorized
devicespeople patches and
configuration testing
Source IT Policy Compliance Group 2011
Managing the Benefits and Risks of Mobile Computing
18
Interestingly the biggest complaint the Group found in the interviews was due to ldquothe lack of patches to update the Android operating systemrdquo For this reason alone we found that many organizations had developed a ldquono Androidrdquo policy or told its users that Android phones could no longer be used Another practice found to significantly impact outcomes is how frequently organizations conduct assessments
Consistency of Assessments and Reporting The rate at which controls to manage risks are monitored assessed and reported on is directly related to outcomes For example the findings reveal significant differences from annual to monthly rates with those conducting less frequent assessments being among the majority of the worst performers and those with the most frequent assessments being among the best performers (Table 11)
Table 11 Rate of assessment and reporting
Outcome Average rate of assessment and reporting
Worst Once every twelve months
Average Once every four-to-five months
Best Once every month or less
Source IT Policy Compliance Group 2011
Mirroring findings in related research the rate at which controls are monitored assessed and compared against a range of conditions including policies prioritized risks threats gold-standards regulatory requirements and internal configuration baselines among others defines
1) When organizations find gaps in controls and procedures
2) Whether risks are larger than expected
3) Whether organizations are able to take appropriate action
4) Whether organizations are able to reduce business risks
When looked at from the perspective of size the research reveals many organizations may not have the tools to automate such assessments or are simply choosing to conduct annual audit review assessments rather than ongoing business risk assessments (Figure 14)
Figure 14 Rate of assessment and reporting
The best performers consistently assess
and report on controls and risks more
frequently
Source IT Policy Compliance Group 2011
Managing the Benefits and Risks of Mobile Computing
19
In addition to the rate of assessment and reporting another defining practice responsible for outcomes is found to be spending on information security by organizations
Spend on Information Security and Outcomes Worst performers are spending 60 percent less than average while the best performers are spending 60 percent more than average performers (Table 12)
Table 12 Spend on information security
Outcome Relative spend on information security compared with average performers
Worst 04
Average 10
Best 16
Source IT Policy Compliance Group 2011
In addition to the relative difference in spend on information security there are large differences in the percentage of the IT budget spent on information security While the range of spend among the worst is from zero to slightly more than 5 of the IT budget the average spent by the worst is less than three percent In contrast average performers spend 75 percent and best performers are spending 12 percent on average (Figure 15)
Figure 15 Spend on information security
The best performers spend a larger
percentage of a larger IT budget on
information security
Source IT Policy Compliance Group 2011
The amount spent is more revealing when considering the actual IT budgets IT budgets among worst performers is just 30 percent of what average performers spend on IT while the amount spent on IT by the best performers is more than 30 percent higher than the average performers
Thus smaller percentages of much smaller annual IT budgets are characteristic of spending on information security by the worst performers while larger percentages of much larger annual IT budgets are characteristic of spending on information security by the best performers
Spending on information security among some of the worst performers actually bottomed-out during the latter half of 2011 When combined with no controls on mobile devices and a culture that is ignoring or discounting the business risks related to the use of Mobile devices it is possible that 2012 could be a year with some negative brand-wrecking events for some of these organizations The best performers will be happy to have positioned themselves differently
Managing the Benefits and Risks of Mobile Computing
20
Back to the Future Is the adoption of Mobile computing a repeat of what occurred in the 1980s Back then it was connecting PCs via local networks to provide office workers with access to information that could be analyzed and acted on in local work groups Today it is about wirelessly interconnecting Mobile devices enabling anyone to share and act on information from any location If today is any indication of what happened in the 1980s then the use of these new powerful pocket-sized but supercharged Mobile devices is likely to change to shape of computing as we know it today
The use of Smartphones by 8-in-10 organizations could likely grow And the use of these devices by employees artificially restricted to 33 percent for now will likely grow as management systems and security controls become more standardized
But we are in a high-growth expansionary phase where Phone manufacturers and carriers are incented to cannibalize products they shipped just last year or as recently as last month leaving consumers employees and organizations with devices that are out of date and may never be updated with systems-level software that would otherwise cure security vulnerabilities
Unfortunately there is no standard Android phone unless you purchase a Google Nexus phone which will be updated by Google directly But the majority of Android phones purchased by consumers and employees are not stock Google Android phones Instead the vast majority of Android phones are overlaid by supplier goo-gads carrier changes along with unexpected and unwanted mdash Carrier IQ mdash additions The carriers and phone manufacturers are incented by the sale of new hardware bling and new service contracts
Encouraged by Google and the profit margins from the latest hardware bling and service contracts the carriers and phone manufacturers continue to develop their own versions of Android What the carriers and phone manufacturers are not incented to do is to deploy software updates to the Android operating system to their customers and so they donrsquot Instead they find it less expensive to lure their customers into an upgrade to a new device on contract two years later
There are more stable and routinely updated
operating systems shipping with
Smartphones from Applersquos iOS RIMrsquos
Blackberry and Windows phone
Eventually these problems and others may resolve themselves but it could be another few years mdash or more mdash of frustration before anything resembling stability in the Android operating system is common and enterprise-ready management tools and security controls are available for these new wonders of the information age
In the meantime there are much more stable mdash and routinely updated mdash operating systems shipping with Smartphones from Applersquos iOS RIMrsquos Blackberry and Windows phone None of these suffer the same problems afflicting Android phones
Whatever you do remember the lessons about what worked mdash and what didnrsquot mdash with earlier generational-changes such as the advent of PCs or the dawn of Internet-computing This longer-term perspective and the lessons will come in handy in formulating strategy and tactics as the use of Mobile computing expands in your workplace
Summary Observations Based on the outcomes being achieved by the best performing organizations
The business benefits of using Smartphones and Tablet computers include
Improved access to business information from any location
Improved customer retention and satisfaction levels and
Higher levels of revenue and profitability when compared with peers
The business risks of using mobile computing devices include
Loss or theft of sensitive information
Unauthorized access to information and applications
Loss of governance or control over sensitive business information business applications business risks and audits
Managing the Benefits and Risks of Mobile Computing
21
The primary information and applications currently being used with mobile devices include
Email and collaborative applications
Office productivity applications
Sales force automation applications
The primary actions to take to limit business risks include
Limit the use of Smartphones in the workplace to specifically approved employees
Fewer than 50 percent of employees currently use Smartphonersquos among the best performers
Policies and practices to implement include
Have IT manage all Tablet computers and Smartphones
Allow approved employees to use their own Smartphones
Furnish Tablet computers to employees
Considerations to evaluate include
Mobile devices are another part of the requirements of your information security audits
Compare your due-care requirements to defend against legal inquiry
Identify your cross-border data privacy and ownership requirements
Practices to implement include
Limit the use of Smartphones to access information and applications to approved employees
Limit access to sensitive information and applications for mobile devices
Geo-track devices especially Smartphones
Prohibit the use of custom ROMs and unapproved App-marketssites
Deliver security awareness training and measure effectiveness with employees
Scan mobile devices with anti-virus and anti-malware
Protect and backup information on the devices
Wipe and lock stolen and lost devices as soon as notified by employees
Investigate the availability of patching as part of device evaluations
Use frequent controls and configuration testing to reduce gaps and limit risks
Increase spend on information security beyond your peers
Managing the Benefits and Risks of Mobile Computing
22
Appendix Expected Changes in Device Use in the Workplace 2011 to 2013 Respondents were asked to identify changes that are most likely going to occur in organizational and employee uses of Smartphones and Tablet computers between 2011 and 2013 As projections these forecasts of user and organizational expectations are reflections of current sentiment
The use of Smartphones by organizations is expected to remain the same between 2011 and 2013 at 79 percent of all organizations However the use of Smartphones to access information and applications by employees is expected to increase from 33 percent to 39 percent (Table 13)
Table 13 Device use 2011 to 2013
Device being used Use by organizationsemployees
2011 2013 Change in use
Organizational use 79 79 -0- Smartphones
Employee use 33 39 6 increase
Organizational use 35 49 14 increase Tablet computers
Employee use 22 32 10 increase
Source IT Policy Compliance Group 2011
Unlike Smartphones the use of Tablet computers is expected to increase for organizations and employees from an average rate of 35 percent to 49 percent for organizations and from 22 to 32 for employees The increases are larger than the sample error of seven percent
After an increase in employees using both devices what is rather intriguing is an expected downtrend in the use of Smartphones among organizations with the best outcomes The decline in the use of Smartphones among best performers is expected to be from 85 percent to 73 percent mdash a decrease of 12 percent mdash from 2011 to 2013 (Figure 16)
Figure 16 Expected changes in device use
Source IT Policy Compliance Group 2011
The explanation for the overall rate of decline of Smartphone use among best performing organization can be found from declines in the uses of iPhone and Windows Phone platforms and much more significant declines in the use of Android and Blackberry phones
At the time the research was being carried out RIM was suffering from blackouts in its services around the World with rolling service-outages that occurred across multiple continents during a one-week period The general consensus of many people we spoke with at the time was the service-outages ldquoare the final event I need to make the switch when my subscription period is duerdquo On the other hand others simply replaced their Blackberry devices that week and did not wait until their subscription was due for renewal
Unlike the RIM Blackberry platforms we found consistently strong disaffection with Android devices due to the inability to obtain updates for the Android operating system without having to root devices and hope for the best using custom ROMs
Managing the Benefits and Risks of Mobile Computing
23
These problems left many saying things like ldquoI bought a pig in a poke never againrdquo Others took matters into their own hands rooted their phones and installed updated versions of Android over the Internet from a number of different development sites none of which were blessed by carriers phone manufacturers or their IT staff
IT managers the Group spoke with identified an utter lack of management tools for Android devices too many versions of Android and a complete lack of vulnerability testing for the devices The inability to update and cure security-problems were just some of the problems identified by IT managers the Group spoke with The upshot for many were two common reactions to the use of Android in the enterprise 1) if it was already deployed the common reaction was to pull back support for Android and convert to other supported Smartphones and 2) if Android was not already deployed wait for Android to become enterprise-ready (Table 14)
Table 14 Reaction to Android phones in the workplace
Status of Android Smartphones
Reaction
Already deployed Pull-back and convert to other Smartphones
If not already deployed Wait for Android to become enterprise-ready
Source IT Policy Compliance Group 2011
When it comes to Tablet computers the sentiment about expected changes in use of different platforms reveals Android Tablet computers likely to see the biggest gains between now and 2013 followed by healthy gains in the use of other Tablet computers The only sentiment indicating significant declines appear to be related to Android and Blackberry Smartphones (Figure 17)
Figure 17 Expected changes in platform use
Source IT Policy Compliance Group 2011
The outlook of current sentiment regarding use of different platforms by 2013 clearly indicates the best performers are predisposed to ditch Android and Blackberry phones and significantly increase the use of iPad Tablet computers
By contrast the worst performers are predisposed to increase use of Smartphones and Tablet computers across the board and with the exception of Blackberry phones increase other mobile device platforms among average performers
Managing the Benefits and Risks of Mobile Computing
24
Additional Resources Numerous sources of related information are available for those interested in pursuing more information on a wide range of topics related to Smartphones and Tablet computers The following are but a small sample of related information perspectives and insight The authors of these articles have no relationship with the ITPCG Android Security See httpdeveloperandroidcomguidetopicssecuritysecurityhtml Android Orphans Visualizing a Sad History of Support See httptheunderstatementcompost11982112928android-orphans-visualizing-a-sad-history-of-support A Look into Mobile Device Security httpwwwsymanteccomcontentenusaboutmediapdfssymc_mobile_device_security_june2011pdfom_ext_cid=biz_socmed_twitter_facebook_marketwire_linkedin_2011Jun_worldwide_mobilesecuritywp Carrier IQ what it is what it isnrsquot and what you need to do httpwwwengadgetcom20111201carrier-iq-what-it-is-what-it-isnt-and-what-you-need-to CIS Apple iOS configuration benchmarks httpbenchmarkscisecurityorgen-usroute=downloadsbrowsecategorybenchmarksmobileiphone Current Android Malware httpforensicsspreitzenbarthdepage_id=254 DISA STIGs for Smartphones - unclassified httpiasedisamilstigsnet_perimeterwirelesssmartphonehtml iOS Hardening Configuration Guide Department of Defence Intelligence and Security Australian Government httpwwwdsdgovaupublicationsiOS_Hardening_Guidepdf Mac OS X and iOS Security httpdeveloperapplecomlibrarymacdocumentationSecurityConceptualSecurity_OverviewArchitectureArchitecturehtmlapple_refdocuidTP30000976-CH202-TPXREF101 Mobile Malware Why Fraudsters are Two Steps Ahead httpwwwtrusteercomblogmobile-malware-why-fraudsters-are-two-steps-ahead Rootkit called Carrier IQ discovered phoning home with user data httpwwwzdnetcomblogapplerootkit-called-carrier-iq-discovered-phoning-home-with-user-data11792 RIM launches Blackberry Fusion to Secure Android and Apple devices httpbusinessfinancialpostcom20111129rim-launching-blackberry-mobile-fusion-to-secure-iphone-android-devices Smartphone Security httpwwwenisaeuropaeuactapplication-securitysmartphone-security-1 The Spy Files Map httpwikileaksorgThe-Spyfiles-The-Maphtml Ten Steps to Secure Your Mobile Devices httpswikiinternet2educonfluencedisplayitsg2Mobile+Device+Security
Why Your Phone is Insecure by Design httpwwwforbescomsitesandygreenberg20110812codebreaker-karsten-nohl-why-your-phone-is-insecure-by-design
Managing the Benefits and Risks of Mobile Computing
25
About the Research Topics researched by the IT Policy Compliance Group (IT PCG) are part of an ongoing calendar established in consultation with Advisory General and Charter members of the Group as well as from findings compiled from ongoing research In addition to specific tracking questions common to each benchmark the research is designed to uncover the relationship between business results outcomes being experienced by organizations actions taken practices implemented and capabilities organizations use to respond
The qualitative research findings presented in this report are from numerous focus groups one-on-one interviews and meetings held with larger audiences throughout 2011 The quantitative findings contained in this report are from primary research studies conducted with 210 organizations in North America during late 2011
The maximum error for the sample findings for the benchmark findings contained in this report is +- seven percent The primary focus of analysis contained in this report is to present the largest differences between the outcomes experienced and similarly aligned findings that are most responsible for the differences in outcomes Instead of relying on differences that are within or close to the sample errors the effort has been to focus on the largest differences For example instead of focusing on differences involving +- 10 percent the findings covered in this report tend to focus on the largest differences in the range of 50 percent or more
The findings covering the use of Mobile computing are representative of organizations in North America and cannot be construed or inferred to represent current usage or plans for Mobile computing outside of North America However the findings covering the performance outcomes benefits and risks of Mobile computing the practices to manage the business risks and the controls to manage the risks match findings from similar studies covering other geographies outside of North America including findings from Latin America South America Europe Africa the Middle East Asia and Oceania
Industries represented The quantitative research includes representation from the following industries advertising accounting services aerospace agriculture apparel architecture automotive banking chemicals computer equipment and peripherals computer software and services construction consumer durable goods distribution education engineering services entertainment financial services food and beverage government (local state and federal level public administration) government (defense and intelligence) health medical and dental services insurance law enforcement management services media scientific and consulting services manufacturing pharmaceuticals public relations publishing real estate rental and leasing services retail trade telecommunications equipment telecommunication services transportation warehousing travel accommodation and hospitality services utilities waste management and wholesale trade Five industries represent 47 percent of the sample These include Banking Education Financial and Accounting Services Manufacturing and Retail Trade Another 27 industries represent the other 53 percent of the sample none of which represents more than five percent of the sample
Revenue or agency budgets of participating organizations Size of the organizations participating in the most recent benchmarks is somewhat evenly distributed although slightly fewer represent midsize organizations Thirty-six percent of the organizations represented by the findings have annual revenues or agency budgets that are less than $50 million Another twenty-nine percent of the sample has annual revenues or agency budgets between $50 million and $999 million The remaining thirty-five percent of the sample has annual revenues or agency budgets that are $1 billion or more
Functional areas of responsibility Thirty-five percent of the qualified participants for the benchmark work in IT with another 30 percent work in finance or internal controls The remaining 35 percent of the qualified participants work in a wide variety of functions from business line management senior management product design and development legal compliance sales marketing procurement logistics and customer services among other functions
Job titles of participants Thirty-five percent of the participants in the benchmark are senior managers with titles that include CEO CIO CFO or Vice president Thirty-eight percent are managers or directors and twenty-seven percent are staff in their organizations
Managing the Benefits and Risks of Mobile Computing
About IT Policy Compliance Group The mission of the IT Policy Compliance Group is to promote actionable findings based on evidence to assist organizations with delivering more value less risk and achieve IT policy and compliance objectives related to the use of information systems The Group Web site at wwwitpolicycompliancecom features quick two-minute self-assessments to compare outcomes and practices against onersquos industry peers and best performing organizations research reports continuing professional education conferences and seminars member and knowledge centers related research from around the World and resources including standards and frameworks associations government and regulators
The Grouprsquos research is designed to help IT risk legal financial and internal audit professionals to
Benchmark results and efforts against peers and best-in-class performers
Identify key drivers challenges and responses to improve results
Determine the applicability and use of specific capabilities to improve results
Identify best practices based on results and experience of peers
The Group relies upon its members and advisors for its research and editorial calendar
IT Policy Compliance Group Charter Members
The Institute of Symantec Corporation Internal Auditors ISACA 350 Ellis Street 247 Maitland Avenue 3701 Algonquin Road Suite 1010 Mountain View CA 94043 Altamonte Springs FL 32701 Rolling Meadows IL 60008 +1 (650) 527 8000 +1 (407) 937 1100 +1 (847) 253 1545 wwwsymanteccom wwwtheiiaorg wwwisacaorg infosymanteccom iiatheiiaorg infoisacaorg
Computer Security Institute Protiviti IT Governance Institute 600 Harrison Street New York Office 3701 Algonquin Road Suite 1010 San Francisco CA 94107 1290 Avenue of the Rolling Meadows IL 60008 +1 (415) 947 6320 Americas 5th Floor +1 (847) 660 5600 wwwgocsicom New York New York 10104 wwwitgiorg csicmpcom +1 (212) 603 8300 infoitgiorg wwwprotiviticom infoprotiviticom
IT Policy Compliance Group Affiliate Members and Advisors A current list of Affiliate Members and Advisors to the Group can be found on the IT Policy Compliance Group website
26
Founded in 2005 the IT Policy Compliance Group conducts benchmark research focused on delivering fact-based guidance on the steps that can be taken to improve results Benchmark results are reported through wwwitpolicycompliancecom for the benefit of members
IT Policy Compliance Group
Contacts Managing Director Jim Hurley Telephone +1 (216) 373 7010 jhurleyitpolicycompliancecom Managing Editor John Ortbal Telephone +1 (847) 444 0344 jortbalitpolicycompliancecom wwwitpolicycompliancecom
December 2011
The information contained in this publication has been obtained from sources that the IT Policy Compliance Group believes to be reliable but is not guaranteed Research publications reflect current conditions that are subject to change without notice
Copyright copy 2011 IT Policy Compliance Group Names and logos may be trademarks of their respective owners All rights reserved 1211 293167003
32
Managing the Benefits and Risks of Mobile Computing
4
Considerations to evaluate
Requirements of your information security audits
Due-care and due-diligence requirements imposed by legal and regulatory requirements
Cross-border data privacy and ownership issues that impact data ownership legal and regulatory mandates
Practices defining better and best outcomes
Limit access to sensitive information and applications for authorized mobile devices and employees
Geo-track devices especially Smartphones
Prohibit the use of custom ROMs and unauthorized App -markets or -sites
Deliver security awareness training and measure its effectiveness with employees
Regularly scan mobile devices with anti-virus and anti-malware
Protect and backup information on the devices
Wipe and lock stolen and lost devices as soon as being notified by employees
Investigate the availability of patching for company-owned devices
Use frequent controls and configuration testing to reduce gaps and limit risks
Consider vendor carrier and manufacturer histories of support or updates for non-company owned devices
Increase spend on information security beyond your peers
Organization of the Report There are four sections to this report as follows
Executive Summary Key findings and recommendations from the research Detailed Benchmark Findings Detailed findings from the research Appendix and Additional Resources Additional research findings sources of information organizations publications and topical resources Research Background S cope coverage sample sizes and demographics of the research findings contained in this report
Managing the Benefits and Risks of Mobile Computing
5
Detailed Benchmark Findings
Background and Introduction The most recent research conducted by the IT Policy Compliance Group (ITPCG) focuses on Mobile computing specifically on the benefits risks challenges policies practices challenges and actions being taken by organizations and employees using Smartphones and Tablet computers in the workplace to accomplish their jobs
As with other research conducted by ITPCG some of the outcomes measured include revenue and profit business downtime related to IT failures and disruptions audit deficiencies found in IT and the loss or theft of sensitive information Findings contained in this report include results from primary quantitative and qualitative research conducted by the Group In addition additional resources are listed after the Appendix for those seeking additional topical information
As we found from large on-site polling events during 2011 the use of Smartphones to access information and applications in the workplace is a contentious and visceral hot-topic for Information Technology (IT) risk audit and legal managers who are responsible for helping their organizations succeed while also ensuring adequate protections and controls are in place to safeguard the interests of the organization
The ITPCG hopes the findings from this research contribute some clarity toward successful strategies and practices to more effectively manage the benefits and risks of Mobile computing mdash going forward
Use of Smartphones and Tablet Computers in the Workplace The use of Smartphones by organizations to access information and applications in the workplace is stunningly high 8-in-10 (79 percent) of all organizations currently use Smartphones for this purpose However the high rate of Smartphone use is not matched by Tablet computers where the use of these devices to access information and applications is currently less than 4-in-10 (35 percent) organizations (Figure 1)
In addition non-scientific sampling conducted at large on-site events yielded consistent ranges from 7-in-10 to as many of 9-in-10 organizations currently using Smartphones to access information and applications while the rates for Tablet computers were found to be between 2-in-10 and 5-in-10 organizations
Figure 1 Use of smartphones and tablet computers
Nearly 8-in-10 organizations use
Smartphones to access information and
application in the workplace Yet less than half of these are
using Tablet computers
Source IT Policy Compliance Group 2011
Almost everyone we interviewed said that mobile phones mdash especially Smartphones mdash have been used in their business for years with many citing the use of RIM-based Blackberry devices having the longest tenure
Managing the Benefits and Risks of Mobile Computing
6
In general the security and management tools for the Blackberry phones are well liked by IT internal audit and legal counsel and risk managers But the phones are apparently showing their age Many cited the recent availability of Applersquos iPhone and Googlersquos Android Smartphones as driving-factors behind an increase in use of non-Blackberry Smartphones by employees during the past two years even in organizations not supporting these devices
The use of Tablet computers appears to be rather recent as old as one-to-two years according to many interviewed While some people cited using smaller-form notebook computers more than five years ago it is the Apple iPad that struck the nerve of most in one-on-one discussions and focus groups
Interestingly the research reveals the rate of growth between Smartphones and Tablet computers is expected to be different during the next two years Smartphones are expected to stabilize at about 8-in-10 organizations through 2013 while Tablet computers are expected to climb by almost 15 percent to nearly one-in-two organizations by 2013
Use of Mobile Devices by Size and Outcome of Organizations The use of mobile devices by organizations varies by size with less use more common by smaller organizations and more use of these devices among larger organizations
Use of mobile devices by size The level of Smartphone use among small organizations mdash at 63 percent mdash is much lower than the industry-average of 79 percent of organizations Similarly the level of use of Tablet computers among small organizations mdash at 16 percent mdash is much smaller than the industry-average of 35 percent of organizations
Use of mobile devices is related to size and
outcomes There is more use of mobile devices among the large and better outcomes and
less use of mobile devices among the small
and worse outcomes
Among midsize organizations the use Smartphones and Tablet computers is close to approximating the average use levels with 82 percent of midsize organizations using Smartphones and 42 percent of midsize organizations using Tablet computers
Large organizations are more likely to be using Smartphones and Tablet computers Ninety-two percent of large organizations are using Smartphones to access information and applications This is accompanied by almost half (49 percent) of these organizations already using Tablet computers (Figure 2)
Figure 2 Use of smartphones and tablet computers
Source IT Policy Compliance Group 2011
Use of mobile devices by outcomes The use of mobile devices mdash Smartphones and Tablet computers mdash by outcomes is similar to use by size Organizations experiencing worse and worst outcomes are less likely to be using Smartphones and Tablet computers while those with better and best outcomes are more likely to be using mobile devices to access information and applications
The outcomes being experienced by organizations measure a range of metrics including profitability revenue business downtime audit deficiencies and loss of sensitive information among other factors
Managing the Benefits and Risks of Mobile Computing
7
Benchmarked Outcomes Almost 2-in-10 organizations (18 percent) experience the worst outcomes These organizations are experiencing the largest declines in revenue and profit the most business downtime due to IT failures and problems the highest level of audit deficiencies to correct in IT and the highest rates of loss or theft of sensitive information
Seven-in-ten organizations (70 percent) are operating with average outcomes involving changes in revenue and profit that range from negative to positive with higher levels of business downtime more deficiencies to correct and more events involving the loss or theft of sensitive information occurring during the past year
About 1-in-10 organizations (12 percent) experience the best outcomes this includes the highest increases in revenue and profit during the past year the lowest levels of business downtime due to failures or problems in IT the fewest deficiencies to correct in IT to pass audits and the fewest events involving the theft or loss of sensitive information (Figure 3)
Figure 3 Benchmarked outcomes
Source IT Policy Compliance Group 2011
Size outcomes and mobile device use An inspection of the extreme outcomes (worst and best) indicates a direct relationship between size outcomes and device use with more small businesses experiencing worst outcomes and lower rates of mobile device usage and much larger organizations experiencing better outcomes and higher rates of mobile device use
Small businesses 63 percent use Smartphones 16 percent use Tablet computers The results for small firms 29 percent experience the worst outcomes (60 percent higher than all organizations) 59 percent experience average outcomes (16 percent lower than all organizations) and 12 percent experience the best outcomes (the same as all organizations) There is unfortunately a higher tendency among 3-in-10 small organizations to be experiencing the worst outcomes
Midsize organizations 82 percent use Smartphones 42 percent use Tablet computers The results for midsize firms 18 percent experience the worst outcomes (the same as all organizations) 77 percent experience average outcomes (10 percent higher than all organizations) and five percent experience the best outcomes (58 percent lower than all organizations) Although not overweight on the negative or positive side of the outcome ledger there is a decided tendency toward slightly worse outcomes among midsize organization
Midsize organizations 92 percent use Smartphones 49 percent use Tablet computers The results for large organizations five percent experience the worst outcomes (73 percent lower than all organizations) 76 percent experience average outcomes (nine percent higher than all organizations) and 19 percent experience the best outcomes (58 percent higher than all organizations) The much lower incident rate of worse outcomes and higher rate of better outcomes reveals a tendency toward slightly better outcomes among large organizations
What is intriguing about the use of mobile devices size and outcomes is the range of actions taken practices implemented and controls used to manage risk by size and outcome In general the larger the organization the more likely it is to be implementing more of the actions practices and controls of organizations achieving the best outcomes In the interest of providing clarity around what is working to deliver better results from the use Mobile computing in the workplace most of the findings in this report will focus on whatrsquos different by outcomes
Managing the Benefits and Risks of Mobile Computing
8
Business Benefits of Smartphones and Tablet Computers The biggest benefits of using Smartphones and Tablet computers include being able to access business information from any location improved communications access to business applications and access to suppliers and partners from anywhere (Table 1)
Table 1 Business benefits of smartphones and tablets
Largest Benefits
Improvements in access to business information from any location
Improvements in communications from any location
Access to business applications from any location
Access to supplierspartners from any location
Source IT Policy Compliance Group 2011
Although not among the majority other benefits cited by best performers include the ability to improve customer sales and service from any location and the ability to reduce capital expenses The least likely benefits of using Smartphones and Tablet computers include the ability to reduce operating expenses and increases in flexibility adaptability and flexibility (Figure 4)
Figure 4 Business benefits of smartphones and tablet computers
The biggest benefits access to information
communications access to business
applications access to suppliers and partners
Source IT Policy Compliance Group 2011
A lopsided result for agility flexibility and adaptability occurs between outcomes experienced and the ranking of this benefit A larger number of average performing organizations find agility flexibility and adaptability to be more beneficial than best performers The other significant variation occurs where reductions to operating expenses are rated less beneficial among worst and best performing organizations and more beneficial by a majority of average performing firms
Smaller organizations less likely to be using Smartphones and Tablet computers are more likely to be among those experiencing the least benefits In comparison midsize organizations whose rate of use of mobile devices is lower than large organizations claim far higher benefits than larger competitors with far more use and experience Interestingly one of the benefits claimed by midsize organizations is out of proportion to the experience of others increases in agility flexibility and adaptability
Managing the Benefits and Risks of Mobile Computing
9
Although improved access to information is listed as a primary benefit in most cases information is only available after applications provide access to underlying information For this reason the research delves into the relationship between applications being used with Smartphones and Tablet computers
Applications Driving the Use of Mobile Devices The applications currently driving the use of Smartphones and Tablet computers include Email and mobile collaboration office productivity and sales force automation applications (Table 2)
Table 2 Applications driving the use of mobile devices
Most important applications
Email and mobile collaboration applications
Office productivity applications
Sales force automation applications
Source IT Policy Compliance Group 2011
Other applications cited as benefits but not by majorities of the best performers include voice and text communications financial applications customer sales and service as well as video- and audio- conferencing communications The least likely applications being used with Mobile devices include those for social media interactions and business continuity and disaster recovery (Figure 5)
Figure 5 Applications driving the use of mobile devices
The applications driving the use of
mobile devices email collaboration office
productivity and sales force automation
Source IT Policy Compliance Group 2011
Lopsided result occurs for voice and text communication applications the best and worst performing organizations value voice and text communications more highly while fewer average performers value these as highly
In addition more average performing organizations rate the use of social media applications more highly than do worst and best performing organizations
With the exception of voice and text communications smaller organizations are less likely to be using Smartphones and Tablet computers for a wider variety of applications to access information Given the more common use of mobile devices among those with better outcomes one expects to see more value being ascribed to more applications providing access to more critical business information among large and best performing organizations
Managing the Benefits and Risks of Mobile Computing
10
Although the benefits of Smartphones and Tablet computers are helping best performers mdash and proportionately more large organizations mdash to post higher revenue and profit levels due to immediate access to information and sharing of information with others these benefits come with business risks most notably the loss or theft of sensitive information unauthorized access to sensitive business information and a loss of control or a loss of governance
Business Risks of Smartphones and Tablet Computers The primary business risks related to the use of Smartphones and Tablet computers include the loss or theft of sensitive information and unauthorized access to sensitive business information or applications and a loss of control over data applications risks and audits (Table 3)
Table 3 Business risks of smartphones and tablet computers
Largest business risks
Loss or theft of sensitive information
Unauthorized access to sensitive information or applications
Loss of governance ndash or control ndash over data applications risks and audits
Source IT Policy Compliance Group 2011
The other major business risk cited by a majority of those experiencing the best outcomes includes the loss or theft of the devices themselves and the unintentional disclosure of sensitive information that occurs through these devices (Figure 6)
Figure 6 Business risks of smartphones and tablet computers
The business risks loss or theft of
sensitive information unauthorized access loss of control over
data applications risks and audits
Source IT Policy Compliance Group 2011
The lowest business risks are found to be customer defections due to misuse or failure of the devices followed by geo-tracking of employees or customers Although the numbers rank geo-tracking of employees as a low business risk one-on-one interviews conducted with several senior managers reveal geo-tracking to be a growing risk especially for high-ranking executives and in cases where teams of people from an organization are converging in one geographic area
Lopsided results for loss of devices and fraud are considered lower risks among average performing organizations but more risk among the best and worst performing organizations Interviews revealed that most organizations consider Smartphones to be disposable as long as the information on these devices is protected from use or reuse
Managing the Benefits and Risks of Mobile Computing
11
Larger organizations tend to focus more on the impacts the devices have on customer loyalty repeat business revenue and profitability These are larger concerns in banking retail and transportation industries where entirely new mobile device Apps is being used by customers of firms in these industries
In addition to the business risks the research findings reveal very significant differences in policies and practices being implemented by organizations covering a range of activities including who owns mobile devices whether employees are encouraged or allowed to use their own devices and whether IT manages Smartphones and Tablet computers
Policies and Practices Governing Mobile Device Use in the Workplace The dominant polices and practices governing the use of mobile devices differ considerably with those experiencing best and average outcomes exhibiting more similar policies and practices Among the best and average performers IT is in charge of managing all devices employee owned or not (Table 4)
Table 4 Polices and practices
Outcomes Smartphones Tablet computers
Worst Use of mobile devices is unknown Employees use their own devices
Average IT manages employee-owned devices IT manages company-issued devices
Best IT manages employee-owned devices IT manages company-issued devices
Source IT Policy Compliance Group 2011
Among the worst performers the dominant culture is one where the use of mobile devices is largely unknown unregistered or unreported and employees are allowed to use their own devices
Among average and best performers the dominant policies and practices are very different IT manages the devices while employees are allowed to use their own Smartphones employees must use company-supplied Tablet computers (Figure 7)
Figure 7 Polices and practices
Source IT Policy Compliance Group 2011
Where IT is involved in managing Smartphones and Tablet computers better and best outcomes are more predominant whereas when IT is not managing mobile devices the predominant outcomes are worse and worst
Of the almost 4-in-10 organizations where employees use Tablet computers to access information and applications at work about one-third (33 percent) furnish and provision Tablet computers for employees slightly less than 40 percent allow employees to bring and use their own Smartphones to work and another 30 percent simply do not know how many Tablet computers are being used by employees
Worse results occur among organizations that do not know how many Smartphones are being used In addition several operational challenges are found to be directly related to more mdash or less mdash business risk related to the use of these Mobile devices
Managing the Benefits and Risks of Mobile Computing
12
Operational Challenges Contributing to Business Risks The primary operational challenges contributing to increased business risk from the use of Smartphones and Tablet computers include a) malicious software that can shut down or take-over mobiles devices b) ineffective vulnerability configuration and penetration testing for mobile devices c) an inability to detect or prevent rogue applications from operating on mobile devices and d) an inability to wipe-clean or lock stolen devices (Table 5)
Table 5 Operational challenges
Outcomes Primary operational challenges
Worst Inability to wipe or lock stolen devices
Average Malicious software
Vulnerability configuration penetration testing
Rogue applications
Best Malicious software
Vulnerability configuration penetration testing
Rogue applications
Inability to wipe or lock stolen devices
Source IT Policy Compliance Group 2011
Malicious software is ranked by 8-in-10 organizations as the factor most contributing to business risk After this ineffective practices for managing vulnerabilities configurations and penetration tests and an inability to detect or prevent rogue applications are rated most highly as contributing to increased business risk from the use of mobile devices (Figure 8)
Figure 8 Operational challenges
Operational challenges malicious software vulnerability
scanning configuration testing pen-testing
rogue software wipe or lock stolenlost
devices patching and remediation
Source IT Policy Compliance Group 2011
Detecting mobile devices and wiping data or locking stolen devices are ranked very highly by worst and best performing organizations and ranked much less highly as an operational challenge resulting in elevated business risks among average performing organizations
The lopsided difference is especially evident for the inability to wipe sensitive information or lock lost or stolen devices this is a challenge for 25 percent of the worst of the average performers whereas it a challenge leading to increased business risk by 50 percent of the best performers and nearly 60 percent of the worst performers
Managing the Benefits and Risks of Mobile Computing
13
In addition to operational challenges contributing to elevated business risks the benchmarks also identify legal and regulatory challenges that are contributing to increased business risk Often called a binary problem mdash you adhere to and report on a specific regulation or not mdash the findings reveal the challenges are larger than concerns about failing to comply with a single regulatory mandate or legal ruling
Legal and Regulatory Challenges Contributing to Business Risks The legal and regulatory challenges contributing to business risks from the use of Smartphones and Tablet computers include a) an inability to conduct information security audits and b) exposure to civil or criminal action due to inadequate due-care findings (Table 6)
Table 6 Legal and regulatory challenges
Outcomes Primary operational challenges
Worst Inability to comply with cross-border data privacy mandates
Average Inability to conduct information security audits
Exposure to civilcriminal actions due to inadequate due-care
Best Inability to conduct information security audits
Exposure to civilcriminal actions due to inadequate due-care
Inability to comply with cross-border data privacy mandates
Loss of ownership of data due to differences in jurisdictions
Source IT Policy Compliance Group 2011
After these two the primary challenges include an inability to comply with cross-border data privacy regulations or law loss of ownership of data due to differences in legal jurisdictions and an inability to deliver forensics information for investigations (Figure 9)
Figure 9 Legal and regulatory challenges
Legal and regulatory challenges information
security audits inadequate due-care
cross-border data privacy loss of
ownership over data
Source IT Policy Compliance Group 2011
Complying with cross-border data privacy regulations are challenges for worst and best performers but less of a challenge among average performing companies
Managing the Benefits and Risks of Mobile Computing
14
Organizations do not willingly engage in behavior whose risks are large enough to outweigh benefits Not as stark as a ldquoflight or fightrdquo reaction the primary action being taken to manage the risks of using Smartphones and Tablet computers reveal much about the outcomes organizations are experiencing
Action Taken to Manage the Risks The primary action taken to manage the risks of using mobile devices is to simply limit the number of employees who can use the devices mdash Smartphones and Tablet computers mdash to access applications and information in the workplace This action is shared by those with the best and average outcomes about 8-in-10 organizations However the primary action being taken by the worst performers is to ignore or discount the risk posed to the business from the use of these mobile devices (Table 7)
Table 7 Actions taken to manage the risks
Outcome Primary action taken to manage the risks
Worst Ignore or discount business risks associated with use of mobile devices
Average Limit the use of mobile devices to specific employees
Best Limit the use of mobile devices to specific employees
Source IT Policy Compliance Group 2011
In contrast the worst performers are not purposely limiting the use of mobile devices to specific employees rather these firms are ignoring or discounting the business risks or are trying to cover the business risks with existing or new insurance contracts
Fewer average better or best performing organizations are limiting the use of these devices and are ignoring or discounting the business risks involved (Figure 10)
Figure 10 Actions taken to manage the risks
Action taken to manage the risks limit number of employees that are allowed to use Smartphones or Tablet
computers in the workplace
Source IT Policy Compliance Group 2011
Limiting the use of mobile devices is a double-edged sword because the benefits tangible benefits include increases in revenue and profitability Although not tracked in these studies research from complementary longitudinal and non-longitudinal studies indicate that customer satisfaction and retention rates are also higher among the best performers The core issue for most organizations is the tradeoff between benefits and risks The obvious issue for most organizations is finding an optimal balance or tradeoff between risks and benefits
Managing the Benefits and Risks of Mobile Computing
15
Limiting the Number of Employees Who Use Mobile Devices Despite the benefits of using mobile devices the business risks are purposely keeping low the number of employees using these mobile devices in the workplace The number of employees using Smartphones to access information and applications is a rather low 3-in-10 people (33 percent) despite the high 8-in-10 (79 percent) number of organizations using these devices Similarly the average number of employees using Tablet computers to access information and applications is just 1-in-5 people (22 percent) among the 35 percent of organizations using these devices (Figure 11)
Figure 11 Use of mobile devices by employees
It is the use of Smartphones by
employees that are being artificially
restricted because of the business risks
Source IT Policy Compliance Group 2011
The use of mobile Smartphones is being artificially limited by organizations due to the risks involved Whether it is the simple visual depiction contained in Figure 11 or the ratio of employees to organizations using the devices or the range of employees using the devices it is clear that it is the use of Smartphones by employees to access information and applications that are being artificially restricted (Table 8)
Table 8 Use of mobile devices by employees
Employee use for 65 of
organizations
Employee use for 95 of
organizations
Ratio of employee use to organization use
Smartphones 31 to 36 29 to 38 42
Tablet computers 18 to 27 14 to 31 63
Source IT Policy Compliance Group 2011
Thus the calculus of determining who uses and who does not use Smartphones to access information and applications at an organization is as much a determination of business need and value as much as it is an evaluation of business risk
As part of the research the Group delved into additional practices organizations implement to see if there are other factors responsible for better mdash or worse mdash outcomes associated with the use of Mobile devices
Managing the Benefits and Risks of Mobile Computing
16
Practices that Determine Outcomes The primary practices being implemented to manage business risks for the employees who are using Smartphones and Tablet computers include limiting access to sensitive information or applications geo-tracking and locating lost or stolen devices protecting and backing-up information from mobile devices wiping sensitive information from stolen or lost mobile devices preventingrecording unauthorized logins from mobile devices delivering security-awareness training to employees who use mobile devices and prohibiting access to Apps-markets Apps-sites and custom ROMs on mobile devices (Table 9)
Table 9 Practices implemented to manage the risks
Priority Practices determining outcomes
1 Limit access to sensitive information and applications
2 Geo-track devices to aid in recovery or destruction of information
3 Protect and backup information from devices
4 Wipe stolen or lost devices of information and credentials
5 Prevent and record unauthorized logon attempts
6 Deliver and measure policy and security awareness training for users
7 Prohibit custom ROMs for rooted devices and access to App-markets
Source IT Policy Compliance Group 2011
As the research uncovered the range of practices implemented to manage business risks are directly related to outcomes Far more of the best performing organizations have more employees using these devices are spending more on information security and are more likely to be implementing most of these practices The reverse was also found to be true the worst performers are simply not implementing the practices or are implementing a few rather than all (Figure 12)
Figure 12 Practices implemented to manage the risks
Practices that determine outcomes
limit access geo-track devices protect and backup data wipe
devices that are lost or stolen prevent
unauthorized logons deliver training no
ROMs or App-markets
Source IT Policy Compliance Group 2011
Managing the Benefits and Risks of Mobile Computing
17
Controls Used to Manage Risks Controls are used in business to assist with the execution of business strategy to manage business outcomes and to manage risk In the case of managing risks related to the use of mobile devices to access information and applications the controls employed by the best performers include using antivirus andor anti-malware scans of the devices encrypting sensitive information on the devices preventing unauthorized people and devices from accessing sensitive information and applications patching mobile device systems-level software where possible and testing configurations of the devices (Table 10)
Table 10 Controls used to manage risks
Priority Controls used to manage the risks
1 Use anti-virus and anti-malware
2 Protect sensitive information on devices with encryption
3 Prevent unauthorized devices and people from accessing informationapplications
4 Patch systems software on devices where possible
5 Test configurations and settings on devices
Source IT Policy Compliance Group 2011
Of the controls tested by the research the one implemented by a clear majority of the best performers is the use of anti-virus andor anti-malware scans The least commonly implemented control among these best performers is the use of virtual private networking (VPN) although interviews revealed many respondents were using some form of VPN with Smartphones in the workplace
In contrast several controls are either not implemented or are less likely implemented by the worst performers These include the scanning of ROMs on mobile devices scanning of vulnerabilities on mobile devices conducting penetration tests on mobile devices patching systems-level software where possible and using virtual private networking (Figure 13)
Figure 13 Controls used to manage risks
Controls to use anti-virusanti-malware encryption checks and limits on unauthorized
devicespeople patches and
configuration testing
Source IT Policy Compliance Group 2011
Managing the Benefits and Risks of Mobile Computing
18
Interestingly the biggest complaint the Group found in the interviews was due to ldquothe lack of patches to update the Android operating systemrdquo For this reason alone we found that many organizations had developed a ldquono Androidrdquo policy or told its users that Android phones could no longer be used Another practice found to significantly impact outcomes is how frequently organizations conduct assessments
Consistency of Assessments and Reporting The rate at which controls to manage risks are monitored assessed and reported on is directly related to outcomes For example the findings reveal significant differences from annual to monthly rates with those conducting less frequent assessments being among the majority of the worst performers and those with the most frequent assessments being among the best performers (Table 11)
Table 11 Rate of assessment and reporting
Outcome Average rate of assessment and reporting
Worst Once every twelve months
Average Once every four-to-five months
Best Once every month or less
Source IT Policy Compliance Group 2011
Mirroring findings in related research the rate at which controls are monitored assessed and compared against a range of conditions including policies prioritized risks threats gold-standards regulatory requirements and internal configuration baselines among others defines
1) When organizations find gaps in controls and procedures
2) Whether risks are larger than expected
3) Whether organizations are able to take appropriate action
4) Whether organizations are able to reduce business risks
When looked at from the perspective of size the research reveals many organizations may not have the tools to automate such assessments or are simply choosing to conduct annual audit review assessments rather than ongoing business risk assessments (Figure 14)
Figure 14 Rate of assessment and reporting
The best performers consistently assess
and report on controls and risks more
frequently
Source IT Policy Compliance Group 2011
Managing the Benefits and Risks of Mobile Computing
19
In addition to the rate of assessment and reporting another defining practice responsible for outcomes is found to be spending on information security by organizations
Spend on Information Security and Outcomes Worst performers are spending 60 percent less than average while the best performers are spending 60 percent more than average performers (Table 12)
Table 12 Spend on information security
Outcome Relative spend on information security compared with average performers
Worst 04
Average 10
Best 16
Source IT Policy Compliance Group 2011
In addition to the relative difference in spend on information security there are large differences in the percentage of the IT budget spent on information security While the range of spend among the worst is from zero to slightly more than 5 of the IT budget the average spent by the worst is less than three percent In contrast average performers spend 75 percent and best performers are spending 12 percent on average (Figure 15)
Figure 15 Spend on information security
The best performers spend a larger
percentage of a larger IT budget on
information security
Source IT Policy Compliance Group 2011
The amount spent is more revealing when considering the actual IT budgets IT budgets among worst performers is just 30 percent of what average performers spend on IT while the amount spent on IT by the best performers is more than 30 percent higher than the average performers
Thus smaller percentages of much smaller annual IT budgets are characteristic of spending on information security by the worst performers while larger percentages of much larger annual IT budgets are characteristic of spending on information security by the best performers
Spending on information security among some of the worst performers actually bottomed-out during the latter half of 2011 When combined with no controls on mobile devices and a culture that is ignoring or discounting the business risks related to the use of Mobile devices it is possible that 2012 could be a year with some negative brand-wrecking events for some of these organizations The best performers will be happy to have positioned themselves differently
Managing the Benefits and Risks of Mobile Computing
20
Back to the Future Is the adoption of Mobile computing a repeat of what occurred in the 1980s Back then it was connecting PCs via local networks to provide office workers with access to information that could be analyzed and acted on in local work groups Today it is about wirelessly interconnecting Mobile devices enabling anyone to share and act on information from any location If today is any indication of what happened in the 1980s then the use of these new powerful pocket-sized but supercharged Mobile devices is likely to change to shape of computing as we know it today
The use of Smartphones by 8-in-10 organizations could likely grow And the use of these devices by employees artificially restricted to 33 percent for now will likely grow as management systems and security controls become more standardized
But we are in a high-growth expansionary phase where Phone manufacturers and carriers are incented to cannibalize products they shipped just last year or as recently as last month leaving consumers employees and organizations with devices that are out of date and may never be updated with systems-level software that would otherwise cure security vulnerabilities
Unfortunately there is no standard Android phone unless you purchase a Google Nexus phone which will be updated by Google directly But the majority of Android phones purchased by consumers and employees are not stock Google Android phones Instead the vast majority of Android phones are overlaid by supplier goo-gads carrier changes along with unexpected and unwanted mdash Carrier IQ mdash additions The carriers and phone manufacturers are incented by the sale of new hardware bling and new service contracts
Encouraged by Google and the profit margins from the latest hardware bling and service contracts the carriers and phone manufacturers continue to develop their own versions of Android What the carriers and phone manufacturers are not incented to do is to deploy software updates to the Android operating system to their customers and so they donrsquot Instead they find it less expensive to lure their customers into an upgrade to a new device on contract two years later
There are more stable and routinely updated
operating systems shipping with
Smartphones from Applersquos iOS RIMrsquos
Blackberry and Windows phone
Eventually these problems and others may resolve themselves but it could be another few years mdash or more mdash of frustration before anything resembling stability in the Android operating system is common and enterprise-ready management tools and security controls are available for these new wonders of the information age
In the meantime there are much more stable mdash and routinely updated mdash operating systems shipping with Smartphones from Applersquos iOS RIMrsquos Blackberry and Windows phone None of these suffer the same problems afflicting Android phones
Whatever you do remember the lessons about what worked mdash and what didnrsquot mdash with earlier generational-changes such as the advent of PCs or the dawn of Internet-computing This longer-term perspective and the lessons will come in handy in formulating strategy and tactics as the use of Mobile computing expands in your workplace
Summary Observations Based on the outcomes being achieved by the best performing organizations
The business benefits of using Smartphones and Tablet computers include
Improved access to business information from any location
Improved customer retention and satisfaction levels and
Higher levels of revenue and profitability when compared with peers
The business risks of using mobile computing devices include
Loss or theft of sensitive information
Unauthorized access to information and applications
Loss of governance or control over sensitive business information business applications business risks and audits
Managing the Benefits and Risks of Mobile Computing
21
The primary information and applications currently being used with mobile devices include
Email and collaborative applications
Office productivity applications
Sales force automation applications
The primary actions to take to limit business risks include
Limit the use of Smartphones in the workplace to specifically approved employees
Fewer than 50 percent of employees currently use Smartphonersquos among the best performers
Policies and practices to implement include
Have IT manage all Tablet computers and Smartphones
Allow approved employees to use their own Smartphones
Furnish Tablet computers to employees
Considerations to evaluate include
Mobile devices are another part of the requirements of your information security audits
Compare your due-care requirements to defend against legal inquiry
Identify your cross-border data privacy and ownership requirements
Practices to implement include
Limit the use of Smartphones to access information and applications to approved employees
Limit access to sensitive information and applications for mobile devices
Geo-track devices especially Smartphones
Prohibit the use of custom ROMs and unapproved App-marketssites
Deliver security awareness training and measure effectiveness with employees
Scan mobile devices with anti-virus and anti-malware
Protect and backup information on the devices
Wipe and lock stolen and lost devices as soon as notified by employees
Investigate the availability of patching as part of device evaluations
Use frequent controls and configuration testing to reduce gaps and limit risks
Increase spend on information security beyond your peers
Managing the Benefits and Risks of Mobile Computing
22
Appendix Expected Changes in Device Use in the Workplace 2011 to 2013 Respondents were asked to identify changes that are most likely going to occur in organizational and employee uses of Smartphones and Tablet computers between 2011 and 2013 As projections these forecasts of user and organizational expectations are reflections of current sentiment
The use of Smartphones by organizations is expected to remain the same between 2011 and 2013 at 79 percent of all organizations However the use of Smartphones to access information and applications by employees is expected to increase from 33 percent to 39 percent (Table 13)
Table 13 Device use 2011 to 2013
Device being used Use by organizationsemployees
2011 2013 Change in use
Organizational use 79 79 -0- Smartphones
Employee use 33 39 6 increase
Organizational use 35 49 14 increase Tablet computers
Employee use 22 32 10 increase
Source IT Policy Compliance Group 2011
Unlike Smartphones the use of Tablet computers is expected to increase for organizations and employees from an average rate of 35 percent to 49 percent for organizations and from 22 to 32 for employees The increases are larger than the sample error of seven percent
After an increase in employees using both devices what is rather intriguing is an expected downtrend in the use of Smartphones among organizations with the best outcomes The decline in the use of Smartphones among best performers is expected to be from 85 percent to 73 percent mdash a decrease of 12 percent mdash from 2011 to 2013 (Figure 16)
Figure 16 Expected changes in device use
Source IT Policy Compliance Group 2011
The explanation for the overall rate of decline of Smartphone use among best performing organization can be found from declines in the uses of iPhone and Windows Phone platforms and much more significant declines in the use of Android and Blackberry phones
At the time the research was being carried out RIM was suffering from blackouts in its services around the World with rolling service-outages that occurred across multiple continents during a one-week period The general consensus of many people we spoke with at the time was the service-outages ldquoare the final event I need to make the switch when my subscription period is duerdquo On the other hand others simply replaced their Blackberry devices that week and did not wait until their subscription was due for renewal
Unlike the RIM Blackberry platforms we found consistently strong disaffection with Android devices due to the inability to obtain updates for the Android operating system without having to root devices and hope for the best using custom ROMs
Managing the Benefits and Risks of Mobile Computing
23
These problems left many saying things like ldquoI bought a pig in a poke never againrdquo Others took matters into their own hands rooted their phones and installed updated versions of Android over the Internet from a number of different development sites none of which were blessed by carriers phone manufacturers or their IT staff
IT managers the Group spoke with identified an utter lack of management tools for Android devices too many versions of Android and a complete lack of vulnerability testing for the devices The inability to update and cure security-problems were just some of the problems identified by IT managers the Group spoke with The upshot for many were two common reactions to the use of Android in the enterprise 1) if it was already deployed the common reaction was to pull back support for Android and convert to other supported Smartphones and 2) if Android was not already deployed wait for Android to become enterprise-ready (Table 14)
Table 14 Reaction to Android phones in the workplace
Status of Android Smartphones
Reaction
Already deployed Pull-back and convert to other Smartphones
If not already deployed Wait for Android to become enterprise-ready
Source IT Policy Compliance Group 2011
When it comes to Tablet computers the sentiment about expected changes in use of different platforms reveals Android Tablet computers likely to see the biggest gains between now and 2013 followed by healthy gains in the use of other Tablet computers The only sentiment indicating significant declines appear to be related to Android and Blackberry Smartphones (Figure 17)
Figure 17 Expected changes in platform use
Source IT Policy Compliance Group 2011
The outlook of current sentiment regarding use of different platforms by 2013 clearly indicates the best performers are predisposed to ditch Android and Blackberry phones and significantly increase the use of iPad Tablet computers
By contrast the worst performers are predisposed to increase use of Smartphones and Tablet computers across the board and with the exception of Blackberry phones increase other mobile device platforms among average performers
Managing the Benefits and Risks of Mobile Computing
24
Additional Resources Numerous sources of related information are available for those interested in pursuing more information on a wide range of topics related to Smartphones and Tablet computers The following are but a small sample of related information perspectives and insight The authors of these articles have no relationship with the ITPCG Android Security See httpdeveloperandroidcomguidetopicssecuritysecurityhtml Android Orphans Visualizing a Sad History of Support See httptheunderstatementcompost11982112928android-orphans-visualizing-a-sad-history-of-support A Look into Mobile Device Security httpwwwsymanteccomcontentenusaboutmediapdfssymc_mobile_device_security_june2011pdfom_ext_cid=biz_socmed_twitter_facebook_marketwire_linkedin_2011Jun_worldwide_mobilesecuritywp Carrier IQ what it is what it isnrsquot and what you need to do httpwwwengadgetcom20111201carrier-iq-what-it-is-what-it-isnt-and-what-you-need-to CIS Apple iOS configuration benchmarks httpbenchmarkscisecurityorgen-usroute=downloadsbrowsecategorybenchmarksmobileiphone Current Android Malware httpforensicsspreitzenbarthdepage_id=254 DISA STIGs for Smartphones - unclassified httpiasedisamilstigsnet_perimeterwirelesssmartphonehtml iOS Hardening Configuration Guide Department of Defence Intelligence and Security Australian Government httpwwwdsdgovaupublicationsiOS_Hardening_Guidepdf Mac OS X and iOS Security httpdeveloperapplecomlibrarymacdocumentationSecurityConceptualSecurity_OverviewArchitectureArchitecturehtmlapple_refdocuidTP30000976-CH202-TPXREF101 Mobile Malware Why Fraudsters are Two Steps Ahead httpwwwtrusteercomblogmobile-malware-why-fraudsters-are-two-steps-ahead Rootkit called Carrier IQ discovered phoning home with user data httpwwwzdnetcomblogapplerootkit-called-carrier-iq-discovered-phoning-home-with-user-data11792 RIM launches Blackberry Fusion to Secure Android and Apple devices httpbusinessfinancialpostcom20111129rim-launching-blackberry-mobile-fusion-to-secure-iphone-android-devices Smartphone Security httpwwwenisaeuropaeuactapplication-securitysmartphone-security-1 The Spy Files Map httpwikileaksorgThe-Spyfiles-The-Maphtml Ten Steps to Secure Your Mobile Devices httpswikiinternet2educonfluencedisplayitsg2Mobile+Device+Security
Why Your Phone is Insecure by Design httpwwwforbescomsitesandygreenberg20110812codebreaker-karsten-nohl-why-your-phone-is-insecure-by-design
Managing the Benefits and Risks of Mobile Computing
25
About the Research Topics researched by the IT Policy Compliance Group (IT PCG) are part of an ongoing calendar established in consultation with Advisory General and Charter members of the Group as well as from findings compiled from ongoing research In addition to specific tracking questions common to each benchmark the research is designed to uncover the relationship between business results outcomes being experienced by organizations actions taken practices implemented and capabilities organizations use to respond
The qualitative research findings presented in this report are from numerous focus groups one-on-one interviews and meetings held with larger audiences throughout 2011 The quantitative findings contained in this report are from primary research studies conducted with 210 organizations in North America during late 2011
The maximum error for the sample findings for the benchmark findings contained in this report is +- seven percent The primary focus of analysis contained in this report is to present the largest differences between the outcomes experienced and similarly aligned findings that are most responsible for the differences in outcomes Instead of relying on differences that are within or close to the sample errors the effort has been to focus on the largest differences For example instead of focusing on differences involving +- 10 percent the findings covered in this report tend to focus on the largest differences in the range of 50 percent or more
The findings covering the use of Mobile computing are representative of organizations in North America and cannot be construed or inferred to represent current usage or plans for Mobile computing outside of North America However the findings covering the performance outcomes benefits and risks of Mobile computing the practices to manage the business risks and the controls to manage the risks match findings from similar studies covering other geographies outside of North America including findings from Latin America South America Europe Africa the Middle East Asia and Oceania
Industries represented The quantitative research includes representation from the following industries advertising accounting services aerospace agriculture apparel architecture automotive banking chemicals computer equipment and peripherals computer software and services construction consumer durable goods distribution education engineering services entertainment financial services food and beverage government (local state and federal level public administration) government (defense and intelligence) health medical and dental services insurance law enforcement management services media scientific and consulting services manufacturing pharmaceuticals public relations publishing real estate rental and leasing services retail trade telecommunications equipment telecommunication services transportation warehousing travel accommodation and hospitality services utilities waste management and wholesale trade Five industries represent 47 percent of the sample These include Banking Education Financial and Accounting Services Manufacturing and Retail Trade Another 27 industries represent the other 53 percent of the sample none of which represents more than five percent of the sample
Revenue or agency budgets of participating organizations Size of the organizations participating in the most recent benchmarks is somewhat evenly distributed although slightly fewer represent midsize organizations Thirty-six percent of the organizations represented by the findings have annual revenues or agency budgets that are less than $50 million Another twenty-nine percent of the sample has annual revenues or agency budgets between $50 million and $999 million The remaining thirty-five percent of the sample has annual revenues or agency budgets that are $1 billion or more
Functional areas of responsibility Thirty-five percent of the qualified participants for the benchmark work in IT with another 30 percent work in finance or internal controls The remaining 35 percent of the qualified participants work in a wide variety of functions from business line management senior management product design and development legal compliance sales marketing procurement logistics and customer services among other functions
Job titles of participants Thirty-five percent of the participants in the benchmark are senior managers with titles that include CEO CIO CFO or Vice president Thirty-eight percent are managers or directors and twenty-seven percent are staff in their organizations
Managing the Benefits and Risks of Mobile Computing
About IT Policy Compliance Group The mission of the IT Policy Compliance Group is to promote actionable findings based on evidence to assist organizations with delivering more value less risk and achieve IT policy and compliance objectives related to the use of information systems The Group Web site at wwwitpolicycompliancecom features quick two-minute self-assessments to compare outcomes and practices against onersquos industry peers and best performing organizations research reports continuing professional education conferences and seminars member and knowledge centers related research from around the World and resources including standards and frameworks associations government and regulators
The Grouprsquos research is designed to help IT risk legal financial and internal audit professionals to
Benchmark results and efforts against peers and best-in-class performers
Identify key drivers challenges and responses to improve results
Determine the applicability and use of specific capabilities to improve results
Identify best practices based on results and experience of peers
The Group relies upon its members and advisors for its research and editorial calendar
IT Policy Compliance Group Charter Members
The Institute of Symantec Corporation Internal Auditors ISACA 350 Ellis Street 247 Maitland Avenue 3701 Algonquin Road Suite 1010 Mountain View CA 94043 Altamonte Springs FL 32701 Rolling Meadows IL 60008 +1 (650) 527 8000 +1 (407) 937 1100 +1 (847) 253 1545 wwwsymanteccom wwwtheiiaorg wwwisacaorg infosymanteccom iiatheiiaorg infoisacaorg
Computer Security Institute Protiviti IT Governance Institute 600 Harrison Street New York Office 3701 Algonquin Road Suite 1010 San Francisco CA 94107 1290 Avenue of the Rolling Meadows IL 60008 +1 (415) 947 6320 Americas 5th Floor +1 (847) 660 5600 wwwgocsicom New York New York 10104 wwwitgiorg csicmpcom +1 (212) 603 8300 infoitgiorg wwwprotiviticom infoprotiviticom
IT Policy Compliance Group Affiliate Members and Advisors A current list of Affiliate Members and Advisors to the Group can be found on the IT Policy Compliance Group website
26
Founded in 2005 the IT Policy Compliance Group conducts benchmark research focused on delivering fact-based guidance on the steps that can be taken to improve results Benchmark results are reported through wwwitpolicycompliancecom for the benefit of members
IT Policy Compliance Group
Contacts Managing Director Jim Hurley Telephone +1 (216) 373 7010 jhurleyitpolicycompliancecom Managing Editor John Ortbal Telephone +1 (847) 444 0344 jortbalitpolicycompliancecom wwwitpolicycompliancecom
December 2011
The information contained in this publication has been obtained from sources that the IT Policy Compliance Group believes to be reliable but is not guaranteed Research publications reflect current conditions that are subject to change without notice
Copyright copy 2011 IT Policy Compliance Group Names and logos may be trademarks of their respective owners All rights reserved 1211 293167003
32
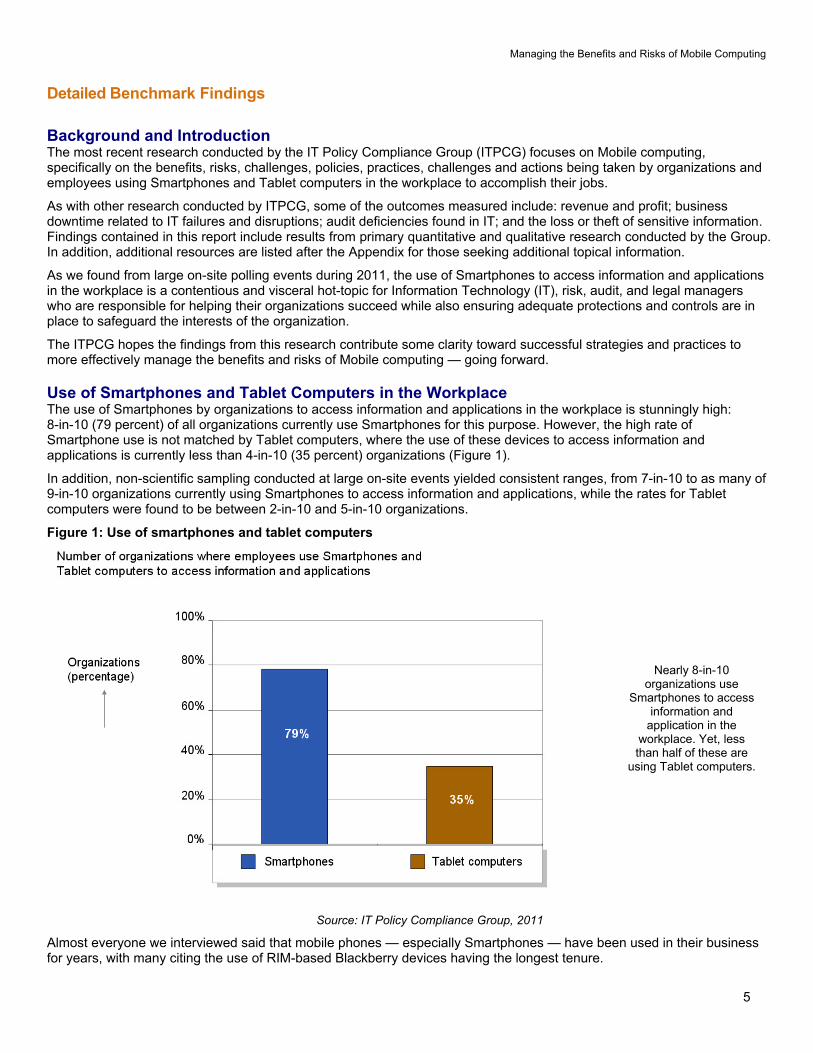
Managing the Benefits and Risks of Mobile Computing
6
In general the security and management tools for the Blackberry phones are well liked by IT internal audit and legal counsel and risk managers But the phones are apparently showing their age Many cited the recent availability of Applersquos iPhone and Googlersquos Android Smartphones as driving-factors behind an increase in use of non-Blackberry Smartphones by employees during the past two years even in organizations not supporting these devices
The use of Tablet computers appears to be rather recent as old as one-to-two years according to many interviewed While some people cited using smaller-form notebook computers more than five years ago it is the Apple iPad that struck the nerve of most in one-on-one discussions and focus groups
Interestingly the research reveals the rate of growth between Smartphones and Tablet computers is expected to be different during the next two years Smartphones are expected to stabilize at about 8-in-10 organizations through 2013 while Tablet computers are expected to climb by almost 15 percent to nearly one-in-two organizations by 2013
Use of Mobile Devices by Size and Outcome of Organizations The use of mobile devices by organizations varies by size with less use more common by smaller organizations and more use of these devices among larger organizations
Use of mobile devices by size The level of Smartphone use among small organizations mdash at 63 percent mdash is much lower than the industry-average of 79 percent of organizations Similarly the level of use of Tablet computers among small organizations mdash at 16 percent mdash is much smaller than the industry-average of 35 percent of organizations
Use of mobile devices is related to size and
outcomes There is more use of mobile devices among the large and better outcomes and
less use of mobile devices among the small
and worse outcomes
Among midsize organizations the use Smartphones and Tablet computers is close to approximating the average use levels with 82 percent of midsize organizations using Smartphones and 42 percent of midsize organizations using Tablet computers
Large organizations are more likely to be using Smartphones and Tablet computers Ninety-two percent of large organizations are using Smartphones to access information and applications This is accompanied by almost half (49 percent) of these organizations already using Tablet computers (Figure 2)
Figure 2 Use of smartphones and tablet computers
Source IT Policy Compliance Group 2011
Use of mobile devices by outcomes The use of mobile devices mdash Smartphones and Tablet computers mdash by outcomes is similar to use by size Organizations experiencing worse and worst outcomes are less likely to be using Smartphones and Tablet computers while those with better and best outcomes are more likely to be using mobile devices to access information and applications
The outcomes being experienced by organizations measure a range of metrics including profitability revenue business downtime audit deficiencies and loss of sensitive information among other factors
Managing the Benefits and Risks of Mobile Computing
7
Benchmarked Outcomes Almost 2-in-10 organizations (18 percent) experience the worst outcomes These organizations are experiencing the largest declines in revenue and profit the most business downtime due to IT failures and problems the highest level of audit deficiencies to correct in IT and the highest rates of loss or theft of sensitive information
Seven-in-ten organizations (70 percent) are operating with average outcomes involving changes in revenue and profit that range from negative to positive with higher levels of business downtime more deficiencies to correct and more events involving the loss or theft of sensitive information occurring during the past year
About 1-in-10 organizations (12 percent) experience the best outcomes this includes the highest increases in revenue and profit during the past year the lowest levels of business downtime due to failures or problems in IT the fewest deficiencies to correct in IT to pass audits and the fewest events involving the theft or loss of sensitive information (Figure 3)
Figure 3 Benchmarked outcomes
Source IT Policy Compliance Group 2011
Size outcomes and mobile device use An inspection of the extreme outcomes (worst and best) indicates a direct relationship between size outcomes and device use with more small businesses experiencing worst outcomes and lower rates of mobile device usage and much larger organizations experiencing better outcomes and higher rates of mobile device use
Small businesses 63 percent use Smartphones 16 percent use Tablet computers The results for small firms 29 percent experience the worst outcomes (60 percent higher than all organizations) 59 percent experience average outcomes (16 percent lower than all organizations) and 12 percent experience the best outcomes (the same as all organizations) There is unfortunately a higher tendency among 3-in-10 small organizations to be experiencing the worst outcomes
Midsize organizations 82 percent use Smartphones 42 percent use Tablet computers The results for midsize firms 18 percent experience the worst outcomes (the same as all organizations) 77 percent experience average outcomes (10 percent higher than all organizations) and five percent experience the best outcomes (58 percent lower than all organizations) Although not overweight on the negative or positive side of the outcome ledger there is a decided tendency toward slightly worse outcomes among midsize organization
Midsize organizations 92 percent use Smartphones 49 percent use Tablet computers The results for large organizations five percent experience the worst outcomes (73 percent lower than all organizations) 76 percent experience average outcomes (nine percent higher than all organizations) and 19 percent experience the best outcomes (58 percent higher than all organizations) The much lower incident rate of worse outcomes and higher rate of better outcomes reveals a tendency toward slightly better outcomes among large organizations
What is intriguing about the use of mobile devices size and outcomes is the range of actions taken practices implemented and controls used to manage risk by size and outcome In general the larger the organization the more likely it is to be implementing more of the actions practices and controls of organizations achieving the best outcomes In the interest of providing clarity around what is working to deliver better results from the use Mobile computing in the workplace most of the findings in this report will focus on whatrsquos different by outcomes
Managing the Benefits and Risks of Mobile Computing
8
Business Benefits of Smartphones and Tablet Computers The biggest benefits of using Smartphones and Tablet computers include being able to access business information from any location improved communications access to business applications and access to suppliers and partners from anywhere (Table 1)
Table 1 Business benefits of smartphones and tablets
Largest Benefits
Improvements in access to business information from any location
Improvements in communications from any location
Access to business applications from any location
Access to supplierspartners from any location
Source IT Policy Compliance Group 2011
Although not among the majority other benefits cited by best performers include the ability to improve customer sales and service from any location and the ability to reduce capital expenses The least likely benefits of using Smartphones and Tablet computers include the ability to reduce operating expenses and increases in flexibility adaptability and flexibility (Figure 4)
Figure 4 Business benefits of smartphones and tablet computers
The biggest benefits access to information
communications access to business
applications access to suppliers and partners
Source IT Policy Compliance Group 2011
A lopsided result for agility flexibility and adaptability occurs between outcomes experienced and the ranking of this benefit A larger number of average performing organizations find agility flexibility and adaptability to be more beneficial than best performers The other significant variation occurs where reductions to operating expenses are rated less beneficial among worst and best performing organizations and more beneficial by a majority of average performing firms
Smaller organizations less likely to be using Smartphones and Tablet computers are more likely to be among those experiencing the least benefits In comparison midsize organizations whose rate of use of mobile devices is lower than large organizations claim far higher benefits than larger competitors with far more use and experience Interestingly one of the benefits claimed by midsize organizations is out of proportion to the experience of others increases in agility flexibility and adaptability
Managing the Benefits and Risks of Mobile Computing
9
Although improved access to information is listed as a primary benefit in most cases information is only available after applications provide access to underlying information For this reason the research delves into the relationship between applications being used with Smartphones and Tablet computers
Applications Driving the Use of Mobile Devices The applications currently driving the use of Smartphones and Tablet computers include Email and mobile collaboration office productivity and sales force automation applications (Table 2)
Table 2 Applications driving the use of mobile devices
Most important applications
Email and mobile collaboration applications
Office productivity applications
Sales force automation applications
Source IT Policy Compliance Group 2011
Other applications cited as benefits but not by majorities of the best performers include voice and text communications financial applications customer sales and service as well as video- and audio- conferencing communications The least likely applications being used with Mobile devices include those for social media interactions and business continuity and disaster recovery (Figure 5)
Figure 5 Applications driving the use of mobile devices
The applications driving the use of
mobile devices email collaboration office
productivity and sales force automation
Source IT Policy Compliance Group 2011
Lopsided result occurs for voice and text communication applications the best and worst performing organizations value voice and text communications more highly while fewer average performers value these as highly
In addition more average performing organizations rate the use of social media applications more highly than do worst and best performing organizations
With the exception of voice and text communications smaller organizations are less likely to be using Smartphones and Tablet computers for a wider variety of applications to access information Given the more common use of mobile devices among those with better outcomes one expects to see more value being ascribed to more applications providing access to more critical business information among large and best performing organizations
Managing the Benefits and Risks of Mobile Computing
10
Although the benefits of Smartphones and Tablet computers are helping best performers mdash and proportionately more large organizations mdash to post higher revenue and profit levels due to immediate access to information and sharing of information with others these benefits come with business risks most notably the loss or theft of sensitive information unauthorized access to sensitive business information and a loss of control or a loss of governance
Business Risks of Smartphones and Tablet Computers The primary business risks related to the use of Smartphones and Tablet computers include the loss or theft of sensitive information and unauthorized access to sensitive business information or applications and a loss of control over data applications risks and audits (Table 3)
Table 3 Business risks of smartphones and tablet computers
Largest business risks
Loss or theft of sensitive information
Unauthorized access to sensitive information or applications
Loss of governance ndash or control ndash over data applications risks and audits
Source IT Policy Compliance Group 2011
The other major business risk cited by a majority of those experiencing the best outcomes includes the loss or theft of the devices themselves and the unintentional disclosure of sensitive information that occurs through these devices (Figure 6)
Figure 6 Business risks of smartphones and tablet computers
The business risks loss or theft of
sensitive information unauthorized access loss of control over
data applications risks and audits
Source IT Policy Compliance Group 2011
The lowest business risks are found to be customer defections due to misuse or failure of the devices followed by geo-tracking of employees or customers Although the numbers rank geo-tracking of employees as a low business risk one-on-one interviews conducted with several senior managers reveal geo-tracking to be a growing risk especially for high-ranking executives and in cases where teams of people from an organization are converging in one geographic area
Lopsided results for loss of devices and fraud are considered lower risks among average performing organizations but more risk among the best and worst performing organizations Interviews revealed that most organizations consider Smartphones to be disposable as long as the information on these devices is protected from use or reuse
Managing the Benefits and Risks of Mobile Computing
11
Larger organizations tend to focus more on the impacts the devices have on customer loyalty repeat business revenue and profitability These are larger concerns in banking retail and transportation industries where entirely new mobile device Apps is being used by customers of firms in these industries
In addition to the business risks the research findings reveal very significant differences in policies and practices being implemented by organizations covering a range of activities including who owns mobile devices whether employees are encouraged or allowed to use their own devices and whether IT manages Smartphones and Tablet computers
Policies and Practices Governing Mobile Device Use in the Workplace The dominant polices and practices governing the use of mobile devices differ considerably with those experiencing best and average outcomes exhibiting more similar policies and practices Among the best and average performers IT is in charge of managing all devices employee owned or not (Table 4)
Table 4 Polices and practices
Outcomes Smartphones Tablet computers
Worst Use of mobile devices is unknown Employees use their own devices
Average IT manages employee-owned devices IT manages company-issued devices
Best IT manages employee-owned devices IT manages company-issued devices
Source IT Policy Compliance Group 2011
Among the worst performers the dominant culture is one where the use of mobile devices is largely unknown unregistered or unreported and employees are allowed to use their own devices
Among average and best performers the dominant policies and practices are very different IT manages the devices while employees are allowed to use their own Smartphones employees must use company-supplied Tablet computers (Figure 7)
Figure 7 Polices and practices
Source IT Policy Compliance Group 2011
Where IT is involved in managing Smartphones and Tablet computers better and best outcomes are more predominant whereas when IT is not managing mobile devices the predominant outcomes are worse and worst
Of the almost 4-in-10 organizations where employees use Tablet computers to access information and applications at work about one-third (33 percent) furnish and provision Tablet computers for employees slightly less than 40 percent allow employees to bring and use their own Smartphones to work and another 30 percent simply do not know how many Tablet computers are being used by employees
Worse results occur among organizations that do not know how many Smartphones are being used In addition several operational challenges are found to be directly related to more mdash or less mdash business risk related to the use of these Mobile devices
Managing the Benefits and Risks of Mobile Computing
12
Operational Challenges Contributing to Business Risks The primary operational challenges contributing to increased business risk from the use of Smartphones and Tablet computers include a) malicious software that can shut down or take-over mobiles devices b) ineffective vulnerability configuration and penetration testing for mobile devices c) an inability to detect or prevent rogue applications from operating on mobile devices and d) an inability to wipe-clean or lock stolen devices (Table 5)
Table 5 Operational challenges
Outcomes Primary operational challenges
Worst Inability to wipe or lock stolen devices
Average Malicious software
Vulnerability configuration penetration testing
Rogue applications
Best Malicious software
Vulnerability configuration penetration testing
Rogue applications
Inability to wipe or lock stolen devices
Source IT Policy Compliance Group 2011
Malicious software is ranked by 8-in-10 organizations as the factor most contributing to business risk After this ineffective practices for managing vulnerabilities configurations and penetration tests and an inability to detect or prevent rogue applications are rated most highly as contributing to increased business risk from the use of mobile devices (Figure 8)
Figure 8 Operational challenges
Operational challenges malicious software vulnerability
scanning configuration testing pen-testing
rogue software wipe or lock stolenlost
devices patching and remediation
Source IT Policy Compliance Group 2011
Detecting mobile devices and wiping data or locking stolen devices are ranked very highly by worst and best performing organizations and ranked much less highly as an operational challenge resulting in elevated business risks among average performing organizations
The lopsided difference is especially evident for the inability to wipe sensitive information or lock lost or stolen devices this is a challenge for 25 percent of the worst of the average performers whereas it a challenge leading to increased business risk by 50 percent of the best performers and nearly 60 percent of the worst performers
Managing the Benefits and Risks of Mobile Computing
13
In addition to operational challenges contributing to elevated business risks the benchmarks also identify legal and regulatory challenges that are contributing to increased business risk Often called a binary problem mdash you adhere to and report on a specific regulation or not mdash the findings reveal the challenges are larger than concerns about failing to comply with a single regulatory mandate or legal ruling
Legal and Regulatory Challenges Contributing to Business Risks The legal and regulatory challenges contributing to business risks from the use of Smartphones and Tablet computers include a) an inability to conduct information security audits and b) exposure to civil or criminal action due to inadequate due-care findings (Table 6)
Table 6 Legal and regulatory challenges
Outcomes Primary operational challenges
Worst Inability to comply with cross-border data privacy mandates
Average Inability to conduct information security audits
Exposure to civilcriminal actions due to inadequate due-care
Best Inability to conduct information security audits
Exposure to civilcriminal actions due to inadequate due-care
Inability to comply with cross-border data privacy mandates
Loss of ownership of data due to differences in jurisdictions
Source IT Policy Compliance Group 2011
After these two the primary challenges include an inability to comply with cross-border data privacy regulations or law loss of ownership of data due to differences in legal jurisdictions and an inability to deliver forensics information for investigations (Figure 9)
Figure 9 Legal and regulatory challenges
Legal and regulatory challenges information
security audits inadequate due-care
cross-border data privacy loss of
ownership over data
Source IT Policy Compliance Group 2011
Complying with cross-border data privacy regulations are challenges for worst and best performers but less of a challenge among average performing companies
Managing the Benefits and Risks of Mobile Computing
14
Organizations do not willingly engage in behavior whose risks are large enough to outweigh benefits Not as stark as a ldquoflight or fightrdquo reaction the primary action being taken to manage the risks of using Smartphones and Tablet computers reveal much about the outcomes organizations are experiencing
Action Taken to Manage the Risks The primary action taken to manage the risks of using mobile devices is to simply limit the number of employees who can use the devices mdash Smartphones and Tablet computers mdash to access applications and information in the workplace This action is shared by those with the best and average outcomes about 8-in-10 organizations However the primary action being taken by the worst performers is to ignore or discount the risk posed to the business from the use of these mobile devices (Table 7)
Table 7 Actions taken to manage the risks
Outcome Primary action taken to manage the risks
Worst Ignore or discount business risks associated with use of mobile devices
Average Limit the use of mobile devices to specific employees
Best Limit the use of mobile devices to specific employees
Source IT Policy Compliance Group 2011
In contrast the worst performers are not purposely limiting the use of mobile devices to specific employees rather these firms are ignoring or discounting the business risks or are trying to cover the business risks with existing or new insurance contracts
Fewer average better or best performing organizations are limiting the use of these devices and are ignoring or discounting the business risks involved (Figure 10)
Figure 10 Actions taken to manage the risks
Action taken to manage the risks limit number of employees that are allowed to use Smartphones or Tablet
computers in the workplace
Source IT Policy Compliance Group 2011
Limiting the use of mobile devices is a double-edged sword because the benefits tangible benefits include increases in revenue and profitability Although not tracked in these studies research from complementary longitudinal and non-longitudinal studies indicate that customer satisfaction and retention rates are also higher among the best performers The core issue for most organizations is the tradeoff between benefits and risks The obvious issue for most organizations is finding an optimal balance or tradeoff between risks and benefits
Managing the Benefits and Risks of Mobile Computing
15
Limiting the Number of Employees Who Use Mobile Devices Despite the benefits of using mobile devices the business risks are purposely keeping low the number of employees using these mobile devices in the workplace The number of employees using Smartphones to access information and applications is a rather low 3-in-10 people (33 percent) despite the high 8-in-10 (79 percent) number of organizations using these devices Similarly the average number of employees using Tablet computers to access information and applications is just 1-in-5 people (22 percent) among the 35 percent of organizations using these devices (Figure 11)
Figure 11 Use of mobile devices by employees
It is the use of Smartphones by
employees that are being artificially
restricted because of the business risks
Source IT Policy Compliance Group 2011
The use of mobile Smartphones is being artificially limited by organizations due to the risks involved Whether it is the simple visual depiction contained in Figure 11 or the ratio of employees to organizations using the devices or the range of employees using the devices it is clear that it is the use of Smartphones by employees to access information and applications that are being artificially restricted (Table 8)
Table 8 Use of mobile devices by employees
Employee use for 65 of
organizations
Employee use for 95 of
organizations
Ratio of employee use to organization use
Smartphones 31 to 36 29 to 38 42
Tablet computers 18 to 27 14 to 31 63
Source IT Policy Compliance Group 2011
Thus the calculus of determining who uses and who does not use Smartphones to access information and applications at an organization is as much a determination of business need and value as much as it is an evaluation of business risk
As part of the research the Group delved into additional practices organizations implement to see if there are other factors responsible for better mdash or worse mdash outcomes associated with the use of Mobile devices
Managing the Benefits and Risks of Mobile Computing
16
Practices that Determine Outcomes The primary practices being implemented to manage business risks for the employees who are using Smartphones and Tablet computers include limiting access to sensitive information or applications geo-tracking and locating lost or stolen devices protecting and backing-up information from mobile devices wiping sensitive information from stolen or lost mobile devices preventingrecording unauthorized logins from mobile devices delivering security-awareness training to employees who use mobile devices and prohibiting access to Apps-markets Apps-sites and custom ROMs on mobile devices (Table 9)
Table 9 Practices implemented to manage the risks
Priority Practices determining outcomes
1 Limit access to sensitive information and applications
2 Geo-track devices to aid in recovery or destruction of information
3 Protect and backup information from devices
4 Wipe stolen or lost devices of information and credentials
5 Prevent and record unauthorized logon attempts
6 Deliver and measure policy and security awareness training for users
7 Prohibit custom ROMs for rooted devices and access to App-markets
Source IT Policy Compliance Group 2011
As the research uncovered the range of practices implemented to manage business risks are directly related to outcomes Far more of the best performing organizations have more employees using these devices are spending more on information security and are more likely to be implementing most of these practices The reverse was also found to be true the worst performers are simply not implementing the practices or are implementing a few rather than all (Figure 12)
Figure 12 Practices implemented to manage the risks
Practices that determine outcomes
limit access geo-track devices protect and backup data wipe
devices that are lost or stolen prevent
unauthorized logons deliver training no
ROMs or App-markets
Source IT Policy Compliance Group 2011
Managing the Benefits and Risks of Mobile Computing
17
Controls Used to Manage Risks Controls are used in business to assist with the execution of business strategy to manage business outcomes and to manage risk In the case of managing risks related to the use of mobile devices to access information and applications the controls employed by the best performers include using antivirus andor anti-malware scans of the devices encrypting sensitive information on the devices preventing unauthorized people and devices from accessing sensitive information and applications patching mobile device systems-level software where possible and testing configurations of the devices (Table 10)
Table 10 Controls used to manage risks
Priority Controls used to manage the risks
1 Use anti-virus and anti-malware
2 Protect sensitive information on devices with encryption
3 Prevent unauthorized devices and people from accessing informationapplications
4 Patch systems software on devices where possible
5 Test configurations and settings on devices
Source IT Policy Compliance Group 2011
Of the controls tested by the research the one implemented by a clear majority of the best performers is the use of anti-virus andor anti-malware scans The least commonly implemented control among these best performers is the use of virtual private networking (VPN) although interviews revealed many respondents were using some form of VPN with Smartphones in the workplace
In contrast several controls are either not implemented or are less likely implemented by the worst performers These include the scanning of ROMs on mobile devices scanning of vulnerabilities on mobile devices conducting penetration tests on mobile devices patching systems-level software where possible and using virtual private networking (Figure 13)
Figure 13 Controls used to manage risks
Controls to use anti-virusanti-malware encryption checks and limits on unauthorized
devicespeople patches and
configuration testing
Source IT Policy Compliance Group 2011
Managing the Benefits and Risks of Mobile Computing
18
Interestingly the biggest complaint the Group found in the interviews was due to ldquothe lack of patches to update the Android operating systemrdquo For this reason alone we found that many organizations had developed a ldquono Androidrdquo policy or told its users that Android phones could no longer be used Another practice found to significantly impact outcomes is how frequently organizations conduct assessments
Consistency of Assessments and Reporting The rate at which controls to manage risks are monitored assessed and reported on is directly related to outcomes For example the findings reveal significant differences from annual to monthly rates with those conducting less frequent assessments being among the majority of the worst performers and those with the most frequent assessments being among the best performers (Table 11)
Table 11 Rate of assessment and reporting
Outcome Average rate of assessment and reporting
Worst Once every twelve months
Average Once every four-to-five months
Best Once every month or less
Source IT Policy Compliance Group 2011
Mirroring findings in related research the rate at which controls are monitored assessed and compared against a range of conditions including policies prioritized risks threats gold-standards regulatory requirements and internal configuration baselines among others defines
1) When organizations find gaps in controls and procedures
2) Whether risks are larger than expected
3) Whether organizations are able to take appropriate action
4) Whether organizations are able to reduce business risks
When looked at from the perspective of size the research reveals many organizations may not have the tools to automate such assessments or are simply choosing to conduct annual audit review assessments rather than ongoing business risk assessments (Figure 14)
Figure 14 Rate of assessment and reporting
The best performers consistently assess
and report on controls and risks more
frequently
Source IT Policy Compliance Group 2011
Managing the Benefits and Risks of Mobile Computing
19
In addition to the rate of assessment and reporting another defining practice responsible for outcomes is found to be spending on information security by organizations
Spend on Information Security and Outcomes Worst performers are spending 60 percent less than average while the best performers are spending 60 percent more than average performers (Table 12)
Table 12 Spend on information security
Outcome Relative spend on information security compared with average performers
Worst 04
Average 10
Best 16
Source IT Policy Compliance Group 2011
In addition to the relative difference in spend on information security there are large differences in the percentage of the IT budget spent on information security While the range of spend among the worst is from zero to slightly more than 5 of the IT budget the average spent by the worst is less than three percent In contrast average performers spend 75 percent and best performers are spending 12 percent on average (Figure 15)
Figure 15 Spend on information security
The best performers spend a larger
percentage of a larger IT budget on
information security
Source IT Policy Compliance Group 2011
The amount spent is more revealing when considering the actual IT budgets IT budgets among worst performers is just 30 percent of what average performers spend on IT while the amount spent on IT by the best performers is more than 30 percent higher than the average performers
Thus smaller percentages of much smaller annual IT budgets are characteristic of spending on information security by the worst performers while larger percentages of much larger annual IT budgets are characteristic of spending on information security by the best performers
Spending on information security among some of the worst performers actually bottomed-out during the latter half of 2011 When combined with no controls on mobile devices and a culture that is ignoring or discounting the business risks related to the use of Mobile devices it is possible that 2012 could be a year with some negative brand-wrecking events for some of these organizations The best performers will be happy to have positioned themselves differently
Managing the Benefits and Risks of Mobile Computing
20
Back to the Future Is the adoption of Mobile computing a repeat of what occurred in the 1980s Back then it was connecting PCs via local networks to provide office workers with access to information that could be analyzed and acted on in local work groups Today it is about wirelessly interconnecting Mobile devices enabling anyone to share and act on information from any location If today is any indication of what happened in the 1980s then the use of these new powerful pocket-sized but supercharged Mobile devices is likely to change to shape of computing as we know it today
The use of Smartphones by 8-in-10 organizations could likely grow And the use of these devices by employees artificially restricted to 33 percent for now will likely grow as management systems and security controls become more standardized
But we are in a high-growth expansionary phase where Phone manufacturers and carriers are incented to cannibalize products they shipped just last year or as recently as last month leaving consumers employees and organizations with devices that are out of date and may never be updated with systems-level software that would otherwise cure security vulnerabilities
Unfortunately there is no standard Android phone unless you purchase a Google Nexus phone which will be updated by Google directly But the majority of Android phones purchased by consumers and employees are not stock Google Android phones Instead the vast majority of Android phones are overlaid by supplier goo-gads carrier changes along with unexpected and unwanted mdash Carrier IQ mdash additions The carriers and phone manufacturers are incented by the sale of new hardware bling and new service contracts
Encouraged by Google and the profit margins from the latest hardware bling and service contracts the carriers and phone manufacturers continue to develop their own versions of Android What the carriers and phone manufacturers are not incented to do is to deploy software updates to the Android operating system to their customers and so they donrsquot Instead they find it less expensive to lure their customers into an upgrade to a new device on contract two years later
There are more stable and routinely updated
operating systems shipping with
Smartphones from Applersquos iOS RIMrsquos
Blackberry and Windows phone
Eventually these problems and others may resolve themselves but it could be another few years mdash or more mdash of frustration before anything resembling stability in the Android operating system is common and enterprise-ready management tools and security controls are available for these new wonders of the information age
In the meantime there are much more stable mdash and routinely updated mdash operating systems shipping with Smartphones from Applersquos iOS RIMrsquos Blackberry and Windows phone None of these suffer the same problems afflicting Android phones
Whatever you do remember the lessons about what worked mdash and what didnrsquot mdash with earlier generational-changes such as the advent of PCs or the dawn of Internet-computing This longer-term perspective and the lessons will come in handy in formulating strategy and tactics as the use of Mobile computing expands in your workplace
Summary Observations Based on the outcomes being achieved by the best performing organizations
The business benefits of using Smartphones and Tablet computers include
Improved access to business information from any location
Improved customer retention and satisfaction levels and
Higher levels of revenue and profitability when compared with peers
The business risks of using mobile computing devices include
Loss or theft of sensitive information
Unauthorized access to information and applications
Loss of governance or control over sensitive business information business applications business risks and audits
Managing the Benefits and Risks of Mobile Computing
21
The primary information and applications currently being used with mobile devices include
Email and collaborative applications
Office productivity applications
Sales force automation applications
The primary actions to take to limit business risks include
Limit the use of Smartphones in the workplace to specifically approved employees
Fewer than 50 percent of employees currently use Smartphonersquos among the best performers
Policies and practices to implement include
Have IT manage all Tablet computers and Smartphones
Allow approved employees to use their own Smartphones
Furnish Tablet computers to employees
Considerations to evaluate include
Mobile devices are another part of the requirements of your information security audits
Compare your due-care requirements to defend against legal inquiry
Identify your cross-border data privacy and ownership requirements
Practices to implement include
Limit the use of Smartphones to access information and applications to approved employees
Limit access to sensitive information and applications for mobile devices
Geo-track devices especially Smartphones
Prohibit the use of custom ROMs and unapproved App-marketssites
Deliver security awareness training and measure effectiveness with employees
Scan mobile devices with anti-virus and anti-malware
Protect and backup information on the devices
Wipe and lock stolen and lost devices as soon as notified by employees
Investigate the availability of patching as part of device evaluations
Use frequent controls and configuration testing to reduce gaps and limit risks
Increase spend on information security beyond your peers
Managing the Benefits and Risks of Mobile Computing
22
Appendix Expected Changes in Device Use in the Workplace 2011 to 2013 Respondents were asked to identify changes that are most likely going to occur in organizational and employee uses of Smartphones and Tablet computers between 2011 and 2013 As projections these forecasts of user and organizational expectations are reflections of current sentiment
The use of Smartphones by organizations is expected to remain the same between 2011 and 2013 at 79 percent of all organizations However the use of Smartphones to access information and applications by employees is expected to increase from 33 percent to 39 percent (Table 13)
Table 13 Device use 2011 to 2013
Device being used Use by organizationsemployees
2011 2013 Change in use
Organizational use 79 79 -0- Smartphones
Employee use 33 39 6 increase
Organizational use 35 49 14 increase Tablet computers
Employee use 22 32 10 increase
Source IT Policy Compliance Group 2011
Unlike Smartphones the use of Tablet computers is expected to increase for organizations and employees from an average rate of 35 percent to 49 percent for organizations and from 22 to 32 for employees The increases are larger than the sample error of seven percent
After an increase in employees using both devices what is rather intriguing is an expected downtrend in the use of Smartphones among organizations with the best outcomes The decline in the use of Smartphones among best performers is expected to be from 85 percent to 73 percent mdash a decrease of 12 percent mdash from 2011 to 2013 (Figure 16)
Figure 16 Expected changes in device use
Source IT Policy Compliance Group 2011
The explanation for the overall rate of decline of Smartphone use among best performing organization can be found from declines in the uses of iPhone and Windows Phone platforms and much more significant declines in the use of Android and Blackberry phones
At the time the research was being carried out RIM was suffering from blackouts in its services around the World with rolling service-outages that occurred across multiple continents during a one-week period The general consensus of many people we spoke with at the time was the service-outages ldquoare the final event I need to make the switch when my subscription period is duerdquo On the other hand others simply replaced their Blackberry devices that week and did not wait until their subscription was due for renewal
Unlike the RIM Blackberry platforms we found consistently strong disaffection with Android devices due to the inability to obtain updates for the Android operating system without having to root devices and hope for the best using custom ROMs
Managing the Benefits and Risks of Mobile Computing
23
These problems left many saying things like ldquoI bought a pig in a poke never againrdquo Others took matters into their own hands rooted their phones and installed updated versions of Android over the Internet from a number of different development sites none of which were blessed by carriers phone manufacturers or their IT staff
IT managers the Group spoke with identified an utter lack of management tools for Android devices too many versions of Android and a complete lack of vulnerability testing for the devices The inability to update and cure security-problems were just some of the problems identified by IT managers the Group spoke with The upshot for many were two common reactions to the use of Android in the enterprise 1) if it was already deployed the common reaction was to pull back support for Android and convert to other supported Smartphones and 2) if Android was not already deployed wait for Android to become enterprise-ready (Table 14)
Table 14 Reaction to Android phones in the workplace
Status of Android Smartphones
Reaction
Already deployed Pull-back and convert to other Smartphones
If not already deployed Wait for Android to become enterprise-ready
Source IT Policy Compliance Group 2011
When it comes to Tablet computers the sentiment about expected changes in use of different platforms reveals Android Tablet computers likely to see the biggest gains between now and 2013 followed by healthy gains in the use of other Tablet computers The only sentiment indicating significant declines appear to be related to Android and Blackberry Smartphones (Figure 17)
Figure 17 Expected changes in platform use
Source IT Policy Compliance Group 2011
The outlook of current sentiment regarding use of different platforms by 2013 clearly indicates the best performers are predisposed to ditch Android and Blackberry phones and significantly increase the use of iPad Tablet computers
By contrast the worst performers are predisposed to increase use of Smartphones and Tablet computers across the board and with the exception of Blackberry phones increase other mobile device platforms among average performers
Managing the Benefits and Risks of Mobile Computing
24
Additional Resources Numerous sources of related information are available for those interested in pursuing more information on a wide range of topics related to Smartphones and Tablet computers The following are but a small sample of related information perspectives and insight The authors of these articles have no relationship with the ITPCG Android Security See httpdeveloperandroidcomguidetopicssecuritysecurityhtml Android Orphans Visualizing a Sad History of Support See httptheunderstatementcompost11982112928android-orphans-visualizing-a-sad-history-of-support A Look into Mobile Device Security httpwwwsymanteccomcontentenusaboutmediapdfssymc_mobile_device_security_june2011pdfom_ext_cid=biz_socmed_twitter_facebook_marketwire_linkedin_2011Jun_worldwide_mobilesecuritywp Carrier IQ what it is what it isnrsquot and what you need to do httpwwwengadgetcom20111201carrier-iq-what-it-is-what-it-isnt-and-what-you-need-to CIS Apple iOS configuration benchmarks httpbenchmarkscisecurityorgen-usroute=downloadsbrowsecategorybenchmarksmobileiphone Current Android Malware httpforensicsspreitzenbarthdepage_id=254 DISA STIGs for Smartphones - unclassified httpiasedisamilstigsnet_perimeterwirelesssmartphonehtml iOS Hardening Configuration Guide Department of Defence Intelligence and Security Australian Government httpwwwdsdgovaupublicationsiOS_Hardening_Guidepdf Mac OS X and iOS Security httpdeveloperapplecomlibrarymacdocumentationSecurityConceptualSecurity_OverviewArchitectureArchitecturehtmlapple_refdocuidTP30000976-CH202-TPXREF101 Mobile Malware Why Fraudsters are Two Steps Ahead httpwwwtrusteercomblogmobile-malware-why-fraudsters-are-two-steps-ahead Rootkit called Carrier IQ discovered phoning home with user data httpwwwzdnetcomblogapplerootkit-called-carrier-iq-discovered-phoning-home-with-user-data11792 RIM launches Blackberry Fusion to Secure Android and Apple devices httpbusinessfinancialpostcom20111129rim-launching-blackberry-mobile-fusion-to-secure-iphone-android-devices Smartphone Security httpwwwenisaeuropaeuactapplication-securitysmartphone-security-1 The Spy Files Map httpwikileaksorgThe-Spyfiles-The-Maphtml Ten Steps to Secure Your Mobile Devices httpswikiinternet2educonfluencedisplayitsg2Mobile+Device+Security
Why Your Phone is Insecure by Design httpwwwforbescomsitesandygreenberg20110812codebreaker-karsten-nohl-why-your-phone-is-insecure-by-design
Managing the Benefits and Risks of Mobile Computing
25
About the Research Topics researched by the IT Policy Compliance Group (IT PCG) are part of an ongoing calendar established in consultation with Advisory General and Charter members of the Group as well as from findings compiled from ongoing research In addition to specific tracking questions common to each benchmark the research is designed to uncover the relationship between business results outcomes being experienced by organizations actions taken practices implemented and capabilities organizations use to respond
The qualitative research findings presented in this report are from numerous focus groups one-on-one interviews and meetings held with larger audiences throughout 2011 The quantitative findings contained in this report are from primary research studies conducted with 210 organizations in North America during late 2011
The maximum error for the sample findings for the benchmark findings contained in this report is +- seven percent The primary focus of analysis contained in this report is to present the largest differences between the outcomes experienced and similarly aligned findings that are most responsible for the differences in outcomes Instead of relying on differences that are within or close to the sample errors the effort has been to focus on the largest differences For example instead of focusing on differences involving +- 10 percent the findings covered in this report tend to focus on the largest differences in the range of 50 percent or more
The findings covering the use of Mobile computing are representative of organizations in North America and cannot be construed or inferred to represent current usage or plans for Mobile computing outside of North America However the findings covering the performance outcomes benefits and risks of Mobile computing the practices to manage the business risks and the controls to manage the risks match findings from similar studies covering other geographies outside of North America including findings from Latin America South America Europe Africa the Middle East Asia and Oceania
Industries represented The quantitative research includes representation from the following industries advertising accounting services aerospace agriculture apparel architecture automotive banking chemicals computer equipment and peripherals computer software and services construction consumer durable goods distribution education engineering services entertainment financial services food and beverage government (local state and federal level public administration) government (defense and intelligence) health medical and dental services insurance law enforcement management services media scientific and consulting services manufacturing pharmaceuticals public relations publishing real estate rental and leasing services retail trade telecommunications equipment telecommunication services transportation warehousing travel accommodation and hospitality services utilities waste management and wholesale trade Five industries represent 47 percent of the sample These include Banking Education Financial and Accounting Services Manufacturing and Retail Trade Another 27 industries represent the other 53 percent of the sample none of which represents more than five percent of the sample
Revenue or agency budgets of participating organizations Size of the organizations participating in the most recent benchmarks is somewhat evenly distributed although slightly fewer represent midsize organizations Thirty-six percent of the organizations represented by the findings have annual revenues or agency budgets that are less than $50 million Another twenty-nine percent of the sample has annual revenues or agency budgets between $50 million and $999 million The remaining thirty-five percent of the sample has annual revenues or agency budgets that are $1 billion or more
Functional areas of responsibility Thirty-five percent of the qualified participants for the benchmark work in IT with another 30 percent work in finance or internal controls The remaining 35 percent of the qualified participants work in a wide variety of functions from business line management senior management product design and development legal compliance sales marketing procurement logistics and customer services among other functions
Job titles of participants Thirty-five percent of the participants in the benchmark are senior managers with titles that include CEO CIO CFO or Vice president Thirty-eight percent are managers or directors and twenty-seven percent are staff in their organizations
Managing the Benefits and Risks of Mobile Computing
About IT Policy Compliance Group The mission of the IT Policy Compliance Group is to promote actionable findings based on evidence to assist organizations with delivering more value less risk and achieve IT policy and compliance objectives related to the use of information systems The Group Web site at wwwitpolicycompliancecom features quick two-minute self-assessments to compare outcomes and practices against onersquos industry peers and best performing organizations research reports continuing professional education conferences and seminars member and knowledge centers related research from around the World and resources including standards and frameworks associations government and regulators
The Grouprsquos research is designed to help IT risk legal financial and internal audit professionals to
Benchmark results and efforts against peers and best-in-class performers
Identify key drivers challenges and responses to improve results
Determine the applicability and use of specific capabilities to improve results
Identify best practices based on results and experience of peers
The Group relies upon its members and advisors for its research and editorial calendar
IT Policy Compliance Group Charter Members
The Institute of Symantec Corporation Internal Auditors ISACA 350 Ellis Street 247 Maitland Avenue 3701 Algonquin Road Suite 1010 Mountain View CA 94043 Altamonte Springs FL 32701 Rolling Meadows IL 60008 +1 (650) 527 8000 +1 (407) 937 1100 +1 (847) 253 1545 wwwsymanteccom wwwtheiiaorg wwwisacaorg infosymanteccom iiatheiiaorg infoisacaorg
Computer Security Institute Protiviti IT Governance Institute 600 Harrison Street New York Office 3701 Algonquin Road Suite 1010 San Francisco CA 94107 1290 Avenue of the Rolling Meadows IL 60008 +1 (415) 947 6320 Americas 5th Floor +1 (847) 660 5600 wwwgocsicom New York New York 10104 wwwitgiorg csicmpcom +1 (212) 603 8300 infoitgiorg wwwprotiviticom infoprotiviticom
IT Policy Compliance Group Affiliate Members and Advisors A current list of Affiliate Members and Advisors to the Group can be found on the IT Policy Compliance Group website
26
Founded in 2005 the IT Policy Compliance Group conducts benchmark research focused on delivering fact-based guidance on the steps that can be taken to improve results Benchmark results are reported through wwwitpolicycompliancecom for the benefit of members
IT Policy Compliance Group
Contacts Managing Director Jim Hurley Telephone +1 (216) 373 7010 jhurleyitpolicycompliancecom Managing Editor John Ortbal Telephone +1 (847) 444 0344 jortbalitpolicycompliancecom wwwitpolicycompliancecom
December 2011
The information contained in this publication has been obtained from sources that the IT Policy Compliance Group believes to be reliable but is not guaranteed Research publications reflect current conditions that are subject to change without notice
Copyright copy 2011 IT Policy Compliance Group Names and logos may be trademarks of their respective owners All rights reserved 1211 293167003
32
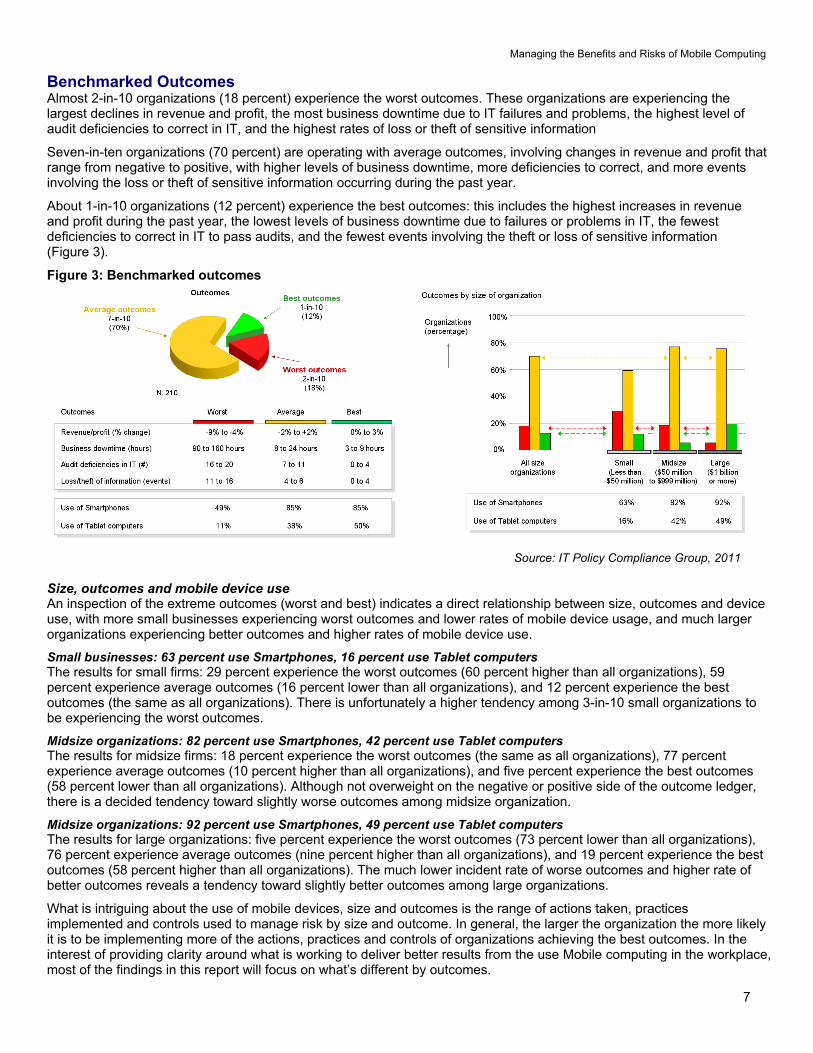
Managing the Benefits and Risks of Mobile Computing
7
Benchmarked Outcomes Almost 2-in-10 organizations (18 percent) experience the worst outcomes These organizations are experiencing the largest declines in revenue and profit the most business downtime due to IT failures and problems the highest level of audit deficiencies to correct in IT and the highest rates of loss or theft of sensitive information
Seven-in-ten organizations (70 percent) are operating with average outcomes involving changes in revenue and profit that range from negative to positive with higher levels of business downtime more deficiencies to correct and more events involving the loss or theft of sensitive information occurring during the past year
About 1-in-10 organizations (12 percent) experience the best outcomes this includes the highest increases in revenue and profit during the past year the lowest levels of business downtime due to failures or problems in IT the fewest deficiencies to correct in IT to pass audits and the fewest events involving the theft or loss of sensitive information (Figure 3)
Figure 3 Benchmarked outcomes
Source IT Policy Compliance Group 2011
Size outcomes and mobile device use An inspection of the extreme outcomes (worst and best) indicates a direct relationship between size outcomes and device use with more small businesses experiencing worst outcomes and lower rates of mobile device usage and much larger organizations experiencing better outcomes and higher rates of mobile device use
Small businesses 63 percent use Smartphones 16 percent use Tablet computers The results for small firms 29 percent experience the worst outcomes (60 percent higher than all organizations) 59 percent experience average outcomes (16 percent lower than all organizations) and 12 percent experience the best outcomes (the same as all organizations) There is unfortunately a higher tendency among 3-in-10 small organizations to be experiencing the worst outcomes
Midsize organizations 82 percent use Smartphones 42 percent use Tablet computers The results for midsize firms 18 percent experience the worst outcomes (the same as all organizations) 77 percent experience average outcomes (10 percent higher than all organizations) and five percent experience the best outcomes (58 percent lower than all organizations) Although not overweight on the negative or positive side of the outcome ledger there is a decided tendency toward slightly worse outcomes among midsize organization
Midsize organizations 92 percent use Smartphones 49 percent use Tablet computers The results for large organizations five percent experience the worst outcomes (73 percent lower than all organizations) 76 percent experience average outcomes (nine percent higher than all organizations) and 19 percent experience the best outcomes (58 percent higher than all organizations) The much lower incident rate of worse outcomes and higher rate of better outcomes reveals a tendency toward slightly better outcomes among large organizations
What is intriguing about the use of mobile devices size and outcomes is the range of actions taken practices implemented and controls used to manage risk by size and outcome In general the larger the organization the more likely it is to be implementing more of the actions practices and controls of organizations achieving the best outcomes In the interest of providing clarity around what is working to deliver better results from the use Mobile computing in the workplace most of the findings in this report will focus on whatrsquos different by outcomes
Managing the Benefits and Risks of Mobile Computing
8
Business Benefits of Smartphones and Tablet Computers The biggest benefits of using Smartphones and Tablet computers include being able to access business information from any location improved communications access to business applications and access to suppliers and partners from anywhere (Table 1)
Table 1 Business benefits of smartphones and tablets
Largest Benefits
Improvements in access to business information from any location
Improvements in communications from any location
Access to business applications from any location
Access to supplierspartners from any location
Source IT Policy Compliance Group 2011
Although not among the majority other benefits cited by best performers include the ability to improve customer sales and service from any location and the ability to reduce capital expenses The least likely benefits of using Smartphones and Tablet computers include the ability to reduce operating expenses and increases in flexibility adaptability and flexibility (Figure 4)
Figure 4 Business benefits of smartphones and tablet computers
The biggest benefits access to information
communications access to business
applications access to suppliers and partners
Source IT Policy Compliance Group 2011
A lopsided result for agility flexibility and adaptability occurs between outcomes experienced and the ranking of this benefit A larger number of average performing organizations find agility flexibility and adaptability to be more beneficial than best performers The other significant variation occurs where reductions to operating expenses are rated less beneficial among worst and best performing organizations and more beneficial by a majority of average performing firms
Smaller organizations less likely to be using Smartphones and Tablet computers are more likely to be among those experiencing the least benefits In comparison midsize organizations whose rate of use of mobile devices is lower than large organizations claim far higher benefits than larger competitors with far more use and experience Interestingly one of the benefits claimed by midsize organizations is out of proportion to the experience of others increases in agility flexibility and adaptability
Managing the Benefits and Risks of Mobile Computing
9
Although improved access to information is listed as a primary benefit in most cases information is only available after applications provide access to underlying information For this reason the research delves into the relationship between applications being used with Smartphones and Tablet computers
Applications Driving the Use of Mobile Devices The applications currently driving the use of Smartphones and Tablet computers include Email and mobile collaboration office productivity and sales force automation applications (Table 2)
Table 2 Applications driving the use of mobile devices
Most important applications
Email and mobile collaboration applications
Office productivity applications
Sales force automation applications
Source IT Policy Compliance Group 2011
Other applications cited as benefits but not by majorities of the best performers include voice and text communications financial applications customer sales and service as well as video- and audio- conferencing communications The least likely applications being used with Mobile devices include those for social media interactions and business continuity and disaster recovery (Figure 5)
Figure 5 Applications driving the use of mobile devices
The applications driving the use of
mobile devices email collaboration office
productivity and sales force automation
Source IT Policy Compliance Group 2011
Lopsided result occurs for voice and text communication applications the best and worst performing organizations value voice and text communications more highly while fewer average performers value these as highly
In addition more average performing organizations rate the use of social media applications more highly than do worst and best performing organizations
With the exception of voice and text communications smaller organizations are less likely to be using Smartphones and Tablet computers for a wider variety of applications to access information Given the more common use of mobile devices among those with better outcomes one expects to see more value being ascribed to more applications providing access to more critical business information among large and best performing organizations
Managing the Benefits and Risks of Mobile Computing
10
Although the benefits of Smartphones and Tablet computers are helping best performers mdash and proportionately more large organizations mdash to post higher revenue and profit levels due to immediate access to information and sharing of information with others these benefits come with business risks most notably the loss or theft of sensitive information unauthorized access to sensitive business information and a loss of control or a loss of governance
Business Risks of Smartphones and Tablet Computers The primary business risks related to the use of Smartphones and Tablet computers include the loss or theft of sensitive information and unauthorized access to sensitive business information or applications and a loss of control over data applications risks and audits (Table 3)
Table 3 Business risks of smartphones and tablet computers
Largest business risks
Loss or theft of sensitive information
Unauthorized access to sensitive information or applications
Loss of governance ndash or control ndash over data applications risks and audits
Source IT Policy Compliance Group 2011
The other major business risk cited by a majority of those experiencing the best outcomes includes the loss or theft of the devices themselves and the unintentional disclosure of sensitive information that occurs through these devices (Figure 6)
Figure 6 Business risks of smartphones and tablet computers
The business risks loss or theft of
sensitive information unauthorized access loss of control over
data applications risks and audits
Source IT Policy Compliance Group 2011
The lowest business risks are found to be customer defections due to misuse or failure of the devices followed by geo-tracking of employees or customers Although the numbers rank geo-tracking of employees as a low business risk one-on-one interviews conducted with several senior managers reveal geo-tracking to be a growing risk especially for high-ranking executives and in cases where teams of people from an organization are converging in one geographic area
Lopsided results for loss of devices and fraud are considered lower risks among average performing organizations but more risk among the best and worst performing organizations Interviews revealed that most organizations consider Smartphones to be disposable as long as the information on these devices is protected from use or reuse
Managing the Benefits and Risks of Mobile Computing
11
Larger organizations tend to focus more on the impacts the devices have on customer loyalty repeat business revenue and profitability These are larger concerns in banking retail and transportation industries where entirely new mobile device Apps is being used by customers of firms in these industries
In addition to the business risks the research findings reveal very significant differences in policies and practices being implemented by organizations covering a range of activities including who owns mobile devices whether employees are encouraged or allowed to use their own devices and whether IT manages Smartphones and Tablet computers
Policies and Practices Governing Mobile Device Use in the Workplace The dominant polices and practices governing the use of mobile devices differ considerably with those experiencing best and average outcomes exhibiting more similar policies and practices Among the best and average performers IT is in charge of managing all devices employee owned or not (Table 4)
Table 4 Polices and practices
Outcomes Smartphones Tablet computers
Worst Use of mobile devices is unknown Employees use their own devices
Average IT manages employee-owned devices IT manages company-issued devices
Best IT manages employee-owned devices IT manages company-issued devices
Source IT Policy Compliance Group 2011
Among the worst performers the dominant culture is one where the use of mobile devices is largely unknown unregistered or unreported and employees are allowed to use their own devices
Among average and best performers the dominant policies and practices are very different IT manages the devices while employees are allowed to use their own Smartphones employees must use company-supplied Tablet computers (Figure 7)
Figure 7 Polices and practices
Source IT Policy Compliance Group 2011
Where IT is involved in managing Smartphones and Tablet computers better and best outcomes are more predominant whereas when IT is not managing mobile devices the predominant outcomes are worse and worst
Of the almost 4-in-10 organizations where employees use Tablet computers to access information and applications at work about one-third (33 percent) furnish and provision Tablet computers for employees slightly less than 40 percent allow employees to bring and use their own Smartphones to work and another 30 percent simply do not know how many Tablet computers are being used by employees
Worse results occur among organizations that do not know how many Smartphones are being used In addition several operational challenges are found to be directly related to more mdash or less mdash business risk related to the use of these Mobile devices
Managing the Benefits and Risks of Mobile Computing
12
Operational Challenges Contributing to Business Risks The primary operational challenges contributing to increased business risk from the use of Smartphones and Tablet computers include a) malicious software that can shut down or take-over mobiles devices b) ineffective vulnerability configuration and penetration testing for mobile devices c) an inability to detect or prevent rogue applications from operating on mobile devices and d) an inability to wipe-clean or lock stolen devices (Table 5)
Table 5 Operational challenges
Outcomes Primary operational challenges
Worst Inability to wipe or lock stolen devices
Average Malicious software
Vulnerability configuration penetration testing
Rogue applications
Best Malicious software
Vulnerability configuration penetration testing
Rogue applications
Inability to wipe or lock stolen devices
Source IT Policy Compliance Group 2011
Malicious software is ranked by 8-in-10 organizations as the factor most contributing to business risk After this ineffective practices for managing vulnerabilities configurations and penetration tests and an inability to detect or prevent rogue applications are rated most highly as contributing to increased business risk from the use of mobile devices (Figure 8)
Figure 8 Operational challenges
Operational challenges malicious software vulnerability
scanning configuration testing pen-testing
rogue software wipe or lock stolenlost
devices patching and remediation
Source IT Policy Compliance Group 2011
Detecting mobile devices and wiping data or locking stolen devices are ranked very highly by worst and best performing organizations and ranked much less highly as an operational challenge resulting in elevated business risks among average performing organizations
The lopsided difference is especially evident for the inability to wipe sensitive information or lock lost or stolen devices this is a challenge for 25 percent of the worst of the average performers whereas it a challenge leading to increased business risk by 50 percent of the best performers and nearly 60 percent of the worst performers
Managing the Benefits and Risks of Mobile Computing
13
In addition to operational challenges contributing to elevated business risks the benchmarks also identify legal and regulatory challenges that are contributing to increased business risk Often called a binary problem mdash you adhere to and report on a specific regulation or not mdash the findings reveal the challenges are larger than concerns about failing to comply with a single regulatory mandate or legal ruling
Legal and Regulatory Challenges Contributing to Business Risks The legal and regulatory challenges contributing to business risks from the use of Smartphones and Tablet computers include a) an inability to conduct information security audits and b) exposure to civil or criminal action due to inadequate due-care findings (Table 6)
Table 6 Legal and regulatory challenges
Outcomes Primary operational challenges
Worst Inability to comply with cross-border data privacy mandates
Average Inability to conduct information security audits
Exposure to civilcriminal actions due to inadequate due-care
Best Inability to conduct information security audits
Exposure to civilcriminal actions due to inadequate due-care
Inability to comply with cross-border data privacy mandates
Loss of ownership of data due to differences in jurisdictions
Source IT Policy Compliance Group 2011
After these two the primary challenges include an inability to comply with cross-border data privacy regulations or law loss of ownership of data due to differences in legal jurisdictions and an inability to deliver forensics information for investigations (Figure 9)
Figure 9 Legal and regulatory challenges
Legal and regulatory challenges information
security audits inadequate due-care
cross-border data privacy loss of
ownership over data
Source IT Policy Compliance Group 2011
Complying with cross-border data privacy regulations are challenges for worst and best performers but less of a challenge among average performing companies
Managing the Benefits and Risks of Mobile Computing
14
Organizations do not willingly engage in behavior whose risks are large enough to outweigh benefits Not as stark as a ldquoflight or fightrdquo reaction the primary action being taken to manage the risks of using Smartphones and Tablet computers reveal much about the outcomes organizations are experiencing
Action Taken to Manage the Risks The primary action taken to manage the risks of using mobile devices is to simply limit the number of employees who can use the devices mdash Smartphones and Tablet computers mdash to access applications and information in the workplace This action is shared by those with the best and average outcomes about 8-in-10 organizations However the primary action being taken by the worst performers is to ignore or discount the risk posed to the business from the use of these mobile devices (Table 7)
Table 7 Actions taken to manage the risks
Outcome Primary action taken to manage the risks
Worst Ignore or discount business risks associated with use of mobile devices
Average Limit the use of mobile devices to specific employees
Best Limit the use of mobile devices to specific employees
Source IT Policy Compliance Group 2011
In contrast the worst performers are not purposely limiting the use of mobile devices to specific employees rather these firms are ignoring or discounting the business risks or are trying to cover the business risks with existing or new insurance contracts
Fewer average better or best performing organizations are limiting the use of these devices and are ignoring or discounting the business risks involved (Figure 10)
Figure 10 Actions taken to manage the risks
Action taken to manage the risks limit number of employees that are allowed to use Smartphones or Tablet
computers in the workplace
Source IT Policy Compliance Group 2011
Limiting the use of mobile devices is a double-edged sword because the benefits tangible benefits include increases in revenue and profitability Although not tracked in these studies research from complementary longitudinal and non-longitudinal studies indicate that customer satisfaction and retention rates are also higher among the best performers The core issue for most organizations is the tradeoff between benefits and risks The obvious issue for most organizations is finding an optimal balance or tradeoff between risks and benefits
Managing the Benefits and Risks of Mobile Computing
15
Limiting the Number of Employees Who Use Mobile Devices Despite the benefits of using mobile devices the business risks are purposely keeping low the number of employees using these mobile devices in the workplace The number of employees using Smartphones to access information and applications is a rather low 3-in-10 people (33 percent) despite the high 8-in-10 (79 percent) number of organizations using these devices Similarly the average number of employees using Tablet computers to access information and applications is just 1-in-5 people (22 percent) among the 35 percent of organizations using these devices (Figure 11)
Figure 11 Use of mobile devices by employees
It is the use of Smartphones by
employees that are being artificially
restricted because of the business risks
Source IT Policy Compliance Group 2011
The use of mobile Smartphones is being artificially limited by organizations due to the risks involved Whether it is the simple visual depiction contained in Figure 11 or the ratio of employees to organizations using the devices or the range of employees using the devices it is clear that it is the use of Smartphones by employees to access information and applications that are being artificially restricted (Table 8)
Table 8 Use of mobile devices by employees
Employee use for 65 of
organizations
Employee use for 95 of
organizations
Ratio of employee use to organization use
Smartphones 31 to 36 29 to 38 42
Tablet computers 18 to 27 14 to 31 63
Source IT Policy Compliance Group 2011
Thus the calculus of determining who uses and who does not use Smartphones to access information and applications at an organization is as much a determination of business need and value as much as it is an evaluation of business risk
As part of the research the Group delved into additional practices organizations implement to see if there are other factors responsible for better mdash or worse mdash outcomes associated with the use of Mobile devices
Managing the Benefits and Risks of Mobile Computing
16
Practices that Determine Outcomes The primary practices being implemented to manage business risks for the employees who are using Smartphones and Tablet computers include limiting access to sensitive information or applications geo-tracking and locating lost or stolen devices protecting and backing-up information from mobile devices wiping sensitive information from stolen or lost mobile devices preventingrecording unauthorized logins from mobile devices delivering security-awareness training to employees who use mobile devices and prohibiting access to Apps-markets Apps-sites and custom ROMs on mobile devices (Table 9)
Table 9 Practices implemented to manage the risks
Priority Practices determining outcomes
1 Limit access to sensitive information and applications
2 Geo-track devices to aid in recovery or destruction of information
3 Protect and backup information from devices
4 Wipe stolen or lost devices of information and credentials
5 Prevent and record unauthorized logon attempts
6 Deliver and measure policy and security awareness training for users
7 Prohibit custom ROMs for rooted devices and access to App-markets
Source IT Policy Compliance Group 2011
As the research uncovered the range of practices implemented to manage business risks are directly related to outcomes Far more of the best performing organizations have more employees using these devices are spending more on information security and are more likely to be implementing most of these practices The reverse was also found to be true the worst performers are simply not implementing the practices or are implementing a few rather than all (Figure 12)
Figure 12 Practices implemented to manage the risks
Practices that determine outcomes
limit access geo-track devices protect and backup data wipe
devices that are lost or stolen prevent
unauthorized logons deliver training no
ROMs or App-markets
Source IT Policy Compliance Group 2011
Managing the Benefits and Risks of Mobile Computing
17
Controls Used to Manage Risks Controls are used in business to assist with the execution of business strategy to manage business outcomes and to manage risk In the case of managing risks related to the use of mobile devices to access information and applications the controls employed by the best performers include using antivirus andor anti-malware scans of the devices encrypting sensitive information on the devices preventing unauthorized people and devices from accessing sensitive information and applications patching mobile device systems-level software where possible and testing configurations of the devices (Table 10)
Table 10 Controls used to manage risks
Priority Controls used to manage the risks
1 Use anti-virus and anti-malware
2 Protect sensitive information on devices with encryption
3 Prevent unauthorized devices and people from accessing informationapplications
4 Patch systems software on devices where possible
5 Test configurations and settings on devices
Source IT Policy Compliance Group 2011
Of the controls tested by the research the one implemented by a clear majority of the best performers is the use of anti-virus andor anti-malware scans The least commonly implemented control among these best performers is the use of virtual private networking (VPN) although interviews revealed many respondents were using some form of VPN with Smartphones in the workplace
In contrast several controls are either not implemented or are less likely implemented by the worst performers These include the scanning of ROMs on mobile devices scanning of vulnerabilities on mobile devices conducting penetration tests on mobile devices patching systems-level software where possible and using virtual private networking (Figure 13)
Figure 13 Controls used to manage risks
Controls to use anti-virusanti-malware encryption checks and limits on unauthorized
devicespeople patches and
configuration testing
Source IT Policy Compliance Group 2011
Managing the Benefits and Risks of Mobile Computing
18
Interestingly the biggest complaint the Group found in the interviews was due to ldquothe lack of patches to update the Android operating systemrdquo For this reason alone we found that many organizations had developed a ldquono Androidrdquo policy or told its users that Android phones could no longer be used Another practice found to significantly impact outcomes is how frequently organizations conduct assessments
Consistency of Assessments and Reporting The rate at which controls to manage risks are monitored assessed and reported on is directly related to outcomes For example the findings reveal significant differences from annual to monthly rates with those conducting less frequent assessments being among the majority of the worst performers and those with the most frequent assessments being among the best performers (Table 11)
Table 11 Rate of assessment and reporting
Outcome Average rate of assessment and reporting
Worst Once every twelve months
Average Once every four-to-five months
Best Once every month or less
Source IT Policy Compliance Group 2011
Mirroring findings in related research the rate at which controls are monitored assessed and compared against a range of conditions including policies prioritized risks threats gold-standards regulatory requirements and internal configuration baselines among others defines
1) When organizations find gaps in controls and procedures
2) Whether risks are larger than expected
3) Whether organizations are able to take appropriate action
4) Whether organizations are able to reduce business risks
When looked at from the perspective of size the research reveals many organizations may not have the tools to automate such assessments or are simply choosing to conduct annual audit review assessments rather than ongoing business risk assessments (Figure 14)
Figure 14 Rate of assessment and reporting
The best performers consistently assess
and report on controls and risks more
frequently
Source IT Policy Compliance Group 2011
Managing the Benefits and Risks of Mobile Computing
19
In addition to the rate of assessment and reporting another defining practice responsible for outcomes is found to be spending on information security by organizations
Spend on Information Security and Outcomes Worst performers are spending 60 percent less than average while the best performers are spending 60 percent more than average performers (Table 12)
Table 12 Spend on information security
Outcome Relative spend on information security compared with average performers
Worst 04
Average 10
Best 16
Source IT Policy Compliance Group 2011
In addition to the relative difference in spend on information security there are large differences in the percentage of the IT budget spent on information security While the range of spend among the worst is from zero to slightly more than 5 of the IT budget the average spent by the worst is less than three percent In contrast average performers spend 75 percent and best performers are spending 12 percent on average (Figure 15)
Figure 15 Spend on information security
The best performers spend a larger
percentage of a larger IT budget on
information security
Source IT Policy Compliance Group 2011
The amount spent is more revealing when considering the actual IT budgets IT budgets among worst performers is just 30 percent of what average performers spend on IT while the amount spent on IT by the best performers is more than 30 percent higher than the average performers
Thus smaller percentages of much smaller annual IT budgets are characteristic of spending on information security by the worst performers while larger percentages of much larger annual IT budgets are characteristic of spending on information security by the best performers
Spending on information security among some of the worst performers actually bottomed-out during the latter half of 2011 When combined with no controls on mobile devices and a culture that is ignoring or discounting the business risks related to the use of Mobile devices it is possible that 2012 could be a year with some negative brand-wrecking events for some of these organizations The best performers will be happy to have positioned themselves differently
Managing the Benefits and Risks of Mobile Computing
20
Back to the Future Is the adoption of Mobile computing a repeat of what occurred in the 1980s Back then it was connecting PCs via local networks to provide office workers with access to information that could be analyzed and acted on in local work groups Today it is about wirelessly interconnecting Mobile devices enabling anyone to share and act on information from any location If today is any indication of what happened in the 1980s then the use of these new powerful pocket-sized but supercharged Mobile devices is likely to change to shape of computing as we know it today
The use of Smartphones by 8-in-10 organizations could likely grow And the use of these devices by employees artificially restricted to 33 percent for now will likely grow as management systems and security controls become more standardized
But we are in a high-growth expansionary phase where Phone manufacturers and carriers are incented to cannibalize products they shipped just last year or as recently as last month leaving consumers employees and organizations with devices that are out of date and may never be updated with systems-level software that would otherwise cure security vulnerabilities
Unfortunately there is no standard Android phone unless you purchase a Google Nexus phone which will be updated by Google directly But the majority of Android phones purchased by consumers and employees are not stock Google Android phones Instead the vast majority of Android phones are overlaid by supplier goo-gads carrier changes along with unexpected and unwanted mdash Carrier IQ mdash additions The carriers and phone manufacturers are incented by the sale of new hardware bling and new service contracts
Encouraged by Google and the profit margins from the latest hardware bling and service contracts the carriers and phone manufacturers continue to develop their own versions of Android What the carriers and phone manufacturers are not incented to do is to deploy software updates to the Android operating system to their customers and so they donrsquot Instead they find it less expensive to lure their customers into an upgrade to a new device on contract two years later
There are more stable and routinely updated
operating systems shipping with
Smartphones from Applersquos iOS RIMrsquos
Blackberry and Windows phone
Eventually these problems and others may resolve themselves but it could be another few years mdash or more mdash of frustration before anything resembling stability in the Android operating system is common and enterprise-ready management tools and security controls are available for these new wonders of the information age
In the meantime there are much more stable mdash and routinely updated mdash operating systems shipping with Smartphones from Applersquos iOS RIMrsquos Blackberry and Windows phone None of these suffer the same problems afflicting Android phones
Whatever you do remember the lessons about what worked mdash and what didnrsquot mdash with earlier generational-changes such as the advent of PCs or the dawn of Internet-computing This longer-term perspective and the lessons will come in handy in formulating strategy and tactics as the use of Mobile computing expands in your workplace
Summary Observations Based on the outcomes being achieved by the best performing organizations
The business benefits of using Smartphones and Tablet computers include
Improved access to business information from any location
Improved customer retention and satisfaction levels and
Higher levels of revenue and profitability when compared with peers
The business risks of using mobile computing devices include
Loss or theft of sensitive information
Unauthorized access to information and applications
Loss of governance or control over sensitive business information business applications business risks and audits
Managing the Benefits and Risks of Mobile Computing
21
The primary information and applications currently being used with mobile devices include
Email and collaborative applications
Office productivity applications
Sales force automation applications
The primary actions to take to limit business risks include
Limit the use of Smartphones in the workplace to specifically approved employees
Fewer than 50 percent of employees currently use Smartphonersquos among the best performers
Policies and practices to implement include
Have IT manage all Tablet computers and Smartphones
Allow approved employees to use their own Smartphones
Furnish Tablet computers to employees
Considerations to evaluate include
Mobile devices are another part of the requirements of your information security audits
Compare your due-care requirements to defend against legal inquiry
Identify your cross-border data privacy and ownership requirements
Practices to implement include
Limit the use of Smartphones to access information and applications to approved employees
Limit access to sensitive information and applications for mobile devices
Geo-track devices especially Smartphones
Prohibit the use of custom ROMs and unapproved App-marketssites
Deliver security awareness training and measure effectiveness with employees
Scan mobile devices with anti-virus and anti-malware
Protect and backup information on the devices
Wipe and lock stolen and lost devices as soon as notified by employees
Investigate the availability of patching as part of device evaluations
Use frequent controls and configuration testing to reduce gaps and limit risks
Increase spend on information security beyond your peers
Managing the Benefits and Risks of Mobile Computing
22
Appendix Expected Changes in Device Use in the Workplace 2011 to 2013 Respondents were asked to identify changes that are most likely going to occur in organizational and employee uses of Smartphones and Tablet computers between 2011 and 2013 As projections these forecasts of user and organizational expectations are reflections of current sentiment
The use of Smartphones by organizations is expected to remain the same between 2011 and 2013 at 79 percent of all organizations However the use of Smartphones to access information and applications by employees is expected to increase from 33 percent to 39 percent (Table 13)
Table 13 Device use 2011 to 2013
Device being used Use by organizationsemployees
2011 2013 Change in use
Organizational use 79 79 -0- Smartphones
Employee use 33 39 6 increase
Organizational use 35 49 14 increase Tablet computers
Employee use 22 32 10 increase
Source IT Policy Compliance Group 2011
Unlike Smartphones the use of Tablet computers is expected to increase for organizations and employees from an average rate of 35 percent to 49 percent for organizations and from 22 to 32 for employees The increases are larger than the sample error of seven percent
After an increase in employees using both devices what is rather intriguing is an expected downtrend in the use of Smartphones among organizations with the best outcomes The decline in the use of Smartphones among best performers is expected to be from 85 percent to 73 percent mdash a decrease of 12 percent mdash from 2011 to 2013 (Figure 16)
Figure 16 Expected changes in device use
Source IT Policy Compliance Group 2011
The explanation for the overall rate of decline of Smartphone use among best performing organization can be found from declines in the uses of iPhone and Windows Phone platforms and much more significant declines in the use of Android and Blackberry phones
At the time the research was being carried out RIM was suffering from blackouts in its services around the World with rolling service-outages that occurred across multiple continents during a one-week period The general consensus of many people we spoke with at the time was the service-outages ldquoare the final event I need to make the switch when my subscription period is duerdquo On the other hand others simply replaced their Blackberry devices that week and did not wait until their subscription was due for renewal
Unlike the RIM Blackberry platforms we found consistently strong disaffection with Android devices due to the inability to obtain updates for the Android operating system without having to root devices and hope for the best using custom ROMs
Managing the Benefits and Risks of Mobile Computing
23
These problems left many saying things like ldquoI bought a pig in a poke never againrdquo Others took matters into their own hands rooted their phones and installed updated versions of Android over the Internet from a number of different development sites none of which were blessed by carriers phone manufacturers or their IT staff
IT managers the Group spoke with identified an utter lack of management tools for Android devices too many versions of Android and a complete lack of vulnerability testing for the devices The inability to update and cure security-problems were just some of the problems identified by IT managers the Group spoke with The upshot for many were two common reactions to the use of Android in the enterprise 1) if it was already deployed the common reaction was to pull back support for Android and convert to other supported Smartphones and 2) if Android was not already deployed wait for Android to become enterprise-ready (Table 14)
Table 14 Reaction to Android phones in the workplace
Status of Android Smartphones
Reaction
Already deployed Pull-back and convert to other Smartphones
If not already deployed Wait for Android to become enterprise-ready
Source IT Policy Compliance Group 2011
When it comes to Tablet computers the sentiment about expected changes in use of different platforms reveals Android Tablet computers likely to see the biggest gains between now and 2013 followed by healthy gains in the use of other Tablet computers The only sentiment indicating significant declines appear to be related to Android and Blackberry Smartphones (Figure 17)
Figure 17 Expected changes in platform use
Source IT Policy Compliance Group 2011
The outlook of current sentiment regarding use of different platforms by 2013 clearly indicates the best performers are predisposed to ditch Android and Blackberry phones and significantly increase the use of iPad Tablet computers
By contrast the worst performers are predisposed to increase use of Smartphones and Tablet computers across the board and with the exception of Blackberry phones increase other mobile device platforms among average performers
Managing the Benefits and Risks of Mobile Computing
24
Additional Resources Numerous sources of related information are available for those interested in pursuing more information on a wide range of topics related to Smartphones and Tablet computers The following are but a small sample of related information perspectives and insight The authors of these articles have no relationship with the ITPCG Android Security See httpdeveloperandroidcomguidetopicssecuritysecurityhtml Android Orphans Visualizing a Sad History of Support See httptheunderstatementcompost11982112928android-orphans-visualizing-a-sad-history-of-support A Look into Mobile Device Security httpwwwsymanteccomcontentenusaboutmediapdfssymc_mobile_device_security_june2011pdfom_ext_cid=biz_socmed_twitter_facebook_marketwire_linkedin_2011Jun_worldwide_mobilesecuritywp Carrier IQ what it is what it isnrsquot and what you need to do httpwwwengadgetcom20111201carrier-iq-what-it-is-what-it-isnt-and-what-you-need-to CIS Apple iOS configuration benchmarks httpbenchmarkscisecurityorgen-usroute=downloadsbrowsecategorybenchmarksmobileiphone Current Android Malware httpforensicsspreitzenbarthdepage_id=254 DISA STIGs for Smartphones - unclassified httpiasedisamilstigsnet_perimeterwirelesssmartphonehtml iOS Hardening Configuration Guide Department of Defence Intelligence and Security Australian Government httpwwwdsdgovaupublicationsiOS_Hardening_Guidepdf Mac OS X and iOS Security httpdeveloperapplecomlibrarymacdocumentationSecurityConceptualSecurity_OverviewArchitectureArchitecturehtmlapple_refdocuidTP30000976-CH202-TPXREF101 Mobile Malware Why Fraudsters are Two Steps Ahead httpwwwtrusteercomblogmobile-malware-why-fraudsters-are-two-steps-ahead Rootkit called Carrier IQ discovered phoning home with user data httpwwwzdnetcomblogapplerootkit-called-carrier-iq-discovered-phoning-home-with-user-data11792 RIM launches Blackberry Fusion to Secure Android and Apple devices httpbusinessfinancialpostcom20111129rim-launching-blackberry-mobile-fusion-to-secure-iphone-android-devices Smartphone Security httpwwwenisaeuropaeuactapplication-securitysmartphone-security-1 The Spy Files Map httpwikileaksorgThe-Spyfiles-The-Maphtml Ten Steps to Secure Your Mobile Devices httpswikiinternet2educonfluencedisplayitsg2Mobile+Device+Security
Why Your Phone is Insecure by Design httpwwwforbescomsitesandygreenberg20110812codebreaker-karsten-nohl-why-your-phone-is-insecure-by-design
Managing the Benefits and Risks of Mobile Computing
25
About the Research Topics researched by the IT Policy Compliance Group (IT PCG) are part of an ongoing calendar established in consultation with Advisory General and Charter members of the Group as well as from findings compiled from ongoing research In addition to specific tracking questions common to each benchmark the research is designed to uncover the relationship between business results outcomes being experienced by organizations actions taken practices implemented and capabilities organizations use to respond
The qualitative research findings presented in this report are from numerous focus groups one-on-one interviews and meetings held with larger audiences throughout 2011 The quantitative findings contained in this report are from primary research studies conducted with 210 organizations in North America during late 2011
The maximum error for the sample findings for the benchmark findings contained in this report is +- seven percent The primary focus of analysis contained in this report is to present the largest differences between the outcomes experienced and similarly aligned findings that are most responsible for the differences in outcomes Instead of relying on differences that are within or close to the sample errors the effort has been to focus on the largest differences For example instead of focusing on differences involving +- 10 percent the findings covered in this report tend to focus on the largest differences in the range of 50 percent or more
The findings covering the use of Mobile computing are representative of organizations in North America and cannot be construed or inferred to represent current usage or plans for Mobile computing outside of North America However the findings covering the performance outcomes benefits and risks of Mobile computing the practices to manage the business risks and the controls to manage the risks match findings from similar studies covering other geographies outside of North America including findings from Latin America South America Europe Africa the Middle East Asia and Oceania
Industries represented The quantitative research includes representation from the following industries advertising accounting services aerospace agriculture apparel architecture automotive banking chemicals computer equipment and peripherals computer software and services construction consumer durable goods distribution education engineering services entertainment financial services food and beverage government (local state and federal level public administration) government (defense and intelligence) health medical and dental services insurance law enforcement management services media scientific and consulting services manufacturing pharmaceuticals public relations publishing real estate rental and leasing services retail trade telecommunications equipment telecommunication services transportation warehousing travel accommodation and hospitality services utilities waste management and wholesale trade Five industries represent 47 percent of the sample These include Banking Education Financial and Accounting Services Manufacturing and Retail Trade Another 27 industries represent the other 53 percent of the sample none of which represents more than five percent of the sample
Revenue or agency budgets of participating organizations Size of the organizations participating in the most recent benchmarks is somewhat evenly distributed although slightly fewer represent midsize organizations Thirty-six percent of the organizations represented by the findings have annual revenues or agency budgets that are less than $50 million Another twenty-nine percent of the sample has annual revenues or agency budgets between $50 million and $999 million The remaining thirty-five percent of the sample has annual revenues or agency budgets that are $1 billion or more
Functional areas of responsibility Thirty-five percent of the qualified participants for the benchmark work in IT with another 30 percent work in finance or internal controls The remaining 35 percent of the qualified participants work in a wide variety of functions from business line management senior management product design and development legal compliance sales marketing procurement logistics and customer services among other functions
Job titles of participants Thirty-five percent of the participants in the benchmark are senior managers with titles that include CEO CIO CFO or Vice president Thirty-eight percent are managers or directors and twenty-seven percent are staff in their organizations
Managing the Benefits and Risks of Mobile Computing
About IT Policy Compliance Group The mission of the IT Policy Compliance Group is to promote actionable findings based on evidence to assist organizations with delivering more value less risk and achieve IT policy and compliance objectives related to the use of information systems The Group Web site at wwwitpolicycompliancecom features quick two-minute self-assessments to compare outcomes and practices against onersquos industry peers and best performing organizations research reports continuing professional education conferences and seminars member and knowledge centers related research from around the World and resources including standards and frameworks associations government and regulators
The Grouprsquos research is designed to help IT risk legal financial and internal audit professionals to
Benchmark results and efforts against peers and best-in-class performers
Identify key drivers challenges and responses to improve results
Determine the applicability and use of specific capabilities to improve results
Identify best practices based on results and experience of peers
The Group relies upon its members and advisors for its research and editorial calendar
IT Policy Compliance Group Charter Members
The Institute of Symantec Corporation Internal Auditors ISACA 350 Ellis Street 247 Maitland Avenue 3701 Algonquin Road Suite 1010 Mountain View CA 94043 Altamonte Springs FL 32701 Rolling Meadows IL 60008 +1 (650) 527 8000 +1 (407) 937 1100 +1 (847) 253 1545 wwwsymanteccom wwwtheiiaorg wwwisacaorg infosymanteccom iiatheiiaorg infoisacaorg
Computer Security Institute Protiviti IT Governance Institute 600 Harrison Street New York Office 3701 Algonquin Road Suite 1010 San Francisco CA 94107 1290 Avenue of the Rolling Meadows IL 60008 +1 (415) 947 6320 Americas 5th Floor +1 (847) 660 5600 wwwgocsicom New York New York 10104 wwwitgiorg csicmpcom +1 (212) 603 8300 infoitgiorg wwwprotiviticom infoprotiviticom
IT Policy Compliance Group Affiliate Members and Advisors A current list of Affiliate Members and Advisors to the Group can be found on the IT Policy Compliance Group website
26
Founded in 2005 the IT Policy Compliance Group conducts benchmark research focused on delivering fact-based guidance on the steps that can be taken to improve results Benchmark results are reported through wwwitpolicycompliancecom for the benefit of members
IT Policy Compliance Group
Contacts Managing Director Jim Hurley Telephone +1 (216) 373 7010 jhurleyitpolicycompliancecom Managing Editor John Ortbal Telephone +1 (847) 444 0344 jortbalitpolicycompliancecom wwwitpolicycompliancecom
December 2011
The information contained in this publication has been obtained from sources that the IT Policy Compliance Group believes to be reliable but is not guaranteed Research publications reflect current conditions that are subject to change without notice
Copyright copy 2011 IT Policy Compliance Group Names and logos may be trademarks of their respective owners All rights reserved 1211 293167003
32
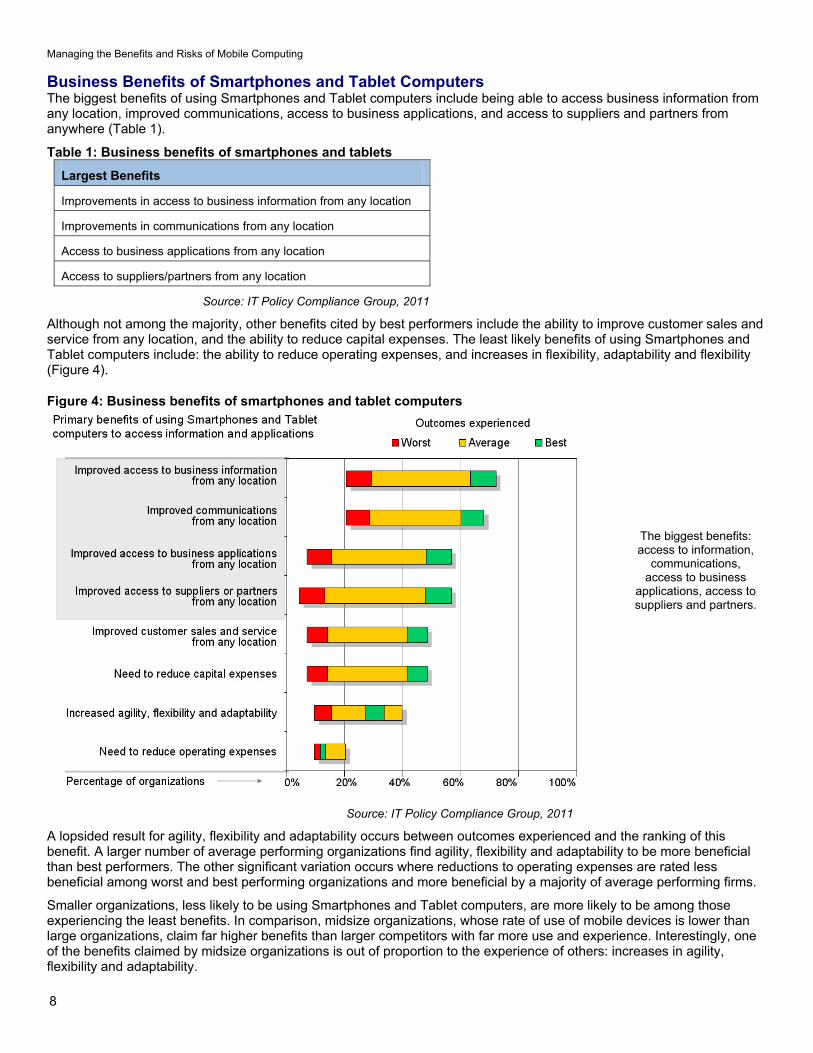
Managing the Benefits and Risks of Mobile Computing
8
Business Benefits of Smartphones and Tablet Computers The biggest benefits of using Smartphones and Tablet computers include being able to access business information from any location improved communications access to business applications and access to suppliers and partners from anywhere (Table 1)
Table 1 Business benefits of smartphones and tablets
Largest Benefits
Improvements in access to business information from any location
Improvements in communications from any location
Access to business applications from any location
Access to supplierspartners from any location
Source IT Policy Compliance Group 2011
Although not among the majority other benefits cited by best performers include the ability to improve customer sales and service from any location and the ability to reduce capital expenses The least likely benefits of using Smartphones and Tablet computers include the ability to reduce operating expenses and increases in flexibility adaptability and flexibility (Figure 4)
Figure 4 Business benefits of smartphones and tablet computers
The biggest benefits access to information
communications access to business
applications access to suppliers and partners
Source IT Policy Compliance Group 2011
A lopsided result for agility flexibility and adaptability occurs between outcomes experienced and the ranking of this benefit A larger number of average performing organizations find agility flexibility and adaptability to be more beneficial than best performers The other significant variation occurs where reductions to operating expenses are rated less beneficial among worst and best performing organizations and more beneficial by a majority of average performing firms
Smaller organizations less likely to be using Smartphones and Tablet computers are more likely to be among those experiencing the least benefits In comparison midsize organizations whose rate of use of mobile devices is lower than large organizations claim far higher benefits than larger competitors with far more use and experience Interestingly one of the benefits claimed by midsize organizations is out of proportion to the experience of others increases in agility flexibility and adaptability
Managing the Benefits and Risks of Mobile Computing
9
Although improved access to information is listed as a primary benefit in most cases information is only available after applications provide access to underlying information For this reason the research delves into the relationship between applications being used with Smartphones and Tablet computers
Applications Driving the Use of Mobile Devices The applications currently driving the use of Smartphones and Tablet computers include Email and mobile collaboration office productivity and sales force automation applications (Table 2)
Table 2 Applications driving the use of mobile devices
Most important applications
Email and mobile collaboration applications
Office productivity applications
Sales force automation applications
Source IT Policy Compliance Group 2011
Other applications cited as benefits but not by majorities of the best performers include voice and text communications financial applications customer sales and service as well as video- and audio- conferencing communications The least likely applications being used with Mobile devices include those for social media interactions and business continuity and disaster recovery (Figure 5)
Figure 5 Applications driving the use of mobile devices
The applications driving the use of
mobile devices email collaboration office
productivity and sales force automation
Source IT Policy Compliance Group 2011
Lopsided result occurs for voice and text communication applications the best and worst performing organizations value voice and text communications more highly while fewer average performers value these as highly
In addition more average performing organizations rate the use of social media applications more highly than do worst and best performing organizations
With the exception of voice and text communications smaller organizations are less likely to be using Smartphones and Tablet computers for a wider variety of applications to access information Given the more common use of mobile devices among those with better outcomes one expects to see more value being ascribed to more applications providing access to more critical business information among large and best performing organizations
Managing the Benefits and Risks of Mobile Computing
10
Although the benefits of Smartphones and Tablet computers are helping best performers mdash and proportionately more large organizations mdash to post higher revenue and profit levels due to immediate access to information and sharing of information with others these benefits come with business risks most notably the loss or theft of sensitive information unauthorized access to sensitive business information and a loss of control or a loss of governance
Business Risks of Smartphones and Tablet Computers The primary business risks related to the use of Smartphones and Tablet computers include the loss or theft of sensitive information and unauthorized access to sensitive business information or applications and a loss of control over data applications risks and audits (Table 3)
Table 3 Business risks of smartphones and tablet computers
Largest business risks
Loss or theft of sensitive information
Unauthorized access to sensitive information or applications
Loss of governance ndash or control ndash over data applications risks and audits
Source IT Policy Compliance Group 2011
The other major business risk cited by a majority of those experiencing the best outcomes includes the loss or theft of the devices themselves and the unintentional disclosure of sensitive information that occurs through these devices (Figure 6)
Figure 6 Business risks of smartphones and tablet computers
The business risks loss or theft of
sensitive information unauthorized access loss of control over
data applications risks and audits
Source IT Policy Compliance Group 2011
The lowest business risks are found to be customer defections due to misuse or failure of the devices followed by geo-tracking of employees or customers Although the numbers rank geo-tracking of employees as a low business risk one-on-one interviews conducted with several senior managers reveal geo-tracking to be a growing risk especially for high-ranking executives and in cases where teams of people from an organization are converging in one geographic area
Lopsided results for loss of devices and fraud are considered lower risks among average performing organizations but more risk among the best and worst performing organizations Interviews revealed that most organizations consider Smartphones to be disposable as long as the information on these devices is protected from use or reuse
Managing the Benefits and Risks of Mobile Computing
11
Larger organizations tend to focus more on the impacts the devices have on customer loyalty repeat business revenue and profitability These are larger concerns in banking retail and transportation industries where entirely new mobile device Apps is being used by customers of firms in these industries
In addition to the business risks the research findings reveal very significant differences in policies and practices being implemented by organizations covering a range of activities including who owns mobile devices whether employees are encouraged or allowed to use their own devices and whether IT manages Smartphones and Tablet computers
Policies and Practices Governing Mobile Device Use in the Workplace The dominant polices and practices governing the use of mobile devices differ considerably with those experiencing best and average outcomes exhibiting more similar policies and practices Among the best and average performers IT is in charge of managing all devices employee owned or not (Table 4)
Table 4 Polices and practices
Outcomes Smartphones Tablet computers
Worst Use of mobile devices is unknown Employees use their own devices
Average IT manages employee-owned devices IT manages company-issued devices
Best IT manages employee-owned devices IT manages company-issued devices
Source IT Policy Compliance Group 2011
Among the worst performers the dominant culture is one where the use of mobile devices is largely unknown unregistered or unreported and employees are allowed to use their own devices
Among average and best performers the dominant policies and practices are very different IT manages the devices while employees are allowed to use their own Smartphones employees must use company-supplied Tablet computers (Figure 7)
Figure 7 Polices and practices
Source IT Policy Compliance Group 2011
Where IT is involved in managing Smartphones and Tablet computers better and best outcomes are more predominant whereas when IT is not managing mobile devices the predominant outcomes are worse and worst
Of the almost 4-in-10 organizations where employees use Tablet computers to access information and applications at work about one-third (33 percent) furnish and provision Tablet computers for employees slightly less than 40 percent allow employees to bring and use their own Smartphones to work and another 30 percent simply do not know how many Tablet computers are being used by employees
Worse results occur among organizations that do not know how many Smartphones are being used In addition several operational challenges are found to be directly related to more mdash or less mdash business risk related to the use of these Mobile devices
Managing the Benefits and Risks of Mobile Computing
12
Operational Challenges Contributing to Business Risks The primary operational challenges contributing to increased business risk from the use of Smartphones and Tablet computers include a) malicious software that can shut down or take-over mobiles devices b) ineffective vulnerability configuration and penetration testing for mobile devices c) an inability to detect or prevent rogue applications from operating on mobile devices and d) an inability to wipe-clean or lock stolen devices (Table 5)
Table 5 Operational challenges
Outcomes Primary operational challenges
Worst Inability to wipe or lock stolen devices
Average Malicious software
Vulnerability configuration penetration testing
Rogue applications
Best Malicious software
Vulnerability configuration penetration testing
Rogue applications
Inability to wipe or lock stolen devices
Source IT Policy Compliance Group 2011
Malicious software is ranked by 8-in-10 organizations as the factor most contributing to business risk After this ineffective practices for managing vulnerabilities configurations and penetration tests and an inability to detect or prevent rogue applications are rated most highly as contributing to increased business risk from the use of mobile devices (Figure 8)
Figure 8 Operational challenges
Operational challenges malicious software vulnerability
scanning configuration testing pen-testing
rogue software wipe or lock stolenlost
devices patching and remediation
Source IT Policy Compliance Group 2011
Detecting mobile devices and wiping data or locking stolen devices are ranked very highly by worst and best performing organizations and ranked much less highly as an operational challenge resulting in elevated business risks among average performing organizations
The lopsided difference is especially evident for the inability to wipe sensitive information or lock lost or stolen devices this is a challenge for 25 percent of the worst of the average performers whereas it a challenge leading to increased business risk by 50 percent of the best performers and nearly 60 percent of the worst performers
Managing the Benefits and Risks of Mobile Computing
13
In addition to operational challenges contributing to elevated business risks the benchmarks also identify legal and regulatory challenges that are contributing to increased business risk Often called a binary problem mdash you adhere to and report on a specific regulation or not mdash the findings reveal the challenges are larger than concerns about failing to comply with a single regulatory mandate or legal ruling
Legal and Regulatory Challenges Contributing to Business Risks The legal and regulatory challenges contributing to business risks from the use of Smartphones and Tablet computers include a) an inability to conduct information security audits and b) exposure to civil or criminal action due to inadequate due-care findings (Table 6)
Table 6 Legal and regulatory challenges
Outcomes Primary operational challenges
Worst Inability to comply with cross-border data privacy mandates
Average Inability to conduct information security audits
Exposure to civilcriminal actions due to inadequate due-care
Best Inability to conduct information security audits
Exposure to civilcriminal actions due to inadequate due-care
Inability to comply with cross-border data privacy mandates
Loss of ownership of data due to differences in jurisdictions
Source IT Policy Compliance Group 2011
After these two the primary challenges include an inability to comply with cross-border data privacy regulations or law loss of ownership of data due to differences in legal jurisdictions and an inability to deliver forensics information for investigations (Figure 9)
Figure 9 Legal and regulatory challenges
Legal and regulatory challenges information
security audits inadequate due-care
cross-border data privacy loss of
ownership over data
Source IT Policy Compliance Group 2011
Complying with cross-border data privacy regulations are challenges for worst and best performers but less of a challenge among average performing companies
Managing the Benefits and Risks of Mobile Computing
14
Organizations do not willingly engage in behavior whose risks are large enough to outweigh benefits Not as stark as a ldquoflight or fightrdquo reaction the primary action being taken to manage the risks of using Smartphones and Tablet computers reveal much about the outcomes organizations are experiencing
Action Taken to Manage the Risks The primary action taken to manage the risks of using mobile devices is to simply limit the number of employees who can use the devices mdash Smartphones and Tablet computers mdash to access applications and information in the workplace This action is shared by those with the best and average outcomes about 8-in-10 organizations However the primary action being taken by the worst performers is to ignore or discount the risk posed to the business from the use of these mobile devices (Table 7)
Table 7 Actions taken to manage the risks
Outcome Primary action taken to manage the risks
Worst Ignore or discount business risks associated with use of mobile devices
Average Limit the use of mobile devices to specific employees
Best Limit the use of mobile devices to specific employees
Source IT Policy Compliance Group 2011
In contrast the worst performers are not purposely limiting the use of mobile devices to specific employees rather these firms are ignoring or discounting the business risks or are trying to cover the business risks with existing or new insurance contracts
Fewer average better or best performing organizations are limiting the use of these devices and are ignoring or discounting the business risks involved (Figure 10)
Figure 10 Actions taken to manage the risks
Action taken to manage the risks limit number of employees that are allowed to use Smartphones or Tablet
computers in the workplace
Source IT Policy Compliance Group 2011
Limiting the use of mobile devices is a double-edged sword because the benefits tangible benefits include increases in revenue and profitability Although not tracked in these studies research from complementary longitudinal and non-longitudinal studies indicate that customer satisfaction and retention rates are also higher among the best performers The core issue for most organizations is the tradeoff between benefits and risks The obvious issue for most organizations is finding an optimal balance or tradeoff between risks and benefits
Managing the Benefits and Risks of Mobile Computing
15
Limiting the Number of Employees Who Use Mobile Devices Despite the benefits of using mobile devices the business risks are purposely keeping low the number of employees using these mobile devices in the workplace The number of employees using Smartphones to access information and applications is a rather low 3-in-10 people (33 percent) despite the high 8-in-10 (79 percent) number of organizations using these devices Similarly the average number of employees using Tablet computers to access information and applications is just 1-in-5 people (22 percent) among the 35 percent of organizations using these devices (Figure 11)
Figure 11 Use of mobile devices by employees
It is the use of Smartphones by
employees that are being artificially
restricted because of the business risks
Source IT Policy Compliance Group 2011
The use of mobile Smartphones is being artificially limited by organizations due to the risks involved Whether it is the simple visual depiction contained in Figure 11 or the ratio of employees to organizations using the devices or the range of employees using the devices it is clear that it is the use of Smartphones by employees to access information and applications that are being artificially restricted (Table 8)
Table 8 Use of mobile devices by employees
Employee use for 65 of
organizations
Employee use for 95 of
organizations
Ratio of employee use to organization use
Smartphones 31 to 36 29 to 38 42
Tablet computers 18 to 27 14 to 31 63
Source IT Policy Compliance Group 2011
Thus the calculus of determining who uses and who does not use Smartphones to access information and applications at an organization is as much a determination of business need and value as much as it is an evaluation of business risk
As part of the research the Group delved into additional practices organizations implement to see if there are other factors responsible for better mdash or worse mdash outcomes associated with the use of Mobile devices
Managing the Benefits and Risks of Mobile Computing
16
Practices that Determine Outcomes The primary practices being implemented to manage business risks for the employees who are using Smartphones and Tablet computers include limiting access to sensitive information or applications geo-tracking and locating lost or stolen devices protecting and backing-up information from mobile devices wiping sensitive information from stolen or lost mobile devices preventingrecording unauthorized logins from mobile devices delivering security-awareness training to employees who use mobile devices and prohibiting access to Apps-markets Apps-sites and custom ROMs on mobile devices (Table 9)
Table 9 Practices implemented to manage the risks
Priority Practices determining outcomes
1 Limit access to sensitive information and applications
2 Geo-track devices to aid in recovery or destruction of information
3 Protect and backup information from devices
4 Wipe stolen or lost devices of information and credentials
5 Prevent and record unauthorized logon attempts
6 Deliver and measure policy and security awareness training for users
7 Prohibit custom ROMs for rooted devices and access to App-markets
Source IT Policy Compliance Group 2011
As the research uncovered the range of practices implemented to manage business risks are directly related to outcomes Far more of the best performing organizations have more employees using these devices are spending more on information security and are more likely to be implementing most of these practices The reverse was also found to be true the worst performers are simply not implementing the practices or are implementing a few rather than all (Figure 12)
Figure 12 Practices implemented to manage the risks
Practices that determine outcomes
limit access geo-track devices protect and backup data wipe
devices that are lost or stolen prevent
unauthorized logons deliver training no
ROMs or App-markets
Source IT Policy Compliance Group 2011
Managing the Benefits and Risks of Mobile Computing
17
Controls Used to Manage Risks Controls are used in business to assist with the execution of business strategy to manage business outcomes and to manage risk In the case of managing risks related to the use of mobile devices to access information and applications the controls employed by the best performers include using antivirus andor anti-malware scans of the devices encrypting sensitive information on the devices preventing unauthorized people and devices from accessing sensitive information and applications patching mobile device systems-level software where possible and testing configurations of the devices (Table 10)
Table 10 Controls used to manage risks
Priority Controls used to manage the risks
1 Use anti-virus and anti-malware
2 Protect sensitive information on devices with encryption
3 Prevent unauthorized devices and people from accessing informationapplications
4 Patch systems software on devices where possible
5 Test configurations and settings on devices
Source IT Policy Compliance Group 2011
Of the controls tested by the research the one implemented by a clear majority of the best performers is the use of anti-virus andor anti-malware scans The least commonly implemented control among these best performers is the use of virtual private networking (VPN) although interviews revealed many respondents were using some form of VPN with Smartphones in the workplace
In contrast several controls are either not implemented or are less likely implemented by the worst performers These include the scanning of ROMs on mobile devices scanning of vulnerabilities on mobile devices conducting penetration tests on mobile devices patching systems-level software where possible and using virtual private networking (Figure 13)
Figure 13 Controls used to manage risks
Controls to use anti-virusanti-malware encryption checks and limits on unauthorized
devicespeople patches and
configuration testing
Source IT Policy Compliance Group 2011
Managing the Benefits and Risks of Mobile Computing
18
Interestingly the biggest complaint the Group found in the interviews was due to ldquothe lack of patches to update the Android operating systemrdquo For this reason alone we found that many organizations had developed a ldquono Androidrdquo policy or told its users that Android phones could no longer be used Another practice found to significantly impact outcomes is how frequently organizations conduct assessments
Consistency of Assessments and Reporting The rate at which controls to manage risks are monitored assessed and reported on is directly related to outcomes For example the findings reveal significant differences from annual to monthly rates with those conducting less frequent assessments being among the majority of the worst performers and those with the most frequent assessments being among the best performers (Table 11)
Table 11 Rate of assessment and reporting
Outcome Average rate of assessment and reporting
Worst Once every twelve months
Average Once every four-to-five months
Best Once every month or less
Source IT Policy Compliance Group 2011
Mirroring findings in related research the rate at which controls are monitored assessed and compared against a range of conditions including policies prioritized risks threats gold-standards regulatory requirements and internal configuration baselines among others defines
1) When organizations find gaps in controls and procedures
2) Whether risks are larger than expected
3) Whether organizations are able to take appropriate action
4) Whether organizations are able to reduce business risks
When looked at from the perspective of size the research reveals many organizations may not have the tools to automate such assessments or are simply choosing to conduct annual audit review assessments rather than ongoing business risk assessments (Figure 14)
Figure 14 Rate of assessment and reporting
The best performers consistently assess
and report on controls and risks more
frequently
Source IT Policy Compliance Group 2011
Managing the Benefits and Risks of Mobile Computing
19
In addition to the rate of assessment and reporting another defining practice responsible for outcomes is found to be spending on information security by organizations
Spend on Information Security and Outcomes Worst performers are spending 60 percent less than average while the best performers are spending 60 percent more than average performers (Table 12)
Table 12 Spend on information security
Outcome Relative spend on information security compared with average performers
Worst 04
Average 10
Best 16
Source IT Policy Compliance Group 2011
In addition to the relative difference in spend on information security there are large differences in the percentage of the IT budget spent on information security While the range of spend among the worst is from zero to slightly more than 5 of the IT budget the average spent by the worst is less than three percent In contrast average performers spend 75 percent and best performers are spending 12 percent on average (Figure 15)
Figure 15 Spend on information security
The best performers spend a larger
percentage of a larger IT budget on
information security
Source IT Policy Compliance Group 2011
The amount spent is more revealing when considering the actual IT budgets IT budgets among worst performers is just 30 percent of what average performers spend on IT while the amount spent on IT by the best performers is more than 30 percent higher than the average performers
Thus smaller percentages of much smaller annual IT budgets are characteristic of spending on information security by the worst performers while larger percentages of much larger annual IT budgets are characteristic of spending on information security by the best performers
Spending on information security among some of the worst performers actually bottomed-out during the latter half of 2011 When combined with no controls on mobile devices and a culture that is ignoring or discounting the business risks related to the use of Mobile devices it is possible that 2012 could be a year with some negative brand-wrecking events for some of these organizations The best performers will be happy to have positioned themselves differently
Managing the Benefits and Risks of Mobile Computing
20
Back to the Future Is the adoption of Mobile computing a repeat of what occurred in the 1980s Back then it was connecting PCs via local networks to provide office workers with access to information that could be analyzed and acted on in local work groups Today it is about wirelessly interconnecting Mobile devices enabling anyone to share and act on information from any location If today is any indication of what happened in the 1980s then the use of these new powerful pocket-sized but supercharged Mobile devices is likely to change to shape of computing as we know it today
The use of Smartphones by 8-in-10 organizations could likely grow And the use of these devices by employees artificially restricted to 33 percent for now will likely grow as management systems and security controls become more standardized
But we are in a high-growth expansionary phase where Phone manufacturers and carriers are incented to cannibalize products they shipped just last year or as recently as last month leaving consumers employees and organizations with devices that are out of date and may never be updated with systems-level software that would otherwise cure security vulnerabilities
Unfortunately there is no standard Android phone unless you purchase a Google Nexus phone which will be updated by Google directly But the majority of Android phones purchased by consumers and employees are not stock Google Android phones Instead the vast majority of Android phones are overlaid by supplier goo-gads carrier changes along with unexpected and unwanted mdash Carrier IQ mdash additions The carriers and phone manufacturers are incented by the sale of new hardware bling and new service contracts
Encouraged by Google and the profit margins from the latest hardware bling and service contracts the carriers and phone manufacturers continue to develop their own versions of Android What the carriers and phone manufacturers are not incented to do is to deploy software updates to the Android operating system to their customers and so they donrsquot Instead they find it less expensive to lure their customers into an upgrade to a new device on contract two years later
There are more stable and routinely updated
operating systems shipping with
Smartphones from Applersquos iOS RIMrsquos
Blackberry and Windows phone
Eventually these problems and others may resolve themselves but it could be another few years mdash or more mdash of frustration before anything resembling stability in the Android operating system is common and enterprise-ready management tools and security controls are available for these new wonders of the information age
In the meantime there are much more stable mdash and routinely updated mdash operating systems shipping with Smartphones from Applersquos iOS RIMrsquos Blackberry and Windows phone None of these suffer the same problems afflicting Android phones
Whatever you do remember the lessons about what worked mdash and what didnrsquot mdash with earlier generational-changes such as the advent of PCs or the dawn of Internet-computing This longer-term perspective and the lessons will come in handy in formulating strategy and tactics as the use of Mobile computing expands in your workplace
Summary Observations Based on the outcomes being achieved by the best performing organizations
The business benefits of using Smartphones and Tablet computers include
Improved access to business information from any location
Improved customer retention and satisfaction levels and
Higher levels of revenue and profitability when compared with peers
The business risks of using mobile computing devices include
Loss or theft of sensitive information
Unauthorized access to information and applications
Loss of governance or control over sensitive business information business applications business risks and audits
Managing the Benefits and Risks of Mobile Computing
21
The primary information and applications currently being used with mobile devices include
Email and collaborative applications
Office productivity applications
Sales force automation applications
The primary actions to take to limit business risks include
Limit the use of Smartphones in the workplace to specifically approved employees
Fewer than 50 percent of employees currently use Smartphonersquos among the best performers
Policies and practices to implement include
Have IT manage all Tablet computers and Smartphones
Allow approved employees to use their own Smartphones
Furnish Tablet computers to employees
Considerations to evaluate include
Mobile devices are another part of the requirements of your information security audits
Compare your due-care requirements to defend against legal inquiry
Identify your cross-border data privacy and ownership requirements
Practices to implement include
Limit the use of Smartphones to access information and applications to approved employees
Limit access to sensitive information and applications for mobile devices
Geo-track devices especially Smartphones
Prohibit the use of custom ROMs and unapproved App-marketssites
Deliver security awareness training and measure effectiveness with employees
Scan mobile devices with anti-virus and anti-malware
Protect and backup information on the devices
Wipe and lock stolen and lost devices as soon as notified by employees
Investigate the availability of patching as part of device evaluations
Use frequent controls and configuration testing to reduce gaps and limit risks
Increase spend on information security beyond your peers
Managing the Benefits and Risks of Mobile Computing
22
Appendix Expected Changes in Device Use in the Workplace 2011 to 2013 Respondents were asked to identify changes that are most likely going to occur in organizational and employee uses of Smartphones and Tablet computers between 2011 and 2013 As projections these forecasts of user and organizational expectations are reflections of current sentiment
The use of Smartphones by organizations is expected to remain the same between 2011 and 2013 at 79 percent of all organizations However the use of Smartphones to access information and applications by employees is expected to increase from 33 percent to 39 percent (Table 13)
Table 13 Device use 2011 to 2013
Device being used Use by organizationsemployees
2011 2013 Change in use
Organizational use 79 79 -0- Smartphones
Employee use 33 39 6 increase
Organizational use 35 49 14 increase Tablet computers
Employee use 22 32 10 increase
Source IT Policy Compliance Group 2011
Unlike Smartphones the use of Tablet computers is expected to increase for organizations and employees from an average rate of 35 percent to 49 percent for organizations and from 22 to 32 for employees The increases are larger than the sample error of seven percent
After an increase in employees using both devices what is rather intriguing is an expected downtrend in the use of Smartphones among organizations with the best outcomes The decline in the use of Smartphones among best performers is expected to be from 85 percent to 73 percent mdash a decrease of 12 percent mdash from 2011 to 2013 (Figure 16)
Figure 16 Expected changes in device use
Source IT Policy Compliance Group 2011
The explanation for the overall rate of decline of Smartphone use among best performing organization can be found from declines in the uses of iPhone and Windows Phone platforms and much more significant declines in the use of Android and Blackberry phones
At the time the research was being carried out RIM was suffering from blackouts in its services around the World with rolling service-outages that occurred across multiple continents during a one-week period The general consensus of many people we spoke with at the time was the service-outages ldquoare the final event I need to make the switch when my subscription period is duerdquo On the other hand others simply replaced their Blackberry devices that week and did not wait until their subscription was due for renewal
Unlike the RIM Blackberry platforms we found consistently strong disaffection with Android devices due to the inability to obtain updates for the Android operating system without having to root devices and hope for the best using custom ROMs
Managing the Benefits and Risks of Mobile Computing
23
These problems left many saying things like ldquoI bought a pig in a poke never againrdquo Others took matters into their own hands rooted their phones and installed updated versions of Android over the Internet from a number of different development sites none of which were blessed by carriers phone manufacturers or their IT staff
IT managers the Group spoke with identified an utter lack of management tools for Android devices too many versions of Android and a complete lack of vulnerability testing for the devices The inability to update and cure security-problems were just some of the problems identified by IT managers the Group spoke with The upshot for many were two common reactions to the use of Android in the enterprise 1) if it was already deployed the common reaction was to pull back support for Android and convert to other supported Smartphones and 2) if Android was not already deployed wait for Android to become enterprise-ready (Table 14)
Table 14 Reaction to Android phones in the workplace
Status of Android Smartphones
Reaction
Already deployed Pull-back and convert to other Smartphones
If not already deployed Wait for Android to become enterprise-ready
Source IT Policy Compliance Group 2011
When it comes to Tablet computers the sentiment about expected changes in use of different platforms reveals Android Tablet computers likely to see the biggest gains between now and 2013 followed by healthy gains in the use of other Tablet computers The only sentiment indicating significant declines appear to be related to Android and Blackberry Smartphones (Figure 17)
Figure 17 Expected changes in platform use
Source IT Policy Compliance Group 2011
The outlook of current sentiment regarding use of different platforms by 2013 clearly indicates the best performers are predisposed to ditch Android and Blackberry phones and significantly increase the use of iPad Tablet computers
By contrast the worst performers are predisposed to increase use of Smartphones and Tablet computers across the board and with the exception of Blackberry phones increase other mobile device platforms among average performers
Managing the Benefits and Risks of Mobile Computing
24
Additional Resources Numerous sources of related information are available for those interested in pursuing more information on a wide range of topics related to Smartphones and Tablet computers The following are but a small sample of related information perspectives and insight The authors of these articles have no relationship with the ITPCG Android Security See httpdeveloperandroidcomguidetopicssecuritysecurityhtml Android Orphans Visualizing a Sad History of Support See httptheunderstatementcompost11982112928android-orphans-visualizing-a-sad-history-of-support A Look into Mobile Device Security httpwwwsymanteccomcontentenusaboutmediapdfssymc_mobile_device_security_june2011pdfom_ext_cid=biz_socmed_twitter_facebook_marketwire_linkedin_2011Jun_worldwide_mobilesecuritywp Carrier IQ what it is what it isnrsquot and what you need to do httpwwwengadgetcom20111201carrier-iq-what-it-is-what-it-isnt-and-what-you-need-to CIS Apple iOS configuration benchmarks httpbenchmarkscisecurityorgen-usroute=downloadsbrowsecategorybenchmarksmobileiphone Current Android Malware httpforensicsspreitzenbarthdepage_id=254 DISA STIGs for Smartphones - unclassified httpiasedisamilstigsnet_perimeterwirelesssmartphonehtml iOS Hardening Configuration Guide Department of Defence Intelligence and Security Australian Government httpwwwdsdgovaupublicationsiOS_Hardening_Guidepdf Mac OS X and iOS Security httpdeveloperapplecomlibrarymacdocumentationSecurityConceptualSecurity_OverviewArchitectureArchitecturehtmlapple_refdocuidTP30000976-CH202-TPXREF101 Mobile Malware Why Fraudsters are Two Steps Ahead httpwwwtrusteercomblogmobile-malware-why-fraudsters-are-two-steps-ahead Rootkit called Carrier IQ discovered phoning home with user data httpwwwzdnetcomblogapplerootkit-called-carrier-iq-discovered-phoning-home-with-user-data11792 RIM launches Blackberry Fusion to Secure Android and Apple devices httpbusinessfinancialpostcom20111129rim-launching-blackberry-mobile-fusion-to-secure-iphone-android-devices Smartphone Security httpwwwenisaeuropaeuactapplication-securitysmartphone-security-1 The Spy Files Map httpwikileaksorgThe-Spyfiles-The-Maphtml Ten Steps to Secure Your Mobile Devices httpswikiinternet2educonfluencedisplayitsg2Mobile+Device+Security
Why Your Phone is Insecure by Design httpwwwforbescomsitesandygreenberg20110812codebreaker-karsten-nohl-why-your-phone-is-insecure-by-design
Managing the Benefits and Risks of Mobile Computing
25
About the Research Topics researched by the IT Policy Compliance Group (IT PCG) are part of an ongoing calendar established in consultation with Advisory General and Charter members of the Group as well as from findings compiled from ongoing research In addition to specific tracking questions common to each benchmark the research is designed to uncover the relationship between business results outcomes being experienced by organizations actions taken practices implemented and capabilities organizations use to respond
The qualitative research findings presented in this report are from numerous focus groups one-on-one interviews and meetings held with larger audiences throughout 2011 The quantitative findings contained in this report are from primary research studies conducted with 210 organizations in North America during late 2011
The maximum error for the sample findings for the benchmark findings contained in this report is +- seven percent The primary focus of analysis contained in this report is to present the largest differences between the outcomes experienced and similarly aligned findings that are most responsible for the differences in outcomes Instead of relying on differences that are within or close to the sample errors the effort has been to focus on the largest differences For example instead of focusing on differences involving +- 10 percent the findings covered in this report tend to focus on the largest differences in the range of 50 percent or more
The findings covering the use of Mobile computing are representative of organizations in North America and cannot be construed or inferred to represent current usage or plans for Mobile computing outside of North America However the findings covering the performance outcomes benefits and risks of Mobile computing the practices to manage the business risks and the controls to manage the risks match findings from similar studies covering other geographies outside of North America including findings from Latin America South America Europe Africa the Middle East Asia and Oceania
Industries represented The quantitative research includes representation from the following industries advertising accounting services aerospace agriculture apparel architecture automotive banking chemicals computer equipment and peripherals computer software and services construction consumer durable goods distribution education engineering services entertainment financial services food and beverage government (local state and federal level public administration) government (defense and intelligence) health medical and dental services insurance law enforcement management services media scientific and consulting services manufacturing pharmaceuticals public relations publishing real estate rental and leasing services retail trade telecommunications equipment telecommunication services transportation warehousing travel accommodation and hospitality services utilities waste management and wholesale trade Five industries represent 47 percent of the sample These include Banking Education Financial and Accounting Services Manufacturing and Retail Trade Another 27 industries represent the other 53 percent of the sample none of which represents more than five percent of the sample
Revenue or agency budgets of participating organizations Size of the organizations participating in the most recent benchmarks is somewhat evenly distributed although slightly fewer represent midsize organizations Thirty-six percent of the organizations represented by the findings have annual revenues or agency budgets that are less than $50 million Another twenty-nine percent of the sample has annual revenues or agency budgets between $50 million and $999 million The remaining thirty-five percent of the sample has annual revenues or agency budgets that are $1 billion or more
Functional areas of responsibility Thirty-five percent of the qualified participants for the benchmark work in IT with another 30 percent work in finance or internal controls The remaining 35 percent of the qualified participants work in a wide variety of functions from business line management senior management product design and development legal compliance sales marketing procurement logistics and customer services among other functions
Job titles of participants Thirty-five percent of the participants in the benchmark are senior managers with titles that include CEO CIO CFO or Vice president Thirty-eight percent are managers or directors and twenty-seven percent are staff in their organizations
Managing the Benefits and Risks of Mobile Computing
About IT Policy Compliance Group The mission of the IT Policy Compliance Group is to promote actionable findings based on evidence to assist organizations with delivering more value less risk and achieve IT policy and compliance objectives related to the use of information systems The Group Web site at wwwitpolicycompliancecom features quick two-minute self-assessments to compare outcomes and practices against onersquos industry peers and best performing organizations research reports continuing professional education conferences and seminars member and knowledge centers related research from around the World and resources including standards and frameworks associations government and regulators
The Grouprsquos research is designed to help IT risk legal financial and internal audit professionals to
Benchmark results and efforts against peers and best-in-class performers
Identify key drivers challenges and responses to improve results
Determine the applicability and use of specific capabilities to improve results
Identify best practices based on results and experience of peers
The Group relies upon its members and advisors for its research and editorial calendar
IT Policy Compliance Group Charter Members
The Institute of Symantec Corporation Internal Auditors ISACA 350 Ellis Street 247 Maitland Avenue 3701 Algonquin Road Suite 1010 Mountain View CA 94043 Altamonte Springs FL 32701 Rolling Meadows IL 60008 +1 (650) 527 8000 +1 (407) 937 1100 +1 (847) 253 1545 wwwsymanteccom wwwtheiiaorg wwwisacaorg infosymanteccom iiatheiiaorg infoisacaorg
Computer Security Institute Protiviti IT Governance Institute 600 Harrison Street New York Office 3701 Algonquin Road Suite 1010 San Francisco CA 94107 1290 Avenue of the Rolling Meadows IL 60008 +1 (415) 947 6320 Americas 5th Floor +1 (847) 660 5600 wwwgocsicom New York New York 10104 wwwitgiorg csicmpcom +1 (212) 603 8300 infoitgiorg wwwprotiviticom infoprotiviticom
IT Policy Compliance Group Affiliate Members and Advisors A current list of Affiliate Members and Advisors to the Group can be found on the IT Policy Compliance Group website
26
Founded in 2005 the IT Policy Compliance Group conducts benchmark research focused on delivering fact-based guidance on the steps that can be taken to improve results Benchmark results are reported through wwwitpolicycompliancecom for the benefit of members
IT Policy Compliance Group
Contacts Managing Director Jim Hurley Telephone +1 (216) 373 7010 jhurleyitpolicycompliancecom Managing Editor John Ortbal Telephone +1 (847) 444 0344 jortbalitpolicycompliancecom wwwitpolicycompliancecom
December 2011
The information contained in this publication has been obtained from sources that the IT Policy Compliance Group believes to be reliable but is not guaranteed Research publications reflect current conditions that are subject to change without notice
Copyright copy 2011 IT Policy Compliance Group Names and logos may be trademarks of their respective owners All rights reserved 1211 293167003
32
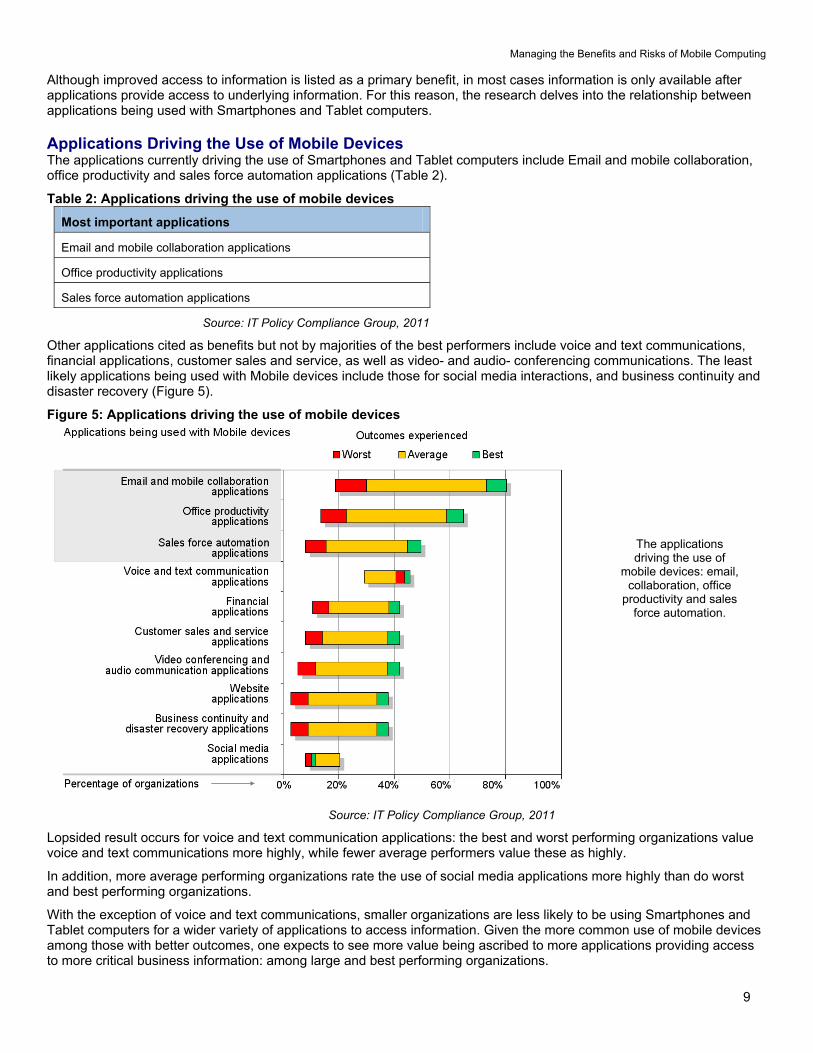
Managing the Benefits and Risks of Mobile Computing
9
Although improved access to information is listed as a primary benefit in most cases information is only available after applications provide access to underlying information For this reason the research delves into the relationship between applications being used with Smartphones and Tablet computers
Applications Driving the Use of Mobile Devices The applications currently driving the use of Smartphones and Tablet computers include Email and mobile collaboration office productivity and sales force automation applications (Table 2)
Table 2 Applications driving the use of mobile devices
Most important applications
Email and mobile collaboration applications
Office productivity applications
Sales force automation applications
Source IT Policy Compliance Group 2011
Other applications cited as benefits but not by majorities of the best performers include voice and text communications financial applications customer sales and service as well as video- and audio- conferencing communications The least likely applications being used with Mobile devices include those for social media interactions and business continuity and disaster recovery (Figure 5)
Figure 5 Applications driving the use of mobile devices
The applications driving the use of
mobile devices email collaboration office
productivity and sales force automation
Source IT Policy Compliance Group 2011
Lopsided result occurs for voice and text communication applications the best and worst performing organizations value voice and text communications more highly while fewer average performers value these as highly
In addition more average performing organizations rate the use of social media applications more highly than do worst and best performing organizations
With the exception of voice and text communications smaller organizations are less likely to be using Smartphones and Tablet computers for a wider variety of applications to access information Given the more common use of mobile devices among those with better outcomes one expects to see more value being ascribed to more applications providing access to more critical business information among large and best performing organizations
Managing the Benefits and Risks of Mobile Computing
10
Although the benefits of Smartphones and Tablet computers are helping best performers mdash and proportionately more large organizations mdash to post higher revenue and profit levels due to immediate access to information and sharing of information with others these benefits come with business risks most notably the loss or theft of sensitive information unauthorized access to sensitive business information and a loss of control or a loss of governance
Business Risks of Smartphones and Tablet Computers The primary business risks related to the use of Smartphones and Tablet computers include the loss or theft of sensitive information and unauthorized access to sensitive business information or applications and a loss of control over data applications risks and audits (Table 3)
Table 3 Business risks of smartphones and tablet computers
Largest business risks
Loss or theft of sensitive information
Unauthorized access to sensitive information or applications
Loss of governance ndash or control ndash over data applications risks and audits
Source IT Policy Compliance Group 2011
The other major business risk cited by a majority of those experiencing the best outcomes includes the loss or theft of the devices themselves and the unintentional disclosure of sensitive information that occurs through these devices (Figure 6)
Figure 6 Business risks of smartphones and tablet computers
The business risks loss or theft of
sensitive information unauthorized access loss of control over
data applications risks and audits
Source IT Policy Compliance Group 2011
The lowest business risks are found to be customer defections due to misuse or failure of the devices followed by geo-tracking of employees or customers Although the numbers rank geo-tracking of employees as a low business risk one-on-one interviews conducted with several senior managers reveal geo-tracking to be a growing risk especially for high-ranking executives and in cases where teams of people from an organization are converging in one geographic area
Lopsided results for loss of devices and fraud are considered lower risks among average performing organizations but more risk among the best and worst performing organizations Interviews revealed that most organizations consider Smartphones to be disposable as long as the information on these devices is protected from use or reuse
Managing the Benefits and Risks of Mobile Computing
11
Larger organizations tend to focus more on the impacts the devices have on customer loyalty repeat business revenue and profitability These are larger concerns in banking retail and transportation industries where entirely new mobile device Apps is being used by customers of firms in these industries
In addition to the business risks the research findings reveal very significant differences in policies and practices being implemented by organizations covering a range of activities including who owns mobile devices whether employees are encouraged or allowed to use their own devices and whether IT manages Smartphones and Tablet computers
Policies and Practices Governing Mobile Device Use in the Workplace The dominant polices and practices governing the use of mobile devices differ considerably with those experiencing best and average outcomes exhibiting more similar policies and practices Among the best and average performers IT is in charge of managing all devices employee owned or not (Table 4)
Table 4 Polices and practices
Outcomes Smartphones Tablet computers
Worst Use of mobile devices is unknown Employees use their own devices
Average IT manages employee-owned devices IT manages company-issued devices
Best IT manages employee-owned devices IT manages company-issued devices
Source IT Policy Compliance Group 2011
Among the worst performers the dominant culture is one where the use of mobile devices is largely unknown unregistered or unreported and employees are allowed to use their own devices
Among average and best performers the dominant policies and practices are very different IT manages the devices while employees are allowed to use their own Smartphones employees must use company-supplied Tablet computers (Figure 7)
Figure 7 Polices and practices
Source IT Policy Compliance Group 2011
Where IT is involved in managing Smartphones and Tablet computers better and best outcomes are more predominant whereas when IT is not managing mobile devices the predominant outcomes are worse and worst
Of the almost 4-in-10 organizations where employees use Tablet computers to access information and applications at work about one-third (33 percent) furnish and provision Tablet computers for employees slightly less than 40 percent allow employees to bring and use their own Smartphones to work and another 30 percent simply do not know how many Tablet computers are being used by employees
Worse results occur among organizations that do not know how many Smartphones are being used In addition several operational challenges are found to be directly related to more mdash or less mdash business risk related to the use of these Mobile devices
Managing the Benefits and Risks of Mobile Computing
12
Operational Challenges Contributing to Business Risks The primary operational challenges contributing to increased business risk from the use of Smartphones and Tablet computers include a) malicious software that can shut down or take-over mobiles devices b) ineffective vulnerability configuration and penetration testing for mobile devices c) an inability to detect or prevent rogue applications from operating on mobile devices and d) an inability to wipe-clean or lock stolen devices (Table 5)
Table 5 Operational challenges
Outcomes Primary operational challenges
Worst Inability to wipe or lock stolen devices
Average Malicious software
Vulnerability configuration penetration testing
Rogue applications
Best Malicious software
Vulnerability configuration penetration testing
Rogue applications
Inability to wipe or lock stolen devices
Source IT Policy Compliance Group 2011
Malicious software is ranked by 8-in-10 organizations as the factor most contributing to business risk After this ineffective practices for managing vulnerabilities configurations and penetration tests and an inability to detect or prevent rogue applications are rated most highly as contributing to increased business risk from the use of mobile devices (Figure 8)
Figure 8 Operational challenges
Operational challenges malicious software vulnerability
scanning configuration testing pen-testing
rogue software wipe or lock stolenlost
devices patching and remediation
Source IT Policy Compliance Group 2011
Detecting mobile devices and wiping data or locking stolen devices are ranked very highly by worst and best performing organizations and ranked much less highly as an operational challenge resulting in elevated business risks among average performing organizations
The lopsided difference is especially evident for the inability to wipe sensitive information or lock lost or stolen devices this is a challenge for 25 percent of the worst of the average performers whereas it a challenge leading to increased business risk by 50 percent of the best performers and nearly 60 percent of the worst performers
Managing the Benefits and Risks of Mobile Computing
13
In addition to operational challenges contributing to elevated business risks the benchmarks also identify legal and regulatory challenges that are contributing to increased business risk Often called a binary problem mdash you adhere to and report on a specific regulation or not mdash the findings reveal the challenges are larger than concerns about failing to comply with a single regulatory mandate or legal ruling
Legal and Regulatory Challenges Contributing to Business Risks The legal and regulatory challenges contributing to business risks from the use of Smartphones and Tablet computers include a) an inability to conduct information security audits and b) exposure to civil or criminal action due to inadequate due-care findings (Table 6)
Table 6 Legal and regulatory challenges
Outcomes Primary operational challenges
Worst Inability to comply with cross-border data privacy mandates
Average Inability to conduct information security audits
Exposure to civilcriminal actions due to inadequate due-care
Best Inability to conduct information security audits
Exposure to civilcriminal actions due to inadequate due-care
Inability to comply with cross-border data privacy mandates
Loss of ownership of data due to differences in jurisdictions
Source IT Policy Compliance Group 2011
After these two the primary challenges include an inability to comply with cross-border data privacy regulations or law loss of ownership of data due to differences in legal jurisdictions and an inability to deliver forensics information for investigations (Figure 9)
Figure 9 Legal and regulatory challenges
Legal and regulatory challenges information
security audits inadequate due-care
cross-border data privacy loss of
ownership over data
Source IT Policy Compliance Group 2011
Complying with cross-border data privacy regulations are challenges for worst and best performers but less of a challenge among average performing companies
Managing the Benefits and Risks of Mobile Computing
14
Organizations do not willingly engage in behavior whose risks are large enough to outweigh benefits Not as stark as a ldquoflight or fightrdquo reaction the primary action being taken to manage the risks of using Smartphones and Tablet computers reveal much about the outcomes organizations are experiencing
Action Taken to Manage the Risks The primary action taken to manage the risks of using mobile devices is to simply limit the number of employees who can use the devices mdash Smartphones and Tablet computers mdash to access applications and information in the workplace This action is shared by those with the best and average outcomes about 8-in-10 organizations However the primary action being taken by the worst performers is to ignore or discount the risk posed to the business from the use of these mobile devices (Table 7)
Table 7 Actions taken to manage the risks
Outcome Primary action taken to manage the risks
Worst Ignore or discount business risks associated with use of mobile devices
Average Limit the use of mobile devices to specific employees
Best Limit the use of mobile devices to specific employees
Source IT Policy Compliance Group 2011
In contrast the worst performers are not purposely limiting the use of mobile devices to specific employees rather these firms are ignoring or discounting the business risks or are trying to cover the business risks with existing or new insurance contracts
Fewer average better or best performing organizations are limiting the use of these devices and are ignoring or discounting the business risks involved (Figure 10)
Figure 10 Actions taken to manage the risks
Action taken to manage the risks limit number of employees that are allowed to use Smartphones or Tablet
computers in the workplace
Source IT Policy Compliance Group 2011
Limiting the use of mobile devices is a double-edged sword because the benefits tangible benefits include increases in revenue and profitability Although not tracked in these studies research from complementary longitudinal and non-longitudinal studies indicate that customer satisfaction and retention rates are also higher among the best performers The core issue for most organizations is the tradeoff between benefits and risks The obvious issue for most organizations is finding an optimal balance or tradeoff between risks and benefits
Managing the Benefits and Risks of Mobile Computing
15
Limiting the Number of Employees Who Use Mobile Devices Despite the benefits of using mobile devices the business risks are purposely keeping low the number of employees using these mobile devices in the workplace The number of employees using Smartphones to access information and applications is a rather low 3-in-10 people (33 percent) despite the high 8-in-10 (79 percent) number of organizations using these devices Similarly the average number of employees using Tablet computers to access information and applications is just 1-in-5 people (22 percent) among the 35 percent of organizations using these devices (Figure 11)
Figure 11 Use of mobile devices by employees
It is the use of Smartphones by
employees that are being artificially
restricted because of the business risks
Source IT Policy Compliance Group 2011
The use of mobile Smartphones is being artificially limited by organizations due to the risks involved Whether it is the simple visual depiction contained in Figure 11 or the ratio of employees to organizations using the devices or the range of employees using the devices it is clear that it is the use of Smartphones by employees to access information and applications that are being artificially restricted (Table 8)
Table 8 Use of mobile devices by employees
Employee use for 65 of
organizations
Employee use for 95 of
organizations
Ratio of employee use to organization use
Smartphones 31 to 36 29 to 38 42
Tablet computers 18 to 27 14 to 31 63
Source IT Policy Compliance Group 2011
Thus the calculus of determining who uses and who does not use Smartphones to access information and applications at an organization is as much a determination of business need and value as much as it is an evaluation of business risk
As part of the research the Group delved into additional practices organizations implement to see if there are other factors responsible for better mdash or worse mdash outcomes associated with the use of Mobile devices
Managing the Benefits and Risks of Mobile Computing
16
Practices that Determine Outcomes The primary practices being implemented to manage business risks for the employees who are using Smartphones and Tablet computers include limiting access to sensitive information or applications geo-tracking and locating lost or stolen devices protecting and backing-up information from mobile devices wiping sensitive information from stolen or lost mobile devices preventingrecording unauthorized logins from mobile devices delivering security-awareness training to employees who use mobile devices and prohibiting access to Apps-markets Apps-sites and custom ROMs on mobile devices (Table 9)
Table 9 Practices implemented to manage the risks
Priority Practices determining outcomes
1 Limit access to sensitive information and applications
2 Geo-track devices to aid in recovery or destruction of information
3 Protect and backup information from devices
4 Wipe stolen or lost devices of information and credentials
5 Prevent and record unauthorized logon attempts
6 Deliver and measure policy and security awareness training for users
7 Prohibit custom ROMs for rooted devices and access to App-markets
Source IT Policy Compliance Group 2011
As the research uncovered the range of practices implemented to manage business risks are directly related to outcomes Far more of the best performing organizations have more employees using these devices are spending more on information security and are more likely to be implementing most of these practices The reverse was also found to be true the worst performers are simply not implementing the practices or are implementing a few rather than all (Figure 12)
Figure 12 Practices implemented to manage the risks
Practices that determine outcomes
limit access geo-track devices protect and backup data wipe
devices that are lost or stolen prevent
unauthorized logons deliver training no
ROMs or App-markets
Source IT Policy Compliance Group 2011
Managing the Benefits and Risks of Mobile Computing
17
Controls Used to Manage Risks Controls are used in business to assist with the execution of business strategy to manage business outcomes and to manage risk In the case of managing risks related to the use of mobile devices to access information and applications the controls employed by the best performers include using antivirus andor anti-malware scans of the devices encrypting sensitive information on the devices preventing unauthorized people and devices from accessing sensitive information and applications patching mobile device systems-level software where possible and testing configurations of the devices (Table 10)
Table 10 Controls used to manage risks
Priority Controls used to manage the risks
1 Use anti-virus and anti-malware
2 Protect sensitive information on devices with encryption
3 Prevent unauthorized devices and people from accessing informationapplications
4 Patch systems software on devices where possible
5 Test configurations and settings on devices
Source IT Policy Compliance Group 2011
Of the controls tested by the research the one implemented by a clear majority of the best performers is the use of anti-virus andor anti-malware scans The least commonly implemented control among these best performers is the use of virtual private networking (VPN) although interviews revealed many respondents were using some form of VPN with Smartphones in the workplace
In contrast several controls are either not implemented or are less likely implemented by the worst performers These include the scanning of ROMs on mobile devices scanning of vulnerabilities on mobile devices conducting penetration tests on mobile devices patching systems-level software where possible and using virtual private networking (Figure 13)
Figure 13 Controls used to manage risks
Controls to use anti-virusanti-malware encryption checks and limits on unauthorized
devicespeople patches and
configuration testing
Source IT Policy Compliance Group 2011
Managing the Benefits and Risks of Mobile Computing
18
Interestingly the biggest complaint the Group found in the interviews was due to ldquothe lack of patches to update the Android operating systemrdquo For this reason alone we found that many organizations had developed a ldquono Androidrdquo policy or told its users that Android phones could no longer be used Another practice found to significantly impact outcomes is how frequently organizations conduct assessments
Consistency of Assessments and Reporting The rate at which controls to manage risks are monitored assessed and reported on is directly related to outcomes For example the findings reveal significant differences from annual to monthly rates with those conducting less frequent assessments being among the majority of the worst performers and those with the most frequent assessments being among the best performers (Table 11)
Table 11 Rate of assessment and reporting
Outcome Average rate of assessment and reporting
Worst Once every twelve months
Average Once every four-to-five months
Best Once every month or less
Source IT Policy Compliance Group 2011
Mirroring findings in related research the rate at which controls are monitored assessed and compared against a range of conditions including policies prioritized risks threats gold-standards regulatory requirements and internal configuration baselines among others defines
1) When organizations find gaps in controls and procedures
2) Whether risks are larger than expected
3) Whether organizations are able to take appropriate action
4) Whether organizations are able to reduce business risks
When looked at from the perspective of size the research reveals many organizations may not have the tools to automate such assessments or are simply choosing to conduct annual audit review assessments rather than ongoing business risk assessments (Figure 14)
Figure 14 Rate of assessment and reporting
The best performers consistently assess
and report on controls and risks more
frequently
Source IT Policy Compliance Group 2011
Managing the Benefits and Risks of Mobile Computing
19
In addition to the rate of assessment and reporting another defining practice responsible for outcomes is found to be spending on information security by organizations
Spend on Information Security and Outcomes Worst performers are spending 60 percent less than average while the best performers are spending 60 percent more than average performers (Table 12)
Table 12 Spend on information security
Outcome Relative spend on information security compared with average performers
Worst 04
Average 10
Best 16
Source IT Policy Compliance Group 2011
In addition to the relative difference in spend on information security there are large differences in the percentage of the IT budget spent on information security While the range of spend among the worst is from zero to slightly more than 5 of the IT budget the average spent by the worst is less than three percent In contrast average performers spend 75 percent and best performers are spending 12 percent on average (Figure 15)
Figure 15 Spend on information security
The best performers spend a larger
percentage of a larger IT budget on
information security
Source IT Policy Compliance Group 2011
The amount spent is more revealing when considering the actual IT budgets IT budgets among worst performers is just 30 percent of what average performers spend on IT while the amount spent on IT by the best performers is more than 30 percent higher than the average performers
Thus smaller percentages of much smaller annual IT budgets are characteristic of spending on information security by the worst performers while larger percentages of much larger annual IT budgets are characteristic of spending on information security by the best performers
Spending on information security among some of the worst performers actually bottomed-out during the latter half of 2011 When combined with no controls on mobile devices and a culture that is ignoring or discounting the business risks related to the use of Mobile devices it is possible that 2012 could be a year with some negative brand-wrecking events for some of these organizations The best performers will be happy to have positioned themselves differently
Managing the Benefits and Risks of Mobile Computing
20
Back to the Future Is the adoption of Mobile computing a repeat of what occurred in the 1980s Back then it was connecting PCs via local networks to provide office workers with access to information that could be analyzed and acted on in local work groups Today it is about wirelessly interconnecting Mobile devices enabling anyone to share and act on information from any location If today is any indication of what happened in the 1980s then the use of these new powerful pocket-sized but supercharged Mobile devices is likely to change to shape of computing as we know it today
The use of Smartphones by 8-in-10 organizations could likely grow And the use of these devices by employees artificially restricted to 33 percent for now will likely grow as management systems and security controls become more standardized
But we are in a high-growth expansionary phase where Phone manufacturers and carriers are incented to cannibalize products they shipped just last year or as recently as last month leaving consumers employees and organizations with devices that are out of date and may never be updated with systems-level software that would otherwise cure security vulnerabilities
Unfortunately there is no standard Android phone unless you purchase a Google Nexus phone which will be updated by Google directly But the majority of Android phones purchased by consumers and employees are not stock Google Android phones Instead the vast majority of Android phones are overlaid by supplier goo-gads carrier changes along with unexpected and unwanted mdash Carrier IQ mdash additions The carriers and phone manufacturers are incented by the sale of new hardware bling and new service contracts
Encouraged by Google and the profit margins from the latest hardware bling and service contracts the carriers and phone manufacturers continue to develop their own versions of Android What the carriers and phone manufacturers are not incented to do is to deploy software updates to the Android operating system to their customers and so they donrsquot Instead they find it less expensive to lure their customers into an upgrade to a new device on contract two years later
There are more stable and routinely updated
operating systems shipping with
Smartphones from Applersquos iOS RIMrsquos
Blackberry and Windows phone
Eventually these problems and others may resolve themselves but it could be another few years mdash or more mdash of frustration before anything resembling stability in the Android operating system is common and enterprise-ready management tools and security controls are available for these new wonders of the information age
In the meantime there are much more stable mdash and routinely updated mdash operating systems shipping with Smartphones from Applersquos iOS RIMrsquos Blackberry and Windows phone None of these suffer the same problems afflicting Android phones
Whatever you do remember the lessons about what worked mdash and what didnrsquot mdash with earlier generational-changes such as the advent of PCs or the dawn of Internet-computing This longer-term perspective and the lessons will come in handy in formulating strategy and tactics as the use of Mobile computing expands in your workplace
Summary Observations Based on the outcomes being achieved by the best performing organizations
The business benefits of using Smartphones and Tablet computers include
Improved access to business information from any location
Improved customer retention and satisfaction levels and
Higher levels of revenue and profitability when compared with peers
The business risks of using mobile computing devices include
Loss or theft of sensitive information
Unauthorized access to information and applications
Loss of governance or control over sensitive business information business applications business risks and audits
Managing the Benefits and Risks of Mobile Computing
21
The primary information and applications currently being used with mobile devices include
Email and collaborative applications
Office productivity applications
Sales force automation applications
The primary actions to take to limit business risks include
Limit the use of Smartphones in the workplace to specifically approved employees
Fewer than 50 percent of employees currently use Smartphonersquos among the best performers
Policies and practices to implement include
Have IT manage all Tablet computers and Smartphones
Allow approved employees to use their own Smartphones
Furnish Tablet computers to employees
Considerations to evaluate include
Mobile devices are another part of the requirements of your information security audits
Compare your due-care requirements to defend against legal inquiry
Identify your cross-border data privacy and ownership requirements
Practices to implement include
Limit the use of Smartphones to access information and applications to approved employees
Limit access to sensitive information and applications for mobile devices
Geo-track devices especially Smartphones
Prohibit the use of custom ROMs and unapproved App-marketssites
Deliver security awareness training and measure effectiveness with employees
Scan mobile devices with anti-virus and anti-malware
Protect and backup information on the devices
Wipe and lock stolen and lost devices as soon as notified by employees
Investigate the availability of patching as part of device evaluations
Use frequent controls and configuration testing to reduce gaps and limit risks
Increase spend on information security beyond your peers
Managing the Benefits and Risks of Mobile Computing
22
Appendix Expected Changes in Device Use in the Workplace 2011 to 2013 Respondents were asked to identify changes that are most likely going to occur in organizational and employee uses of Smartphones and Tablet computers between 2011 and 2013 As projections these forecasts of user and organizational expectations are reflections of current sentiment
The use of Smartphones by organizations is expected to remain the same between 2011 and 2013 at 79 percent of all organizations However the use of Smartphones to access information and applications by employees is expected to increase from 33 percent to 39 percent (Table 13)
Table 13 Device use 2011 to 2013
Device being used Use by organizationsemployees
2011 2013 Change in use
Organizational use 79 79 -0- Smartphones
Employee use 33 39 6 increase
Organizational use 35 49 14 increase Tablet computers
Employee use 22 32 10 increase
Source IT Policy Compliance Group 2011
Unlike Smartphones the use of Tablet computers is expected to increase for organizations and employees from an average rate of 35 percent to 49 percent for organizations and from 22 to 32 for employees The increases are larger than the sample error of seven percent
After an increase in employees using both devices what is rather intriguing is an expected downtrend in the use of Smartphones among organizations with the best outcomes The decline in the use of Smartphones among best performers is expected to be from 85 percent to 73 percent mdash a decrease of 12 percent mdash from 2011 to 2013 (Figure 16)
Figure 16 Expected changes in device use
Source IT Policy Compliance Group 2011
The explanation for the overall rate of decline of Smartphone use among best performing organization can be found from declines in the uses of iPhone and Windows Phone platforms and much more significant declines in the use of Android and Blackberry phones
At the time the research was being carried out RIM was suffering from blackouts in its services around the World with rolling service-outages that occurred across multiple continents during a one-week period The general consensus of many people we spoke with at the time was the service-outages ldquoare the final event I need to make the switch when my subscription period is duerdquo On the other hand others simply replaced their Blackberry devices that week and did not wait until their subscription was due for renewal
Unlike the RIM Blackberry platforms we found consistently strong disaffection with Android devices due to the inability to obtain updates for the Android operating system without having to root devices and hope for the best using custom ROMs
Managing the Benefits and Risks of Mobile Computing
23
These problems left many saying things like ldquoI bought a pig in a poke never againrdquo Others took matters into their own hands rooted their phones and installed updated versions of Android over the Internet from a number of different development sites none of which were blessed by carriers phone manufacturers or their IT staff
IT managers the Group spoke with identified an utter lack of management tools for Android devices too many versions of Android and a complete lack of vulnerability testing for the devices The inability to update and cure security-problems were just some of the problems identified by IT managers the Group spoke with The upshot for many were two common reactions to the use of Android in the enterprise 1) if it was already deployed the common reaction was to pull back support for Android and convert to other supported Smartphones and 2) if Android was not already deployed wait for Android to become enterprise-ready (Table 14)
Table 14 Reaction to Android phones in the workplace
Status of Android Smartphones
Reaction
Already deployed Pull-back and convert to other Smartphones
If not already deployed Wait for Android to become enterprise-ready
Source IT Policy Compliance Group 2011
When it comes to Tablet computers the sentiment about expected changes in use of different platforms reveals Android Tablet computers likely to see the biggest gains between now and 2013 followed by healthy gains in the use of other Tablet computers The only sentiment indicating significant declines appear to be related to Android and Blackberry Smartphones (Figure 17)
Figure 17 Expected changes in platform use
Source IT Policy Compliance Group 2011
The outlook of current sentiment regarding use of different platforms by 2013 clearly indicates the best performers are predisposed to ditch Android and Blackberry phones and significantly increase the use of iPad Tablet computers
By contrast the worst performers are predisposed to increase use of Smartphones and Tablet computers across the board and with the exception of Blackberry phones increase other mobile device platforms among average performers
Managing the Benefits and Risks of Mobile Computing
24
Additional Resources Numerous sources of related information are available for those interested in pursuing more information on a wide range of topics related to Smartphones and Tablet computers The following are but a small sample of related information perspectives and insight The authors of these articles have no relationship with the ITPCG Android Security See httpdeveloperandroidcomguidetopicssecuritysecurityhtml Android Orphans Visualizing a Sad History of Support See httptheunderstatementcompost11982112928android-orphans-visualizing-a-sad-history-of-support A Look into Mobile Device Security httpwwwsymanteccomcontentenusaboutmediapdfssymc_mobile_device_security_june2011pdfom_ext_cid=biz_socmed_twitter_facebook_marketwire_linkedin_2011Jun_worldwide_mobilesecuritywp Carrier IQ what it is what it isnrsquot and what you need to do httpwwwengadgetcom20111201carrier-iq-what-it-is-what-it-isnt-and-what-you-need-to CIS Apple iOS configuration benchmarks httpbenchmarkscisecurityorgen-usroute=downloadsbrowsecategorybenchmarksmobileiphone Current Android Malware httpforensicsspreitzenbarthdepage_id=254 DISA STIGs for Smartphones - unclassified httpiasedisamilstigsnet_perimeterwirelesssmartphonehtml iOS Hardening Configuration Guide Department of Defence Intelligence and Security Australian Government httpwwwdsdgovaupublicationsiOS_Hardening_Guidepdf Mac OS X and iOS Security httpdeveloperapplecomlibrarymacdocumentationSecurityConceptualSecurity_OverviewArchitectureArchitecturehtmlapple_refdocuidTP30000976-CH202-TPXREF101 Mobile Malware Why Fraudsters are Two Steps Ahead httpwwwtrusteercomblogmobile-malware-why-fraudsters-are-two-steps-ahead Rootkit called Carrier IQ discovered phoning home with user data httpwwwzdnetcomblogapplerootkit-called-carrier-iq-discovered-phoning-home-with-user-data11792 RIM launches Blackberry Fusion to Secure Android and Apple devices httpbusinessfinancialpostcom20111129rim-launching-blackberry-mobile-fusion-to-secure-iphone-android-devices Smartphone Security httpwwwenisaeuropaeuactapplication-securitysmartphone-security-1 The Spy Files Map httpwikileaksorgThe-Spyfiles-The-Maphtml Ten Steps to Secure Your Mobile Devices httpswikiinternet2educonfluencedisplayitsg2Mobile+Device+Security
Why Your Phone is Insecure by Design httpwwwforbescomsitesandygreenberg20110812codebreaker-karsten-nohl-why-your-phone-is-insecure-by-design
Managing the Benefits and Risks of Mobile Computing
25
About the Research Topics researched by the IT Policy Compliance Group (IT PCG) are part of an ongoing calendar established in consultation with Advisory General and Charter members of the Group as well as from findings compiled from ongoing research In addition to specific tracking questions common to each benchmark the research is designed to uncover the relationship between business results outcomes being experienced by organizations actions taken practices implemented and capabilities organizations use to respond
The qualitative research findings presented in this report are from numerous focus groups one-on-one interviews and meetings held with larger audiences throughout 2011 The quantitative findings contained in this report are from primary research studies conducted with 210 organizations in North America during late 2011
The maximum error for the sample findings for the benchmark findings contained in this report is +- seven percent The primary focus of analysis contained in this report is to present the largest differences between the outcomes experienced and similarly aligned findings that are most responsible for the differences in outcomes Instead of relying on differences that are within or close to the sample errors the effort has been to focus on the largest differences For example instead of focusing on differences involving +- 10 percent the findings covered in this report tend to focus on the largest differences in the range of 50 percent or more
The findings covering the use of Mobile computing are representative of organizations in North America and cannot be construed or inferred to represent current usage or plans for Mobile computing outside of North America However the findings covering the performance outcomes benefits and risks of Mobile computing the practices to manage the business risks and the controls to manage the risks match findings from similar studies covering other geographies outside of North America including findings from Latin America South America Europe Africa the Middle East Asia and Oceania
Industries represented The quantitative research includes representation from the following industries advertising accounting services aerospace agriculture apparel architecture automotive banking chemicals computer equipment and peripherals computer software and services construction consumer durable goods distribution education engineering services entertainment financial services food and beverage government (local state and federal level public administration) government (defense and intelligence) health medical and dental services insurance law enforcement management services media scientific and consulting services manufacturing pharmaceuticals public relations publishing real estate rental and leasing services retail trade telecommunications equipment telecommunication services transportation warehousing travel accommodation and hospitality services utilities waste management and wholesale trade Five industries represent 47 percent of the sample These include Banking Education Financial and Accounting Services Manufacturing and Retail Trade Another 27 industries represent the other 53 percent of the sample none of which represents more than five percent of the sample
Revenue or agency budgets of participating organizations Size of the organizations participating in the most recent benchmarks is somewhat evenly distributed although slightly fewer represent midsize organizations Thirty-six percent of the organizations represented by the findings have annual revenues or agency budgets that are less than $50 million Another twenty-nine percent of the sample has annual revenues or agency budgets between $50 million and $999 million The remaining thirty-five percent of the sample has annual revenues or agency budgets that are $1 billion or more
Functional areas of responsibility Thirty-five percent of the qualified participants for the benchmark work in IT with another 30 percent work in finance or internal controls The remaining 35 percent of the qualified participants work in a wide variety of functions from business line management senior management product design and development legal compliance sales marketing procurement logistics and customer services among other functions
Job titles of participants Thirty-five percent of the participants in the benchmark are senior managers with titles that include CEO CIO CFO or Vice president Thirty-eight percent are managers or directors and twenty-seven percent are staff in their organizations
Managing the Benefits and Risks of Mobile Computing
About IT Policy Compliance Group The mission of the IT Policy Compliance Group is to promote actionable findings based on evidence to assist organizations with delivering more value less risk and achieve IT policy and compliance objectives related to the use of information systems The Group Web site at wwwitpolicycompliancecom features quick two-minute self-assessments to compare outcomes and practices against onersquos industry peers and best performing organizations research reports continuing professional education conferences and seminars member and knowledge centers related research from around the World and resources including standards and frameworks associations government and regulators
The Grouprsquos research is designed to help IT risk legal financial and internal audit professionals to
Benchmark results and efforts against peers and best-in-class performers
Identify key drivers challenges and responses to improve results
Determine the applicability and use of specific capabilities to improve results
Identify best practices based on results and experience of peers
The Group relies upon its members and advisors for its research and editorial calendar
IT Policy Compliance Group Charter Members
The Institute of Symantec Corporation Internal Auditors ISACA 350 Ellis Street 247 Maitland Avenue 3701 Algonquin Road Suite 1010 Mountain View CA 94043 Altamonte Springs FL 32701 Rolling Meadows IL 60008 +1 (650) 527 8000 +1 (407) 937 1100 +1 (847) 253 1545 wwwsymanteccom wwwtheiiaorg wwwisacaorg infosymanteccom iiatheiiaorg infoisacaorg
Computer Security Institute Protiviti IT Governance Institute 600 Harrison Street New York Office 3701 Algonquin Road Suite 1010 San Francisco CA 94107 1290 Avenue of the Rolling Meadows IL 60008 +1 (415) 947 6320 Americas 5th Floor +1 (847) 660 5600 wwwgocsicom New York New York 10104 wwwitgiorg csicmpcom +1 (212) 603 8300 infoitgiorg wwwprotiviticom infoprotiviticom
IT Policy Compliance Group Affiliate Members and Advisors A current list of Affiliate Members and Advisors to the Group can be found on the IT Policy Compliance Group website
26
Founded in 2005 the IT Policy Compliance Group conducts benchmark research focused on delivering fact-based guidance on the steps that can be taken to improve results Benchmark results are reported through wwwitpolicycompliancecom for the benefit of members
IT Policy Compliance Group
Contacts Managing Director Jim Hurley Telephone +1 (216) 373 7010 jhurleyitpolicycompliancecom Managing Editor John Ortbal Telephone +1 (847) 444 0344 jortbalitpolicycompliancecom wwwitpolicycompliancecom
December 2011
The information contained in this publication has been obtained from sources that the IT Policy Compliance Group believes to be reliable but is not guaranteed Research publications reflect current conditions that are subject to change without notice
Copyright copy 2011 IT Policy Compliance Group Names and logos may be trademarks of their respective owners All rights reserved 1211 293167003
32
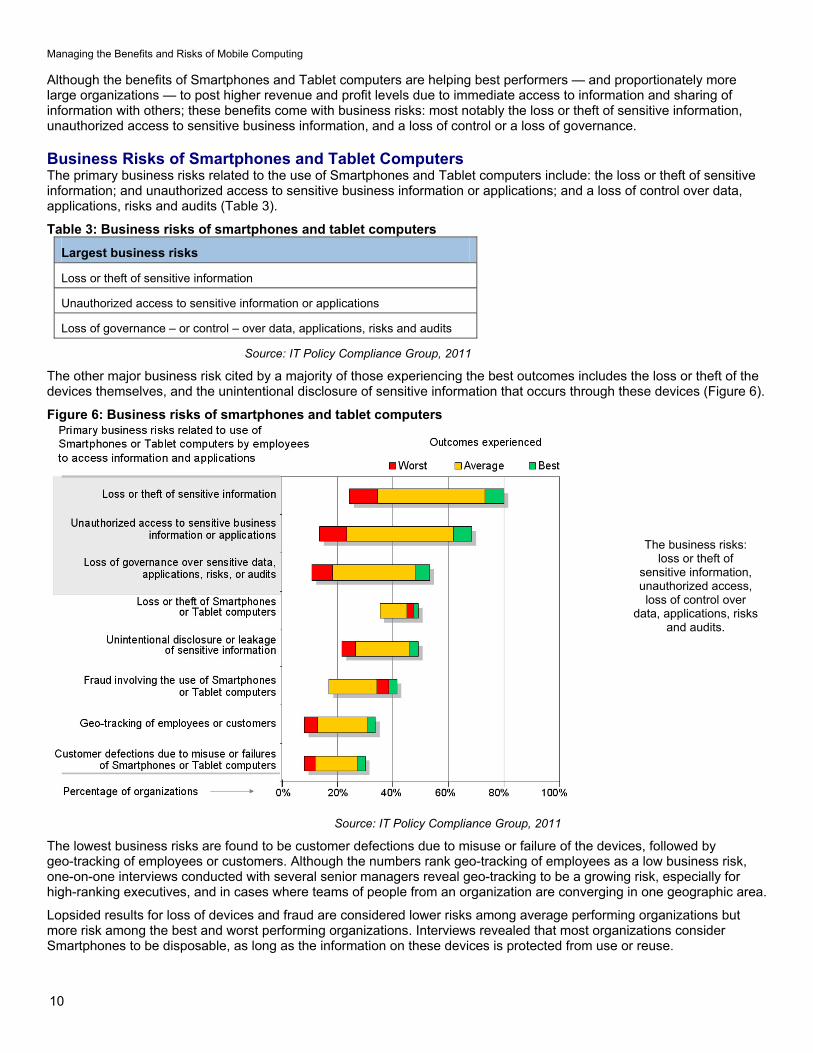
Managing the Benefits and Risks of Mobile Computing
10
Although the benefits of Smartphones and Tablet computers are helping best performers mdash and proportionately more large organizations mdash to post higher revenue and profit levels due to immediate access to information and sharing of information with others these benefits come with business risks most notably the loss or theft of sensitive information unauthorized access to sensitive business information and a loss of control or a loss of governance
Business Risks of Smartphones and Tablet Computers The primary business risks related to the use of Smartphones and Tablet computers include the loss or theft of sensitive information and unauthorized access to sensitive business information or applications and a loss of control over data applications risks and audits (Table 3)
Table 3 Business risks of smartphones and tablet computers
Largest business risks
Loss or theft of sensitive information
Unauthorized access to sensitive information or applications
Loss of governance ndash or control ndash over data applications risks and audits
Source IT Policy Compliance Group 2011
The other major business risk cited by a majority of those experiencing the best outcomes includes the loss or theft of the devices themselves and the unintentional disclosure of sensitive information that occurs through these devices (Figure 6)
Figure 6 Business risks of smartphones and tablet computers
The business risks loss or theft of
sensitive information unauthorized access loss of control over
data applications risks and audits
Source IT Policy Compliance Group 2011
The lowest business risks are found to be customer defections due to misuse or failure of the devices followed by geo-tracking of employees or customers Although the numbers rank geo-tracking of employees as a low business risk one-on-one interviews conducted with several senior managers reveal geo-tracking to be a growing risk especially for high-ranking executives and in cases where teams of people from an organization are converging in one geographic area
Lopsided results for loss of devices and fraud are considered lower risks among average performing organizations but more risk among the best and worst performing organizations Interviews revealed that most organizations consider Smartphones to be disposable as long as the information on these devices is protected from use or reuse
Managing the Benefits and Risks of Mobile Computing
11
Larger organizations tend to focus more on the impacts the devices have on customer loyalty repeat business revenue and profitability These are larger concerns in banking retail and transportation industries where entirely new mobile device Apps is being used by customers of firms in these industries
In addition to the business risks the research findings reveal very significant differences in policies and practices being implemented by organizations covering a range of activities including who owns mobile devices whether employees are encouraged or allowed to use their own devices and whether IT manages Smartphones and Tablet computers
Policies and Practices Governing Mobile Device Use in the Workplace The dominant polices and practices governing the use of mobile devices differ considerably with those experiencing best and average outcomes exhibiting more similar policies and practices Among the best and average performers IT is in charge of managing all devices employee owned or not (Table 4)
Table 4 Polices and practices
Outcomes Smartphones Tablet computers
Worst Use of mobile devices is unknown Employees use their own devices
Average IT manages employee-owned devices IT manages company-issued devices
Best IT manages employee-owned devices IT manages company-issued devices
Source IT Policy Compliance Group 2011
Among the worst performers the dominant culture is one where the use of mobile devices is largely unknown unregistered or unreported and employees are allowed to use their own devices
Among average and best performers the dominant policies and practices are very different IT manages the devices while employees are allowed to use their own Smartphones employees must use company-supplied Tablet computers (Figure 7)
Figure 7 Polices and practices
Source IT Policy Compliance Group 2011
Where IT is involved in managing Smartphones and Tablet computers better and best outcomes are more predominant whereas when IT is not managing mobile devices the predominant outcomes are worse and worst
Of the almost 4-in-10 organizations where employees use Tablet computers to access information and applications at work about one-third (33 percent) furnish and provision Tablet computers for employees slightly less than 40 percent allow employees to bring and use their own Smartphones to work and another 30 percent simply do not know how many Tablet computers are being used by employees
Worse results occur among organizations that do not know how many Smartphones are being used In addition several operational challenges are found to be directly related to more mdash or less mdash business risk related to the use of these Mobile devices
Managing the Benefits and Risks of Mobile Computing
12
Operational Challenges Contributing to Business Risks The primary operational challenges contributing to increased business risk from the use of Smartphones and Tablet computers include a) malicious software that can shut down or take-over mobiles devices b) ineffective vulnerability configuration and penetration testing for mobile devices c) an inability to detect or prevent rogue applications from operating on mobile devices and d) an inability to wipe-clean or lock stolen devices (Table 5)
Table 5 Operational challenges
Outcomes Primary operational challenges
Worst Inability to wipe or lock stolen devices
Average Malicious software
Vulnerability configuration penetration testing
Rogue applications
Best Malicious software
Vulnerability configuration penetration testing
Rogue applications
Inability to wipe or lock stolen devices
Source IT Policy Compliance Group 2011
Malicious software is ranked by 8-in-10 organizations as the factor most contributing to business risk After this ineffective practices for managing vulnerabilities configurations and penetration tests and an inability to detect or prevent rogue applications are rated most highly as contributing to increased business risk from the use of mobile devices (Figure 8)
Figure 8 Operational challenges
Operational challenges malicious software vulnerability
scanning configuration testing pen-testing
rogue software wipe or lock stolenlost
devices patching and remediation
Source IT Policy Compliance Group 2011
Detecting mobile devices and wiping data or locking stolen devices are ranked very highly by worst and best performing organizations and ranked much less highly as an operational challenge resulting in elevated business risks among average performing organizations
The lopsided difference is especially evident for the inability to wipe sensitive information or lock lost or stolen devices this is a challenge for 25 percent of the worst of the average performers whereas it a challenge leading to increased business risk by 50 percent of the best performers and nearly 60 percent of the worst performers
Managing the Benefits and Risks of Mobile Computing
13
In addition to operational challenges contributing to elevated business risks the benchmarks also identify legal and regulatory challenges that are contributing to increased business risk Often called a binary problem mdash you adhere to and report on a specific regulation or not mdash the findings reveal the challenges are larger than concerns about failing to comply with a single regulatory mandate or legal ruling
Legal and Regulatory Challenges Contributing to Business Risks The legal and regulatory challenges contributing to business risks from the use of Smartphones and Tablet computers include a) an inability to conduct information security audits and b) exposure to civil or criminal action due to inadequate due-care findings (Table 6)
Table 6 Legal and regulatory challenges
Outcomes Primary operational challenges
Worst Inability to comply with cross-border data privacy mandates
Average Inability to conduct information security audits
Exposure to civilcriminal actions due to inadequate due-care
Best Inability to conduct information security audits
Exposure to civilcriminal actions due to inadequate due-care
Inability to comply with cross-border data privacy mandates
Loss of ownership of data due to differences in jurisdictions
Source IT Policy Compliance Group 2011
After these two the primary challenges include an inability to comply with cross-border data privacy regulations or law loss of ownership of data due to differences in legal jurisdictions and an inability to deliver forensics information for investigations (Figure 9)
Figure 9 Legal and regulatory challenges
Legal and regulatory challenges information
security audits inadequate due-care
cross-border data privacy loss of
ownership over data
Source IT Policy Compliance Group 2011
Complying with cross-border data privacy regulations are challenges for worst and best performers but less of a challenge among average performing companies
Managing the Benefits and Risks of Mobile Computing
14
Organizations do not willingly engage in behavior whose risks are large enough to outweigh benefits Not as stark as a ldquoflight or fightrdquo reaction the primary action being taken to manage the risks of using Smartphones and Tablet computers reveal much about the outcomes organizations are experiencing
Action Taken to Manage the Risks The primary action taken to manage the risks of using mobile devices is to simply limit the number of employees who can use the devices mdash Smartphones and Tablet computers mdash to access applications and information in the workplace This action is shared by those with the best and average outcomes about 8-in-10 organizations However the primary action being taken by the worst performers is to ignore or discount the risk posed to the business from the use of these mobile devices (Table 7)
Table 7 Actions taken to manage the risks
Outcome Primary action taken to manage the risks
Worst Ignore or discount business risks associated with use of mobile devices
Average Limit the use of mobile devices to specific employees
Best Limit the use of mobile devices to specific employees
Source IT Policy Compliance Group 2011
In contrast the worst performers are not purposely limiting the use of mobile devices to specific employees rather these firms are ignoring or discounting the business risks or are trying to cover the business risks with existing or new insurance contracts
Fewer average better or best performing organizations are limiting the use of these devices and are ignoring or discounting the business risks involved (Figure 10)
Figure 10 Actions taken to manage the risks
Action taken to manage the risks limit number of employees that are allowed to use Smartphones or Tablet
computers in the workplace
Source IT Policy Compliance Group 2011
Limiting the use of mobile devices is a double-edged sword because the benefits tangible benefits include increases in revenue and profitability Although not tracked in these studies research from complementary longitudinal and non-longitudinal studies indicate that customer satisfaction and retention rates are also higher among the best performers The core issue for most organizations is the tradeoff between benefits and risks The obvious issue for most organizations is finding an optimal balance or tradeoff between risks and benefits
Managing the Benefits and Risks of Mobile Computing
15
Limiting the Number of Employees Who Use Mobile Devices Despite the benefits of using mobile devices the business risks are purposely keeping low the number of employees using these mobile devices in the workplace The number of employees using Smartphones to access information and applications is a rather low 3-in-10 people (33 percent) despite the high 8-in-10 (79 percent) number of organizations using these devices Similarly the average number of employees using Tablet computers to access information and applications is just 1-in-5 people (22 percent) among the 35 percent of organizations using these devices (Figure 11)
Figure 11 Use of mobile devices by employees
It is the use of Smartphones by
employees that are being artificially
restricted because of the business risks
Source IT Policy Compliance Group 2011
The use of mobile Smartphones is being artificially limited by organizations due to the risks involved Whether it is the simple visual depiction contained in Figure 11 or the ratio of employees to organizations using the devices or the range of employees using the devices it is clear that it is the use of Smartphones by employees to access information and applications that are being artificially restricted (Table 8)
Table 8 Use of mobile devices by employees
Employee use for 65 of
organizations
Employee use for 95 of
organizations
Ratio of employee use to organization use
Smartphones 31 to 36 29 to 38 42
Tablet computers 18 to 27 14 to 31 63
Source IT Policy Compliance Group 2011
Thus the calculus of determining who uses and who does not use Smartphones to access information and applications at an organization is as much a determination of business need and value as much as it is an evaluation of business risk
As part of the research the Group delved into additional practices organizations implement to see if there are other factors responsible for better mdash or worse mdash outcomes associated with the use of Mobile devices
Managing the Benefits and Risks of Mobile Computing
16
Practices that Determine Outcomes The primary practices being implemented to manage business risks for the employees who are using Smartphones and Tablet computers include limiting access to sensitive information or applications geo-tracking and locating lost or stolen devices protecting and backing-up information from mobile devices wiping sensitive information from stolen or lost mobile devices preventingrecording unauthorized logins from mobile devices delivering security-awareness training to employees who use mobile devices and prohibiting access to Apps-markets Apps-sites and custom ROMs on mobile devices (Table 9)
Table 9 Practices implemented to manage the risks
Priority Practices determining outcomes
1 Limit access to sensitive information and applications
2 Geo-track devices to aid in recovery or destruction of information
3 Protect and backup information from devices
4 Wipe stolen or lost devices of information and credentials
5 Prevent and record unauthorized logon attempts
6 Deliver and measure policy and security awareness training for users
7 Prohibit custom ROMs for rooted devices and access to App-markets
Source IT Policy Compliance Group 2011
As the research uncovered the range of practices implemented to manage business risks are directly related to outcomes Far more of the best performing organizations have more employees using these devices are spending more on information security and are more likely to be implementing most of these practices The reverse was also found to be true the worst performers are simply not implementing the practices or are implementing a few rather than all (Figure 12)
Figure 12 Practices implemented to manage the risks
Practices that determine outcomes
limit access geo-track devices protect and backup data wipe
devices that are lost or stolen prevent
unauthorized logons deliver training no
ROMs or App-markets
Source IT Policy Compliance Group 2011
Managing the Benefits and Risks of Mobile Computing
17
Controls Used to Manage Risks Controls are used in business to assist with the execution of business strategy to manage business outcomes and to manage risk In the case of managing risks related to the use of mobile devices to access information and applications the controls employed by the best performers include using antivirus andor anti-malware scans of the devices encrypting sensitive information on the devices preventing unauthorized people and devices from accessing sensitive information and applications patching mobile device systems-level software where possible and testing configurations of the devices (Table 10)
Table 10 Controls used to manage risks
Priority Controls used to manage the risks
1 Use anti-virus and anti-malware
2 Protect sensitive information on devices with encryption
3 Prevent unauthorized devices and people from accessing informationapplications
4 Patch systems software on devices where possible
5 Test configurations and settings on devices
Source IT Policy Compliance Group 2011
Of the controls tested by the research the one implemented by a clear majority of the best performers is the use of anti-virus andor anti-malware scans The least commonly implemented control among these best performers is the use of virtual private networking (VPN) although interviews revealed many respondents were using some form of VPN with Smartphones in the workplace
In contrast several controls are either not implemented or are less likely implemented by the worst performers These include the scanning of ROMs on mobile devices scanning of vulnerabilities on mobile devices conducting penetration tests on mobile devices patching systems-level software where possible and using virtual private networking (Figure 13)
Figure 13 Controls used to manage risks
Controls to use anti-virusanti-malware encryption checks and limits on unauthorized
devicespeople patches and
configuration testing
Source IT Policy Compliance Group 2011
Managing the Benefits and Risks of Mobile Computing
18
Interestingly the biggest complaint the Group found in the interviews was due to ldquothe lack of patches to update the Android operating systemrdquo For this reason alone we found that many organizations had developed a ldquono Androidrdquo policy or told its users that Android phones could no longer be used Another practice found to significantly impact outcomes is how frequently organizations conduct assessments
Consistency of Assessments and Reporting The rate at which controls to manage risks are monitored assessed and reported on is directly related to outcomes For example the findings reveal significant differences from annual to monthly rates with those conducting less frequent assessments being among the majority of the worst performers and those with the most frequent assessments being among the best performers (Table 11)
Table 11 Rate of assessment and reporting
Outcome Average rate of assessment and reporting
Worst Once every twelve months
Average Once every four-to-five months
Best Once every month or less
Source IT Policy Compliance Group 2011
Mirroring findings in related research the rate at which controls are monitored assessed and compared against a range of conditions including policies prioritized risks threats gold-standards regulatory requirements and internal configuration baselines among others defines
1) When organizations find gaps in controls and procedures
2) Whether risks are larger than expected
3) Whether organizations are able to take appropriate action
4) Whether organizations are able to reduce business risks
When looked at from the perspective of size the research reveals many organizations may not have the tools to automate such assessments or are simply choosing to conduct annual audit review assessments rather than ongoing business risk assessments (Figure 14)
Figure 14 Rate of assessment and reporting
The best performers consistently assess
and report on controls and risks more
frequently
Source IT Policy Compliance Group 2011
Managing the Benefits and Risks of Mobile Computing
19
In addition to the rate of assessment and reporting another defining practice responsible for outcomes is found to be spending on information security by organizations
Spend on Information Security and Outcomes Worst performers are spending 60 percent less than average while the best performers are spending 60 percent more than average performers (Table 12)
Table 12 Spend on information security
Outcome Relative spend on information security compared with average performers
Worst 04
Average 10
Best 16
Source IT Policy Compliance Group 2011
In addition to the relative difference in spend on information security there are large differences in the percentage of the IT budget spent on information security While the range of spend among the worst is from zero to slightly more than 5 of the IT budget the average spent by the worst is less than three percent In contrast average performers spend 75 percent and best performers are spending 12 percent on average (Figure 15)
Figure 15 Spend on information security
The best performers spend a larger
percentage of a larger IT budget on
information security
Source IT Policy Compliance Group 2011
The amount spent is more revealing when considering the actual IT budgets IT budgets among worst performers is just 30 percent of what average performers spend on IT while the amount spent on IT by the best performers is more than 30 percent higher than the average performers
Thus smaller percentages of much smaller annual IT budgets are characteristic of spending on information security by the worst performers while larger percentages of much larger annual IT budgets are characteristic of spending on information security by the best performers
Spending on information security among some of the worst performers actually bottomed-out during the latter half of 2011 When combined with no controls on mobile devices and a culture that is ignoring or discounting the business risks related to the use of Mobile devices it is possible that 2012 could be a year with some negative brand-wrecking events for some of these organizations The best performers will be happy to have positioned themselves differently
Managing the Benefits and Risks of Mobile Computing
20
Back to the Future Is the adoption of Mobile computing a repeat of what occurred in the 1980s Back then it was connecting PCs via local networks to provide office workers with access to information that could be analyzed and acted on in local work groups Today it is about wirelessly interconnecting Mobile devices enabling anyone to share and act on information from any location If today is any indication of what happened in the 1980s then the use of these new powerful pocket-sized but supercharged Mobile devices is likely to change to shape of computing as we know it today
The use of Smartphones by 8-in-10 organizations could likely grow And the use of these devices by employees artificially restricted to 33 percent for now will likely grow as management systems and security controls become more standardized
But we are in a high-growth expansionary phase where Phone manufacturers and carriers are incented to cannibalize products they shipped just last year or as recently as last month leaving consumers employees and organizations with devices that are out of date and may never be updated with systems-level software that would otherwise cure security vulnerabilities
Unfortunately there is no standard Android phone unless you purchase a Google Nexus phone which will be updated by Google directly But the majority of Android phones purchased by consumers and employees are not stock Google Android phones Instead the vast majority of Android phones are overlaid by supplier goo-gads carrier changes along with unexpected and unwanted mdash Carrier IQ mdash additions The carriers and phone manufacturers are incented by the sale of new hardware bling and new service contracts
Encouraged by Google and the profit margins from the latest hardware bling and service contracts the carriers and phone manufacturers continue to develop their own versions of Android What the carriers and phone manufacturers are not incented to do is to deploy software updates to the Android operating system to their customers and so they donrsquot Instead they find it less expensive to lure their customers into an upgrade to a new device on contract two years later
There are more stable and routinely updated
operating systems shipping with
Smartphones from Applersquos iOS RIMrsquos
Blackberry and Windows phone
Eventually these problems and others may resolve themselves but it could be another few years mdash or more mdash of frustration before anything resembling stability in the Android operating system is common and enterprise-ready management tools and security controls are available for these new wonders of the information age
In the meantime there are much more stable mdash and routinely updated mdash operating systems shipping with Smartphones from Applersquos iOS RIMrsquos Blackberry and Windows phone None of these suffer the same problems afflicting Android phones
Whatever you do remember the lessons about what worked mdash and what didnrsquot mdash with earlier generational-changes such as the advent of PCs or the dawn of Internet-computing This longer-term perspective and the lessons will come in handy in formulating strategy and tactics as the use of Mobile computing expands in your workplace
Summary Observations Based on the outcomes being achieved by the best performing organizations
The business benefits of using Smartphones and Tablet computers include
Improved access to business information from any location
Improved customer retention and satisfaction levels and
Higher levels of revenue and profitability when compared with peers
The business risks of using mobile computing devices include
Loss or theft of sensitive information
Unauthorized access to information and applications
Loss of governance or control over sensitive business information business applications business risks and audits
Managing the Benefits and Risks of Mobile Computing
21
The primary information and applications currently being used with mobile devices include
Email and collaborative applications
Office productivity applications
Sales force automation applications
The primary actions to take to limit business risks include
Limit the use of Smartphones in the workplace to specifically approved employees
Fewer than 50 percent of employees currently use Smartphonersquos among the best performers
Policies and practices to implement include
Have IT manage all Tablet computers and Smartphones
Allow approved employees to use their own Smartphones
Furnish Tablet computers to employees
Considerations to evaluate include
Mobile devices are another part of the requirements of your information security audits
Compare your due-care requirements to defend against legal inquiry
Identify your cross-border data privacy and ownership requirements
Practices to implement include
Limit the use of Smartphones to access information and applications to approved employees
Limit access to sensitive information and applications for mobile devices
Geo-track devices especially Smartphones
Prohibit the use of custom ROMs and unapproved App-marketssites
Deliver security awareness training and measure effectiveness with employees
Scan mobile devices with anti-virus and anti-malware
Protect and backup information on the devices
Wipe and lock stolen and lost devices as soon as notified by employees
Investigate the availability of patching as part of device evaluations
Use frequent controls and configuration testing to reduce gaps and limit risks
Increase spend on information security beyond your peers
Managing the Benefits and Risks of Mobile Computing
22
Appendix Expected Changes in Device Use in the Workplace 2011 to 2013 Respondents were asked to identify changes that are most likely going to occur in organizational and employee uses of Smartphones and Tablet computers between 2011 and 2013 As projections these forecasts of user and organizational expectations are reflections of current sentiment
The use of Smartphones by organizations is expected to remain the same between 2011 and 2013 at 79 percent of all organizations However the use of Smartphones to access information and applications by employees is expected to increase from 33 percent to 39 percent (Table 13)
Table 13 Device use 2011 to 2013
Device being used Use by organizationsemployees
2011 2013 Change in use
Organizational use 79 79 -0- Smartphones
Employee use 33 39 6 increase
Organizational use 35 49 14 increase Tablet computers
Employee use 22 32 10 increase
Source IT Policy Compliance Group 2011
Unlike Smartphones the use of Tablet computers is expected to increase for organizations and employees from an average rate of 35 percent to 49 percent for organizations and from 22 to 32 for employees The increases are larger than the sample error of seven percent
After an increase in employees using both devices what is rather intriguing is an expected downtrend in the use of Smartphones among organizations with the best outcomes The decline in the use of Smartphones among best performers is expected to be from 85 percent to 73 percent mdash a decrease of 12 percent mdash from 2011 to 2013 (Figure 16)
Figure 16 Expected changes in device use
Source IT Policy Compliance Group 2011
The explanation for the overall rate of decline of Smartphone use among best performing organization can be found from declines in the uses of iPhone and Windows Phone platforms and much more significant declines in the use of Android and Blackberry phones
At the time the research was being carried out RIM was suffering from blackouts in its services around the World with rolling service-outages that occurred across multiple continents during a one-week period The general consensus of many people we spoke with at the time was the service-outages ldquoare the final event I need to make the switch when my subscription period is duerdquo On the other hand others simply replaced their Blackberry devices that week and did not wait until their subscription was due for renewal
Unlike the RIM Blackberry platforms we found consistently strong disaffection with Android devices due to the inability to obtain updates for the Android operating system without having to root devices and hope for the best using custom ROMs
Managing the Benefits and Risks of Mobile Computing
23
These problems left many saying things like ldquoI bought a pig in a poke never againrdquo Others took matters into their own hands rooted their phones and installed updated versions of Android over the Internet from a number of different development sites none of which were blessed by carriers phone manufacturers or their IT staff
IT managers the Group spoke with identified an utter lack of management tools for Android devices too many versions of Android and a complete lack of vulnerability testing for the devices The inability to update and cure security-problems were just some of the problems identified by IT managers the Group spoke with The upshot for many were two common reactions to the use of Android in the enterprise 1) if it was already deployed the common reaction was to pull back support for Android and convert to other supported Smartphones and 2) if Android was not already deployed wait for Android to become enterprise-ready (Table 14)
Table 14 Reaction to Android phones in the workplace
Status of Android Smartphones
Reaction
Already deployed Pull-back and convert to other Smartphones
If not already deployed Wait for Android to become enterprise-ready
Source IT Policy Compliance Group 2011
When it comes to Tablet computers the sentiment about expected changes in use of different platforms reveals Android Tablet computers likely to see the biggest gains between now and 2013 followed by healthy gains in the use of other Tablet computers The only sentiment indicating significant declines appear to be related to Android and Blackberry Smartphones (Figure 17)
Figure 17 Expected changes in platform use
Source IT Policy Compliance Group 2011
The outlook of current sentiment regarding use of different platforms by 2013 clearly indicates the best performers are predisposed to ditch Android and Blackberry phones and significantly increase the use of iPad Tablet computers
By contrast the worst performers are predisposed to increase use of Smartphones and Tablet computers across the board and with the exception of Blackberry phones increase other mobile device platforms among average performers
Managing the Benefits and Risks of Mobile Computing
24
Additional Resources Numerous sources of related information are available for those interested in pursuing more information on a wide range of topics related to Smartphones and Tablet computers The following are but a small sample of related information perspectives and insight The authors of these articles have no relationship with the ITPCG Android Security See httpdeveloperandroidcomguidetopicssecuritysecurityhtml Android Orphans Visualizing a Sad History of Support See httptheunderstatementcompost11982112928android-orphans-visualizing-a-sad-history-of-support A Look into Mobile Device Security httpwwwsymanteccomcontentenusaboutmediapdfssymc_mobile_device_security_june2011pdfom_ext_cid=biz_socmed_twitter_facebook_marketwire_linkedin_2011Jun_worldwide_mobilesecuritywp Carrier IQ what it is what it isnrsquot and what you need to do httpwwwengadgetcom20111201carrier-iq-what-it-is-what-it-isnt-and-what-you-need-to CIS Apple iOS configuration benchmarks httpbenchmarkscisecurityorgen-usroute=downloadsbrowsecategorybenchmarksmobileiphone Current Android Malware httpforensicsspreitzenbarthdepage_id=254 DISA STIGs for Smartphones - unclassified httpiasedisamilstigsnet_perimeterwirelesssmartphonehtml iOS Hardening Configuration Guide Department of Defence Intelligence and Security Australian Government httpwwwdsdgovaupublicationsiOS_Hardening_Guidepdf Mac OS X and iOS Security httpdeveloperapplecomlibrarymacdocumentationSecurityConceptualSecurity_OverviewArchitectureArchitecturehtmlapple_refdocuidTP30000976-CH202-TPXREF101 Mobile Malware Why Fraudsters are Two Steps Ahead httpwwwtrusteercomblogmobile-malware-why-fraudsters-are-two-steps-ahead Rootkit called Carrier IQ discovered phoning home with user data httpwwwzdnetcomblogapplerootkit-called-carrier-iq-discovered-phoning-home-with-user-data11792 RIM launches Blackberry Fusion to Secure Android and Apple devices httpbusinessfinancialpostcom20111129rim-launching-blackberry-mobile-fusion-to-secure-iphone-android-devices Smartphone Security httpwwwenisaeuropaeuactapplication-securitysmartphone-security-1 The Spy Files Map httpwikileaksorgThe-Spyfiles-The-Maphtml Ten Steps to Secure Your Mobile Devices httpswikiinternet2educonfluencedisplayitsg2Mobile+Device+Security
Why Your Phone is Insecure by Design httpwwwforbescomsitesandygreenberg20110812codebreaker-karsten-nohl-why-your-phone-is-insecure-by-design
Managing the Benefits and Risks of Mobile Computing
25
About the Research Topics researched by the IT Policy Compliance Group (IT PCG) are part of an ongoing calendar established in consultation with Advisory General and Charter members of the Group as well as from findings compiled from ongoing research In addition to specific tracking questions common to each benchmark the research is designed to uncover the relationship between business results outcomes being experienced by organizations actions taken practices implemented and capabilities organizations use to respond
The qualitative research findings presented in this report are from numerous focus groups one-on-one interviews and meetings held with larger audiences throughout 2011 The quantitative findings contained in this report are from primary research studies conducted with 210 organizations in North America during late 2011
The maximum error for the sample findings for the benchmark findings contained in this report is +- seven percent The primary focus of analysis contained in this report is to present the largest differences between the outcomes experienced and similarly aligned findings that are most responsible for the differences in outcomes Instead of relying on differences that are within or close to the sample errors the effort has been to focus on the largest differences For example instead of focusing on differences involving +- 10 percent the findings covered in this report tend to focus on the largest differences in the range of 50 percent or more
The findings covering the use of Mobile computing are representative of organizations in North America and cannot be construed or inferred to represent current usage or plans for Mobile computing outside of North America However the findings covering the performance outcomes benefits and risks of Mobile computing the practices to manage the business risks and the controls to manage the risks match findings from similar studies covering other geographies outside of North America including findings from Latin America South America Europe Africa the Middle East Asia and Oceania
Industries represented The quantitative research includes representation from the following industries advertising accounting services aerospace agriculture apparel architecture automotive banking chemicals computer equipment and peripherals computer software and services construction consumer durable goods distribution education engineering services entertainment financial services food and beverage government (local state and federal level public administration) government (defense and intelligence) health medical and dental services insurance law enforcement management services media scientific and consulting services manufacturing pharmaceuticals public relations publishing real estate rental and leasing services retail trade telecommunications equipment telecommunication services transportation warehousing travel accommodation and hospitality services utilities waste management and wholesale trade Five industries represent 47 percent of the sample These include Banking Education Financial and Accounting Services Manufacturing and Retail Trade Another 27 industries represent the other 53 percent of the sample none of which represents more than five percent of the sample
Revenue or agency budgets of participating organizations Size of the organizations participating in the most recent benchmarks is somewhat evenly distributed although slightly fewer represent midsize organizations Thirty-six percent of the organizations represented by the findings have annual revenues or agency budgets that are less than $50 million Another twenty-nine percent of the sample has annual revenues or agency budgets between $50 million and $999 million The remaining thirty-five percent of the sample has annual revenues or agency budgets that are $1 billion or more
Functional areas of responsibility Thirty-five percent of the qualified participants for the benchmark work in IT with another 30 percent work in finance or internal controls The remaining 35 percent of the qualified participants work in a wide variety of functions from business line management senior management product design and development legal compliance sales marketing procurement logistics and customer services among other functions
Job titles of participants Thirty-five percent of the participants in the benchmark are senior managers with titles that include CEO CIO CFO or Vice president Thirty-eight percent are managers or directors and twenty-seven percent are staff in their organizations
Managing the Benefits and Risks of Mobile Computing
About IT Policy Compliance Group The mission of the IT Policy Compliance Group is to promote actionable findings based on evidence to assist organizations with delivering more value less risk and achieve IT policy and compliance objectives related to the use of information systems The Group Web site at wwwitpolicycompliancecom features quick two-minute self-assessments to compare outcomes and practices against onersquos industry peers and best performing organizations research reports continuing professional education conferences and seminars member and knowledge centers related research from around the World and resources including standards and frameworks associations government and regulators
The Grouprsquos research is designed to help IT risk legal financial and internal audit professionals to
Benchmark results and efforts against peers and best-in-class performers
Identify key drivers challenges and responses to improve results
Determine the applicability and use of specific capabilities to improve results
Identify best practices based on results and experience of peers
The Group relies upon its members and advisors for its research and editorial calendar
IT Policy Compliance Group Charter Members
The Institute of Symantec Corporation Internal Auditors ISACA 350 Ellis Street 247 Maitland Avenue 3701 Algonquin Road Suite 1010 Mountain View CA 94043 Altamonte Springs FL 32701 Rolling Meadows IL 60008 +1 (650) 527 8000 +1 (407) 937 1100 +1 (847) 253 1545 wwwsymanteccom wwwtheiiaorg wwwisacaorg infosymanteccom iiatheiiaorg infoisacaorg
Computer Security Institute Protiviti IT Governance Institute 600 Harrison Street New York Office 3701 Algonquin Road Suite 1010 San Francisco CA 94107 1290 Avenue of the Rolling Meadows IL 60008 +1 (415) 947 6320 Americas 5th Floor +1 (847) 660 5600 wwwgocsicom New York New York 10104 wwwitgiorg csicmpcom +1 (212) 603 8300 infoitgiorg wwwprotiviticom infoprotiviticom
IT Policy Compliance Group Affiliate Members and Advisors A current list of Affiliate Members and Advisors to the Group can be found on the IT Policy Compliance Group website
26
Founded in 2005 the IT Policy Compliance Group conducts benchmark research focused on delivering fact-based guidance on the steps that can be taken to improve results Benchmark results are reported through wwwitpolicycompliancecom for the benefit of members
IT Policy Compliance Group
Contacts Managing Director Jim Hurley Telephone +1 (216) 373 7010 jhurleyitpolicycompliancecom Managing Editor John Ortbal Telephone +1 (847) 444 0344 jortbalitpolicycompliancecom wwwitpolicycompliancecom
December 2011
The information contained in this publication has been obtained from sources that the IT Policy Compliance Group believes to be reliable but is not guaranteed Research publications reflect current conditions that are subject to change without notice
Copyright copy 2011 IT Policy Compliance Group Names and logos may be trademarks of their respective owners All rights reserved 1211 293167003
32
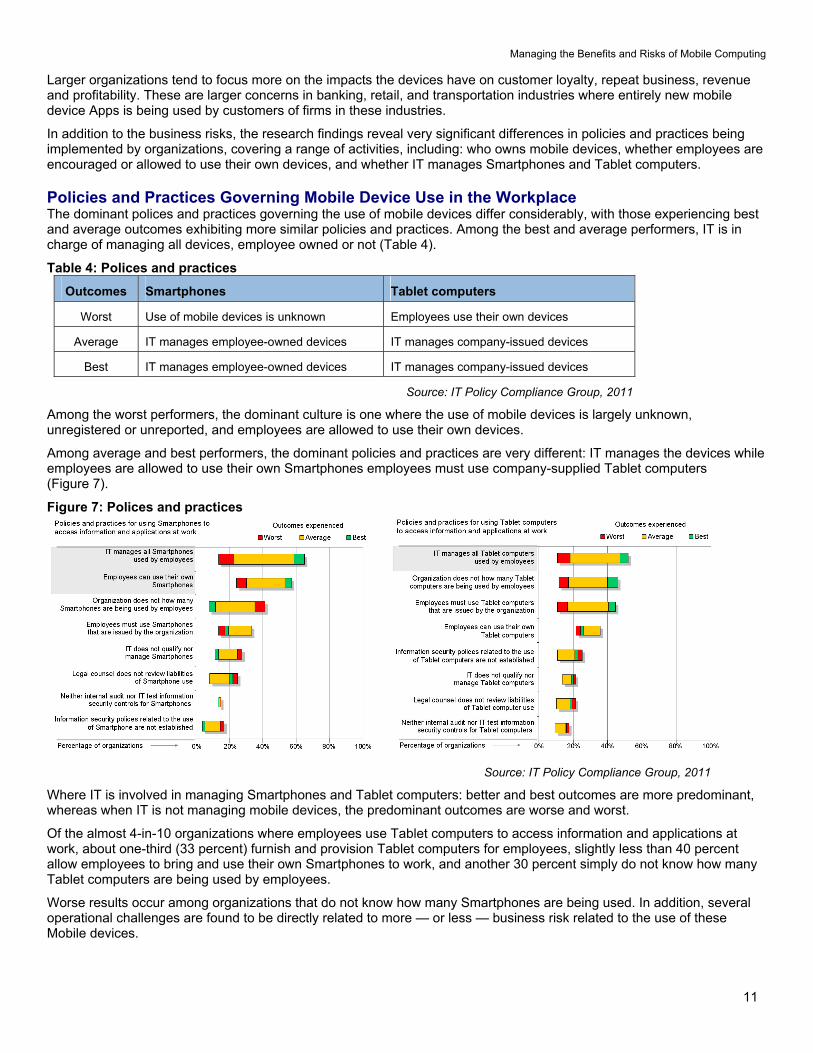
Managing the Benefits and Risks of Mobile Computing
11
Larger organizations tend to focus more on the impacts the devices have on customer loyalty repeat business revenue and profitability These are larger concerns in banking retail and transportation industries where entirely new mobile device Apps is being used by customers of firms in these industries
In addition to the business risks the research findings reveal very significant differences in policies and practices being implemented by organizations covering a range of activities including who owns mobile devices whether employees are encouraged or allowed to use their own devices and whether IT manages Smartphones and Tablet computers
Policies and Practices Governing Mobile Device Use in the Workplace The dominant polices and practices governing the use of mobile devices differ considerably with those experiencing best and average outcomes exhibiting more similar policies and practices Among the best and average performers IT is in charge of managing all devices employee owned or not (Table 4)
Table 4 Polices and practices
Outcomes Smartphones Tablet computers
Worst Use of mobile devices is unknown Employees use their own devices
Average IT manages employee-owned devices IT manages company-issued devices
Best IT manages employee-owned devices IT manages company-issued devices
Source IT Policy Compliance Group 2011
Among the worst performers the dominant culture is one where the use of mobile devices is largely unknown unregistered or unreported and employees are allowed to use their own devices
Among average and best performers the dominant policies and practices are very different IT manages the devices while employees are allowed to use their own Smartphones employees must use company-supplied Tablet computers (Figure 7)
Figure 7 Polices and practices
Source IT Policy Compliance Group 2011
Where IT is involved in managing Smartphones and Tablet computers better and best outcomes are more predominant whereas when IT is not managing mobile devices the predominant outcomes are worse and worst
Of the almost 4-in-10 organizations where employees use Tablet computers to access information and applications at work about one-third (33 percent) furnish and provision Tablet computers for employees slightly less than 40 percent allow employees to bring and use their own Smartphones to work and another 30 percent simply do not know how many Tablet computers are being used by employees
Worse results occur among organizations that do not know how many Smartphones are being used In addition several operational challenges are found to be directly related to more mdash or less mdash business risk related to the use of these Mobile devices
Managing the Benefits and Risks of Mobile Computing
12
Operational Challenges Contributing to Business Risks The primary operational challenges contributing to increased business risk from the use of Smartphones and Tablet computers include a) malicious software that can shut down or take-over mobiles devices b) ineffective vulnerability configuration and penetration testing for mobile devices c) an inability to detect or prevent rogue applications from operating on mobile devices and d) an inability to wipe-clean or lock stolen devices (Table 5)
Table 5 Operational challenges
Outcomes Primary operational challenges
Worst Inability to wipe or lock stolen devices
Average Malicious software
Vulnerability configuration penetration testing
Rogue applications
Best Malicious software
Vulnerability configuration penetration testing
Rogue applications
Inability to wipe or lock stolen devices
Source IT Policy Compliance Group 2011
Malicious software is ranked by 8-in-10 organizations as the factor most contributing to business risk After this ineffective practices for managing vulnerabilities configurations and penetration tests and an inability to detect or prevent rogue applications are rated most highly as contributing to increased business risk from the use of mobile devices (Figure 8)
Figure 8 Operational challenges
Operational challenges malicious software vulnerability
scanning configuration testing pen-testing
rogue software wipe or lock stolenlost
devices patching and remediation
Source IT Policy Compliance Group 2011
Detecting mobile devices and wiping data or locking stolen devices are ranked very highly by worst and best performing organizations and ranked much less highly as an operational challenge resulting in elevated business risks among average performing organizations
The lopsided difference is especially evident for the inability to wipe sensitive information or lock lost or stolen devices this is a challenge for 25 percent of the worst of the average performers whereas it a challenge leading to increased business risk by 50 percent of the best performers and nearly 60 percent of the worst performers
Managing the Benefits and Risks of Mobile Computing
13
In addition to operational challenges contributing to elevated business risks the benchmarks also identify legal and regulatory challenges that are contributing to increased business risk Often called a binary problem mdash you adhere to and report on a specific regulation or not mdash the findings reveal the challenges are larger than concerns about failing to comply with a single regulatory mandate or legal ruling
Legal and Regulatory Challenges Contributing to Business Risks The legal and regulatory challenges contributing to business risks from the use of Smartphones and Tablet computers include a) an inability to conduct information security audits and b) exposure to civil or criminal action due to inadequate due-care findings (Table 6)
Table 6 Legal and regulatory challenges
Outcomes Primary operational challenges
Worst Inability to comply with cross-border data privacy mandates
Average Inability to conduct information security audits
Exposure to civilcriminal actions due to inadequate due-care
Best Inability to conduct information security audits
Exposure to civilcriminal actions due to inadequate due-care
Inability to comply with cross-border data privacy mandates
Loss of ownership of data due to differences in jurisdictions
Source IT Policy Compliance Group 2011
After these two the primary challenges include an inability to comply with cross-border data privacy regulations or law loss of ownership of data due to differences in legal jurisdictions and an inability to deliver forensics information for investigations (Figure 9)
Figure 9 Legal and regulatory challenges
Legal and regulatory challenges information
security audits inadequate due-care
cross-border data privacy loss of
ownership over data
Source IT Policy Compliance Group 2011
Complying with cross-border data privacy regulations are challenges for worst and best performers but less of a challenge among average performing companies
Managing the Benefits and Risks of Mobile Computing
14
Organizations do not willingly engage in behavior whose risks are large enough to outweigh benefits Not as stark as a ldquoflight or fightrdquo reaction the primary action being taken to manage the risks of using Smartphones and Tablet computers reveal much about the outcomes organizations are experiencing
Action Taken to Manage the Risks The primary action taken to manage the risks of using mobile devices is to simply limit the number of employees who can use the devices mdash Smartphones and Tablet computers mdash to access applications and information in the workplace This action is shared by those with the best and average outcomes about 8-in-10 organizations However the primary action being taken by the worst performers is to ignore or discount the risk posed to the business from the use of these mobile devices (Table 7)
Table 7 Actions taken to manage the risks
Outcome Primary action taken to manage the risks
Worst Ignore or discount business risks associated with use of mobile devices
Average Limit the use of mobile devices to specific employees
Best Limit the use of mobile devices to specific employees
Source IT Policy Compliance Group 2011
In contrast the worst performers are not purposely limiting the use of mobile devices to specific employees rather these firms are ignoring or discounting the business risks or are trying to cover the business risks with existing or new insurance contracts
Fewer average better or best performing organizations are limiting the use of these devices and are ignoring or discounting the business risks involved (Figure 10)
Figure 10 Actions taken to manage the risks
Action taken to manage the risks limit number of employees that are allowed to use Smartphones or Tablet
computers in the workplace
Source IT Policy Compliance Group 2011
Limiting the use of mobile devices is a double-edged sword because the benefits tangible benefits include increases in revenue and profitability Although not tracked in these studies research from complementary longitudinal and non-longitudinal studies indicate that customer satisfaction and retention rates are also higher among the best performers The core issue for most organizations is the tradeoff between benefits and risks The obvious issue for most organizations is finding an optimal balance or tradeoff between risks and benefits
Managing the Benefits and Risks of Mobile Computing
15
Limiting the Number of Employees Who Use Mobile Devices Despite the benefits of using mobile devices the business risks are purposely keeping low the number of employees using these mobile devices in the workplace The number of employees using Smartphones to access information and applications is a rather low 3-in-10 people (33 percent) despite the high 8-in-10 (79 percent) number of organizations using these devices Similarly the average number of employees using Tablet computers to access information and applications is just 1-in-5 people (22 percent) among the 35 percent of organizations using these devices (Figure 11)
Figure 11 Use of mobile devices by employees
It is the use of Smartphones by
employees that are being artificially
restricted because of the business risks
Source IT Policy Compliance Group 2011
The use of mobile Smartphones is being artificially limited by organizations due to the risks involved Whether it is the simple visual depiction contained in Figure 11 or the ratio of employees to organizations using the devices or the range of employees using the devices it is clear that it is the use of Smartphones by employees to access information and applications that are being artificially restricted (Table 8)
Table 8 Use of mobile devices by employees
Employee use for 65 of
organizations
Employee use for 95 of
organizations
Ratio of employee use to organization use
Smartphones 31 to 36 29 to 38 42
Tablet computers 18 to 27 14 to 31 63
Source IT Policy Compliance Group 2011
Thus the calculus of determining who uses and who does not use Smartphones to access information and applications at an organization is as much a determination of business need and value as much as it is an evaluation of business risk
As part of the research the Group delved into additional practices organizations implement to see if there are other factors responsible for better mdash or worse mdash outcomes associated with the use of Mobile devices
Managing the Benefits and Risks of Mobile Computing
16
Practices that Determine Outcomes The primary practices being implemented to manage business risks for the employees who are using Smartphones and Tablet computers include limiting access to sensitive information or applications geo-tracking and locating lost or stolen devices protecting and backing-up information from mobile devices wiping sensitive information from stolen or lost mobile devices preventingrecording unauthorized logins from mobile devices delivering security-awareness training to employees who use mobile devices and prohibiting access to Apps-markets Apps-sites and custom ROMs on mobile devices (Table 9)
Table 9 Practices implemented to manage the risks
Priority Practices determining outcomes
1 Limit access to sensitive information and applications
2 Geo-track devices to aid in recovery or destruction of information
3 Protect and backup information from devices
4 Wipe stolen or lost devices of information and credentials
5 Prevent and record unauthorized logon attempts
6 Deliver and measure policy and security awareness training for users
7 Prohibit custom ROMs for rooted devices and access to App-markets
Source IT Policy Compliance Group 2011
As the research uncovered the range of practices implemented to manage business risks are directly related to outcomes Far more of the best performing organizations have more employees using these devices are spending more on information security and are more likely to be implementing most of these practices The reverse was also found to be true the worst performers are simply not implementing the practices or are implementing a few rather than all (Figure 12)
Figure 12 Practices implemented to manage the risks
Practices that determine outcomes
limit access geo-track devices protect and backup data wipe
devices that are lost or stolen prevent
unauthorized logons deliver training no
ROMs or App-markets
Source IT Policy Compliance Group 2011
Managing the Benefits and Risks of Mobile Computing
17
Controls Used to Manage Risks Controls are used in business to assist with the execution of business strategy to manage business outcomes and to manage risk In the case of managing risks related to the use of mobile devices to access information and applications the controls employed by the best performers include using antivirus andor anti-malware scans of the devices encrypting sensitive information on the devices preventing unauthorized people and devices from accessing sensitive information and applications patching mobile device systems-level software where possible and testing configurations of the devices (Table 10)
Table 10 Controls used to manage risks
Priority Controls used to manage the risks
1 Use anti-virus and anti-malware
2 Protect sensitive information on devices with encryption
3 Prevent unauthorized devices and people from accessing informationapplications
4 Patch systems software on devices where possible
5 Test configurations and settings on devices
Source IT Policy Compliance Group 2011
Of the controls tested by the research the one implemented by a clear majority of the best performers is the use of anti-virus andor anti-malware scans The least commonly implemented control among these best performers is the use of virtual private networking (VPN) although interviews revealed many respondents were using some form of VPN with Smartphones in the workplace
In contrast several controls are either not implemented or are less likely implemented by the worst performers These include the scanning of ROMs on mobile devices scanning of vulnerabilities on mobile devices conducting penetration tests on mobile devices patching systems-level software where possible and using virtual private networking (Figure 13)
Figure 13 Controls used to manage risks
Controls to use anti-virusanti-malware encryption checks and limits on unauthorized
devicespeople patches and
configuration testing
Source IT Policy Compliance Group 2011
Managing the Benefits and Risks of Mobile Computing
18
Interestingly the biggest complaint the Group found in the interviews was due to ldquothe lack of patches to update the Android operating systemrdquo For this reason alone we found that many organizations had developed a ldquono Androidrdquo policy or told its users that Android phones could no longer be used Another practice found to significantly impact outcomes is how frequently organizations conduct assessments
Consistency of Assessments and Reporting The rate at which controls to manage risks are monitored assessed and reported on is directly related to outcomes For example the findings reveal significant differences from annual to monthly rates with those conducting less frequent assessments being among the majority of the worst performers and those with the most frequent assessments being among the best performers (Table 11)
Table 11 Rate of assessment and reporting
Outcome Average rate of assessment and reporting
Worst Once every twelve months
Average Once every four-to-five months
Best Once every month or less
Source IT Policy Compliance Group 2011
Mirroring findings in related research the rate at which controls are monitored assessed and compared against a range of conditions including policies prioritized risks threats gold-standards regulatory requirements and internal configuration baselines among others defines
1) When organizations find gaps in controls and procedures
2) Whether risks are larger than expected
3) Whether organizations are able to take appropriate action
4) Whether organizations are able to reduce business risks
When looked at from the perspective of size the research reveals many organizations may not have the tools to automate such assessments or are simply choosing to conduct annual audit review assessments rather than ongoing business risk assessments (Figure 14)
Figure 14 Rate of assessment and reporting
The best performers consistently assess
and report on controls and risks more
frequently
Source IT Policy Compliance Group 2011
Managing the Benefits and Risks of Mobile Computing
19
In addition to the rate of assessment and reporting another defining practice responsible for outcomes is found to be spending on information security by organizations
Spend on Information Security and Outcomes Worst performers are spending 60 percent less than average while the best performers are spending 60 percent more than average performers (Table 12)
Table 12 Spend on information security
Outcome Relative spend on information security compared with average performers
Worst 04
Average 10
Best 16
Source IT Policy Compliance Group 2011
In addition to the relative difference in spend on information security there are large differences in the percentage of the IT budget spent on information security While the range of spend among the worst is from zero to slightly more than 5 of the IT budget the average spent by the worst is less than three percent In contrast average performers spend 75 percent and best performers are spending 12 percent on average (Figure 15)
Figure 15 Spend on information security
The best performers spend a larger
percentage of a larger IT budget on
information security
Source IT Policy Compliance Group 2011
The amount spent is more revealing when considering the actual IT budgets IT budgets among worst performers is just 30 percent of what average performers spend on IT while the amount spent on IT by the best performers is more than 30 percent higher than the average performers
Thus smaller percentages of much smaller annual IT budgets are characteristic of spending on information security by the worst performers while larger percentages of much larger annual IT budgets are characteristic of spending on information security by the best performers
Spending on information security among some of the worst performers actually bottomed-out during the latter half of 2011 When combined with no controls on mobile devices and a culture that is ignoring or discounting the business risks related to the use of Mobile devices it is possible that 2012 could be a year with some negative brand-wrecking events for some of these organizations The best performers will be happy to have positioned themselves differently
Managing the Benefits and Risks of Mobile Computing
20
Back to the Future Is the adoption of Mobile computing a repeat of what occurred in the 1980s Back then it was connecting PCs via local networks to provide office workers with access to information that could be analyzed and acted on in local work groups Today it is about wirelessly interconnecting Mobile devices enabling anyone to share and act on information from any location If today is any indication of what happened in the 1980s then the use of these new powerful pocket-sized but supercharged Mobile devices is likely to change to shape of computing as we know it today
The use of Smartphones by 8-in-10 organizations could likely grow And the use of these devices by employees artificially restricted to 33 percent for now will likely grow as management systems and security controls become more standardized
But we are in a high-growth expansionary phase where Phone manufacturers and carriers are incented to cannibalize products they shipped just last year or as recently as last month leaving consumers employees and organizations with devices that are out of date and may never be updated with systems-level software that would otherwise cure security vulnerabilities
Unfortunately there is no standard Android phone unless you purchase a Google Nexus phone which will be updated by Google directly But the majority of Android phones purchased by consumers and employees are not stock Google Android phones Instead the vast majority of Android phones are overlaid by supplier goo-gads carrier changes along with unexpected and unwanted mdash Carrier IQ mdash additions The carriers and phone manufacturers are incented by the sale of new hardware bling and new service contracts
Encouraged by Google and the profit margins from the latest hardware bling and service contracts the carriers and phone manufacturers continue to develop their own versions of Android What the carriers and phone manufacturers are not incented to do is to deploy software updates to the Android operating system to their customers and so they donrsquot Instead they find it less expensive to lure their customers into an upgrade to a new device on contract two years later
There are more stable and routinely updated
operating systems shipping with
Smartphones from Applersquos iOS RIMrsquos
Blackberry and Windows phone
Eventually these problems and others may resolve themselves but it could be another few years mdash or more mdash of frustration before anything resembling stability in the Android operating system is common and enterprise-ready management tools and security controls are available for these new wonders of the information age
In the meantime there are much more stable mdash and routinely updated mdash operating systems shipping with Smartphones from Applersquos iOS RIMrsquos Blackberry and Windows phone None of these suffer the same problems afflicting Android phones
Whatever you do remember the lessons about what worked mdash and what didnrsquot mdash with earlier generational-changes such as the advent of PCs or the dawn of Internet-computing This longer-term perspective and the lessons will come in handy in formulating strategy and tactics as the use of Mobile computing expands in your workplace
Summary Observations Based on the outcomes being achieved by the best performing organizations
The business benefits of using Smartphones and Tablet computers include
Improved access to business information from any location
Improved customer retention and satisfaction levels and
Higher levels of revenue and profitability when compared with peers
The business risks of using mobile computing devices include
Loss or theft of sensitive information
Unauthorized access to information and applications
Loss of governance or control over sensitive business information business applications business risks and audits
Managing the Benefits and Risks of Mobile Computing
21
The primary information and applications currently being used with mobile devices include
Email and collaborative applications
Office productivity applications
Sales force automation applications
The primary actions to take to limit business risks include
Limit the use of Smartphones in the workplace to specifically approved employees
Fewer than 50 percent of employees currently use Smartphonersquos among the best performers
Policies and practices to implement include
Have IT manage all Tablet computers and Smartphones
Allow approved employees to use their own Smartphones
Furnish Tablet computers to employees
Considerations to evaluate include
Mobile devices are another part of the requirements of your information security audits
Compare your due-care requirements to defend against legal inquiry
Identify your cross-border data privacy and ownership requirements
Practices to implement include
Limit the use of Smartphones to access information and applications to approved employees
Limit access to sensitive information and applications for mobile devices
Geo-track devices especially Smartphones
Prohibit the use of custom ROMs and unapproved App-marketssites
Deliver security awareness training and measure effectiveness with employees
Scan mobile devices with anti-virus and anti-malware
Protect and backup information on the devices
Wipe and lock stolen and lost devices as soon as notified by employees
Investigate the availability of patching as part of device evaluations
Use frequent controls and configuration testing to reduce gaps and limit risks
Increase spend on information security beyond your peers
Managing the Benefits and Risks of Mobile Computing
22
Appendix Expected Changes in Device Use in the Workplace 2011 to 2013 Respondents were asked to identify changes that are most likely going to occur in organizational and employee uses of Smartphones and Tablet computers between 2011 and 2013 As projections these forecasts of user and organizational expectations are reflections of current sentiment
The use of Smartphones by organizations is expected to remain the same between 2011 and 2013 at 79 percent of all organizations However the use of Smartphones to access information and applications by employees is expected to increase from 33 percent to 39 percent (Table 13)
Table 13 Device use 2011 to 2013
Device being used Use by organizationsemployees
2011 2013 Change in use
Organizational use 79 79 -0- Smartphones
Employee use 33 39 6 increase
Organizational use 35 49 14 increase Tablet computers
Employee use 22 32 10 increase
Source IT Policy Compliance Group 2011
Unlike Smartphones the use of Tablet computers is expected to increase for organizations and employees from an average rate of 35 percent to 49 percent for organizations and from 22 to 32 for employees The increases are larger than the sample error of seven percent
After an increase in employees using both devices what is rather intriguing is an expected downtrend in the use of Smartphones among organizations with the best outcomes The decline in the use of Smartphones among best performers is expected to be from 85 percent to 73 percent mdash a decrease of 12 percent mdash from 2011 to 2013 (Figure 16)
Figure 16 Expected changes in device use
Source IT Policy Compliance Group 2011
The explanation for the overall rate of decline of Smartphone use among best performing organization can be found from declines in the uses of iPhone and Windows Phone platforms and much more significant declines in the use of Android and Blackberry phones
At the time the research was being carried out RIM was suffering from blackouts in its services around the World with rolling service-outages that occurred across multiple continents during a one-week period The general consensus of many people we spoke with at the time was the service-outages ldquoare the final event I need to make the switch when my subscription period is duerdquo On the other hand others simply replaced their Blackberry devices that week and did not wait until their subscription was due for renewal
Unlike the RIM Blackberry platforms we found consistently strong disaffection with Android devices due to the inability to obtain updates for the Android operating system without having to root devices and hope for the best using custom ROMs
Managing the Benefits and Risks of Mobile Computing
23
These problems left many saying things like ldquoI bought a pig in a poke never againrdquo Others took matters into their own hands rooted their phones and installed updated versions of Android over the Internet from a number of different development sites none of which were blessed by carriers phone manufacturers or their IT staff
IT managers the Group spoke with identified an utter lack of management tools for Android devices too many versions of Android and a complete lack of vulnerability testing for the devices The inability to update and cure security-problems were just some of the problems identified by IT managers the Group spoke with The upshot for many were two common reactions to the use of Android in the enterprise 1) if it was already deployed the common reaction was to pull back support for Android and convert to other supported Smartphones and 2) if Android was not already deployed wait for Android to become enterprise-ready (Table 14)
Table 14 Reaction to Android phones in the workplace
Status of Android Smartphones
Reaction
Already deployed Pull-back and convert to other Smartphones
If not already deployed Wait for Android to become enterprise-ready
Source IT Policy Compliance Group 2011
When it comes to Tablet computers the sentiment about expected changes in use of different platforms reveals Android Tablet computers likely to see the biggest gains between now and 2013 followed by healthy gains in the use of other Tablet computers The only sentiment indicating significant declines appear to be related to Android and Blackberry Smartphones (Figure 17)
Figure 17 Expected changes in platform use
Source IT Policy Compliance Group 2011
The outlook of current sentiment regarding use of different platforms by 2013 clearly indicates the best performers are predisposed to ditch Android and Blackberry phones and significantly increase the use of iPad Tablet computers
By contrast the worst performers are predisposed to increase use of Smartphones and Tablet computers across the board and with the exception of Blackberry phones increase other mobile device platforms among average performers
Managing the Benefits and Risks of Mobile Computing
24
Additional Resources Numerous sources of related information are available for those interested in pursuing more information on a wide range of topics related to Smartphones and Tablet computers The following are but a small sample of related information perspectives and insight The authors of these articles have no relationship with the ITPCG Android Security See httpdeveloperandroidcomguidetopicssecuritysecurityhtml Android Orphans Visualizing a Sad History of Support See httptheunderstatementcompost11982112928android-orphans-visualizing-a-sad-history-of-support A Look into Mobile Device Security httpwwwsymanteccomcontentenusaboutmediapdfssymc_mobile_device_security_june2011pdfom_ext_cid=biz_socmed_twitter_facebook_marketwire_linkedin_2011Jun_worldwide_mobilesecuritywp Carrier IQ what it is what it isnrsquot and what you need to do httpwwwengadgetcom20111201carrier-iq-what-it-is-what-it-isnt-and-what-you-need-to CIS Apple iOS configuration benchmarks httpbenchmarkscisecurityorgen-usroute=downloadsbrowsecategorybenchmarksmobileiphone Current Android Malware httpforensicsspreitzenbarthdepage_id=254 DISA STIGs for Smartphones - unclassified httpiasedisamilstigsnet_perimeterwirelesssmartphonehtml iOS Hardening Configuration Guide Department of Defence Intelligence and Security Australian Government httpwwwdsdgovaupublicationsiOS_Hardening_Guidepdf Mac OS X and iOS Security httpdeveloperapplecomlibrarymacdocumentationSecurityConceptualSecurity_OverviewArchitectureArchitecturehtmlapple_refdocuidTP30000976-CH202-TPXREF101 Mobile Malware Why Fraudsters are Two Steps Ahead httpwwwtrusteercomblogmobile-malware-why-fraudsters-are-two-steps-ahead Rootkit called Carrier IQ discovered phoning home with user data httpwwwzdnetcomblogapplerootkit-called-carrier-iq-discovered-phoning-home-with-user-data11792 RIM launches Blackberry Fusion to Secure Android and Apple devices httpbusinessfinancialpostcom20111129rim-launching-blackberry-mobile-fusion-to-secure-iphone-android-devices Smartphone Security httpwwwenisaeuropaeuactapplication-securitysmartphone-security-1 The Spy Files Map httpwikileaksorgThe-Spyfiles-The-Maphtml Ten Steps to Secure Your Mobile Devices httpswikiinternet2educonfluencedisplayitsg2Mobile+Device+Security
Why Your Phone is Insecure by Design httpwwwforbescomsitesandygreenberg20110812codebreaker-karsten-nohl-why-your-phone-is-insecure-by-design
Managing the Benefits and Risks of Mobile Computing
25
About the Research Topics researched by the IT Policy Compliance Group (IT PCG) are part of an ongoing calendar established in consultation with Advisory General and Charter members of the Group as well as from findings compiled from ongoing research In addition to specific tracking questions common to each benchmark the research is designed to uncover the relationship between business results outcomes being experienced by organizations actions taken practices implemented and capabilities organizations use to respond
The qualitative research findings presented in this report are from numerous focus groups one-on-one interviews and meetings held with larger audiences throughout 2011 The quantitative findings contained in this report are from primary research studies conducted with 210 organizations in North America during late 2011
The maximum error for the sample findings for the benchmark findings contained in this report is +- seven percent The primary focus of analysis contained in this report is to present the largest differences between the outcomes experienced and similarly aligned findings that are most responsible for the differences in outcomes Instead of relying on differences that are within or close to the sample errors the effort has been to focus on the largest differences For example instead of focusing on differences involving +- 10 percent the findings covered in this report tend to focus on the largest differences in the range of 50 percent or more
The findings covering the use of Mobile computing are representative of organizations in North America and cannot be construed or inferred to represent current usage or plans for Mobile computing outside of North America However the findings covering the performance outcomes benefits and risks of Mobile computing the practices to manage the business risks and the controls to manage the risks match findings from similar studies covering other geographies outside of North America including findings from Latin America South America Europe Africa the Middle East Asia and Oceania
Industries represented The quantitative research includes representation from the following industries advertising accounting services aerospace agriculture apparel architecture automotive banking chemicals computer equipment and peripherals computer software and services construction consumer durable goods distribution education engineering services entertainment financial services food and beverage government (local state and federal level public administration) government (defense and intelligence) health medical and dental services insurance law enforcement management services media scientific and consulting services manufacturing pharmaceuticals public relations publishing real estate rental and leasing services retail trade telecommunications equipment telecommunication services transportation warehousing travel accommodation and hospitality services utilities waste management and wholesale trade Five industries represent 47 percent of the sample These include Banking Education Financial and Accounting Services Manufacturing and Retail Trade Another 27 industries represent the other 53 percent of the sample none of which represents more than five percent of the sample
Revenue or agency budgets of participating organizations Size of the organizations participating in the most recent benchmarks is somewhat evenly distributed although slightly fewer represent midsize organizations Thirty-six percent of the organizations represented by the findings have annual revenues or agency budgets that are less than $50 million Another twenty-nine percent of the sample has annual revenues or agency budgets between $50 million and $999 million The remaining thirty-five percent of the sample has annual revenues or agency budgets that are $1 billion or more
Functional areas of responsibility Thirty-five percent of the qualified participants for the benchmark work in IT with another 30 percent work in finance or internal controls The remaining 35 percent of the qualified participants work in a wide variety of functions from business line management senior management product design and development legal compliance sales marketing procurement logistics and customer services among other functions
Job titles of participants Thirty-five percent of the participants in the benchmark are senior managers with titles that include CEO CIO CFO or Vice president Thirty-eight percent are managers or directors and twenty-seven percent are staff in their organizations
Managing the Benefits and Risks of Mobile Computing
About IT Policy Compliance Group The mission of the IT Policy Compliance Group is to promote actionable findings based on evidence to assist organizations with delivering more value less risk and achieve IT policy and compliance objectives related to the use of information systems The Group Web site at wwwitpolicycompliancecom features quick two-minute self-assessments to compare outcomes and practices against onersquos industry peers and best performing organizations research reports continuing professional education conferences and seminars member and knowledge centers related research from around the World and resources including standards and frameworks associations government and regulators
The Grouprsquos research is designed to help IT risk legal financial and internal audit professionals to
Benchmark results and efforts against peers and best-in-class performers
Identify key drivers challenges and responses to improve results
Determine the applicability and use of specific capabilities to improve results
Identify best practices based on results and experience of peers
The Group relies upon its members and advisors for its research and editorial calendar
IT Policy Compliance Group Charter Members
The Institute of Symantec Corporation Internal Auditors ISACA 350 Ellis Street 247 Maitland Avenue 3701 Algonquin Road Suite 1010 Mountain View CA 94043 Altamonte Springs FL 32701 Rolling Meadows IL 60008 +1 (650) 527 8000 +1 (407) 937 1100 +1 (847) 253 1545 wwwsymanteccom wwwtheiiaorg wwwisacaorg infosymanteccom iiatheiiaorg infoisacaorg
Computer Security Institute Protiviti IT Governance Institute 600 Harrison Street New York Office 3701 Algonquin Road Suite 1010 San Francisco CA 94107 1290 Avenue of the Rolling Meadows IL 60008 +1 (415) 947 6320 Americas 5th Floor +1 (847) 660 5600 wwwgocsicom New York New York 10104 wwwitgiorg csicmpcom +1 (212) 603 8300 infoitgiorg wwwprotiviticom infoprotiviticom
IT Policy Compliance Group Affiliate Members and Advisors A current list of Affiliate Members and Advisors to the Group can be found on the IT Policy Compliance Group website
26
Founded in 2005 the IT Policy Compliance Group conducts benchmark research focused on delivering fact-based guidance on the steps that can be taken to improve results Benchmark results are reported through wwwitpolicycompliancecom for the benefit of members
IT Policy Compliance Group
Contacts Managing Director Jim Hurley Telephone +1 (216) 373 7010 jhurleyitpolicycompliancecom Managing Editor John Ortbal Telephone +1 (847) 444 0344 jortbalitpolicycompliancecom wwwitpolicycompliancecom
December 2011
The information contained in this publication has been obtained from sources that the IT Policy Compliance Group believes to be reliable but is not guaranteed Research publications reflect current conditions that are subject to change without notice
Copyright copy 2011 IT Policy Compliance Group Names and logos may be trademarks of their respective owners All rights reserved 1211 293167003
32
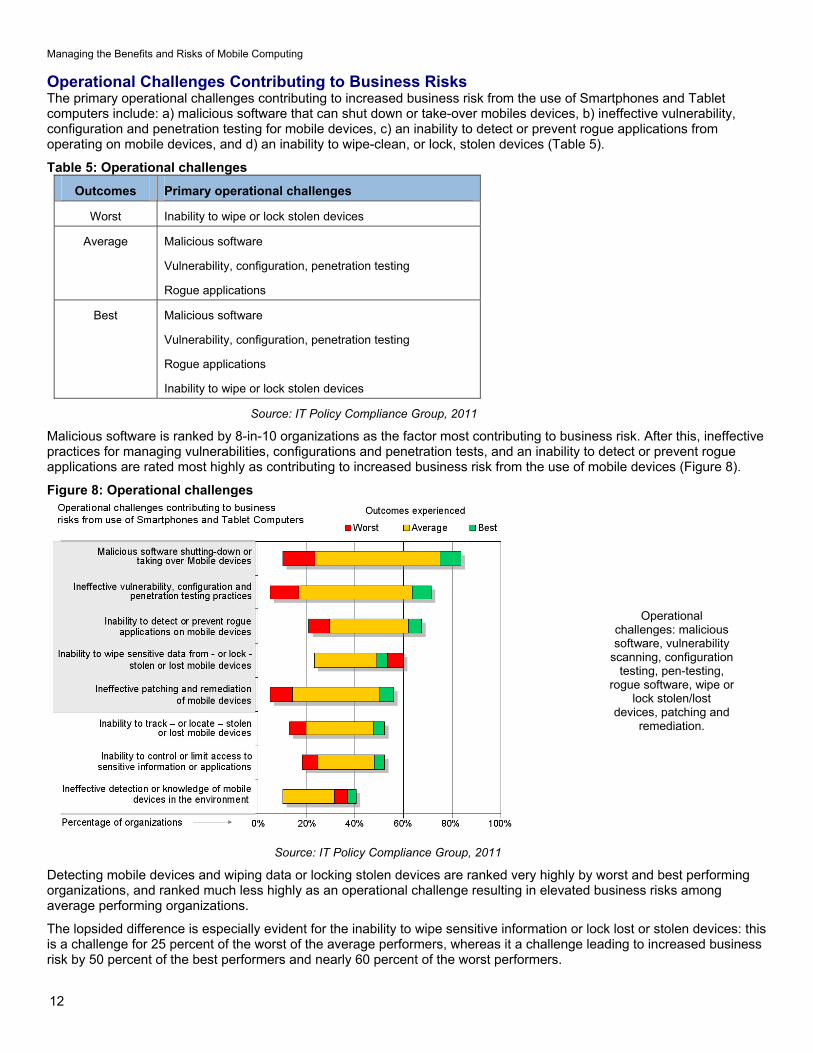
Managing the Benefits and Risks of Mobile Computing
12
Operational Challenges Contributing to Business Risks The primary operational challenges contributing to increased business risk from the use of Smartphones and Tablet computers include a) malicious software that can shut down or take-over mobiles devices b) ineffective vulnerability configuration and penetration testing for mobile devices c) an inability to detect or prevent rogue applications from operating on mobile devices and d) an inability to wipe-clean or lock stolen devices (Table 5)
Table 5 Operational challenges
Outcomes Primary operational challenges
Worst Inability to wipe or lock stolen devices
Average Malicious software
Vulnerability configuration penetration testing
Rogue applications
Best Malicious software
Vulnerability configuration penetration testing
Rogue applications
Inability to wipe or lock stolen devices
Source IT Policy Compliance Group 2011
Malicious software is ranked by 8-in-10 organizations as the factor most contributing to business risk After this ineffective practices for managing vulnerabilities configurations and penetration tests and an inability to detect or prevent rogue applications are rated most highly as contributing to increased business risk from the use of mobile devices (Figure 8)
Figure 8 Operational challenges
Operational challenges malicious software vulnerability
scanning configuration testing pen-testing
rogue software wipe or lock stolenlost
devices patching and remediation
Source IT Policy Compliance Group 2011
Detecting mobile devices and wiping data or locking stolen devices are ranked very highly by worst and best performing organizations and ranked much less highly as an operational challenge resulting in elevated business risks among average performing organizations
The lopsided difference is especially evident for the inability to wipe sensitive information or lock lost or stolen devices this is a challenge for 25 percent of the worst of the average performers whereas it a challenge leading to increased business risk by 50 percent of the best performers and nearly 60 percent of the worst performers
Managing the Benefits and Risks of Mobile Computing
13
In addition to operational challenges contributing to elevated business risks the benchmarks also identify legal and regulatory challenges that are contributing to increased business risk Often called a binary problem mdash you adhere to and report on a specific regulation or not mdash the findings reveal the challenges are larger than concerns about failing to comply with a single regulatory mandate or legal ruling
Legal and Regulatory Challenges Contributing to Business Risks The legal and regulatory challenges contributing to business risks from the use of Smartphones and Tablet computers include a) an inability to conduct information security audits and b) exposure to civil or criminal action due to inadequate due-care findings (Table 6)
Table 6 Legal and regulatory challenges
Outcomes Primary operational challenges
Worst Inability to comply with cross-border data privacy mandates
Average Inability to conduct information security audits
Exposure to civilcriminal actions due to inadequate due-care
Best Inability to conduct information security audits
Exposure to civilcriminal actions due to inadequate due-care
Inability to comply with cross-border data privacy mandates
Loss of ownership of data due to differences in jurisdictions
Source IT Policy Compliance Group 2011
After these two the primary challenges include an inability to comply with cross-border data privacy regulations or law loss of ownership of data due to differences in legal jurisdictions and an inability to deliver forensics information for investigations (Figure 9)
Figure 9 Legal and regulatory challenges
Legal and regulatory challenges information
security audits inadequate due-care
cross-border data privacy loss of
ownership over data
Source IT Policy Compliance Group 2011
Complying with cross-border data privacy regulations are challenges for worst and best performers but less of a challenge among average performing companies
Managing the Benefits and Risks of Mobile Computing
14
Organizations do not willingly engage in behavior whose risks are large enough to outweigh benefits Not as stark as a ldquoflight or fightrdquo reaction the primary action being taken to manage the risks of using Smartphones and Tablet computers reveal much about the outcomes organizations are experiencing
Action Taken to Manage the Risks The primary action taken to manage the risks of using mobile devices is to simply limit the number of employees who can use the devices mdash Smartphones and Tablet computers mdash to access applications and information in the workplace This action is shared by those with the best and average outcomes about 8-in-10 organizations However the primary action being taken by the worst performers is to ignore or discount the risk posed to the business from the use of these mobile devices (Table 7)
Table 7 Actions taken to manage the risks
Outcome Primary action taken to manage the risks
Worst Ignore or discount business risks associated with use of mobile devices
Average Limit the use of mobile devices to specific employees
Best Limit the use of mobile devices to specific employees
Source IT Policy Compliance Group 2011
In contrast the worst performers are not purposely limiting the use of mobile devices to specific employees rather these firms are ignoring or discounting the business risks or are trying to cover the business risks with existing or new insurance contracts
Fewer average better or best performing organizations are limiting the use of these devices and are ignoring or discounting the business risks involved (Figure 10)
Figure 10 Actions taken to manage the risks
Action taken to manage the risks limit number of employees that are allowed to use Smartphones or Tablet
computers in the workplace
Source IT Policy Compliance Group 2011
Limiting the use of mobile devices is a double-edged sword because the benefits tangible benefits include increases in revenue and profitability Although not tracked in these studies research from complementary longitudinal and non-longitudinal studies indicate that customer satisfaction and retention rates are also higher among the best performers The core issue for most organizations is the tradeoff between benefits and risks The obvious issue for most organizations is finding an optimal balance or tradeoff between risks and benefits
Managing the Benefits and Risks of Mobile Computing
15
Limiting the Number of Employees Who Use Mobile Devices Despite the benefits of using mobile devices the business risks are purposely keeping low the number of employees using these mobile devices in the workplace The number of employees using Smartphones to access information and applications is a rather low 3-in-10 people (33 percent) despite the high 8-in-10 (79 percent) number of organizations using these devices Similarly the average number of employees using Tablet computers to access information and applications is just 1-in-5 people (22 percent) among the 35 percent of organizations using these devices (Figure 11)
Figure 11 Use of mobile devices by employees
It is the use of Smartphones by
employees that are being artificially
restricted because of the business risks
Source IT Policy Compliance Group 2011
The use of mobile Smartphones is being artificially limited by organizations due to the risks involved Whether it is the simple visual depiction contained in Figure 11 or the ratio of employees to organizations using the devices or the range of employees using the devices it is clear that it is the use of Smartphones by employees to access information and applications that are being artificially restricted (Table 8)
Table 8 Use of mobile devices by employees
Employee use for 65 of
organizations
Employee use for 95 of
organizations
Ratio of employee use to organization use
Smartphones 31 to 36 29 to 38 42
Tablet computers 18 to 27 14 to 31 63
Source IT Policy Compliance Group 2011
Thus the calculus of determining who uses and who does not use Smartphones to access information and applications at an organization is as much a determination of business need and value as much as it is an evaluation of business risk
As part of the research the Group delved into additional practices organizations implement to see if there are other factors responsible for better mdash or worse mdash outcomes associated with the use of Mobile devices
Managing the Benefits and Risks of Mobile Computing
16
Practices that Determine Outcomes The primary practices being implemented to manage business risks for the employees who are using Smartphones and Tablet computers include limiting access to sensitive information or applications geo-tracking and locating lost or stolen devices protecting and backing-up information from mobile devices wiping sensitive information from stolen or lost mobile devices preventingrecording unauthorized logins from mobile devices delivering security-awareness training to employees who use mobile devices and prohibiting access to Apps-markets Apps-sites and custom ROMs on mobile devices (Table 9)
Table 9 Practices implemented to manage the risks
Priority Practices determining outcomes
1 Limit access to sensitive information and applications
2 Geo-track devices to aid in recovery or destruction of information
3 Protect and backup information from devices
4 Wipe stolen or lost devices of information and credentials
5 Prevent and record unauthorized logon attempts
6 Deliver and measure policy and security awareness training for users
7 Prohibit custom ROMs for rooted devices and access to App-markets
Source IT Policy Compliance Group 2011
As the research uncovered the range of practices implemented to manage business risks are directly related to outcomes Far more of the best performing organizations have more employees using these devices are spending more on information security and are more likely to be implementing most of these practices The reverse was also found to be true the worst performers are simply not implementing the practices or are implementing a few rather than all (Figure 12)
Figure 12 Practices implemented to manage the risks
Practices that determine outcomes
limit access geo-track devices protect and backup data wipe
devices that are lost or stolen prevent
unauthorized logons deliver training no
ROMs or App-markets
Source IT Policy Compliance Group 2011
Managing the Benefits and Risks of Mobile Computing
17
Controls Used to Manage Risks Controls are used in business to assist with the execution of business strategy to manage business outcomes and to manage risk In the case of managing risks related to the use of mobile devices to access information and applications the controls employed by the best performers include using antivirus andor anti-malware scans of the devices encrypting sensitive information on the devices preventing unauthorized people and devices from accessing sensitive information and applications patching mobile device systems-level software where possible and testing configurations of the devices (Table 10)
Table 10 Controls used to manage risks
Priority Controls used to manage the risks
1 Use anti-virus and anti-malware
2 Protect sensitive information on devices with encryption
3 Prevent unauthorized devices and people from accessing informationapplications
4 Patch systems software on devices where possible
5 Test configurations and settings on devices
Source IT Policy Compliance Group 2011
Of the controls tested by the research the one implemented by a clear majority of the best performers is the use of anti-virus andor anti-malware scans The least commonly implemented control among these best performers is the use of virtual private networking (VPN) although interviews revealed many respondents were using some form of VPN with Smartphones in the workplace
In contrast several controls are either not implemented or are less likely implemented by the worst performers These include the scanning of ROMs on mobile devices scanning of vulnerabilities on mobile devices conducting penetration tests on mobile devices patching systems-level software where possible and using virtual private networking (Figure 13)
Figure 13 Controls used to manage risks
Controls to use anti-virusanti-malware encryption checks and limits on unauthorized
devicespeople patches and
configuration testing
Source IT Policy Compliance Group 2011
Managing the Benefits and Risks of Mobile Computing
18
Interestingly the biggest complaint the Group found in the interviews was due to ldquothe lack of patches to update the Android operating systemrdquo For this reason alone we found that many organizations had developed a ldquono Androidrdquo policy or told its users that Android phones could no longer be used Another practice found to significantly impact outcomes is how frequently organizations conduct assessments
Consistency of Assessments and Reporting The rate at which controls to manage risks are monitored assessed and reported on is directly related to outcomes For example the findings reveal significant differences from annual to monthly rates with those conducting less frequent assessments being among the majority of the worst performers and those with the most frequent assessments being among the best performers (Table 11)
Table 11 Rate of assessment and reporting
Outcome Average rate of assessment and reporting
Worst Once every twelve months
Average Once every four-to-five months
Best Once every month or less
Source IT Policy Compliance Group 2011
Mirroring findings in related research the rate at which controls are monitored assessed and compared against a range of conditions including policies prioritized risks threats gold-standards regulatory requirements and internal configuration baselines among others defines
1) When organizations find gaps in controls and procedures
2) Whether risks are larger than expected
3) Whether organizations are able to take appropriate action
4) Whether organizations are able to reduce business risks
When looked at from the perspective of size the research reveals many organizations may not have the tools to automate such assessments or are simply choosing to conduct annual audit review assessments rather than ongoing business risk assessments (Figure 14)
Figure 14 Rate of assessment and reporting
The best performers consistently assess
and report on controls and risks more
frequently
Source IT Policy Compliance Group 2011
Managing the Benefits and Risks of Mobile Computing
19
In addition to the rate of assessment and reporting another defining practice responsible for outcomes is found to be spending on information security by organizations
Spend on Information Security and Outcomes Worst performers are spending 60 percent less than average while the best performers are spending 60 percent more than average performers (Table 12)
Table 12 Spend on information security
Outcome Relative spend on information security compared with average performers
Worst 04
Average 10
Best 16
Source IT Policy Compliance Group 2011
In addition to the relative difference in spend on information security there are large differences in the percentage of the IT budget spent on information security While the range of spend among the worst is from zero to slightly more than 5 of the IT budget the average spent by the worst is less than three percent In contrast average performers spend 75 percent and best performers are spending 12 percent on average (Figure 15)
Figure 15 Spend on information security
The best performers spend a larger
percentage of a larger IT budget on
information security
Source IT Policy Compliance Group 2011
The amount spent is more revealing when considering the actual IT budgets IT budgets among worst performers is just 30 percent of what average performers spend on IT while the amount spent on IT by the best performers is more than 30 percent higher than the average performers
Thus smaller percentages of much smaller annual IT budgets are characteristic of spending on information security by the worst performers while larger percentages of much larger annual IT budgets are characteristic of spending on information security by the best performers
Spending on information security among some of the worst performers actually bottomed-out during the latter half of 2011 When combined with no controls on mobile devices and a culture that is ignoring or discounting the business risks related to the use of Mobile devices it is possible that 2012 could be a year with some negative brand-wrecking events for some of these organizations The best performers will be happy to have positioned themselves differently
Managing the Benefits and Risks of Mobile Computing
20
Back to the Future Is the adoption of Mobile computing a repeat of what occurred in the 1980s Back then it was connecting PCs via local networks to provide office workers with access to information that could be analyzed and acted on in local work groups Today it is about wirelessly interconnecting Mobile devices enabling anyone to share and act on information from any location If today is any indication of what happened in the 1980s then the use of these new powerful pocket-sized but supercharged Mobile devices is likely to change to shape of computing as we know it today
The use of Smartphones by 8-in-10 organizations could likely grow And the use of these devices by employees artificially restricted to 33 percent for now will likely grow as management systems and security controls become more standardized
But we are in a high-growth expansionary phase where Phone manufacturers and carriers are incented to cannibalize products they shipped just last year or as recently as last month leaving consumers employees and organizations with devices that are out of date and may never be updated with systems-level software that would otherwise cure security vulnerabilities
Unfortunately there is no standard Android phone unless you purchase a Google Nexus phone which will be updated by Google directly But the majority of Android phones purchased by consumers and employees are not stock Google Android phones Instead the vast majority of Android phones are overlaid by supplier goo-gads carrier changes along with unexpected and unwanted mdash Carrier IQ mdash additions The carriers and phone manufacturers are incented by the sale of new hardware bling and new service contracts
Encouraged by Google and the profit margins from the latest hardware bling and service contracts the carriers and phone manufacturers continue to develop their own versions of Android What the carriers and phone manufacturers are not incented to do is to deploy software updates to the Android operating system to their customers and so they donrsquot Instead they find it less expensive to lure their customers into an upgrade to a new device on contract two years later
There are more stable and routinely updated
operating systems shipping with
Smartphones from Applersquos iOS RIMrsquos
Blackberry and Windows phone
Eventually these problems and others may resolve themselves but it could be another few years mdash or more mdash of frustration before anything resembling stability in the Android operating system is common and enterprise-ready management tools and security controls are available for these new wonders of the information age
In the meantime there are much more stable mdash and routinely updated mdash operating systems shipping with Smartphones from Applersquos iOS RIMrsquos Blackberry and Windows phone None of these suffer the same problems afflicting Android phones
Whatever you do remember the lessons about what worked mdash and what didnrsquot mdash with earlier generational-changes such as the advent of PCs or the dawn of Internet-computing This longer-term perspective and the lessons will come in handy in formulating strategy and tactics as the use of Mobile computing expands in your workplace
Summary Observations Based on the outcomes being achieved by the best performing organizations
The business benefits of using Smartphones and Tablet computers include
Improved access to business information from any location
Improved customer retention and satisfaction levels and
Higher levels of revenue and profitability when compared with peers
The business risks of using mobile computing devices include
Loss or theft of sensitive information
Unauthorized access to information and applications
Loss of governance or control over sensitive business information business applications business risks and audits
Managing the Benefits and Risks of Mobile Computing
21
The primary information and applications currently being used with mobile devices include
Email and collaborative applications
Office productivity applications
Sales force automation applications
The primary actions to take to limit business risks include
Limit the use of Smartphones in the workplace to specifically approved employees
Fewer than 50 percent of employees currently use Smartphonersquos among the best performers
Policies and practices to implement include
Have IT manage all Tablet computers and Smartphones
Allow approved employees to use their own Smartphones
Furnish Tablet computers to employees
Considerations to evaluate include
Mobile devices are another part of the requirements of your information security audits
Compare your due-care requirements to defend against legal inquiry
Identify your cross-border data privacy and ownership requirements
Practices to implement include
Limit the use of Smartphones to access information and applications to approved employees
Limit access to sensitive information and applications for mobile devices
Geo-track devices especially Smartphones
Prohibit the use of custom ROMs and unapproved App-marketssites
Deliver security awareness training and measure effectiveness with employees
Scan mobile devices with anti-virus and anti-malware
Protect and backup information on the devices
Wipe and lock stolen and lost devices as soon as notified by employees
Investigate the availability of patching as part of device evaluations
Use frequent controls and configuration testing to reduce gaps and limit risks
Increase spend on information security beyond your peers
Managing the Benefits and Risks of Mobile Computing
22
Appendix Expected Changes in Device Use in the Workplace 2011 to 2013 Respondents were asked to identify changes that are most likely going to occur in organizational and employee uses of Smartphones and Tablet computers between 2011 and 2013 As projections these forecasts of user and organizational expectations are reflections of current sentiment
The use of Smartphones by organizations is expected to remain the same between 2011 and 2013 at 79 percent of all organizations However the use of Smartphones to access information and applications by employees is expected to increase from 33 percent to 39 percent (Table 13)
Table 13 Device use 2011 to 2013
Device being used Use by organizationsemployees
2011 2013 Change in use
Organizational use 79 79 -0- Smartphones
Employee use 33 39 6 increase
Organizational use 35 49 14 increase Tablet computers
Employee use 22 32 10 increase
Source IT Policy Compliance Group 2011
Unlike Smartphones the use of Tablet computers is expected to increase for organizations and employees from an average rate of 35 percent to 49 percent for organizations and from 22 to 32 for employees The increases are larger than the sample error of seven percent
After an increase in employees using both devices what is rather intriguing is an expected downtrend in the use of Smartphones among organizations with the best outcomes The decline in the use of Smartphones among best performers is expected to be from 85 percent to 73 percent mdash a decrease of 12 percent mdash from 2011 to 2013 (Figure 16)
Figure 16 Expected changes in device use
Source IT Policy Compliance Group 2011
The explanation for the overall rate of decline of Smartphone use among best performing organization can be found from declines in the uses of iPhone and Windows Phone platforms and much more significant declines in the use of Android and Blackberry phones
At the time the research was being carried out RIM was suffering from blackouts in its services around the World with rolling service-outages that occurred across multiple continents during a one-week period The general consensus of many people we spoke with at the time was the service-outages ldquoare the final event I need to make the switch when my subscription period is duerdquo On the other hand others simply replaced their Blackberry devices that week and did not wait until their subscription was due for renewal
Unlike the RIM Blackberry platforms we found consistently strong disaffection with Android devices due to the inability to obtain updates for the Android operating system without having to root devices and hope for the best using custom ROMs
Managing the Benefits and Risks of Mobile Computing
23
These problems left many saying things like ldquoI bought a pig in a poke never againrdquo Others took matters into their own hands rooted their phones and installed updated versions of Android over the Internet from a number of different development sites none of which were blessed by carriers phone manufacturers or their IT staff
IT managers the Group spoke with identified an utter lack of management tools for Android devices too many versions of Android and a complete lack of vulnerability testing for the devices The inability to update and cure security-problems were just some of the problems identified by IT managers the Group spoke with The upshot for many were two common reactions to the use of Android in the enterprise 1) if it was already deployed the common reaction was to pull back support for Android and convert to other supported Smartphones and 2) if Android was not already deployed wait for Android to become enterprise-ready (Table 14)
Table 14 Reaction to Android phones in the workplace
Status of Android Smartphones
Reaction
Already deployed Pull-back and convert to other Smartphones
If not already deployed Wait for Android to become enterprise-ready
Source IT Policy Compliance Group 2011
When it comes to Tablet computers the sentiment about expected changes in use of different platforms reveals Android Tablet computers likely to see the biggest gains between now and 2013 followed by healthy gains in the use of other Tablet computers The only sentiment indicating significant declines appear to be related to Android and Blackberry Smartphones (Figure 17)
Figure 17 Expected changes in platform use
Source IT Policy Compliance Group 2011
The outlook of current sentiment regarding use of different platforms by 2013 clearly indicates the best performers are predisposed to ditch Android and Blackberry phones and significantly increase the use of iPad Tablet computers
By contrast the worst performers are predisposed to increase use of Smartphones and Tablet computers across the board and with the exception of Blackberry phones increase other mobile device platforms among average performers
Managing the Benefits and Risks of Mobile Computing
24
Additional Resources Numerous sources of related information are available for those interested in pursuing more information on a wide range of topics related to Smartphones and Tablet computers The following are but a small sample of related information perspectives and insight The authors of these articles have no relationship with the ITPCG Android Security See httpdeveloperandroidcomguidetopicssecuritysecurityhtml Android Orphans Visualizing a Sad History of Support See httptheunderstatementcompost11982112928android-orphans-visualizing-a-sad-history-of-support A Look into Mobile Device Security httpwwwsymanteccomcontentenusaboutmediapdfssymc_mobile_device_security_june2011pdfom_ext_cid=biz_socmed_twitter_facebook_marketwire_linkedin_2011Jun_worldwide_mobilesecuritywp Carrier IQ what it is what it isnrsquot and what you need to do httpwwwengadgetcom20111201carrier-iq-what-it-is-what-it-isnt-and-what-you-need-to CIS Apple iOS configuration benchmarks httpbenchmarkscisecurityorgen-usroute=downloadsbrowsecategorybenchmarksmobileiphone Current Android Malware httpforensicsspreitzenbarthdepage_id=254 DISA STIGs for Smartphones - unclassified httpiasedisamilstigsnet_perimeterwirelesssmartphonehtml iOS Hardening Configuration Guide Department of Defence Intelligence and Security Australian Government httpwwwdsdgovaupublicationsiOS_Hardening_Guidepdf Mac OS X and iOS Security httpdeveloperapplecomlibrarymacdocumentationSecurityConceptualSecurity_OverviewArchitectureArchitecturehtmlapple_refdocuidTP30000976-CH202-TPXREF101 Mobile Malware Why Fraudsters are Two Steps Ahead httpwwwtrusteercomblogmobile-malware-why-fraudsters-are-two-steps-ahead Rootkit called Carrier IQ discovered phoning home with user data httpwwwzdnetcomblogapplerootkit-called-carrier-iq-discovered-phoning-home-with-user-data11792 RIM launches Blackberry Fusion to Secure Android and Apple devices httpbusinessfinancialpostcom20111129rim-launching-blackberry-mobile-fusion-to-secure-iphone-android-devices Smartphone Security httpwwwenisaeuropaeuactapplication-securitysmartphone-security-1 The Spy Files Map httpwikileaksorgThe-Spyfiles-The-Maphtml Ten Steps to Secure Your Mobile Devices httpswikiinternet2educonfluencedisplayitsg2Mobile+Device+Security
Why Your Phone is Insecure by Design httpwwwforbescomsitesandygreenberg20110812codebreaker-karsten-nohl-why-your-phone-is-insecure-by-design
Managing the Benefits and Risks of Mobile Computing
25
About the Research Topics researched by the IT Policy Compliance Group (IT PCG) are part of an ongoing calendar established in consultation with Advisory General and Charter members of the Group as well as from findings compiled from ongoing research In addition to specific tracking questions common to each benchmark the research is designed to uncover the relationship between business results outcomes being experienced by organizations actions taken practices implemented and capabilities organizations use to respond
The qualitative research findings presented in this report are from numerous focus groups one-on-one interviews and meetings held with larger audiences throughout 2011 The quantitative findings contained in this report are from primary research studies conducted with 210 organizations in North America during late 2011
The maximum error for the sample findings for the benchmark findings contained in this report is +- seven percent The primary focus of analysis contained in this report is to present the largest differences between the outcomes experienced and similarly aligned findings that are most responsible for the differences in outcomes Instead of relying on differences that are within or close to the sample errors the effort has been to focus on the largest differences For example instead of focusing on differences involving +- 10 percent the findings covered in this report tend to focus on the largest differences in the range of 50 percent or more
The findings covering the use of Mobile computing are representative of organizations in North America and cannot be construed or inferred to represent current usage or plans for Mobile computing outside of North America However the findings covering the performance outcomes benefits and risks of Mobile computing the practices to manage the business risks and the controls to manage the risks match findings from similar studies covering other geographies outside of North America including findings from Latin America South America Europe Africa the Middle East Asia and Oceania
Industries represented The quantitative research includes representation from the following industries advertising accounting services aerospace agriculture apparel architecture automotive banking chemicals computer equipment and peripherals computer software and services construction consumer durable goods distribution education engineering services entertainment financial services food and beverage government (local state and federal level public administration) government (defense and intelligence) health medical and dental services insurance law enforcement management services media scientific and consulting services manufacturing pharmaceuticals public relations publishing real estate rental and leasing services retail trade telecommunications equipment telecommunication services transportation warehousing travel accommodation and hospitality services utilities waste management and wholesale trade Five industries represent 47 percent of the sample These include Banking Education Financial and Accounting Services Manufacturing and Retail Trade Another 27 industries represent the other 53 percent of the sample none of which represents more than five percent of the sample
Revenue or agency budgets of participating organizations Size of the organizations participating in the most recent benchmarks is somewhat evenly distributed although slightly fewer represent midsize organizations Thirty-six percent of the organizations represented by the findings have annual revenues or agency budgets that are less than $50 million Another twenty-nine percent of the sample has annual revenues or agency budgets between $50 million and $999 million The remaining thirty-five percent of the sample has annual revenues or agency budgets that are $1 billion or more
Functional areas of responsibility Thirty-five percent of the qualified participants for the benchmark work in IT with another 30 percent work in finance or internal controls The remaining 35 percent of the qualified participants work in a wide variety of functions from business line management senior management product design and development legal compliance sales marketing procurement logistics and customer services among other functions
Job titles of participants Thirty-five percent of the participants in the benchmark are senior managers with titles that include CEO CIO CFO or Vice president Thirty-eight percent are managers or directors and twenty-seven percent are staff in their organizations
Managing the Benefits and Risks of Mobile Computing
About IT Policy Compliance Group The mission of the IT Policy Compliance Group is to promote actionable findings based on evidence to assist organizations with delivering more value less risk and achieve IT policy and compliance objectives related to the use of information systems The Group Web site at wwwitpolicycompliancecom features quick two-minute self-assessments to compare outcomes and practices against onersquos industry peers and best performing organizations research reports continuing professional education conferences and seminars member and knowledge centers related research from around the World and resources including standards and frameworks associations government and regulators
The Grouprsquos research is designed to help IT risk legal financial and internal audit professionals to
Benchmark results and efforts against peers and best-in-class performers
Identify key drivers challenges and responses to improve results
Determine the applicability and use of specific capabilities to improve results
Identify best practices based on results and experience of peers
The Group relies upon its members and advisors for its research and editorial calendar
IT Policy Compliance Group Charter Members
The Institute of Symantec Corporation Internal Auditors ISACA 350 Ellis Street 247 Maitland Avenue 3701 Algonquin Road Suite 1010 Mountain View CA 94043 Altamonte Springs FL 32701 Rolling Meadows IL 60008 +1 (650) 527 8000 +1 (407) 937 1100 +1 (847) 253 1545 wwwsymanteccom wwwtheiiaorg wwwisacaorg infosymanteccom iiatheiiaorg infoisacaorg
Computer Security Institute Protiviti IT Governance Institute 600 Harrison Street New York Office 3701 Algonquin Road Suite 1010 San Francisco CA 94107 1290 Avenue of the Rolling Meadows IL 60008 +1 (415) 947 6320 Americas 5th Floor +1 (847) 660 5600 wwwgocsicom New York New York 10104 wwwitgiorg csicmpcom +1 (212) 603 8300 infoitgiorg wwwprotiviticom infoprotiviticom
IT Policy Compliance Group Affiliate Members and Advisors A current list of Affiliate Members and Advisors to the Group can be found on the IT Policy Compliance Group website
26
Founded in 2005 the IT Policy Compliance Group conducts benchmark research focused on delivering fact-based guidance on the steps that can be taken to improve results Benchmark results are reported through wwwitpolicycompliancecom for the benefit of members
IT Policy Compliance Group
Contacts Managing Director Jim Hurley Telephone +1 (216) 373 7010 jhurleyitpolicycompliancecom Managing Editor John Ortbal Telephone +1 (847) 444 0344 jortbalitpolicycompliancecom wwwitpolicycompliancecom
December 2011
The information contained in this publication has been obtained from sources that the IT Policy Compliance Group believes to be reliable but is not guaranteed Research publications reflect current conditions that are subject to change without notice
Copyright copy 2011 IT Policy Compliance Group Names and logos may be trademarks of their respective owners All rights reserved 1211 293167003
32
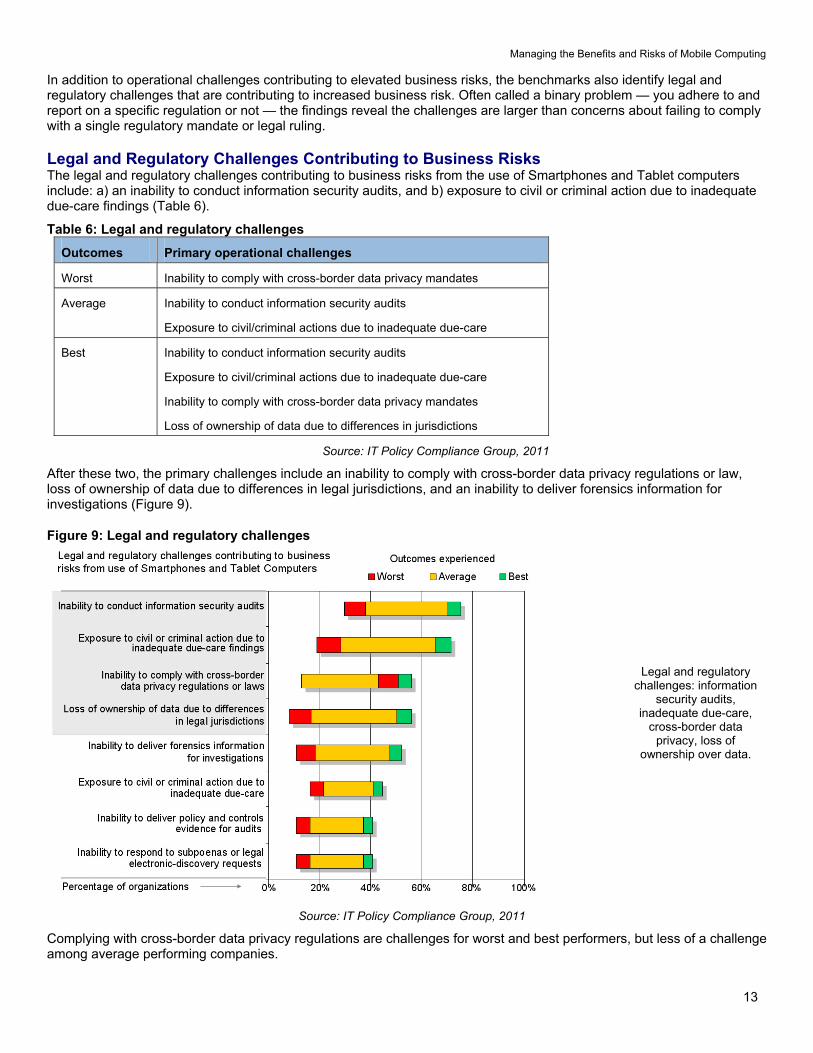
Managing the Benefits and Risks of Mobile Computing
13
In addition to operational challenges contributing to elevated business risks the benchmarks also identify legal and regulatory challenges that are contributing to increased business risk Often called a binary problem mdash you adhere to and report on a specific regulation or not mdash the findings reveal the challenges are larger than concerns about failing to comply with a single regulatory mandate or legal ruling
Legal and Regulatory Challenges Contributing to Business Risks The legal and regulatory challenges contributing to business risks from the use of Smartphones and Tablet computers include a) an inability to conduct information security audits and b) exposure to civil or criminal action due to inadequate due-care findings (Table 6)
Table 6 Legal and regulatory challenges
Outcomes Primary operational challenges
Worst Inability to comply with cross-border data privacy mandates
Average Inability to conduct information security audits
Exposure to civilcriminal actions due to inadequate due-care
Best Inability to conduct information security audits
Exposure to civilcriminal actions due to inadequate due-care
Inability to comply with cross-border data privacy mandates
Loss of ownership of data due to differences in jurisdictions
Source IT Policy Compliance Group 2011
After these two the primary challenges include an inability to comply with cross-border data privacy regulations or law loss of ownership of data due to differences in legal jurisdictions and an inability to deliver forensics information for investigations (Figure 9)
Figure 9 Legal and regulatory challenges
Legal and regulatory challenges information
security audits inadequate due-care
cross-border data privacy loss of
ownership over data
Source IT Policy Compliance Group 2011
Complying with cross-border data privacy regulations are challenges for worst and best performers but less of a challenge among average performing companies
Managing the Benefits and Risks of Mobile Computing
14
Organizations do not willingly engage in behavior whose risks are large enough to outweigh benefits Not as stark as a ldquoflight or fightrdquo reaction the primary action being taken to manage the risks of using Smartphones and Tablet computers reveal much about the outcomes organizations are experiencing
Action Taken to Manage the Risks The primary action taken to manage the risks of using mobile devices is to simply limit the number of employees who can use the devices mdash Smartphones and Tablet computers mdash to access applications and information in the workplace This action is shared by those with the best and average outcomes about 8-in-10 organizations However the primary action being taken by the worst performers is to ignore or discount the risk posed to the business from the use of these mobile devices (Table 7)
Table 7 Actions taken to manage the risks
Outcome Primary action taken to manage the risks
Worst Ignore or discount business risks associated with use of mobile devices
Average Limit the use of mobile devices to specific employees
Best Limit the use of mobile devices to specific employees
Source IT Policy Compliance Group 2011
In contrast the worst performers are not purposely limiting the use of mobile devices to specific employees rather these firms are ignoring or discounting the business risks or are trying to cover the business risks with existing or new insurance contracts
Fewer average better or best performing organizations are limiting the use of these devices and are ignoring or discounting the business risks involved (Figure 10)
Figure 10 Actions taken to manage the risks
Action taken to manage the risks limit number of employees that are allowed to use Smartphones or Tablet
computers in the workplace
Source IT Policy Compliance Group 2011
Limiting the use of mobile devices is a double-edged sword because the benefits tangible benefits include increases in revenue and profitability Although not tracked in these studies research from complementary longitudinal and non-longitudinal studies indicate that customer satisfaction and retention rates are also higher among the best performers The core issue for most organizations is the tradeoff between benefits and risks The obvious issue for most organizations is finding an optimal balance or tradeoff between risks and benefits
Managing the Benefits and Risks of Mobile Computing
15
Limiting the Number of Employees Who Use Mobile Devices Despite the benefits of using mobile devices the business risks are purposely keeping low the number of employees using these mobile devices in the workplace The number of employees using Smartphones to access information and applications is a rather low 3-in-10 people (33 percent) despite the high 8-in-10 (79 percent) number of organizations using these devices Similarly the average number of employees using Tablet computers to access information and applications is just 1-in-5 people (22 percent) among the 35 percent of organizations using these devices (Figure 11)
Figure 11 Use of mobile devices by employees
It is the use of Smartphones by
employees that are being artificially
restricted because of the business risks
Source IT Policy Compliance Group 2011
The use of mobile Smartphones is being artificially limited by organizations due to the risks involved Whether it is the simple visual depiction contained in Figure 11 or the ratio of employees to organizations using the devices or the range of employees using the devices it is clear that it is the use of Smartphones by employees to access information and applications that are being artificially restricted (Table 8)
Table 8 Use of mobile devices by employees
Employee use for 65 of
organizations
Employee use for 95 of
organizations
Ratio of employee use to organization use
Smartphones 31 to 36 29 to 38 42
Tablet computers 18 to 27 14 to 31 63
Source IT Policy Compliance Group 2011
Thus the calculus of determining who uses and who does not use Smartphones to access information and applications at an organization is as much a determination of business need and value as much as it is an evaluation of business risk
As part of the research the Group delved into additional practices organizations implement to see if there are other factors responsible for better mdash or worse mdash outcomes associated with the use of Mobile devices
Managing the Benefits and Risks of Mobile Computing
16
Practices that Determine Outcomes The primary practices being implemented to manage business risks for the employees who are using Smartphones and Tablet computers include limiting access to sensitive information or applications geo-tracking and locating lost or stolen devices protecting and backing-up information from mobile devices wiping sensitive information from stolen or lost mobile devices preventingrecording unauthorized logins from mobile devices delivering security-awareness training to employees who use mobile devices and prohibiting access to Apps-markets Apps-sites and custom ROMs on mobile devices (Table 9)
Table 9 Practices implemented to manage the risks
Priority Practices determining outcomes
1 Limit access to sensitive information and applications
2 Geo-track devices to aid in recovery or destruction of information
3 Protect and backup information from devices
4 Wipe stolen or lost devices of information and credentials
5 Prevent and record unauthorized logon attempts
6 Deliver and measure policy and security awareness training for users
7 Prohibit custom ROMs for rooted devices and access to App-markets
Source IT Policy Compliance Group 2011
As the research uncovered the range of practices implemented to manage business risks are directly related to outcomes Far more of the best performing organizations have more employees using these devices are spending more on information security and are more likely to be implementing most of these practices The reverse was also found to be true the worst performers are simply not implementing the practices or are implementing a few rather than all (Figure 12)
Figure 12 Practices implemented to manage the risks
Practices that determine outcomes
limit access geo-track devices protect and backup data wipe
devices that are lost or stolen prevent
unauthorized logons deliver training no
ROMs or App-markets
Source IT Policy Compliance Group 2011
Managing the Benefits and Risks of Mobile Computing
17
Controls Used to Manage Risks Controls are used in business to assist with the execution of business strategy to manage business outcomes and to manage risk In the case of managing risks related to the use of mobile devices to access information and applications the controls employed by the best performers include using antivirus andor anti-malware scans of the devices encrypting sensitive information on the devices preventing unauthorized people and devices from accessing sensitive information and applications patching mobile device systems-level software where possible and testing configurations of the devices (Table 10)
Table 10 Controls used to manage risks
Priority Controls used to manage the risks
1 Use anti-virus and anti-malware
2 Protect sensitive information on devices with encryption
3 Prevent unauthorized devices and people from accessing informationapplications
4 Patch systems software on devices where possible
5 Test configurations and settings on devices
Source IT Policy Compliance Group 2011
Of the controls tested by the research the one implemented by a clear majority of the best performers is the use of anti-virus andor anti-malware scans The least commonly implemented control among these best performers is the use of virtual private networking (VPN) although interviews revealed many respondents were using some form of VPN with Smartphones in the workplace
In contrast several controls are either not implemented or are less likely implemented by the worst performers These include the scanning of ROMs on mobile devices scanning of vulnerabilities on mobile devices conducting penetration tests on mobile devices patching systems-level software where possible and using virtual private networking (Figure 13)
Figure 13 Controls used to manage risks
Controls to use anti-virusanti-malware encryption checks and limits on unauthorized
devicespeople patches and
configuration testing
Source IT Policy Compliance Group 2011
Managing the Benefits and Risks of Mobile Computing
18
Interestingly the biggest complaint the Group found in the interviews was due to ldquothe lack of patches to update the Android operating systemrdquo For this reason alone we found that many organizations had developed a ldquono Androidrdquo policy or told its users that Android phones could no longer be used Another practice found to significantly impact outcomes is how frequently organizations conduct assessments
Consistency of Assessments and Reporting The rate at which controls to manage risks are monitored assessed and reported on is directly related to outcomes For example the findings reveal significant differences from annual to monthly rates with those conducting less frequent assessments being among the majority of the worst performers and those with the most frequent assessments being among the best performers (Table 11)
Table 11 Rate of assessment and reporting
Outcome Average rate of assessment and reporting
Worst Once every twelve months
Average Once every four-to-five months
Best Once every month or less
Source IT Policy Compliance Group 2011
Mirroring findings in related research the rate at which controls are monitored assessed and compared against a range of conditions including policies prioritized risks threats gold-standards regulatory requirements and internal configuration baselines among others defines
1) When organizations find gaps in controls and procedures
2) Whether risks are larger than expected
3) Whether organizations are able to take appropriate action
4) Whether organizations are able to reduce business risks
When looked at from the perspective of size the research reveals many organizations may not have the tools to automate such assessments or are simply choosing to conduct annual audit review assessments rather than ongoing business risk assessments (Figure 14)
Figure 14 Rate of assessment and reporting
The best performers consistently assess
and report on controls and risks more
frequently
Source IT Policy Compliance Group 2011
Managing the Benefits and Risks of Mobile Computing
19
In addition to the rate of assessment and reporting another defining practice responsible for outcomes is found to be spending on information security by organizations
Spend on Information Security and Outcomes Worst performers are spending 60 percent less than average while the best performers are spending 60 percent more than average performers (Table 12)
Table 12 Spend on information security
Outcome Relative spend on information security compared with average performers
Worst 04
Average 10
Best 16
Source IT Policy Compliance Group 2011
In addition to the relative difference in spend on information security there are large differences in the percentage of the IT budget spent on information security While the range of spend among the worst is from zero to slightly more than 5 of the IT budget the average spent by the worst is less than three percent In contrast average performers spend 75 percent and best performers are spending 12 percent on average (Figure 15)
Figure 15 Spend on information security
The best performers spend a larger
percentage of a larger IT budget on
information security
Source IT Policy Compliance Group 2011
The amount spent is more revealing when considering the actual IT budgets IT budgets among worst performers is just 30 percent of what average performers spend on IT while the amount spent on IT by the best performers is more than 30 percent higher than the average performers
Thus smaller percentages of much smaller annual IT budgets are characteristic of spending on information security by the worst performers while larger percentages of much larger annual IT budgets are characteristic of spending on information security by the best performers
Spending on information security among some of the worst performers actually bottomed-out during the latter half of 2011 When combined with no controls on mobile devices and a culture that is ignoring or discounting the business risks related to the use of Mobile devices it is possible that 2012 could be a year with some negative brand-wrecking events for some of these organizations The best performers will be happy to have positioned themselves differently
Managing the Benefits and Risks of Mobile Computing
20
Back to the Future Is the adoption of Mobile computing a repeat of what occurred in the 1980s Back then it was connecting PCs via local networks to provide office workers with access to information that could be analyzed and acted on in local work groups Today it is about wirelessly interconnecting Mobile devices enabling anyone to share and act on information from any location If today is any indication of what happened in the 1980s then the use of these new powerful pocket-sized but supercharged Mobile devices is likely to change to shape of computing as we know it today
The use of Smartphones by 8-in-10 organizations could likely grow And the use of these devices by employees artificially restricted to 33 percent for now will likely grow as management systems and security controls become more standardized
But we are in a high-growth expansionary phase where Phone manufacturers and carriers are incented to cannibalize products they shipped just last year or as recently as last month leaving consumers employees and organizations with devices that are out of date and may never be updated with systems-level software that would otherwise cure security vulnerabilities
Unfortunately there is no standard Android phone unless you purchase a Google Nexus phone which will be updated by Google directly But the majority of Android phones purchased by consumers and employees are not stock Google Android phones Instead the vast majority of Android phones are overlaid by supplier goo-gads carrier changes along with unexpected and unwanted mdash Carrier IQ mdash additions The carriers and phone manufacturers are incented by the sale of new hardware bling and new service contracts
Encouraged by Google and the profit margins from the latest hardware bling and service contracts the carriers and phone manufacturers continue to develop their own versions of Android What the carriers and phone manufacturers are not incented to do is to deploy software updates to the Android operating system to their customers and so they donrsquot Instead they find it less expensive to lure their customers into an upgrade to a new device on contract two years later
There are more stable and routinely updated
operating systems shipping with
Smartphones from Applersquos iOS RIMrsquos
Blackberry and Windows phone
Eventually these problems and others may resolve themselves but it could be another few years mdash or more mdash of frustration before anything resembling stability in the Android operating system is common and enterprise-ready management tools and security controls are available for these new wonders of the information age
In the meantime there are much more stable mdash and routinely updated mdash operating systems shipping with Smartphones from Applersquos iOS RIMrsquos Blackberry and Windows phone None of these suffer the same problems afflicting Android phones
Whatever you do remember the lessons about what worked mdash and what didnrsquot mdash with earlier generational-changes such as the advent of PCs or the dawn of Internet-computing This longer-term perspective and the lessons will come in handy in formulating strategy and tactics as the use of Mobile computing expands in your workplace
Summary Observations Based on the outcomes being achieved by the best performing organizations
The business benefits of using Smartphones and Tablet computers include
Improved access to business information from any location
Improved customer retention and satisfaction levels and
Higher levels of revenue and profitability when compared with peers
The business risks of using mobile computing devices include
Loss or theft of sensitive information
Unauthorized access to information and applications
Loss of governance or control over sensitive business information business applications business risks and audits
Managing the Benefits and Risks of Mobile Computing
21
The primary information and applications currently being used with mobile devices include
Email and collaborative applications
Office productivity applications
Sales force automation applications
The primary actions to take to limit business risks include
Limit the use of Smartphones in the workplace to specifically approved employees
Fewer than 50 percent of employees currently use Smartphonersquos among the best performers
Policies and practices to implement include
Have IT manage all Tablet computers and Smartphones
Allow approved employees to use their own Smartphones
Furnish Tablet computers to employees
Considerations to evaluate include
Mobile devices are another part of the requirements of your information security audits
Compare your due-care requirements to defend against legal inquiry
Identify your cross-border data privacy and ownership requirements
Practices to implement include
Limit the use of Smartphones to access information and applications to approved employees
Limit access to sensitive information and applications for mobile devices
Geo-track devices especially Smartphones
Prohibit the use of custom ROMs and unapproved App-marketssites
Deliver security awareness training and measure effectiveness with employees
Scan mobile devices with anti-virus and anti-malware
Protect and backup information on the devices
Wipe and lock stolen and lost devices as soon as notified by employees
Investigate the availability of patching as part of device evaluations
Use frequent controls and configuration testing to reduce gaps and limit risks
Increase spend on information security beyond your peers
Managing the Benefits and Risks of Mobile Computing
22
Appendix Expected Changes in Device Use in the Workplace 2011 to 2013 Respondents were asked to identify changes that are most likely going to occur in organizational and employee uses of Smartphones and Tablet computers between 2011 and 2013 As projections these forecasts of user and organizational expectations are reflections of current sentiment
The use of Smartphones by organizations is expected to remain the same between 2011 and 2013 at 79 percent of all organizations However the use of Smartphones to access information and applications by employees is expected to increase from 33 percent to 39 percent (Table 13)
Table 13 Device use 2011 to 2013
Device being used Use by organizationsemployees
2011 2013 Change in use
Organizational use 79 79 -0- Smartphones
Employee use 33 39 6 increase
Organizational use 35 49 14 increase Tablet computers
Employee use 22 32 10 increase
Source IT Policy Compliance Group 2011
Unlike Smartphones the use of Tablet computers is expected to increase for organizations and employees from an average rate of 35 percent to 49 percent for organizations and from 22 to 32 for employees The increases are larger than the sample error of seven percent
After an increase in employees using both devices what is rather intriguing is an expected downtrend in the use of Smartphones among organizations with the best outcomes The decline in the use of Smartphones among best performers is expected to be from 85 percent to 73 percent mdash a decrease of 12 percent mdash from 2011 to 2013 (Figure 16)
Figure 16 Expected changes in device use
Source IT Policy Compliance Group 2011
The explanation for the overall rate of decline of Smartphone use among best performing organization can be found from declines in the uses of iPhone and Windows Phone platforms and much more significant declines in the use of Android and Blackberry phones
At the time the research was being carried out RIM was suffering from blackouts in its services around the World with rolling service-outages that occurred across multiple continents during a one-week period The general consensus of many people we spoke with at the time was the service-outages ldquoare the final event I need to make the switch when my subscription period is duerdquo On the other hand others simply replaced their Blackberry devices that week and did not wait until their subscription was due for renewal
Unlike the RIM Blackberry platforms we found consistently strong disaffection with Android devices due to the inability to obtain updates for the Android operating system without having to root devices and hope for the best using custom ROMs
Managing the Benefits and Risks of Mobile Computing
23
These problems left many saying things like ldquoI bought a pig in a poke never againrdquo Others took matters into their own hands rooted their phones and installed updated versions of Android over the Internet from a number of different development sites none of which were blessed by carriers phone manufacturers or their IT staff
IT managers the Group spoke with identified an utter lack of management tools for Android devices too many versions of Android and a complete lack of vulnerability testing for the devices The inability to update and cure security-problems were just some of the problems identified by IT managers the Group spoke with The upshot for many were two common reactions to the use of Android in the enterprise 1) if it was already deployed the common reaction was to pull back support for Android and convert to other supported Smartphones and 2) if Android was not already deployed wait for Android to become enterprise-ready (Table 14)
Table 14 Reaction to Android phones in the workplace
Status of Android Smartphones
Reaction
Already deployed Pull-back and convert to other Smartphones
If not already deployed Wait for Android to become enterprise-ready
Source IT Policy Compliance Group 2011
When it comes to Tablet computers the sentiment about expected changes in use of different platforms reveals Android Tablet computers likely to see the biggest gains between now and 2013 followed by healthy gains in the use of other Tablet computers The only sentiment indicating significant declines appear to be related to Android and Blackberry Smartphones (Figure 17)
Figure 17 Expected changes in platform use
Source IT Policy Compliance Group 2011
The outlook of current sentiment regarding use of different platforms by 2013 clearly indicates the best performers are predisposed to ditch Android and Blackberry phones and significantly increase the use of iPad Tablet computers
By contrast the worst performers are predisposed to increase use of Smartphones and Tablet computers across the board and with the exception of Blackberry phones increase other mobile device platforms among average performers
Managing the Benefits and Risks of Mobile Computing
24
Additional Resources Numerous sources of related information are available for those interested in pursuing more information on a wide range of topics related to Smartphones and Tablet computers The following are but a small sample of related information perspectives and insight The authors of these articles have no relationship with the ITPCG Android Security See httpdeveloperandroidcomguidetopicssecuritysecurityhtml Android Orphans Visualizing a Sad History of Support See httptheunderstatementcompost11982112928android-orphans-visualizing-a-sad-history-of-support A Look into Mobile Device Security httpwwwsymanteccomcontentenusaboutmediapdfssymc_mobile_device_security_june2011pdfom_ext_cid=biz_socmed_twitter_facebook_marketwire_linkedin_2011Jun_worldwide_mobilesecuritywp Carrier IQ what it is what it isnrsquot and what you need to do httpwwwengadgetcom20111201carrier-iq-what-it-is-what-it-isnt-and-what-you-need-to CIS Apple iOS configuration benchmarks httpbenchmarkscisecurityorgen-usroute=downloadsbrowsecategorybenchmarksmobileiphone Current Android Malware httpforensicsspreitzenbarthdepage_id=254 DISA STIGs for Smartphones - unclassified httpiasedisamilstigsnet_perimeterwirelesssmartphonehtml iOS Hardening Configuration Guide Department of Defence Intelligence and Security Australian Government httpwwwdsdgovaupublicationsiOS_Hardening_Guidepdf Mac OS X and iOS Security httpdeveloperapplecomlibrarymacdocumentationSecurityConceptualSecurity_OverviewArchitectureArchitecturehtmlapple_refdocuidTP30000976-CH202-TPXREF101 Mobile Malware Why Fraudsters are Two Steps Ahead httpwwwtrusteercomblogmobile-malware-why-fraudsters-are-two-steps-ahead Rootkit called Carrier IQ discovered phoning home with user data httpwwwzdnetcomblogapplerootkit-called-carrier-iq-discovered-phoning-home-with-user-data11792 RIM launches Blackberry Fusion to Secure Android and Apple devices httpbusinessfinancialpostcom20111129rim-launching-blackberry-mobile-fusion-to-secure-iphone-android-devices Smartphone Security httpwwwenisaeuropaeuactapplication-securitysmartphone-security-1 The Spy Files Map httpwikileaksorgThe-Spyfiles-The-Maphtml Ten Steps to Secure Your Mobile Devices httpswikiinternet2educonfluencedisplayitsg2Mobile+Device+Security
Why Your Phone is Insecure by Design httpwwwforbescomsitesandygreenberg20110812codebreaker-karsten-nohl-why-your-phone-is-insecure-by-design
Managing the Benefits and Risks of Mobile Computing
25
About the Research Topics researched by the IT Policy Compliance Group (IT PCG) are part of an ongoing calendar established in consultation with Advisory General and Charter members of the Group as well as from findings compiled from ongoing research In addition to specific tracking questions common to each benchmark the research is designed to uncover the relationship between business results outcomes being experienced by organizations actions taken practices implemented and capabilities organizations use to respond
The qualitative research findings presented in this report are from numerous focus groups one-on-one interviews and meetings held with larger audiences throughout 2011 The quantitative findings contained in this report are from primary research studies conducted with 210 organizations in North America during late 2011
The maximum error for the sample findings for the benchmark findings contained in this report is +- seven percent The primary focus of analysis contained in this report is to present the largest differences between the outcomes experienced and similarly aligned findings that are most responsible for the differences in outcomes Instead of relying on differences that are within or close to the sample errors the effort has been to focus on the largest differences For example instead of focusing on differences involving +- 10 percent the findings covered in this report tend to focus on the largest differences in the range of 50 percent or more
The findings covering the use of Mobile computing are representative of organizations in North America and cannot be construed or inferred to represent current usage or plans for Mobile computing outside of North America However the findings covering the performance outcomes benefits and risks of Mobile computing the practices to manage the business risks and the controls to manage the risks match findings from similar studies covering other geographies outside of North America including findings from Latin America South America Europe Africa the Middle East Asia and Oceania
Industries represented The quantitative research includes representation from the following industries advertising accounting services aerospace agriculture apparel architecture automotive banking chemicals computer equipment and peripherals computer software and services construction consumer durable goods distribution education engineering services entertainment financial services food and beverage government (local state and federal level public administration) government (defense and intelligence) health medical and dental services insurance law enforcement management services media scientific and consulting services manufacturing pharmaceuticals public relations publishing real estate rental and leasing services retail trade telecommunications equipment telecommunication services transportation warehousing travel accommodation and hospitality services utilities waste management and wholesale trade Five industries represent 47 percent of the sample These include Banking Education Financial and Accounting Services Manufacturing and Retail Trade Another 27 industries represent the other 53 percent of the sample none of which represents more than five percent of the sample
Revenue or agency budgets of participating organizations Size of the organizations participating in the most recent benchmarks is somewhat evenly distributed although slightly fewer represent midsize organizations Thirty-six percent of the organizations represented by the findings have annual revenues or agency budgets that are less than $50 million Another twenty-nine percent of the sample has annual revenues or agency budgets between $50 million and $999 million The remaining thirty-five percent of the sample has annual revenues or agency budgets that are $1 billion or more
Functional areas of responsibility Thirty-five percent of the qualified participants for the benchmark work in IT with another 30 percent work in finance or internal controls The remaining 35 percent of the qualified participants work in a wide variety of functions from business line management senior management product design and development legal compliance sales marketing procurement logistics and customer services among other functions
Job titles of participants Thirty-five percent of the participants in the benchmark are senior managers with titles that include CEO CIO CFO or Vice president Thirty-eight percent are managers or directors and twenty-seven percent are staff in their organizations
Managing the Benefits and Risks of Mobile Computing
About IT Policy Compliance Group The mission of the IT Policy Compliance Group is to promote actionable findings based on evidence to assist organizations with delivering more value less risk and achieve IT policy and compliance objectives related to the use of information systems The Group Web site at wwwitpolicycompliancecom features quick two-minute self-assessments to compare outcomes and practices against onersquos industry peers and best performing organizations research reports continuing professional education conferences and seminars member and knowledge centers related research from around the World and resources including standards and frameworks associations government and regulators
The Grouprsquos research is designed to help IT risk legal financial and internal audit professionals to
Benchmark results and efforts against peers and best-in-class performers
Identify key drivers challenges and responses to improve results
Determine the applicability and use of specific capabilities to improve results
Identify best practices based on results and experience of peers
The Group relies upon its members and advisors for its research and editorial calendar
IT Policy Compliance Group Charter Members
The Institute of Symantec Corporation Internal Auditors ISACA 350 Ellis Street 247 Maitland Avenue 3701 Algonquin Road Suite 1010 Mountain View CA 94043 Altamonte Springs FL 32701 Rolling Meadows IL 60008 +1 (650) 527 8000 +1 (407) 937 1100 +1 (847) 253 1545 wwwsymanteccom wwwtheiiaorg wwwisacaorg infosymanteccom iiatheiiaorg infoisacaorg
Computer Security Institute Protiviti IT Governance Institute 600 Harrison Street New York Office 3701 Algonquin Road Suite 1010 San Francisco CA 94107 1290 Avenue of the Rolling Meadows IL 60008 +1 (415) 947 6320 Americas 5th Floor +1 (847) 660 5600 wwwgocsicom New York New York 10104 wwwitgiorg csicmpcom +1 (212) 603 8300 infoitgiorg wwwprotiviticom infoprotiviticom
IT Policy Compliance Group Affiliate Members and Advisors A current list of Affiliate Members and Advisors to the Group can be found on the IT Policy Compliance Group website
26
Founded in 2005 the IT Policy Compliance Group conducts benchmark research focused on delivering fact-based guidance on the steps that can be taken to improve results Benchmark results are reported through wwwitpolicycompliancecom for the benefit of members
IT Policy Compliance Group
Contacts Managing Director Jim Hurley Telephone +1 (216) 373 7010 jhurleyitpolicycompliancecom Managing Editor John Ortbal Telephone +1 (847) 444 0344 jortbalitpolicycompliancecom wwwitpolicycompliancecom
December 2011
The information contained in this publication has been obtained from sources that the IT Policy Compliance Group believes to be reliable but is not guaranteed Research publications reflect current conditions that are subject to change without notice
Copyright copy 2011 IT Policy Compliance Group Names and logos may be trademarks of their respective owners All rights reserved 1211 293167003
32
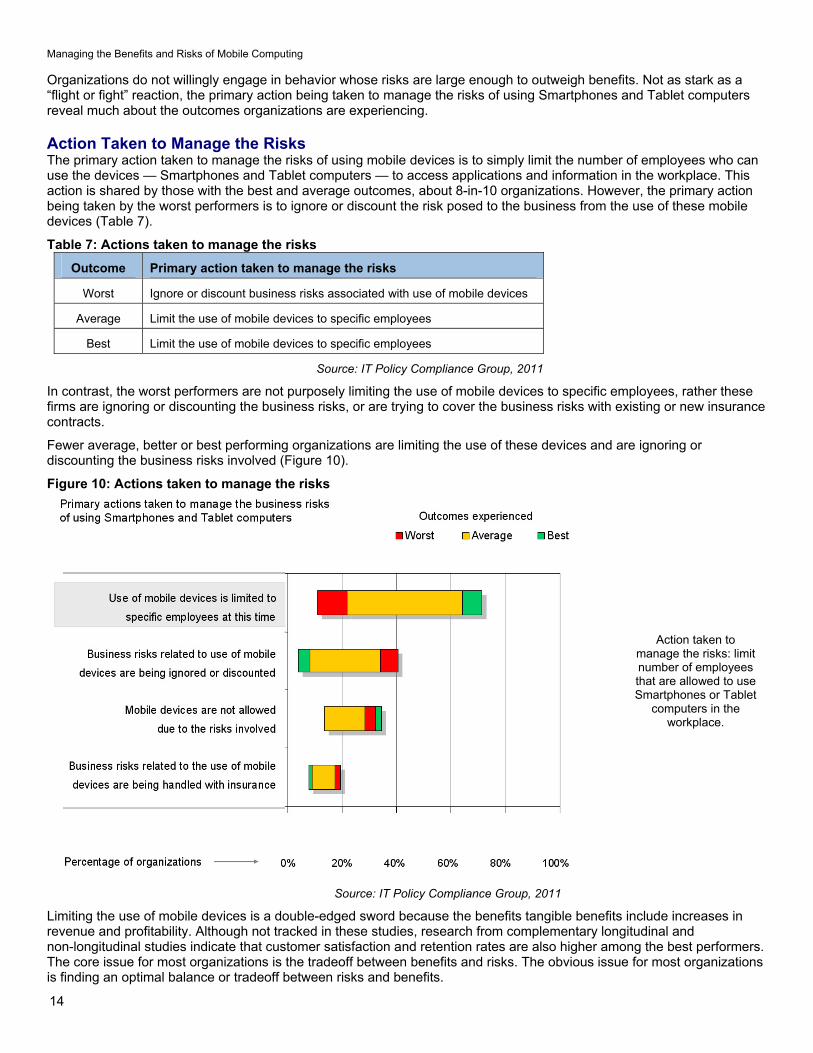
Managing the Benefits and Risks of Mobile Computing
14
Organizations do not willingly engage in behavior whose risks are large enough to outweigh benefits Not as stark as a ldquoflight or fightrdquo reaction the primary action being taken to manage the risks of using Smartphones and Tablet computers reveal much about the outcomes organizations are experiencing
Action Taken to Manage the Risks The primary action taken to manage the risks of using mobile devices is to simply limit the number of employees who can use the devices mdash Smartphones and Tablet computers mdash to access applications and information in the workplace This action is shared by those with the best and average outcomes about 8-in-10 organizations However the primary action being taken by the worst performers is to ignore or discount the risk posed to the business from the use of these mobile devices (Table 7)
Table 7 Actions taken to manage the risks
Outcome Primary action taken to manage the risks
Worst Ignore or discount business risks associated with use of mobile devices
Average Limit the use of mobile devices to specific employees
Best Limit the use of mobile devices to specific employees
Source IT Policy Compliance Group 2011
In contrast the worst performers are not purposely limiting the use of mobile devices to specific employees rather these firms are ignoring or discounting the business risks or are trying to cover the business risks with existing or new insurance contracts
Fewer average better or best performing organizations are limiting the use of these devices and are ignoring or discounting the business risks involved (Figure 10)
Figure 10 Actions taken to manage the risks
Action taken to manage the risks limit number of employees that are allowed to use Smartphones or Tablet
computers in the workplace
Source IT Policy Compliance Group 2011
Limiting the use of mobile devices is a double-edged sword because the benefits tangible benefits include increases in revenue and profitability Although not tracked in these studies research from complementary longitudinal and non-longitudinal studies indicate that customer satisfaction and retention rates are also higher among the best performers The core issue for most organizations is the tradeoff between benefits and risks The obvious issue for most organizations is finding an optimal balance or tradeoff between risks and benefits
Managing the Benefits and Risks of Mobile Computing
15
Limiting the Number of Employees Who Use Mobile Devices Despite the benefits of using mobile devices the business risks are purposely keeping low the number of employees using these mobile devices in the workplace The number of employees using Smartphones to access information and applications is a rather low 3-in-10 people (33 percent) despite the high 8-in-10 (79 percent) number of organizations using these devices Similarly the average number of employees using Tablet computers to access information and applications is just 1-in-5 people (22 percent) among the 35 percent of organizations using these devices (Figure 11)
Figure 11 Use of mobile devices by employees
It is the use of Smartphones by
employees that are being artificially
restricted because of the business risks
Source IT Policy Compliance Group 2011
The use of mobile Smartphones is being artificially limited by organizations due to the risks involved Whether it is the simple visual depiction contained in Figure 11 or the ratio of employees to organizations using the devices or the range of employees using the devices it is clear that it is the use of Smartphones by employees to access information and applications that are being artificially restricted (Table 8)
Table 8 Use of mobile devices by employees
Employee use for 65 of
organizations
Employee use for 95 of
organizations
Ratio of employee use to organization use
Smartphones 31 to 36 29 to 38 42
Tablet computers 18 to 27 14 to 31 63
Source IT Policy Compliance Group 2011
Thus the calculus of determining who uses and who does not use Smartphones to access information and applications at an organization is as much a determination of business need and value as much as it is an evaluation of business risk
As part of the research the Group delved into additional practices organizations implement to see if there are other factors responsible for better mdash or worse mdash outcomes associated with the use of Mobile devices
Managing the Benefits and Risks of Mobile Computing
16
Practices that Determine Outcomes The primary practices being implemented to manage business risks for the employees who are using Smartphones and Tablet computers include limiting access to sensitive information or applications geo-tracking and locating lost or stolen devices protecting and backing-up information from mobile devices wiping sensitive information from stolen or lost mobile devices preventingrecording unauthorized logins from mobile devices delivering security-awareness training to employees who use mobile devices and prohibiting access to Apps-markets Apps-sites and custom ROMs on mobile devices (Table 9)
Table 9 Practices implemented to manage the risks
Priority Practices determining outcomes
1 Limit access to sensitive information and applications
2 Geo-track devices to aid in recovery or destruction of information
3 Protect and backup information from devices
4 Wipe stolen or lost devices of information and credentials
5 Prevent and record unauthorized logon attempts
6 Deliver and measure policy and security awareness training for users
7 Prohibit custom ROMs for rooted devices and access to App-markets
Source IT Policy Compliance Group 2011
As the research uncovered the range of practices implemented to manage business risks are directly related to outcomes Far more of the best performing organizations have more employees using these devices are spending more on information security and are more likely to be implementing most of these practices The reverse was also found to be true the worst performers are simply not implementing the practices or are implementing a few rather than all (Figure 12)
Figure 12 Practices implemented to manage the risks
Practices that determine outcomes
limit access geo-track devices protect and backup data wipe
devices that are lost or stolen prevent
unauthorized logons deliver training no
ROMs or App-markets
Source IT Policy Compliance Group 2011
Managing the Benefits and Risks of Mobile Computing
17
Controls Used to Manage Risks Controls are used in business to assist with the execution of business strategy to manage business outcomes and to manage risk In the case of managing risks related to the use of mobile devices to access information and applications the controls employed by the best performers include using antivirus andor anti-malware scans of the devices encrypting sensitive information on the devices preventing unauthorized people and devices from accessing sensitive information and applications patching mobile device systems-level software where possible and testing configurations of the devices (Table 10)
Table 10 Controls used to manage risks
Priority Controls used to manage the risks
1 Use anti-virus and anti-malware
2 Protect sensitive information on devices with encryption
3 Prevent unauthorized devices and people from accessing informationapplications
4 Patch systems software on devices where possible
5 Test configurations and settings on devices
Source IT Policy Compliance Group 2011
Of the controls tested by the research the one implemented by a clear majority of the best performers is the use of anti-virus andor anti-malware scans The least commonly implemented control among these best performers is the use of virtual private networking (VPN) although interviews revealed many respondents were using some form of VPN with Smartphones in the workplace
In contrast several controls are either not implemented or are less likely implemented by the worst performers These include the scanning of ROMs on mobile devices scanning of vulnerabilities on mobile devices conducting penetration tests on mobile devices patching systems-level software where possible and using virtual private networking (Figure 13)
Figure 13 Controls used to manage risks
Controls to use anti-virusanti-malware encryption checks and limits on unauthorized
devicespeople patches and
configuration testing
Source IT Policy Compliance Group 2011
Managing the Benefits and Risks of Mobile Computing
18
Interestingly the biggest complaint the Group found in the interviews was due to ldquothe lack of patches to update the Android operating systemrdquo For this reason alone we found that many organizations had developed a ldquono Androidrdquo policy or told its users that Android phones could no longer be used Another practice found to significantly impact outcomes is how frequently organizations conduct assessments
Consistency of Assessments and Reporting The rate at which controls to manage risks are monitored assessed and reported on is directly related to outcomes For example the findings reveal significant differences from annual to monthly rates with those conducting less frequent assessments being among the majority of the worst performers and those with the most frequent assessments being among the best performers (Table 11)
Table 11 Rate of assessment and reporting
Outcome Average rate of assessment and reporting
Worst Once every twelve months
Average Once every four-to-five months
Best Once every month or less
Source IT Policy Compliance Group 2011
Mirroring findings in related research the rate at which controls are monitored assessed and compared against a range of conditions including policies prioritized risks threats gold-standards regulatory requirements and internal configuration baselines among others defines
1) When organizations find gaps in controls and procedures
2) Whether risks are larger than expected
3) Whether organizations are able to take appropriate action
4) Whether organizations are able to reduce business risks
When looked at from the perspective of size the research reveals many organizations may not have the tools to automate such assessments or are simply choosing to conduct annual audit review assessments rather than ongoing business risk assessments (Figure 14)
Figure 14 Rate of assessment and reporting
The best performers consistently assess
and report on controls and risks more
frequently
Source IT Policy Compliance Group 2011
Managing the Benefits and Risks of Mobile Computing
19
In addition to the rate of assessment and reporting another defining practice responsible for outcomes is found to be spending on information security by organizations
Spend on Information Security and Outcomes Worst performers are spending 60 percent less than average while the best performers are spending 60 percent more than average performers (Table 12)
Table 12 Spend on information security
Outcome Relative spend on information security compared with average performers
Worst 04
Average 10
Best 16
Source IT Policy Compliance Group 2011
In addition to the relative difference in spend on information security there are large differences in the percentage of the IT budget spent on information security While the range of spend among the worst is from zero to slightly more than 5 of the IT budget the average spent by the worst is less than three percent In contrast average performers spend 75 percent and best performers are spending 12 percent on average (Figure 15)
Figure 15 Spend on information security
The best performers spend a larger
percentage of a larger IT budget on
information security
Source IT Policy Compliance Group 2011
The amount spent is more revealing when considering the actual IT budgets IT budgets among worst performers is just 30 percent of what average performers spend on IT while the amount spent on IT by the best performers is more than 30 percent higher than the average performers
Thus smaller percentages of much smaller annual IT budgets are characteristic of spending on information security by the worst performers while larger percentages of much larger annual IT budgets are characteristic of spending on information security by the best performers
Spending on information security among some of the worst performers actually bottomed-out during the latter half of 2011 When combined with no controls on mobile devices and a culture that is ignoring or discounting the business risks related to the use of Mobile devices it is possible that 2012 could be a year with some negative brand-wrecking events for some of these organizations The best performers will be happy to have positioned themselves differently
Managing the Benefits and Risks of Mobile Computing
20
Back to the Future Is the adoption of Mobile computing a repeat of what occurred in the 1980s Back then it was connecting PCs via local networks to provide office workers with access to information that could be analyzed and acted on in local work groups Today it is about wirelessly interconnecting Mobile devices enabling anyone to share and act on information from any location If today is any indication of what happened in the 1980s then the use of these new powerful pocket-sized but supercharged Mobile devices is likely to change to shape of computing as we know it today
The use of Smartphones by 8-in-10 organizations could likely grow And the use of these devices by employees artificially restricted to 33 percent for now will likely grow as management systems and security controls become more standardized
But we are in a high-growth expansionary phase where Phone manufacturers and carriers are incented to cannibalize products they shipped just last year or as recently as last month leaving consumers employees and organizations with devices that are out of date and may never be updated with systems-level software that would otherwise cure security vulnerabilities
Unfortunately there is no standard Android phone unless you purchase a Google Nexus phone which will be updated by Google directly But the majority of Android phones purchased by consumers and employees are not stock Google Android phones Instead the vast majority of Android phones are overlaid by supplier goo-gads carrier changes along with unexpected and unwanted mdash Carrier IQ mdash additions The carriers and phone manufacturers are incented by the sale of new hardware bling and new service contracts
Encouraged by Google and the profit margins from the latest hardware bling and service contracts the carriers and phone manufacturers continue to develop their own versions of Android What the carriers and phone manufacturers are not incented to do is to deploy software updates to the Android operating system to their customers and so they donrsquot Instead they find it less expensive to lure their customers into an upgrade to a new device on contract two years later
There are more stable and routinely updated
operating systems shipping with
Smartphones from Applersquos iOS RIMrsquos
Blackberry and Windows phone
Eventually these problems and others may resolve themselves but it could be another few years mdash or more mdash of frustration before anything resembling stability in the Android operating system is common and enterprise-ready management tools and security controls are available for these new wonders of the information age
In the meantime there are much more stable mdash and routinely updated mdash operating systems shipping with Smartphones from Applersquos iOS RIMrsquos Blackberry and Windows phone None of these suffer the same problems afflicting Android phones
Whatever you do remember the lessons about what worked mdash and what didnrsquot mdash with earlier generational-changes such as the advent of PCs or the dawn of Internet-computing This longer-term perspective and the lessons will come in handy in formulating strategy and tactics as the use of Mobile computing expands in your workplace
Summary Observations Based on the outcomes being achieved by the best performing organizations
The business benefits of using Smartphones and Tablet computers include
Improved access to business information from any location
Improved customer retention and satisfaction levels and
Higher levels of revenue and profitability when compared with peers
The business risks of using mobile computing devices include
Loss or theft of sensitive information
Unauthorized access to information and applications
Loss of governance or control over sensitive business information business applications business risks and audits
Managing the Benefits and Risks of Mobile Computing
21
The primary information and applications currently being used with mobile devices include
Email and collaborative applications
Office productivity applications
Sales force automation applications
The primary actions to take to limit business risks include
Limit the use of Smartphones in the workplace to specifically approved employees
Fewer than 50 percent of employees currently use Smartphonersquos among the best performers
Policies and practices to implement include
Have IT manage all Tablet computers and Smartphones
Allow approved employees to use their own Smartphones
Furnish Tablet computers to employees
Considerations to evaluate include
Mobile devices are another part of the requirements of your information security audits
Compare your due-care requirements to defend against legal inquiry
Identify your cross-border data privacy and ownership requirements
Practices to implement include
Limit the use of Smartphones to access information and applications to approved employees
Limit access to sensitive information and applications for mobile devices
Geo-track devices especially Smartphones
Prohibit the use of custom ROMs and unapproved App-marketssites
Deliver security awareness training and measure effectiveness with employees
Scan mobile devices with anti-virus and anti-malware
Protect and backup information on the devices
Wipe and lock stolen and lost devices as soon as notified by employees
Investigate the availability of patching as part of device evaluations
Use frequent controls and configuration testing to reduce gaps and limit risks
Increase spend on information security beyond your peers
Managing the Benefits and Risks of Mobile Computing
22
Appendix Expected Changes in Device Use in the Workplace 2011 to 2013 Respondents were asked to identify changes that are most likely going to occur in organizational and employee uses of Smartphones and Tablet computers between 2011 and 2013 As projections these forecasts of user and organizational expectations are reflections of current sentiment
The use of Smartphones by organizations is expected to remain the same between 2011 and 2013 at 79 percent of all organizations However the use of Smartphones to access information and applications by employees is expected to increase from 33 percent to 39 percent (Table 13)
Table 13 Device use 2011 to 2013
Device being used Use by organizationsemployees
2011 2013 Change in use
Organizational use 79 79 -0- Smartphones
Employee use 33 39 6 increase
Organizational use 35 49 14 increase Tablet computers
Employee use 22 32 10 increase
Source IT Policy Compliance Group 2011
Unlike Smartphones the use of Tablet computers is expected to increase for organizations and employees from an average rate of 35 percent to 49 percent for organizations and from 22 to 32 for employees The increases are larger than the sample error of seven percent
After an increase in employees using both devices what is rather intriguing is an expected downtrend in the use of Smartphones among organizations with the best outcomes The decline in the use of Smartphones among best performers is expected to be from 85 percent to 73 percent mdash a decrease of 12 percent mdash from 2011 to 2013 (Figure 16)
Figure 16 Expected changes in device use
Source IT Policy Compliance Group 2011
The explanation for the overall rate of decline of Smartphone use among best performing organization can be found from declines in the uses of iPhone and Windows Phone platforms and much more significant declines in the use of Android and Blackberry phones
At the time the research was being carried out RIM was suffering from blackouts in its services around the World with rolling service-outages that occurred across multiple continents during a one-week period The general consensus of many people we spoke with at the time was the service-outages ldquoare the final event I need to make the switch when my subscription period is duerdquo On the other hand others simply replaced their Blackberry devices that week and did not wait until their subscription was due for renewal
Unlike the RIM Blackberry platforms we found consistently strong disaffection with Android devices due to the inability to obtain updates for the Android operating system without having to root devices and hope for the best using custom ROMs
Managing the Benefits and Risks of Mobile Computing
23
These problems left many saying things like ldquoI bought a pig in a poke never againrdquo Others took matters into their own hands rooted their phones and installed updated versions of Android over the Internet from a number of different development sites none of which were blessed by carriers phone manufacturers or their IT staff
IT managers the Group spoke with identified an utter lack of management tools for Android devices too many versions of Android and a complete lack of vulnerability testing for the devices The inability to update and cure security-problems were just some of the problems identified by IT managers the Group spoke with The upshot for many were two common reactions to the use of Android in the enterprise 1) if it was already deployed the common reaction was to pull back support for Android and convert to other supported Smartphones and 2) if Android was not already deployed wait for Android to become enterprise-ready (Table 14)
Table 14 Reaction to Android phones in the workplace
Status of Android Smartphones
Reaction
Already deployed Pull-back and convert to other Smartphones
If not already deployed Wait for Android to become enterprise-ready
Source IT Policy Compliance Group 2011
When it comes to Tablet computers the sentiment about expected changes in use of different platforms reveals Android Tablet computers likely to see the biggest gains between now and 2013 followed by healthy gains in the use of other Tablet computers The only sentiment indicating significant declines appear to be related to Android and Blackberry Smartphones (Figure 17)
Figure 17 Expected changes in platform use
Source IT Policy Compliance Group 2011
The outlook of current sentiment regarding use of different platforms by 2013 clearly indicates the best performers are predisposed to ditch Android and Blackberry phones and significantly increase the use of iPad Tablet computers
By contrast the worst performers are predisposed to increase use of Smartphones and Tablet computers across the board and with the exception of Blackberry phones increase other mobile device platforms among average performers
Managing the Benefits and Risks of Mobile Computing
24
Additional Resources Numerous sources of related information are available for those interested in pursuing more information on a wide range of topics related to Smartphones and Tablet computers The following are but a small sample of related information perspectives and insight The authors of these articles have no relationship with the ITPCG Android Security See httpdeveloperandroidcomguidetopicssecuritysecurityhtml Android Orphans Visualizing a Sad History of Support See httptheunderstatementcompost11982112928android-orphans-visualizing-a-sad-history-of-support A Look into Mobile Device Security httpwwwsymanteccomcontentenusaboutmediapdfssymc_mobile_device_security_june2011pdfom_ext_cid=biz_socmed_twitter_facebook_marketwire_linkedin_2011Jun_worldwide_mobilesecuritywp Carrier IQ what it is what it isnrsquot and what you need to do httpwwwengadgetcom20111201carrier-iq-what-it-is-what-it-isnt-and-what-you-need-to CIS Apple iOS configuration benchmarks httpbenchmarkscisecurityorgen-usroute=downloadsbrowsecategorybenchmarksmobileiphone Current Android Malware httpforensicsspreitzenbarthdepage_id=254 DISA STIGs for Smartphones - unclassified httpiasedisamilstigsnet_perimeterwirelesssmartphonehtml iOS Hardening Configuration Guide Department of Defence Intelligence and Security Australian Government httpwwwdsdgovaupublicationsiOS_Hardening_Guidepdf Mac OS X and iOS Security httpdeveloperapplecomlibrarymacdocumentationSecurityConceptualSecurity_OverviewArchitectureArchitecturehtmlapple_refdocuidTP30000976-CH202-TPXREF101 Mobile Malware Why Fraudsters are Two Steps Ahead httpwwwtrusteercomblogmobile-malware-why-fraudsters-are-two-steps-ahead Rootkit called Carrier IQ discovered phoning home with user data httpwwwzdnetcomblogapplerootkit-called-carrier-iq-discovered-phoning-home-with-user-data11792 RIM launches Blackberry Fusion to Secure Android and Apple devices httpbusinessfinancialpostcom20111129rim-launching-blackberry-mobile-fusion-to-secure-iphone-android-devices Smartphone Security httpwwwenisaeuropaeuactapplication-securitysmartphone-security-1 The Spy Files Map httpwikileaksorgThe-Spyfiles-The-Maphtml Ten Steps to Secure Your Mobile Devices httpswikiinternet2educonfluencedisplayitsg2Mobile+Device+Security
Why Your Phone is Insecure by Design httpwwwforbescomsitesandygreenberg20110812codebreaker-karsten-nohl-why-your-phone-is-insecure-by-design
Managing the Benefits and Risks of Mobile Computing
25
About the Research Topics researched by the IT Policy Compliance Group (IT PCG) are part of an ongoing calendar established in consultation with Advisory General and Charter members of the Group as well as from findings compiled from ongoing research In addition to specific tracking questions common to each benchmark the research is designed to uncover the relationship between business results outcomes being experienced by organizations actions taken practices implemented and capabilities organizations use to respond
The qualitative research findings presented in this report are from numerous focus groups one-on-one interviews and meetings held with larger audiences throughout 2011 The quantitative findings contained in this report are from primary research studies conducted with 210 organizations in North America during late 2011
The maximum error for the sample findings for the benchmark findings contained in this report is +- seven percent The primary focus of analysis contained in this report is to present the largest differences between the outcomes experienced and similarly aligned findings that are most responsible for the differences in outcomes Instead of relying on differences that are within or close to the sample errors the effort has been to focus on the largest differences For example instead of focusing on differences involving +- 10 percent the findings covered in this report tend to focus on the largest differences in the range of 50 percent or more
The findings covering the use of Mobile computing are representative of organizations in North America and cannot be construed or inferred to represent current usage or plans for Mobile computing outside of North America However the findings covering the performance outcomes benefits and risks of Mobile computing the practices to manage the business risks and the controls to manage the risks match findings from similar studies covering other geographies outside of North America including findings from Latin America South America Europe Africa the Middle East Asia and Oceania
Industries represented The quantitative research includes representation from the following industries advertising accounting services aerospace agriculture apparel architecture automotive banking chemicals computer equipment and peripherals computer software and services construction consumer durable goods distribution education engineering services entertainment financial services food and beverage government (local state and federal level public administration) government (defense and intelligence) health medical and dental services insurance law enforcement management services media scientific and consulting services manufacturing pharmaceuticals public relations publishing real estate rental and leasing services retail trade telecommunications equipment telecommunication services transportation warehousing travel accommodation and hospitality services utilities waste management and wholesale trade Five industries represent 47 percent of the sample These include Banking Education Financial and Accounting Services Manufacturing and Retail Trade Another 27 industries represent the other 53 percent of the sample none of which represents more than five percent of the sample
Revenue or agency budgets of participating organizations Size of the organizations participating in the most recent benchmarks is somewhat evenly distributed although slightly fewer represent midsize organizations Thirty-six percent of the organizations represented by the findings have annual revenues or agency budgets that are less than $50 million Another twenty-nine percent of the sample has annual revenues or agency budgets between $50 million and $999 million The remaining thirty-five percent of the sample has annual revenues or agency budgets that are $1 billion or more
Functional areas of responsibility Thirty-five percent of the qualified participants for the benchmark work in IT with another 30 percent work in finance or internal controls The remaining 35 percent of the qualified participants work in a wide variety of functions from business line management senior management product design and development legal compliance sales marketing procurement logistics and customer services among other functions
Job titles of participants Thirty-five percent of the participants in the benchmark are senior managers with titles that include CEO CIO CFO or Vice president Thirty-eight percent are managers or directors and twenty-seven percent are staff in their organizations
Managing the Benefits and Risks of Mobile Computing
About IT Policy Compliance Group The mission of the IT Policy Compliance Group is to promote actionable findings based on evidence to assist organizations with delivering more value less risk and achieve IT policy and compliance objectives related to the use of information systems The Group Web site at wwwitpolicycompliancecom features quick two-minute self-assessments to compare outcomes and practices against onersquos industry peers and best performing organizations research reports continuing professional education conferences and seminars member and knowledge centers related research from around the World and resources including standards and frameworks associations government and regulators
The Grouprsquos research is designed to help IT risk legal financial and internal audit professionals to
Benchmark results and efforts against peers and best-in-class performers
Identify key drivers challenges and responses to improve results
Determine the applicability and use of specific capabilities to improve results
Identify best practices based on results and experience of peers
The Group relies upon its members and advisors for its research and editorial calendar
IT Policy Compliance Group Charter Members
The Institute of Symantec Corporation Internal Auditors ISACA 350 Ellis Street 247 Maitland Avenue 3701 Algonquin Road Suite 1010 Mountain View CA 94043 Altamonte Springs FL 32701 Rolling Meadows IL 60008 +1 (650) 527 8000 +1 (407) 937 1100 +1 (847) 253 1545 wwwsymanteccom wwwtheiiaorg wwwisacaorg infosymanteccom iiatheiiaorg infoisacaorg
Computer Security Institute Protiviti IT Governance Institute 600 Harrison Street New York Office 3701 Algonquin Road Suite 1010 San Francisco CA 94107 1290 Avenue of the Rolling Meadows IL 60008 +1 (415) 947 6320 Americas 5th Floor +1 (847) 660 5600 wwwgocsicom New York New York 10104 wwwitgiorg csicmpcom +1 (212) 603 8300 infoitgiorg wwwprotiviticom infoprotiviticom
IT Policy Compliance Group Affiliate Members and Advisors A current list of Affiliate Members and Advisors to the Group can be found on the IT Policy Compliance Group website
26
Founded in 2005 the IT Policy Compliance Group conducts benchmark research focused on delivering fact-based guidance on the steps that can be taken to improve results Benchmark results are reported through wwwitpolicycompliancecom for the benefit of members
IT Policy Compliance Group
Contacts Managing Director Jim Hurley Telephone +1 (216) 373 7010 jhurleyitpolicycompliancecom Managing Editor John Ortbal Telephone +1 (847) 444 0344 jortbalitpolicycompliancecom wwwitpolicycompliancecom
December 2011
The information contained in this publication has been obtained from sources that the IT Policy Compliance Group believes to be reliable but is not guaranteed Research publications reflect current conditions that are subject to change without notice
Copyright copy 2011 IT Policy Compliance Group Names and logos may be trademarks of their respective owners All rights reserved 1211 293167003
32
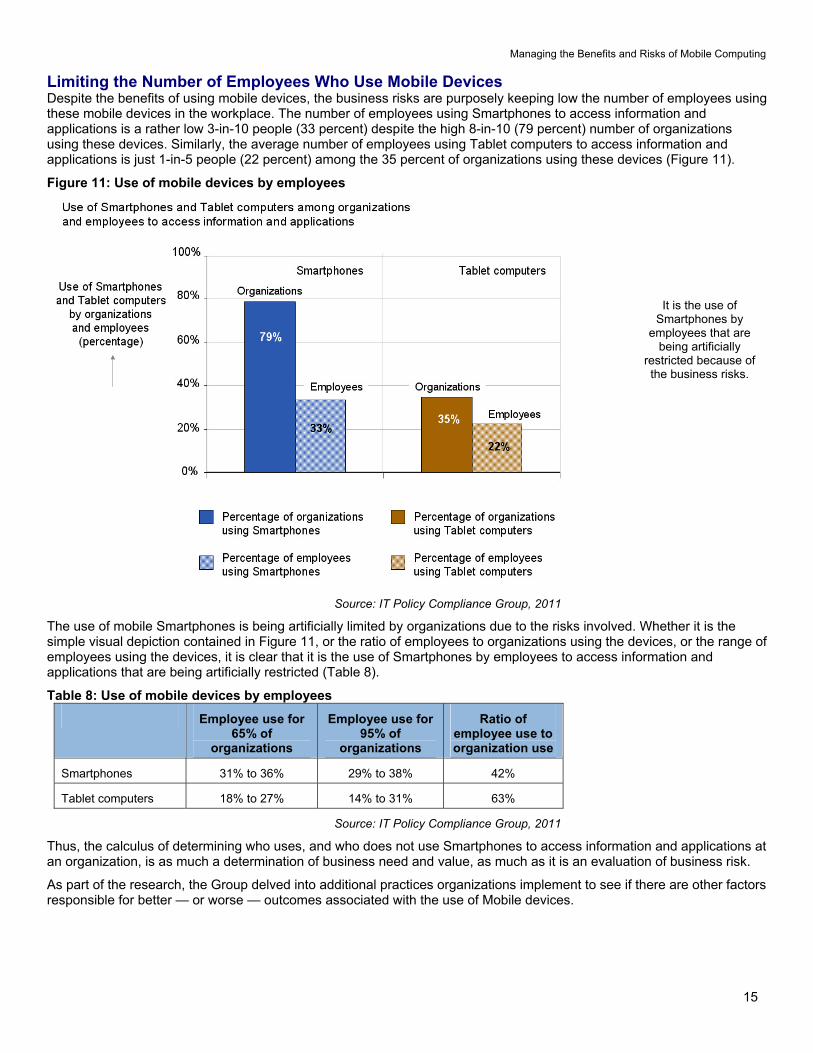
Managing the Benefits and Risks of Mobile Computing
15
Limiting the Number of Employees Who Use Mobile Devices Despite the benefits of using mobile devices the business risks are purposely keeping low the number of employees using these mobile devices in the workplace The number of employees using Smartphones to access information and applications is a rather low 3-in-10 people (33 percent) despite the high 8-in-10 (79 percent) number of organizations using these devices Similarly the average number of employees using Tablet computers to access information and applications is just 1-in-5 people (22 percent) among the 35 percent of organizations using these devices (Figure 11)
Figure 11 Use of mobile devices by employees
It is the use of Smartphones by
employees that are being artificially
restricted because of the business risks
Source IT Policy Compliance Group 2011
The use of mobile Smartphones is being artificially limited by organizations due to the risks involved Whether it is the simple visual depiction contained in Figure 11 or the ratio of employees to organizations using the devices or the range of employees using the devices it is clear that it is the use of Smartphones by employees to access information and applications that are being artificially restricted (Table 8)
Table 8 Use of mobile devices by employees
Employee use for 65 of
organizations
Employee use for 95 of
organizations
Ratio of employee use to organization use
Smartphones 31 to 36 29 to 38 42
Tablet computers 18 to 27 14 to 31 63
Source IT Policy Compliance Group 2011
Thus the calculus of determining who uses and who does not use Smartphones to access information and applications at an organization is as much a determination of business need and value as much as it is an evaluation of business risk
As part of the research the Group delved into additional practices organizations implement to see if there are other factors responsible for better mdash or worse mdash outcomes associated with the use of Mobile devices
Managing the Benefits and Risks of Mobile Computing
16
Practices that Determine Outcomes The primary practices being implemented to manage business risks for the employees who are using Smartphones and Tablet computers include limiting access to sensitive information or applications geo-tracking and locating lost or stolen devices protecting and backing-up information from mobile devices wiping sensitive information from stolen or lost mobile devices preventingrecording unauthorized logins from mobile devices delivering security-awareness training to employees who use mobile devices and prohibiting access to Apps-markets Apps-sites and custom ROMs on mobile devices (Table 9)
Table 9 Practices implemented to manage the risks
Priority Practices determining outcomes
1 Limit access to sensitive information and applications
2 Geo-track devices to aid in recovery or destruction of information
3 Protect and backup information from devices
4 Wipe stolen or lost devices of information and credentials
5 Prevent and record unauthorized logon attempts
6 Deliver and measure policy and security awareness training for users
7 Prohibit custom ROMs for rooted devices and access to App-markets
Source IT Policy Compliance Group 2011
As the research uncovered the range of practices implemented to manage business risks are directly related to outcomes Far more of the best performing organizations have more employees using these devices are spending more on information security and are more likely to be implementing most of these practices The reverse was also found to be true the worst performers are simply not implementing the practices or are implementing a few rather than all (Figure 12)
Figure 12 Practices implemented to manage the risks
Practices that determine outcomes
limit access geo-track devices protect and backup data wipe
devices that are lost or stolen prevent
unauthorized logons deliver training no
ROMs or App-markets
Source IT Policy Compliance Group 2011
Managing the Benefits and Risks of Mobile Computing
17
Controls Used to Manage Risks Controls are used in business to assist with the execution of business strategy to manage business outcomes and to manage risk In the case of managing risks related to the use of mobile devices to access information and applications the controls employed by the best performers include using antivirus andor anti-malware scans of the devices encrypting sensitive information on the devices preventing unauthorized people and devices from accessing sensitive information and applications patching mobile device systems-level software where possible and testing configurations of the devices (Table 10)
Table 10 Controls used to manage risks
Priority Controls used to manage the risks
1 Use anti-virus and anti-malware
2 Protect sensitive information on devices with encryption
3 Prevent unauthorized devices and people from accessing informationapplications
4 Patch systems software on devices where possible
5 Test configurations and settings on devices
Source IT Policy Compliance Group 2011
Of the controls tested by the research the one implemented by a clear majority of the best performers is the use of anti-virus andor anti-malware scans The least commonly implemented control among these best performers is the use of virtual private networking (VPN) although interviews revealed many respondents were using some form of VPN with Smartphones in the workplace
In contrast several controls are either not implemented or are less likely implemented by the worst performers These include the scanning of ROMs on mobile devices scanning of vulnerabilities on mobile devices conducting penetration tests on mobile devices patching systems-level software where possible and using virtual private networking (Figure 13)
Figure 13 Controls used to manage risks
Controls to use anti-virusanti-malware encryption checks and limits on unauthorized
devicespeople patches and
configuration testing
Source IT Policy Compliance Group 2011
Managing the Benefits and Risks of Mobile Computing
18
Interestingly the biggest complaint the Group found in the interviews was due to ldquothe lack of patches to update the Android operating systemrdquo For this reason alone we found that many organizations had developed a ldquono Androidrdquo policy or told its users that Android phones could no longer be used Another practice found to significantly impact outcomes is how frequently organizations conduct assessments
Consistency of Assessments and Reporting The rate at which controls to manage risks are monitored assessed and reported on is directly related to outcomes For example the findings reveal significant differences from annual to monthly rates with those conducting less frequent assessments being among the majority of the worst performers and those with the most frequent assessments being among the best performers (Table 11)
Table 11 Rate of assessment and reporting
Outcome Average rate of assessment and reporting
Worst Once every twelve months
Average Once every four-to-five months
Best Once every month or less
Source IT Policy Compliance Group 2011
Mirroring findings in related research the rate at which controls are monitored assessed and compared against a range of conditions including policies prioritized risks threats gold-standards regulatory requirements and internal configuration baselines among others defines
1) When organizations find gaps in controls and procedures
2) Whether risks are larger than expected
3) Whether organizations are able to take appropriate action
4) Whether organizations are able to reduce business risks
When looked at from the perspective of size the research reveals many organizations may not have the tools to automate such assessments or are simply choosing to conduct annual audit review assessments rather than ongoing business risk assessments (Figure 14)
Figure 14 Rate of assessment and reporting
The best performers consistently assess
and report on controls and risks more
frequently
Source IT Policy Compliance Group 2011
Managing the Benefits and Risks of Mobile Computing
19
In addition to the rate of assessment and reporting another defining practice responsible for outcomes is found to be spending on information security by organizations
Spend on Information Security and Outcomes Worst performers are spending 60 percent less than average while the best performers are spending 60 percent more than average performers (Table 12)
Table 12 Spend on information security
Outcome Relative spend on information security compared with average performers
Worst 04
Average 10
Best 16
Source IT Policy Compliance Group 2011
In addition to the relative difference in spend on information security there are large differences in the percentage of the IT budget spent on information security While the range of spend among the worst is from zero to slightly more than 5 of the IT budget the average spent by the worst is less than three percent In contrast average performers spend 75 percent and best performers are spending 12 percent on average (Figure 15)
Figure 15 Spend on information security
The best performers spend a larger
percentage of a larger IT budget on
information security
Source IT Policy Compliance Group 2011
The amount spent is more revealing when considering the actual IT budgets IT budgets among worst performers is just 30 percent of what average performers spend on IT while the amount spent on IT by the best performers is more than 30 percent higher than the average performers
Thus smaller percentages of much smaller annual IT budgets are characteristic of spending on information security by the worst performers while larger percentages of much larger annual IT budgets are characteristic of spending on information security by the best performers
Spending on information security among some of the worst performers actually bottomed-out during the latter half of 2011 When combined with no controls on mobile devices and a culture that is ignoring or discounting the business risks related to the use of Mobile devices it is possible that 2012 could be a year with some negative brand-wrecking events for some of these organizations The best performers will be happy to have positioned themselves differently
Managing the Benefits and Risks of Mobile Computing
20
Back to the Future Is the adoption of Mobile computing a repeat of what occurred in the 1980s Back then it was connecting PCs via local networks to provide office workers with access to information that could be analyzed and acted on in local work groups Today it is about wirelessly interconnecting Mobile devices enabling anyone to share and act on information from any location If today is any indication of what happened in the 1980s then the use of these new powerful pocket-sized but supercharged Mobile devices is likely to change to shape of computing as we know it today
The use of Smartphones by 8-in-10 organizations could likely grow And the use of these devices by employees artificially restricted to 33 percent for now will likely grow as management systems and security controls become more standardized
But we are in a high-growth expansionary phase where Phone manufacturers and carriers are incented to cannibalize products they shipped just last year or as recently as last month leaving consumers employees and organizations with devices that are out of date and may never be updated with systems-level software that would otherwise cure security vulnerabilities
Unfortunately there is no standard Android phone unless you purchase a Google Nexus phone which will be updated by Google directly But the majority of Android phones purchased by consumers and employees are not stock Google Android phones Instead the vast majority of Android phones are overlaid by supplier goo-gads carrier changes along with unexpected and unwanted mdash Carrier IQ mdash additions The carriers and phone manufacturers are incented by the sale of new hardware bling and new service contracts
Encouraged by Google and the profit margins from the latest hardware bling and service contracts the carriers and phone manufacturers continue to develop their own versions of Android What the carriers and phone manufacturers are not incented to do is to deploy software updates to the Android operating system to their customers and so they donrsquot Instead they find it less expensive to lure their customers into an upgrade to a new device on contract two years later
There are more stable and routinely updated
operating systems shipping with
Smartphones from Applersquos iOS RIMrsquos
Blackberry and Windows phone
Eventually these problems and others may resolve themselves but it could be another few years mdash or more mdash of frustration before anything resembling stability in the Android operating system is common and enterprise-ready management tools and security controls are available for these new wonders of the information age
In the meantime there are much more stable mdash and routinely updated mdash operating systems shipping with Smartphones from Applersquos iOS RIMrsquos Blackberry and Windows phone None of these suffer the same problems afflicting Android phones
Whatever you do remember the lessons about what worked mdash and what didnrsquot mdash with earlier generational-changes such as the advent of PCs or the dawn of Internet-computing This longer-term perspective and the lessons will come in handy in formulating strategy and tactics as the use of Mobile computing expands in your workplace
Summary Observations Based on the outcomes being achieved by the best performing organizations
The business benefits of using Smartphones and Tablet computers include
Improved access to business information from any location
Improved customer retention and satisfaction levels and
Higher levels of revenue and profitability when compared with peers
The business risks of using mobile computing devices include
Loss or theft of sensitive information
Unauthorized access to information and applications
Loss of governance or control over sensitive business information business applications business risks and audits
Managing the Benefits and Risks of Mobile Computing
21
The primary information and applications currently being used with mobile devices include
Email and collaborative applications
Office productivity applications
Sales force automation applications
The primary actions to take to limit business risks include
Limit the use of Smartphones in the workplace to specifically approved employees
Fewer than 50 percent of employees currently use Smartphonersquos among the best performers
Policies and practices to implement include
Have IT manage all Tablet computers and Smartphones
Allow approved employees to use their own Smartphones
Furnish Tablet computers to employees
Considerations to evaluate include
Mobile devices are another part of the requirements of your information security audits
Compare your due-care requirements to defend against legal inquiry
Identify your cross-border data privacy and ownership requirements
Practices to implement include
Limit the use of Smartphones to access information and applications to approved employees
Limit access to sensitive information and applications for mobile devices
Geo-track devices especially Smartphones
Prohibit the use of custom ROMs and unapproved App-marketssites
Deliver security awareness training and measure effectiveness with employees
Scan mobile devices with anti-virus and anti-malware
Protect and backup information on the devices
Wipe and lock stolen and lost devices as soon as notified by employees
Investigate the availability of patching as part of device evaluations
Use frequent controls and configuration testing to reduce gaps and limit risks
Increase spend on information security beyond your peers
Managing the Benefits and Risks of Mobile Computing
22
Appendix Expected Changes in Device Use in the Workplace 2011 to 2013 Respondents were asked to identify changes that are most likely going to occur in organizational and employee uses of Smartphones and Tablet computers between 2011 and 2013 As projections these forecasts of user and organizational expectations are reflections of current sentiment
The use of Smartphones by organizations is expected to remain the same between 2011 and 2013 at 79 percent of all organizations However the use of Smartphones to access information and applications by employees is expected to increase from 33 percent to 39 percent (Table 13)
Table 13 Device use 2011 to 2013
Device being used Use by organizationsemployees
2011 2013 Change in use
Organizational use 79 79 -0- Smartphones
Employee use 33 39 6 increase
Organizational use 35 49 14 increase Tablet computers
Employee use 22 32 10 increase
Source IT Policy Compliance Group 2011
Unlike Smartphones the use of Tablet computers is expected to increase for organizations and employees from an average rate of 35 percent to 49 percent for organizations and from 22 to 32 for employees The increases are larger than the sample error of seven percent
After an increase in employees using both devices what is rather intriguing is an expected downtrend in the use of Smartphones among organizations with the best outcomes The decline in the use of Smartphones among best performers is expected to be from 85 percent to 73 percent mdash a decrease of 12 percent mdash from 2011 to 2013 (Figure 16)
Figure 16 Expected changes in device use
Source IT Policy Compliance Group 2011
The explanation for the overall rate of decline of Smartphone use among best performing organization can be found from declines in the uses of iPhone and Windows Phone platforms and much more significant declines in the use of Android and Blackberry phones
At the time the research was being carried out RIM was suffering from blackouts in its services around the World with rolling service-outages that occurred across multiple continents during a one-week period The general consensus of many people we spoke with at the time was the service-outages ldquoare the final event I need to make the switch when my subscription period is duerdquo On the other hand others simply replaced their Blackberry devices that week and did not wait until their subscription was due for renewal
Unlike the RIM Blackberry platforms we found consistently strong disaffection with Android devices due to the inability to obtain updates for the Android operating system without having to root devices and hope for the best using custom ROMs
Managing the Benefits and Risks of Mobile Computing
23
These problems left many saying things like ldquoI bought a pig in a poke never againrdquo Others took matters into their own hands rooted their phones and installed updated versions of Android over the Internet from a number of different development sites none of which were blessed by carriers phone manufacturers or their IT staff
IT managers the Group spoke with identified an utter lack of management tools for Android devices too many versions of Android and a complete lack of vulnerability testing for the devices The inability to update and cure security-problems were just some of the problems identified by IT managers the Group spoke with The upshot for many were two common reactions to the use of Android in the enterprise 1) if it was already deployed the common reaction was to pull back support for Android and convert to other supported Smartphones and 2) if Android was not already deployed wait for Android to become enterprise-ready (Table 14)
Table 14 Reaction to Android phones in the workplace
Status of Android Smartphones
Reaction
Already deployed Pull-back and convert to other Smartphones
If not already deployed Wait for Android to become enterprise-ready
Source IT Policy Compliance Group 2011
When it comes to Tablet computers the sentiment about expected changes in use of different platforms reveals Android Tablet computers likely to see the biggest gains between now and 2013 followed by healthy gains in the use of other Tablet computers The only sentiment indicating significant declines appear to be related to Android and Blackberry Smartphones (Figure 17)
Figure 17 Expected changes in platform use
Source IT Policy Compliance Group 2011
The outlook of current sentiment regarding use of different platforms by 2013 clearly indicates the best performers are predisposed to ditch Android and Blackberry phones and significantly increase the use of iPad Tablet computers
By contrast the worst performers are predisposed to increase use of Smartphones and Tablet computers across the board and with the exception of Blackberry phones increase other mobile device platforms among average performers
Managing the Benefits and Risks of Mobile Computing
24
Additional Resources Numerous sources of related information are available for those interested in pursuing more information on a wide range of topics related to Smartphones and Tablet computers The following are but a small sample of related information perspectives and insight The authors of these articles have no relationship with the ITPCG Android Security See httpdeveloperandroidcomguidetopicssecuritysecurityhtml Android Orphans Visualizing a Sad History of Support See httptheunderstatementcompost11982112928android-orphans-visualizing-a-sad-history-of-support A Look into Mobile Device Security httpwwwsymanteccomcontentenusaboutmediapdfssymc_mobile_device_security_june2011pdfom_ext_cid=biz_socmed_twitter_facebook_marketwire_linkedin_2011Jun_worldwide_mobilesecuritywp Carrier IQ what it is what it isnrsquot and what you need to do httpwwwengadgetcom20111201carrier-iq-what-it-is-what-it-isnt-and-what-you-need-to CIS Apple iOS configuration benchmarks httpbenchmarkscisecurityorgen-usroute=downloadsbrowsecategorybenchmarksmobileiphone Current Android Malware httpforensicsspreitzenbarthdepage_id=254 DISA STIGs for Smartphones - unclassified httpiasedisamilstigsnet_perimeterwirelesssmartphonehtml iOS Hardening Configuration Guide Department of Defence Intelligence and Security Australian Government httpwwwdsdgovaupublicationsiOS_Hardening_Guidepdf Mac OS X and iOS Security httpdeveloperapplecomlibrarymacdocumentationSecurityConceptualSecurity_OverviewArchitectureArchitecturehtmlapple_refdocuidTP30000976-CH202-TPXREF101 Mobile Malware Why Fraudsters are Two Steps Ahead httpwwwtrusteercomblogmobile-malware-why-fraudsters-are-two-steps-ahead Rootkit called Carrier IQ discovered phoning home with user data httpwwwzdnetcomblogapplerootkit-called-carrier-iq-discovered-phoning-home-with-user-data11792 RIM launches Blackberry Fusion to Secure Android and Apple devices httpbusinessfinancialpostcom20111129rim-launching-blackberry-mobile-fusion-to-secure-iphone-android-devices Smartphone Security httpwwwenisaeuropaeuactapplication-securitysmartphone-security-1 The Spy Files Map httpwikileaksorgThe-Spyfiles-The-Maphtml Ten Steps to Secure Your Mobile Devices httpswikiinternet2educonfluencedisplayitsg2Mobile+Device+Security
Why Your Phone is Insecure by Design httpwwwforbescomsitesandygreenberg20110812codebreaker-karsten-nohl-why-your-phone-is-insecure-by-design
Managing the Benefits and Risks of Mobile Computing
25
About the Research Topics researched by the IT Policy Compliance Group (IT PCG) are part of an ongoing calendar established in consultation with Advisory General and Charter members of the Group as well as from findings compiled from ongoing research In addition to specific tracking questions common to each benchmark the research is designed to uncover the relationship between business results outcomes being experienced by organizations actions taken practices implemented and capabilities organizations use to respond
The qualitative research findings presented in this report are from numerous focus groups one-on-one interviews and meetings held with larger audiences throughout 2011 The quantitative findings contained in this report are from primary research studies conducted with 210 organizations in North America during late 2011
The maximum error for the sample findings for the benchmark findings contained in this report is +- seven percent The primary focus of analysis contained in this report is to present the largest differences between the outcomes experienced and similarly aligned findings that are most responsible for the differences in outcomes Instead of relying on differences that are within or close to the sample errors the effort has been to focus on the largest differences For example instead of focusing on differences involving +- 10 percent the findings covered in this report tend to focus on the largest differences in the range of 50 percent or more
The findings covering the use of Mobile computing are representative of organizations in North America and cannot be construed or inferred to represent current usage or plans for Mobile computing outside of North America However the findings covering the performance outcomes benefits and risks of Mobile computing the practices to manage the business risks and the controls to manage the risks match findings from similar studies covering other geographies outside of North America including findings from Latin America South America Europe Africa the Middle East Asia and Oceania
Industries represented The quantitative research includes representation from the following industries advertising accounting services aerospace agriculture apparel architecture automotive banking chemicals computer equipment and peripherals computer software and services construction consumer durable goods distribution education engineering services entertainment financial services food and beverage government (local state and federal level public administration) government (defense and intelligence) health medical and dental services insurance law enforcement management services media scientific and consulting services manufacturing pharmaceuticals public relations publishing real estate rental and leasing services retail trade telecommunications equipment telecommunication services transportation warehousing travel accommodation and hospitality services utilities waste management and wholesale trade Five industries represent 47 percent of the sample These include Banking Education Financial and Accounting Services Manufacturing and Retail Trade Another 27 industries represent the other 53 percent of the sample none of which represents more than five percent of the sample
Revenue or agency budgets of participating organizations Size of the organizations participating in the most recent benchmarks is somewhat evenly distributed although slightly fewer represent midsize organizations Thirty-six percent of the organizations represented by the findings have annual revenues or agency budgets that are less than $50 million Another twenty-nine percent of the sample has annual revenues or agency budgets between $50 million and $999 million The remaining thirty-five percent of the sample has annual revenues or agency budgets that are $1 billion or more
Functional areas of responsibility Thirty-five percent of the qualified participants for the benchmark work in IT with another 30 percent work in finance or internal controls The remaining 35 percent of the qualified participants work in a wide variety of functions from business line management senior management product design and development legal compliance sales marketing procurement logistics and customer services among other functions
Job titles of participants Thirty-five percent of the participants in the benchmark are senior managers with titles that include CEO CIO CFO or Vice president Thirty-eight percent are managers or directors and twenty-seven percent are staff in their organizations
Managing the Benefits and Risks of Mobile Computing
About IT Policy Compliance Group The mission of the IT Policy Compliance Group is to promote actionable findings based on evidence to assist organizations with delivering more value less risk and achieve IT policy and compliance objectives related to the use of information systems The Group Web site at wwwitpolicycompliancecom features quick two-minute self-assessments to compare outcomes and practices against onersquos industry peers and best performing organizations research reports continuing professional education conferences and seminars member and knowledge centers related research from around the World and resources including standards and frameworks associations government and regulators
The Grouprsquos research is designed to help IT risk legal financial and internal audit professionals to
Benchmark results and efforts against peers and best-in-class performers
Identify key drivers challenges and responses to improve results
Determine the applicability and use of specific capabilities to improve results
Identify best practices based on results and experience of peers
The Group relies upon its members and advisors for its research and editorial calendar
IT Policy Compliance Group Charter Members
The Institute of Symantec Corporation Internal Auditors ISACA 350 Ellis Street 247 Maitland Avenue 3701 Algonquin Road Suite 1010 Mountain View CA 94043 Altamonte Springs FL 32701 Rolling Meadows IL 60008 +1 (650) 527 8000 +1 (407) 937 1100 +1 (847) 253 1545 wwwsymanteccom wwwtheiiaorg wwwisacaorg infosymanteccom iiatheiiaorg infoisacaorg
Computer Security Institute Protiviti IT Governance Institute 600 Harrison Street New York Office 3701 Algonquin Road Suite 1010 San Francisco CA 94107 1290 Avenue of the Rolling Meadows IL 60008 +1 (415) 947 6320 Americas 5th Floor +1 (847) 660 5600 wwwgocsicom New York New York 10104 wwwitgiorg csicmpcom +1 (212) 603 8300 infoitgiorg wwwprotiviticom infoprotiviticom
IT Policy Compliance Group Affiliate Members and Advisors A current list of Affiliate Members and Advisors to the Group can be found on the IT Policy Compliance Group website
26
Founded in 2005 the IT Policy Compliance Group conducts benchmark research focused on delivering fact-based guidance on the steps that can be taken to improve results Benchmark results are reported through wwwitpolicycompliancecom for the benefit of members
IT Policy Compliance Group
Contacts Managing Director Jim Hurley Telephone +1 (216) 373 7010 jhurleyitpolicycompliancecom Managing Editor John Ortbal Telephone +1 (847) 444 0344 jortbalitpolicycompliancecom wwwitpolicycompliancecom
December 2011
The information contained in this publication has been obtained from sources that the IT Policy Compliance Group believes to be reliable but is not guaranteed Research publications reflect current conditions that are subject to change without notice
Copyright copy 2011 IT Policy Compliance Group Names and logos may be trademarks of their respective owners All rights reserved 1211 293167003
32
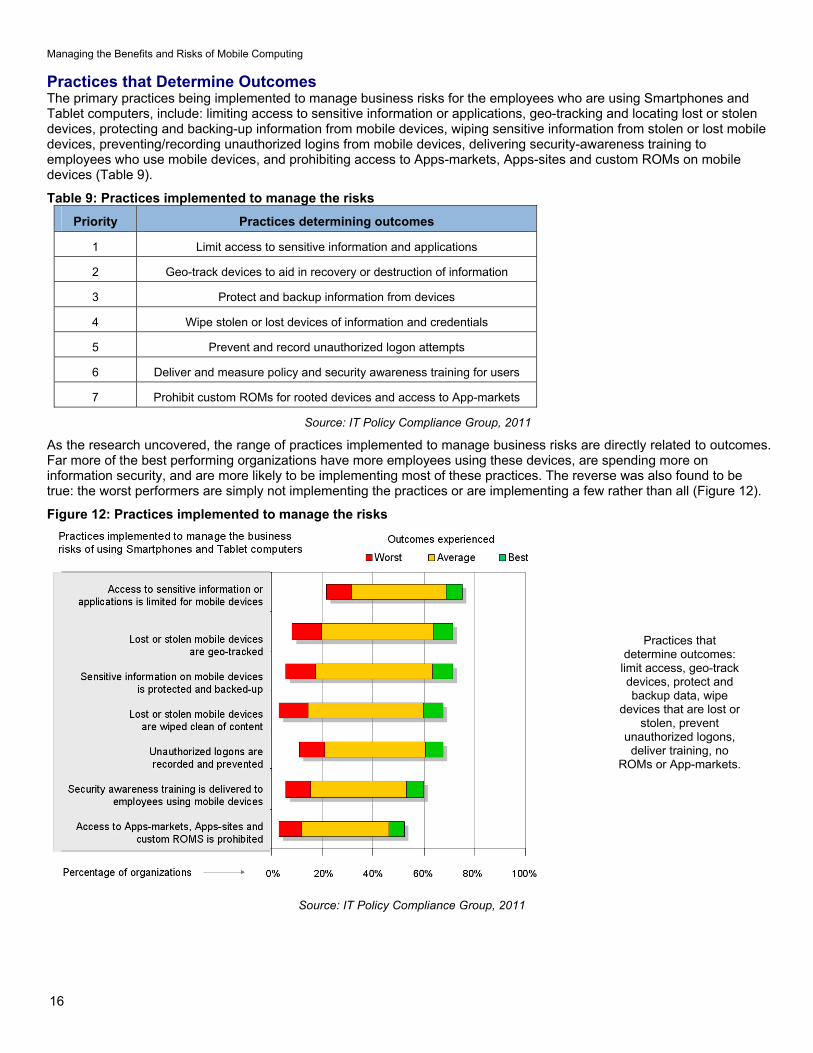
Managing the Benefits and Risks of Mobile Computing
16
Practices that Determine Outcomes The primary practices being implemented to manage business risks for the employees who are using Smartphones and Tablet computers include limiting access to sensitive information or applications geo-tracking and locating lost or stolen devices protecting and backing-up information from mobile devices wiping sensitive information from stolen or lost mobile devices preventingrecording unauthorized logins from mobile devices delivering security-awareness training to employees who use mobile devices and prohibiting access to Apps-markets Apps-sites and custom ROMs on mobile devices (Table 9)
Table 9 Practices implemented to manage the risks
Priority Practices determining outcomes
1 Limit access to sensitive information and applications
2 Geo-track devices to aid in recovery or destruction of information
3 Protect and backup information from devices
4 Wipe stolen or lost devices of information and credentials
5 Prevent and record unauthorized logon attempts
6 Deliver and measure policy and security awareness training for users
7 Prohibit custom ROMs for rooted devices and access to App-markets
Source IT Policy Compliance Group 2011
As the research uncovered the range of practices implemented to manage business risks are directly related to outcomes Far more of the best performing organizations have more employees using these devices are spending more on information security and are more likely to be implementing most of these practices The reverse was also found to be true the worst performers are simply not implementing the practices or are implementing a few rather than all (Figure 12)
Figure 12 Practices implemented to manage the risks
Practices that determine outcomes
limit access geo-track devices protect and backup data wipe
devices that are lost or stolen prevent
unauthorized logons deliver training no
ROMs or App-markets
Source IT Policy Compliance Group 2011
Managing the Benefits and Risks of Mobile Computing
17
Controls Used to Manage Risks Controls are used in business to assist with the execution of business strategy to manage business outcomes and to manage risk In the case of managing risks related to the use of mobile devices to access information and applications the controls employed by the best performers include using antivirus andor anti-malware scans of the devices encrypting sensitive information on the devices preventing unauthorized people and devices from accessing sensitive information and applications patching mobile device systems-level software where possible and testing configurations of the devices (Table 10)
Table 10 Controls used to manage risks
Priority Controls used to manage the risks
1 Use anti-virus and anti-malware
2 Protect sensitive information on devices with encryption
3 Prevent unauthorized devices and people from accessing informationapplications
4 Patch systems software on devices where possible
5 Test configurations and settings on devices
Source IT Policy Compliance Group 2011
Of the controls tested by the research the one implemented by a clear majority of the best performers is the use of anti-virus andor anti-malware scans The least commonly implemented control among these best performers is the use of virtual private networking (VPN) although interviews revealed many respondents were using some form of VPN with Smartphones in the workplace
In contrast several controls are either not implemented or are less likely implemented by the worst performers These include the scanning of ROMs on mobile devices scanning of vulnerabilities on mobile devices conducting penetration tests on mobile devices patching systems-level software where possible and using virtual private networking (Figure 13)
Figure 13 Controls used to manage risks
Controls to use anti-virusanti-malware encryption checks and limits on unauthorized
devicespeople patches and
configuration testing
Source IT Policy Compliance Group 2011
Managing the Benefits and Risks of Mobile Computing
18
Interestingly the biggest complaint the Group found in the interviews was due to ldquothe lack of patches to update the Android operating systemrdquo For this reason alone we found that many organizations had developed a ldquono Androidrdquo policy or told its users that Android phones could no longer be used Another practice found to significantly impact outcomes is how frequently organizations conduct assessments
Consistency of Assessments and Reporting The rate at which controls to manage risks are monitored assessed and reported on is directly related to outcomes For example the findings reveal significant differences from annual to monthly rates with those conducting less frequent assessments being among the majority of the worst performers and those with the most frequent assessments being among the best performers (Table 11)
Table 11 Rate of assessment and reporting
Outcome Average rate of assessment and reporting
Worst Once every twelve months
Average Once every four-to-five months
Best Once every month or less
Source IT Policy Compliance Group 2011
Mirroring findings in related research the rate at which controls are monitored assessed and compared against a range of conditions including policies prioritized risks threats gold-standards regulatory requirements and internal configuration baselines among others defines
1) When organizations find gaps in controls and procedures
2) Whether risks are larger than expected
3) Whether organizations are able to take appropriate action
4) Whether organizations are able to reduce business risks
When looked at from the perspective of size the research reveals many organizations may not have the tools to automate such assessments or are simply choosing to conduct annual audit review assessments rather than ongoing business risk assessments (Figure 14)
Figure 14 Rate of assessment and reporting
The best performers consistently assess
and report on controls and risks more
frequently
Source IT Policy Compliance Group 2011
Managing the Benefits and Risks of Mobile Computing
19
In addition to the rate of assessment and reporting another defining practice responsible for outcomes is found to be spending on information security by organizations
Spend on Information Security and Outcomes Worst performers are spending 60 percent less than average while the best performers are spending 60 percent more than average performers (Table 12)
Table 12 Spend on information security
Outcome Relative spend on information security compared with average performers
Worst 04
Average 10
Best 16
Source IT Policy Compliance Group 2011
In addition to the relative difference in spend on information security there are large differences in the percentage of the IT budget spent on information security While the range of spend among the worst is from zero to slightly more than 5 of the IT budget the average spent by the worst is less than three percent In contrast average performers spend 75 percent and best performers are spending 12 percent on average (Figure 15)
Figure 15 Spend on information security
The best performers spend a larger
percentage of a larger IT budget on
information security
Source IT Policy Compliance Group 2011
The amount spent is more revealing when considering the actual IT budgets IT budgets among worst performers is just 30 percent of what average performers spend on IT while the amount spent on IT by the best performers is more than 30 percent higher than the average performers
Thus smaller percentages of much smaller annual IT budgets are characteristic of spending on information security by the worst performers while larger percentages of much larger annual IT budgets are characteristic of spending on information security by the best performers
Spending on information security among some of the worst performers actually bottomed-out during the latter half of 2011 When combined with no controls on mobile devices and a culture that is ignoring or discounting the business risks related to the use of Mobile devices it is possible that 2012 could be a year with some negative brand-wrecking events for some of these organizations The best performers will be happy to have positioned themselves differently
Managing the Benefits and Risks of Mobile Computing
20
Back to the Future Is the adoption of Mobile computing a repeat of what occurred in the 1980s Back then it was connecting PCs via local networks to provide office workers with access to information that could be analyzed and acted on in local work groups Today it is about wirelessly interconnecting Mobile devices enabling anyone to share and act on information from any location If today is any indication of what happened in the 1980s then the use of these new powerful pocket-sized but supercharged Mobile devices is likely to change to shape of computing as we know it today
The use of Smartphones by 8-in-10 organizations could likely grow And the use of these devices by employees artificially restricted to 33 percent for now will likely grow as management systems and security controls become more standardized
But we are in a high-growth expansionary phase where Phone manufacturers and carriers are incented to cannibalize products they shipped just last year or as recently as last month leaving consumers employees and organizations with devices that are out of date and may never be updated with systems-level software that would otherwise cure security vulnerabilities
Unfortunately there is no standard Android phone unless you purchase a Google Nexus phone which will be updated by Google directly But the majority of Android phones purchased by consumers and employees are not stock Google Android phones Instead the vast majority of Android phones are overlaid by supplier goo-gads carrier changes along with unexpected and unwanted mdash Carrier IQ mdash additions The carriers and phone manufacturers are incented by the sale of new hardware bling and new service contracts
Encouraged by Google and the profit margins from the latest hardware bling and service contracts the carriers and phone manufacturers continue to develop their own versions of Android What the carriers and phone manufacturers are not incented to do is to deploy software updates to the Android operating system to their customers and so they donrsquot Instead they find it less expensive to lure their customers into an upgrade to a new device on contract two years later
There are more stable and routinely updated
operating systems shipping with
Smartphones from Applersquos iOS RIMrsquos
Blackberry and Windows phone
Eventually these problems and others may resolve themselves but it could be another few years mdash or more mdash of frustration before anything resembling stability in the Android operating system is common and enterprise-ready management tools and security controls are available for these new wonders of the information age
In the meantime there are much more stable mdash and routinely updated mdash operating systems shipping with Smartphones from Applersquos iOS RIMrsquos Blackberry and Windows phone None of these suffer the same problems afflicting Android phones
Whatever you do remember the lessons about what worked mdash and what didnrsquot mdash with earlier generational-changes such as the advent of PCs or the dawn of Internet-computing This longer-term perspective and the lessons will come in handy in formulating strategy and tactics as the use of Mobile computing expands in your workplace
Summary Observations Based on the outcomes being achieved by the best performing organizations
The business benefits of using Smartphones and Tablet computers include
Improved access to business information from any location
Improved customer retention and satisfaction levels and
Higher levels of revenue and profitability when compared with peers
The business risks of using mobile computing devices include
Loss or theft of sensitive information
Unauthorized access to information and applications
Loss of governance or control over sensitive business information business applications business risks and audits
Managing the Benefits and Risks of Mobile Computing
21
The primary information and applications currently being used with mobile devices include
Email and collaborative applications
Office productivity applications
Sales force automation applications
The primary actions to take to limit business risks include
Limit the use of Smartphones in the workplace to specifically approved employees
Fewer than 50 percent of employees currently use Smartphonersquos among the best performers
Policies and practices to implement include
Have IT manage all Tablet computers and Smartphones
Allow approved employees to use their own Smartphones
Furnish Tablet computers to employees
Considerations to evaluate include
Mobile devices are another part of the requirements of your information security audits
Compare your due-care requirements to defend against legal inquiry
Identify your cross-border data privacy and ownership requirements
Practices to implement include
Limit the use of Smartphones to access information and applications to approved employees
Limit access to sensitive information and applications for mobile devices
Geo-track devices especially Smartphones
Prohibit the use of custom ROMs and unapproved App-marketssites
Deliver security awareness training and measure effectiveness with employees
Scan mobile devices with anti-virus and anti-malware
Protect and backup information on the devices
Wipe and lock stolen and lost devices as soon as notified by employees
Investigate the availability of patching as part of device evaluations
Use frequent controls and configuration testing to reduce gaps and limit risks
Increase spend on information security beyond your peers
Managing the Benefits and Risks of Mobile Computing
22
Appendix Expected Changes in Device Use in the Workplace 2011 to 2013 Respondents were asked to identify changes that are most likely going to occur in organizational and employee uses of Smartphones and Tablet computers between 2011 and 2013 As projections these forecasts of user and organizational expectations are reflections of current sentiment
The use of Smartphones by organizations is expected to remain the same between 2011 and 2013 at 79 percent of all organizations However the use of Smartphones to access information and applications by employees is expected to increase from 33 percent to 39 percent (Table 13)
Table 13 Device use 2011 to 2013
Device being used Use by organizationsemployees
2011 2013 Change in use
Organizational use 79 79 -0- Smartphones
Employee use 33 39 6 increase
Organizational use 35 49 14 increase Tablet computers
Employee use 22 32 10 increase
Source IT Policy Compliance Group 2011
Unlike Smartphones the use of Tablet computers is expected to increase for organizations and employees from an average rate of 35 percent to 49 percent for organizations and from 22 to 32 for employees The increases are larger than the sample error of seven percent
After an increase in employees using both devices what is rather intriguing is an expected downtrend in the use of Smartphones among organizations with the best outcomes The decline in the use of Smartphones among best performers is expected to be from 85 percent to 73 percent mdash a decrease of 12 percent mdash from 2011 to 2013 (Figure 16)
Figure 16 Expected changes in device use
Source IT Policy Compliance Group 2011
The explanation for the overall rate of decline of Smartphone use among best performing organization can be found from declines in the uses of iPhone and Windows Phone platforms and much more significant declines in the use of Android and Blackberry phones
At the time the research was being carried out RIM was suffering from blackouts in its services around the World with rolling service-outages that occurred across multiple continents during a one-week period The general consensus of many people we spoke with at the time was the service-outages ldquoare the final event I need to make the switch when my subscription period is duerdquo On the other hand others simply replaced their Blackberry devices that week and did not wait until their subscription was due for renewal
Unlike the RIM Blackberry platforms we found consistently strong disaffection with Android devices due to the inability to obtain updates for the Android operating system without having to root devices and hope for the best using custom ROMs
Managing the Benefits and Risks of Mobile Computing
23
These problems left many saying things like ldquoI bought a pig in a poke never againrdquo Others took matters into their own hands rooted their phones and installed updated versions of Android over the Internet from a number of different development sites none of which were blessed by carriers phone manufacturers or their IT staff
IT managers the Group spoke with identified an utter lack of management tools for Android devices too many versions of Android and a complete lack of vulnerability testing for the devices The inability to update and cure security-problems were just some of the problems identified by IT managers the Group spoke with The upshot for many were two common reactions to the use of Android in the enterprise 1) if it was already deployed the common reaction was to pull back support for Android and convert to other supported Smartphones and 2) if Android was not already deployed wait for Android to become enterprise-ready (Table 14)
Table 14 Reaction to Android phones in the workplace
Status of Android Smartphones
Reaction
Already deployed Pull-back and convert to other Smartphones
If not already deployed Wait for Android to become enterprise-ready
Source IT Policy Compliance Group 2011
When it comes to Tablet computers the sentiment about expected changes in use of different platforms reveals Android Tablet computers likely to see the biggest gains between now and 2013 followed by healthy gains in the use of other Tablet computers The only sentiment indicating significant declines appear to be related to Android and Blackberry Smartphones (Figure 17)
Figure 17 Expected changes in platform use
Source IT Policy Compliance Group 2011
The outlook of current sentiment regarding use of different platforms by 2013 clearly indicates the best performers are predisposed to ditch Android and Blackberry phones and significantly increase the use of iPad Tablet computers
By contrast the worst performers are predisposed to increase use of Smartphones and Tablet computers across the board and with the exception of Blackberry phones increase other mobile device platforms among average performers
Managing the Benefits and Risks of Mobile Computing
24
Additional Resources Numerous sources of related information are available for those interested in pursuing more information on a wide range of topics related to Smartphones and Tablet computers The following are but a small sample of related information perspectives and insight The authors of these articles have no relationship with the ITPCG Android Security See httpdeveloperandroidcomguidetopicssecuritysecurityhtml Android Orphans Visualizing a Sad History of Support See httptheunderstatementcompost11982112928android-orphans-visualizing-a-sad-history-of-support A Look into Mobile Device Security httpwwwsymanteccomcontentenusaboutmediapdfssymc_mobile_device_security_june2011pdfom_ext_cid=biz_socmed_twitter_facebook_marketwire_linkedin_2011Jun_worldwide_mobilesecuritywp Carrier IQ what it is what it isnrsquot and what you need to do httpwwwengadgetcom20111201carrier-iq-what-it-is-what-it-isnt-and-what-you-need-to CIS Apple iOS configuration benchmarks httpbenchmarkscisecurityorgen-usroute=downloadsbrowsecategorybenchmarksmobileiphone Current Android Malware httpforensicsspreitzenbarthdepage_id=254 DISA STIGs for Smartphones - unclassified httpiasedisamilstigsnet_perimeterwirelesssmartphonehtml iOS Hardening Configuration Guide Department of Defence Intelligence and Security Australian Government httpwwwdsdgovaupublicationsiOS_Hardening_Guidepdf Mac OS X and iOS Security httpdeveloperapplecomlibrarymacdocumentationSecurityConceptualSecurity_OverviewArchitectureArchitecturehtmlapple_refdocuidTP30000976-CH202-TPXREF101 Mobile Malware Why Fraudsters are Two Steps Ahead httpwwwtrusteercomblogmobile-malware-why-fraudsters-are-two-steps-ahead Rootkit called Carrier IQ discovered phoning home with user data httpwwwzdnetcomblogapplerootkit-called-carrier-iq-discovered-phoning-home-with-user-data11792 RIM launches Blackberry Fusion to Secure Android and Apple devices httpbusinessfinancialpostcom20111129rim-launching-blackberry-mobile-fusion-to-secure-iphone-android-devices Smartphone Security httpwwwenisaeuropaeuactapplication-securitysmartphone-security-1 The Spy Files Map httpwikileaksorgThe-Spyfiles-The-Maphtml Ten Steps to Secure Your Mobile Devices httpswikiinternet2educonfluencedisplayitsg2Mobile+Device+Security
Why Your Phone is Insecure by Design httpwwwforbescomsitesandygreenberg20110812codebreaker-karsten-nohl-why-your-phone-is-insecure-by-design
Managing the Benefits and Risks of Mobile Computing
25
About the Research Topics researched by the IT Policy Compliance Group (IT PCG) are part of an ongoing calendar established in consultation with Advisory General and Charter members of the Group as well as from findings compiled from ongoing research In addition to specific tracking questions common to each benchmark the research is designed to uncover the relationship between business results outcomes being experienced by organizations actions taken practices implemented and capabilities organizations use to respond
The qualitative research findings presented in this report are from numerous focus groups one-on-one interviews and meetings held with larger audiences throughout 2011 The quantitative findings contained in this report are from primary research studies conducted with 210 organizations in North America during late 2011
The maximum error for the sample findings for the benchmark findings contained in this report is +- seven percent The primary focus of analysis contained in this report is to present the largest differences between the outcomes experienced and similarly aligned findings that are most responsible for the differences in outcomes Instead of relying on differences that are within or close to the sample errors the effort has been to focus on the largest differences For example instead of focusing on differences involving +- 10 percent the findings covered in this report tend to focus on the largest differences in the range of 50 percent or more
The findings covering the use of Mobile computing are representative of organizations in North America and cannot be construed or inferred to represent current usage or plans for Mobile computing outside of North America However the findings covering the performance outcomes benefits and risks of Mobile computing the practices to manage the business risks and the controls to manage the risks match findings from similar studies covering other geographies outside of North America including findings from Latin America South America Europe Africa the Middle East Asia and Oceania
Industries represented The quantitative research includes representation from the following industries advertising accounting services aerospace agriculture apparel architecture automotive banking chemicals computer equipment and peripherals computer software and services construction consumer durable goods distribution education engineering services entertainment financial services food and beverage government (local state and federal level public administration) government (defense and intelligence) health medical and dental services insurance law enforcement management services media scientific and consulting services manufacturing pharmaceuticals public relations publishing real estate rental and leasing services retail trade telecommunications equipment telecommunication services transportation warehousing travel accommodation and hospitality services utilities waste management and wholesale trade Five industries represent 47 percent of the sample These include Banking Education Financial and Accounting Services Manufacturing and Retail Trade Another 27 industries represent the other 53 percent of the sample none of which represents more than five percent of the sample
Revenue or agency budgets of participating organizations Size of the organizations participating in the most recent benchmarks is somewhat evenly distributed although slightly fewer represent midsize organizations Thirty-six percent of the organizations represented by the findings have annual revenues or agency budgets that are less than $50 million Another twenty-nine percent of the sample has annual revenues or agency budgets between $50 million and $999 million The remaining thirty-five percent of the sample has annual revenues or agency budgets that are $1 billion or more
Functional areas of responsibility Thirty-five percent of the qualified participants for the benchmark work in IT with another 30 percent work in finance or internal controls The remaining 35 percent of the qualified participants work in a wide variety of functions from business line management senior management product design and development legal compliance sales marketing procurement logistics and customer services among other functions
Job titles of participants Thirty-five percent of the participants in the benchmark are senior managers with titles that include CEO CIO CFO or Vice president Thirty-eight percent are managers or directors and twenty-seven percent are staff in their organizations
Managing the Benefits and Risks of Mobile Computing
About IT Policy Compliance Group The mission of the IT Policy Compliance Group is to promote actionable findings based on evidence to assist organizations with delivering more value less risk and achieve IT policy and compliance objectives related to the use of information systems The Group Web site at wwwitpolicycompliancecom features quick two-minute self-assessments to compare outcomes and practices against onersquos industry peers and best performing organizations research reports continuing professional education conferences and seminars member and knowledge centers related research from around the World and resources including standards and frameworks associations government and regulators
The Grouprsquos research is designed to help IT risk legal financial and internal audit professionals to
Benchmark results and efforts against peers and best-in-class performers
Identify key drivers challenges and responses to improve results
Determine the applicability and use of specific capabilities to improve results
Identify best practices based on results and experience of peers
The Group relies upon its members and advisors for its research and editorial calendar
IT Policy Compliance Group Charter Members
The Institute of Symantec Corporation Internal Auditors ISACA 350 Ellis Street 247 Maitland Avenue 3701 Algonquin Road Suite 1010 Mountain View CA 94043 Altamonte Springs FL 32701 Rolling Meadows IL 60008 +1 (650) 527 8000 +1 (407) 937 1100 +1 (847) 253 1545 wwwsymanteccom wwwtheiiaorg wwwisacaorg infosymanteccom iiatheiiaorg infoisacaorg
Computer Security Institute Protiviti IT Governance Institute 600 Harrison Street New York Office 3701 Algonquin Road Suite 1010 San Francisco CA 94107 1290 Avenue of the Rolling Meadows IL 60008 +1 (415) 947 6320 Americas 5th Floor +1 (847) 660 5600 wwwgocsicom New York New York 10104 wwwitgiorg csicmpcom +1 (212) 603 8300 infoitgiorg wwwprotiviticom infoprotiviticom
IT Policy Compliance Group Affiliate Members and Advisors A current list of Affiliate Members and Advisors to the Group can be found on the IT Policy Compliance Group website
26
Founded in 2005 the IT Policy Compliance Group conducts benchmark research focused on delivering fact-based guidance on the steps that can be taken to improve results Benchmark results are reported through wwwitpolicycompliancecom for the benefit of members
IT Policy Compliance Group
Contacts Managing Director Jim Hurley Telephone +1 (216) 373 7010 jhurleyitpolicycompliancecom Managing Editor John Ortbal Telephone +1 (847) 444 0344 jortbalitpolicycompliancecom wwwitpolicycompliancecom
December 2011
The information contained in this publication has been obtained from sources that the IT Policy Compliance Group believes to be reliable but is not guaranteed Research publications reflect current conditions that are subject to change without notice
Copyright copy 2011 IT Policy Compliance Group Names and logos may be trademarks of their respective owners All rights reserved 1211 293167003
32
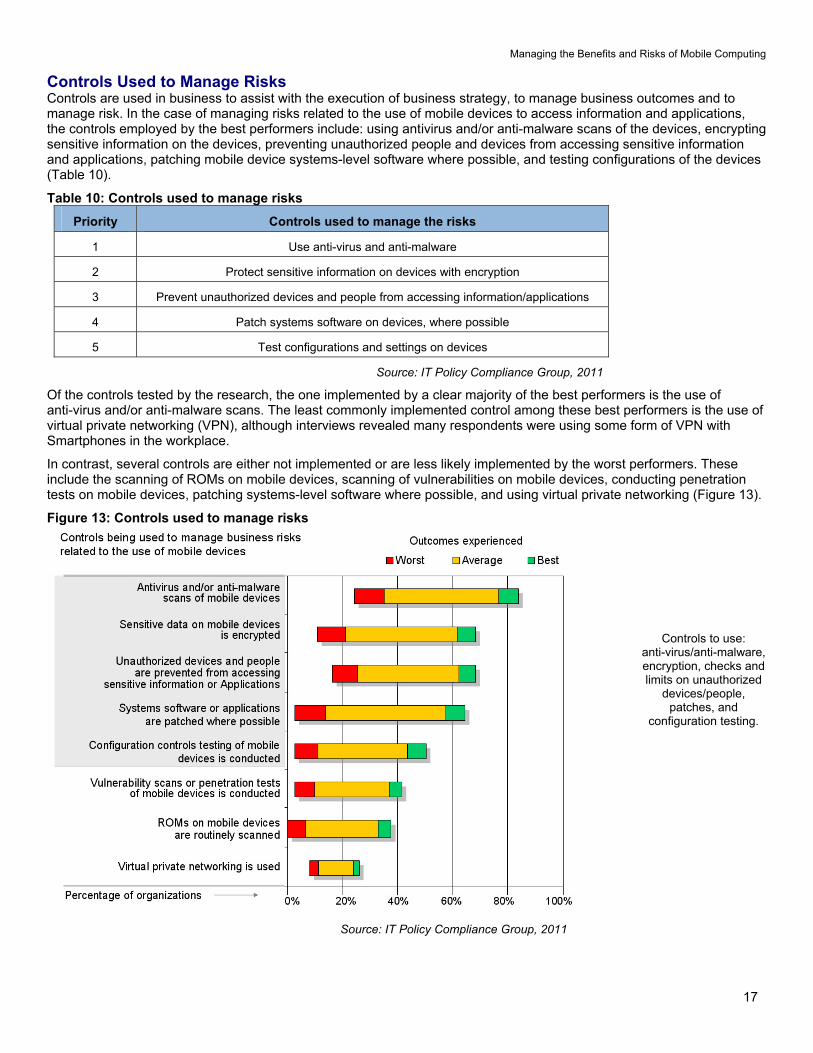
Managing the Benefits and Risks of Mobile Computing
17
Controls Used to Manage Risks Controls are used in business to assist with the execution of business strategy to manage business outcomes and to manage risk In the case of managing risks related to the use of mobile devices to access information and applications the controls employed by the best performers include using antivirus andor anti-malware scans of the devices encrypting sensitive information on the devices preventing unauthorized people and devices from accessing sensitive information and applications patching mobile device systems-level software where possible and testing configurations of the devices (Table 10)
Table 10 Controls used to manage risks
Priority Controls used to manage the risks
1 Use anti-virus and anti-malware
2 Protect sensitive information on devices with encryption
3 Prevent unauthorized devices and people from accessing informationapplications
4 Patch systems software on devices where possible
5 Test configurations and settings on devices
Source IT Policy Compliance Group 2011
Of the controls tested by the research the one implemented by a clear majority of the best performers is the use of anti-virus andor anti-malware scans The least commonly implemented control among these best performers is the use of virtual private networking (VPN) although interviews revealed many respondents were using some form of VPN with Smartphones in the workplace
In contrast several controls are either not implemented or are less likely implemented by the worst performers These include the scanning of ROMs on mobile devices scanning of vulnerabilities on mobile devices conducting penetration tests on mobile devices patching systems-level software where possible and using virtual private networking (Figure 13)
Figure 13 Controls used to manage risks
Controls to use anti-virusanti-malware encryption checks and limits on unauthorized
devicespeople patches and
configuration testing
Source IT Policy Compliance Group 2011
Managing the Benefits and Risks of Mobile Computing
18
Interestingly the biggest complaint the Group found in the interviews was due to ldquothe lack of patches to update the Android operating systemrdquo For this reason alone we found that many organizations had developed a ldquono Androidrdquo policy or told its users that Android phones could no longer be used Another practice found to significantly impact outcomes is how frequently organizations conduct assessments
Consistency of Assessments and Reporting The rate at which controls to manage risks are monitored assessed and reported on is directly related to outcomes For example the findings reveal significant differences from annual to monthly rates with those conducting less frequent assessments being among the majority of the worst performers and those with the most frequent assessments being among the best performers (Table 11)
Table 11 Rate of assessment and reporting
Outcome Average rate of assessment and reporting
Worst Once every twelve months
Average Once every four-to-five months
Best Once every month or less
Source IT Policy Compliance Group 2011
Mirroring findings in related research the rate at which controls are monitored assessed and compared against a range of conditions including policies prioritized risks threats gold-standards regulatory requirements and internal configuration baselines among others defines
1) When organizations find gaps in controls and procedures
2) Whether risks are larger than expected
3) Whether organizations are able to take appropriate action
4) Whether organizations are able to reduce business risks
When looked at from the perspective of size the research reveals many organizations may not have the tools to automate such assessments or are simply choosing to conduct annual audit review assessments rather than ongoing business risk assessments (Figure 14)
Figure 14 Rate of assessment and reporting
The best performers consistently assess
and report on controls and risks more
frequently
Source IT Policy Compliance Group 2011
Managing the Benefits and Risks of Mobile Computing
19
In addition to the rate of assessment and reporting another defining practice responsible for outcomes is found to be spending on information security by organizations
Spend on Information Security and Outcomes Worst performers are spending 60 percent less than average while the best performers are spending 60 percent more than average performers (Table 12)
Table 12 Spend on information security
Outcome Relative spend on information security compared with average performers
Worst 04
Average 10
Best 16
Source IT Policy Compliance Group 2011
In addition to the relative difference in spend on information security there are large differences in the percentage of the IT budget spent on information security While the range of spend among the worst is from zero to slightly more than 5 of the IT budget the average spent by the worst is less than three percent In contrast average performers spend 75 percent and best performers are spending 12 percent on average (Figure 15)
Figure 15 Spend on information security
The best performers spend a larger
percentage of a larger IT budget on
information security
Source IT Policy Compliance Group 2011
The amount spent is more revealing when considering the actual IT budgets IT budgets among worst performers is just 30 percent of what average performers spend on IT while the amount spent on IT by the best performers is more than 30 percent higher than the average performers
Thus smaller percentages of much smaller annual IT budgets are characteristic of spending on information security by the worst performers while larger percentages of much larger annual IT budgets are characteristic of spending on information security by the best performers
Spending on information security among some of the worst performers actually bottomed-out during the latter half of 2011 When combined with no controls on mobile devices and a culture that is ignoring or discounting the business risks related to the use of Mobile devices it is possible that 2012 could be a year with some negative brand-wrecking events for some of these organizations The best performers will be happy to have positioned themselves differently
Managing the Benefits and Risks of Mobile Computing
20
Back to the Future Is the adoption of Mobile computing a repeat of what occurred in the 1980s Back then it was connecting PCs via local networks to provide office workers with access to information that could be analyzed and acted on in local work groups Today it is about wirelessly interconnecting Mobile devices enabling anyone to share and act on information from any location If today is any indication of what happened in the 1980s then the use of these new powerful pocket-sized but supercharged Mobile devices is likely to change to shape of computing as we know it today
The use of Smartphones by 8-in-10 organizations could likely grow And the use of these devices by employees artificially restricted to 33 percent for now will likely grow as management systems and security controls become more standardized
But we are in a high-growth expansionary phase where Phone manufacturers and carriers are incented to cannibalize products they shipped just last year or as recently as last month leaving consumers employees and organizations with devices that are out of date and may never be updated with systems-level software that would otherwise cure security vulnerabilities
Unfortunately there is no standard Android phone unless you purchase a Google Nexus phone which will be updated by Google directly But the majority of Android phones purchased by consumers and employees are not stock Google Android phones Instead the vast majority of Android phones are overlaid by supplier goo-gads carrier changes along with unexpected and unwanted mdash Carrier IQ mdash additions The carriers and phone manufacturers are incented by the sale of new hardware bling and new service contracts
Encouraged by Google and the profit margins from the latest hardware bling and service contracts the carriers and phone manufacturers continue to develop their own versions of Android What the carriers and phone manufacturers are not incented to do is to deploy software updates to the Android operating system to their customers and so they donrsquot Instead they find it less expensive to lure their customers into an upgrade to a new device on contract two years later
There are more stable and routinely updated
operating systems shipping with
Smartphones from Applersquos iOS RIMrsquos
Blackberry and Windows phone
Eventually these problems and others may resolve themselves but it could be another few years mdash or more mdash of frustration before anything resembling stability in the Android operating system is common and enterprise-ready management tools and security controls are available for these new wonders of the information age
In the meantime there are much more stable mdash and routinely updated mdash operating systems shipping with Smartphones from Applersquos iOS RIMrsquos Blackberry and Windows phone None of these suffer the same problems afflicting Android phones
Whatever you do remember the lessons about what worked mdash and what didnrsquot mdash with earlier generational-changes such as the advent of PCs or the dawn of Internet-computing This longer-term perspective and the lessons will come in handy in formulating strategy and tactics as the use of Mobile computing expands in your workplace
Summary Observations Based on the outcomes being achieved by the best performing organizations
The business benefits of using Smartphones and Tablet computers include
Improved access to business information from any location
Improved customer retention and satisfaction levels and
Higher levels of revenue and profitability when compared with peers
The business risks of using mobile computing devices include
Loss or theft of sensitive information
Unauthorized access to information and applications
Loss of governance or control over sensitive business information business applications business risks and audits
Managing the Benefits and Risks of Mobile Computing
21
The primary information and applications currently being used with mobile devices include
Email and collaborative applications
Office productivity applications
Sales force automation applications
The primary actions to take to limit business risks include
Limit the use of Smartphones in the workplace to specifically approved employees
Fewer than 50 percent of employees currently use Smartphonersquos among the best performers
Policies and practices to implement include
Have IT manage all Tablet computers and Smartphones
Allow approved employees to use their own Smartphones
Furnish Tablet computers to employees
Considerations to evaluate include
Mobile devices are another part of the requirements of your information security audits
Compare your due-care requirements to defend against legal inquiry
Identify your cross-border data privacy and ownership requirements
Practices to implement include
Limit the use of Smartphones to access information and applications to approved employees
Limit access to sensitive information and applications for mobile devices
Geo-track devices especially Smartphones
Prohibit the use of custom ROMs and unapproved App-marketssites
Deliver security awareness training and measure effectiveness with employees
Scan mobile devices with anti-virus and anti-malware
Protect and backup information on the devices
Wipe and lock stolen and lost devices as soon as notified by employees
Investigate the availability of patching as part of device evaluations
Use frequent controls and configuration testing to reduce gaps and limit risks
Increase spend on information security beyond your peers
Managing the Benefits and Risks of Mobile Computing
22
Appendix Expected Changes in Device Use in the Workplace 2011 to 2013 Respondents were asked to identify changes that are most likely going to occur in organizational and employee uses of Smartphones and Tablet computers between 2011 and 2013 As projections these forecasts of user and organizational expectations are reflections of current sentiment
The use of Smartphones by organizations is expected to remain the same between 2011 and 2013 at 79 percent of all organizations However the use of Smartphones to access information and applications by employees is expected to increase from 33 percent to 39 percent (Table 13)
Table 13 Device use 2011 to 2013
Device being used Use by organizationsemployees
2011 2013 Change in use
Organizational use 79 79 -0- Smartphones
Employee use 33 39 6 increase
Organizational use 35 49 14 increase Tablet computers
Employee use 22 32 10 increase
Source IT Policy Compliance Group 2011
Unlike Smartphones the use of Tablet computers is expected to increase for organizations and employees from an average rate of 35 percent to 49 percent for organizations and from 22 to 32 for employees The increases are larger than the sample error of seven percent
After an increase in employees using both devices what is rather intriguing is an expected downtrend in the use of Smartphones among organizations with the best outcomes The decline in the use of Smartphones among best performers is expected to be from 85 percent to 73 percent mdash a decrease of 12 percent mdash from 2011 to 2013 (Figure 16)
Figure 16 Expected changes in device use
Source IT Policy Compliance Group 2011
The explanation for the overall rate of decline of Smartphone use among best performing organization can be found from declines in the uses of iPhone and Windows Phone platforms and much more significant declines in the use of Android and Blackberry phones
At the time the research was being carried out RIM was suffering from blackouts in its services around the World with rolling service-outages that occurred across multiple continents during a one-week period The general consensus of many people we spoke with at the time was the service-outages ldquoare the final event I need to make the switch when my subscription period is duerdquo On the other hand others simply replaced their Blackberry devices that week and did not wait until their subscription was due for renewal
Unlike the RIM Blackberry platforms we found consistently strong disaffection with Android devices due to the inability to obtain updates for the Android operating system without having to root devices and hope for the best using custom ROMs
Managing the Benefits and Risks of Mobile Computing
23
These problems left many saying things like ldquoI bought a pig in a poke never againrdquo Others took matters into their own hands rooted their phones and installed updated versions of Android over the Internet from a number of different development sites none of which were blessed by carriers phone manufacturers or their IT staff
IT managers the Group spoke with identified an utter lack of management tools for Android devices too many versions of Android and a complete lack of vulnerability testing for the devices The inability to update and cure security-problems were just some of the problems identified by IT managers the Group spoke with The upshot for many were two common reactions to the use of Android in the enterprise 1) if it was already deployed the common reaction was to pull back support for Android and convert to other supported Smartphones and 2) if Android was not already deployed wait for Android to become enterprise-ready (Table 14)
Table 14 Reaction to Android phones in the workplace
Status of Android Smartphones
Reaction
Already deployed Pull-back and convert to other Smartphones
If not already deployed Wait for Android to become enterprise-ready
Source IT Policy Compliance Group 2011
When it comes to Tablet computers the sentiment about expected changes in use of different platforms reveals Android Tablet computers likely to see the biggest gains between now and 2013 followed by healthy gains in the use of other Tablet computers The only sentiment indicating significant declines appear to be related to Android and Blackberry Smartphones (Figure 17)
Figure 17 Expected changes in platform use
Source IT Policy Compliance Group 2011
The outlook of current sentiment regarding use of different platforms by 2013 clearly indicates the best performers are predisposed to ditch Android and Blackberry phones and significantly increase the use of iPad Tablet computers
By contrast the worst performers are predisposed to increase use of Smartphones and Tablet computers across the board and with the exception of Blackberry phones increase other mobile device platforms among average performers
Managing the Benefits and Risks of Mobile Computing
24
Additional Resources Numerous sources of related information are available for those interested in pursuing more information on a wide range of topics related to Smartphones and Tablet computers The following are but a small sample of related information perspectives and insight The authors of these articles have no relationship with the ITPCG Android Security See httpdeveloperandroidcomguidetopicssecuritysecurityhtml Android Orphans Visualizing a Sad History of Support See httptheunderstatementcompost11982112928android-orphans-visualizing-a-sad-history-of-support A Look into Mobile Device Security httpwwwsymanteccomcontentenusaboutmediapdfssymc_mobile_device_security_june2011pdfom_ext_cid=biz_socmed_twitter_facebook_marketwire_linkedin_2011Jun_worldwide_mobilesecuritywp Carrier IQ what it is what it isnrsquot and what you need to do httpwwwengadgetcom20111201carrier-iq-what-it-is-what-it-isnt-and-what-you-need-to CIS Apple iOS configuration benchmarks httpbenchmarkscisecurityorgen-usroute=downloadsbrowsecategorybenchmarksmobileiphone Current Android Malware httpforensicsspreitzenbarthdepage_id=254 DISA STIGs for Smartphones - unclassified httpiasedisamilstigsnet_perimeterwirelesssmartphonehtml iOS Hardening Configuration Guide Department of Defence Intelligence and Security Australian Government httpwwwdsdgovaupublicationsiOS_Hardening_Guidepdf Mac OS X and iOS Security httpdeveloperapplecomlibrarymacdocumentationSecurityConceptualSecurity_OverviewArchitectureArchitecturehtmlapple_refdocuidTP30000976-CH202-TPXREF101 Mobile Malware Why Fraudsters are Two Steps Ahead httpwwwtrusteercomblogmobile-malware-why-fraudsters-are-two-steps-ahead Rootkit called Carrier IQ discovered phoning home with user data httpwwwzdnetcomblogapplerootkit-called-carrier-iq-discovered-phoning-home-with-user-data11792 RIM launches Blackberry Fusion to Secure Android and Apple devices httpbusinessfinancialpostcom20111129rim-launching-blackberry-mobile-fusion-to-secure-iphone-android-devices Smartphone Security httpwwwenisaeuropaeuactapplication-securitysmartphone-security-1 The Spy Files Map httpwikileaksorgThe-Spyfiles-The-Maphtml Ten Steps to Secure Your Mobile Devices httpswikiinternet2educonfluencedisplayitsg2Mobile+Device+Security
Why Your Phone is Insecure by Design httpwwwforbescomsitesandygreenberg20110812codebreaker-karsten-nohl-why-your-phone-is-insecure-by-design
Managing the Benefits and Risks of Mobile Computing
25
About the Research Topics researched by the IT Policy Compliance Group (IT PCG) are part of an ongoing calendar established in consultation with Advisory General and Charter members of the Group as well as from findings compiled from ongoing research In addition to specific tracking questions common to each benchmark the research is designed to uncover the relationship between business results outcomes being experienced by organizations actions taken practices implemented and capabilities organizations use to respond
The qualitative research findings presented in this report are from numerous focus groups one-on-one interviews and meetings held with larger audiences throughout 2011 The quantitative findings contained in this report are from primary research studies conducted with 210 organizations in North America during late 2011
The maximum error for the sample findings for the benchmark findings contained in this report is +- seven percent The primary focus of analysis contained in this report is to present the largest differences between the outcomes experienced and similarly aligned findings that are most responsible for the differences in outcomes Instead of relying on differences that are within or close to the sample errors the effort has been to focus on the largest differences For example instead of focusing on differences involving +- 10 percent the findings covered in this report tend to focus on the largest differences in the range of 50 percent or more
The findings covering the use of Mobile computing are representative of organizations in North America and cannot be construed or inferred to represent current usage or plans for Mobile computing outside of North America However the findings covering the performance outcomes benefits and risks of Mobile computing the practices to manage the business risks and the controls to manage the risks match findings from similar studies covering other geographies outside of North America including findings from Latin America South America Europe Africa the Middle East Asia and Oceania
Industries represented The quantitative research includes representation from the following industries advertising accounting services aerospace agriculture apparel architecture automotive banking chemicals computer equipment and peripherals computer software and services construction consumer durable goods distribution education engineering services entertainment financial services food and beverage government (local state and federal level public administration) government (defense and intelligence) health medical and dental services insurance law enforcement management services media scientific and consulting services manufacturing pharmaceuticals public relations publishing real estate rental and leasing services retail trade telecommunications equipment telecommunication services transportation warehousing travel accommodation and hospitality services utilities waste management and wholesale trade Five industries represent 47 percent of the sample These include Banking Education Financial and Accounting Services Manufacturing and Retail Trade Another 27 industries represent the other 53 percent of the sample none of which represents more than five percent of the sample
Revenue or agency budgets of participating organizations Size of the organizations participating in the most recent benchmarks is somewhat evenly distributed although slightly fewer represent midsize organizations Thirty-six percent of the organizations represented by the findings have annual revenues or agency budgets that are less than $50 million Another twenty-nine percent of the sample has annual revenues or agency budgets between $50 million and $999 million The remaining thirty-five percent of the sample has annual revenues or agency budgets that are $1 billion or more
Functional areas of responsibility Thirty-five percent of the qualified participants for the benchmark work in IT with another 30 percent work in finance or internal controls The remaining 35 percent of the qualified participants work in a wide variety of functions from business line management senior management product design and development legal compliance sales marketing procurement logistics and customer services among other functions
Job titles of participants Thirty-five percent of the participants in the benchmark are senior managers with titles that include CEO CIO CFO or Vice president Thirty-eight percent are managers or directors and twenty-seven percent are staff in their organizations
Managing the Benefits and Risks of Mobile Computing
About IT Policy Compliance Group The mission of the IT Policy Compliance Group is to promote actionable findings based on evidence to assist organizations with delivering more value less risk and achieve IT policy and compliance objectives related to the use of information systems The Group Web site at wwwitpolicycompliancecom features quick two-minute self-assessments to compare outcomes and practices against onersquos industry peers and best performing organizations research reports continuing professional education conferences and seminars member and knowledge centers related research from around the World and resources including standards and frameworks associations government and regulators
The Grouprsquos research is designed to help IT risk legal financial and internal audit professionals to
Benchmark results and efforts against peers and best-in-class performers
Identify key drivers challenges and responses to improve results
Determine the applicability and use of specific capabilities to improve results
Identify best practices based on results and experience of peers
The Group relies upon its members and advisors for its research and editorial calendar
IT Policy Compliance Group Charter Members
The Institute of Symantec Corporation Internal Auditors ISACA 350 Ellis Street 247 Maitland Avenue 3701 Algonquin Road Suite 1010 Mountain View CA 94043 Altamonte Springs FL 32701 Rolling Meadows IL 60008 +1 (650) 527 8000 +1 (407) 937 1100 +1 (847) 253 1545 wwwsymanteccom wwwtheiiaorg wwwisacaorg infosymanteccom iiatheiiaorg infoisacaorg
Computer Security Institute Protiviti IT Governance Institute 600 Harrison Street New York Office 3701 Algonquin Road Suite 1010 San Francisco CA 94107 1290 Avenue of the Rolling Meadows IL 60008 +1 (415) 947 6320 Americas 5th Floor +1 (847) 660 5600 wwwgocsicom New York New York 10104 wwwitgiorg csicmpcom +1 (212) 603 8300 infoitgiorg wwwprotiviticom infoprotiviticom
IT Policy Compliance Group Affiliate Members and Advisors A current list of Affiliate Members and Advisors to the Group can be found on the IT Policy Compliance Group website
26
Founded in 2005 the IT Policy Compliance Group conducts benchmark research focused on delivering fact-based guidance on the steps that can be taken to improve results Benchmark results are reported through wwwitpolicycompliancecom for the benefit of members
IT Policy Compliance Group
Contacts Managing Director Jim Hurley Telephone +1 (216) 373 7010 jhurleyitpolicycompliancecom Managing Editor John Ortbal Telephone +1 (847) 444 0344 jortbalitpolicycompliancecom wwwitpolicycompliancecom
December 2011
The information contained in this publication has been obtained from sources that the IT Policy Compliance Group believes to be reliable but is not guaranteed Research publications reflect current conditions that are subject to change without notice
Copyright copy 2011 IT Policy Compliance Group Names and logos may be trademarks of their respective owners All rights reserved 1211 293167003
32
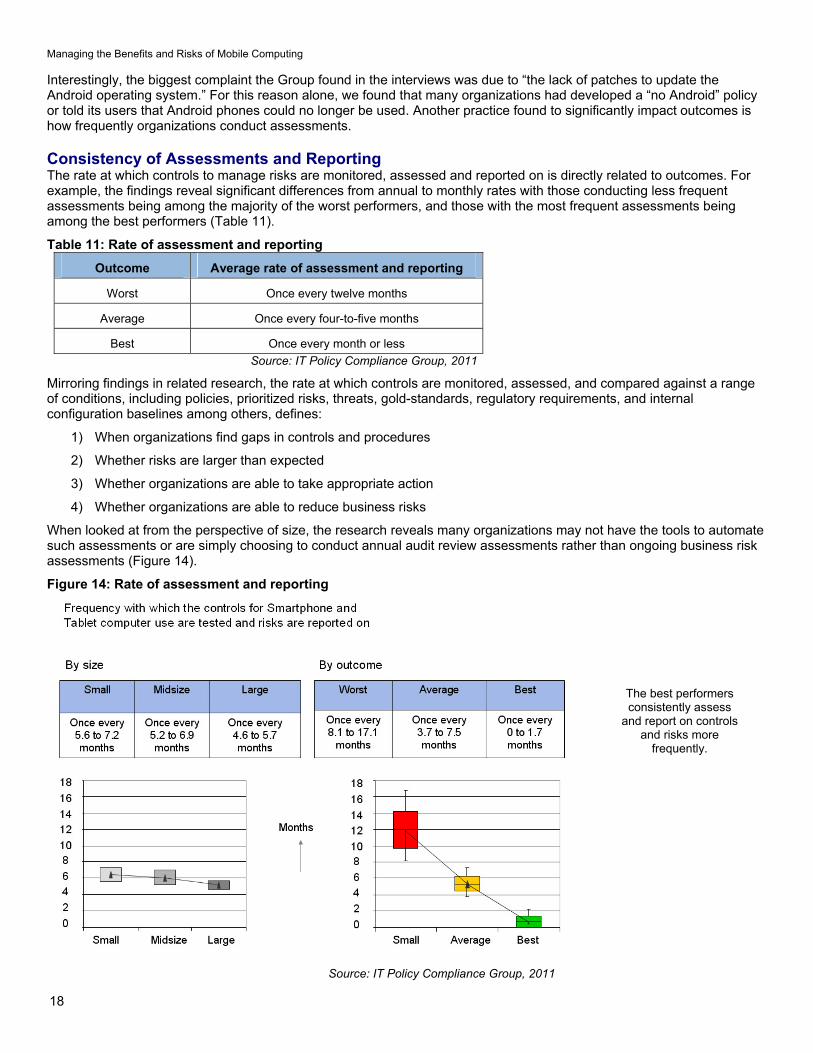
Managing the Benefits and Risks of Mobile Computing
18
Interestingly the biggest complaint the Group found in the interviews was due to ldquothe lack of patches to update the Android operating systemrdquo For this reason alone we found that many organizations had developed a ldquono Androidrdquo policy or told its users that Android phones could no longer be used Another practice found to significantly impact outcomes is how frequently organizations conduct assessments
Consistency of Assessments and Reporting The rate at which controls to manage risks are monitored assessed and reported on is directly related to outcomes For example the findings reveal significant differences from annual to monthly rates with those conducting less frequent assessments being among the majority of the worst performers and those with the most frequent assessments being among the best performers (Table 11)
Table 11 Rate of assessment and reporting
Outcome Average rate of assessment and reporting
Worst Once every twelve months
Average Once every four-to-five months
Best Once every month or less
Source IT Policy Compliance Group 2011
Mirroring findings in related research the rate at which controls are monitored assessed and compared against a range of conditions including policies prioritized risks threats gold-standards regulatory requirements and internal configuration baselines among others defines
1) When organizations find gaps in controls and procedures
2) Whether risks are larger than expected
3) Whether organizations are able to take appropriate action
4) Whether organizations are able to reduce business risks
When looked at from the perspective of size the research reveals many organizations may not have the tools to automate such assessments or are simply choosing to conduct annual audit review assessments rather than ongoing business risk assessments (Figure 14)
Figure 14 Rate of assessment and reporting
The best performers consistently assess
and report on controls and risks more
frequently
Source IT Policy Compliance Group 2011
Managing the Benefits and Risks of Mobile Computing
19
In addition to the rate of assessment and reporting another defining practice responsible for outcomes is found to be spending on information security by organizations
Spend on Information Security and Outcomes Worst performers are spending 60 percent less than average while the best performers are spending 60 percent more than average performers (Table 12)
Table 12 Spend on information security
Outcome Relative spend on information security compared with average performers
Worst 04
Average 10
Best 16
Source IT Policy Compliance Group 2011
In addition to the relative difference in spend on information security there are large differences in the percentage of the IT budget spent on information security While the range of spend among the worst is from zero to slightly more than 5 of the IT budget the average spent by the worst is less than three percent In contrast average performers spend 75 percent and best performers are spending 12 percent on average (Figure 15)
Figure 15 Spend on information security
The best performers spend a larger
percentage of a larger IT budget on
information security
Source IT Policy Compliance Group 2011
The amount spent is more revealing when considering the actual IT budgets IT budgets among worst performers is just 30 percent of what average performers spend on IT while the amount spent on IT by the best performers is more than 30 percent higher than the average performers
Thus smaller percentages of much smaller annual IT budgets are characteristic of spending on information security by the worst performers while larger percentages of much larger annual IT budgets are characteristic of spending on information security by the best performers
Spending on information security among some of the worst performers actually bottomed-out during the latter half of 2011 When combined with no controls on mobile devices and a culture that is ignoring or discounting the business risks related to the use of Mobile devices it is possible that 2012 could be a year with some negative brand-wrecking events for some of these organizations The best performers will be happy to have positioned themselves differently
Managing the Benefits and Risks of Mobile Computing
20
Back to the Future Is the adoption of Mobile computing a repeat of what occurred in the 1980s Back then it was connecting PCs via local networks to provide office workers with access to information that could be analyzed and acted on in local work groups Today it is about wirelessly interconnecting Mobile devices enabling anyone to share and act on information from any location If today is any indication of what happened in the 1980s then the use of these new powerful pocket-sized but supercharged Mobile devices is likely to change to shape of computing as we know it today
The use of Smartphones by 8-in-10 organizations could likely grow And the use of these devices by employees artificially restricted to 33 percent for now will likely grow as management systems and security controls become more standardized
But we are in a high-growth expansionary phase where Phone manufacturers and carriers are incented to cannibalize products they shipped just last year or as recently as last month leaving consumers employees and organizations with devices that are out of date and may never be updated with systems-level software that would otherwise cure security vulnerabilities
Unfortunately there is no standard Android phone unless you purchase a Google Nexus phone which will be updated by Google directly But the majority of Android phones purchased by consumers and employees are not stock Google Android phones Instead the vast majority of Android phones are overlaid by supplier goo-gads carrier changes along with unexpected and unwanted mdash Carrier IQ mdash additions The carriers and phone manufacturers are incented by the sale of new hardware bling and new service contracts
Encouraged by Google and the profit margins from the latest hardware bling and service contracts the carriers and phone manufacturers continue to develop their own versions of Android What the carriers and phone manufacturers are not incented to do is to deploy software updates to the Android operating system to their customers and so they donrsquot Instead they find it less expensive to lure their customers into an upgrade to a new device on contract two years later
There are more stable and routinely updated
operating systems shipping with
Smartphones from Applersquos iOS RIMrsquos
Blackberry and Windows phone
Eventually these problems and others may resolve themselves but it could be another few years mdash or more mdash of frustration before anything resembling stability in the Android operating system is common and enterprise-ready management tools and security controls are available for these new wonders of the information age
In the meantime there are much more stable mdash and routinely updated mdash operating systems shipping with Smartphones from Applersquos iOS RIMrsquos Blackberry and Windows phone None of these suffer the same problems afflicting Android phones
Whatever you do remember the lessons about what worked mdash and what didnrsquot mdash with earlier generational-changes such as the advent of PCs or the dawn of Internet-computing This longer-term perspective and the lessons will come in handy in formulating strategy and tactics as the use of Mobile computing expands in your workplace
Summary Observations Based on the outcomes being achieved by the best performing organizations
The business benefits of using Smartphones and Tablet computers include
Improved access to business information from any location
Improved customer retention and satisfaction levels and
Higher levels of revenue and profitability when compared with peers
The business risks of using mobile computing devices include
Loss or theft of sensitive information
Unauthorized access to information and applications
Loss of governance or control over sensitive business information business applications business risks and audits
Managing the Benefits and Risks of Mobile Computing
21
The primary information and applications currently being used with mobile devices include
Email and collaborative applications
Office productivity applications
Sales force automation applications
The primary actions to take to limit business risks include
Limit the use of Smartphones in the workplace to specifically approved employees
Fewer than 50 percent of employees currently use Smartphonersquos among the best performers
Policies and practices to implement include
Have IT manage all Tablet computers and Smartphones
Allow approved employees to use their own Smartphones
Furnish Tablet computers to employees
Considerations to evaluate include
Mobile devices are another part of the requirements of your information security audits
Compare your due-care requirements to defend against legal inquiry
Identify your cross-border data privacy and ownership requirements
Practices to implement include
Limit the use of Smartphones to access information and applications to approved employees
Limit access to sensitive information and applications for mobile devices
Geo-track devices especially Smartphones
Prohibit the use of custom ROMs and unapproved App-marketssites
Deliver security awareness training and measure effectiveness with employees
Scan mobile devices with anti-virus and anti-malware
Protect and backup information on the devices
Wipe and lock stolen and lost devices as soon as notified by employees
Investigate the availability of patching as part of device evaluations
Use frequent controls and configuration testing to reduce gaps and limit risks
Increase spend on information security beyond your peers
Managing the Benefits and Risks of Mobile Computing
22
Appendix Expected Changes in Device Use in the Workplace 2011 to 2013 Respondents were asked to identify changes that are most likely going to occur in organizational and employee uses of Smartphones and Tablet computers between 2011 and 2013 As projections these forecasts of user and organizational expectations are reflections of current sentiment
The use of Smartphones by organizations is expected to remain the same between 2011 and 2013 at 79 percent of all organizations However the use of Smartphones to access information and applications by employees is expected to increase from 33 percent to 39 percent (Table 13)
Table 13 Device use 2011 to 2013
Device being used Use by organizationsemployees
2011 2013 Change in use
Organizational use 79 79 -0- Smartphones
Employee use 33 39 6 increase
Organizational use 35 49 14 increase Tablet computers
Employee use 22 32 10 increase
Source IT Policy Compliance Group 2011
Unlike Smartphones the use of Tablet computers is expected to increase for organizations and employees from an average rate of 35 percent to 49 percent for organizations and from 22 to 32 for employees The increases are larger than the sample error of seven percent
After an increase in employees using both devices what is rather intriguing is an expected downtrend in the use of Smartphones among organizations with the best outcomes The decline in the use of Smartphones among best performers is expected to be from 85 percent to 73 percent mdash a decrease of 12 percent mdash from 2011 to 2013 (Figure 16)
Figure 16 Expected changes in device use
Source IT Policy Compliance Group 2011
The explanation for the overall rate of decline of Smartphone use among best performing organization can be found from declines in the uses of iPhone and Windows Phone platforms and much more significant declines in the use of Android and Blackberry phones
At the time the research was being carried out RIM was suffering from blackouts in its services around the World with rolling service-outages that occurred across multiple continents during a one-week period The general consensus of many people we spoke with at the time was the service-outages ldquoare the final event I need to make the switch when my subscription period is duerdquo On the other hand others simply replaced their Blackberry devices that week and did not wait until their subscription was due for renewal
Unlike the RIM Blackberry platforms we found consistently strong disaffection with Android devices due to the inability to obtain updates for the Android operating system without having to root devices and hope for the best using custom ROMs
Managing the Benefits and Risks of Mobile Computing
23
These problems left many saying things like ldquoI bought a pig in a poke never againrdquo Others took matters into their own hands rooted their phones and installed updated versions of Android over the Internet from a number of different development sites none of which were blessed by carriers phone manufacturers or their IT staff
IT managers the Group spoke with identified an utter lack of management tools for Android devices too many versions of Android and a complete lack of vulnerability testing for the devices The inability to update and cure security-problems were just some of the problems identified by IT managers the Group spoke with The upshot for many were two common reactions to the use of Android in the enterprise 1) if it was already deployed the common reaction was to pull back support for Android and convert to other supported Smartphones and 2) if Android was not already deployed wait for Android to become enterprise-ready (Table 14)
Table 14 Reaction to Android phones in the workplace
Status of Android Smartphones
Reaction
Already deployed Pull-back and convert to other Smartphones
If not already deployed Wait for Android to become enterprise-ready
Source IT Policy Compliance Group 2011
When it comes to Tablet computers the sentiment about expected changes in use of different platforms reveals Android Tablet computers likely to see the biggest gains between now and 2013 followed by healthy gains in the use of other Tablet computers The only sentiment indicating significant declines appear to be related to Android and Blackberry Smartphones (Figure 17)
Figure 17 Expected changes in platform use
Source IT Policy Compliance Group 2011
The outlook of current sentiment regarding use of different platforms by 2013 clearly indicates the best performers are predisposed to ditch Android and Blackberry phones and significantly increase the use of iPad Tablet computers
By contrast the worst performers are predisposed to increase use of Smartphones and Tablet computers across the board and with the exception of Blackberry phones increase other mobile device platforms among average performers
Managing the Benefits and Risks of Mobile Computing
24
Additional Resources Numerous sources of related information are available for those interested in pursuing more information on a wide range of topics related to Smartphones and Tablet computers The following are but a small sample of related information perspectives and insight The authors of these articles have no relationship with the ITPCG Android Security See httpdeveloperandroidcomguidetopicssecuritysecurityhtml Android Orphans Visualizing a Sad History of Support See httptheunderstatementcompost11982112928android-orphans-visualizing-a-sad-history-of-support A Look into Mobile Device Security httpwwwsymanteccomcontentenusaboutmediapdfssymc_mobile_device_security_june2011pdfom_ext_cid=biz_socmed_twitter_facebook_marketwire_linkedin_2011Jun_worldwide_mobilesecuritywp Carrier IQ what it is what it isnrsquot and what you need to do httpwwwengadgetcom20111201carrier-iq-what-it-is-what-it-isnt-and-what-you-need-to CIS Apple iOS configuration benchmarks httpbenchmarkscisecurityorgen-usroute=downloadsbrowsecategorybenchmarksmobileiphone Current Android Malware httpforensicsspreitzenbarthdepage_id=254 DISA STIGs for Smartphones - unclassified httpiasedisamilstigsnet_perimeterwirelesssmartphonehtml iOS Hardening Configuration Guide Department of Defence Intelligence and Security Australian Government httpwwwdsdgovaupublicationsiOS_Hardening_Guidepdf Mac OS X and iOS Security httpdeveloperapplecomlibrarymacdocumentationSecurityConceptualSecurity_OverviewArchitectureArchitecturehtmlapple_refdocuidTP30000976-CH202-TPXREF101 Mobile Malware Why Fraudsters are Two Steps Ahead httpwwwtrusteercomblogmobile-malware-why-fraudsters-are-two-steps-ahead Rootkit called Carrier IQ discovered phoning home with user data httpwwwzdnetcomblogapplerootkit-called-carrier-iq-discovered-phoning-home-with-user-data11792 RIM launches Blackberry Fusion to Secure Android and Apple devices httpbusinessfinancialpostcom20111129rim-launching-blackberry-mobile-fusion-to-secure-iphone-android-devices Smartphone Security httpwwwenisaeuropaeuactapplication-securitysmartphone-security-1 The Spy Files Map httpwikileaksorgThe-Spyfiles-The-Maphtml Ten Steps to Secure Your Mobile Devices httpswikiinternet2educonfluencedisplayitsg2Mobile+Device+Security
Why Your Phone is Insecure by Design httpwwwforbescomsitesandygreenberg20110812codebreaker-karsten-nohl-why-your-phone-is-insecure-by-design
Managing the Benefits and Risks of Mobile Computing
25
About the Research Topics researched by the IT Policy Compliance Group (IT PCG) are part of an ongoing calendar established in consultation with Advisory General and Charter members of the Group as well as from findings compiled from ongoing research In addition to specific tracking questions common to each benchmark the research is designed to uncover the relationship between business results outcomes being experienced by organizations actions taken practices implemented and capabilities organizations use to respond
The qualitative research findings presented in this report are from numerous focus groups one-on-one interviews and meetings held with larger audiences throughout 2011 The quantitative findings contained in this report are from primary research studies conducted with 210 organizations in North America during late 2011
The maximum error for the sample findings for the benchmark findings contained in this report is +- seven percent The primary focus of analysis contained in this report is to present the largest differences between the outcomes experienced and similarly aligned findings that are most responsible for the differences in outcomes Instead of relying on differences that are within or close to the sample errors the effort has been to focus on the largest differences For example instead of focusing on differences involving +- 10 percent the findings covered in this report tend to focus on the largest differences in the range of 50 percent or more
The findings covering the use of Mobile computing are representative of organizations in North America and cannot be construed or inferred to represent current usage or plans for Mobile computing outside of North America However the findings covering the performance outcomes benefits and risks of Mobile computing the practices to manage the business risks and the controls to manage the risks match findings from similar studies covering other geographies outside of North America including findings from Latin America South America Europe Africa the Middle East Asia and Oceania
Industries represented The quantitative research includes representation from the following industries advertising accounting services aerospace agriculture apparel architecture automotive banking chemicals computer equipment and peripherals computer software and services construction consumer durable goods distribution education engineering services entertainment financial services food and beverage government (local state and federal level public administration) government (defense and intelligence) health medical and dental services insurance law enforcement management services media scientific and consulting services manufacturing pharmaceuticals public relations publishing real estate rental and leasing services retail trade telecommunications equipment telecommunication services transportation warehousing travel accommodation and hospitality services utilities waste management and wholesale trade Five industries represent 47 percent of the sample These include Banking Education Financial and Accounting Services Manufacturing and Retail Trade Another 27 industries represent the other 53 percent of the sample none of which represents more than five percent of the sample
Revenue or agency budgets of participating organizations Size of the organizations participating in the most recent benchmarks is somewhat evenly distributed although slightly fewer represent midsize organizations Thirty-six percent of the organizations represented by the findings have annual revenues or agency budgets that are less than $50 million Another twenty-nine percent of the sample has annual revenues or agency budgets between $50 million and $999 million The remaining thirty-five percent of the sample has annual revenues or agency budgets that are $1 billion or more
Functional areas of responsibility Thirty-five percent of the qualified participants for the benchmark work in IT with another 30 percent work in finance or internal controls The remaining 35 percent of the qualified participants work in a wide variety of functions from business line management senior management product design and development legal compliance sales marketing procurement logistics and customer services among other functions
Job titles of participants Thirty-five percent of the participants in the benchmark are senior managers with titles that include CEO CIO CFO or Vice president Thirty-eight percent are managers or directors and twenty-seven percent are staff in their organizations
Managing the Benefits and Risks of Mobile Computing
About IT Policy Compliance Group The mission of the IT Policy Compliance Group is to promote actionable findings based on evidence to assist organizations with delivering more value less risk and achieve IT policy and compliance objectives related to the use of information systems The Group Web site at wwwitpolicycompliancecom features quick two-minute self-assessments to compare outcomes and practices against onersquos industry peers and best performing organizations research reports continuing professional education conferences and seminars member and knowledge centers related research from around the World and resources including standards and frameworks associations government and regulators
The Grouprsquos research is designed to help IT risk legal financial and internal audit professionals to
Benchmark results and efforts against peers and best-in-class performers
Identify key drivers challenges and responses to improve results
Determine the applicability and use of specific capabilities to improve results
Identify best practices based on results and experience of peers
The Group relies upon its members and advisors for its research and editorial calendar
IT Policy Compliance Group Charter Members
The Institute of Symantec Corporation Internal Auditors ISACA 350 Ellis Street 247 Maitland Avenue 3701 Algonquin Road Suite 1010 Mountain View CA 94043 Altamonte Springs FL 32701 Rolling Meadows IL 60008 +1 (650) 527 8000 +1 (407) 937 1100 +1 (847) 253 1545 wwwsymanteccom wwwtheiiaorg wwwisacaorg infosymanteccom iiatheiiaorg infoisacaorg
Computer Security Institute Protiviti IT Governance Institute 600 Harrison Street New York Office 3701 Algonquin Road Suite 1010 San Francisco CA 94107 1290 Avenue of the Rolling Meadows IL 60008 +1 (415) 947 6320 Americas 5th Floor +1 (847) 660 5600 wwwgocsicom New York New York 10104 wwwitgiorg csicmpcom +1 (212) 603 8300 infoitgiorg wwwprotiviticom infoprotiviticom
IT Policy Compliance Group Affiliate Members and Advisors A current list of Affiliate Members and Advisors to the Group can be found on the IT Policy Compliance Group website
26
Founded in 2005 the IT Policy Compliance Group conducts benchmark research focused on delivering fact-based guidance on the steps that can be taken to improve results Benchmark results are reported through wwwitpolicycompliancecom for the benefit of members
IT Policy Compliance Group
Contacts Managing Director Jim Hurley Telephone +1 (216) 373 7010 jhurleyitpolicycompliancecom Managing Editor John Ortbal Telephone +1 (847) 444 0344 jortbalitpolicycompliancecom wwwitpolicycompliancecom
December 2011
The information contained in this publication has been obtained from sources that the IT Policy Compliance Group believes to be reliable but is not guaranteed Research publications reflect current conditions that are subject to change without notice
Copyright copy 2011 IT Policy Compliance Group Names and logos may be trademarks of their respective owners All rights reserved 1211 293167003
32
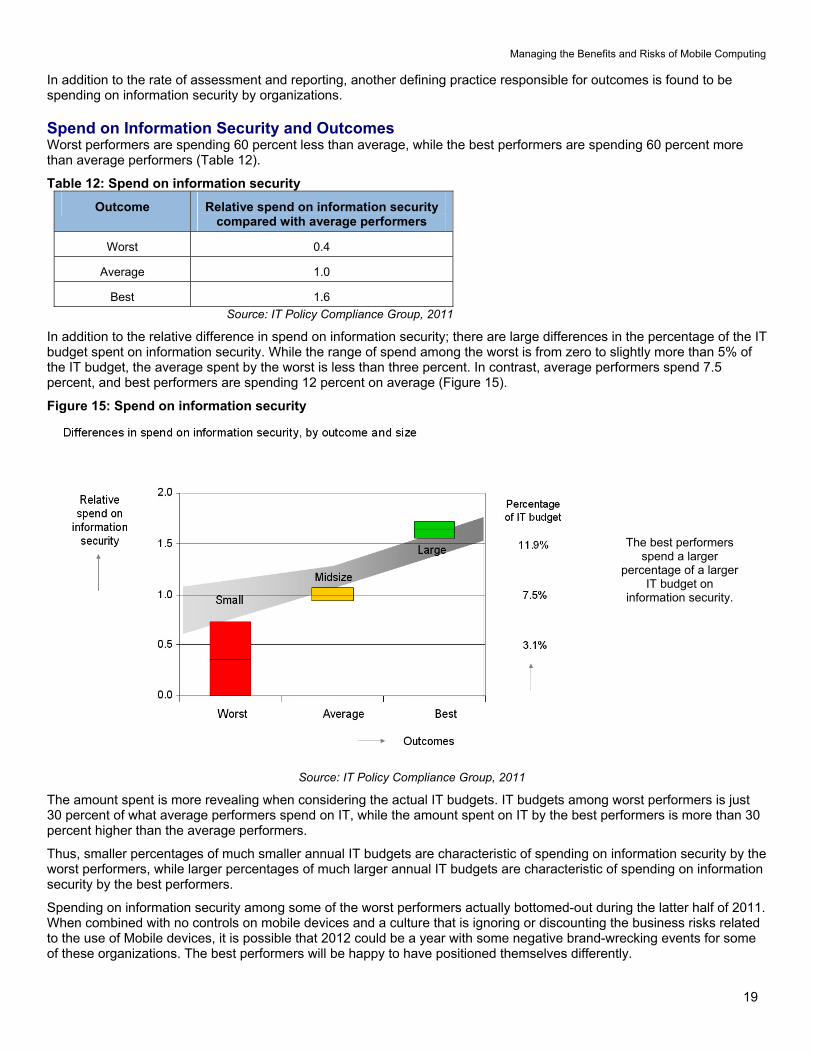
Managing the Benefits and Risks of Mobile Computing
19
In addition to the rate of assessment and reporting another defining practice responsible for outcomes is found to be spending on information security by organizations
Spend on Information Security and Outcomes Worst performers are spending 60 percent less than average while the best performers are spending 60 percent more than average performers (Table 12)
Table 12 Spend on information security
Outcome Relative spend on information security compared with average performers
Worst 04
Average 10
Best 16
Source IT Policy Compliance Group 2011
In addition to the relative difference in spend on information security there are large differences in the percentage of the IT budget spent on information security While the range of spend among the worst is from zero to slightly more than 5 of the IT budget the average spent by the worst is less than three percent In contrast average performers spend 75 percent and best performers are spending 12 percent on average (Figure 15)
Figure 15 Spend on information security
The best performers spend a larger
percentage of a larger IT budget on
information security
Source IT Policy Compliance Group 2011
The amount spent is more revealing when considering the actual IT budgets IT budgets among worst performers is just 30 percent of what average performers spend on IT while the amount spent on IT by the best performers is more than 30 percent higher than the average performers
Thus smaller percentages of much smaller annual IT budgets are characteristic of spending on information security by the worst performers while larger percentages of much larger annual IT budgets are characteristic of spending on information security by the best performers
Spending on information security among some of the worst performers actually bottomed-out during the latter half of 2011 When combined with no controls on mobile devices and a culture that is ignoring or discounting the business risks related to the use of Mobile devices it is possible that 2012 could be a year with some negative brand-wrecking events for some of these organizations The best performers will be happy to have positioned themselves differently
Managing the Benefits and Risks of Mobile Computing
20
Back to the Future Is the adoption of Mobile computing a repeat of what occurred in the 1980s Back then it was connecting PCs via local networks to provide office workers with access to information that could be analyzed and acted on in local work groups Today it is about wirelessly interconnecting Mobile devices enabling anyone to share and act on information from any location If today is any indication of what happened in the 1980s then the use of these new powerful pocket-sized but supercharged Mobile devices is likely to change to shape of computing as we know it today
The use of Smartphones by 8-in-10 organizations could likely grow And the use of these devices by employees artificially restricted to 33 percent for now will likely grow as management systems and security controls become more standardized
But we are in a high-growth expansionary phase where Phone manufacturers and carriers are incented to cannibalize products they shipped just last year or as recently as last month leaving consumers employees and organizations with devices that are out of date and may never be updated with systems-level software that would otherwise cure security vulnerabilities
Unfortunately there is no standard Android phone unless you purchase a Google Nexus phone which will be updated by Google directly But the majority of Android phones purchased by consumers and employees are not stock Google Android phones Instead the vast majority of Android phones are overlaid by supplier goo-gads carrier changes along with unexpected and unwanted mdash Carrier IQ mdash additions The carriers and phone manufacturers are incented by the sale of new hardware bling and new service contracts
Encouraged by Google and the profit margins from the latest hardware bling and service contracts the carriers and phone manufacturers continue to develop their own versions of Android What the carriers and phone manufacturers are not incented to do is to deploy software updates to the Android operating system to their customers and so they donrsquot Instead they find it less expensive to lure their customers into an upgrade to a new device on contract two years later
There are more stable and routinely updated
operating systems shipping with
Smartphones from Applersquos iOS RIMrsquos
Blackberry and Windows phone
Eventually these problems and others may resolve themselves but it could be another few years mdash or more mdash of frustration before anything resembling stability in the Android operating system is common and enterprise-ready management tools and security controls are available for these new wonders of the information age
In the meantime there are much more stable mdash and routinely updated mdash operating systems shipping with Smartphones from Applersquos iOS RIMrsquos Blackberry and Windows phone None of these suffer the same problems afflicting Android phones
Whatever you do remember the lessons about what worked mdash and what didnrsquot mdash with earlier generational-changes such as the advent of PCs or the dawn of Internet-computing This longer-term perspective and the lessons will come in handy in formulating strategy and tactics as the use of Mobile computing expands in your workplace
Summary Observations Based on the outcomes being achieved by the best performing organizations
The business benefits of using Smartphones and Tablet computers include
Improved access to business information from any location
Improved customer retention and satisfaction levels and
Higher levels of revenue and profitability when compared with peers
The business risks of using mobile computing devices include
Loss or theft of sensitive information
Unauthorized access to information and applications
Loss of governance or control over sensitive business information business applications business risks and audits
Managing the Benefits and Risks of Mobile Computing
21
The primary information and applications currently being used with mobile devices include
Email and collaborative applications
Office productivity applications
Sales force automation applications
The primary actions to take to limit business risks include
Limit the use of Smartphones in the workplace to specifically approved employees
Fewer than 50 percent of employees currently use Smartphonersquos among the best performers
Policies and practices to implement include
Have IT manage all Tablet computers and Smartphones
Allow approved employees to use their own Smartphones
Furnish Tablet computers to employees
Considerations to evaluate include
Mobile devices are another part of the requirements of your information security audits
Compare your due-care requirements to defend against legal inquiry
Identify your cross-border data privacy and ownership requirements
Practices to implement include
Limit the use of Smartphones to access information and applications to approved employees
Limit access to sensitive information and applications for mobile devices
Geo-track devices especially Smartphones
Prohibit the use of custom ROMs and unapproved App-marketssites
Deliver security awareness training and measure effectiveness with employees
Scan mobile devices with anti-virus and anti-malware
Protect and backup information on the devices
Wipe and lock stolen and lost devices as soon as notified by employees
Investigate the availability of patching as part of device evaluations
Use frequent controls and configuration testing to reduce gaps and limit risks
Increase spend on information security beyond your peers
Managing the Benefits and Risks of Mobile Computing
22
Appendix Expected Changes in Device Use in the Workplace 2011 to 2013 Respondents were asked to identify changes that are most likely going to occur in organizational and employee uses of Smartphones and Tablet computers between 2011 and 2013 As projections these forecasts of user and organizational expectations are reflections of current sentiment
The use of Smartphones by organizations is expected to remain the same between 2011 and 2013 at 79 percent of all organizations However the use of Smartphones to access information and applications by employees is expected to increase from 33 percent to 39 percent (Table 13)
Table 13 Device use 2011 to 2013
Device being used Use by organizationsemployees
2011 2013 Change in use
Organizational use 79 79 -0- Smartphones
Employee use 33 39 6 increase
Organizational use 35 49 14 increase Tablet computers
Employee use 22 32 10 increase
Source IT Policy Compliance Group 2011
Unlike Smartphones the use of Tablet computers is expected to increase for organizations and employees from an average rate of 35 percent to 49 percent for organizations and from 22 to 32 for employees The increases are larger than the sample error of seven percent
After an increase in employees using both devices what is rather intriguing is an expected downtrend in the use of Smartphones among organizations with the best outcomes The decline in the use of Smartphones among best performers is expected to be from 85 percent to 73 percent mdash a decrease of 12 percent mdash from 2011 to 2013 (Figure 16)
Figure 16 Expected changes in device use
Source IT Policy Compliance Group 2011
The explanation for the overall rate of decline of Smartphone use among best performing organization can be found from declines in the uses of iPhone and Windows Phone platforms and much more significant declines in the use of Android and Blackberry phones
At the time the research was being carried out RIM was suffering from blackouts in its services around the World with rolling service-outages that occurred across multiple continents during a one-week period The general consensus of many people we spoke with at the time was the service-outages ldquoare the final event I need to make the switch when my subscription period is duerdquo On the other hand others simply replaced their Blackberry devices that week and did not wait until their subscription was due for renewal
Unlike the RIM Blackberry platforms we found consistently strong disaffection with Android devices due to the inability to obtain updates for the Android operating system without having to root devices and hope for the best using custom ROMs
Managing the Benefits and Risks of Mobile Computing
23
These problems left many saying things like ldquoI bought a pig in a poke never againrdquo Others took matters into their own hands rooted their phones and installed updated versions of Android over the Internet from a number of different development sites none of which were blessed by carriers phone manufacturers or their IT staff
IT managers the Group spoke with identified an utter lack of management tools for Android devices too many versions of Android and a complete lack of vulnerability testing for the devices The inability to update and cure security-problems were just some of the problems identified by IT managers the Group spoke with The upshot for many were two common reactions to the use of Android in the enterprise 1) if it was already deployed the common reaction was to pull back support for Android and convert to other supported Smartphones and 2) if Android was not already deployed wait for Android to become enterprise-ready (Table 14)
Table 14 Reaction to Android phones in the workplace
Status of Android Smartphones
Reaction
Already deployed Pull-back and convert to other Smartphones
If not already deployed Wait for Android to become enterprise-ready
Source IT Policy Compliance Group 2011
When it comes to Tablet computers the sentiment about expected changes in use of different platforms reveals Android Tablet computers likely to see the biggest gains between now and 2013 followed by healthy gains in the use of other Tablet computers The only sentiment indicating significant declines appear to be related to Android and Blackberry Smartphones (Figure 17)
Figure 17 Expected changes in platform use
Source IT Policy Compliance Group 2011
The outlook of current sentiment regarding use of different platforms by 2013 clearly indicates the best performers are predisposed to ditch Android and Blackberry phones and significantly increase the use of iPad Tablet computers
By contrast the worst performers are predisposed to increase use of Smartphones and Tablet computers across the board and with the exception of Blackberry phones increase other mobile device platforms among average performers
Managing the Benefits and Risks of Mobile Computing
24
Additional Resources Numerous sources of related information are available for those interested in pursuing more information on a wide range of topics related to Smartphones and Tablet computers The following are but a small sample of related information perspectives and insight The authors of these articles have no relationship with the ITPCG Android Security See httpdeveloperandroidcomguidetopicssecuritysecurityhtml Android Orphans Visualizing a Sad History of Support See httptheunderstatementcompost11982112928android-orphans-visualizing-a-sad-history-of-support A Look into Mobile Device Security httpwwwsymanteccomcontentenusaboutmediapdfssymc_mobile_device_security_june2011pdfom_ext_cid=biz_socmed_twitter_facebook_marketwire_linkedin_2011Jun_worldwide_mobilesecuritywp Carrier IQ what it is what it isnrsquot and what you need to do httpwwwengadgetcom20111201carrier-iq-what-it-is-what-it-isnt-and-what-you-need-to CIS Apple iOS configuration benchmarks httpbenchmarkscisecurityorgen-usroute=downloadsbrowsecategorybenchmarksmobileiphone Current Android Malware httpforensicsspreitzenbarthdepage_id=254 DISA STIGs for Smartphones - unclassified httpiasedisamilstigsnet_perimeterwirelesssmartphonehtml iOS Hardening Configuration Guide Department of Defence Intelligence and Security Australian Government httpwwwdsdgovaupublicationsiOS_Hardening_Guidepdf Mac OS X and iOS Security httpdeveloperapplecomlibrarymacdocumentationSecurityConceptualSecurity_OverviewArchitectureArchitecturehtmlapple_refdocuidTP30000976-CH202-TPXREF101 Mobile Malware Why Fraudsters are Two Steps Ahead httpwwwtrusteercomblogmobile-malware-why-fraudsters-are-two-steps-ahead Rootkit called Carrier IQ discovered phoning home with user data httpwwwzdnetcomblogapplerootkit-called-carrier-iq-discovered-phoning-home-with-user-data11792 RIM launches Blackberry Fusion to Secure Android and Apple devices httpbusinessfinancialpostcom20111129rim-launching-blackberry-mobile-fusion-to-secure-iphone-android-devices Smartphone Security httpwwwenisaeuropaeuactapplication-securitysmartphone-security-1 The Spy Files Map httpwikileaksorgThe-Spyfiles-The-Maphtml Ten Steps to Secure Your Mobile Devices httpswikiinternet2educonfluencedisplayitsg2Mobile+Device+Security
Why Your Phone is Insecure by Design httpwwwforbescomsitesandygreenberg20110812codebreaker-karsten-nohl-why-your-phone-is-insecure-by-design
Managing the Benefits and Risks of Mobile Computing
25
About the Research Topics researched by the IT Policy Compliance Group (IT PCG) are part of an ongoing calendar established in consultation with Advisory General and Charter members of the Group as well as from findings compiled from ongoing research In addition to specific tracking questions common to each benchmark the research is designed to uncover the relationship between business results outcomes being experienced by organizations actions taken practices implemented and capabilities organizations use to respond
The qualitative research findings presented in this report are from numerous focus groups one-on-one interviews and meetings held with larger audiences throughout 2011 The quantitative findings contained in this report are from primary research studies conducted with 210 organizations in North America during late 2011
The maximum error for the sample findings for the benchmark findings contained in this report is +- seven percent The primary focus of analysis contained in this report is to present the largest differences between the outcomes experienced and similarly aligned findings that are most responsible for the differences in outcomes Instead of relying on differences that are within or close to the sample errors the effort has been to focus on the largest differences For example instead of focusing on differences involving +- 10 percent the findings covered in this report tend to focus on the largest differences in the range of 50 percent or more
The findings covering the use of Mobile computing are representative of organizations in North America and cannot be construed or inferred to represent current usage or plans for Mobile computing outside of North America However the findings covering the performance outcomes benefits and risks of Mobile computing the practices to manage the business risks and the controls to manage the risks match findings from similar studies covering other geographies outside of North America including findings from Latin America South America Europe Africa the Middle East Asia and Oceania
Industries represented The quantitative research includes representation from the following industries advertising accounting services aerospace agriculture apparel architecture automotive banking chemicals computer equipment and peripherals computer software and services construction consumer durable goods distribution education engineering services entertainment financial services food and beverage government (local state and federal level public administration) government (defense and intelligence) health medical and dental services insurance law enforcement management services media scientific and consulting services manufacturing pharmaceuticals public relations publishing real estate rental and leasing services retail trade telecommunications equipment telecommunication services transportation warehousing travel accommodation and hospitality services utilities waste management and wholesale trade Five industries represent 47 percent of the sample These include Banking Education Financial and Accounting Services Manufacturing and Retail Trade Another 27 industries represent the other 53 percent of the sample none of which represents more than five percent of the sample
Revenue or agency budgets of participating organizations Size of the organizations participating in the most recent benchmarks is somewhat evenly distributed although slightly fewer represent midsize organizations Thirty-six percent of the organizations represented by the findings have annual revenues or agency budgets that are less than $50 million Another twenty-nine percent of the sample has annual revenues or agency budgets between $50 million and $999 million The remaining thirty-five percent of the sample has annual revenues or agency budgets that are $1 billion or more
Functional areas of responsibility Thirty-five percent of the qualified participants for the benchmark work in IT with another 30 percent work in finance or internal controls The remaining 35 percent of the qualified participants work in a wide variety of functions from business line management senior management product design and development legal compliance sales marketing procurement logistics and customer services among other functions
Job titles of participants Thirty-five percent of the participants in the benchmark are senior managers with titles that include CEO CIO CFO or Vice president Thirty-eight percent are managers or directors and twenty-seven percent are staff in their organizations
Managing the Benefits and Risks of Mobile Computing
About IT Policy Compliance Group The mission of the IT Policy Compliance Group is to promote actionable findings based on evidence to assist organizations with delivering more value less risk and achieve IT policy and compliance objectives related to the use of information systems The Group Web site at wwwitpolicycompliancecom features quick two-minute self-assessments to compare outcomes and practices against onersquos industry peers and best performing organizations research reports continuing professional education conferences and seminars member and knowledge centers related research from around the World and resources including standards and frameworks associations government and regulators
The Grouprsquos research is designed to help IT risk legal financial and internal audit professionals to
Benchmark results and efforts against peers and best-in-class performers
Identify key drivers challenges and responses to improve results
Determine the applicability and use of specific capabilities to improve results
Identify best practices based on results and experience of peers
The Group relies upon its members and advisors for its research and editorial calendar
IT Policy Compliance Group Charter Members
The Institute of Symantec Corporation Internal Auditors ISACA 350 Ellis Street 247 Maitland Avenue 3701 Algonquin Road Suite 1010 Mountain View CA 94043 Altamonte Springs FL 32701 Rolling Meadows IL 60008 +1 (650) 527 8000 +1 (407) 937 1100 +1 (847) 253 1545 wwwsymanteccom wwwtheiiaorg wwwisacaorg infosymanteccom iiatheiiaorg infoisacaorg
Computer Security Institute Protiviti IT Governance Institute 600 Harrison Street New York Office 3701 Algonquin Road Suite 1010 San Francisco CA 94107 1290 Avenue of the Rolling Meadows IL 60008 +1 (415) 947 6320 Americas 5th Floor +1 (847) 660 5600 wwwgocsicom New York New York 10104 wwwitgiorg csicmpcom +1 (212) 603 8300 infoitgiorg wwwprotiviticom infoprotiviticom
IT Policy Compliance Group Affiliate Members and Advisors A current list of Affiliate Members and Advisors to the Group can be found on the IT Policy Compliance Group website
26
Founded in 2005 the IT Policy Compliance Group conducts benchmark research focused on delivering fact-based guidance on the steps that can be taken to improve results Benchmark results are reported through wwwitpolicycompliancecom for the benefit of members
IT Policy Compliance Group
Contacts Managing Director Jim Hurley Telephone +1 (216) 373 7010 jhurleyitpolicycompliancecom Managing Editor John Ortbal Telephone +1 (847) 444 0344 jortbalitpolicycompliancecom wwwitpolicycompliancecom
December 2011
The information contained in this publication has been obtained from sources that the IT Policy Compliance Group believes to be reliable but is not guaranteed Research publications reflect current conditions that are subject to change without notice
Copyright copy 2011 IT Policy Compliance Group Names and logos may be trademarks of their respective owners All rights reserved 1211 293167003
32
Managing the Benefits and Risks of Mobile Computing
21
The primary information and applications currently being used with mobile devices include
Email and collaborative applications
Office productivity applications
Sales force automation applications
The primary actions to take to limit business risks include
Limit the use of Smartphones in the workplace to specifically approved employees
Fewer than 50 percent of employees currently use Smartphonersquos among the best performers
Policies and practices to implement include
Have IT manage all Tablet computers and Smartphones
Allow approved employees to use their own Smartphones
Furnish Tablet computers to employees
Considerations to evaluate include
Mobile devices are another part of the requirements of your information security audits
Compare your due-care requirements to defend against legal inquiry
Identify your cross-border data privacy and ownership requirements
Practices to implement include
Limit the use of Smartphones to access information and applications to approved employees
Limit access to sensitive information and applications for mobile devices
Geo-track devices especially Smartphones
Prohibit the use of custom ROMs and unapproved App-marketssites
Deliver security awareness training and measure effectiveness with employees
Scan mobile devices with anti-virus and anti-malware
Protect and backup information on the devices
Wipe and lock stolen and lost devices as soon as notified by employees
Investigate the availability of patching as part of device evaluations
Use frequent controls and configuration testing to reduce gaps and limit risks
Increase spend on information security beyond your peers
Managing the Benefits and Risks of Mobile Computing
22
Appendix Expected Changes in Device Use in the Workplace 2011 to 2013 Respondents were asked to identify changes that are most likely going to occur in organizational and employee uses of Smartphones and Tablet computers between 2011 and 2013 As projections these forecasts of user and organizational expectations are reflections of current sentiment
The use of Smartphones by organizations is expected to remain the same between 2011 and 2013 at 79 percent of all organizations However the use of Smartphones to access information and applications by employees is expected to increase from 33 percent to 39 percent (Table 13)
Table 13 Device use 2011 to 2013
Device being used Use by organizationsemployees
2011 2013 Change in use
Organizational use 79 79 -0- Smartphones
Employee use 33 39 6 increase
Organizational use 35 49 14 increase Tablet computers
Employee use 22 32 10 increase
Source IT Policy Compliance Group 2011
Unlike Smartphones the use of Tablet computers is expected to increase for organizations and employees from an average rate of 35 percent to 49 percent for organizations and from 22 to 32 for employees The increases are larger than the sample error of seven percent
After an increase in employees using both devices what is rather intriguing is an expected downtrend in the use of Smartphones among organizations with the best outcomes The decline in the use of Smartphones among best performers is expected to be from 85 percent to 73 percent mdash a decrease of 12 percent mdash from 2011 to 2013 (Figure 16)
Figure 16 Expected changes in device use
Source IT Policy Compliance Group 2011
The explanation for the overall rate of decline of Smartphone use among best performing organization can be found from declines in the uses of iPhone and Windows Phone platforms and much more significant declines in the use of Android and Blackberry phones
At the time the research was being carried out RIM was suffering from blackouts in its services around the World with rolling service-outages that occurred across multiple continents during a one-week period The general consensus of many people we spoke with at the time was the service-outages ldquoare the final event I need to make the switch when my subscription period is duerdquo On the other hand others simply replaced their Blackberry devices that week and did not wait until their subscription was due for renewal
Unlike the RIM Blackberry platforms we found consistently strong disaffection with Android devices due to the inability to obtain updates for the Android operating system without having to root devices and hope for the best using custom ROMs
Managing the Benefits and Risks of Mobile Computing
23
These problems left many saying things like ldquoI bought a pig in a poke never againrdquo Others took matters into their own hands rooted their phones and installed updated versions of Android over the Internet from a number of different development sites none of which were blessed by carriers phone manufacturers or their IT staff
IT managers the Group spoke with identified an utter lack of management tools for Android devices too many versions of Android and a complete lack of vulnerability testing for the devices The inability to update and cure security-problems were just some of the problems identified by IT managers the Group spoke with The upshot for many were two common reactions to the use of Android in the enterprise 1) if it was already deployed the common reaction was to pull back support for Android and convert to other supported Smartphones and 2) if Android was not already deployed wait for Android to become enterprise-ready (Table 14)
Table 14 Reaction to Android phones in the workplace
Status of Android Smartphones
Reaction
Already deployed Pull-back and convert to other Smartphones
If not already deployed Wait for Android to become enterprise-ready
Source IT Policy Compliance Group 2011
When it comes to Tablet computers the sentiment about expected changes in use of different platforms reveals Android Tablet computers likely to see the biggest gains between now and 2013 followed by healthy gains in the use of other Tablet computers The only sentiment indicating significant declines appear to be related to Android and Blackberry Smartphones (Figure 17)
Figure 17 Expected changes in platform use
Source IT Policy Compliance Group 2011
The outlook of current sentiment regarding use of different platforms by 2013 clearly indicates the best performers are predisposed to ditch Android and Blackberry phones and significantly increase the use of iPad Tablet computers
By contrast the worst performers are predisposed to increase use of Smartphones and Tablet computers across the board and with the exception of Blackberry phones increase other mobile device platforms among average performers
Managing the Benefits and Risks of Mobile Computing
24
Additional Resources Numerous sources of related information are available for those interested in pursuing more information on a wide range of topics related to Smartphones and Tablet computers The following are but a small sample of related information perspectives and insight The authors of these articles have no relationship with the ITPCG Android Security See httpdeveloperandroidcomguidetopicssecuritysecurityhtml Android Orphans Visualizing a Sad History of Support See httptheunderstatementcompost11982112928android-orphans-visualizing-a-sad-history-of-support A Look into Mobile Device Security httpwwwsymanteccomcontentenusaboutmediapdfssymc_mobile_device_security_june2011pdfom_ext_cid=biz_socmed_twitter_facebook_marketwire_linkedin_2011Jun_worldwide_mobilesecuritywp Carrier IQ what it is what it isnrsquot and what you need to do httpwwwengadgetcom20111201carrier-iq-what-it-is-what-it-isnt-and-what-you-need-to CIS Apple iOS configuration benchmarks httpbenchmarkscisecurityorgen-usroute=downloadsbrowsecategorybenchmarksmobileiphone Current Android Malware httpforensicsspreitzenbarthdepage_id=254 DISA STIGs for Smartphones - unclassified httpiasedisamilstigsnet_perimeterwirelesssmartphonehtml iOS Hardening Configuration Guide Department of Defence Intelligence and Security Australian Government httpwwwdsdgovaupublicationsiOS_Hardening_Guidepdf Mac OS X and iOS Security httpdeveloperapplecomlibrarymacdocumentationSecurityConceptualSecurity_OverviewArchitectureArchitecturehtmlapple_refdocuidTP30000976-CH202-TPXREF101 Mobile Malware Why Fraudsters are Two Steps Ahead httpwwwtrusteercomblogmobile-malware-why-fraudsters-are-two-steps-ahead Rootkit called Carrier IQ discovered phoning home with user data httpwwwzdnetcomblogapplerootkit-called-carrier-iq-discovered-phoning-home-with-user-data11792 RIM launches Blackberry Fusion to Secure Android and Apple devices httpbusinessfinancialpostcom20111129rim-launching-blackberry-mobile-fusion-to-secure-iphone-android-devices Smartphone Security httpwwwenisaeuropaeuactapplication-securitysmartphone-security-1 The Spy Files Map httpwikileaksorgThe-Spyfiles-The-Maphtml Ten Steps to Secure Your Mobile Devices httpswikiinternet2educonfluencedisplayitsg2Mobile+Device+Security
Why Your Phone is Insecure by Design httpwwwforbescomsitesandygreenberg20110812codebreaker-karsten-nohl-why-your-phone-is-insecure-by-design
Managing the Benefits and Risks of Mobile Computing
25
About the Research Topics researched by the IT Policy Compliance Group (IT PCG) are part of an ongoing calendar established in consultation with Advisory General and Charter members of the Group as well as from findings compiled from ongoing research In addition to specific tracking questions common to each benchmark the research is designed to uncover the relationship between business results outcomes being experienced by organizations actions taken practices implemented and capabilities organizations use to respond
The qualitative research findings presented in this report are from numerous focus groups one-on-one interviews and meetings held with larger audiences throughout 2011 The quantitative findings contained in this report are from primary research studies conducted with 210 organizations in North America during late 2011
The maximum error for the sample findings for the benchmark findings contained in this report is +- seven percent The primary focus of analysis contained in this report is to present the largest differences between the outcomes experienced and similarly aligned findings that are most responsible for the differences in outcomes Instead of relying on differences that are within or close to the sample errors the effort has been to focus on the largest differences For example instead of focusing on differences involving +- 10 percent the findings covered in this report tend to focus on the largest differences in the range of 50 percent or more
The findings covering the use of Mobile computing are representative of organizations in North America and cannot be construed or inferred to represent current usage or plans for Mobile computing outside of North America However the findings covering the performance outcomes benefits and risks of Mobile computing the practices to manage the business risks and the controls to manage the risks match findings from similar studies covering other geographies outside of North America including findings from Latin America South America Europe Africa the Middle East Asia and Oceania
Industries represented The quantitative research includes representation from the following industries advertising accounting services aerospace agriculture apparel architecture automotive banking chemicals computer equipment and peripherals computer software and services construction consumer durable goods distribution education engineering services entertainment financial services food and beverage government (local state and federal level public administration) government (defense and intelligence) health medical and dental services insurance law enforcement management services media scientific and consulting services manufacturing pharmaceuticals public relations publishing real estate rental and leasing services retail trade telecommunications equipment telecommunication services transportation warehousing travel accommodation and hospitality services utilities waste management and wholesale trade Five industries represent 47 percent of the sample These include Banking Education Financial and Accounting Services Manufacturing and Retail Trade Another 27 industries represent the other 53 percent of the sample none of which represents more than five percent of the sample
Revenue or agency budgets of participating organizations Size of the organizations participating in the most recent benchmarks is somewhat evenly distributed although slightly fewer represent midsize organizations Thirty-six percent of the organizations represented by the findings have annual revenues or agency budgets that are less than $50 million Another twenty-nine percent of the sample has annual revenues or agency budgets between $50 million and $999 million The remaining thirty-five percent of the sample has annual revenues or agency budgets that are $1 billion or more
Functional areas of responsibility Thirty-five percent of the qualified participants for the benchmark work in IT with another 30 percent work in finance or internal controls The remaining 35 percent of the qualified participants work in a wide variety of functions from business line management senior management product design and development legal compliance sales marketing procurement logistics and customer services among other functions
Job titles of participants Thirty-five percent of the participants in the benchmark are senior managers with titles that include CEO CIO CFO or Vice president Thirty-eight percent are managers or directors and twenty-seven percent are staff in their organizations
Managing the Benefits and Risks of Mobile Computing
About IT Policy Compliance Group The mission of the IT Policy Compliance Group is to promote actionable findings based on evidence to assist organizations with delivering more value less risk and achieve IT policy and compliance objectives related to the use of information systems The Group Web site at wwwitpolicycompliancecom features quick two-minute self-assessments to compare outcomes and practices against onersquos industry peers and best performing organizations research reports continuing professional education conferences and seminars member and knowledge centers related research from around the World and resources including standards and frameworks associations government and regulators
The Grouprsquos research is designed to help IT risk legal financial and internal audit professionals to
Benchmark results and efforts against peers and best-in-class performers
Identify key drivers challenges and responses to improve results
Determine the applicability and use of specific capabilities to improve results
Identify best practices based on results and experience of peers
The Group relies upon its members and advisors for its research and editorial calendar
IT Policy Compliance Group Charter Members
The Institute of Symantec Corporation Internal Auditors ISACA 350 Ellis Street 247 Maitland Avenue 3701 Algonquin Road Suite 1010 Mountain View CA 94043 Altamonte Springs FL 32701 Rolling Meadows IL 60008 +1 (650) 527 8000 +1 (407) 937 1100 +1 (847) 253 1545 wwwsymanteccom wwwtheiiaorg wwwisacaorg infosymanteccom iiatheiiaorg infoisacaorg
Computer Security Institute Protiviti IT Governance Institute 600 Harrison Street New York Office 3701 Algonquin Road Suite 1010 San Francisco CA 94107 1290 Avenue of the Rolling Meadows IL 60008 +1 (415) 947 6320 Americas 5th Floor +1 (847) 660 5600 wwwgocsicom New York New York 10104 wwwitgiorg csicmpcom +1 (212) 603 8300 infoitgiorg wwwprotiviticom infoprotiviticom
IT Policy Compliance Group Affiliate Members and Advisors A current list of Affiliate Members and Advisors to the Group can be found on the IT Policy Compliance Group website
26
Founded in 2005 the IT Policy Compliance Group conducts benchmark research focused on delivering fact-based guidance on the steps that can be taken to improve results Benchmark results are reported through wwwitpolicycompliancecom for the benefit of members
IT Policy Compliance Group
Contacts Managing Director Jim Hurley Telephone +1 (216) 373 7010 jhurleyitpolicycompliancecom Managing Editor John Ortbal Telephone +1 (847) 444 0344 jortbalitpolicycompliancecom wwwitpolicycompliancecom
December 2011
The information contained in this publication has been obtained from sources that the IT Policy Compliance Group believes to be reliable but is not guaranteed Research publications reflect current conditions that are subject to change without notice
Copyright copy 2011 IT Policy Compliance Group Names and logos may be trademarks of their respective owners All rights reserved 1211 293167003
32
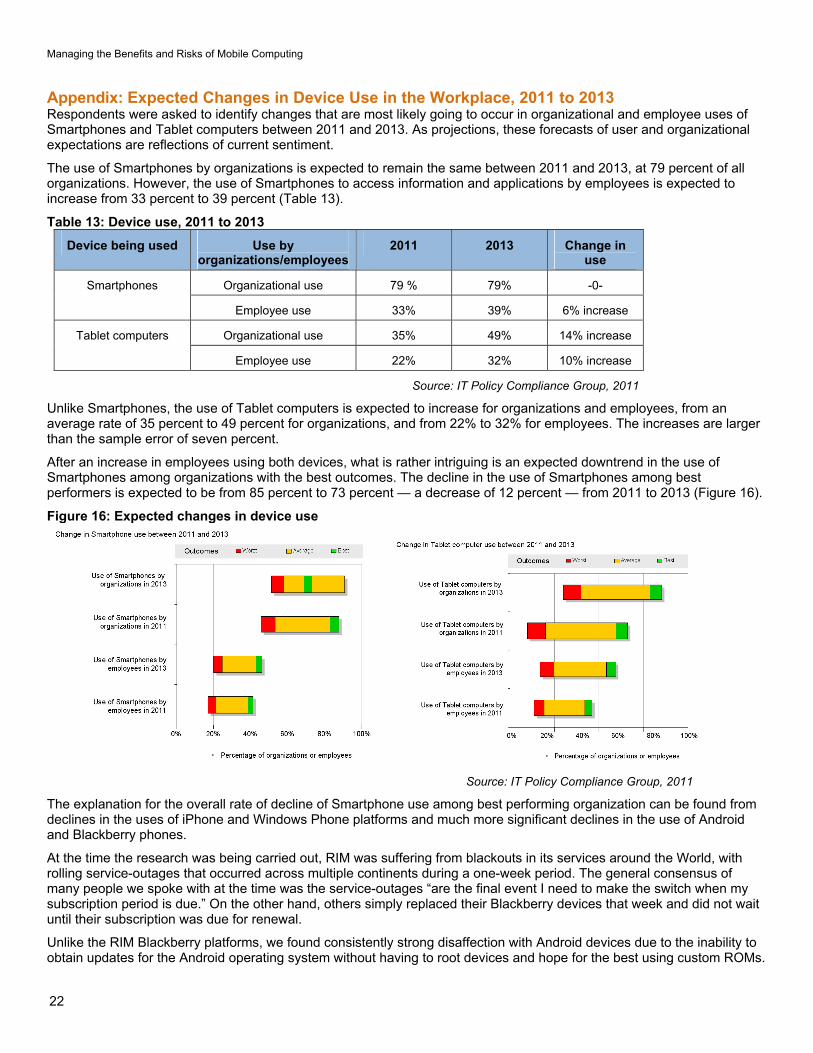
Managing the Benefits and Risks of Mobile Computing
22
Appendix Expected Changes in Device Use in the Workplace 2011 to 2013 Respondents were asked to identify changes that are most likely going to occur in organizational and employee uses of Smartphones and Tablet computers between 2011 and 2013 As projections these forecasts of user and organizational expectations are reflections of current sentiment
The use of Smartphones by organizations is expected to remain the same between 2011 and 2013 at 79 percent of all organizations However the use of Smartphones to access information and applications by employees is expected to increase from 33 percent to 39 percent (Table 13)
Table 13 Device use 2011 to 2013
Device being used Use by organizationsemployees
2011 2013 Change in use
Organizational use 79 79 -0- Smartphones
Employee use 33 39 6 increase
Organizational use 35 49 14 increase Tablet computers
Employee use 22 32 10 increase
Source IT Policy Compliance Group 2011
Unlike Smartphones the use of Tablet computers is expected to increase for organizations and employees from an average rate of 35 percent to 49 percent for organizations and from 22 to 32 for employees The increases are larger than the sample error of seven percent
After an increase in employees using both devices what is rather intriguing is an expected downtrend in the use of Smartphones among organizations with the best outcomes The decline in the use of Smartphones among best performers is expected to be from 85 percent to 73 percent mdash a decrease of 12 percent mdash from 2011 to 2013 (Figure 16)
Figure 16 Expected changes in device use
Source IT Policy Compliance Group 2011
The explanation for the overall rate of decline of Smartphone use among best performing organization can be found from declines in the uses of iPhone and Windows Phone platforms and much more significant declines in the use of Android and Blackberry phones
At the time the research was being carried out RIM was suffering from blackouts in its services around the World with rolling service-outages that occurred across multiple continents during a one-week period The general consensus of many people we spoke with at the time was the service-outages ldquoare the final event I need to make the switch when my subscription period is duerdquo On the other hand others simply replaced their Blackberry devices that week and did not wait until their subscription was due for renewal
Unlike the RIM Blackberry platforms we found consistently strong disaffection with Android devices due to the inability to obtain updates for the Android operating system without having to root devices and hope for the best using custom ROMs
Managing the Benefits and Risks of Mobile Computing
23
These problems left many saying things like ldquoI bought a pig in a poke never againrdquo Others took matters into their own hands rooted their phones and installed updated versions of Android over the Internet from a number of different development sites none of which were blessed by carriers phone manufacturers or their IT staff
IT managers the Group spoke with identified an utter lack of management tools for Android devices too many versions of Android and a complete lack of vulnerability testing for the devices The inability to update and cure security-problems were just some of the problems identified by IT managers the Group spoke with The upshot for many were two common reactions to the use of Android in the enterprise 1) if it was already deployed the common reaction was to pull back support for Android and convert to other supported Smartphones and 2) if Android was not already deployed wait for Android to become enterprise-ready (Table 14)
Table 14 Reaction to Android phones in the workplace
Status of Android Smartphones
Reaction
Already deployed Pull-back and convert to other Smartphones
If not already deployed Wait for Android to become enterprise-ready
Source IT Policy Compliance Group 2011
When it comes to Tablet computers the sentiment about expected changes in use of different platforms reveals Android Tablet computers likely to see the biggest gains between now and 2013 followed by healthy gains in the use of other Tablet computers The only sentiment indicating significant declines appear to be related to Android and Blackberry Smartphones (Figure 17)
Figure 17 Expected changes in platform use
Source IT Policy Compliance Group 2011
The outlook of current sentiment regarding use of different platforms by 2013 clearly indicates the best performers are predisposed to ditch Android and Blackberry phones and significantly increase the use of iPad Tablet computers
By contrast the worst performers are predisposed to increase use of Smartphones and Tablet computers across the board and with the exception of Blackberry phones increase other mobile device platforms among average performers
Managing the Benefits and Risks of Mobile Computing
24
Additional Resources Numerous sources of related information are available for those interested in pursuing more information on a wide range of topics related to Smartphones and Tablet computers The following are but a small sample of related information perspectives and insight The authors of these articles have no relationship with the ITPCG Android Security See httpdeveloperandroidcomguidetopicssecuritysecurityhtml Android Orphans Visualizing a Sad History of Support See httptheunderstatementcompost11982112928android-orphans-visualizing-a-sad-history-of-support A Look into Mobile Device Security httpwwwsymanteccomcontentenusaboutmediapdfssymc_mobile_device_security_june2011pdfom_ext_cid=biz_socmed_twitter_facebook_marketwire_linkedin_2011Jun_worldwide_mobilesecuritywp Carrier IQ what it is what it isnrsquot and what you need to do httpwwwengadgetcom20111201carrier-iq-what-it-is-what-it-isnt-and-what-you-need-to CIS Apple iOS configuration benchmarks httpbenchmarkscisecurityorgen-usroute=downloadsbrowsecategorybenchmarksmobileiphone Current Android Malware httpforensicsspreitzenbarthdepage_id=254 DISA STIGs for Smartphones - unclassified httpiasedisamilstigsnet_perimeterwirelesssmartphonehtml iOS Hardening Configuration Guide Department of Defence Intelligence and Security Australian Government httpwwwdsdgovaupublicationsiOS_Hardening_Guidepdf Mac OS X and iOS Security httpdeveloperapplecomlibrarymacdocumentationSecurityConceptualSecurity_OverviewArchitectureArchitecturehtmlapple_refdocuidTP30000976-CH202-TPXREF101 Mobile Malware Why Fraudsters are Two Steps Ahead httpwwwtrusteercomblogmobile-malware-why-fraudsters-are-two-steps-ahead Rootkit called Carrier IQ discovered phoning home with user data httpwwwzdnetcomblogapplerootkit-called-carrier-iq-discovered-phoning-home-with-user-data11792 RIM launches Blackberry Fusion to Secure Android and Apple devices httpbusinessfinancialpostcom20111129rim-launching-blackberry-mobile-fusion-to-secure-iphone-android-devices Smartphone Security httpwwwenisaeuropaeuactapplication-securitysmartphone-security-1 The Spy Files Map httpwikileaksorgThe-Spyfiles-The-Maphtml Ten Steps to Secure Your Mobile Devices httpswikiinternet2educonfluencedisplayitsg2Mobile+Device+Security
Why Your Phone is Insecure by Design httpwwwforbescomsitesandygreenberg20110812codebreaker-karsten-nohl-why-your-phone-is-insecure-by-design
Managing the Benefits and Risks of Mobile Computing
25
About the Research Topics researched by the IT Policy Compliance Group (IT PCG) are part of an ongoing calendar established in consultation with Advisory General and Charter members of the Group as well as from findings compiled from ongoing research In addition to specific tracking questions common to each benchmark the research is designed to uncover the relationship between business results outcomes being experienced by organizations actions taken practices implemented and capabilities organizations use to respond
The qualitative research findings presented in this report are from numerous focus groups one-on-one interviews and meetings held with larger audiences throughout 2011 The quantitative findings contained in this report are from primary research studies conducted with 210 organizations in North America during late 2011
The maximum error for the sample findings for the benchmark findings contained in this report is +- seven percent The primary focus of analysis contained in this report is to present the largest differences between the outcomes experienced and similarly aligned findings that are most responsible for the differences in outcomes Instead of relying on differences that are within or close to the sample errors the effort has been to focus on the largest differences For example instead of focusing on differences involving +- 10 percent the findings covered in this report tend to focus on the largest differences in the range of 50 percent or more
The findings covering the use of Mobile computing are representative of organizations in North America and cannot be construed or inferred to represent current usage or plans for Mobile computing outside of North America However the findings covering the performance outcomes benefits and risks of Mobile computing the practices to manage the business risks and the controls to manage the risks match findings from similar studies covering other geographies outside of North America including findings from Latin America South America Europe Africa the Middle East Asia and Oceania
Industries represented The quantitative research includes representation from the following industries advertising accounting services aerospace agriculture apparel architecture automotive banking chemicals computer equipment and peripherals computer software and services construction consumer durable goods distribution education engineering services entertainment financial services food and beverage government (local state and federal level public administration) government (defense and intelligence) health medical and dental services insurance law enforcement management services media scientific and consulting services manufacturing pharmaceuticals public relations publishing real estate rental and leasing services retail trade telecommunications equipment telecommunication services transportation warehousing travel accommodation and hospitality services utilities waste management and wholesale trade Five industries represent 47 percent of the sample These include Banking Education Financial and Accounting Services Manufacturing and Retail Trade Another 27 industries represent the other 53 percent of the sample none of which represents more than five percent of the sample
Revenue or agency budgets of participating organizations Size of the organizations participating in the most recent benchmarks is somewhat evenly distributed although slightly fewer represent midsize organizations Thirty-six percent of the organizations represented by the findings have annual revenues or agency budgets that are less than $50 million Another twenty-nine percent of the sample has annual revenues or agency budgets between $50 million and $999 million The remaining thirty-five percent of the sample has annual revenues or agency budgets that are $1 billion or more
Functional areas of responsibility Thirty-five percent of the qualified participants for the benchmark work in IT with another 30 percent work in finance or internal controls The remaining 35 percent of the qualified participants work in a wide variety of functions from business line management senior management product design and development legal compliance sales marketing procurement logistics and customer services among other functions
Job titles of participants Thirty-five percent of the participants in the benchmark are senior managers with titles that include CEO CIO CFO or Vice president Thirty-eight percent are managers or directors and twenty-seven percent are staff in their organizations
Managing the Benefits and Risks of Mobile Computing
About IT Policy Compliance Group The mission of the IT Policy Compliance Group is to promote actionable findings based on evidence to assist organizations with delivering more value less risk and achieve IT policy and compliance objectives related to the use of information systems The Group Web site at wwwitpolicycompliancecom features quick two-minute self-assessments to compare outcomes and practices against onersquos industry peers and best performing organizations research reports continuing professional education conferences and seminars member and knowledge centers related research from around the World and resources including standards and frameworks associations government and regulators
The Grouprsquos research is designed to help IT risk legal financial and internal audit professionals to
Benchmark results and efforts against peers and best-in-class performers
Identify key drivers challenges and responses to improve results
Determine the applicability and use of specific capabilities to improve results
Identify best practices based on results and experience of peers
The Group relies upon its members and advisors for its research and editorial calendar
IT Policy Compliance Group Charter Members
The Institute of Symantec Corporation Internal Auditors ISACA 350 Ellis Street 247 Maitland Avenue 3701 Algonquin Road Suite 1010 Mountain View CA 94043 Altamonte Springs FL 32701 Rolling Meadows IL 60008 +1 (650) 527 8000 +1 (407) 937 1100 +1 (847) 253 1545 wwwsymanteccom wwwtheiiaorg wwwisacaorg infosymanteccom iiatheiiaorg infoisacaorg
Computer Security Institute Protiviti IT Governance Institute 600 Harrison Street New York Office 3701 Algonquin Road Suite 1010 San Francisco CA 94107 1290 Avenue of the Rolling Meadows IL 60008 +1 (415) 947 6320 Americas 5th Floor +1 (847) 660 5600 wwwgocsicom New York New York 10104 wwwitgiorg csicmpcom +1 (212) 603 8300 infoitgiorg wwwprotiviticom infoprotiviticom
IT Policy Compliance Group Affiliate Members and Advisors A current list of Affiliate Members and Advisors to the Group can be found on the IT Policy Compliance Group website
26
Founded in 2005 the IT Policy Compliance Group conducts benchmark research focused on delivering fact-based guidance on the steps that can be taken to improve results Benchmark results are reported through wwwitpolicycompliancecom for the benefit of members
IT Policy Compliance Group
Contacts Managing Director Jim Hurley Telephone +1 (216) 373 7010 jhurleyitpolicycompliancecom Managing Editor John Ortbal Telephone +1 (847) 444 0344 jortbalitpolicycompliancecom wwwitpolicycompliancecom
December 2011
The information contained in this publication has been obtained from sources that the IT Policy Compliance Group believes to be reliable but is not guaranteed Research publications reflect current conditions that are subject to change without notice
Copyright copy 2011 IT Policy Compliance Group Names and logos may be trademarks of their respective owners All rights reserved 1211 293167003
32
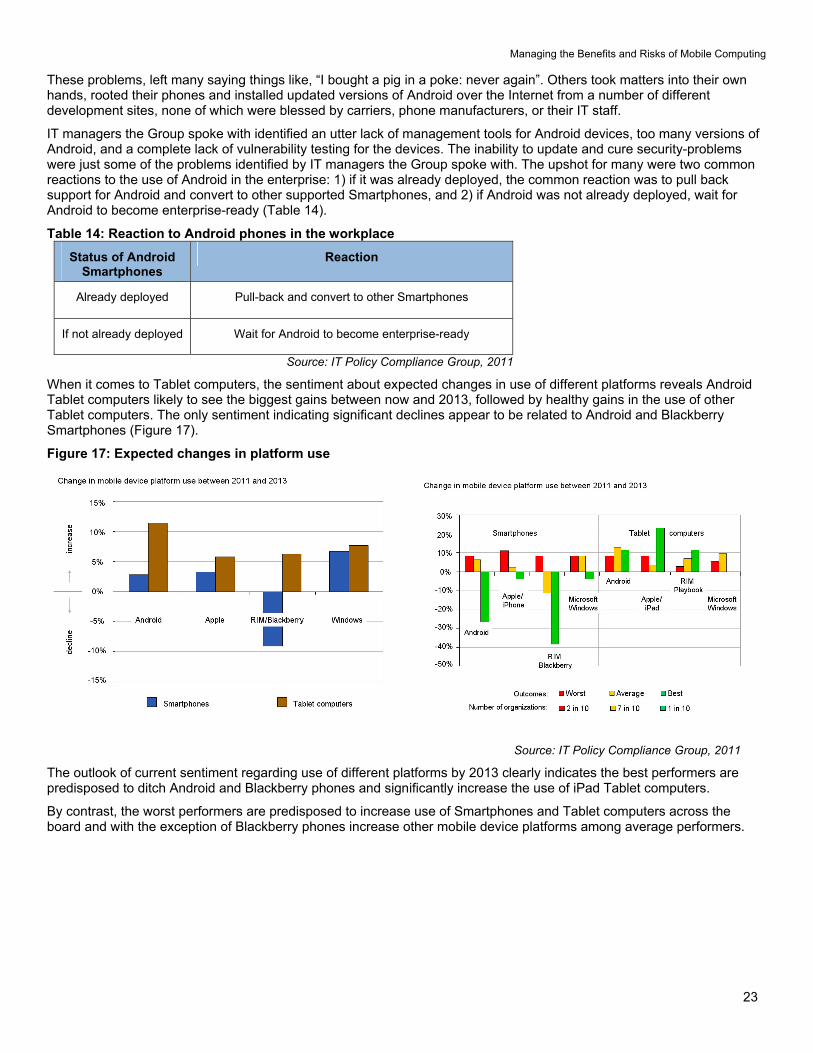
Managing the Benefits and Risks of Mobile Computing
23
These problems left many saying things like ldquoI bought a pig in a poke never againrdquo Others took matters into their own hands rooted their phones and installed updated versions of Android over the Internet from a number of different development sites none of which were blessed by carriers phone manufacturers or their IT staff
IT managers the Group spoke with identified an utter lack of management tools for Android devices too many versions of Android and a complete lack of vulnerability testing for the devices The inability to update and cure security-problems were just some of the problems identified by IT managers the Group spoke with The upshot for many were two common reactions to the use of Android in the enterprise 1) if it was already deployed the common reaction was to pull back support for Android and convert to other supported Smartphones and 2) if Android was not already deployed wait for Android to become enterprise-ready (Table 14)
Table 14 Reaction to Android phones in the workplace
Status of Android Smartphones
Reaction
Already deployed Pull-back and convert to other Smartphones
If not already deployed Wait for Android to become enterprise-ready
Source IT Policy Compliance Group 2011
When it comes to Tablet computers the sentiment about expected changes in use of different platforms reveals Android Tablet computers likely to see the biggest gains between now and 2013 followed by healthy gains in the use of other Tablet computers The only sentiment indicating significant declines appear to be related to Android and Blackberry Smartphones (Figure 17)
Figure 17 Expected changes in platform use
Source IT Policy Compliance Group 2011
The outlook of current sentiment regarding use of different platforms by 2013 clearly indicates the best performers are predisposed to ditch Android and Blackberry phones and significantly increase the use of iPad Tablet computers
By contrast the worst performers are predisposed to increase use of Smartphones and Tablet computers across the board and with the exception of Blackberry phones increase other mobile device platforms among average performers
Managing the Benefits and Risks of Mobile Computing
24
Additional Resources Numerous sources of related information are available for those interested in pursuing more information on a wide range of topics related to Smartphones and Tablet computers The following are but a small sample of related information perspectives and insight The authors of these articles have no relationship with the ITPCG Android Security See httpdeveloperandroidcomguidetopicssecuritysecurityhtml Android Orphans Visualizing a Sad History of Support See httptheunderstatementcompost11982112928android-orphans-visualizing-a-sad-history-of-support A Look into Mobile Device Security httpwwwsymanteccomcontentenusaboutmediapdfssymc_mobile_device_security_june2011pdfom_ext_cid=biz_socmed_twitter_facebook_marketwire_linkedin_2011Jun_worldwide_mobilesecuritywp Carrier IQ what it is what it isnrsquot and what you need to do httpwwwengadgetcom20111201carrier-iq-what-it-is-what-it-isnt-and-what-you-need-to CIS Apple iOS configuration benchmarks httpbenchmarkscisecurityorgen-usroute=downloadsbrowsecategorybenchmarksmobileiphone Current Android Malware httpforensicsspreitzenbarthdepage_id=254 DISA STIGs for Smartphones - unclassified httpiasedisamilstigsnet_perimeterwirelesssmartphonehtml iOS Hardening Configuration Guide Department of Defence Intelligence and Security Australian Government httpwwwdsdgovaupublicationsiOS_Hardening_Guidepdf Mac OS X and iOS Security httpdeveloperapplecomlibrarymacdocumentationSecurityConceptualSecurity_OverviewArchitectureArchitecturehtmlapple_refdocuidTP30000976-CH202-TPXREF101 Mobile Malware Why Fraudsters are Two Steps Ahead httpwwwtrusteercomblogmobile-malware-why-fraudsters-are-two-steps-ahead Rootkit called Carrier IQ discovered phoning home with user data httpwwwzdnetcomblogapplerootkit-called-carrier-iq-discovered-phoning-home-with-user-data11792 RIM launches Blackberry Fusion to Secure Android and Apple devices httpbusinessfinancialpostcom20111129rim-launching-blackberry-mobile-fusion-to-secure-iphone-android-devices Smartphone Security httpwwwenisaeuropaeuactapplication-securitysmartphone-security-1 The Spy Files Map httpwikileaksorgThe-Spyfiles-The-Maphtml Ten Steps to Secure Your Mobile Devices httpswikiinternet2educonfluencedisplayitsg2Mobile+Device+Security
Why Your Phone is Insecure by Design httpwwwforbescomsitesandygreenberg20110812codebreaker-karsten-nohl-why-your-phone-is-insecure-by-design
Managing the Benefits and Risks of Mobile Computing
25
About the Research Topics researched by the IT Policy Compliance Group (IT PCG) are part of an ongoing calendar established in consultation with Advisory General and Charter members of the Group as well as from findings compiled from ongoing research In addition to specific tracking questions common to each benchmark the research is designed to uncover the relationship between business results outcomes being experienced by organizations actions taken practices implemented and capabilities organizations use to respond
The qualitative research findings presented in this report are from numerous focus groups one-on-one interviews and meetings held with larger audiences throughout 2011 The quantitative findings contained in this report are from primary research studies conducted with 210 organizations in North America during late 2011
The maximum error for the sample findings for the benchmark findings contained in this report is +- seven percent The primary focus of analysis contained in this report is to present the largest differences between the outcomes experienced and similarly aligned findings that are most responsible for the differences in outcomes Instead of relying on differences that are within or close to the sample errors the effort has been to focus on the largest differences For example instead of focusing on differences involving +- 10 percent the findings covered in this report tend to focus on the largest differences in the range of 50 percent or more
The findings covering the use of Mobile computing are representative of organizations in North America and cannot be construed or inferred to represent current usage or plans for Mobile computing outside of North America However the findings covering the performance outcomes benefits and risks of Mobile computing the practices to manage the business risks and the controls to manage the risks match findings from similar studies covering other geographies outside of North America including findings from Latin America South America Europe Africa the Middle East Asia and Oceania
Industries represented The quantitative research includes representation from the following industries advertising accounting services aerospace agriculture apparel architecture automotive banking chemicals computer equipment and peripherals computer software and services construction consumer durable goods distribution education engineering services entertainment financial services food and beverage government (local state and federal level public administration) government (defense and intelligence) health medical and dental services insurance law enforcement management services media scientific and consulting services manufacturing pharmaceuticals public relations publishing real estate rental and leasing services retail trade telecommunications equipment telecommunication services transportation warehousing travel accommodation and hospitality services utilities waste management and wholesale trade Five industries represent 47 percent of the sample These include Banking Education Financial and Accounting Services Manufacturing and Retail Trade Another 27 industries represent the other 53 percent of the sample none of which represents more than five percent of the sample
Revenue or agency budgets of participating organizations Size of the organizations participating in the most recent benchmarks is somewhat evenly distributed although slightly fewer represent midsize organizations Thirty-six percent of the organizations represented by the findings have annual revenues or agency budgets that are less than $50 million Another twenty-nine percent of the sample has annual revenues or agency budgets between $50 million and $999 million The remaining thirty-five percent of the sample has annual revenues or agency budgets that are $1 billion or more
Functional areas of responsibility Thirty-five percent of the qualified participants for the benchmark work in IT with another 30 percent work in finance or internal controls The remaining 35 percent of the qualified participants work in a wide variety of functions from business line management senior management product design and development legal compliance sales marketing procurement logistics and customer services among other functions
Job titles of participants Thirty-five percent of the participants in the benchmark are senior managers with titles that include CEO CIO CFO or Vice president Thirty-eight percent are managers or directors and twenty-seven percent are staff in their organizations
Managing the Benefits and Risks of Mobile Computing
About IT Policy Compliance Group The mission of the IT Policy Compliance Group is to promote actionable findings based on evidence to assist organizations with delivering more value less risk and achieve IT policy and compliance objectives related to the use of information systems The Group Web site at wwwitpolicycompliancecom features quick two-minute self-assessments to compare outcomes and practices against onersquos industry peers and best performing organizations research reports continuing professional education conferences and seminars member and knowledge centers related research from around the World and resources including standards and frameworks associations government and regulators
The Grouprsquos research is designed to help IT risk legal financial and internal audit professionals to
Benchmark results and efforts against peers and best-in-class performers
Identify key drivers challenges and responses to improve results
Determine the applicability and use of specific capabilities to improve results
Identify best practices based on results and experience of peers
The Group relies upon its members and advisors for its research and editorial calendar
IT Policy Compliance Group Charter Members
The Institute of Symantec Corporation Internal Auditors ISACA 350 Ellis Street 247 Maitland Avenue 3701 Algonquin Road Suite 1010 Mountain View CA 94043 Altamonte Springs FL 32701 Rolling Meadows IL 60008 +1 (650) 527 8000 +1 (407) 937 1100 +1 (847) 253 1545 wwwsymanteccom wwwtheiiaorg wwwisacaorg infosymanteccom iiatheiiaorg infoisacaorg
Computer Security Institute Protiviti IT Governance Institute 600 Harrison Street New York Office 3701 Algonquin Road Suite 1010 San Francisco CA 94107 1290 Avenue of the Rolling Meadows IL 60008 +1 (415) 947 6320 Americas 5th Floor +1 (847) 660 5600 wwwgocsicom New York New York 10104 wwwitgiorg csicmpcom +1 (212) 603 8300 infoitgiorg wwwprotiviticom infoprotiviticom
IT Policy Compliance Group Affiliate Members and Advisors A current list of Affiliate Members and Advisors to the Group can be found on the IT Policy Compliance Group website
26
Founded in 2005 the IT Policy Compliance Group conducts benchmark research focused on delivering fact-based guidance on the steps that can be taken to improve results Benchmark results are reported through wwwitpolicycompliancecom for the benefit of members
IT Policy Compliance Group
Contacts Managing Director Jim Hurley Telephone +1 (216) 373 7010 jhurleyitpolicycompliancecom Managing Editor John Ortbal Telephone +1 (847) 444 0344 jortbalitpolicycompliancecom wwwitpolicycompliancecom
December 2011
The information contained in this publication has been obtained from sources that the IT Policy Compliance Group believes to be reliable but is not guaranteed Research publications reflect current conditions that are subject to change without notice
Copyright copy 2011 IT Policy Compliance Group Names and logos may be trademarks of their respective owners All rights reserved 1211 293167003
32
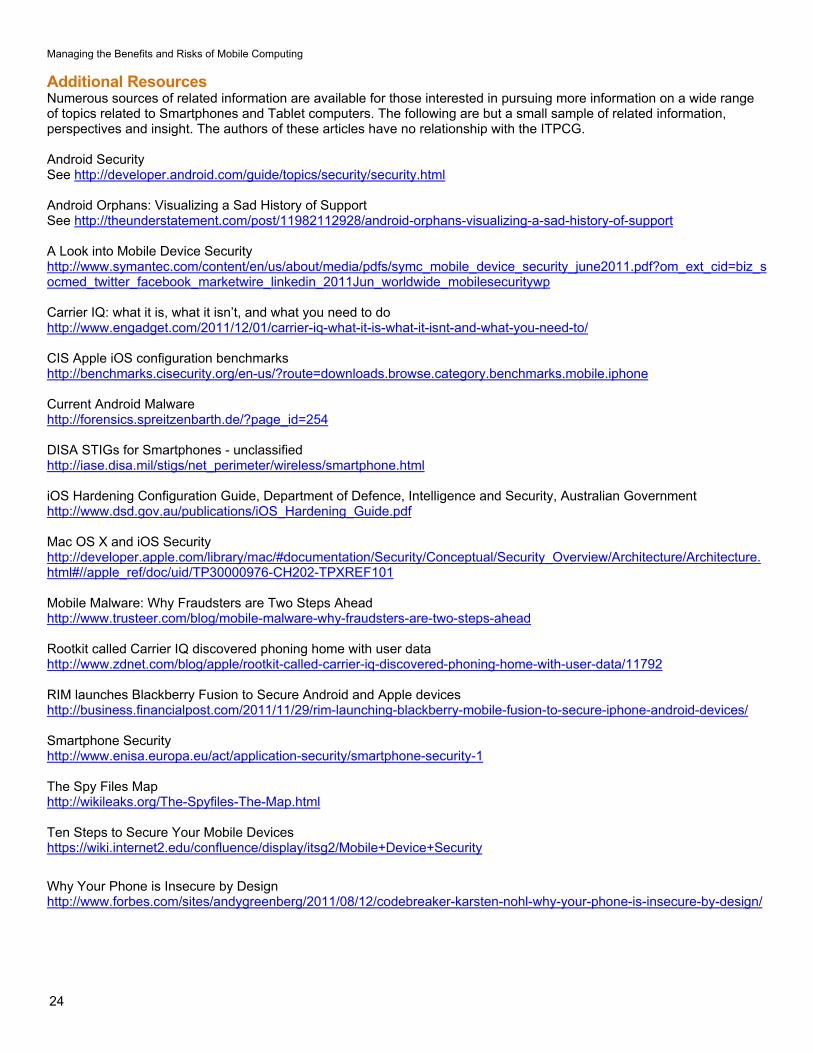
Managing the Benefits and Risks of Mobile Computing
24
Additional Resources Numerous sources of related information are available for those interested in pursuing more information on a wide range of topics related to Smartphones and Tablet computers The following are but a small sample of related information perspectives and insight The authors of these articles have no relationship with the ITPCG Android Security See httpdeveloperandroidcomguidetopicssecuritysecurityhtml Android Orphans Visualizing a Sad History of Support See httptheunderstatementcompost11982112928android-orphans-visualizing-a-sad-history-of-support A Look into Mobile Device Security httpwwwsymanteccomcontentenusaboutmediapdfssymc_mobile_device_security_june2011pdfom_ext_cid=biz_socmed_twitter_facebook_marketwire_linkedin_2011Jun_worldwide_mobilesecuritywp Carrier IQ what it is what it isnrsquot and what you need to do httpwwwengadgetcom20111201carrier-iq-what-it-is-what-it-isnt-and-what-you-need-to CIS Apple iOS configuration benchmarks httpbenchmarkscisecurityorgen-usroute=downloadsbrowsecategorybenchmarksmobileiphone Current Android Malware httpforensicsspreitzenbarthdepage_id=254 DISA STIGs for Smartphones - unclassified httpiasedisamilstigsnet_perimeterwirelesssmartphonehtml iOS Hardening Configuration Guide Department of Defence Intelligence and Security Australian Government httpwwwdsdgovaupublicationsiOS_Hardening_Guidepdf Mac OS X and iOS Security httpdeveloperapplecomlibrarymacdocumentationSecurityConceptualSecurity_OverviewArchitectureArchitecturehtmlapple_refdocuidTP30000976-CH202-TPXREF101 Mobile Malware Why Fraudsters are Two Steps Ahead httpwwwtrusteercomblogmobile-malware-why-fraudsters-are-two-steps-ahead Rootkit called Carrier IQ discovered phoning home with user data httpwwwzdnetcomblogapplerootkit-called-carrier-iq-discovered-phoning-home-with-user-data11792 RIM launches Blackberry Fusion to Secure Android and Apple devices httpbusinessfinancialpostcom20111129rim-launching-blackberry-mobile-fusion-to-secure-iphone-android-devices Smartphone Security httpwwwenisaeuropaeuactapplication-securitysmartphone-security-1 The Spy Files Map httpwikileaksorgThe-Spyfiles-The-Maphtml Ten Steps to Secure Your Mobile Devices httpswikiinternet2educonfluencedisplayitsg2Mobile+Device+Security
Why Your Phone is Insecure by Design httpwwwforbescomsitesandygreenberg20110812codebreaker-karsten-nohl-why-your-phone-is-insecure-by-design
Managing the Benefits and Risks of Mobile Computing
25
About the Research Topics researched by the IT Policy Compliance Group (IT PCG) are part of an ongoing calendar established in consultation with Advisory General and Charter members of the Group as well as from findings compiled from ongoing research In addition to specific tracking questions common to each benchmark the research is designed to uncover the relationship between business results outcomes being experienced by organizations actions taken practices implemented and capabilities organizations use to respond
The qualitative research findings presented in this report are from numerous focus groups one-on-one interviews and meetings held with larger audiences throughout 2011 The quantitative findings contained in this report are from primary research studies conducted with 210 organizations in North America during late 2011
The maximum error for the sample findings for the benchmark findings contained in this report is +- seven percent The primary focus of analysis contained in this report is to present the largest differences between the outcomes experienced and similarly aligned findings that are most responsible for the differences in outcomes Instead of relying on differences that are within or close to the sample errors the effort has been to focus on the largest differences For example instead of focusing on differences involving +- 10 percent the findings covered in this report tend to focus on the largest differences in the range of 50 percent or more
The findings covering the use of Mobile computing are representative of organizations in North America and cannot be construed or inferred to represent current usage or plans for Mobile computing outside of North America However the findings covering the performance outcomes benefits and risks of Mobile computing the practices to manage the business risks and the controls to manage the risks match findings from similar studies covering other geographies outside of North America including findings from Latin America South America Europe Africa the Middle East Asia and Oceania
Industries represented The quantitative research includes representation from the following industries advertising accounting services aerospace agriculture apparel architecture automotive banking chemicals computer equipment and peripherals computer software and services construction consumer durable goods distribution education engineering services entertainment financial services food and beverage government (local state and federal level public administration) government (defense and intelligence) health medical and dental services insurance law enforcement management services media scientific and consulting services manufacturing pharmaceuticals public relations publishing real estate rental and leasing services retail trade telecommunications equipment telecommunication services transportation warehousing travel accommodation and hospitality services utilities waste management and wholesale trade Five industries represent 47 percent of the sample These include Banking Education Financial and Accounting Services Manufacturing and Retail Trade Another 27 industries represent the other 53 percent of the sample none of which represents more than five percent of the sample
Revenue or agency budgets of participating organizations Size of the organizations participating in the most recent benchmarks is somewhat evenly distributed although slightly fewer represent midsize organizations Thirty-six percent of the organizations represented by the findings have annual revenues or agency budgets that are less than $50 million Another twenty-nine percent of the sample has annual revenues or agency budgets between $50 million and $999 million The remaining thirty-five percent of the sample has annual revenues or agency budgets that are $1 billion or more
Functional areas of responsibility Thirty-five percent of the qualified participants for the benchmark work in IT with another 30 percent work in finance or internal controls The remaining 35 percent of the qualified participants work in a wide variety of functions from business line management senior management product design and development legal compliance sales marketing procurement logistics and customer services among other functions
Job titles of participants Thirty-five percent of the participants in the benchmark are senior managers with titles that include CEO CIO CFO or Vice president Thirty-eight percent are managers or directors and twenty-seven percent are staff in their organizations
Managing the Benefits and Risks of Mobile Computing
About IT Policy Compliance Group The mission of the IT Policy Compliance Group is to promote actionable findings based on evidence to assist organizations with delivering more value less risk and achieve IT policy and compliance objectives related to the use of information systems The Group Web site at wwwitpolicycompliancecom features quick two-minute self-assessments to compare outcomes and practices against onersquos industry peers and best performing organizations research reports continuing professional education conferences and seminars member and knowledge centers related research from around the World and resources including standards and frameworks associations government and regulators
The Grouprsquos research is designed to help IT risk legal financial and internal audit professionals to
Benchmark results and efforts against peers and best-in-class performers
Identify key drivers challenges and responses to improve results
Determine the applicability and use of specific capabilities to improve results
Identify best practices based on results and experience of peers
The Group relies upon its members and advisors for its research and editorial calendar
IT Policy Compliance Group Charter Members
The Institute of Symantec Corporation Internal Auditors ISACA 350 Ellis Street 247 Maitland Avenue 3701 Algonquin Road Suite 1010 Mountain View CA 94043 Altamonte Springs FL 32701 Rolling Meadows IL 60008 +1 (650) 527 8000 +1 (407) 937 1100 +1 (847) 253 1545 wwwsymanteccom wwwtheiiaorg wwwisacaorg infosymanteccom iiatheiiaorg infoisacaorg
Computer Security Institute Protiviti IT Governance Institute 600 Harrison Street New York Office 3701 Algonquin Road Suite 1010 San Francisco CA 94107 1290 Avenue of the Rolling Meadows IL 60008 +1 (415) 947 6320 Americas 5th Floor +1 (847) 660 5600 wwwgocsicom New York New York 10104 wwwitgiorg csicmpcom +1 (212) 603 8300 infoitgiorg wwwprotiviticom infoprotiviticom
IT Policy Compliance Group Affiliate Members and Advisors A current list of Affiliate Members and Advisors to the Group can be found on the IT Policy Compliance Group website
26
Founded in 2005 the IT Policy Compliance Group conducts benchmark research focused on delivering fact-based guidance on the steps that can be taken to improve results Benchmark results are reported through wwwitpolicycompliancecom for the benefit of members
IT Policy Compliance Group
Contacts Managing Director Jim Hurley Telephone +1 (216) 373 7010 jhurleyitpolicycompliancecom Managing Editor John Ortbal Telephone +1 (847) 444 0344 jortbalitpolicycompliancecom wwwitpolicycompliancecom
December 2011
The information contained in this publication has been obtained from sources that the IT Policy Compliance Group believes to be reliable but is not guaranteed Research publications reflect current conditions that are subject to change without notice
Copyright copy 2011 IT Policy Compliance Group Names and logos may be trademarks of their respective owners All rights reserved 1211 293167003
32
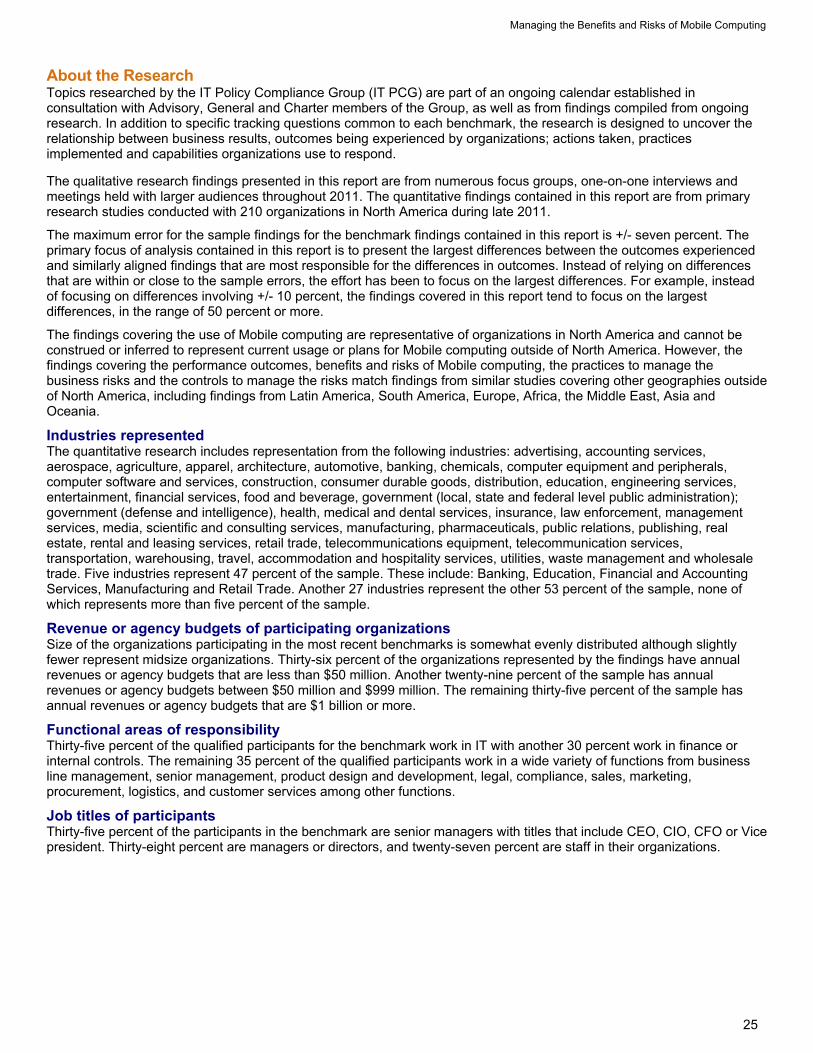
Managing the Benefits and Risks of Mobile Computing
25
About the Research Topics researched by the IT Policy Compliance Group (IT PCG) are part of an ongoing calendar established in consultation with Advisory General and Charter members of the Group as well as from findings compiled from ongoing research In addition to specific tracking questions common to each benchmark the research is designed to uncover the relationship between business results outcomes being experienced by organizations actions taken practices implemented and capabilities organizations use to respond
The qualitative research findings presented in this report are from numerous focus groups one-on-one interviews and meetings held with larger audiences throughout 2011 The quantitative findings contained in this report are from primary research studies conducted with 210 organizations in North America during late 2011
The maximum error for the sample findings for the benchmark findings contained in this report is +- seven percent The primary focus of analysis contained in this report is to present the largest differences between the outcomes experienced and similarly aligned findings that are most responsible for the differences in outcomes Instead of relying on differences that are within or close to the sample errors the effort has been to focus on the largest differences For example instead of focusing on differences involving +- 10 percent the findings covered in this report tend to focus on the largest differences in the range of 50 percent or more
The findings covering the use of Mobile computing are representative of organizations in North America and cannot be construed or inferred to represent current usage or plans for Mobile computing outside of North America However the findings covering the performance outcomes benefits and risks of Mobile computing the practices to manage the business risks and the controls to manage the risks match findings from similar studies covering other geographies outside of North America including findings from Latin America South America Europe Africa the Middle East Asia and Oceania
Industries represented The quantitative research includes representation from the following industries advertising accounting services aerospace agriculture apparel architecture automotive banking chemicals computer equipment and peripherals computer software and services construction consumer durable goods distribution education engineering services entertainment financial services food and beverage government (local state and federal level public administration) government (defense and intelligence) health medical and dental services insurance law enforcement management services media scientific and consulting services manufacturing pharmaceuticals public relations publishing real estate rental and leasing services retail trade telecommunications equipment telecommunication services transportation warehousing travel accommodation and hospitality services utilities waste management and wholesale trade Five industries represent 47 percent of the sample These include Banking Education Financial and Accounting Services Manufacturing and Retail Trade Another 27 industries represent the other 53 percent of the sample none of which represents more than five percent of the sample
Revenue or agency budgets of participating organizations Size of the organizations participating in the most recent benchmarks is somewhat evenly distributed although slightly fewer represent midsize organizations Thirty-six percent of the organizations represented by the findings have annual revenues or agency budgets that are less than $50 million Another twenty-nine percent of the sample has annual revenues or agency budgets between $50 million and $999 million The remaining thirty-five percent of the sample has annual revenues or agency budgets that are $1 billion or more
Functional areas of responsibility Thirty-five percent of the qualified participants for the benchmark work in IT with another 30 percent work in finance or internal controls The remaining 35 percent of the qualified participants work in a wide variety of functions from business line management senior management product design and development legal compliance sales marketing procurement logistics and customer services among other functions
Job titles of participants Thirty-five percent of the participants in the benchmark are senior managers with titles that include CEO CIO CFO or Vice president Thirty-eight percent are managers or directors and twenty-seven percent are staff in their organizations
Managing the Benefits and Risks of Mobile Computing
About IT Policy Compliance Group The mission of the IT Policy Compliance Group is to promote actionable findings based on evidence to assist organizations with delivering more value less risk and achieve IT policy and compliance objectives related to the use of information systems The Group Web site at wwwitpolicycompliancecom features quick two-minute self-assessments to compare outcomes and practices against onersquos industry peers and best performing organizations research reports continuing professional education conferences and seminars member and knowledge centers related research from around the World and resources including standards and frameworks associations government and regulators
The Grouprsquos research is designed to help IT risk legal financial and internal audit professionals to
Benchmark results and efforts against peers and best-in-class performers
Identify key drivers challenges and responses to improve results
Determine the applicability and use of specific capabilities to improve results
Identify best practices based on results and experience of peers
The Group relies upon its members and advisors for its research and editorial calendar
IT Policy Compliance Group Charter Members
The Institute of Symantec Corporation Internal Auditors ISACA 350 Ellis Street 247 Maitland Avenue 3701 Algonquin Road Suite 1010 Mountain View CA 94043 Altamonte Springs FL 32701 Rolling Meadows IL 60008 +1 (650) 527 8000 +1 (407) 937 1100 +1 (847) 253 1545 wwwsymanteccom wwwtheiiaorg wwwisacaorg infosymanteccom iiatheiiaorg infoisacaorg
Computer Security Institute Protiviti IT Governance Institute 600 Harrison Street New York Office 3701 Algonquin Road Suite 1010 San Francisco CA 94107 1290 Avenue of the Rolling Meadows IL 60008 +1 (415) 947 6320 Americas 5th Floor +1 (847) 660 5600 wwwgocsicom New York New York 10104 wwwitgiorg csicmpcom +1 (212) 603 8300 infoitgiorg wwwprotiviticom infoprotiviticom
IT Policy Compliance Group Affiliate Members and Advisors A current list of Affiliate Members and Advisors to the Group can be found on the IT Policy Compliance Group website
26
Founded in 2005 the IT Policy Compliance Group conducts benchmark research focused on delivering fact-based guidance on the steps that can be taken to improve results Benchmark results are reported through wwwitpolicycompliancecom for the benefit of members
IT Policy Compliance Group
Contacts Managing Director Jim Hurley Telephone +1 (216) 373 7010 jhurleyitpolicycompliancecom Managing Editor John Ortbal Telephone +1 (847) 444 0344 jortbalitpolicycompliancecom wwwitpolicycompliancecom
December 2011
The information contained in this publication has been obtained from sources that the IT Policy Compliance Group believes to be reliable but is not guaranteed Research publications reflect current conditions that are subject to change without notice
Copyright copy 2011 IT Policy Compliance Group Names and logos may be trademarks of their respective owners All rights reserved 1211 293167003
32