managing the environmental performance of production facilities in the electronics industry: more...
TRANSCRIPT

Journal of Cleaner Production 11 (2003) 11–26www.cleanerproduction.net
Managing the environmental performance of production facilitiesin the electronics industry: more than application of the concept of
cleaner production
M.H. Nagelab,∗
a Lucent Technologies, Bell Labs Innovations, Environmental, Health & Safety Corporate Center, Bell Laboratories, Larenseweg 50, P.O. Box1168, 1200 BD Hilversum, The Netherlands
b Delft University of Technology, Design for Sustainability Research Group, Faculty OCP, Jaffalaan 9, 2628 BX Delft, The Netherlands
Received 12 January 2002; accepted 12 February 2002
Abstract
This paper approaches the production facilities in the supply chain primarily from an Original Equipment Manufacturer’s perspec-tive as the requesting party in the scope of environmental quality and secondarily from a production facility’s perspective. Fromthe perspective of the customer as well as the supplier, aspects such as price, delivery, technology etc. play an ongoing role, whileenvironmental quality is a new aspect. With respect to environmental quality, the paper discusses the existing situation in thefacilities, like the use of environmental management systems, the notions of environmental performance, green procurement andenvironmental quality in relation to cost structures of facilities. The paper also introduces a new method of benchmarking environ-mental performances of facilities. Environmental performance expresses the total production behaviour of the production facility.A link into a business perspective is shown on the basis of the environmental performance. In this scope the result of a worldwideassessment of 25 printed board production facilities is discussed and a conclusion is drawn. 2002 Elsevier Science Ltd. Allrights reserved.
Keywords: Business; Environmental performance; Environmental quality; Production facility; Supply chain
1. Introduction
A study of the environment of a company identifiescustomers, suppliers, competitors, shareholders, govern-ments etc. Several relationships exist between the com-pany and all these entities. Within this setting, a com-pany operates in terms of product sales, production,procurement, legislation etc. Each company has one ormore production facilities, which manufactures compo-nents and/or products. Each production facility generatesenvironmental load in terms of contributions to environ-mental effects as, acidification, greenhouse effect, smogetc. In general a full product life cycle from “cradle tograve” comprises three phases: the product manufactur-ing phase, the product use phase and the recycling phase.Each phase generates environmental load, which can
∗ Tel.: +31-35-278-7082; fax:+31-35-278-2956.E-mail address: [email protected] (M.H. Nagel).
0959-6526/02/$ - see front matter 2002 Elsevier Science Ltd. All rights reserved.PII: S0959-6526 (02)00021-5
also be divided into three parts, see EL1 to EL3 in Fig.1. The manufacturing phase comprises a large numberof production facilities. Several customer-supplierrelationships exist between the production facilities andthese relationships are cornerstones of the globaloperating economic process. From the perspective of thecustomer as well as the supplier, aspects such as price,delivery, service, technology and quality play an ongo-ing role, while environmental quality is a new aspect,see Fig. 2. In the current global environmental develop-ments in the electronics industry, the environmentalquality of manufactured products and components
Fig. 1. The product life cycle.

12 M.H. Nagel / Journal of Cleaner Production 11 (2003) 11–26
Fig. 2. Customer–relationship.
receives attention in terms of environmentally hazardoussubstances, recyclables and energy use. In this case,environmental quality is product-related and not pro-duction process-related. This paper approaches theenvironmental quality of production processes from arelative perspective. The environmental quality of a pro-duction process can be expressed by a numericalenvironmental performance. Based on environmentalperformance, the management of the production facilitycan set its priorities in terms of measurable improve-ments. At present, a numerical environmental perform-ance per production facility does not exist in the elec-tronics industry, which means that measurableimprovements cannot be realized. The numericalenvironmental performance is linked to the cost structureof the production facility in terms of materials, waterand energy use, which means that improvement of theenvironmental performance results in a cost decrease onthe long term. The benefit of environmental performanceis that internal improvement actions can be set, whichcan also be communicated externally in terms of market-ing and brand-image improvement. The communicationof measurable environmental improvements for eachproduction facility offers new opportunities from a busi-ness perspective. When, for instance, environmental per-formances exist for comparable production facilities,correct environmental benchmarking is also possiblefrom a supply chain management perspective. From acustomer’s perspective the environmental performancesof each suppliers’ production facilities can be used froma business perspective too. In practice this can mean alink between environmental performance and the sup-plier’s purchase turnover. This paper views the environ-mental performance of a production facility from a cus-tomer’s perspective as the requesting party and from asupplier’s perspective as the delivering party. From thescope of a customer–supplier relationship, the existingenvironmental activities in the electronics industry withrespect to environmental management systems, greenprocurement, design for environment and energy costsare primarily discussed. Secondarily, a new environmen-tal-business model is outlined, which represents theenvironmental performance of a production facility [1].Based on this model extended research has been conduc-ted in the worldwide printed board industry, which isshown and discussed. The air emission behaviour andthe energy behaviour of 25 printed board productionfacilities will be discussed in detail, which shows that
these behaviours are not measured and so not managedin this industry sector. Management of the productionfacility’s output flows to air, water and soil representsthe concept of “cleaner production” . The developedmodel will show that management of these behavioursrepresents only the undesired output flows of productionfacilities and not the desired input flows, as incomingmaterials, energy, water etc. This paper will close witha conclusion and some recommendations for pro-duction facilities.
2. The existing situation in production facilities
2.1. Introduction
The notion of environmental quality in general isdriven from the environmental concern related to thehuman ecosphere. The quality of air, soil and water playsan ongoing role, as does the use of resources and energy.Currently, environmental concern is a reality in thesociety, which also results in attention to the productionfacilities in electronics industry. Regarding the currentproduction facilities, many different materials are pro-cured and included in the products. Semiconductors,cables, printed boards, housings, capacitors and varioustypes of subassemblies are required to assemble a tele-communication product. This diversity of components isproduced in different kinds of production processes.These components are a sum of base materials. The rawmaterials are procured through a supplier of the supplier.In some cases, like copper, the next chain can be out-lined: copper extraction, pure copper production, lead-frame production for semiconductor devices and lead-frame preparation before use. Several customer–supplierrelationships exist in this chain (see Fig. 3). Environ-mental quality plays a role in each customer–supplierrelationship. For example, supplier S2 is the customerfor supplier S5. The whole supply chain of an OriginalEquipment Manufacturer (OEM) contains the suppliers’production facilities S1 through S11, i.e. from raw-material extraction to the produced components. Regard-
Fig. 3. The supply chain as a sum of customer–relationship.

13M.H. Nagel / Journal of Cleaner Production 11 (2003) 11–26
ing the current supply chain approaches of OEMs, thecontacts with the supply chain are limited mostly to thefirst tier of suppliers, i.e. S1 to S4.
The introduction of the concept of environmentalquality in the OEM’s direct supply chain, S1 throughS4, shows a large opportunity from an environmental-business perspective for customers and suppliers. This isbecause the environmental performance of a productionfacility can be used in terms of marketing from a sup-plier’s perspective and in terms of benchmarking froma customer’s perspective. A linkage between theenvironmental performance of a supplier’s productionfacility and a proposed price reduction related to the cus-tomer’s purchase turnover is an example of an environ-mental-business approach. Production facilities S1
through S4 generate environmental load in their differentproduction processes, as well as the production facilitiesdeeper in the chain. Each process step in the chain pro-duces solid and liquid waste, air emissions and compo-nents, and each process step needs energy, auxiliarycompounds, water, raw materials and/or subcomponents.Each produced component can contain environmentallyrelevant substances or can use too much energy or canbe non-recyclable. The introduction of the concept ofenvironmental quality to each customer–supplierrelationship in the chain offers an environmental-busi-ness opportunity when the suppliers’ environmental per-formances are measured and integrated into the sup-pliers’ negotiations. This paper focuses on theenvironmental quality of processing methods for compo-nents in the production facilities in the chain, which hasa higher value than the use of environmental manage-ment systems and the general terms as environmentalperformance and green procurement. None of theseaspects are linked to the cost structure of productionfacilities.
2.2. Environmental management systems, ISO14000series of standards and eco-management and auditscheme (EMAS)
A model of an environmental management system fora production facility is outlined by an International Stan-dardization Organization (ISO) approach (see Fig. 4).
Fig. 4. ISO model of an environmental management system..
The ISO14000 series of standard has been establishedwith respect to environmental management systems.Standards ISO14001 is central to the framework of theISO14000 series of standard. ISO14001 contains thebasic requirements for an environmental managementsystem [2]. When, for instance, senior management ofa globally operating semiconductor company decides tointroduce an environmental management system in eachof its eight waferfabs across the world, the process canbe started from the ISO model with the initial principle,commitment and policy (Fig. 4). Once initiated, the pro-cess can be followed by principles such as planning,implementation, measurement and evaluation and reviewand improve. Based on the ISO approach, the elementof continual improvement should be leading.
Following the realization of an environmental man-agement system in each waferfab and by executing thefive mentioned ISO principles, the result will be thateach waferfab can show its ISO14001 certified environ-mental management system to customers, governmentsetc. From an OEM’s supply chain management perspec-tive all the suppliers’ waferfabs have an ISO14001 certi-fied environmental management system in place, butthey are different when compared in depth because termslike environmental performance, environmental impact,continual improvement etc. have been measured, inter-preted and implemented in different ways. This emphas-izes that when all the suppliers’ facilities of an OEMhave an environmental management system in place, thisdoes not mean that they have the same metrics. Thisteaches that supplier selection, qualification, ranking andcomparison based on an ISO14001 environmental man-agement system does not make sense. Many suppliers’production facilities are currently working towards anenvironmental management system, which will be certi-fied according to ISO14001. To have such a certifiedsystem in place will distinguish them from others, whodo not have such a system in place. However, within aperiod of 5 years each production facility in an OEM’ssupply chain round the globe will be certified accordingto ISO14001, from a totally different content of the fiveprinciples. This paper describes the metrics for determin-ing the environmental performance of comparable pro-duction processes of different suppliers from the oper-ational analysis of production facilities. When numericalenvironmental performances of suppliers’ productionfacilities are available, the fourth step in the ISO model,measurement and evaluation and the concept of contin-ual improvement becomes measurable from a supplychain management perspective. Based on environmentalperformance suppliers’ production facilities can beselected, qualified and benchmarked and the concept ofcontinual improvement becomes valueable.
The eco-management and audit scheme (EMAS) existalongside the ISO14000 series of standard [3]. The his-tory of the EMAS has been closely linked with that of

14 M.H. Nagel / Journal of Cleaner Production 11 (2003) 11–26
the ISO14000 standard. This standard will also play aminimum role within the scope of supply chain manage-ment. Another aspect, which is not covered by an EMASor an ISO14001 environmental management system, isthe environmental quality of the delivered product. Themass, energy use, environmentally relevant substances,recyclability, recycled content, and quantity of sub-stances of a delivered product, which represents theenvironmental quality, is not addressed by the five men-tioned IS0 principles.
2.3. Environmental performance and greenprocurement
With respect to environmental performance in the sup-ply chain, Sun Microsystems, Inc. has started to integrateenvironmental considerations into its supplier manage-ment process [4]. The main impetus was to develop acapability to respond to customer inquiries on environ-mental aspects of the company and its products. Anotherimpetus was the measurement of the use of ozone-depleting substances in the suppliers’ product manufac-turing processes. These direct impetuses form the basisto adjust the supply chain, but not from an own supplychain strategy. These two issues received the greatestattention, but also provided an avenue to initiate alonger-term discussion regarding whether, and how, sup-plier performance with respect to environmental issuescould be addressed. Many ideas are circulating inrelation to supply chain aspects, like the development ofenvironmental questionnaires [5,6]. The questionnaireshave been focused on obtaining compliance and mostlycontain questions relating to the availability of anenvironmental policy and product design, and nothingmore. Examples are:
� Does the facility/corporation have a written environ-mental policy statement?
� Does the facility have written environmental perform-ance objectives/targets and implementation plans toreduce costs or risks?
� Does your product contain lead?
Furthermore, notions of “green purchasing” and“green procurement” are circulating, but nobody has out-lined this in depth and specified the notion of “green-ness” related to suppliers [7]. In most cases, green pro-curement is linked to a large variety of product andprocess aspects of the supplier. These aspects are: eco-labels, the avoidance of environmentally relevant sub-stances, energy use, use of recycled materials, productmass, re-usability of some parts, recyclability, the use ofenvironmental management systems and the applicationof Design for Environment (DfE) or Life Cycle Assess-ment (LCA). Green procurement is embodied by sup-plier questionnaires related to the aspects mentioned. In
practice it means that one or more questions have beendefined per aspect. Some questions are open, but othersenable the supplier to respond with “yes” or “no” . Ingeneral, green procurement can be described as severalshort-term actions, driven from the OEM to the directsupplier, which are activated by drivers from outside thecompany, such as customers, competitors, laws, regu-lations and directives. When an OEM influences its sup-ply chain from the external driver, it shows a defensivesupply chain approach, not based on vision, strategy,innovation and leadership of the company. The OEM’sgreen procurement approach is to be compliant with cus-tomers, laws and regulations because non-compliance isa threat to the business.
2.4. Environment quality in relation to costs
The production of electrical energy results in the emis-sion of CO2 and acid compounds such as NOx and SO2.A minimization of energy use results in the minimizationof CO2 ejection and a minimization of the greenhouseeffect, while minimization of material use results in lessdissipation. The supply chain can be divided into printedboards, capacitors, coils etc. The production of thesecomponents needs energy, materials and water and pro-duces waste. This shows that the suppliers’ productionfacilities in the chain can be approached from both anenvironmental and an economic perspective. It alsoshows that an internal driver can operate alongside theexternal environmental driver. Within the scope of sup-ply chain management, an internal driver is defined asa driver, which is not triggered by external sources likelegislation, customers, competitors or stakeholders, butby supply chain goals such as cost reductions linked toenvironmental improvements and vice versa. See forinstance, the costs of energy use for heat and power byeight selected sectors in the electronics industry in theUnited States of America (USA) during 1991 in Table1. The sector original equipment in Table 1 containscomputers, computer storage equipment, terminals, per-ipheral equipment, office machines and calculating andaccounting equipment. “Other electronic components” ,is a sector that includes crystals, filters, switches, piezoe-lectric devices, microwave components and printedboard assemblies. Table 1 shows the energy costs of thesuppliers of the OEMs. The sectors, printed boards, sem-iconductors and original equipment have the highestenergy costs. These energy costs influence the sellingprices of the components and products. The main partof the energy costs is related to the electrical energy.When the energy costs per produced component aremanaged, environmental quality is linked to a businessperspective.
The material use in the production facilities is anotherelement, which can be influenced from a managementapproach. When, for example, wafer production process

15M.H. Nagel / Journal of Cleaner Production 11 (2003) 11–26
Table 1Energy costs in the electronics industry in the USA, during 1991
Total supply chain of OEMs Costs (million $) fuel/electricity Costs (million $) electrical Costs (million $) fuelenergy energy
1 Printed Boards 126.8 103.8 232 Semiconductors 467.3 420.7 46.63 Capacitors 33.1 28.7 4.44 Resistors 14.8 12.9 1.95 Coils and Transformers 10.5 8.6 1.96 Connectors 46.8 39.9 6.97 Other Electronic Components 186.6 158.6 288 Original Equipment 338 304.8 33.2
needs 100 kg silicon per hour and produces 75 kg waferper hour, what has happened to the 25 kg silicon? Whenthis mass of silicon is scrapped, this means no efficiencywith respect to use of resources. An efficient use ofmaterial resources is coupled to the cost price and theselling price of a component or material. When thematerial costs per produced component can be reduced,environmental quality is linked to the business perspec-tive too. The management of the necessary materials perkilogram product produced constitutes an opportunity,along with the necessary quantity of water and auxiliarycompounds per kilogram component produced. The useof materials, auxiliary compounds, water, energy andpacking materials determines a part of the cost structureof each production facility, as well as the costs for solidand liquid waste handling and for measuring air emis-sions. Minimizing this use will decrease the environmen-tal load and the cost structure on the long term.
3. Managing the environmental performance ofproduction facilities — an environmental supplychain approach
3.1. Introduction
The management of environmental quality in the sup-ply chain can be driven from its own corporate goals orfrom customers, competitors and/or legislation. Cus-tomers, competitors, stakeholders and legislation areexternal drivers for a company, while the corporate goalsare internal drivers, like realization of cost savings froman environmental perspective. When a customer of anOEM has specific questions relating to the material con-tent of the delivered product, the questions should beanswered directly or when, for instance, the use of chro-mium in products is forbidden in Europe, the OEMshould take action immediately. When the OEM carriesout activities in compliance with it’s customer’s request,and complies with the legislation, but does not study thebackgrounds of these requests and laws, the OEM putsitself in a reactive position. A reactive mode involves
what one has been asked to do and nothing more. Thechoice for such a mode does not require an own strategyor approach. Independent of customer questions, regu-lations and laws, but linked to corporate goals, the abovemajor question relating to the material content of pro-ducts can be the trigger for a company to develop anenvironmental business strategy. To have in place anown environmental business strategy means to operatefrom an offensive leading position (see Fig. 5). Anenvironmental supply chain strategy, a product strategyand a marketing strategy can be derived from a com-pany’s environmental business strategy. The linkagesbetween costs and environmental impact should be aleading element in these strategies. Because the materialcontent of the OEM’s products is mainly determined bythe supply chain, it emphasises that a supply chainapproach is necessary. The new environmental supplychain approach was developed from the concept of lifecycle thinking, with a focus on direct suppliers’ pro-duction processes.
When the production processes of suppliers are com-parable, the environmental load per kilogram producedcomponent is also comparable. For instance, productionfacility A and B produce comparable printed boards.Production facility A uses 5 kg base materials and pro-duction facility B uses 7 kg base materials for 1 kgprinted board. Comparison of A and B shows that pro-duction facility A has a better environmental perform-ance than production facility B. This also means that
Fig. 5. An environmental supply chain strategy is linked to a corpor-ate goal.

16 M.H. Nagel / Journal of Cleaner Production 11 (2003) 11–26
production facility A has lower costs for the basematerials and less solid waste. Less solid waste resultsin less waste handling costs. Production processes ingeneral use materials, auxiliary compounds, water,energy and packing materials to transport the product tothe customer, and generate air emissions and solid andliquid waste. These seven environmental load elementsdetermine the environmental performance of a pro-duction facility. These environmental load elementsform the basis for a management model or Environmen-tal Performance Tool. The generated environmental loadof 1 kg component by the use of materials, auxiliarycompounds, water, energy and packing materials etc. isinversely proportional to environmental performance,which is general expressed by Eq. (1).
EP,PRODUCTION FACILTY�1
EP
. (1)
Based on an environmental performance per pro-duction facility, facilities can be managed because anenvironmental performance is a measurable tangible.The management problem is determined by a lack ofEnvironmental Performance Tools. Without the appli-cation of Environmental Performance Tools it is imposs-ible to determine the environmental performance of aproduction facility, which means the internal policy interms of measurable improvements cannot be executedand the external policy in terms of brand image improve-ment cannot be communicated. An Environmental Per-formance Tool for assessments of production facilitiesshould contain two parts:
� A set of specified questions related to the use ofmaterials, auxiliary compounds, water, energy, pack-ing materials, air emissions and waste, the so-calleddata collection process related to the seven environ-mental load elements.
� A model, which generates a numerical environmentalperformance value.
When an environmental performance per productionfacility is available, facilities can be ranked, classifiedin terms of good or bad and development from bad togood. Based on environmental performance, a linkage tothe supplier’s purchase turnover can be made, whichresults in a proposed price reduction. Environmentalquality can only be integrated into the supply chainbased on the supplier’s environmental performance andthe linkage to the purchase turnover. Proposed pricereductions linked to bad environmental performancestrigger suppliers to improve themselves competitively.Without this linkage, the supply chain policy will receiveno content from a business perspective.
Supplier or production facility development from anenvironmental perspective is defined as eco-supplierdevelopment or eco-production facility development,
Fig. 6. Eco-supplier or eco-production facility development.
which is based on continual improvement. This develop-ment suggests two or more different measurable environ-mental situations of a production facility and the methodof changing from environmental situation A to environ-mental situation B (see Fig. 6). The challenge for theOEM is how to activate suppliers in such a way that theyinitiate innovations in their processes and componentsfrom an environmental business perspective, whichresults in a reduction of the environmental load for theexisting chain. The challenge for the production facilitiesis to determine its environmental performance in ameasurable way, to realize measurable improvementsand to communicate the improvements in terms of mar-keting.
Fig. 6 determines environmental situation A for pro-duction facility Y with EL=n, while the environmentalload in environmental situation B has been decreasedby x until EL=n�x. Eco-supplier development is a corecompetence in a supply chain policy and creates a supplychain management approach. Eco-supplier developmentshould be integrated into the supplier development cycle,which also exists for elements such as quality etc. Theeco-supplier development cycle embodies six steps, seeFig. 7. The first step is the execution of suppliermeasurements. Environmental performances per suppliercan be calculated and compared from these measure-ments, which activities represent the second and thirdsteps. Based on the environmental performance proposedprice reductions relating to the supplier’s purchase turn-over can be determined and negotiated with the supplier,see fourth step. This linkage puts environmental qualityin the scope of a business perspective and results in an
Fig. 7. Eco-supplier or eco-production facility development cycle
17M.H. Nagel / Journal of Cleaner Production 11 (2003) 11–26
agreed price reduction, after negotiation, see fifth step.When the supplier has been classified as very bad andthe proposed price reduction is 10% the primary inten-tion is not to cut off the business with the supplier, butto realize an agreed price reduction and on the basis ofthis to support the supplier with an eco-supplier develop-ment plan. Such a plan contains actions for improve-ment, such as reducing energy consumption by 5% atthe same production level, see sixth step. The executionof an eco-supplier development plan is the supplier’sresponsibility. After, 3 or 4 years, for example, the sup-plier will be measured again and compared with its com-petitors. The essence of the eco-supplier developmentcycle is to realize environmental improvements by priceincentives in the scope of continual improvement. Theactivation and continuation of the eco-supplier develop-ment cycle cannot take place without Environmental Per-formance Tools. From the perspective of the productionfacility the elements of the internal policy are the first,second and sixth step of the eco-production developmentcycle in Fig. 7. When a production facility measures itsproduction behaviour in terms of material use per kilog-ram product and decreases the material use per kilogramproduct the facility can show the environmentalimprovements in terms of marketing. This attitude doesnot exist in production facilities, because the quantity ofmaterials is approached from an economic perspectiveand not from an environmental perspective, while bothare connected. The used base materials are not measuredin kilograms per unit of time linked to the produced pro-ducts in kilograms for the same time unit.
3.2. Environmental process modeling based on therelative approach
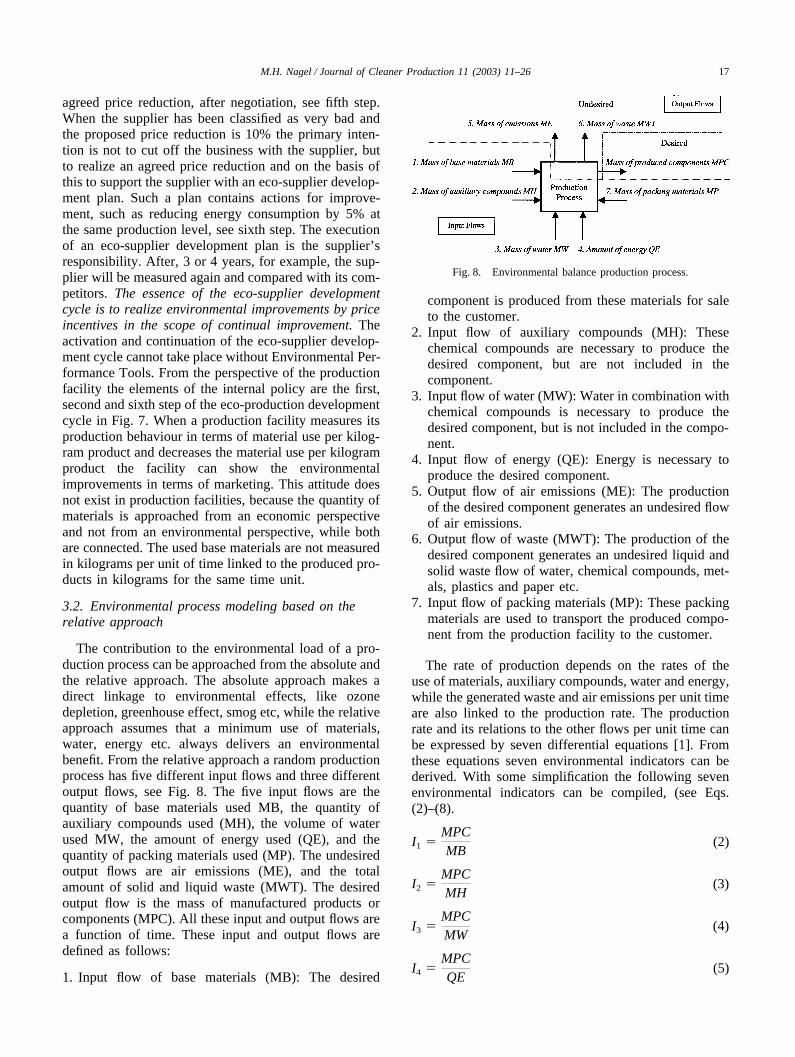
The contribution to the environmental load of a pro-duction process can be approached from the absolute andthe relative approach. The absolute approach makes adirect linkage to environmental effects, like ozonedepletion, greenhouse effect, smog etc, while the relativeapproach assumes that a minimum use of materials,water, energy etc. always delivers an environmentalbenefit. From the relative approach a random productionprocess has five different input flows and three differentoutput flows, see Fig. 8. The five input flows are thequantity of base materials used MB, the quantity ofauxiliary compounds used (MH), the volume of waterused MW, the amount of energy used (QE), and thequantity of packing materials used (MP). The undesiredoutput flows are air emissions (ME), and the totalamount of solid and liquid waste (MWT). The desiredoutput flow is the mass of manufactured products orcomponents (MPC). All these input and output flows area function of time. These input and output flows aredefined as follows:
1. Input flow of base materials (MB): The desired
Fig. 8. Environmental balance production process.
component is produced from these materials for saleto the customer.
2. Input flow of auxiliary compounds (MH): Thesechemical compounds are necessary to produce thedesired component, but are not included in thecomponent.
3. Input flow of water (MW): Water in combination withchemical compounds is necessary to produce thedesired component, but is not included in the compo-nent.
4. Input flow of energy (QE): Energy is necessary toproduce the desired component.
5. Output flow of air emissions (ME): The productionof the desired component generates an undesired flowof air emissions.
6. Output flow of waste (MWT): The production of thedesired component generates an undesired liquid andsolid waste flow of water, chemical compounds, met-als, plastics and paper etc.
7. Input flow of packing materials (MP): These packingmaterials are used to transport the produced compo-nent from the production facility to the customer.
The rate of production depends on the rates of theuse of materials, auxiliary compounds, water and energy,while the generated waste and air emissions per unit timeare also linked to the production rate. The productionrate and its relations to the other flows per unit time canbe expressed by seven differential equations [1]. Fromthese equations seven environmental indicators can bederived. With some simplification the following sevenenvironmental indicators can be compiled, (see Eqs.(2)–(8).
I1 �MPCMB
(2)
I2 �MPCMH
(3)
I3 �MPCMW
(4)
I4 �MPCQE
(5)

18 M.H. Nagel / Journal of Cleaner Production 11 (2003) 11–26
I5 �MPCME
(6)
I6 �MPCMWT
(7)
I8 �MPCMP
. (8)
In these equations the five input and two undesiredoutput flows are linked to the mass of manufactured pro-ducts or components (MPC). These seven environmentalindicators represent the environmental performance ofthe production facility. The higher the ratios between theproduced mass of products or components, MPC, andthe number of environmental load elements, the moreefficient the production will be. This means in theory,that the environmental indicators I1 to I7 will operatebetween 0�I1, I2, I3, I4, I5, I6, I7��. Environmental indi-cators, I1, I2, I3, I4 and I7 are defined as output-inputindicators, while I5 and I6 are defined as output–outputindicators. The environmental output–input indicatorsdescribe the relation between the produced output(MPC) and the input flows. The environmental output–output indicators describe the relation between the pro-duced output MPC and the other output flows. In generalthe management of the output–output indicators, I5 andI6, represents the concept of cleaner production. A mini-mization of the mass of the air emissions (ME) and themass of solid and liquid waste (MWT) per kilogram pro-duced product fits within the concept of cleaner pro-duction as well as the eco-toxicity of the air emissionsand the emissions to land and water.
Eco-toxicity ratios per production facility per industrysector relating to water emissions, but also to air andsoil emissions, deserve to be investigated further. Whenthe environmental performance of a production facilityis expressed by one or more eco-toxicity ratios relatingto different waste flows, production facilities can beranked, compared, classified and developed from a sup-ply chain management perspective. Regarding forexample, the wastewater flow of the printed board pro-duction facilities, emissions are found of lead, copper,tin, phosphates etc. Comparison of these wastewaterflows shows differences in the execution of measure-ments for the substances. Because local laws and regu-lations linked to the facilities differ strongly, theexecution of measurements on substances also differsstrongly. This means that a generic global eco-toxicityratio related to a wastewater flow of printed board pro-duction facilities cannot be determined. Relating to theexecution of measurements on substances in the waste-water flow, the facilities exhibit compliance-orientedbehaviour, as well as with respect to the execution ofmeasurements on substances emitted into the air. Theattitude of the management of production facilities is tobe compliant with laws and regulations. The definition,
measurement, improvement and marketing of the eco-toxicity ratio in terms of environmental performance isa new opportunity from an environmental-business per-spective. In Eqs. (2)–(8) the notion eco-toxicity is notincluded, because the establishment of the indicators I1
to I7 is a first priority for production facilities. Currently,in general only 35% of the printed board productionfacilities have been determined its mass balance at a cor-rect way, which means that indicators I1 to I7 are cor-rect too.
When the measured environmental indicators I1 to I7
per production facility are compared with environmentalreference indicators I1R to I7R, the ‘best practices’ , thegap between two different environmental situations Aand B can be established, see Fig. 6. When in practicethe reference indicators I1R to I7R are chosen so that I1R,I2R,.....I7R�I1, I2,.......I7, the ratios x1 to x7 between themeasured and the reference indicators vary between0�x1, x2, x3, x4, x5, x6, x7,�1. This results in Eq. (9).
xn �In
InR
for n � 1,2,3,4,5,6,7 and 0�xn�1 (9)
With some mathematics [1] a normalized environmen-tal performance ||EPN|| per production facility can bedetermined, see eq. (10). When expression (9) has beenfilled in eq. (10), eq. (11) exists. Here, each measuredindicator I1 to I7 is compared with its reference indicatorI1R to I7.
||EPN|| (10)
� �17·{x2
1 � x22 � x2
3 � x24 � x2
5 � x26 � x2
7}.
||EPN|| � (11)
�17·�� I1
I1R�2
� � I2
I2R�2
� � I3
I3R�2
� � I4
I4R�2
� � I5
I5R�2
� � I6
I6R�2
� � I7
I7R�2�.
In Eq. (10) each ratio xn has the same environmentalweighting. This means in theory that each ratio xn is mul-tiplied by 1/7. But in practice it means that the consump-tion of materials is equal to the consumption of auxiliarycompounds, water, energy etc. from an environmentalimpact perspective. Application of the same environ-mental weighting indirectly implies application of aquality approach, which means that the consumption ofmaterials, auxiliary compounds, water, energy and pack-ing materials and the generation of air emissions andwaste should be equal to the established perfect refer-ence indicators I1R to I7R. If I1=I1R, I2=I2R,......I7=I7R, the�EPN�=1, which represents the best performance value.The operating range of the normalized environmentalperformance is given by Eq. (12). The operating range of||EPN|| offers a simple solution with respect to productionfacility classification.
0�||EPN||�1 (12)

19M.H. Nagel / Journal of Cleaner Production 11 (2003) 11–26
The ||EPN|| can be also applied to the supply chain ofan OEM. ||EPN|| expresses the environmental perform-ance of a mass of produced components in a productionfacility during a period of time. When for instance, 25printed board suppliers are assessed by means of a datacollection process for each environmental load element,and the answers provide the information that allow anormalized performance to be determined, the supplierscan be benchmarked and classified in an easy and under-standable way. Table 2 contains an example of classi-fication of suppliers’ production facilities. If, forinstance, the deviation of the assessed supplier, i.e.environmental indicators I1 to I7, is less than 10% of thereference indicators, the supplier is classified as E1. Thismeans that ||EPN|| operates between 0.9 and 1. In such away, each ||EPN|| of a supplier can be redirected to an E-level and classified as good, sufficient, insufficient, badand very bad.
4. The environmental performance of a printedboard production facility linked to its coststructure
An operational analysis of a printed board productionfacility from an environmental perspective needs datafrom the following environmental load elements:material use, use of auxiliary compounds, water con-sumption, energy consumption, ejected air emissions,waste flows and packing materials. The facility’s policyrelating to these elements is influenced by local andregional environmental regulations and agreements withrespect to noise, emissions, wastewater, landfill, nuis-ance and quality of the soil around the productionfacility. One of the key figures to be established regard-ing the flow of procured base materials, such as, lami-nates, copper foils, copper anodes, lacquers and glass-resin materials, is their percentage in the end product.Using research results, the facility’s annual productionof the mass of printed boards will be linked to the flowof materials, auxiliary compounds, water and energy use,waste, air emissions and packing material. These sevenenvironmental load elements are used to elaborate an
Table 2Classification of production facilities in the supply chain
Classification Production Facilities# Environmental Indicators I1 to I7 �EPN� E-levels
1 0–10% deviation of I1R to I7R 0.9–1 0.9�E1�1, good2 10–20% deviation of I1R to I7R 0.8–0.9 0.8�E2�0.9, sufficient3 20–30% deviation of I1R to I7R 0.7–0.8 0.7�E3�0.8, insufficient4 30–40% deviation of I1R to I7R 0.6–0.7 0.6�E4�0.7, bad5 Larger than 40% deviation of I1R to I7R 0–0.6 E5�0.6, very bad
Environmental Performance Tool. Table 3 gives anenvironmental profile of a mass of produced printedboards in a facility, during 1997. The production andtransport of 494 952 kg printed boards needs a mass ofmaterials, auxiliary compounds, water, packing materialsand an amount of energy and produces air emissions andsolid and liquid waste. The “costs” column shows a dis-tribution of the costs over the seven environmental loadelements. The costs with respect to the ejection and fil-tering of air emissions are unknown, which means thatthese are included in the overhead costs of the facility.During 1993, emission measurements were executed toobtain a correct view of the emission behaviour of thefacility. The costs for these measurements amounted to$150 000. The “ indicators” column gives the ratiosbetween the mass of produced boards and the sevenenvironmental load elements, which shows an appli-cation of Eqs. (2)–(8). The final column of Table 3shows what is needed to produce and pack 1 kg printedboard. A specific conclusion linked to good or badenvironmental performance cannot be established fromthis table because it gives an impression of only oneproduction facility. The seven elements identified allaffect the environment, as well as the cost structure ofthe facility. The use of materials, energy, water, auxiliarycompounds, packing material and the handling of wastehave been linked to the cost price of a printed board. Inthe period between 1991 and 1998, the price of the pro-cess water increased threefold in the area of the facilityresearched. The price of a kilowatt-hour of electricalenergy is also rising slowly. The energy costs (electricaland natural gas) for the manufacturing of 1 kg printedboard are $4.25.
The production facility’s cost structure can be dividedinto four parts: the costs of materials, water, energy etc.,labour costs, overhead costs and selling costs. Thesecosts (C) plus the profit (P) determine the turnover (TO)of the production facility. In the case of the productionfacility, the turnover for 1997 is outlined in Table 4. Thecosts of materials, auxiliary compounds, water, energy,waste handling and packing materials together are 28.3%of the turnover. A study of the costs of these sevenenvironmental load elements shows that the use of

20 M.H. Nagel / Journal of Cleaner Production 11 (2003) 11–26
Table 3Environmental profile printed board production facility during 1997
Mass printed boards produced 494 952 kg The processing of 1 kg printedboard requires and generates
Environmental load elements Costs ($) Indicators
1 Mass materials MB 926 815.6 kg 15 066 416 5.34·10-1 1.87 kg2 Mass auxiliary compounds MH 9 275 290.2 kg 5 222 408 5.34·10-2 18.74 kg3 Mass incoming water flow MW 690 469 000 kg 647 024 7.168·10-4 1395 kg4 Energy QE 185.22·1012 J 2 102 828 2.6·10-9 kg/J 3.74·108 J5 Mass of air emissions ME 27 969.35 kg negligible 10.72 93 g6 Mass of waste flows MWT 7.62·108 kg 1 609 100 6.495·10-4 1539.5 kg7 Mass packaging materials MP 51 845 kg 69 324 9.55 105 g
Table 4Description turnover of the production facility during 1997
Turnover printed board production facility
1. Costs Materials $ 15 066 416 61% 28.3%Auxiliary compounds $ 5 222 408 21.1%Water $ 647 024 2.6%Energy $ 2 102 828 8.5%Air emissions Negligible 0%Waste $ 1 609 100 6.5%Packing materials $ 69 324 0.3%
2. Costs Labour3. Costs Factory overhead4. Costs Selling and administration $62 482 900 71.7%5. ProfitTurnover $ 87 200 000 100%
materials represents 61% of these costs. The costs for theenvironmental load element air emissions and packingmaterial are negligible compared with the material andauxiliary compounds costs. In the scope of cost savings,the facility’s policy will be to minimize material costsand the costs for auxiliary compounds, followed byenergy, waste handling and water. A study of the wastecosts shows that the handling of the wastewater flowrepresents 80% of the costs, while handling the processchemicals and sludge represents 9.8 and 4.7% of thecosts respectively. The other 5.5% of the waste costs isdetermined by the handling of plastics (0.8%), metals(1.9%), paper and cardboard (0.6%), solid printed boardmaterials (2%) and household waste (0.2%). Because theproduction processes for printed boards are comparable,the distribution of the costs for materials, auxiliary com-pounds, water etc. will be roughly comparable too. Froma cost savings perspective the following four points havethe first priority:
� Minimization of base materials� Minimization of auxiliary compounds� Minimization of energy use� Minimization of waste
When the production facility transfers these points to
executable actions, which are feasible on the long term,the normalized environmental performance ||EPN|| ismanaged and will increase. The execution and monitor-ing of actions will also give an increase in indicator I3,because, for instance, a reduction of the wastewater flowof 10% also gives a reduction in incoming water flow.This also means that the waste costs will be reduced. Atthis moment the management of production facilitiesdoes not realize itself that a decrease of material costsand/or energy costs at the same production rate in a cer-tain time frame results in an improvement of theenvironmental performance.
5. A global application of an environmentalperformance tool based on the relative approach inthe printed board industry
5.1. Introduction
Based on an evaluated and validated EnvironmentalPerformance Tool, a global implementation of environ-mental quality in the OEM’s printed board supply chainhas been applied from the relative approach. The objec-tive of this implementation step is to establish nor-malized environmental performances for several printed

21M.H. Nagel / Journal of Cleaner Production 11 (2003) 11–26
board suppliers, from an environmental-business per-spective. In this scope, 25 suppliers’ production facili-ties, A1 through A25, were selected for the execution ofenvironmental assessments. These facilities are locatedin different regions around the globe and produce differ-ent kinds of printed boards. Table 5 shows the locationsof the production facilities. Most of the production facili-ties are located in the USA, in total 13. The suppliers’facilities A8, A9, A10, A14 A20, A21 and A25 are locatedin Europe, while A4, A22, A23 and A24 are located inAsia. These suppliers’ production facilities represent asubstantial part of the OEM’s purchase turnover.
These 25 suppliers’ production facilities wereassessed with the aid of the following procedure. Beforethe start of the supplier assessments, the OEM compiledan overview of appropriate environmental contact per-sons for each facility. The facilities then received anintroductory letter about the environmental activities,research and the OEM’s developed supply chain strat-egy. This letter contained an explanation of the environ-mental-quality concept from a business perspective. Thismeans in practice that the environmental assessmentresults are integrated in the business and the facilitieswill be classified as good, sufficient, insufficient, bad andvery bad. The introductory letter also announced that bya certain date, the facility would be receiving a secondletter plus a floppy disk containing the environmentalsurvey. The letter was signed by the purchaser, qualityengineer, and the environmental expert. Five weeks afterthe introductory letter, the second letter plus the environ-mental survey was sent to the suppliers’ productionfacilities. This letter contained the same message as thefirst one, and was also signed by the same purchaser,quality engineer, and environmental expert. During the7-week assessment period the environmental expert wasavailable to answer questions and provide support. Mostfacilities contacted the environmental expert withremarks and questions. Both letters indicated that sup-pliers’ facilities that did not respond to the environmen-tal survey would be classified as very bad after the duedate. In both letters, the OEM requested that the facilitiessend a confirmation to the environmental expert of whenthey will be able to open the floppy disk containing thesurvey. During the assessment period, the environmentalexpert contacted the facilities to inquire about the statusof the survey.
This procedure yielded a 100% result as all suppliers
Table 5Distribution of suppliers’ production facilities per region
Supplier A1 USA Supplier A6 USA Supplier A11 USA Supplier A16 USA Supplier A21 EuropeSupplier A2 USA Supplier A7 Canada Supplier A12 USA Supplier A17 USA Supplier A22 AsiaSupplier A3 USA Supplier A8 Europe Supplier A13 USA Supplier A18 USA Supplier A23 AsiaSupplier A4 Asia Supplier A9 Europe Supplier A14 Europe Supplier A19 USA Supplier A24 AsiaSupplier A5 USA Supplier A10 Europe Supplier A15 USA Supplier A20 Europe Supplier A25 Europe
responded. Supplier A13 confirmed that it had receivedthe environmental survey, but far exceeded the due date.Seven weeks after the due date, after receiving severalreminders, the President commented that the environ-mental survey is very comprehensive and that he is openfor discussion. Based on the established policy, supplierA13 will be classified as very bad, which means theenvironmental indicators I1 through I7 Twill be estab-lished as 0, the normalized environmental performancebecomes 0 and the proposed price reduction in thenegotiations will be 10%. Supplier A22 exhibited compa-rable behaviour. Two days before the due date, theyrequested the environmental expert to extend the assess-ment period by 1 week because they intended to providethe correct response. More than 1 week after the newdue date, supplier A22 delivered a poor result and prom-ised to deliver more answers. The promised answerswere still not available 2 weeks later. A final reminderwas sent to supplier A22, who did not respond. SupplierA22 will also be classified as very bad and the proposedprice reduction will also be 10%. Neither suppliers exhi-bit supportive behaviour.
The other suppliers did respond to the questions ofthe survey. All the answers relate to production in 1999.A study of the answers identifies inconsistencies indelivered supplier data. This means that some answersare not given or are unreliable. Different answers contra-dict each other in some cases. Another aspect is thatsome suppliers did not read the explanation of the surveycarefully. The mass balance provides insight into thesuppliers’ self-management behaviour. The mass bal-ance per supplier, outlined in Section 5.2, exhibits aninitial impression of the inconsistency. Independent ofthe inconsistency, the answers delivered relate to use ofmaterials, auxiliary compounds, water, energy and pack-ing materials and were used to calculate input–outputindicators I1, I2, I3, I4 and I7 for each facility. Theanswers delivered relate to the generated air emissionsand solid and liquid waste were used to calculate output–output indicators I5 and I6. Sections 5.3 and 5.4 discussthe sample size of the 25 suppliers’ production facilitiesfor the environmental load elements energy use (I4) andair emissions (I5). This means that the energy use andthe air emission behaviour in the sample size will bediscussed in detail, and the highest or best indicator willbe selected. Based on the selected indicators or referenceindicators, the normalized environmental performance

22 M.H. Nagel / Journal of Cleaner Production 11 (2003) 11–26
per supplier’s production facility was determined and aproposed price reduction was derived, see Section 5.5.This result shows an initial environmental qualityimplementation step in the supply chain, which can befollowed by communication to the supplier, the develop-ment of eco-supplier development plans, including inexisting supplier profiles etc., see Fig. 7.
5.2. Discussion of mass balances in the sample size
In theory, a mass balance is in balance when the sumof the input flows (materials, auxiliary compounds, waterand packing materials), is equal to the sum of the outputflows (air emissions, waste and produced printedboards). The mass balance per production facility hasbeen determined on the basis of the delivered supplierdata, which offers a management control. Table 6 showsan overview of the mass balances of the assessed sup-pliers relating to the production of 1 kg printed board.The sum of the input flows minus the sum of the outputflows should be 0. Regarding the mass balance of sup-plier Al, the sum of the inputs is 756.4 kg, while thesum of the outputs is 491.28 kg. The difference betweenthe sum of the inputs and that of the outputs is 35.1%,because the sum of the inputs is greater than the sumof the outputs. Because 95–98% of the generated waste
Table 6Mass balances of the 25 assessed printed board suppliers
# Input Flows Output Flows Difference
MB (kg) MH MW (kg) MP (g) ME (g) MWT (kg) MPC (kg) (%)�inputs (kg) �outputs (kg)(kg)
Supplier A1 12.11 3.45 740.74 100 756.4 78.86 490.2 1 491.28 +35.1Supplier A2 7.78 4.94 473.93 175.44 486.83 12.38 396.83 1 397.84 +18.3Supplier A3 7.07 3.35 854.7 123.46 865.24 34.05 396.83 1 629.96 +27.2Supplier A4 1.97 9.29 1694.92 95.6 1706.28 44.44 1312.34 1 1313.38 +23Supplier A5 6.99 3.96 370.37 104.17 381.4 24.42 384.62 1 385.64 �1.1Supplier A6 1.74 6.73 970.87 98.91 979.44 154.56 869.57 1 870.72 +11.1Supplier A7 1.58 3.84 641.03 37.95 646.49 57.93 442.48 1 443.54 +31.4Supplier A8 1.67 14.49 1052.63 39.42 1068.83 34.49 1124.86 1 1125.89 �5.1Supplier A9 1.57 10.75 684.93 487.8 697.74 5.38 588.24 1 589.25 +15.5Supplier A10 5.18 10.99 1000 609.76 1016.78 112.49 1317.52 1 1318.63 �22.9Supplier A11 7.76 100 7142.86 52.63 7250.67 246.91 7042.25 1 7043.5 +2.9Supplier A12 1.47 1.34 273.97 43.1 276.82 30.67 275.48 1 276.51 +0.1Supplier A13 – – – – – – – – – –Supplier A14 1.35 3.27 330.03 56.21 334.71 68.07 289.02 1 290.09 +13.3Supplier A15 2.02 3.31 588.24 33.9 593.6 27.12 588.24 1 589.27 +0.7Supplier A16 1.55 3.67 680.27 74.35 685.56 0.0259 704.23 1 705.26 �2.8Supplier A17 1.86 1.81 421.94 19.83 425.63 24.13 4166.66 1 4167.68 �89.8Supplier A18 2.35 2.63 416.66 19.83 421.63 20.47 267.38 1 268.4 +36.3Supplier A19 1.73 6.78 769.23 69.25 777.81 49.75 793.65 1 794.7 �2.1Supplier A20 1.69 8.82 380.23 86.96 390.83 30.44 584.8 1 585.83 �33.3Supplier A21 0.99 4.87 0.26 50 6.17 – 3.64 1 4.64 +24.8Supplier A22 – – – – – – – – – –Supplier A23 1.63 2.61 227.79 10 232.04 0.047 119.05 1 120.08 +48.3Supplier A24 1.81 4.98 1492.54 94.07 1499.42 50.68 1190.48 1 1191.53 +20.5Supplier A25 0.68 1.49 0 41.67 2.21 0.0059 106.95 1 108 �98
is wastewater, the water intake is not comparable to thewastewater flow. From this difference it can be con-cluded that supplier A1 has a weak overview of its massbalance. Regarding the mass balance of supplier A10, thesum of the input flows is 1016.78 kg, while the sum ofthe output flows is 1318.63 kg. This means that the sumof the input flows is 22.9% smaller than the sum of theoutput flows, which is impossible from a physical view-point. In Table 6 when the sum of the input flows isgreater than the sum of the output flows, the differenceis shown by a plus sign, while a minus sign indicatesthat the sum of the input flows is smaller than the sumof the output flows. A study of the differences betweenthe sum of input flows and the sum of output flowsshows that most suppliers have no real insight into theirmass balance. When a measure of inaccuracy is acceptedwithin the range of -15 to +15%, only suppliers A5, A6,A8, A11, A12, A14, A15, A16 and A19 have insight intotheir mass balance. If this is representative for the indus-try, only a third knows what its mass balance is.
5.3. Discussion of energy use and selection ofindicator I4
Table 7 shows the use of energy in the sample sizeof the assessed suppliers. The ratio (MPC/QE) and hence

23M.H. Nagel / Journal of Cleaner Production 11 (2003) 11–26
Table 7Overview of ratios and indicators relating to energy use and air emissions
# [MPC/QE] 1 kg printed board I4 (�10-9) [MPC/ME] Air emissions generated I5
needs:(J) per kg printed board
Supplier A1 3.93·10-9 2.54·108 3.93 12.68 78.86 g 12.68Supplier A2 8.06·10-9 1.24·108 8.06 80.75 12.38 g 0Supplier A3 5.59·10-9 1.79·108 5.59 29.37 34.05 g 29.37Supplier A4 3.54·10-9 2.82·108 3.54 22.5 44.44 g 22.5Supplier A5 5.78·10-9 1.73·108 5.78 40.95 24.42 g 40.95Supplier A6 2.78·10-9 3.6·108 2.78 6.47 154.56 g 6.47Supplier A7 6.5·10-9 1.54·108 6.5 17.26 57.93 g 17.26Supplier A8 3.33·10-9 3 108 3.33 28.99 34.49 g 28.99Supplier A9 3.31·10-9 3.02·108 3.31 186 5.38 g 0Supplier A10 5.27·10-9 1.9·108 5.27 8.89 112.49 g 8.89Supplier A11 1.02·10-9 9.8·108 1.02 4.05 246.91 g 4.05Supplier A12 6.11·10-9 1.64·108 6.11 32.6 30.67 g 32.6Supplier A13 – – 0 – – 0Supplier A14 5.06·10-9 1.96·108 5.06 14.69 68.07 g 14.69Supplier A15 6.11·10-9 1.64·108 6.11 36.87 27.12 g 36.87Supplier A16 1.81·10-9 5.52·108 1.81 38511.7 25.97 g 0Supplier A17 4.32·10-9 2.31·108 4.32 41.45 24.13 g 41.45Supplier A18 0.6·10-9 16.66·108 0.6 48.84 20.47 g 48.84Supplier A19 7.78·10-9 1.29·108 7.78 20.1 49.75 g 20.1Supplier A20 12.1·10-9 0.83·108 12.1 32.85 30.44 g 0Supplier A21 8.66·10-9 1.15·108 8.66 – – 0Supplier A22 – – 0 – – 0Supplier A23 400·10-9 2.5·106 0 28811.67 34.71 mg 0Supplier A24 1.6·10-9 6.25·108 1.6 19.73 50.68 g 19.73Supplier A25 25.9·10-9 38.6·106 0 168000 5.95 mg 0
the indicator I4 was calculated on the basis of the deliv-ered data of the suppliers. For these calculations Eq. (5)has been used. A study of Table 7 shows great diversityin the ratio (MPC/QE). In general, suppliers A18 and A20
represent the operating range of ratio (MPC/QE), whichvaries between 0.6·10-9 and 12.1·10-9. Suppliers A23 andA25 exhibit ratios that do not seem realistic. Supplier A23
uses a factor of 33 less energy than supplier A20. Sucha ratio should be established as an inconsistency,because the process equipment in the facilities is compa-rable. Such an inconsistency should result in an indicatorI4 of 0. Supplier A25 uses a factor 2.1 less energy thansupplier A20. The gap between the ratios of the suppliersA20 and A25 is too large to suggest that supplier A25
delivers the reference indicator for the sample size.Regarding the answers to the questions for determiningindicators I1, I2 and I3 of supplier A25, there are inaccur-acies and negligences. This should also result in an indi-cator I4 of 0. Summarizing the situation for the samplesize, supplier A20 delivers the highest indicator I4, whichresults in the reference indicator I4R.
5.4. Discussion of air emissions and selection ofindicator I5
Table 7 also outlines the air emissions of the suppliersassessed in the sample. The ratio (MPC/ME) has beencalculated on the basis of the data provided by the sup-
pliers. Eq. (6) was used for these calculations. Regardingthe sample size, most suppliers have not executed con-centration measurements in their stacks on the roofs oftheir production facilities, relating to the combinationsof substances. This means that the toxicity ratios cannotbe established. Only suppliers A4, A7, A11, A12, A14, A17
and A23 reported any measurement results of concen-tration of substances. However, a comparison of themeasured concentrations identifies wide differences.Regarding the ejection of copper compounds, supplierA7 reports different measured concentrations, the lowestbeing 0.001 mg/cm3, while supplier A12 reports that theconcentration is less than 0.1 mg/cm3. Supplier A12 indi-cates a concentration of 0, while supplier A23 states thatit is not applicable. In the case of the ejection of SOx
and NOx compounds, supplier A17 has not measured this,while supplier A23 measured 0.0005 mg/cm3 as the low-est concentration of SOx. Based on a study of the meas-ured concentrations, it should be concluded that the tox-icity ratio cannot be determined using the supplier dataas provided.
The ratios (MPC/ME) in Table 7 also show a greatdeal of diversity. Supplier A2 exhibits a fairly high ratioof 80.75, which reflects the ejection of only 12.38 g perproduced kilogram printed board. A study of the ejectionof the different combinations of substances results inquestion marks with respect to the NOx compounds andthe volatile organic compounds. These values are 10 000

24 M.H. Nagel / Journal of Cleaner Production 11 (2003) 11–26
and 8000 kg per year only and are too exact. It wouldappear that the estimates are weak and not based onmeasurements. Furthermore, six kinds of combinationsof substances have been marked as not applicable, whichis unrealistic in today’s printed board industry. Thisemission behaviour should result in an indicator for I5
of 0. Supplier A9 also has a fairly high ratio (MPC/ME).The ejection is only 5.38 g per kilogram producedprinted board. Analyzing the ejection of different kindsof combinations shows that five categories have beenmarked as negligible and six categories as not appli-cable. This means that the ratio (MPC/ME) is based onlyon the ejection of chlorine, copper and nickel com-pounds, and a quantity of volatile organic compounds.Such a weak emission behaviour should also result inan indicator for I5 of 0.
The ratio (MPC/ME) of supplier A16 exhibits a valuethat appears unrealistic. During 1999, this productionfacility ejected 0.12 kg formaldehyde into the atmos-phere, together with 0.81 kg ammonia compounds, 0.02kg chlorine compounds, 0.21 kg phosphorous com-pounds, 0.52 kg SOx compounds, 0.1 kg NOx com-pounds and 6.23 kg volatile organic compounds. Thistogether amounts to an ejection of 8.01 kg caused by theproduction of 308 479 kg printed boards. This ratio can-not be represented by an indicator because such a “zero-emission facility” does not exist in the current elec-tronics industry. This means that indicator I5 is estab-lished as 0. Supplier A20 has a ratio (MPC/ME), whichis based solely on a mass of ejected volatile organiccompounds and not on other substances. This wouldappear to be unrealistic, and the ratio cannot be trans-ferred to an indicator I5. In this case, I5 has been estab-lished as 0. The emission behaviour of supplier A21 isunknown because the supplier does not provide any data.Suppliers A23 and A25 exhibit emission profiles that aresimilar to supplier A16, which also results in indicatorsof 0. Regarding indicator I5 in , nine suppliers have anindicator of 0. Many suppliers have poor insight intotheir emission behaviour and have made estimationsfrom a customer perspective, thereby generatingunrealistic ratios (MPC/ME). In the sample size, supplierAla delivers the highest indicator, followed by A17 andA5. In this case supplier A18 will deliver the referenceindicator I5R.
5.5. Discussion of normalized environmentalperformances in the sample size
In the previous Sections 5.3 and 5.4 the indicators I4
and I5 of the assessed suppliers have been discussed andreference indicators I4R to I5R have been selected fromthe sample size. Based on seven reference indicators, anormalized environmental performance �EPN�per sup-plier’s production facility has been calculated. With Eq.(11), the indicators I1 to I7 and the reference indicators
I1R to I7R, the calculated �EPN� per supplier is shown in .These selected reference indicators are [1]:
� I1R=60.19·10-2 — from supplier A16
� I2R=45.87·10-2 — from supplier A25
� I3R=4.39·10-4 — from supplier A23
� I4R=12.1·10-9 — from supplier A20
� I5R=48.84 — from supplier A18
� I6R=1.87·10-3 — from supplier A18
� I7R=24 — from supplier A25
Based on the set of reference indicators, which havebeen provided by five different suppliers, the calculatednormalized environmental performances vary between 0and 0.66. Supplier A12 has the highest performance, fol-lowed by suppliers A18 and A17. The other suppliers haveperformances that vary between 0 and 0.53. Within thisrange, suppliers A11, A13 and A22 have the lowest per-formances, while supplier A25 has the highest. But allthese suppliers exhibit more than 40% deviation fromthe reference indicators. When the suppliers are ranked,as shown in Table 2, all suppliers with exception of A12,A17 and A18 are classified as very bad, i.e. level E5. Sup-pliers A12, A17 and A18 exhibit 34, 38 and 36% deviationfrom the reference indicators respectively, which meansa classification of bad, i.e. level E4. None of the sup-pliers can be classified as sufficient or good. These per-formances determine “environmental situation A” of thesupply base, (see for instance Fig. 6).
In the negotiations between an OEM and its suppliers,the elements component quality and reliability, tech-nology, service, delivery performance and price have arole to play in establishing contracts. An unacceptabledelivery performance of the supplier impacts the priceof components, as well as an unacceptable quality level.The link between environmental quality and price for anumber of components or subassemblies can be for-malized by a link between the normalized environmentalperformance of the supplier’s production facility and thepurchase turnover, which represents the number ofcomponents delivered by that facility. The normalizedenvironmental performances, �EPN�, can operate as adiscriminator in the contracting processes. Based on per-formance, a price reduction (PPR) linked to purchaseturnover per supplier’s facility (PTs) can be proposed. Inthis case, the rule of thumb expressed by Eq. (13) canbe used.
PPR � [(1�|EPN|) /10]·PTS. (13)
The result is that the supplier with the lowest perform-ance receives the highest proposed price reduction ofpurchase turnover per supplier’s facility (PTs), see sup-pliers A10, A11, A13 and A22. From a business perspectivethe five suppliers’ facilities, which can deliver the high-est cost savings should have the first attention in thescope of the eco-supplier development cycle, see Fig. 7.

25M.H. Nagel / Journal of Cleaner Production 11 (2003) 11–26
After an agreed price reduction with the supplier, arequired “environmental situation B” can be establishedand eco-supplier development plans can be developed.
The last column of Table 8 shows the “quality” of themass balance of the assessed suppliers. As discussed inSection 5.2, only suppliers A5, A6, A8, A11, A12, A14,A15, A16 and A19 have a correct mass balance. The othersuppliers have an incorrect mass balance. In this casenormalized environmental performances have been cal-culated independent of the mass balance, which does notimply that an unbalanced mass balance delivers a lownormalized environmental performance or vice versa,see suppliers A11 and A17. The weakness of thisapproach is that suppliers with an unbalanced mass bal-ance can have a relative high performance with respectto sample size, see supplier A25. The strength of thisapproach is that the performance is calculated based oncurrent best available data, which can be used in sup-plier negotiations.
6. Conclusion
This paper has shown that environmental quality canbe integrated into the existing supply chain of an OEMby using an Environmental Performance Tool. Appli-cation of this Environmental Performance Tool hasshown that suppliers can be ranked, classified and com-pared on the basis of their environmental performance
Table 8Calculated normalized environmental performances of assessed suppliers
# �EPN� Proposed price reduction PPR Classification Region Difference (%)
Supplier A1 0.3 7% of PTs E5: very bad USA +35.1Supplier A2 0.41 5.9% of PTs E5: very bad USA +18.3Supplier A3 0.39 6.1% of PTs E5: very bad USA +27.2Supplier A4 0.29 7.1% of PTs E5: very bad Asia +23Supplier A5 0.49 5.1% of PTs E5: very bad USA �1.1Supplier A6 0.24 7.6% of PTs E5: very bad USA +11.1Supplier A7 0.35 6.5% of PTs E5: very bad Canada +31.4Supplier A8 0.32 6.8% of PTs E5: very bad Europe �5.1Supplier A9 0.23 7.7% of PTs E5: very bad Europe +15.5Supplier A10 0.2 8% of PTs E5: very bad Europe �22.9Supplier A11 0.07 9.3% of PTs E5: very bad USA +2.9Supplier A12 0.66 3.4% of PTs E4: bad USA +0.1Supplier A13 0 10% of PTs E5: very bad USA -Supplier A14 0.41 5.9% of PTs E5: very bad Europe +13.3Supplier A15 0.46 5.4% of PTs E5: very bad USA +0.7Supplier A16 0.43 5.7% of PTs E5: very bad USA �2.8Supplier A17 0.62 3.8% of PTs E4: bad USA �89.8Supplier A18 0.64 3.6% of PTs E4: bad USA +36.3Supplier A19 0.4 6% of PTs E5: very bad USA �2.1Supplier A20 0.46 5.4% of PTs E5: very bad Europe �33.3Supplier A21 0.34 6.6% of PTs E5: very bad Europe +24.8Supplier A22 0 10% of PTs E5: very bad Asia -Supplier A23 0.38 6.2% of PTs E5: very bad Asia +48.3Supplier A22 0.37 6.3% of PTs E5: very bad Asia +20.5Supplier A22 0.53 4.7% of PTs E5: very bad Europe �98
and that proposed price reductions can be derived andused in the supplier negotiations. It also shows, however,that only nine of the 25 assessed printed board facilitiesknow what their mass balance is. Therefore, the addedstrength of this Environmental Performance Tool is thatthe accuracy of the supplier data can be checked. In thiscase, the environmental indicators and the normalizedenvironmental performance were calculated independentof inaccuracies in supplier data. Inaccuracies in the dataare not a reason for not calculating the environmentalindicators and the normalized environmental perform-ance. Inaccuracies in data will be eliminated when theeco-supplier development cycle is activated and con-tinued, (see Fig. 6). In the future, the business impact interms of proposed price reductions can be expandedwidely when suppliers deliver inaccurate data. In thiscase, it means that 16 printed board facilities have noinsight into their mass balance, which should result in anormalized environmental performance of 0, a proposedprice reduction of 10% and the classification ‘very bad’ .The normalized environmental performances can be cal-culated and compared for the other nine printed boardfacilities, and proposed price reductions can be derived.
Based on the statement that only nine of the 25assessed printed board production facilities know whattheir mass balance is, it should be concluded that themanagement of the mass balance is almost non-existentin the production facilities. When the mass balance andthe energy use have been determined and combined, a

26 M.H. Nagel / Journal of Cleaner Production 11 (2003) 11–26
total environmental profile of a production facility exists,which can be expressed by environmental indicators I1
to I7. The compilation of such a profile is a first neces-sary step in the scope of the production facility’senvironmental performance. A second step is the con-nection to the production facility’s cost structure. Whenindicators I1 to I7 exist, feasible objectives can be estab-lished, such as a minimization of 3% of the auxiliarycompounds and base materials at a same productionlevel. In practice this means an improvement of indi-cators I1 and I2. The third step is the determination of thenotion eco-toxicity with respect to air, solid and wateremissions, which requires more attention from a researchperspective. The data for the compilation of indicatorsI1 to I7 is available in each production facility, but havenever been brought together or connected to cost struc-ture. The compilation of indicators I1 to I7 demands anintegrated approach from the management of the pro-duction facility. In practice this means for example, thatthe establishment of the used base materials and wastein kilogram per year should be integrated into theemployee’s materials management and waste handlingtasks. At present many waste-handling activities of pro-duction facilities are approached from a legal perspec-tive, which activates the facilities, but also drives theminto a re-active mode. A change from a re-active modeto a pro-active mode means in general that the environ-
mental performance of a production facility can be usedas a business opportunity in terms of “we produce morewith less” . This deserves to be investigated further.
References
[1] Nagel M.H. Environmental quality in the supply chain of an orig-inal equipment manufacturer in the electronics industry. Ph.D. Dis-sertation, September 2001, ISBN 90-9015022-6
[2] ISO14001. Environmental management systems — Specificationwith guidance for use; 1996, ISBN 0580267083
[3] Eco-Management and Audit Scheme, Text of Council Regulation1836/93 — EMAS. Available from:http://www.emas.lu/regtext.htm
[4] Craig E. Integrating environmental considerations into suppliermanagement processes at Sun Microsystems, Inc. Proceedings ofthe IEEE International Symposium on Electronics and the Environ-ment, ISEE-1997, San Francisco; May 1997. p. 282–284.
[5] Craig E., Shiovitz A. Not another survey!!! How Sun Microsys-tems tackled its customer environmental inquiry response problemusing quality processes. Proceedings of the IEEE InternationalSymposium on Electronics and the Environment, ISEE-1997, SanFrancisco; May 1997. p. 267–271.
[6] Andersen J., Choong H. The development of an industry standardsupply-base environmental practices questionnaire” , proceedingsof the IEEE international symposium on electronics and theenvironment, ISEE-1997, San Francisco; May 1997. p. 276–281.
[7] Mulder L., “Green purchasing: does it make sense?” Proceedingsof the IEEE International Symposium on Electronics and theEnvironment, ISEE-1998, Chicago; May 1998. p. 1213–128