managing water in the west - bureau of reclamation managing water in the west colorado river basin...
TRANSCRIPT

RECLAMATION Managing Water in the West
Colorado River Basin Water Supply and Demand Study Technical Report C Water Demand Assessment
U.S. Department of the Interior Bureau of Reclamation December 2012

Mission Statements The U.S. Department of the Interior protects America’s natural resources and heritage, honors our cultures and tribal communities, and supplies the energy to power our future. The mission of the Bureau of Reclamation is to manage, develop, and protect water and related resources in an environmentally and economically sound manner in the interest of the American public.

U.S. Department of the Interior Bureau of Reclamation December 2012
Colorado River Basin Water Supply and Demand Study
Technical Report C — Water Demand Assessment


December 2012 C-iii
Contents
Page
1.0 Introduction .............................................................................................................. C-1
2.0 Background .............................................................................................................. C-4 2.1 State Water Planning...................................................................................... C-4 2.2 Other Studies .................................................................................................. C-4 2.3 Federally Recognized Tribes ......................................................................... C-5 2.4 Summary of Trends in Historical Water Use ................................................. C-6 2.5 Limitations of Historical Data and Future Commitments.............................. C-9
3.0 Water Demand Scenario Development Approach ................................................ C-10 3.1 Scenario Planning Approach.......................................................................... C-10 3.2 Quantification Approach ................................................................................ C-13
3.2.1 Quantification of Tribal Demand ....................................................... C-17
4.0 Results of Water Demand Scenario Quantification .............................................. C-18 4.1 Comparison of Demand Scenarios................................................................. C-18
4.1.1 Demographics and Land Use ............................................................. C-19 4.1.2 Technology and Economics ............................................................... C-19 4.1.3 Social and Governance ...................................................................... C-20
4.2 Summary Results of Scenario Quantification ................................................ C-20 4.3 Colorado River Water Demand by Geography .............................................. C-23 4.4 Colorado River Water Demand by Category ................................................. C-29
4.4.1 Agriculture ......................................................................................... C-29 4.4.2 Municipal and Industrial .................................................................... C-31 4.4.3 Energy ................................................................................................ C-33 4.4.4 Minerals ............................................................................................. C-35 4.4.5 Fish, Wildlife, and Recreation ........................................................... C-35 4.4.6 Tribal .................................................................................................. C-38
5.0 Mexico’s Allotment .................................................................................................. C-45
6.0 Reservoir Evaporation and other Losses ............................................................... C-45 6.1 Reservoir Evaporation ................................................................................... C-46 6.2 Phreatophyte Losses....................................................................................... C-47 6.3 Operational Inefficiencies .............................................................................. C-47
7.0 Approach for Incorporating Climate Change Effects on Demands .................... C-48 7.1 Climate Change Effects on Evapotranspiration ............................................. C-49 7.2 Climate Change Effects on Reservoir Evaporation ....................................... C-50
8.0 Limitations ................................................................................................................ C-51
9.0 References ................................................................................................................. C-52
Disclaimer ............................................................................................................................. C-55

Colorado River Basin Water Supply and Demand Study
C-iv December 2012
Tables Page
C-1 Definition of Demand Categories and Their Associated Parameters ........................ C-15
C-2 Scenario Matrix of Typical Changes in Parameters Defined by the Water Demand Storylines .......................................................................................... C-16
C-3 Storylines Related to Tribal Water Use ..................................................................... C-17
C-4 Summary Results of Water Demand Scenario Quantification by 2060 .................... C-21
C-5 Upper Colorado River Basin Tribes, Lower Colorado River Mainstem Tribes, and Tribes Served by Water Provided through the CAP ............................... C-39
C-6 Upper Colorado River Basin Tribal Rights and Tribal and State Future Demands ......................................................................................................... C-42
C-7 Lower Colorado River Tribal Rights and Tribal and State Future Demands ............ C-44 Figures
Page
C-1 The Study Area .......................................................................................................... C-3
C-2 Historical Colorado River Water Consumptive Use and Loss by State, Mexico, Reservoir Evaporation, and Other Losses, 1971–2010 ............................... C-7
C-3 Historical Colorado River Water Consumptive Use and Loss by Basin, Mexico, Reservoir Evaporation, and Other Losses, 1971–2010 ............................... C-8
C-4 Historical Colorado River Water Consumptive Use, Delivery to Mexico, Reservoir Evaporation, and Other Losses, 1971–2010 .............................................. C-9
C-5 Scenario Development Process .................................................................................. C-12
C-6 Approach to Quantifying Demand Scenarios ............................................................ C-14
C-7 Study Area, Colorado River, and Change in Colorado River Demand ..................... C-24
C-8 Colorado River Basin Historical Use and Future Projected Demand, Delivery to Mexico, Reservoir Evaporation, and Other Losses ................................ C-25
C-9 Colorado River Water Demand ................................................................................. C-26
C-10 Colorado River Water Demand by Category ............................................................. C-27
C-11 Change in Colorado River Water Demand from 2015 by Category .......................... C-28
C-12 Change in Colorado River Water Demand for Agriculture ....................................... C-30

Technical Report C — Water Demand Assessment
December 2012 C-v
Figures (continued) Page
C-13 Change in Colorado River Water Demand for Municipal and Industrial .................. C-32
C-14 Change in Colorado River Water Demand for Energy .............................................. C-34
C-15 Change in Colorado River Water Demand for Mineral Production .......................... C-36
C-16 Change in Colorado River Water Demand for Fish, Wildlife, and Recreation .................................................................................................................. C-37
C-17 Colorado River Basin Tribes ..................................................................................... C-40
C-18 Colorado River Basin Tribal Diversion Rights and Diversion-Based Demand ...................................................................................................................... C-41
C-19 Reservoir Evaporative Losses .................................................................................... C-46
C-20 Historical Lower Basin Phreatophyte Use, 1971–2010 ............................................. C-48
C-21 Current Projected (A) Scenario Demands Adjusted for Future Climate Change ....................................................................................................................... C-50 Appendices
C1 Water Demand Sub-Team Members C2 Colorado Water Demand Scenario Quantification C3 New Mexico Water Demand Scenario Quantification C4 Utah Water Demand Scenario Quantification C5 Wyoming Water Demand Scenario Quantification C6 Arizona Water Demand Scenario Quantification C7 California Water Demand Scenario Quantification C8 Nevada Water Demand Scenario Quantification C9 Tribal Water Demand Scenario Quantification C10 Historical Consumptive Use and Loss Detail By State C11 Modeling of Lower Basin Tributaries in the Colorado River Simulation System C12 Plausible Range of Parameters C13 Parameters Assigned to Each Scenario C14 Water Demand Scenario Storylines C15 Climate Change Effects on Water Demand and Losses


December 2012 C-vii
Acronyms and Abbreviations
ADWR Arizona Department of Water Resources
af acre-feet
afy acre-feet per year
AMA Active Management Area
ASCE American Society of Civil Engineers
Basin Colorado River Basin
Basin States Colorado River Basin States
BC Blaney-Criddle
CAP Central Arizona Project
CBER Center for Business and Economic Research
CIMIS California Irrigation Management Information System
CRB Colorado River Board
CRBPA Colorado River Basin Project Act
CRIT Colorado River Indian Tribes
CRSS Colorado River Simulation System
CRWDA Colorado River Water Delivery Agreement
CU&L Reports Reclamation’s Consumptive Uses and Losses Reports
CVWD Coachella Valley Water District
CVWMP Coachella Valley Water Management Plan
CWCB Colorado Water Conservation Board
DIT Demand Input Tool
DWR Department of Water Resources (California); Division of Water Resources (Utah)
ESA Endangered Species Act
gpcd gallons per capita per day
Harg Hargreaves
ICS Intentionally Created Surplus
IID Imperial Irrigation District
ITA Indian Trust Asset
ITCA Inter Tribal Council of Arizona

Colorado River Basin Water Supply and Demand Study
C-viii December 2012
kaf thousand acre-feet
M&I municipal and industrial
maf million acre-feet
Mexico United Mexican States
MWD Metropolitan Water District of Southern California
NIA Non-Indian Agriculture
NIAR Non-Indian Agriculture Relinquished
NWR National Wildlife Refuge
Partnership Ten Tribes Partnership
PET potential evapotranspiration
PM Penman-Monteith
PPR present perfected right
Prs-Tylr Priestley-Taylor
PVID Palo Verde Irrigation District
Reclamation Bureau of Reclamation
Secretary Secretary of the Interior
SNWA Southern Nevada Water Authority
SRP Salt River Project
SSI self-served industrial
Study Colorado River Basin Water Supply and Demand Study
SWSI Statewide Water Supply Initiative
tribes federally recognized tribes
UMUR Ute Mountain Ute Reservation
UMUT Ute Mountain Ute Tribe
USFWS U.S. Fish and Wildlife Service
USGS U.S. Geological Survey
VIC Variable Infiltration Capacity

December 2012 C-1
Technical Report C — Water Demand Assessment
Key Terms Used in this Technical Report • Hydrologic Basin – the
geographic region naturally draining to the Colorado River.
• Adjacent Area – geographic regions outside the Colorado River hydrologic basin that receive Colorado River water.
• Study Area – the hydrologic boundaries of the Colorado River Basin within the United States, plus the adjacent areas of the Basin States that receive Colorado River water.
• Demand – water needed to meet identified uses.
• Diversion – water withdrawn from the river system.
• Return Flow – water diverted from and returned to the river system.
• Consumptive Use – water used, diminishing the available supply.
• Non-consumptive Use – water used without diminishing the available supply.
• Loss – water unavailable for identified uses due to reservoir/channel evaporation, phreatophyte use, and operational inefficiencies.
• Other Supplies – water supplies other than Colorado River Simulation System (CRSS) simulated Colorado River water supplies that may meet demand.
• Parameter – a variable that affects a demand category (for example, population).
• Colorado River Demand –Colorado River demand as computed by Study Area demand minus other supplies.
1.0 Introduction The Colorado River Basin Water Supply and Demand Study (Study), initiated in January 2010, was conducted by the Bureau of Reclamation’s (Reclamation) Upper Colorado and Lower Colorado regions, and agencies representing the seven Colorado River Basin States (Basin States) in collaboration with stakeholders throughout the Colorado River Basin (Basin). The purpose of the Study is to define current and future imbalances in water supply and demand in the Basin and the adjacent areas of the Basin States that receive Colorado River water over the next 50 years (through 2060), and to develop and analyze adaptation and mitigation strategies to resolve those imbalances. The Study contains for major phases to accomplish this goal: Water Supply Assessment, Water Demand Assessment, System Reliability Analysis, and Development and Evaluation of Options and Strategies for Balancing Supply and Demand.
Spanning parts of the seven states of Arizona, California, Colorado, New Mexico, Nevada, Utah, and Wyoming, the Colorado River is one of the most critical sources of water in the western United States. The Colorado River is also a vital resource to the United Mexican States (Mexico). It is widely known that the Colorado River, based on the inflows observed over the last century, is over-allocated and supply and demand imbalances are likely to occur in the future. Up to this point, this imbalance has been managed, and demands have largely been met as a result of the considerable amount of reservoir storage capacity in the system, the fact that the Upper Basin States are still developing into their apportionments, and efforts the Basin States have made to reduce their demand for Colorado River water.
Concerns regarding the reliability of the Colorado River system to meet future needs are even more apparent today. The Basin States include some of the fastest growing urban and industrial areas in the United States. At the same time, the effects of climate change and

Colorado River Basin Water Supply and Demand Study
C-2 December 2012
variability on the Basin water supply has been the focus of many scientific studies which project a decline in the future yield of the Colorado River. Increasing demand, coupled with decreasing supplies, will certainly exacerbate imbalances throughout the Basin.
It is against this backdrop that the Study was conducted to establish a common technical foundation from which important discussions can begin regarding possible strategies to reduce future supply and demand imbalances. The content of this report is a key component of that technical foundation and describes the Study’s assessment of water demand.
The amount of water available and the progression of demand for water in the Basin (and the adjacent areas of the Basin States that receive Colorado River water) over the next 50 years are highly uncertain and dependent upon a number of socioeconomic and other factors. The potential impacts of future climate variability and climate change further contribute to these uncertainties. To analyze the future reliability of the Colorado River system, with and without adaption and mitigation strategies, projections of water supply and demand were necessary. These projections needed to be sufficiently broad to capture the plausible ranges of uncertainty in future water supply and water demand to ensure that the reliability of the Colorado River system was adequately analyzed.
The Water Demand Assessment examined the quantity and location of current and future water demands in the Study Area. These water demands were derived from the needs of various uses, including municipal and industrial (M&I) use, hydropower generation, recreation, and fish and wildlife habitat. In addition, losses in the Study Area due to evaporation and other factors were assessed. Because future water supply and demand throughout the Study Area are uncertain, scenarios were developed that are sufficiently broad to span that uncertainty, including the potential effects of future climate change. The water demand scenarios, coupled with water supply scenarios (see Technical Report B – Water Supply Assessment) were used to analyze the future reliability of the Colorado River system, with and without future adaptation and mitigation strategies.
Numerous organizations participated in the Water Demand Assessment, including representatives of Reclamation, the Basin States, federally-recognized tribes (tribes), conservation organizations, and others interested in the Basin. A Water Demand Sub-Team was assembled to provide input and assist in completion of this report. Members of the Water Demand Sub-Team are listed in appendix C1.
This technical report presents historical water demand in the Study Area, the Study’s approach to water demand scenario development and quantification, and the results of quantifying water demand for a range of future demand scenarios within the Study Area. The Study Area encompasses the hydrologic boundaries of the Basin within the United States, plus the adjacent areas of the Basin States that receive Colorado River water (figure C-1). Water demand is presented by use category, including a compilation of demand information by tribe.

Technical Report C — Water Demand Assessment
December 2012 C-3
FIGURE C-1 The Study Area

Colorado River Basin Water Supply and Demand Study
C-4 December 2012
2.0 Background
2.1 State Water Planning Each of the Basin States has a statewide water planning process in place for estimating future water supply and demand. These processes typically project demand based on planning regions that are associated with the hydrologic basins of that state. In most states, demand is developed based on parameters in a similar manner employed in the Study. For example, Wyoming’s Green River Basin Plan projects future M&I demand by projecting population under “low,” “medium,” and “high” growth scenarios provided by the Wyoming Division of Economic Analysis (States West Water Resources Corporation, 2001). These population data are coupled with per capita water use estimates to arrive at future M&I demand. Similarly, agricultural demand is based on projections of future irrigated crop acreage, estimates of crop irrigation requirements, and losses.
Parameter and demand estimates for the Study were provided by the Basin States and were generally derived from the states’ planning processes or, in some cases, the planning of individual water agencies such as the Southern Nevada Water Authority (SNWA) and Metropolitan Water District of Southern California (MWD). Because the Basin States and agencies are tasked with water planning and management of their respective areas, they have the most detailed knowledge of current and potential future demand for Colorado River water. Because of this knowledge and planning responsibility, information developed and provided by these agencies was heavily relied upon in the completion of this assessment. Where appropriate, other regional data and studies were consider and used to augment the assessment. Appendices C2 through C8, (Colorado, New Mexico, Utah, Wyoming, Arizona, California, Nevada, respectively) of this technical report presents detail about the assumptions and data sources used for each state in this demand assessment.
2.2 Other Studies As part of the demand scenario quantification process, several studies were reviewed to provide information on the regional trends in water use or parameters affecting water use.
This information was provided to the Basin States to assist in demand scenario quantification where local information may not have been available, or where the range of parameter characteristics had not been previously assessed in state or water agency plans. For example, in the development of demand projections for the San Juan planning area in New Mexico, it was found that the San Juan Regional Water Plan did not include a range of estimates of population for this region. To examine high- and low-growth scenarios, a range of population projections for New Mexico was developed from U.S. Census data.
Regional and national studies consulted include:
• Population Projections: U.S. Census Bureau Projections (U.S. Census Bureau, 2010), U.S. Population Projections 2005–2050 (Pew Research Center, 2010), and World Population Prospects 2010 Revision (United Nations Department of Economic and Social Affairs, 2010).

Technical Report C — Water Demand Assessment
December 2012 C-5
• Municipal Water Use: North American Water Use Trends Since 1992 (Water Research Foundation, 2010), Residential Water Use Trends in North America (Rockaway et al., 2011), 20x2020 Water Conservation Plan (California Department of Water Resources, 2010), Growing Toward More Efficient Water Use (U.S. Environmental Protection Agency, 2010) and Municipal Deliveries of Colorado River Basin Water (Pacific Institute, 2011).
• Irrigated Acreage and Agricultural Water Use: Agricultural Resources and Environmental Indicators (U.S. Department of Agriculture, 2010) and Estimated Use of Water in the United States reports (U.S. Geological Survey, 2009).
• Energy Water Use: Energy-Water Nexus, A Better and Coordinated Understanding of Water Resources Could Help Mitigate the Impacts of Potential Oil Shale Development, (General Accounting Office, 2010), State Electricity Profiles (U.S. Department of Energy, 2009).
2.3 Federally Recognized Tribes Tribes hold quantified rights to a significant amount of water from the Colorado River and its tributaries (approximately 2.9 million acre-feet [maf] of annual diversion rights). In many cases, these rights are senior in priority to those held by other users. Therefore, representing these rights and the associated demand was a critical component to assessing future water demand in the Basin. An additional component of future demand was an assessment of demands by tribes that have unquantified rights or claims. Where information on these unquantified rights or claims was provided by tribes, it was included in the Study, as appropriate; however, this information is not reflected in future tribal water demand projections.1
Based on quantified rights and with additional input from tribes, future demand for water by tribes in the Basin was quantified by the Study. The term “quantified rights”, as used in the context of the Study, is defined as the quantity of water rights reserved by or granted to tribes by federal court decrees, state court decrees, treaties, agreements, and Executive Orders.
The United States has a trust responsibility to protect and maintain rights reserved by or granted to tribes by federal court decrees, state court decrees, treaties, agreements, and Executive Orders. The Indian Trust Assets entitled to protection under the trust responsibility include tribes’ federally reserved water rights. A tribe may also have other off-reservation interests and concerns that must be taken into account.
Each tribe’s water rights determination is multifaceted and contains numerous provisions. The information in this report is limited to the United States’ obligations with regard to current and future Colorado River water delivery to tribes, including tributaries in the Upper Basin. The information in this report is not intended to provide an interpretation of the water rights of any tribe.
Throughout the Study, Reclamation met with tribes in the Upper Colorado River Basin, Lower Colorado River mainstem, and tribes served by water provided (directly or pursuant to exchanges) through the Central Arizona Project (CAP) facilities under contracts between tribes and the United States (see the Tribal discussion in the Colorado River Water Demand by Category section). In addition, Reclamation worked collaboratively with the Ten Tribes Partnership (Partnership), whose members have landholdings in the Upper and Lower Basins through which the Colorado River and 1 Demands provided by the Navajo Nation include both quantified and unquantified rights. See Appendix C-9 for more detail.

Colorado River Basin Water Supply and Demand Study
C-6 December 2012
various tributaries flow, as well as the Inter Tribal Council of Arizona (ITCA), whose members are the governments of 20 tribes with land in Arizona. Additional information on tribal rights and projected future demand is provided in appendix C9.
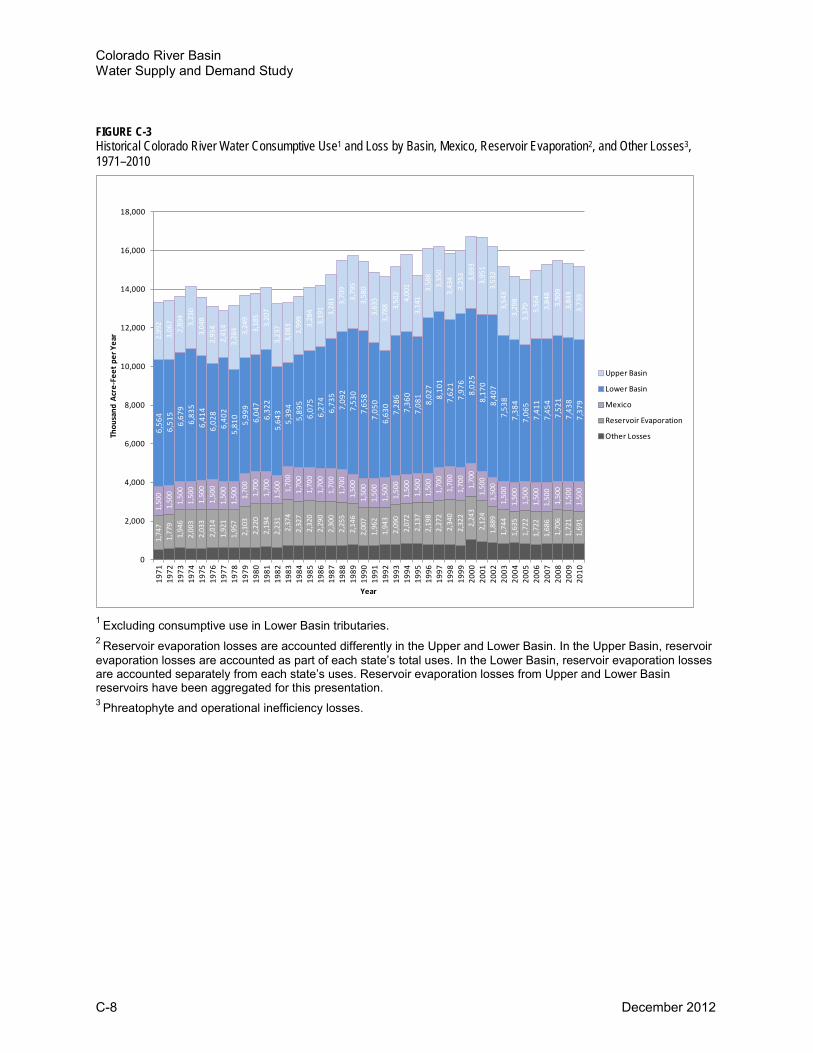
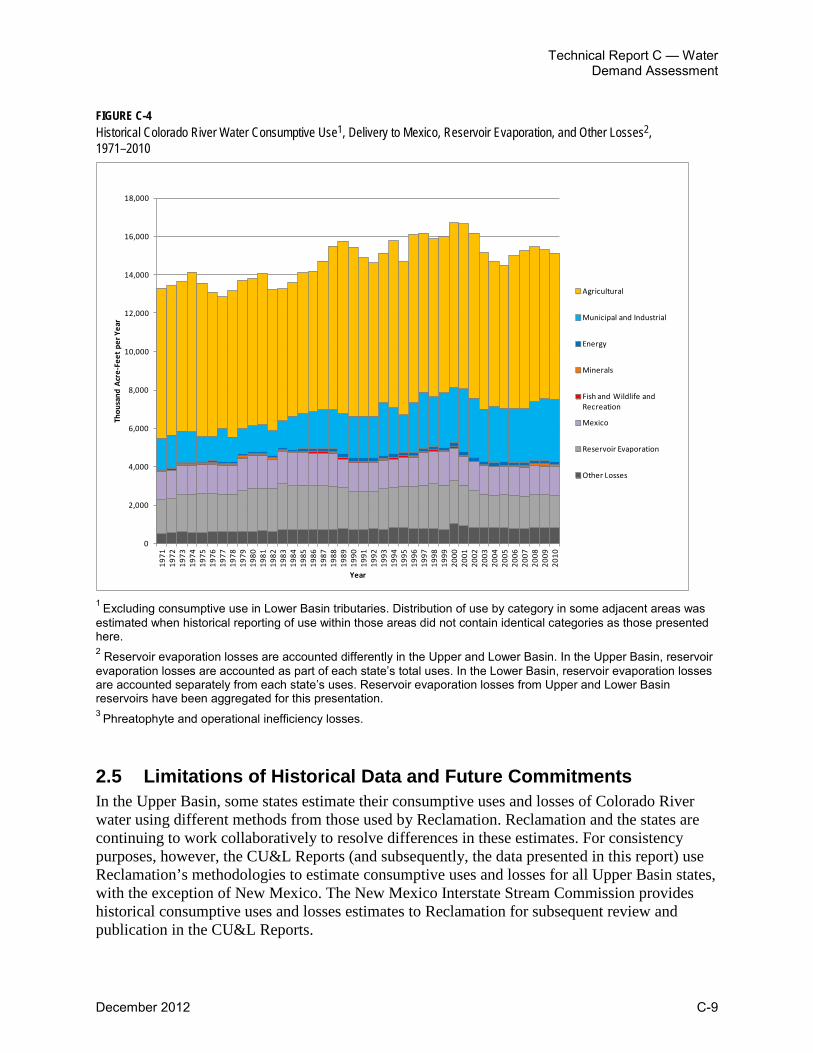
2.4 Summary of Trends in Historical Water Use Reclamation’s Consumptive Uses and Losses Reports2 (CU&L Reports) (Reclamation, 2005, 2012a, 2012b, 2012c) and Colorado River Accounting and Water Use Reports (Reclamation, 1971–2011), and Reclamation estimates demonstrate an increasing trend in Colorado River water use over the historical period 1971 to 2011. Details of historical water use by state can be found in appendix C10. Study Area consumptive uses and losses (including deliveries to Mexico pursuant to the 1944 treaty3) have grown from approximately 13 maf to over 15 maf, an increase of about 14 percent. Figure C-2 shows historical Colorado River water use by each state, water use by Mexico, reservoir evaporation, and other losses. Figure C-3 shows the same information as figure C-2 grouped by Upper and Lower Basin, water use by Mexico, reservoir evaporation, and other losses. Figure C-4 presents historical Colorado River uses and losses by category. From this figure, trends of increasing M&I water use and stable to decreasing agricultural water use can be seen, consistent with the population and irrigated acreage trends of the Southwest.
M&I water use has increased over time as a result of continued population growth in the Basin States. The Basin States include some of the most rapidly growing areas of the United States and typically have had growth rates far exceeding the national average. While population growth has slowed in recent years, the projections for the region continue to remain higher than the national average (U.S. Census Bureau, 2010). Significant decreases in per capita water use, largely due to improvements in indoor fixtures and appliances, have partially offset the water demands associated with increases in population.
Agricultural water use has been relatively stable in recent years, with some reductions likely due to the recent drought. Some reductions in irrigated acreage have occurred in the Basin, consistent with trends in the western United States, and appear to be associated with economic conditions, supply limitations, and pressures from urban encroachment due to land use changes and water transfers. Continued population growth is expected to continue these recent pressures on agriculture lands and water use.
Water use for energy purposes has grown over time, generally consistent with population growth. The growth in population has translated into increased energy demands in the Southwest with energy supply importation from other areas and expanding use of renewable energy. This growth in energy demands has been partially offset through federal and local energy conservation incentive programs.
Because historical tribal water use was not explicitly recorded as part of consumptive uses and losses reporting, the tribal uses have been incorporated into other applicable categories. However, for the projections of future demand, tribal demands are generally considered in a separate category.
2 Some states produce independent estimates of consumptive uses and losses. For consistency, Reclamation-estimated historical consumptive use
and loss are presented in this technical report. 3 Utilization of Waters of the Colorado and Tijuana Rivers and of the Rio Grande, Treaty between the United States and Mexico, 1944.

Technical Report C — Water Demand Assessment
December 2012 C-7
FIGURE C-2 Historical Colorado River Water Consumptive Use1 and Loss by State, Mexico, Reservoir Evaporation2, and Other Losses3, 1971–2010
1 Excluding consumptive use in Lower Basin tributaries. 2 Reservoir evaporation losses are accounted differently in the Upper and Lower Basin. In the Upper Basin, reservoir evaporation losses are accounted as part of each state’s total uses. In the Lower Basin, reservoir evaporation losses are accounted separately from each state’s uses. Reservoir evaporation losses from Upper and Lower Basin reservoirs have been aggregated for this presentation. 3 Phreatophyte and operational inefficiency losses.
0
2,000
4,000
6,000
8,000
10,000
12,000
14,000
16,000
18,000
1971
1972
1973
1974
1975
1976
1977
1978
1979
1980
1981
1982
1983
1984
1985
1986
1987
1988
1989
1990
1991
1992
1993
1994
1995
1996
1997
1998
1999
2000
2001
2002
2003
2004
2005
2006
2007
2008
2009
2010
Thou
sand
Acr
e-Fe
et p
er Y
ear
Year
Colorado
New Mexico
Utah
Wyoming
Arizona
California
Nevada
Mexico
Reservoir Evaporation
Other Losses
Colorado River Basin Water Supply and Demand Study
C-8 December 2012
FIGURE C-3 Historical Colorado River Water Consumptive Use1 and Loss by Basin, Mexico, Reservoir Evaporation2, and Other Losses3, 1971–2010
1 Excluding consumptive use in Lower Basin tributaries. 2 Reservoir evaporation losses are accounted differently in the Upper and Lower Basin. In the Upper Basin, reservoir evaporation losses are accounted as part of each state’s total uses. In the Lower Basin, reservoir evaporation losses are accounted separately from each state’s uses. Reservoir evaporation losses from Upper and Lower Basin reservoirs have been aggregated for this presentation. 3 Phreatophyte and operational inefficiency losses.
1,74
71,
779
1,94
62,
003
2,03
32,
014
1,92
11,
957
2,10
32,
220
2,19
42,
231
2,37
42,
327
2,32
02,
290
2,30
02,
255
2,14
62,
007
1,96
21,
943
2,09
02,
072
2,13
72,
198
2,27
22,
340
2,32
22,
243
2,12
41,
889
1,74
41,
635
1,72
21,
722
1,68
61,
706
1,72
11,
691
1,50
01,
500
1,50
01,
500
1,50
01,
500
1,50
01,
500
1,70
01,
700
1,70
01,
500
1,70
01,
700
1,70
01,
700
1,70
01,
700
1,50
01,
500
1,50
01,
500
1,50
01,
500
1,50
01,
500
1,70
01,
700
1,70
01,
700
1,50
01,
500
1,50
01,
500
1,50
01,
500
1,50
01,
500
1,50
01,
500
6,56
4 6,
515
6,67
9 6,
835
6,41
4 6,
028
6,40
2 5,
810
5,99
9 6,
047
6,32
2 5,
643
5,39
4 5,
895
6,07
5 6,
274
6,73
5 7,
092
7,53
0 7,
658
7,05
0 6,
630
7,28
6 7,
360
7,08
1 8,
027
8,10
1 7,
621
7,97
6 8,
025
8,17
0 8,
407
7,53
8 7,
384
7,06
5 7,
411
7,45
4 7,
521
7,43
8 7,
379
2,99
2 3,
067
2,89
4 3,
230
3,04
8 2,
954
2,41
4 3,
284 3,24
9 3,
185
3,20
7 3,
237
3,08
3 2,
999
3,28
4 3,
191 3,28
1 3,70
9 3,
795
3,58
0 3,
635
3,78
8 3,50
2 4,
001
3,14
1 3,
588
3,35
0 3,
434
3,25
3 3,69
3 3,
951
3,53
2 3,
543
3,29
8 3,
379
3,56
4 3,
848
3,90
9 3,
843
3,73
9
0
2,000
4,000
6,000
8,000
10,000
12,000
14,000
16,000
18,000
1971
1972
1973
1974
1975
1976
1977
1978
1979
1980
1981
1982
1983
1984
1985
1986
1987
1988
1989
1990
1991
1992
1993
1994
1995
1996
1997
1998
1999
2000
2001
2002
2003
2004
2005
2006
2007
2008
2009
2010
Thou
sand
Acr
e-Fe
et p
er Y
ear
Year
Upper Basin
Lower Basin
Mexico
Reservoir Evaporation
Other Losses
Technical Report C — Water Demand Assessment
December 2012 C-9
FIGURE C-4 Historical Colorado River Water Consumptive Use1, Delivery to Mexico, Reservoir Evaporation, and Other Losses2, 1971–2010
1 Excluding consumptive use in Lower Basin tributaries. Distribution of use by category in some adjacent areas was estimated when historical reporting of use within those areas did not contain identical categories as those presented here. 2 Reservoir evaporation losses are accounted differently in the Upper and Lower Basin. In the Upper Basin, reservoir evaporation losses are accounted as part of each state’s total uses. In the Lower Basin, reservoir evaporation losses are accounted separately from each state’s uses. Reservoir evaporation losses from Upper and Lower Basin reservoirs have been aggregated for this presentation. 3 Phreatophyte and operational inefficiency losses.
2.5 Limitations of Historical Data and Future Commitments In the Upper Basin, some states estimate their consumptive uses and losses of Colorado River water using different methods from those used by Reclamation. Reclamation and the states are continuing to work collaboratively to resolve differences in these estimates. For consistency purposes, however, the CU&L Reports (and subsequently, the data presented in this report) use Reclamation’s methodologies to estimate consumptive uses and losses for all Upper Basin states, with the exception of New Mexico. The New Mexico Interstate Stream Commission provides historical consumptive uses and losses estimates to Reclamation for subsequent review and publication in the CU&L Reports.
0
2,000
4,000
6,000
8,000
10,000
12,000
14,000
16,000
18,000
1971
1972
1973
1974
1975
1976
1977
1978
1979
1980
1981
1982
1983
1984
1985
1986
1987
1988
1989
1990
1991
1992
1993
1994
1995
1996
1997
1998
1999
2000
2001
2002
2003
2004
2005
2006
2007
2008
2009
2010
Thou
sand
Acr
e-Fe
et p
er Y
ear
Year
Agricultural
Municipal and Industrial
Energy
Minerals
Fish and Wildlife and Recreation
Mexico
Reservoir Evaporation
Other Losses

Colorado River Basin Water Supply and Demand Study
C-10 December 2012
In the Lower Basin, Reclamation accounts for consumptive use on the mainstem using a “diversion minus return flow” methodology for all water users and publishes that information each year in the Water Accounting Reports. The CU&L Reports include information taken from the Water Accounting Reports for mainstem Lower Basin use and also estimate consumptive uses and losses in the Lower Basin tributaries (primarily the Little Colorado, Virgin, Bill Williams, and Gila rivers). The process of estimating Lower Basin tributary consumptive uses and losses has not received a great deal of attention in the past, and the quality of the resulting information has suffered (see appendix C11). Because of the issues and problems associated with the Lower Basin tributary consumptive uses and losses data, the historical consumptive uses and losses data presented in the following sections do not include data from the Lower Basin tributaries.
Furthermore, Reclamation does not use consumptive uses and losses to compute natural flows on the Lower Basin tributaries for use in CRSS4. Specifically, CRSS uses historical inflows based on U.S. Geological Survey gaged records as estimates of natural flows for the Little Colorado, Virgin and Bill Williams rivers. In addition, the Gila River is not included in CRSS. In appendix C11, three commitments are made to engage in efforts independent of the Study to enhance the capabilities of CRSS: 1) to resolve and correct the methodological and data inconsistencies in CU&L Reports pertaining to all of the Lower Basin tributaries, in collaboration with the Basin States; and 2) to develop natural flows for the Little Colorado, Virgin, and Bill Williams rivers and to modify CRSS to use natural flows for those tributaries; and 3) to explore the feasibility and necessity of computing natural flows for the Gila River Basin and adding that tributary to CRSS.
Although some limitations were imposed on the Study by this treatment of the Lower Basin tributaries, the Study was able to examine several important issues, including potential climate change impacts on the tributaries represented in CRSS, future demand scenarios on those tributaries, and future demand scenarios for the Colorado River from the Gila River Basin, factoring in other water supplies within that basin (see appendix C11).
3.0 Water Demand Scenario Development Approach
3.1 Scenario Planning Approach A scenario planning approach was implemented to examine the uncertainty in future water supply and demand. Details of this approach are included in Technical Report A – Scenario Development. Scenarios are alternative views of how the future might unfold and were used to assist in evaluating the effect of key driving forces on future system reliability. Scenarios are not predictions or forecasts of the future. Rather, a set of well-constructed scenarios represents a range of plausible futures.
The scenario planning process involved identifying the key driving forces (the factors that likely will have the greatest influence on the future state of the system and thereby the performance of the system over time), ranking the driving forces as to their relative importance and relative
4 CRSS is the primary modeling tool used in the Study. It simulates the operation of the major Colorado River system reservoirs on a monthly
time step and provides information regarding the projected state of the system in terms of output variables. Outputs include the amount of water in storage, reservoir elevations, releases from the dams, hydropower generation, the amount of water flowing at various points in the system, the total dissolved solids content, and diversions to and return flows from the water users in the system. See Technical Report G – System Reliability Analysis and Evaluation of Options and Strategies.

Technical Report C — Water Demand Assessment
December 2012 C-11
uncertainty, and associating the highly uncertain and highly important driving forces (critical uncertainties) with either water supply or water demand. The top third of figure C-5 provides a flowchart of this approach as implemented in the Study.
The water demand scenarios were then constructed based on alternative views of future demand for the Colorado River, considering those critical uncertainties relating to demand. This process took place generally following the procedure identified on the right hand side of figure C-5 labeled “Demand” and included: 1) identification of critical uncertainties; 2) identification of parameter ranges (e.g., high and low growth for population); 3) developing storylines that provide a cohesive plausible narrative of the future; and 4) quantifying the storylines. The Water Demand Sub-Team provided input and helped complete these steps. Appendices C12 and C13 present the range of parameters by scenario.
The following scenarios resulted from this process and were used to assess the range of future demand:
• Current Projected (A): Continuation of growth, development patterns, and institutions follow long-term trends
• Slow Growth (B): Slow growth with emphasis on economic efficiency
• Rapid Growth (C1 and C2): Economic resurgence (population and energy) and current preferences toward human and environmental values
• Enhanced Environment (D1 and D2): Expanded environmental awareness and stewardship with growing economy
Complete narrative descriptions of the scenarios (storylines) are presented in appendix C14. Under the storylines, two logical branches or directions were considered for the Rapid Growth (C1 and C2) and Enhanced Environment (D1 and D2) scenarios. For example, population growth or increasing energy needs and subsequent water demand could be partially offset by associated technological innovations influencing water use. The four storylines, with two branches, resulted in a total of six water demand scenarios.

Colorado River Basin Water Supply and Demand Study
C-12 December 2012
FIGURE C-5 Scenario Development Process
Analysis & Strategy
Development
Scenario Development Process Identify Driving Forces
Rank Driving Forces
Identify Critical Uncertainties
Frame the Question
Associate Critical Uncertainties withWater Supply and Water Demand
Quantify Scenarios
Identify Characteristics within each Critical Uncertainty
Analyze Supply Scenarios
Identify Parameters within each Critical Uncertainty
Develop Storylines
Supply Demand
Uncertainty_Flow_Diagram_rev10.ppt
No
Yes
Analyze Demand Scenarios
Combine Scenarios
No
Yes
Supply Scenarios
Document Supply
Scenarios
Demand Scenarios
Document Demand
Scenarios
Do the existing scenarios represent a sufficiently broad range of plausible futures?
Do the existing scenarios represent a sufficiently broad range of plausible futures?
Identify Parameter Ranges

Technical Report C — Water Demand Assessment
December 2012 C-13
3.2 Quantification Approach The scenario planning approach described previously provided the narrative framework for assessing Colorado River demand. Each of the scenarios was subsequently quantified through significant input from the Basin States, with additional input provided by tribes, U.S. Fish and Wildlife Service (USFWS) personnel, and conservation organizations. Demand for each scenario was quantified by estimating values for individual parameters (such as population, irrigated acreage, water use efficiencies, etc.) associated with storylines and specific scenario assumptions.
Each Basin State considers many of these parameters in its evaluation of future demand projections for its state water planning efforts. Although many planning efforts consider alternative scenarios, in most cases those scenarios are not wholly consistent with those considered in the Study. To provide consistent demand assumptions with the scenarios considered in the Study, the Basin States provided estimates of future demand that align with the storylines. These estimates of scenario demand were initially based on existing planning efforts, with varying assumptions related to parameters as well as varying planning timeframes considered. The estimates were generally modified to reflect the broader range of plausible conditions desired in the Study. The trends and projections of population, and trends in water use efficiency and agricultural acreage from previous regional studies, were provided to the Basin States for consideration and utilized to varying extent in development of demand projections. However, in many cases the detail from these previous studies was not sufficient to develop planning-area-level estimates as required for the Study. It was also not possible within the scope of the Study to develop Basin-wide demand projections based on a fully consistent analytical method that would also include the important local differences in factors contributing to water demand.
Consumptive demand for fish and wildlife needs were prepared by the USFWS to reflect the range of potential needs for wildlife refuges.
The demand under each scenario was developed for each of six demand categories: agricultural, M&I, energy, mining, fish/wildlife/recreation, and tribal. Demand estimates were developed for specific planning areas within each state and then totaled for all planning areas to represent the Study Area demand for that state.
Demand was first developed for areas that may be served by Colorado River water, independent of the source of supply. This demand is termed Study Area demand in this technical report; however, for many areas outside of the hydrologic basin, a portion of the Study Area demand is satisfied by other supplies. To develop estimates of Colorado River demand, the Study Area demand was reduced by estimates of available supply from other sources. The distinction between Study Area demand and Colorado River demand is particularly important for areas such as southern California, portions of Arizona not served by mainstem Colorado River water, the Front Range of Colorado, the Wasatch Front of Utah, the San Juan-Chama service areas of New Mexico, and the Cheyenne region in Wyoming (figure C-1). For example, M&I demands in southern California are served by sources such as the State Water Project, Los Angeles Aqueduct, and local surface and groundwater sources that are intermingled with Colorado River water. In these areas, parameters such as irrigated acreage and population were developed and projected based on a specific geographic area rather than by supply source. As a result, the specific population potentially served by Colorado River water could not be directly determined.

Colorado River Basin Water Supply and Demand Study
C-14 December 2012
Instead, the total population was used to estimate M&I demand for the geography, and information about the availability of other supplies was used to estimate the Colorado River demand. Colorado River demand was not limited to individual state apportionments but rather reflects projected water needs based on change in demand parameters over time.
Figure C-6 shows the general approach to quantifying a demand scenario. The storyline, shown at the top of figure C-6, was required to begin the approach. The parameter characteristics were quantified for that particular storyline and used to quantify demand by category. Summing all the categories established the Study Area demand. Colorado River demand was calculated as the Study Area demand minus demand potentially met by other supplies.
Other factors affecting future water demand, such as Mexico’s allotment and losses such as riparian use and reservoir evaporation, were not explicitly included in the scenario approach. These factors were included in the modeling supporting the system reliability analysis. Non-consumptive demands were primarily represented through metrics associated with uses such as hydropower, recreation, and ecological resources, further discussed in detail in Technical Report D – System Reliability Metrics.
FIGURE C-6 Approach to Quantifying Demand Scenarios1
1 Mexico’s allotment and losses such as reservoir evaporation, phreatophyte losses, and operational inefficiencies, are not included in this approach but will be included in the modeling supporting the system reliability analysis.

Technical Report C — Water Demand Assessment
December 2012 C-15
Table C-1 presents the demand categories, their definitions, and associated parameters collected or developed for the Study. The parameter data were collected through communication with and requests to the Basin States, tribes, USFWS, and conservation organizations. Information sought included changes in parameter data over time, such as population, that were used to develop demands by category. Where information on alternative futures was lacking, other references were reviewed that provided indications of regional trends. TABLE C-1 Definition of Demand Categories and Their Associated Parameters
Demand Category Definition Parameters
Agriculture Water used to meet irrigation requirements of agricultural crops, maintain stock ponds, and sustain livestock
Irrigated acreage, irrigation efficiency
Municipal and Industrial
Water used to meet urban and rural population needs, and industrial needs within urban areas
Population, population distribution, M&I water use efficiency, consumptive use factor
Energy Water used for energy services and development Water needs for energy generation
Minerals Water used for mineral extraction not related to energy services Water needs for mineral extraction
Fish, Wildlife, Recreation1
Water used to meet National Wildlife Refuge, National Recreation Area, state park, and off-stream wetland habitat needs
Institutional and regulatory conditions, social values affecting water use, Endangered Species Act-listed species needs, and ecosystem needs
Tribal Water used to meet tribal needs and settlement of tribal water rights claims Tribal use, settlements, and claims
1 This demand category represents the consumptive use portion of demand. Non-consumptive demands are considered in metrics, see Technical Report D – System Reliability Metrics. As part of the scenario quantification process, general relationships were used to relate the expected changes in parameters for each scenario in comparison to recent history consistent with each storyline. These are shown conceptually in table C-2. For example, it was anticipated that population will grow under all scenarios but will grow at a greater rate in the Rapid Growth (C1 and C2) scenarios when compared to the Current Projected (A) scenario. M&I per capita water use goes down in all of the scenarios (i.e. communities become more efficient), but the rate of decrease is greater in the Rapid Growth (C2) scenario as compared to the Rapid Growth (C1) scenario. In addition, the expected change in parameters may have substantial geographic differences. For example, although “Increased Demand” for minerals under the Rapid Growth (C1) scenario may be expected in general, some areas may have little or no capacity for minerals development. Therefore, although these general relationships are shown in table C-2, the specific quantification of the scenario includes important geographic differences at the state and individual planning area level.

Colorado River Basin Water Supply and Demand Study
C-16 December 2012
TABLE C-2 Scenario Matrix of Typical Changes in Parameters Defined by the Water Demand Storylines In general, these represent parameter change from 2015 with growth as a blue “Up” arrow, no change as a yellow bar, or reduction as a green “Down” arrow. The size of the arrow represent larger or smaller change for a given parameter.
1 Self-served industrial demand (SSI) represents the demand of industries in a given area that have water supply systems independent of municipal systems.
PopulationM&I Per
Capita Use
Self ServedIndustrialDemand1
AgriculturalIrrigated Acreage
AgriculturalPer Acre Delivery
EnergyWater
DemandMineralsDemand
Fish,Wildlife,
RecreationDemand
TribalDemand
Current Projected
(A)
Slow Growth
(B)
EnhancedEnvironment
(D2)
RapidGrowth
(C1)
EnhancedEnvironment
(D1)
RapidGrowth
(C2)
Technical Report C — Water Demand Assessment
December 2012 C-17
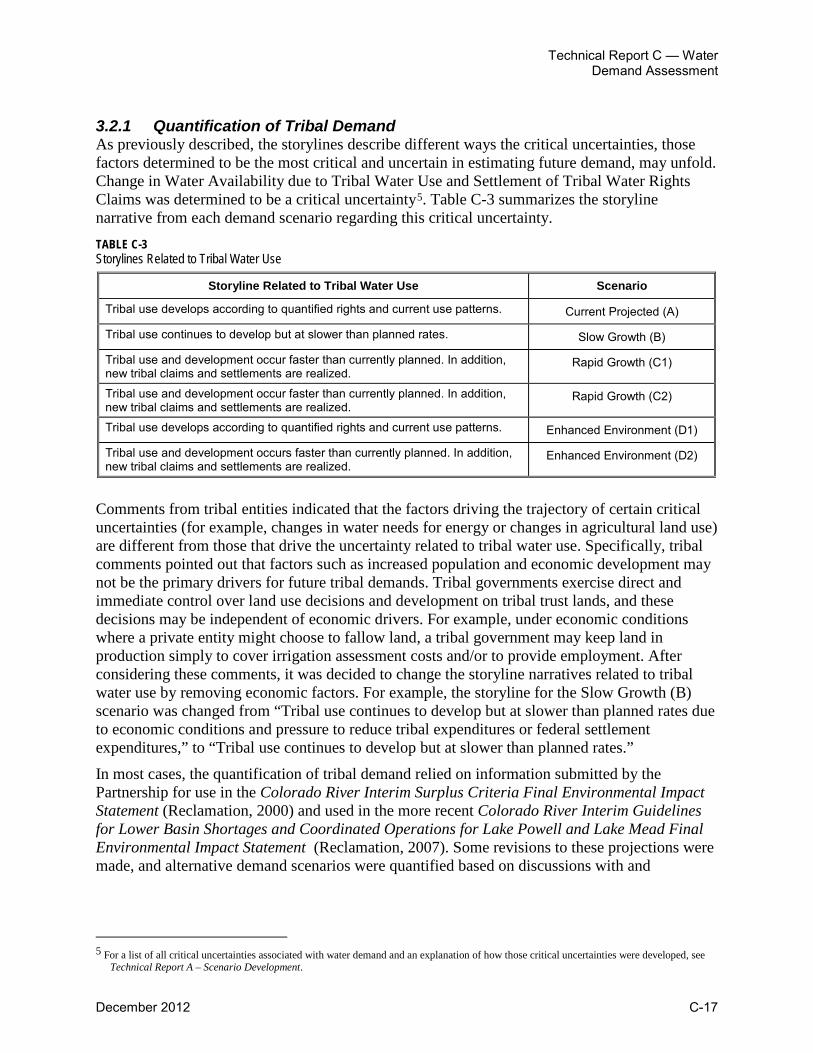
3.2.1 Quantification of Tribal Demand As previously described, the storylines describe different ways the critical uncertainties, those factors determined to be the most critical and uncertain in estimating future demand, may unfold. Change in Water Availability due to Tribal Water Use and Settlement of Tribal Water Rights Claims was determined to be a critical uncertainty5. Table C-3 summarizes the storyline narrative from each demand scenario regarding this critical uncertainty. TABLE C-3 Storylines Related to Tribal Water Use
Storyline Related to Tribal Water Use Scenario
Tribal use develops according to quantified rights and current use patterns. Current Projected (A)
Tribal use continues to develop but at slower than planned rates. Slow Growth (B)
Tribal use and development occur faster than currently planned. In addition, new tribal claims and settlements are realized.
Rapid Growth (C1)
Tribal use and development occur faster than currently planned. In addition, new tribal claims and settlements are realized.
Rapid Growth (C2)
Tribal use develops according to quantified rights and current use patterns. Enhanced Environment (D1)
Tribal use and development occurs faster than currently planned. In addition, new tribal claims and settlements are realized.
Enhanced Environment (D2)
Comments from tribal entities indicated that the factors driving the trajectory of certain critical uncertainties (for example, changes in water needs for energy or changes in agricultural land use) are different from those that drive the uncertainty related to tribal water use. Specifically, tribal comments pointed out that factors such as increased population and economic development may not be the primary drivers for future tribal demands. Tribal governments exercise direct and immediate control over land use decisions and development on tribal trust lands, and these decisions may be independent of economic drivers. For example, under economic conditions where a private entity might choose to fallow land, a tribal government may keep land in production simply to cover irrigation assessment costs and/or to provide employment. After considering these comments, it was decided to change the storyline narratives related to tribal water use by removing economic factors. For example, the storyline for the Slow Growth (B) scenario was changed from “Tribal use continues to develop but at slower than planned rates due to economic conditions and pressure to reduce tribal expenditures or federal settlement expenditures,” to “Tribal use continues to develop but at slower than planned rates.”
In most cases, the quantification of tribal demand relied on information submitted by the Partnership for use in the Colorado River Interim Surplus Criteria Final Environmental Impact Statement (Reclamation, 2000) and used in the more recent Colorado River Interim Guidelines for Lower Basin Shortages and Coordinated Operations for Lake Powell and Lake Mead Final Environmental Impact Statement (Reclamation, 2007). Some revisions to these projections were made, and alternative demand scenarios were quantified based on discussions with and
5 For a list of all critical uncertainties associated with water demand and an explanation of how those critical uncertainties were developed, see
Technical Report A – Scenario Development.

Colorado River Basin Water Supply and Demand Study
C-18 December 2012
information submitted by individual tribes, the Partnership, and the ITCA. Appendix C9 describes in more detail the demand projections for each tribe with quantified Colorado River rights.
4.0 Results of Water Demand Scenario Quantification The quantification of future water demand incorporated the scenario planning approach described earlier. This section presents the quantified demands that resulted from implementing this approach. It begins with a broad qualitative comparison of the demand scenarios, followed by a quantitative summary of the results. An overview of Study Area demand and Colorado River demand is provided, followed by a discussion of demand by geography (state and Basin level) and demand by category. In each of these sections, the demands are presented for all six scenarios. Details of the demand quantification for each state at the planning-area level are presented in appendices C2 through C8 (Colorado, New Mexico, Utah, Wyoming, Arizona, California, Nevada, respectively). Details of quantification for tribal demands are provided in appendix C9.
4.1 Comparison of Demand Scenarios This section presents a broad comparison of the demand scenarios across the Study Area. The comparison is presented in terms of the differences among driving forces, summarized at a category level, as described in the storyline for each scenario. The storylines are also provided in appendix C14 of this technical report. The driving force categories, Demographics and Land Use, Technological and Economics, and Social and Governance, contain multiple driving forces that were used to explore critical uncertainties that formed the basis of the storyline for each scenario. The development of the driving forces, category groupings, critical uncertainties, and storylines is discussed in more detail in Technical Report A – Scenario Development.
The storylines discuss the future trajectory of both consumptive and non-consumptive demands. The scenario quantification presented in this technical report primarily focuses on consumptive demands, expressed through the categories M&I, Agricultural, Energy, Minerals, Fish, Wildlife and Recreation, and Tribal. This technical report does not compare non-consumptive demands, which are those that support the environment and recreational activities, across scenarios. Rather, the impact on flows supporting the environment and recreational activities was assessed across all scenarios through the evaluation of flow targets, characterized through ecological and recreational metrics. Ecological resources and recreational resources (for example, river and whitewater boating) metrics can be found in Technical Report D – System Reliability Metrics.
The Study Area comparison provides the overarching context supporting the water demand quantification presented in this technical report. Relative to water use across sectors, these comparisons reflect differing levels of and interplay among changing societal values, economic drivers, and various types of resource constraints. An exception to this comparison is with respect to tribal demands. It was determined during the quantification process that the factors affecting tribal demands are not particularly well represented by the driving force categories established by the Study. For the most part, tribal demands are based on quantified rights in Current Projected (A), Slow Growth (B), and Enhanced Environment (D1) scenarios, but consider additional unquantified settlements or claims in tribal demands in the Rapid Growth (C1 and C2) and Enhanced Environment (D2) scenarios. Additionally, it is important to

Technical Report C — Water Demand Assessment
December 2012 C-19
recognize that the quantification of water supply and demand scenarios may compare differently at state and individual planning area levels. State level demands generally follow broad identifiable trends, whereas individual planning areas consider locally relevant information, plans, timelines, and constraints.
4.1.1 Demographics and Land Use Population growth and changes in land use are driven by economic growth, the continuance of currently planned agricultural water supply projects, conversion of agricultural land to urban land, and the phasing out of lower-economic-value crops in some areas. Population growth and land use parameters for each state correspond with different reference points based on state and local information and planning efforts reflecting long-term trends.
The Current Projected (A) and Enhanced Environment (D1) scenarios include population projections that are the central estimate from the projections used by the Basin States, whereas more rapid population projections support the Rapid Growth (C1 and C2) and Enhanced Environment (D2) scenarios. The Slow Growth (B) scenario contains lower population projections. Agricultural land use decreases across the entire Basin to varying degrees across all scenarios and at a greater rate under the Rapid Growth (C1 and C2) scenarios. However, in some Upper Basin planning areas both the Current Projected (A) and the Slow Growth (B) scenarios show increases in irrigated agricultural acreage by 2060.
4.1.2 Technology and Economics The development and adoption of new technology and conservation programs supporting reductions in agricultural, energy, and M&I water demand are driven by investments at the local, state, and federal levels that will be brought about by changing societal values, economic drivers, and resource constraints.
M&I water use becomes more efficient under all scenarios. The increase in efficiency is beyond current water efficiency programs and practices. The lowest increase in M&I water use efficiency occurs under the Slow Growth (B) scenario, and the largest efficiency increase occurs under the Enhanced Environment (D1 and D2) scenarios. Changing social values drive these efficiency increases by fostering a willingness to increase investments at the local, state, and federal levels in water conservation programs. The most modest efficiency increase under the Slow Growth (B) scenario stems from the slower rate at which society embraces additional new conservation programs or lacks resources to develop such programs. Changing social values, federal investment, and subsequent responses focused on conservation efforts results in the largest efficiency increase under the Enhanced Environment (D1 and D2) scenarios.
Agricultural per-acre water delivery ranges from a modest increase under the Rapid Growth (C2) scenario to a modest decrease under the Enhanced Environment (D1) scenario. The primary reason for the small decrease under this scenario is favorable economic conditions coupled with changing social values, creating willingness and incentives to invest in agricultural water conservation. This investment leads to rapid adoption of new technologies, resulting in decreased agricultural demands due to increased agricultural water use efficiency.
Water needs for energy development increase across all scenarios and range from the most modest increase under the Enhanced Environment (D1 and D2) scenarios to the greatest increase under the Rapid Growth (C1 and C2) scenarios. Water needs for energy expand relative to population growth and results in the highest demand under the Rapid Growth (C1) scenario.
Colorado River Basin Water Supply and Demand Study
C-20 December 2012
Under the Enhanced Environment (D1 and D2) scenarios, an emphasis on renewable energy requirements and investments in technologies that reduce water consumption associated with energy production and new development decreases projected water demands for energy production, despite a rapidly growing population featured under the Enhanced Environment (D2) scenario.
4.1.3 Social and Governance Changes in agricultural and M&I water use efficiency, in addition to the adoption of new programs to support ecological and recreational resources, are influenced by varying rates of institutional and regulatory changes assumed in the scenarios.
Water use efficiency changes range from a continuation of present practices toward increased efficiency to a greater emphasis on efficiency based on social values. A continuation of present practices is assumed in the Current Projected (A) and Slow Growth (B) scenarios. The Enhanced Environment (D1 and D2) scenarios show larger increases in efficiency resulting from social values leading to greater investment; increased governmental regulations, agreements, and incentives promoting greater renewable energy use; and implementation of additional water conservation programs.
All scenarios rely on the continued existence and further successful implementation of existing federal endangered species programs and policies. Additionally, the Enhanced Environment (D1 and D2) scenarios contemplate a future where changing social values drive public support for investments in additional programs and actions: supporting more certain recovery of listed species, keeping them from being re-listed, providing ecological flows sufficient to support a healthy river system, and enhancing recreational use of the river. The ecological flow targets, characterized using the flow metrics for these scenarios, are non-consumptive, and modeling identified shortfalls for quantified flow targets. Options and strategies, including those that increase supply, reduce demand, and/or modify operations, were considered to address the risks to Basin resources6.
4.2 Summary Results of Scenario Quantification Following the approach described earlier, values were developed for parameters and demands quantified for each of the scenarios. Table C-4 presents summary results for the demand scenarios considered in the Study. The table presents agricultural and M&I demand parameters for the Study Area, which distinguishes the scenarios, the resulting Study Area demand, and finally the Colorado River demand by category.
About 40 million people are estimated to be in the Study Area by 2015. This number is expected to increase to between 49 and 77 million by 2060. The highest population growth is associated with the Rapid Growth (C1 and C2) and the Enhanced Environment (D2) scenarios. The Slow Growth (B) scenario has the lowest population growth of the scenarios (49 million by 2060), but still represents a growth of nearly 25 percent over 2015 estimates.
6 Resources include water allocations and deliveries consistent with the apportionments under the Law of the River; hydroelectric power
generation; recreation; fish, wildlife, and their habitats (including candidate, threatened, and endangered species); water quality including salinity; flow- and water-dependent ecological systems; and flood control.

Technical Report C — Water Demand Assessment
December 2012 C-21
TABLE C-4 Summary Results of Water Demand Scenario Quantification by 2060
Key Study Area Demand Scenario Parameters
2015 2060 Scenario Parameters
A B C1 C2 D1 D2
Population (millions) 38.9–41.1 62.4 49.3 76.5 76.5 62.4 76.5
Change in per capita water usage (%), from 2015 – -9% -7% -9% -16% -19% -17%
Irrigated acreage (millions of acres) 5.4–5.5 5.1 5.2 4.6 4.6 5.0 5.0
Change in per-acre water delivery (%), from 20151 – +1% +2% +1% +3% 0% +3%
Study Area Demand (maf)
Agricultural Demand 16.4–16.7 15.2 15.7 13.7 13.8 14.9 14.9
Municipal and Industrial Demand 8.4–8.8 12.5 10.2 15.1 13.9 11.0 13.7
Energy Demand 0.34–0.63 0.66 0.57 1.01 0.58 0.51 0.56
Minerals Demand 0.1–0.11 0.18 0.18 0.22 0.15 0.15 0.15
Fish, Wildlife, and Recreation Demand 0.16–0.23 0.08 0.08 0.08 0.10 0.16 0.16
Tribal Demand2 1.6–1.8 2.0 2.0 2.4 2.4 2.0 2.4
Total Study Area Demand3 27.3–27.8 30.6 28.7 32.5 30.9 28.7 31.9
Colorado River Demand (maf)
Agricultural Demand 7.1–7.2 6.7 6.8 6.6 6.7 6.6 6.8
Municipal and Industrial Demand 3.4–3.5 5.1 4.5 6.2 5.2 4.8 5.4
Energy Demand 0.21–0.23 0.44 0.38 0.74 0.37 0.34 0.35
Minerals Demand 0.09–0.11 0.17 0.18 0.21 0.14 0.14 0.14
Fish, Wildlife, and Recreation Demand 0.15–0.21 0.06 0.07 0.06 0.08 0.15 0.15
Tribal Demand2 1.5–1.7 2.0 1.9 2.4 2.4 2.0 2.4
Total Colorado River Demand3 12.6–12.8 14.5 13.8 16.2 15.0 14.0 15.2 1 Does not include reductions associated with conservation and efficiency programs such as those in Imperial Irrigation District which are part of transfer agreements. 2 Tribal demand within the state of Colorado is included in other demand categories. 3 Excludes Mexico’s allotment and losses (reservoir evaporation, phreatophytes, and operational inefficiencies). These factors will be included in the modeling supporting the system reliability analysis. The growing municipal population, however, will continue to be more efficient in its per capita water use than today. Per capita water use, based primarily on passive or existing conservation targets, is expected to be 7 to 19 percent less in 2060 than in 2015. These reductions vary considerably across states and scenarios. In some regions, per capita water use rates are expected to drop by over 20 percent by 2060.
Irrigated acreage is projected to continue to decrease through 2060 under all scenarios. Under the Rapid Growth (C1 and C2) scenarios, projected irrigated acreage is reduced by more than 830,000 acres and by roughly 300,000 to 500,000 acres in the other scenarios. Although water

Colorado River Basin Water Supply and Demand Study
C-22 December 2012
use efficiency improvements are anticipated, some of the remaining irrigated land is expected to be more intensely cultivated or fully irrigated, resulting in little overall change in water delivery per acre.
Water demand for energy and mineral categories are projected to increase under all scenarios. The growing need for energy (coal, solar, and oil shale) is projected to increase water demands. The largest increases are anticipated in Arizona, Colorado, and the California desert. Meanwhile, water needs for mineral extraction are projected to significantly increase in Wyoming, Colorado, and Arizona.
Tribal demand is anticipated to increase over time as demand reaches quantified rights (in all scenarios), and demand beyond these quantified rights is realized in the Rapid Growth (C1 and C2) scenarios and the Enhanced Environment (D2) scenario.
The Study Area demand ranges between 28.7 and 32.5 maf by 2060, with Colorado River demand7 ranging between 13.8 and 16.2 maf. Some of the increase in Study Area demand is projected to be met through increases in other supplies, primarily in Colorado and California. The increase in Colorado River demand from 2015 to 2060 is estimated to be between 1.2 and 3.4 maf, with the Lower Basin making up about 60 percent of the increase. Of the total increase in Colorado River demand, for the growing categories, between 64 and 76 percent of the growth is contributed by the M&I demand category. The growth in energy, tribal, and mineral categories constitutes the remaining demand increase.
Colorado River demand is calculated as Study Area demand less the demand projected to be supplied by other sources. The Study and the results presented in this technical report focus on the resulting Colorado River demand. Figure C-7 presents demands across the initial scenarios in three panels as follows: 1) Study Area demand with other supplies and Colorado River demand identified, 2) Colorado River demand, and 3) change in Colorado River demand by demand category.
From the first panel, it can be seen that Study Area demand increases from about 28 maf in 2015 to up to nearly 33 maf by 2060 in the highest scenario. The range in demand increase across scenarios in 2060, however, is projected to be as low as 1.2 or as high as 4.7 maf. When total Study Area demand is compared to Colorado River Demand, it can be seen that more than half of the Study Area demand is expected to be met by other supplies.
Panel two depicts the range of Colorado River demand across scenarios. The Colorado River demand increases from about 12.6 to 12.8 maf in 2015 to between 13.8 and 16.2 maf in 2060 (or 9 percent to 26 percent increase from 2015) depending on the scenario. The range across the highest and lowest scenarios is about 2.4 maf by 2060 or about a 17 percent spread between the Rapid Growth (C1) and the Slow Growth (B) scenarios.
Panel three shows the projected change in Colorado River demand by specific demand categories for each scenario. Increase in the M&I demand category across all scenarios represents the greatest increase in demand. Tribal and energy demand categories also are projected to grow, but
7 Mexico’s allotment and losses such as reservoir evaporation, phreatophyte losses, and operational inefficiencies are not part of this total. These
factors will be included in the modeling supporting the system reliability analysis and have been included in figure C-2 to provide a more complete view of the total demand and losses in the Basin.

Technical Report C — Water Demand Assessment
December 2012 C-23
the overall growth in Colorado River demand is projected to be partially offset by decreases in agricultural demand driven by reductions in irrigated acreage.
Figure C-8 shows the historical Colorado River use and projected future Colorado River demand by scenario. This figure includes historical and future projected losses (consisting of reservoir evaporation and other losses) and deliveries to Mexico to provide a more complete view of the total demand and losses in the Basin. Factoring in Mexico’s allotment and losses, the Colorado River demand increases to between 17.7 and 20.1 maf in 2060. The range across scenarios in 2060 (about 2.4 maf) is easily discernible in the figure, as is the relative similarity of overall demand in the Current Projected (A), Rapid Growth (C2), and Enhanced Environment (D2) scenarios. In addition, it appears that the quantified scenarios track with recent peaks in historical uses that likely represent the least supply limited conditions and could be an indication of historical demand.
4.3 Colorado River Water Demand by Geography The Colorado River demand at three geographic levels is presented in figures C-9, C-10, and C-11. These figures show Study Area, Upper and Lower Basin, and individual state demand across the scenarios. The bars at the right in these figures show the relative contribution of each demand category to the total Colorado River demand at a point in time (2015, 2035, or 2060) in the Current Projected (A) scenario. In general, the category proportions remain relatively consistent across the scenarios.
As described in the Quantification Approach, the scenario quantification approach entailed first quantifying the changes in parameters, such as population and agricultural acreage, and then using these quantified parameters to compute demand. For the purposes of the Study, the resulting demand was not limited by the Colorado River Compact apportionments. In this way the demand for Colorado River and tributary water were assessed in the context of overall Study Area demand and supplies available from other sources.
As shown in figure C-9, the change in both magnitude and percentage of Colorado River demand varies considerably across the states. Colorado and Arizona show the greatest magnitude of overall growth in Colorado River demand from 2015 to 2060 across the scenarios, ranging between about a 0.2 to 1.2 maf increase by 2060 in Arizona and 0.14 to 0.64 maf in Colorado. The broad demand range across scenarios in these states is attributable to substantial growth in M&I demand, particularly in central Arizona and the Front Range of Colorado. Increase in tribal demand is also a significant contributor to the increases in Arizona. Demand in Nevada and California is projected to grow by about 0.2 to 0.35 maf primarily as the result of population growth. Demand in New Mexico, Utah, and Wyoming grows by about 0.1 to 0.2 maf under most scenarios. However, under the Rapid Growth (C1) scenario the growth is about 0.3 maf and 0.4 maf in Utah and New Mexico, respectively. This additional growth in Utah is driven by a projected increase in population of nearly 4 million and per capita water use reductions not fully offsetting the rapid growth. In New Mexico, this growth is driven by population growth and tribal demands.

Colorado River Basin Water Supply and Demand Study
C-24 December 2012
FIGURE C-7 Study Area, Colorado River, and Change in Colorado River Demand
0
5
10
15
20
25
30
35
2015 2035 2060
Mill
ion
Acre
-Fee
t
Study Area Demand(demands do not include Mexico's allotment, reservoir evaporation, and other losses)
12.0
12.5
13.0
13.5
14.0
14.5
15.0
15.5
16.0
16.5
2015 2035 2060
Mill
ion
Acre
-Fee
t
Colorado River Demand(demands do not include Mexico's allotment, reservoir evaporation, and other losses)
Colorado River Demandshown with solid color
Demands that may be met by Other Supplies shownwith off-white and colored border
-1.0
0.0
1.0
2.0
3.0
4.0
5.0
2015 2035 2060
Mill
ion-
Acre
Feet
Change in Colorado River Demand, from 2015(demands do not include Mexico's allotment, reservoir evaporation, and other losses)
Agricultural
Municipal and Industrial
Energy
Minerals
Fish and Wildlife and RecreationTribal
Net Change
0123456
KAF
Current Projected (A)Slow Growth (B)Rapid Growth (C1)Rapid Growth (C2)Enhanced Environment (D1)Enhanced Environment (D2)
0123456
KAF
Current Projected (A)Slow Growth (B)Rapid Growth (C1)Rapid Growth (C2)Enhanced Environment (D1)Enhanced Environment (D2)
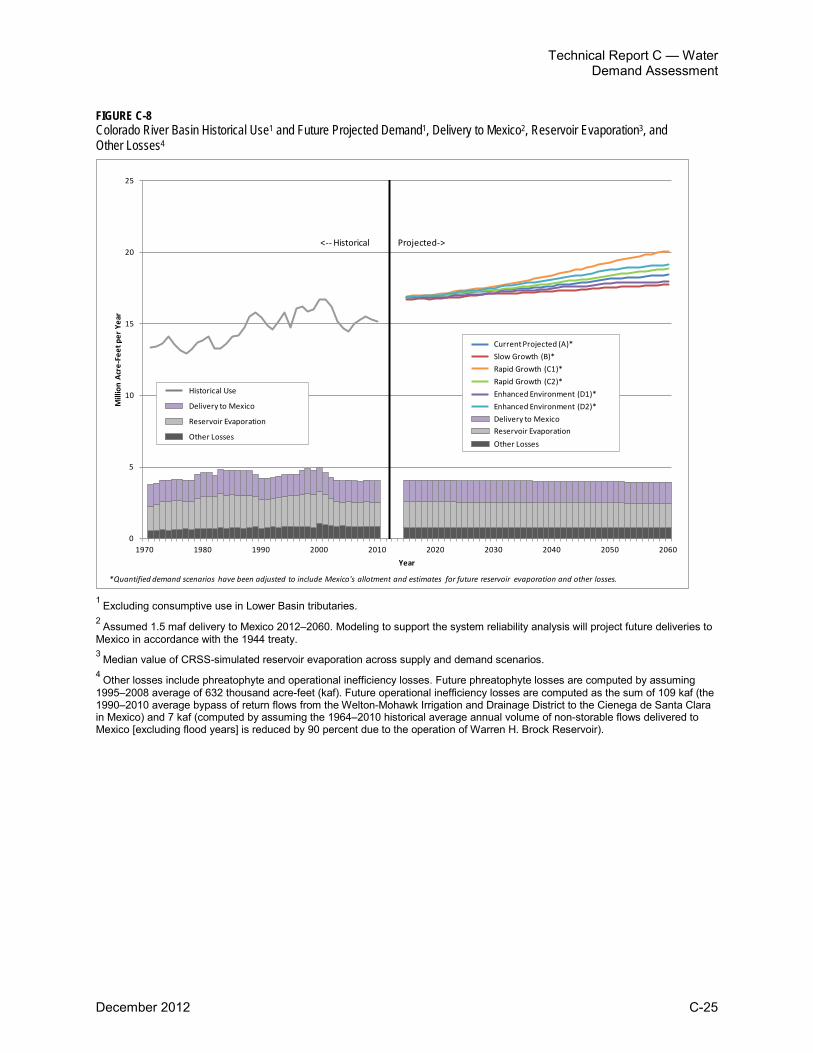
Technical Report C — Water Demand Assessment
December 2012 C-25
FIGURE C-8 Colorado River Basin Historical Use1 and Future Projected Demand1, Delivery to Mexico2, Reservoir Evaporation3, and Other Losses4
1 Excluding consumptive use in Lower Basin tributaries. 2 Assumed 1.5 maf delivery to Mexico 2012–2060. Modeling to support the system reliability analysis will project future deliveries to Mexico in accordance with the 1944 treaty. 3 Median value of CRSS-simulated reservoir evaporation across supply and demand scenarios. 4 Other losses include phreatophyte and operational inefficiency losses. Future phreatophyte losses are computed by assuming 1995–2008 average of 632 thousand acre-feet (kaf). Future operational inefficiency losses are computed as the sum of 109 kaf (the 1990–2010 average bypass of return flows from the Welton-Mohawk Irrigation and Drainage District to the Cienega de Santa Clara in Mexico) and 7 kaf (computed by assuming the 1964–2010 historical average annual volume of non-storable flows delivered to Mexico [excluding flood years] is reduced by 90 percent due to the operation of Warren H. Brock Reservoir).
0
5
10
15
20
25
1970 1980 1990 2000 2010 2020 2030 2040 2050 2060
Mill
ion
Acre
-Fee
t per
Yea
r
Year
<-- Historical Projected->
*Quantified demand scenarios have been adjusted to include Mexico's allotment and estimates for future reservoir evaporation and other losses.
Historical Use
Delivery to Mexico
Reservoir Evaporation
Other Losses
Current Projected (A)*
Delivery to MexicoReservoir EvaporationOther Losses
Slow Growth (B)*Rapid Growth (C1)*Rapid Growth (C2)*Enhanced Environment (D1)*Enhanced Environment (D2)*

Colorado River Basin Water Supply and Demand Study
C-26 December 2012
FIGURE C-9 Colorado River Water Demand1,2
1 Demands do not include Mexico’s allotment and losses such as reservoir evaporation. These factors will be included in the modeling supporting the system reliability analysis. 2 Tribal demand in Colorado, at the request of the Southern Ute Indian and Ute Mountain Ute tribes, is not separated from other categories in the state.
AgriculturalMunicipal and IndustrialEnergyMineralsFish and Wildlife and RecreationTribal
Category Legend (Right)
0123456
2015 2035 2060
KAF
Demand Legend
Current Projected (A) Slow Growth (B)
Rapid Growth (C1) Rapid Growth (C2)
Enhanced Environment (D1) Enhanced Environment (D2)
0.0
2.0
4.0
6.0
8.0
10.0
12.0
2015 2035 2060
MAF
Lower Basin
Trib
al
Trib
al
Trib
al
Mun
icip
al a
nd In
dust
rial
Mun
icip
al a
nd In
dust
rial
Mun
icip
al a
nd In
dust
rial
Agric
ultu
ral
Agric
ultu
ral
Agric
ultu
ral
2015
2035
2060
0.0
2.0
4.0
6.0
8.0
10.0
12.0
2015 2035 2060
MAF
Upper Basin
0.01.02.03.04.0
2015 2035 2060
MAF
Utah
0.01.02.03.04.0
2015 2035 2060
MAF
Nevada
0.01.02.03.04.05.06.0
2015 2035 2060
MAF
California
0.01.02.03.04.0
2015 2035 2060
MAF
New Mexico
0.01.02.03.04.0
2015 2035 2060
MAF
Colorado
0.01.02.03.04.0
2015 2035 2060
MAF
Wyoming
0.01.02.03.04.05.0
2015 2035 2060
MAF
Arizona
12.0
12.5
13.0
13.5
14.0
14.5
15.0
15.5
16.0
16.5
2015 2035 2060
Mill
ion
Acre
-Fee
t (M
AF)
Colorado River Demand
UPPER BASIN
LOWER BASIN

Technical Report C — Water Demand Assessment
December 2012 C-27
FIGURE C-10 Colorado River Water Demand by Category1,2
1 Demands do not include Mexico’s allotment and losses such as reservoir evaporation. These factors will be included in the modeling supporting the system reliability analysis. 2 Tribal demand in Colorado, at the request of the Southern Ute Indian and Ute Mountain Ute tribes, is not separated from other categories in the state.
0
2
4
6
8
10
12
MAF
Upper Basin
2015 2035 20600
2
4
6
8
10
12
MAF
Lower Basin
2015 2035 2060
0.0
1.0
2.0
3.0
4.0
MAF
Utah
2015 2035 2060
0.0
1.0
2.0
3.0
4.0
MAF
Nevada
2015 2035 2060
0.0
1.0
2.0
3.0
4.0
5.0
6.0
MAF
California
2015 2035 2060
0.0
1.0
2.0
3.0
4.0
5.0
MAF
Arizona
2015 2035 2060
0.0
1.0
2.0
3.0
4.0
MAF
New Mexico
2015 2035 2060
0.0
1.0
2.0
3.0
4.0
MAF
Colorado
2015 2035 2060
0.0
1.0
2.0
3.0
4.0
MAF
Wyoming
2015 2035 2060
Agricultural Municipal and Industrial
Energy Minerals
Fish and Wildlife and Recreation Tribal
0.0
2.0
4.0
6.0
8.0
10.0
12.0
14.0
16.0
18.0
Mill
ion
Acre
-Fee
t (M
AF)
Colorado River Demand
2015 2035 2060
Trib
alTr
ibal
Trib
al
Mun
icip
al a
nd In
dust
rial
Mun
icip
al a
nd In
dust
rial
Mun
icip
al a
nd In
dust
rial
Agric
ultu
ral
Agric
ultu
ral
Agric
ultu
ral
2015
2035
2060
Six columns per time period represent six scenarios. From left to right: A, B, C1, C2, D1, D2
UPPER BASIN
LOWER BASIN
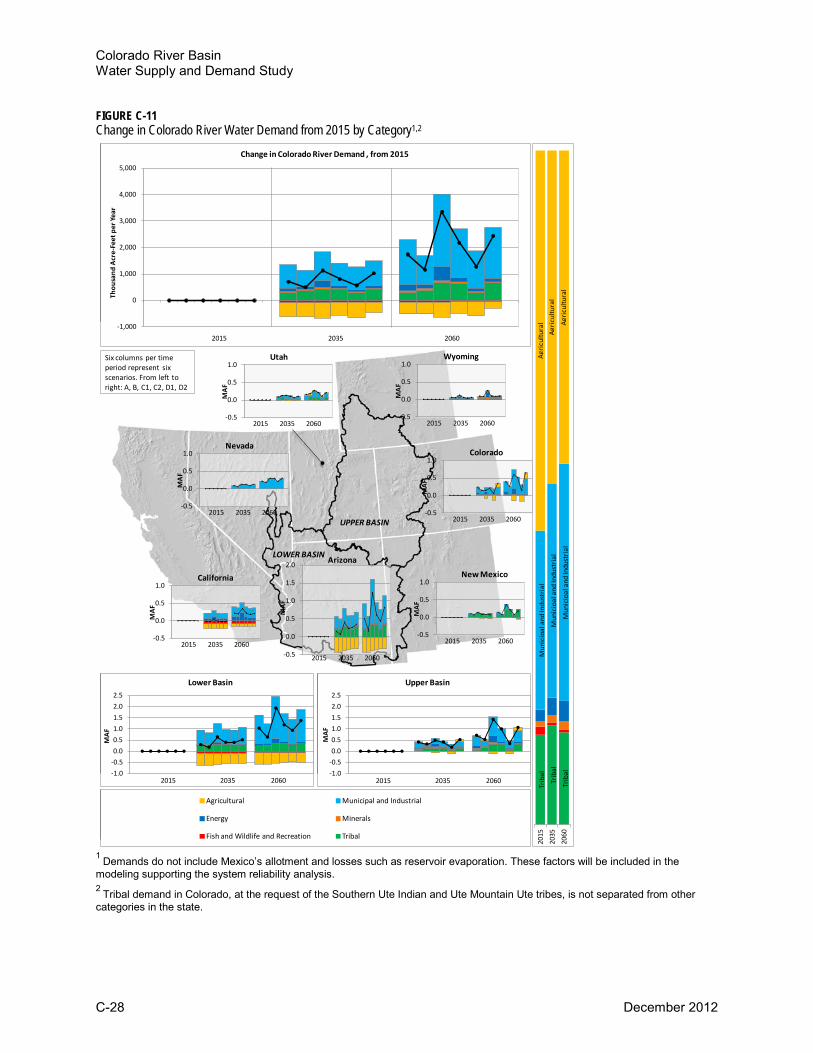
Colorado River Basin Water Supply and Demand Study
C-28 December 2012
FIGURE C-11 Change in Colorado River Water Demand from 2015 by Category1,2
1 Demands do not include Mexico’s allotment and losses such as reservoir evaporation. These factors will be included in the modeling supporting the system reliability analysis. 2 Tribal demand in Colorado, at the request of the Southern Ute Indian and Ute Mountain Ute tribes, is not separated from other categories in the state.
-1.0-0.50.00.51.01.52.02.5
MAF
Upper Basin
2015 2035 2060-1.0-0.50.00.51.01.52.02.5
MAF
Lower Basin
2015 2035 2060
-0.5
0.0
0.5
1.0
MAF
Utah
2015 2035 2060
-0.5
0.0
0.5
1.0
MAF
Nevada
2015 2035 2060
-0.5
0.0
0.5
1.0
MAF
California
2015 2035 2060-0.5
0.0
0.5
1.0
1.5
2.0
MAF
Arizona
2015 2035 2060
-0.5
0.0
0.5
1.0
MAF
New Mexico
2015 2035 2060
-0.5
0.0
0.5
1.0
MAF
Colorado
2015 2035 2060
-0.5
0.0
0.5
1.0
MAF
Wyoming
2015 2035 2060
-1,000
0
1,000
2,000
3,000
4,000
5,000
Thou
sand
Acr
e-Fe
et p
er Ye
ar
Change in Colorado River Demand , from 2015
2015 2035 2060
Trib
alTr
ibal
Trib
al
Mun
icip
al a
nd In
dust
rial
Mun
icip
al a
nd In
dust
rial
Mun
icip
al a
nd In
dust
rial
Agric
ultu
ral
Agric
ultu
ral
Agric
ultu
ral
2015
2035
2060
Six columns per time period represent six scenarios. From left to right: A, B, C1, C2, D1, D2
Agricultural Municipal and Industrial
Energy Minerals
Fish and Wildlife and Recreation Tribal
UPPER BASIN
LOWER BASIN

Technical Report C — Water Demand Assessment
December 2012 C-29
When demand by category is examined in figure C-10, the contribution of demand by category across the Upper and Lower Basins vary, with nearly equal agricultural and M&I demand in the Lower Basin and nearly two-thirds of the demand in the Upper Basin from agriculture. The category contribution to the total demand varies considerably across states as well, with no two states having comparable proportions of categories.
Figure C-11 shows the change in Colorado River demand by category from 2015 for each scenario. In most scenarios, the M&I demand is the major driver contributing to future growth in demand. However, the M&I demand does not increase as significantly in the Slow Growth (B) or Enhanced Environment (D1) scenarios where either population growth is reduced or per capita water use is assumed to be substantially decreased, respectively. Tribal, energy, and minerals demands are also projected to increase in all scenarios, while Basin-wide reductions in agricultural demand are projected. The Upper Basin generally shows growth in all categories but is dominated by demand growth in the M&I category, while the Lower Basin shows dramatic growth in M&I demand (in most scenarios) and a significant reduction of agricultural demand. The reduction in fish and wildlife demand in the Lower Basin is caused by the cessation of mitigation water provided to the Salton Sea in California in accordance with the Colorado River Water Delivery Agreement8 (CRWDA), approved in 2003.
4.4 Colorado River Water Demand by Category 4.4.1 Agriculture Agricultural water demand is primarily driven by the extent of irrigated acreage and per-acre water delivery. Per-acre water delivery is the amount of water diverted per irrigated acre and includes components such as transmission and delivery losses (surface evaporation, riparian demand, and seepage), and on-farm losses that are made up of evaporation, tail water (return), and crop irrigation requirements. Each of these factors varies by location (precipitation, growing season, etc.), irrigation method, and crop type.
Figure C-10 shows the demand by category and depicts the relative magnitude of the agricultural demand. Figure C-12 presents the change in agricultural demand for the Study Area, by Upper and Lower Basin, and by state. The figure also shows agricultural demand as a proportion of the total Colorado River water demand (right hand stacked bar graph).
As can be seen from figure C-10 and figure C-12, agricultural water demand is the largest component of Colorado River demand. Demand for agricultural uses decreases through 2060 for all scenarios, dropping from about 57 percent in 2015 to between 41 and 49 percent of Colorado River demand in 2060, depending on the scenario. The reduction in the percentage contribution of agricultural demand results from both a decrease in the magnitude of agricultural water demand and increases in the magnitude of other categories of demand. The overall decrease is almost entirely due to a reduction in irrigated acreage, as per-acre delivery shows slight increases across all scenarios.
8 Colorado River Water Delivery Agreement: Federal Quantification Settlement Agreement for Purposes of Section 5(B) of Interim Surplus
Guidelines, October 10, 2003 (69 Federal Register 12202, March 15, 2004)

Colorado River Basin Water Supply and Demand Study
C-30 December 2012
FIGURE C-12 Change in Colorado River Water Demand for Agriculture
-0.6-0.5-0.4-0.3-0.2-0.10.00.10.2
2015 2035 2060
MAF
Lower Basin
2015
2035
2060
-0.6-0.5-0.4-0.3-0.2-0.10.00.10.2
2015 2035 2060
MAF
Upper Basin
-0.6-0.4-0.20.00.2
2015 2035 2060
MAF
Utah
-0.6-0.4-0.20.00.2
2015 2035 2060
MAF
Nevada
-0.6-0.4-0.20.00.2
2015 2035 2060
MAF
California
-0.6-0.4-0.20.00.2
2015 2035 2060
MAF
New Mexico
-0.6-0.4-0.20.00.2
2015 2035 2060
MAF
Colorado
-0.6-0.4-0.20.00.2
2015 2035 2060
MAF
Wyoming
-0.6-0.4-0.20.00.2
2015 2035 2060
MAF
Arizona
A
A
B
B
C1 C1
C2
C2
D1
D1
D2
D2
-0.7
-0.6
-0.5
-0.4
-0.3
-0.2
-0.1
0.0
2015 2035 2060
Mill
ion
Acre
-Fee
t (M
AF)
Change in Colorado River Demand, From 2015Agricultural
Agric
ultu
re is
55
-57%
of C
olor
ado
Rive
r dem
and*
Agric
ultu
re is
47
-51%
of C
olor
ado
Rive
r dem
and*
Agric
ultu
re is
41
-49%
of C
olor
ado
Rive
r dem
and*
Agricultural Municipal and Industrial
Energy Minerals
Fish and Wildlife and Recreation Tribal
LegendCategory Plot (Right)
UPPER BASIN
LOWER BASIN
N/A
Six columns per time period represent six scenarios. From left to right: A, B, C1, C2, D1, D2
*Percentages shown represent the range across scenarios
Technical Report C — Water Demand Assessment
December 2012 C-31
Agricultural demand decreases over time in the Lower Basin, but exhibits some increases in the Upper Basin in several scenarios. For the Lower Basin states, most of the decrease in agricultural demand occurs in Arizona, with a small amount of reduction in demand in California across all scenarios. Nevada does not report any agricultural use in any scenario. In the Upper Basin, an increase in agricultural demand occurs in most states. Increases in projected agricultural demand in Colorado have the greatest magnitude and are the most notable in the Enhanced Environment (D2) scenario; however, decreases occur in several other scenarios due to assumed decreases in future irrigated acreage. Slight increases in agricultural demand are projected in most scenarios in Utah and Wyoming. New Mexico agricultural demand ranges from no change to a nominal decrease.
A strong driver for loss of agricultural acreage is urbanization, leading to physical loss of acreage and pressure for transfer of water. These factors are particularly important in Colorado and Arizona. Utah and Wyoming are continuing to actively develop agricultural lands under existing plans.
4.4.2 Municipal and Industrial M&I water demand was estimated from population and per capita water use, with the addition of SSI demand. The per capita water use is a measure of the amount of water produced or diverted per person in a given municipality or service area. Because this measure examines all water produced by a given municipality or service area, it often includes industrial, commercial, and institutional demand as well as residential demand. A number of factors may influence the M&I water use of a given community, including the amount of industrial demand, climate, number of institutional facilities, accounting method for reuse, demographics, economic conditions, and number of visitors. These factors make comparisons among different locations challenging.
The SSI demand represents the demand of industries in a given area that have independent water supply systems. Because these industries have water supplies independent from the urban areas, the demand is not directly related to population and per capita water use rates assumed for most M&I demand projections.
Figure C-10 shows the demand by category and depicts the relative magnitude of the M&I demand. Figure C-13 presents the change in M&I demand for the Study Area, by Upper and Lower Basin, and by state. The figure also shows the M&I demand as a proportion of the total Colorado River water demand (right hand stacked bar graph).
As can be seen from figure C-10 and figure C-13, M&I water demand is the second largest component of Colorado River demand. The M&I demand increases over the Study period for all scenarios, from about 27 percent in 2015 to between 33 and 38 percent of total Colorado River demand in 2060, depending on the scenario. The increase is primarily due to population increase because per capita water use is projected to decrease over time across all scenarios. The SSI demand is less than 10 percent of total M&I demand.

Colorado River Basin Water Supply and Demand Study
C-32 December 2012
FIGURE C-13 Change in Colorado River Water Demand for Municipal and Industrial
0.0
0.5
1.0
1.5
2.0
2015 2035 2060
MAF
Lower Basin
2015
2035
2060
0.0
0.5
1.0
1.5
2.0
2015 2035 2060
MAF
Upper Basin
-0.50.00.51.01.5
2015 2035 2060
MAF
Utah
-0.50.00.51.01.5
2015 2035 2060
MAF
Nevada
-0.50.00.51.01.5
2015 2035 2060
MAF
California
-0.50.00.51.01.5
2015 2035 2060
MAF
New Mexico
-0.50.00.51.01.5
2015 2035 2060
MAF
Colorado
-0.50.00.51.01.5
2015 2035 2060
MAF
Wyoming
-0.5
0.0
0.5
1.0
1.5
2015 2035 2060
MAF
Arizona
A
A
B
BC1
C1
C2
C2
D1
D1
D2
D2
0.0
0.5
1.0
1.5
2.0
2.5
3.0
2015 2035 2060
Mill
ion
Acre
-Fee
t (M
AF)
Change in Colorado River Demand, From 2015Municipal and Industrial
M&
I is 2
7% o
f Col
orad
o Ri
ver d
eman
d*
M&
I is 3
1 -3
2% o
f Col
orad
o Ri
ver d
eman
d*
M&
I is 3
3 -3
8% o
f Col
orad
o Ri
ver d
eman
d*
Agricultural Municipal and Industrial
Energy Minerals
Fish and Wildlife and Recreation Tribal
LegendCategory Plot (Right)
UPPER BASIN
LOWER BASIN
Six columns per time period represent six scenarios. From left to right: A, B, C1, C2, D1, D2
*Percentages shown represent the range across scenarios

Technical Report C — Water Demand Assessment
December 2012 C-33
The M&I demand for Colorado River water increases over the Study period in both the Upper and Lower Basin, with about 19 to 33 percent of the increase occurring in the Upper Basin and 67 to 81 percent of the increase occurring in the Lower Basin. In the Upper Basin, most of the increase in M&I demand for Colorado River water is due to projected population growth in the state of Colorado. The remaining increase in Upper Basin M&I demand is primarily in New Mexico and Utah, with only small increases in Wyoming. In the Lower Basin, about 50 percent of the increase in M&I demand occurs in Arizona, with the remaining 50 percent split between California and Nevada across all scenarios.
Population is the most significant driver for increases in M&I demands. In the scenarios, per capita water use rates are projected to decrease in six of the seven Basin States and partially attenuate demand growth due to population increases alone. Per capita water use rates decrease in all states except in Wyoming, where rates are projected to increase slightly due to urbanization of rural areas.
4.4.3 Energy Water demand for energy includes anticipated growth in most types of power generation and associated technologies, including thermoelectric, solar, geothermal, and oil shale. Water demand for energy uses can be estimated through known plans for new power plants or through applying a per capita energy water use factor. Power facilities, however, often serve areas remote from their locations and therefore potentially represent exports or imports of energy and water from the Study Area to meet these distributed needs. Therefore, while the link between population and energy demand exists, the effects on energy water demands are not always experienced in the same planning areas as the growth.
Figure C-10 shows the demand by category and depicts the relative magnitude of the energy water demand. Figure C-14 presents the change in energy demand for the Study Area, by Upper and Lower Basin, and by state. The figure also shows the energy demand as a proportion of the total Colorado River water demand (right hand stacked bar graph).
As can be seen from figure C-10 and figure C-14, energy water demand is a small fraction of total Colorado River demand. The water demand for energy is projected to increase over the Study period in all scenarios and in both the Upper and Lower Basins. The water demand for energy increases from about 1.7 percent of the total demand in 2015 to between 2.3 and 4.6 percent of total demand in 2060, depending on the scenario. Between 31 and 56 percent of the increase in water demand for energy occurs in the Upper Basin and between 44 and 69 percent of the increase occurs in the Lower Basin. In the Upper Basin, between about 50 to 80 percent of the increase in energy demand over time is due to increases in Colorado, with the remaining increase in demand primarily split between Wyoming and Utah. In the Upper Basin, increases are due to expansion of thermoelectric power plants and oil shale production. In the Lower Basin, virtually all of the growth in water demand for energy occurs in California due to projected expansion of geothermal and solar projects. Projected increases in water demands for energy in Arizona represent only about 1 percent of the Lower Basin increase, and Nevada does not report any water demand for energy use in any of the scenarios. In general, most states have some portion of imported and exported electrical supply. Likewise, significant hydroelectric production capacity along the mainstem mitigates typical water demand for energy production.
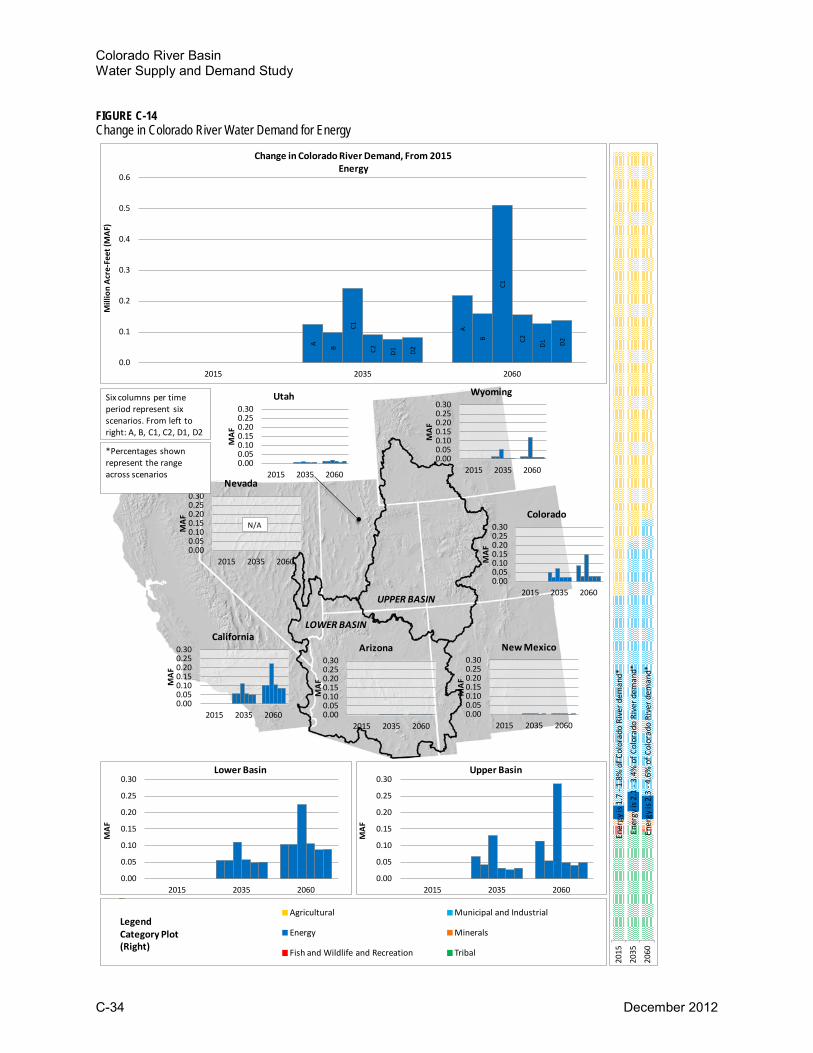
Colorado River Basin Water Supply and Demand Study
C-34 December 2012
FIGURE C-14 Change in Colorado River Water Demand for Energy
0.00
0.05
0.10
0.15
0.20
0.25
0.30
2015 2035 2060
MAF
Lower Basin
2015
2035
2060
0.00
0.05
0.10
0.15
0.20
0.25
0.30
2015 2035 2060
MAF
Upper Basin
0.000.050.100.150.200.250.30
2015 2035 2060
MAF
Utah
0.000.050.100.150.200.250.30
2015 2035 2060
MAF
Nevada
0.000.050.100.150.200.250.30
2015 2035 2060
MAF
California
0.000.050.100.150.200.250.30
2015 2035 2060
MAF
New Mexico
0.000.050.100.150.200.250.30
2015 2035 2060
MAF
Colorado
0.000.050.100.150.200.250.30
2015 2035 2060
MAF
Wyoming
0.000.050.100.150.200.250.30
2015 2035 2060
MAF
Arizona
A
A
B
B
C1
C1
C2
C2
D1
D1
D2
D2
0.0
0.1
0.2
0.3
0.4
0.5
0.6
2015 2035 2060
Mill
ion
Acre
-Fee
t (M
AF)
Change in Colorado River Demand, From 2015Energy
Ener
gy is
1.7
-1.
8% o
f Col
orad
o Ri
ver d
eman
d*
Ener
gy is
2.1
-3.
4% o
f Col
orad
o Ri
ver d
eman
d*
Ener
gy is
2.3
-4.
6% o
f Col
orad
o Ri
ver d
eman
d*
Agricultural Municipal and Industrial
Energy Minerals
Fish and Wildlife and Recreation Tribal
LegendCategory Plot (Right)
UPPER BASIN
LOWER BASIN
N/A
Six columns per time period represent six scenarios. From left to right: A, B, C1, C2, D1, D2
*Percentages shown represent the range across scenarios
Technical Report C — Water Demand Assessment
December 2012 C-35
4.4.4 Minerals Water demand for mineral production was estimated through existing uses and known plans for mineral extraction in the Study Area. Water demand for mineral production varies considerably across the Study Area and can fluctuate significantly based on market prices for a given product.
Figure C-10 shows the demand by category and depicts the relative magnitude of the mineral water demand. Figure C-15 presents the change in mineral demand for the Study Area, by Upper and Lower Basin, and by state. The figure also shows mineral demand as a proportion of the total Colorado River water demand (right hand stacked bar graph).
As can be seen from figure C-10 and figure C-15, water demand for mineral extraction is a small fraction (less than 200,000 acre-feet per year [afy] Basin-wide) of the total Colorado River demand It increases from about 0.7 percent in 2015 to between 0.9 and 1.3 percent of Colorado River demand in 2060, depending on the scenario. The water demand for mineral extraction increases for all scenarios and in both the Upper and Lower Basins. Similar increases in demand occur in the Upper and Lower Basins for Rapid Growth (C2) and Enhanced Environment (D1 and D2) scenarios between 2015 and 2060. Greater increases in demand occur in the Upper Basin for Current Projected (A), Slow Growth (B), and Rapid Growth (C1) scenarios due to technology adoption assumptions.
All increases in water demand for mineral production are due to increases in Colorado, Wyoming, and Arizona.
4.4.5 Fish, Wildlife, and Recreation Water demand for fish, wildlife, and recreation was estimated from existing agreements or known consumptive uses associated with this demand category. The demands in this category largely represent water needs for wildlife refuges, fish hatcheries, recreational facilities, and obligations for water delivery to the Salton Sea under the CRWDA. In the Lower Basin, the Cibola National Wildlife Refuge (NWR), Imperial NWR, Havasu NWR, and Lake Mead National Recreation Area have consumptive water rights and largely comprise the fish, wildlife, and recreation demand in the Lower Basin. Non-consumptive demands associated with fish, wildlife, and recreations, including in-stream flow requirements are represented through the metrics portion of the Study as presented in Technical Report D – System Reliability Metrics.
Figure C-10 shows the demand by category and depicts the relative magnitude of the fish, wildlife, and recreation water demand. Figure C-16 presents the change in fish, wildlife, and recreation demand for the Study Area, by Upper and Lower Basin, and by state. The figure also shows the fish, wildlife, and recreation demand as a proportion of the total Colorado River water demand (right hand stacked bar graph).
As can be seen from figure C-10 and figure C-16, fish, wildlife, and recreation water demand is a small fraction of Colorado River demand, and decreases from about 1.4 percent in 2015 to about 0.4 to 1 percent of Colorado River demand in 2060 across all scenarios. The overall decrease in demand for Colorado River water for fish, wildlife, and recreation is driven by the terms of Exhibit B of the CRWDA, which phases out Salton Sea delivery obligations over time. As such, the change in demand is a result of the termination of a regulatory settlement, rather than a regional depiction of reductions in water allocated for fish, wildlife, and recreation demands.

Colorado River Basin Water Supply and Demand Study
C-36 December 2012
FIGURE C-15 Change in Colorado River Water Demand for Mineral Production
0.00
0.02
0.04
0.06
0.08
0.10
2015 2035 2060
MAF
Lower Basin
2015
2035
2060
0.00
0.02
0.04
0.06
0.08
0.10
2015 2035 2060
MAF
Upper Basin
0.00
0.02
0.04
0.06
2015 2035 2060
MAF
Utah
0.00
0.02
0.04
0.06
2015 2035 2060
MAF
Nevada
0.00
0.02
0.04
0.06
2015 2035 2060
MAF
California
0.00
0.02
0.04
0.06
2015 2035 2060
MAF
New Mexico
0.00
0.02
0.04
0.06
2015 2035 2060
MAF
Colorado
0.00
0.02
0.04
0.06
2015 2035 2060
MAF
Wyoming
0.00
0.02
0.04
0.06
2015 2035 2060
MAF
Arizona
A
A
B
B
C1
C1
C2
C2
D1
D1
D2
D2
0.00
0.02
0.04
0.06
0.08
0.10
0.12
2015 2035 2060
Mill
ion
Acre
-Fee
t (M
AF)
Change in Colorado River Demand, From 2015Minerals
Min
eral
s is 0
.7 -
0.8%
of C
olor
ado
Rive
r dem
and*
Min
eral
s is 1
-1.
3% o
f Col
orad
o Ri
ver d
eman
d*
Min
eral
s is 0
.9 -
1.3%
of C
olor
ado
Rive
r dem
and*
Agricultural Municipal and Industrial
Energy Minerals
Fish and Wildlife and Recreation Tribal
LegendCategory Plot (Right)
UPPER BASIN
LOWER BASIN
Six columns per time period represent six scenarios. From left to right: A, B, C1, C2, D1, D2
N/A
N/A
N/A
N/A
*Percentages shown represent the range across scenarios

Technical Report C — Water Demand Assessment
December 2012 C-37
FIGURE C-16 Change in Colorado River Water Demand for Fish, Wildlife, and Recreation
-0.12-0.10-0.08-0.06-0.04-0.020.000.020.04
2015 2035 2060
MAF
Lower Basin
2015
2035
2060
-0.12-0.10-0.08-0.06-0.04-0.020.000.020.04
2015 2035 2060
MAF
Upper Basin
-0.12-0.08-0.040.000.04
2015 2035 2060
MAF
Utah
-0.12-0.08-0.040.000.04
2015 2035 2060
MAF
Nevada
-0.12-0.08-0.040.000.04
2015 2035 2060
MAF
California
-0.12-0.08-0.040.000.04
2015 2035 2060
MAF
New Mexico
-0.12-0.08-0.040.000.04
2015 2035 2060
MAF
Colorado
-0.12-0.08-0.040.000.04
2015 2035 2060
MAF
Wyoming
-0.12-0.08-0.040.000.04
2015 2035 2060
MAF
Arizona
A
A
B
B
C1
C1C2
C2
D1
D1
D2
D2
-0.10
-0.09
-0.08
-0.07
-0.06
-0.05
-0.04
-0.03
-0.02
-0.01
0.00
2015 2035 2060
Mill
ion
Acre
-Fee
t (M
AF)
Change in Colorado River Demand, From 2015Fish, Wildlife, and Recreation
Fish
, Wild
life,
& R
ecre
atio
n is
1.2
-1.7
% o
f Col
orad
o Ri
ver d
eman
d*
Fish
, Wild
life,
& R
ecre
atio
n is
0.4
-0.9
% o
f Col
orad
o Ri
ver d
eman
d*
Fish
, Wild
life,
& R
ecre
atio
n is
0.4
-1%
of C
olor
ado
Rive
r dem
and*
Agricultural Municipal and Industrial
Energy Minerals
Fish and Wildlife and Recreation Tribal
LegendCategory Plot (Right)
UPPER BASIN
LOWER BASIN
Six columns per time period represent six scenarios. From left to right: A, B, C1, C2, D1, D2
No Change
No Change
N/A
N/A
N/A*Percentages shown represent the range across scenarios

Colorado River Basin Water Supply and Demand Study
C-38 December 2012
Fish, wildlife, and recreation demand increases over time in the Upper Basin and decreases over time in the Lower Basin. The Upper Basin makes up about 30 percent of the fish, wildlife, and recreation demand in 2060, with the Lower Basin making up about 70 percent of demand. In the Upper Basin, all of the increase in fish, wildlife, and recreation water demand over time is due to increases in this category in Wyoming. Wyoming provides water for a number of wildlife refuges. Colorado, New Mexico, and Utah do not report any fish, wildlife, and recreation consumptive use in any of the scenarios. In the Lower Basin, all of the decrease in fish, wildlife, and recreation demand occurs in California. Arizona includes fish, wildlife, and recreation demand that varies by scenario but is constant over time. Nevada includes small fish, wildlife, and recreation demand that is constant over time and across scenarios.
4.4.6 Tribal Tribal water demand in the Study is largely based on the quantified rights and entitlements of tribes to Colorado River water as well as their anticipated future rate of use and development. A number of tribes in the Basin have unquantified rights and claims (Navajo Nation, Ute Mountain Ute Tribe, Havasupai Tribe, Hopi Tribe, Hualapai Tribe, Kaibab Band of Paiute Indians, Pascua Yaqui Tribe, San Carlos Apache Tribe, San Juan Southern Paiute Tribe, Tohono O’odham Nation, Tonto Apache Tribe, and Yavapai-Apache Nation), and although the demand for this water will be a factor impacting Basin-wide water availability, specific, reliable numbers are not presently available due to their unresolved status.
For the Study, tribes with quantified rights to Colorado River water were organized into three categories, presented in table C-5, based on location: Upper Colorado River Basin tribes, Lower Colorado River Mainstem tribes, and tribes served by water provided through the CAP. Figure C-17 displays the lands in the hydrologic Basin where tribes have rights or claims to Colorado River water.
Figure C-18 summarizes Basin-wide, by Upper and Lower Basins, and by state, both the quantified Colorado River rights held by tribes as well as the tribal demand as a portion of those rights. Tables C-6 and C-7 present, by state, tribal diversion, depletion, and acreage entitlement as appropriate, as well as 2015, 2035, and 2060 projected tribal diversion and depletion, along with total state depletion under each scenario. It is important to note that in figure C-18 both tribal demand and rights are presented in terms of diversion and not depletion. This presentation was chosen to facilitate a comparison between demand and quantified rights for the mainstem tribes in the Lower Basin whose rights are quantified in terms of diversion entitlements. For a more detailed description of the rights and demands by tribe, see appendix C9.
As seen in figure C-18, quantified tribal diversion rights comprise about 2.9 maf in the Basin, with about 1.36 maf of those rights in the Upper Basin and 1.58 maf in the Lower Basin. Quantified tribal rights are assumed to not vary by scenario or throughout the Study period. The majority of quantified rights are within Arizona, totaling approximately 1.4 maf. Tribal demands in Colorado, at the request of the Southern Ute Indian and Ute Mountain Ute Tribes, are not broken out from other categories in the state. Consequently, only the quantified right for these tribes (not the demand) is shown in these figures. There are no tribal rights or claims to Colorado River water in Wyoming. The figure also shows the tribal demand in terms of depletion as a proportion of the total Colorado River demand (right hand stacked bar graph).
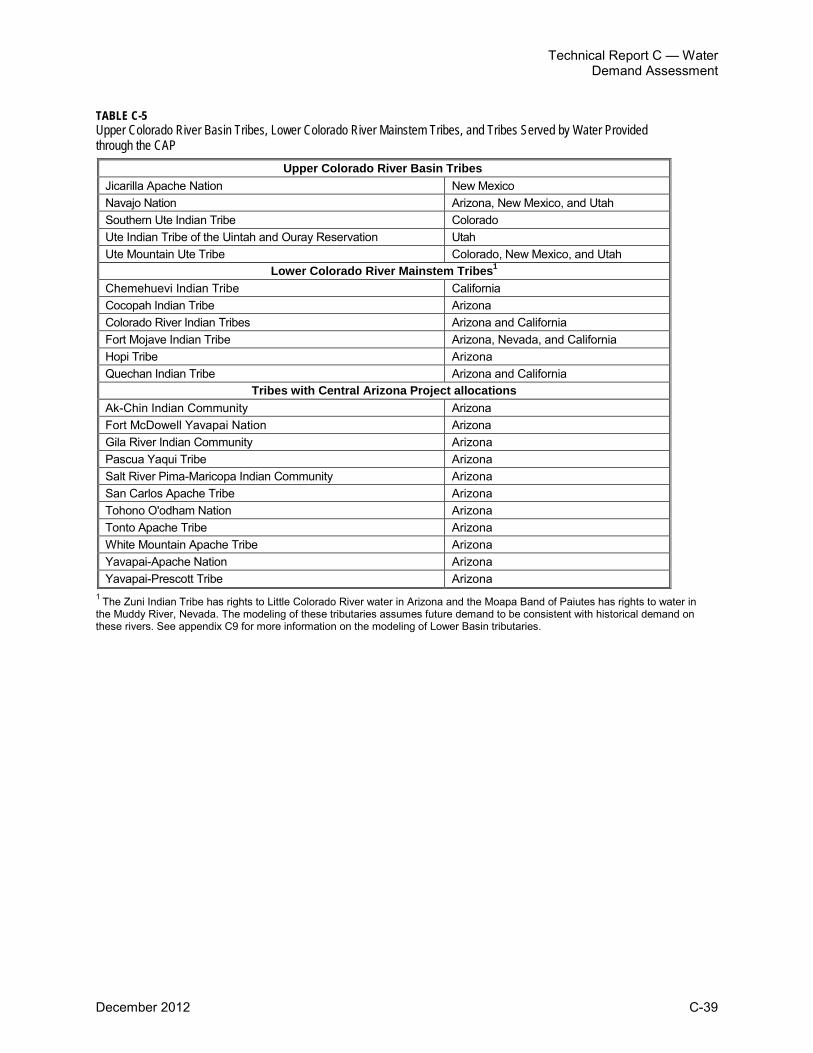
Technical Report C — Water Demand Assessment
December 2012 C-39
TABLE C-5 Upper Colorado River Basin Tribes, Lower Colorado River Mainstem Tribes, and Tribes Served by Water Provided through the CAP
Upper Colorado River Basin Tribes Jicarilla Apache Nation New Mexico Navajo Nation Arizona, New Mexico, and Utah Southern Ute Indian Tribe Colorado Ute Indian Tribe of the Uintah and Ouray Reservation Utah Ute Mountain Ute Tribe Colorado, New Mexico, and Utah
Lower Colorado River Mainstem Tribes1 Chemehuevi Indian Tribe California Cocopah Indian Tribe Arizona Colorado River Indian Tribes Arizona and California Fort Mojave Indian Tribe Arizona, Nevada, and California Hopi Tribe Arizona Quechan Indian Tribe Arizona and California
Tribes with Central Arizona Project allocations Ak-Chin Indian Community Arizona Fort McDowell Yavapai Nation Arizona Gila River Indian Community Arizona Pascua Yaqui Tribe Arizona Salt River Pima-Maricopa Indian Community Arizona San Carlos Apache Tribe Arizona Tohono O'odham Nation Arizona Tonto Apache Tribe Arizona White Mountain Apache Tribe Arizona Yavapai-Apache Nation Arizona Yavapai-Prescott Tribe Arizona
1 The Zuni Indian Tribe has rights to Little Colorado River water in Arizona and the Moapa Band of Paiutes has rights to water in the Muddy River, Nevada. The modeling of these tributaries assumes future demand to be consistent with historical demand on these rivers. See appendix C9 for more information on the modeling of Lower Basin tributaries.

Colorado River Basin Water Supply and Demand Study
C-40 December 2012
FIGURE C-17 Colorado River Basin Tribes

Technical Report C — Water Demand Assessment
December 2012 C-41
FIGURE C-18 Colorado River Basin Tribal Diversion Rights (dotted line) and Diversion-Based Demand1,2,3
1 Tribal demand in Colorado, at the request of the Southern Ute Indian and Ute Mountain Ute tribes, is not separated from other categories in the state.
2 The diversion and depletion associated with demand for the Ute Indian Tribe of the Uintah and Ouray Reservation is dependent upon the re-ratification of the Revised Ute Indian Compact of 1990 by the tribe and the State of Utah. 3 The diversion and depletion demands of the Navajo Nation from the Colorado River in the Upper Basin in New Mexico are not limited by the Navajo Nation San Juan River in New Mexico Water Rights Settlement; however, the Navajo Nation agrees to be bound by the terms of that settlement so long as the Settlement is effective. To the extent that the Navajo Nation demands exceed the amounts provided in the settlement, the Nation may seek to acquire water from other users or from sources other than the Colorado River to meet any unmet demands.
0.0
0.5
1.0
1.5
2.0
2015 2035 2060
MAF
Lower Basin
0.0
0.5
1.0
1.5
2.0
2015 2035 2060
MAF
Upper Basin
0.000.250.500.751.001.251.501.75
2015 2035 2060
MAF
New Mexico
0.000.250.500.751.001.251.501.75
2015 2035 2060
MAF
Arizona
0.000.250.500.751.001.251.501.75
2015 2035 2060
MAF
California
0.000.250.500.751.001.251.501.75
2015 2035 2060
MAF
Nevada
0.000.250.500.751.001.251.501.75
2015 2035 2060
MAF
Wyoming
0.000.250.500.751.001.251.501.75
2015 2035 2060
MAF
Utah
UPPER BASIN
LOWER BASIN
Six columns per time period represent six scenarios. From left to right: A, B, C1, C2, D1, D2
A
A A
B
B B
C1
C1
C1
C2
C2
C2
D1
D1 D1
D2
D2
D2
0.0
0.5
1.0
1.5
2.0
2.5
3.0
3.5
4.0
2015 2035 2060
Mill
ion
Acre
-Fee
t (M
AF)
Colorado River Tribal Water Right and Demand
0.000.250.500.751.001.251.501.75
2015 2035 2060
MAF
Colorado

Colorado River Basin Water Supply and Demand Study
C-42 December 2012
TABLE C-6 Upper Colorado River Basin Tribal Rights and Tribal and State Future Demands
State
Tribal Diversion
Entitlement (Water
Right) (afy)
Tribal Depletion
Entitlement (Water
Right) (afy) Scenario
Tribal Demand (Diversion)
Tribal Demand
(Depletion)
State Demand
(Depletion) Tribal Demand
(Diversion)
Tribal Demand
(Depletion) State Demand
(Depletion)
Tribal Demand
(Diversion)
Tribal Demand
(Depletion)
State Demand
(Depletion) 2015 (afy) 2035 (afy) 2060 (afy)
CO 225,448 125,399 All Scenarios Tribal demand in Colorado is embedded in other demand categories within the state.
NM1 652,343 359,865 Current Projected (A) 543,280 299,470 600,020 652,926 359,730 703,035 658,546 363,195 754,100
Slow Growth (B) 543,280 299,470 600,020 652,926 359,730 673,386 658,546 363,195 692,615
Rapid Growth (C1) 554,904 305,710 606,260 745,316 409,775 757,963 961,439 525,795 979,209
Rapid Growth (C2) 554,904 305,710 605,005 745,316 409,775 694,229 961,439 525,795 830,724
Enhanced Environment (D1)
543,280 299,470 597,509 652,926 359,730 684,477 658,546 363,195 682,604
Enhanced Environment (D2)
554,904 305,710 602,586 745,316 409,775 678,361 961,439 525,795 784,559
UT 480,594 258,943 Current Projected (A) 480,594 258,943 999,059 480,594 258,943 1,081,531 480,594 258,943 1,153,500
Slow Growth (B) 316,354 170,451 910,566 447,747 241,245 1,032,775 480,594 258,943 1,084,253
Rapid Growth (C1) 506,798 272,045 1,012,161 560,470 298,881 1,141,323 637,286 337,289 1,277,455
Rapid Growth (C2) 506,798 272,045 1,011,093 560,470 298,881 1,116,488 637,286 337,289 1,222,092

Technical Report C — Water Demand Assessment
December 2012 C-43
TABLE C-6 Upper Colorado River Basin Tribal Rights and Tribal and State Future Demands
State
Tribal Diversion
Entitlement (Water
Right) (afy)
Tribal Depletion
Entitlement (Water
Right) (afy) Scenario
Tribal Demand (Diversion)
Tribal Demand
(Depletion)
State Demand
(Depletion) Tribal Demand
(Diversion)
Tribal Demand
(Depletion) State Demand
(Depletion)
Tribal Demand
(Diversion)
Tribal Demand
(Depletion)
State Demand
(Depletion) 2015 (afy) 2035 (afy) 2060 (afy)
UT 480,594 258,943 Enhanced Environment (D1)
480,594 258,943 997,295 480,594 258,943 1,059,226 480,594 258,943 1,109,080
Enhanced Environment (D2)
506,798 272,045 1,010,397 560,470 298,881 1,111,176 637,286 337,289 1,211,531
WY 0 0 All Scenarios No tribal entities in Wyoming receive Colorado River water.
AZ 0 0 Current Projected (A) 49,125 47,987 45,610 49,207 47,707 45,610 49,207 47,707 45,610
Slow Growth (B) 49,125 47,987 45,610 49,207 47,707 45,610 49,207 47,707 45,610
Rapid Growth (C1) 43,437 42,431 40,054 61,088 59,226 57,129 77,621 75,255 68,768
Rapid Growth (C2) 43,437 42,431 40,054 61,088 59,226 57,129 77,621 75,255 68,768
Enhanced Environment (D1)
49,125 47,987 45,610 49,207 47,707 45,610 49,207 47,707 45,610
Enhanced Environment (D2)
43,437 42,431 40,054 61,088 59,226 57,129 77,621 75,255 68,768
1 The diversion and depletion demands of the Navajo Nation from the Colorado River in the Upper Basin in New Mexico are not limited by the Navajo Nation San Juan River in New Mexico Water Rights Settlement; however, the Navajo Nation agrees to be bound by the terms of that settlement so long as the Settlement is effective. To the extent that the Navajo Nation demands exceed the amounts provided in the settlement, the Nation may seek to acquire water from other users or from sources other than the Colorado River to meet any unmet demands. 2 The diversion and depletion associated with the demand for the Ute Indian Tribe of the Uintah and Ouray Reservation is dependent upon the re-ratification of the Revised Ute Indian Compact of 1990 by the tribe and the State of Utah.

Colorado River Basin Water Supply and Demand Study
C-44 December 2012
TABLE C-7 Lower Colorado River Tribal Rights and Tribal and State Future Demands
State
Tribal Diversion
Entitlement (Water Right)
(afy) Scenario
Tribal Demand
(Diversion)
Tribal Demand
(Depletion)
State Demand
(Depletion)
Tribal Demand
(Diversion)
Tribal Demand
(Depletion)
State Demand
(Depletion)
Tribal Demand
(Diversion)
Tribal Demand
(Depletion)
State Demand
(Depletion) 2015 (afy) 2035 (afy) 2060 (afy)
AZ 1,411,968 Current Projected (A) 1,226,804 991,458 2,971,627 1,389,573 1,154,227 3,139,792 1,389,573 1,154,227 3,498,169
Slow Growth (B) 1,173,590 875,250 2,954,401 1,336,359 1,038,019 3,023,966 1,336,359 1,038,019 3,113,250
Rapid Growth (C1) 1,243,260 1,007,533 3,062,675 1,463,628 1,226,025 3,474,004 1,516,340 1,277,130 4,294,372
Rapid Growth (C2) 1,243,047 1,007,384 3,047,165 1,463,415 1,225,876 3,279,575 1,516,127 1,276,981 3,649,521
Enhanced Environment (D1) 1,226,804 991,458 3,060,138 1,389,573 1,154,227 3,281,506 1,389,573 1,154,227 3,478,115
Enhanced Environment (D2) 1,243,047 1,007,384 3,094,136 1,463,415 1,225,876 3,415,447 1,516,127 1,276,981 3,871,117
CA 156,522 Current Projected (A) 156,522 91,995 4,979,059 156,522 91,995 4,973,679 156,522 91,995 5,203,358
Slow Growth (B) 156,522 91,995 4,976,814 156,522 91,995 4,966,166 156,522 91,995 5,182,190
Rapid Growth (C1) 156,522 91,995 4,987,463 156,522 91,995 5,038,886 156,522 91,995 5,335,818
Rapid Growth (C2) 156,522 91,995 4,979,179 156,522 91,995 4,970,671 156,522 91,995 5,203,263
Enhanced Environment (D1) 156,522 91,995 4,975,136 156,522 91,995 4,955,416 156,522 91,995 5,167,686
Enhanced Environment (D2) 156,522 91,995 4,977,225 156,522 91,995 4,961,821 156,522 91,995 5,184,353
NV 12,534 Current Projected (A) 12,534 9,000 300,000 12,534 9,000 385,309 12,534 9,000 517,042
Slow Growth (B) 12,534 9,000 300,000 12,534 9,000 356,568 12,534 9,000 489,668
Rapid Growth (C1) 12,534 9,000 300,000 12,534 9,000 426,713 12,534 9,000 600,049
Rapid Growth (C2) 12,534 9,000 300,000 12,534 9,000 426,713 12,534 9,000 600,049
Enhanced Environment (D1) 12,534 9,000 300,000 12,534 9,000 385,309 12,534 9,000 517,042
Enhanced Environment (D2) 12,534 9,000 300,000 12,534 9,000 426,713 12,534 9,000 600,049

Technical Report C — Water Demand Assessment
December 2012 C-45
Tables C-6 and C-7 show that in some states, tribal demand is already equal to (or in some cases above) the quantified right in 2015 under all scenarios. Demand beyond the quantified rights, as seen under the Rapid Growth (C1 and C2) scenarios and the Enhanced Environment (D2) scenario in Arizona, New Mexico, and Utah, include unquantified rights and claims provided by the Navajo Nation. In those states that include scenarios where tribal demand is less than the right (Arizona, Utah, and New Mexico) the demand grows to reach the right by 2060. Under all scenarios for all states, with the exception of Colorado where tribal demand is not separated from other demands within the state, tribal demand has met or surpassed the quantified tribal right by 2060.
These tables also demonstrate the importance of tribal water in Study Area demand. Tribal demand in the Study Area lags behind only M&I and agricultural demand.
5.0 Mexico’s Allotment Mexico has an allotment to Colorado River water under Article 10 of the 1944 Treaty (United States and Mexico, 1944 [T.S. 994]). Article 10 of the 1944 Treaty states the following:
“Of the waters of the Colorado River, from any and all sources, there are allotted to Mexico:
(a) A guaranteed annual quantity of 1,500,000 acre-feet (1,850,234,000 cubic meters) to be delivered in accordance with the provisions of Article 15 of this Treaty.
(b) Any other quantities arriving at the Mexican points of diversion, with the understanding that in any year in which, as determined by the United States Section, there exists a surplus of waters of the Colorado River in excess of the amount necessary to supply uses in the United States and the guaranteed quantity of 1,500,000 acre-feet (1,850,234,000 cubic meters) annually to Mexico, the United States undertakes to deliver to Mexico, in the manner set out in Article 15 of this Treaty, additional waters of the Colorado River system to provide a total quantity not to exceed 1,700,000 acre-feet (2,096,931,000 cubic meters) a year. Mexico shall acquire no right beyond that provided by this subparagraph by the use of waters of the Colorado River system, for any purpose whatsoever, in excess of 1,500,000 acre-feet (1,850,234,000 cubic meters) annually.
In the event of extraordinary drought or serious accident to the irrigation system in the United States, thereby making it difficult for the United States to deliver the guaranteed quantity of 1,500,000 acre-feet (1,850,234,000 cubic meters) a year, the water allotted to Mexico under subparagraph (a) of this Article will be reduced in the same proportion as consumptive uses in the United States are reduced.
The quantification of demand scenarios did not include the assessment of future demand for Colorado River water within Mexico. Future deliveries to Mexico in accordance with the 1944 Treaty were included in the System Reliability Analysis phase of the Study, which assessed future imbalances within the Study Area.
6.0 Reservoir Evaporation and other Losses Water loss categories were also defined for the Study; these are reservoir evaporation (water lost due to evaporation from reservoirs), phreatophyte use (water lost due to evapotranspiration

Colorado River Basin Water Supply and Demand Study
C-46
by riparian vegetation along the Colorado River in the Lower Basin), and operational inefficiency9 (water unavailable for delivery due to operational inefficiencies in the Lower Basin).
Losses for a number of the large mainstem reservoirs are directly calculated by CRSS. Other reservoirs and phreatophyte use are accounted for in the analysis by using an average of historical use.
6.1 Reservoir Evaporation Reservoir evaporation varies annually, based on the surface area of a given reservoir and climatic conditions. Annual evaporation for the larger Basin reservoirs (Lower Basin: Lake Mead, Lake Mohave, and Lake Havasu; Upper Basin: Morrow Point, Blue Mesa, Crystal, Fontenelle, Flaming Gorge, Navajo, and Lake Powell) is calculated monthly through model simulation based on simulated conditions. Evaporation from other reservoirs in the Basin States is estimated from historical losses. Figure C-19 presents historical losses due to reservoir evaporation. Average annual evaporative losses between 1971 and 2010 are about 2 maf and 1.8 maf between 2000 and 2010. Declining evaporative losses can be attributed to lower average reservoir storage.
FIGURE C-19 Reservoir Evaporative Losses
9 Operational inefficiency losses include return flows from the Wellton-Mohawk Irrigation and Drainage District that are not allowed to return to
the river due to salinity concerns and non-storable flows that are delivered to Mexico in excess of Treaty requirements.
0.00
0.50
1.00
1.50
2.00
2.50
1971
1972
1973
1974
1975
1976
1977
1978
1979
1980
1981
1982
1983
1984
1985
1986
1987
1988
1989
1990
1991
1992
1993
1994
1995
1996
1997
1998
1999
2000
2001
2002
2003
2004
2005
2006
2007
2008
2009
2010
Mill
ion
Acre
-Fee
t per
Yea
r
Year
Upper Basin: Morrow Point
Upper Basin: Blue Mesa
Upper Basin: Flaming Gorge
Upper Basin: Lake Powell
Lower Basin: Lake Mead
Lower Basin: Lake Mohave
Lower Basin: Lake Havasu
Other Reservoir Evap
Technical Report C — Water Demand Assessment
December 2012 C-47
6.2 Phreatophyte Losses Phreatophytes are defined as deep-rooted plants that obtain water from the water table or in the vadose zone just above the water table. Phreatophyte losses are estimated for portions of the Lower Basin along the Colorado River mainstem and explicitly included in the water budget using those estimates. Phreatophyte losses in the Upper Basin are implicitly included in the water budget through the natural flow computations and therefore are not shown separately as losses.
Since 1995, Reclamation has updated Lower Basin phreatophyte areas by comparing the current year Landsat summer satellite images to the previous year's images (spectral change detection methods). Reclamation field checks areas of spectral change to confirm that the change is actually due to change in land cover. The areas of land cover change are then mapped, and these maps are used to update the phreatophyte database. Reference evapotranspiration is calculated using the Penman-Monteith (PM) equation and applied to the phreatophyte database to arrive at a water demand. Further details can be found in the Lower Colorado River Accounting System reports (Reclamation, 2009).
Before 1996, Davis Dam to Imperial Dam Lower Basin phreatophyte acreage was estimated, and the Blaney-Criddle (BC) model was used to estimate demand from 1971 to 1990 and a linear interpolation was employed from 1991 to 1994. Imperial Dam to Northerly International Boundary Lower Basin phreatophyte demand from 1971 to 1994 was estimated based on a 1995 to 2008 linear relationship between phreatophyte demand at Davis Dam to Imperial Dam versus Imperial Dam to Northerly International Boundary.
Historical and current phreatophyte use averages about 0.54 maf per year from 1971 to 2010 and 0.64 maf per year from 2000 to 2010. Figure C-20 shows historical Lower Basin phreatophyte use.
6.3 Operational Inefficiencies Operational inefficiency losses include return flows from the Wellton-Mohawk Irrigation and Drainage District that are not allowed to return to the river due to salinity concerns and non-storable flows that are delivered to Mexico in excess of treaty requirements.
Non-storable flows that were delivered to Mexico in excess of the 1944 Treaty over the period of 1964 to 2009 averaged 74,000 afy, excluding years when flood control releases were made from Lake Mead or flooding on the Gila River. The construction of the Warren H. Brock Reservoir is expected to reduce this quantity by about 90 percent to 7,000 afy.
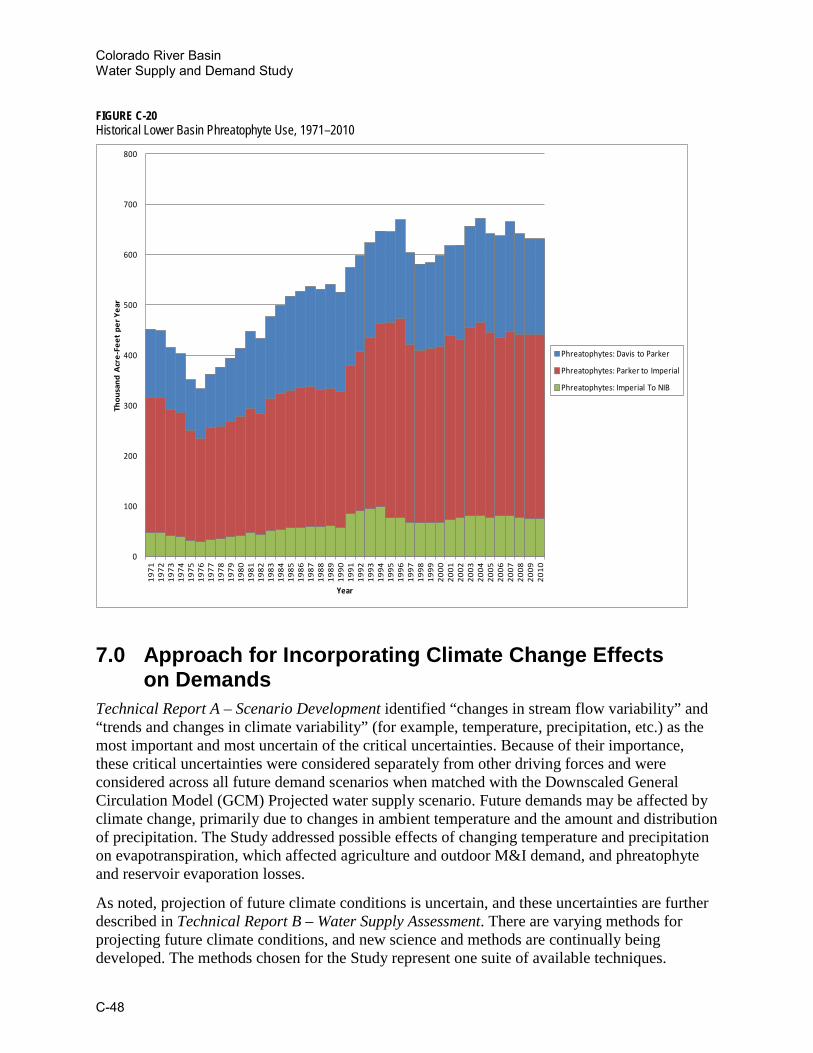
Colorado River Basin Water Supply and Demand Study
C-48
FIGURE C-20 Historical Lower Basin Phreatophyte Use, 1971–2010
7.0 Approach for Incorporating Climate Change Effects on Demands
Technical Report A – Scenario Development identified “changes in stream flow variability” and “trends and changes in climate variability” (for example, temperature, precipitation, etc.) as the most important and most uncertain of the critical uncertainties. Because of their importance, these critical uncertainties were considered separately from other driving forces and were considered across all future demand scenarios when matched with the Downscaled General Circulation Model (GCM) Projected water supply scenario. Future demands may be affected by climate change, primarily due to changes in ambient temperature and the amount and distribution of precipitation. The Study addressed possible effects of changing temperature and precipitation on evapotranspiration, which affected agriculture and outdoor M&I demand, and phreatophyte and reservoir evaporation losses.
As noted, projection of future climate conditions is uncertain, and these uncertainties are further described in Technical Report B – Water Supply Assessment. There are varying methods for projecting future climate conditions, and new science and methods are continually being developed. The methods chosen for the Study represent one suite of available techniques.
0
100
200
300
400
500
600
700
80019
7119
7219
7319
7419
7519
7619
7719
7819
7919
8019
8119
8219
8319
8419
8519
8619
8719
8819
8919
9019
9119
9219
9319
9419
9519
9619
9719
9819
9920
0020
0120
0220
0320
0420
0520
0620
0720
0820
0920
10
Thou
sand
Acr
e-Fe
et p
er Y
ear
Year
Phreatophytes: Davis to Parker
Phreatophytes: Parker to Imperial
Phreatophytes: Imperial To NIB

Technical Report C — Water Demand Assessment
December 2012 C-49
Possible changes in demand related to climate change that were not evaluated in the Study include changes in water demand for energy production, changes to environmental flow requirements associated with increasing ambient temperature, and changes in crop type. Regarding water demand for energy production, the additional variability in water demands for energy due to climate change would likely be small compared with the overall uncertainty in future energy demands. For environmental flows, insufficient data currently exist to quantify new habitat and species flow needs due to climate change. Changes in crop type are highly uncertain, and there are insufficient data to understand how crop type will change in response to changes in temperature and precipitation.
7.1 Climate Change Effects on Evapotranspiration Reclamation has historically used an empirically based approach, the BC or modified BC method, for calculating consumptive uses and losses in the Basin. As part of the hydrologic modeling for the Study, a more physically based method, PM, was used to estimate potential evapotranspiration (PET) under varying climatic conditions. A detailed analysis of these two methods and a description of the approach for incorporating climate information for adjusting demands are presented in appendix C15.
Reclamation used the Variable Infiltration Capacity (VIC) hydrologic model to estimate hydrologic responses in the Basin for the purposes of estimating water supply under changing climate conditions. The VIC model incorporates the PM method for estimating PET in the daily water balance calculations. PET results from Reclamation’s VIC modeling were used in the Study to estimate the effects of climate change on demand. PET estimates may vary widely among various methods, but the PM method has been shown to estimate actual evapotranspiration from lysimeter and field studies most accurately (American Society of Civil Engineers, 2005; Jensen et al., 1990; and Hill et al., 1983). Different PET methods have been found to produce different results under similar climate change assumptions (McKenney and Rosenberg, 1993; Kingston et al., 2009; Bormann, 2011). It was found that the BC method produced the highest PET sensitivity to climate warming (greatest increase in PET per degree of warming) compared to four other methods for computing PET. The PM method produced changes in PET of approximately 2 to 3 percent per degree Celsius warming. This sensitivity was larger than that estimated under the Priestly-Taylor method and lower than that under the Hargreaves method; however, results were generally within 1 percent of these two methods. Conversely, the BC method, when simulated under identical meteorological conditions, suggests a change of almost double that in the other methods.
In order to be consistent between the calculations used to generate water supply scenarios, the PM method, as implemented in the VIC model, was used to adjust agricultural, outdoor M&I demands, phreatophyte losses, and reservoir evaporation rates due to climate change. Details on the methods used to construct the climate index factors for adjusting demands and losses under climate change are included in appendix C15. The mean change in evapotranspirative demand is on the order of 4 percent by 2060 as compared to demands without changes in climate. Using the methods described in appendix C15 and applying the projected changes to all agricultural, outdoor M&I, and phreatophyte demands results in a total demand increase of over 500 kaf per year by 2060. These changes are projected to evolve over time with a warming climate, and could be higher or lower depending on the climate projection, but the magnitude of the climate impact to demands is expected to be substantial.

Colorado River Basin Water Supply and Demand Study
C-50
Figure C-21 presents the factors as applied to the Current Projected (A) scenario demands excluding Mexico’s allotment, reservoir evaporation10, and other losses11 (corresponding with the Colorado River demand shown in table C-4). The thick red line represents the average annual demand as adjusted for the climate change scenarios. This line can be compared to the unadjusted demands (thick black line). The thinner lines represent the adjustments associated with individual climate traces. Similar adjustments were made to each of the demand scenarios when coupled with the GCM projected supply scenarios.
FIGURE C-21 Current Projected (A) Scenario Demands Adjusted for Future Climate Change
7.2 Climate Change Effects on Reservoir Evaporation Reservoir evaporation will be affected by changes in temperature and rainfall in a similar manner to that for PET. Evaporation from mainstem reservoirs was calculated by estimating reservoir surface area and applying monthly unit net evaporation rates (evaporation minus precipitation). For the supply scenario representing climate change, projections of open water surface evaporation rates and precipitation were taken from the VIC model (see
10 Climate change effects on reservoir evaporation are adjusted dynamically through CRSS simulations. 11 Phreatophytes are included in the “other losses” category. Losses due to phreatophytes are adjusted for climate change using similar methods
as those proposed for agricultural irrigation.
12
12.5
13
13.5
14
14.5
15
15.5
16
16.5
17
2010 2015 2020 2025 2030 2035 2040 2045 2050 2055 2060 2065
Mill
ion
Acre
-Fee
t per
Yea
r
Year
BaselineAverage Climate Change
Technical Report C — Water Demand Assessment
December 2012 C-51
Technical Report B – Water Supply Assessment) to adjust historical evaporation rates to reflect the changes in climate. The details of the climate factors that were used to modify reservoir evaporation are described in appendix C15.
8.0 Limitations The projection of future demands for Colorado River water is inherently uncertain. Many factors influence the demand for water in each of the categories described in this technical report. Population, water use efficiency, agricultural markets, policy and regulations, social values, availability of other supplies, and other factors will all change in the future. This technical report describes the uncertainty in projecting future conditions through the use of alternative scenarios. The scenarios capture a view of future demands under only “external” factors and do not include activities by water management entities that may affect demand. Actual demands in the future will be the result of both external factors and more-direct, active management, just as demands were in the past. Active management is considered in the options and strategies portion of the Study.
The quantification of scenarios relied predominantly on state-provided information guided by the storylines. Each state projects water demands in a slightly different manner and level of complexity, and relies on different data sources. The trends and projections of population, and trends in water use efficiency and agricultural acreage from previous regional studies, were provided to the Basin States for consideration and utilized to varying extent in development of demand projections. However, in many cases the detail from these previous studies was not sufficient to develop planning area level estimates as required for the Study. It was also not possible within the scope of the Study to develop Basin-wide demand projections based on a fully consistent analytical method that would include the important local differences in factors contributing to water demand. The demands presented in this technical report are a compilation of this information in the most consistent form possible. However, there are areas of difference with respect to treatment of data, reference points, assumptions, and computation methods. Evaluations were performed as part of the Study, and it is known that areas of difference continue to exist due to planning approach differences.
The demand assessment did not explicitly include the effects of markets and pricing on water demand. However, the driving forces related to technology and economics were considered in the development of the water demand scenarios. The increasing scarcity costs of water price elasticity effects on demand may have been considered implicitly by the Basin States in the quantification of their water demand projections and the assumed levels of M&I and agricultural water conservation. Consideration of additional water conservation, with drivers related to environmental, social, and economic factors, was included in the development of options and strategies (see Technical Report F – Development of Options and Strategies). However, explicit consideration of the economic and pricing impacts on water demand was beyond the scope of the Study.
Feedback of water shortage or climatic factors on population and population distribution was not explicitly considered in Study. While it has been suggested that some regions of the Basin may experience future climate conditions so extreme as to affect population migration changes, explicit consideration of these effects was considered too speculative for the Study. However, the

Colorado River Basin Water Supply and Demand Study
C-52
range of population projections considered in the Study is believed to be sufficiently broad for exploring future Colorado River water demand.
Although these limitations exist, the Study represents a comprehensive, Basin-wide evaluation of future demands for the Colorado River Basin. Future planning efforts will improve upon these methods and limitations.
9.0 References American Society of Civil Engineers. 2005. The ASCE Standardized Reference
Evapotranspiration Equation. EWRI of ASCE Standardization of Reference Evapotranspiration Task Committee. Final Report.
Bureau of Reclamation (Reclamation). 1971–2011 Colorado River Accounting and Water Use Reports. Retrieved from http://www.usbr.gov/lc/region/g4000/wtracct.html#Decree.
Bureau of Reclamation (Reclamation). 2000. Colorado River Interim Surplus Criteria Final Environmental Impact Statement.
Bureau of Reclamation (Reclamation). 2005. Upper Colorado River Basin Consumptive Uses and Losses Report As Revised After Peer Review 1971 to 1995. Retrieved from http://www.usbr.gov/uc/library/envdocs/reports/crs/crsul.html.
Bureau of Reclamation (Reclamation). 2007. Colorado River Interim Guidelines for Lower Basin Shortages and Coordinated Operations for Lake Powell and Lake Mead Final Environmental Impact Statement.
Bureau of Reclamation (Reclamation). 2009. Lower Colorado River Accounting System Evapotranspiration and Evaporation Calculations, Calendar Year 2008. Technical Memorandum No. 86-68210–2009-09.
Bureau of Reclamation (Reclamation). 2012a. Colorado River Basin Consumptive Uses and Losses Report 1996–2000. Retrieved from http://www.usbr.gov/uc/library/envdocs/reports/crs/crsul.html.
Bureau of Reclamation (Reclamation). 2012b. Upper Colorado River Basin Consumptive Uses and Losses Report 2001–2005. Retrieved August, from http://www.usbr.gov/uc/library/envdocs/reports/crs/crsul.html.
Bureau of Reclamation (Reclamation). 2012c. Provisional Upper Colorado River Basin Consumptive Uses and Losses Report 2006–2010. Retrieved August, from http://www.usbr.gov/uc/library/envdocs/reports/crs/pdfs/cul2006-2010prov.pdf.
Bormann, H. 2011. “Sensitivity analysis of 18 different potential evapotranspiration models to observed climatic change at German climate stations.” Climatic Change. 104:729-753.
California Department of Water Resources. 2010. 20x2020 Water Conservation Plan.
General Accounting Office. 2010. Energy-Water Nexus, A Better and Coordinated Understanding of Water Resources Could Help Mitigate the Impacts of Potential Oil Shale Development.

Technical Report C — Water Demand Assessment
December 2012 C-53
Hill, R. W., E. L. Johns, and D. K. Frevert. 1983. Comparison of Equations used for Estimating Agricultural Crop Evapotranspiration with Field Research. U.S. Department of the Interior, Bureau of Reclamation. Page 242.
Jensen, M.E., R.D. Burman, and R.G. Allen. 1990. “Evapotranspiration and Irrigation Water Requirements.” American Society of Civil Engineers – Manuals and Reports on Engineering Practice – No. 70.
Kingston, D.G., M.C. Todd, R.G. Taylor, J.R. Thompson, and N.W. Arnell. 2009. “Uncertainty in the estimation of potential evaporation under climate change.” Geophys Res Lett 36:L20403. doi:10.1029/2009GL040267.
McKenney, M.S. and N.J. Rosenberg. 1993. “Sensitivity of some potential evapotranspiration estimation methods to climate change.” Agricultural and Forest Meteorology, 64, 81-110.
Pacific Institute. 2011. Municipal Deliveries of Colorado River Basin Water.
Pew Research Center. 2010. U.S. Population Projections 2005–2050.
Rockaway, T, P. Comes, J. Rivard, and B. Kornstein. 2011. Residential Water Use Trends in North America.
States West Water Resources Corporation. 2001. Green River Basin Water Planning Process. Prepared for Wyoming Water Development Commission Basin Planning Program. Prepared in association with Boyle Engineering Corporation, Purcell Consulting, P.C., Water Right Services LLC, and Watts and Associates, Inc. February.
United Nations Department of Economic and Social Affairs. 2010. World Population Prospects 2010 Revision.
U.S. Census Bureau. 2010. U.S. Census Bureau Projections.
U.S. Department of Agriculture. 2010. Agricultural Resources and Environmental Indicators.
U.S. Department of Energy. 2009. State Electricity Profiles.
U.S. Environmental Protection Agency. 2010. Growing Toward More Efficient Water Use.
U.S. Geological Survey. 2009. Estimated Use of Water in the United States.
U.S. Secretary of Interior. 2003. Colorado River Water Delivery Agreement: Federal Quantification Settlement Agreement.
Water Research Foundation. 2010. North American Water Use Trends Since 1992.


Technical Report C — Water Demand Assessment
December 2012 C-55
Disclaimer The Colorado River Basin Water Supply and Demand Study (Study) is funded jointly by the Bureau of Reclamation (Reclamation) and the seven Colorado River Basin States (Basin States). The purpose of the Study is to analyze water supply and demand imbalances throughout the Colorado River Basin and those adjacent areas of the Basin States that receive Colorado River water through 2060; and develop, assess, and evaluate options and strategies to address the current and projected imbalances. Reclamation and the Basin States intend that the Study will promote and facilitate cooperation and communication throughout the Basin regarding the reliability of the system to continue to meet Basin needs and the strategies that may be considered to ensure that reliability. Reclamation and the Basin States recognize the Study was constrained by funding, timing, and technological and other limitations, and in some cases presented specific policy questions and issues, particularly related to modeling and interpretation of the provisions of the Law of the River during the course of the Study. In such cases, Reclamation and the Basin States developed and incorporated assumptions to further complete the Study. Where possible, a range of assumptions was typically used to identify the sensitivity of the results to those assumptions. Nothing in the Study, however, is intended for use against any Basin State, any federally recognized tribe, the federal government or the Upper Colorado River Commission in administrative, judicial or other proceedings to evidence legal interpretations of the Law of the River. As such, assumptions contained in the Study or any reports generated during the Study do not, and shall not, represent a legal position or interpretation by the Basin States, any federally recognized tribe, federal government or Upper Colorado River Commission as it relates to the Law of the River. Furthermore, nothing in the Study is intended to, nor shall the Study be construed so as to, interpret, diminish or modify the rights of any Basin State, any federally recognized tribe, the federal government, or the Upper Colorado River Commission under federal or state law or administrative rule, regulation or guideline, including without limitation the Colorado River Compact (45 Stat. 1057), the Upper Colorado River Basin Compact (63 Stat. 31), the Utilization of Waters of the Colorado and Tijuana Rivers and of the Rio Grande, Treaty Between the United States of America and Mexico (Treaty Series 994, 59 Stat. 1219), the United States/Mexico agreement in Minute No. 242 of August 30, 1973 (Treaty Series 7708; 24 UST 1968), or Minute No. 314 of November 26, 2008, or Minute No. 318 of December 17, 2010, or Minute No. 319 of November 20, 2012, the Consolidated Decree entered by the Supreme Court of the United States in Arizona v. California (547 U.S 150 (2006)), the Boulder Canyon Project Act (45 Stat. 1057), the Boulder Canyon Project Adjustment Act (54 Stat. 774; 43 U.S.C. 618a), the Colorado River Storage Project Act of 1956 (70 Stat. 105; 43 U.S.C. 620), the Colorado River Basin Project Act of 1968 (82 Stat. 885; 43 U.S.C. 1501), the Colorado River Basin Salinity Control Act (88 Stat. 266; 43 U.S.C. 1951) as amended, the Hoover Power Plant Act of 1984 (98 Stat. 1333), the Colorado River Floodway Protection Act (100 Stat. 1129; 43 U.S.C. 1600), the Grand Canyon Protection Act of 1992 (Title XVIII of Public Law 102-575, 106 Stat. 4669), or the Hoover Power Allocation Act of 2011 (Public Law 112-72). In addition, nothing in the Study is intended to, nor shall the Study be construed so as to, interpret, diminish or modify the rights of any federally recognized tribe, pursuant to federal court decrees, state court decrees, treaties, agreements, executive orders and federal trust responsibility. Reclamation and the Basin States continue to recognize the entitlement and right of each State and any federally recognized tribe under existing law, to use and develop the water of the Colorado River system.