manalapan - englishtown - new jersey · manalapan - englishtown regional schools a regional...
TRANSCRIPT

MANALAPAN - ENGLISHTOWN REGIONAL SCHOOLS
A REGIONAL DISTRICT COMPRISED OF THE TOWNSHIP OF MANALAPAN
AND THE BOROUGH OF ENGLISHTOWN
COMPREHENSIVE ANNUAL FINANCIAL REPORT
FOR THE FISCAL YEAR ENDED
June 30, 2011


MANALAPAN-ENGLISHTOWN SCHOOL DISTRICT
ENGLISHTOWN, NEW JERSEY
COMPREHENSIVE ANNUAL FINANCIAL REPORT
FOR THE FISCAL YEAR ENDED JUNE 30, 2011
Prepared by
Manalapan-Englishtown Regional School District Business Office, Sharon Silvia Assistant Business Administrator


OUTLINE FOR COMPREHENSIVE ANNUAL FINANCIAL REPORT INTRODUCTORY SECTION Page Letter of Transmittal 1-5 Organizational Chart 6 Roster of Officials 7 Consultants and Advisors 8 FINANCIAL SECTION Independent Auditor's Report 11-12
REQUIRED SUPPLEMENTARY INFORMATION - PART I
Management's Discussion and Analysis 15-24 BASIC FINANCIAL STATEMENTS A. District-wide Financial Statements A-1 Statement of Net Assets 27 A-2 Statement of Activities 28 B. Fund Financial Statements
Governmental Funds B-1 Balance Sheet 31 B-2 Statement of Revenues, Expenditures and Changes in Fund Balance 32 B-3 Reconciliation of the Statement of Revenues, Expenditures, and Changes in Fund Balances of Governmental Funds to the Statement of Activities 33
Proprietary Funds B-4 Statement of Net Assets 34 B-5 Statement of Revenues, Expenses and Changes in Fund Net Assets 35 B-6 Statement of Cash Flows 36 Fiduciary Funds B-7 Statement of Fiduciary Net Assets 37 B-8 Statement of Changes in Fiduciary Net Assets 38 Notes to Basic Financial Statements 39-57

OUTLINE FOR COMPREHENSIVE ANNUAL FINANCIAL REPORT REQUIRED SUPPLEMENTARY INFORMATION – PART II Page C. Budgetary Comparison Schedules
C-1 Budgetary Comparison Schedule – General Fund 63-67 C-2 Budgetary Comparison Schedule – Special Revenue Fund 71
Notes to Required Supplementary Information C-3 Budget-to-GAAP Reconciliation 75 Other Supplementary Information D. School Level Schedules
D-1 Combining Balance Sheet N/A D-2 Blended Resource Fund – Schedule of Expenditures Allocated by Resource Type – Actual N/A D-3 Blended Resource Fund – Schedule of Blended Expenditures Budget and Actual N/A E. Special Revenue Fund E-1 Combining Schedule of Program Revenues and Expenditures Special Revenue Fund – Budgetary Basis 79-82 E-2 Schedule of Preschool Education Aid Expenditures - Preschool – All Programs - Budgetary Basis N/A F. Capital Projects Fund
F-1 Summary Schedule of Project Revenue, Expenditures and Changes in Fund Balance- Budgetary Basis 85 F-2 Summary Schedule of Revenues, Expenditures and Changes In Fund Balance – Budgetary Basis 86 F-2 Schedules of Project Revenues, Expenditures, Project Balance And Project Status – Budgetary Basis 87-93
G. Proprietary Funds
Enterprise Fund G-1 Statement of Net Assets 97 G-2 Statement of Revenues, Expenses and Changes in Fund Net Assets 98 G-3 Statement of Cash Flows 99 Internal Service Fund G-4 Statement of Net Assets N/A G-5 Statement of Revenues, Expenses and Changes in Fund Net Assets N/A G-6 Statement of Cash Flows N/A

OUTLINE FOR COMPREHENSIVE ANNUAL FINANCIAL REPORT
Page H. Fiduciary Funds
H-1 Statement of Fiduciary Net Assets 103 H-2 Statement of Changes in Fiduciary Net Assets 104 H-3 Student Activity Agency Fund Schedule of Receipts and Disbursements 105 H-4 Payroll Agency Fund Schedule of Receipts and Disbursements 106
I. Long-Term Debt
I-1 Schedule of Serial Bonds 109-110 I-2 Schedule of Obligations Under Capital Leases 111 I-3 Debt Service Fund Budgetary Comparison Schedule 112
J. Introduction to the Statistical Section Financial Trends J-1 Net Assets by Component 117 J-2 Changes in Net Assets 118-119 J-3 Fund Balances – Governmental Funds 120 J-4 Changes in Fund Balances, Governmental Funds 121 J-5 General Fund Other Local Revenue by Source 122 Revenue Capacity J-6 Assessed Value and Estimated Actual Value of Taxable Property 123 J-7 Direct and Overlapping Property Tax Rates 124 J-8 Principal Property Taxpayers 125 J-9 Property Tax Levies and Collections 126 Debt Capacity J-10 Ratios of Outstanding Debt by Type 127 J-11 Ratios of General Bonded Debt Outstanding 128 J-12 Direct and Overlapping Governmental Activities Debt 129 J-13 Legal Debt Margin Information 130 Demographic and Economic Information J-14 Demographic and Economic Statistics 131 J-15 Principal Employers 132 Operating Information J-16 Full-time Equivalent District Employees by Function/Program 133 J-17 Operating Statistics 134 J-18 School Building Information 135 J-19 Schedule of Allowable Maintenance Expenditures by School Facility 136 J-20 Insurance Schedule 137-138
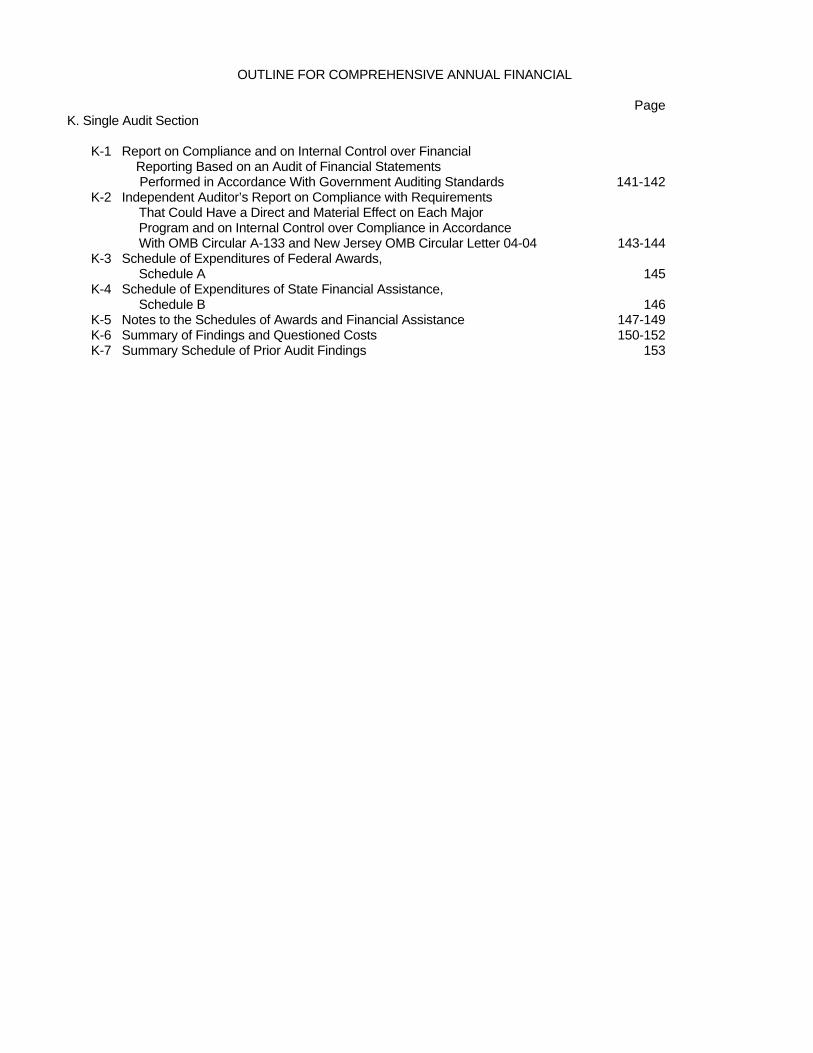
OUTLINE FOR COMPREHENSIVE ANNUAL FINANCIAL Page K. Single Audit Section K-1 Report on Compliance and on Internal Control over Financial Reporting Based on an Audit of Financial Statements Performed in Accordance With Government Auditing Standards 141-142 K-2 Independent Auditor’s Report on Compliance with Requirements That Could Have a Direct and Material Effect on Each Major Program and on Internal Control over Compliance in Accordance With OMB Circular A-133 and New Jersey OMB Circular Letter 04-04 143-144 K-3 Schedule of Expenditures of Federal Awards, Schedule A 145 K-4 Schedule of Expenditures of State Financial Assistance, Schedule B 146 K-5 Notes to the Schedules of Awards and Financial Assistance 147-149 K-6 Summary of Findings and Questioned Costs 150-152 K-7 Summary Schedule of Prior Audit Findings 153
INTRODUCTORY SECTION

-1-

SCHOOL DISTRICT ORGANIZATION The Manalapan-Englishtown Regional School District is an independent reporting entity within the criteria adopted by the GASB as established by Statement No. 14 as amended by GASB 39. All funds of the District are included in this report. The Manalapan-Englishtown Regional Board of Education and all its schools constitute the District's reporting entity. The District has maintained a high quality of education, even though it is one of the largest K-8 districts in Monmouth County. The Manalapan-Englishtown District serves the children of the Township of Manalapan and the Borough of Englishtown. The District provides a full range of programs and services appropriate to grades Pre-K through 8. An early learning center (The John I. Dawes Early Learning Center) houses the pre-K and kindergarten programs. Five elementary schools (Clark Mills, Milford Brook, Taylor Mills, Lafayette Mills, and Wemrock Brook) house grades 1 through 5. The Pine Brook School houses grade 6. The Manalapan-Englishtown Middle School (MEMS) houses grades 7 and 8. Supervising district-wide goals is a district superintendent, an assistant superintendent for curriculum and human resources, a business administrator, three district wide curriculum supervisors, a director of special education and a supervisor of special education. The Early Learning Center has its own principal. Each 1 - 5 elementary has its own principal and one assistant principal. Pine Brook has one principal and one assistant principal. The middle school has one principal and two assistant principals. The Board of Education, comprised of nine members, each elected to 3-year terms, meets on the first and third Tuesday of each month to determine district goals and priorities and conduct the business of the Board of Education. The Board of Education utilizes a committee structure as well as operates as a committee of the whole. All committee of the whole meetings are open to the public and begin at 7:30 PM and conclude at 11:30 PM unless the board passes a resolution to extend the meeting.
Ad-hoc advisory committees composed of representatives from the community; administration, PTA's, and the Township and Borough are often formed to provide the Board of Education with information and input on specific issues. In the 2010-11 school year the Board of Education did not have a specific Ad-Hoc committee, although the district did seek input from community members and the PTA’s regarding curriculum program offerings, impact of proposed budget reductions and changes in transportation. PTA's are highly active in the District and provide community support for a variety of programs and activities for the children. A senior citizen group provides the District with information regarding community members who no longer have children in the district. To maintain communication with the various constituent groups, the District utilizes its web site. Budget information, while available on the web site, is also presented to the township committee and borough council. In March 2011, the New Jersey Department of Education released its Comparative Spending Guide for all school districts in the State. The guide compares districts with those who are similar in enrollment/configurations. The information on expenditures was taken from certified budgets on file with the State Department of Education. This reports shows that the district spends $11,580 per pupil while the average costs for similar districts are $12,667. According to the report, per pupil costs range from a low of $7,952 to a high of $17,086. Of the 88 K-8 school districts in the state with enrollments exceeding 751 children, Manalapan-Englishtown Regional ranked 26th lowest in total cost per pupil.
-2-

EDUCATIONAL PROGRAM Each of the schools in the district follows the district-wide goals and educational approaches to the teaching of children, while maintaining a unique personality that makes up that particular school. All curricula in our district have been aligned to the New Jersey Core Curriculum Content Standards. The following table presents the actual historical pupil enrollment, as of October 15, for the school years 2001-02 through 2010-11.
Enrollment School Year As of October 15 2001-02 2002-03 2003-04 2004-05 2005-06 2006-07 2007-08 2008-09 2009-10 2010-11
5,717 5,584 5,545 5,486 5,495 5,446 5,471 5,454 5,364 5,188
ECONOMIC CONDITION AND OUTLOOK Monmouth County is steeped in history from pre-revolutionary times to the present day. Rich in natural resources, Monmouth's deep forests, rolling countryside and miles of beautiful sandy beaches offer a perfect backdrop for the vast variety of recreational, cultural and leisure opportunities in the area. The County has horse country and thriving agricultural industry in the west, beaches and seaside resorts in the east, and a booming business community throughout. The Manalapan-Englishtown Regional School District serves students from a wide range of socioeconomic backgrounds. Monmouth County is located in the center of the state approximately 47 miles south of New York City and 55 miles east of Philadelphia. Newark Liberty International Airport is just 40 minutes away. The public and private transportation systems include more than 2,600 miles of rails and roads, making the County accessible to virtually all of New Jersey as well as nearby New York and Philadelphia.
Because Monmouth County continues to be among the fastest growing in New Jersey, change is constant in the Manalapan-Englishtown Regional School District. Sales of both new and existing homes are occurring at a slow pace. Existing homes continue to stay on the market for a much longer period of time than a few years ago. Just last year, the number of families relocating in the area has dropped compared to years 2007 and 2008, respectively. The District, along with all of the other public school systems in the state, will continue to face difficult economic situations in the future since the primary funding source is and will continue to be property tax revenue. The proposed budget for the fiscal year 2011-12 passed. Overall tax revenue for 2010-2011 was increased slightly by 2.83%, but the increased expenditures from the growing cost of contractual salary increases, employee health care, increases in the contributions to the retirement system, and rising insurance premiums have outpaced the additional revenue. We recognize that the state is in a financial crisis and want to assure our residents that the Manalapan-Englishtown Regional School District is doing its part to maintain a responsible budget. The District’s administration closely monitors the cost of operations and continues to look for new funding sources in order to maintain the quality education services that the district has been accustomed to providing. Manalapan-Englishtown Regional School’s Foundation donated generously during the 2010-2011 school year as well as Manalapan-Englishtown Regional School District’s PTA’s. MAJOR INITIATIVES Phase I of the Pine Brook Elementary School renovations began at the end of the school year 2009-2010. This project involved the replacement of windows and HVAC equipment in several wings of the building. Phase I was completed before the start of school in September 2010. The project is currently completed. The Taylor Mills School renovation project is currently completed. The project involved replacement of windows and HVAC equipment. Renovations are also taking place at Milford Brook and Lafayette Mills Schools. Those projects involve roof replacement and HVAC equipment replacement. Minor renovation projects are planned for other school buildings over the next 2 years.
-3-

The administration and the Board of Education approved the restructuring of six of the eight schools on December 9, 2008. There are both educational and economic rationales for changing grade level configurations to create five neighborhood schools and a sixth grade learning center. The restructuring plan called for a reduction in teaching staff that would be accomplished through attrition. Another economic benefit was a decrease in the number of buses needed to transport students to and from school. Savings came in the form of reduced transportation salaries, health benefits, gasoline, insurance and vehicle maintenance costs. Further savings were realized in the transportation department during the 2010-2011 school year through the implementation of cluster bus stops, where possible. INTERNAL CONTROLS
Management of the district is responsible for establishing and maintaining an internal control system designed to ensure that the assets of the district are protected from loss, theft or misuse; and to ensure that adequate accounting data are compiled to allow for the preparation of financial statements in conformity with generally-accepted accounting principles (GAAP). The internal control structure is designed to provide reasonable, but not absolute, assurance that these objectives are met. The concept of reasonable assurance recognizes that: (1) the cost of a control should not exceed the benefits likely to be derived; and (2) the valuation of costs and benefits requires estimates and judgments by management. As a recipient of federal and state financial assistance, the district also is responsible for ensuring that an adequate internal control structure is in place to ensure compliance with applicable laws and regulations related to those programs. This internal control structure is also subject to periodic evaluation by the district management. As part of the district's single audit, described earlier, tests are made to determine the adequacy of the internal control structure, including that portion related to federal and state financial assistance programs, as well as to determine that the district has complied with applicable laws and regulations. BUDGETARY CONTROLS In addition to internal accounting controls, the District maintains budgetary controls. The objective of these controls is to ensure compliance with legal provisions embodied in the annual appropriated budget approved by the voters of the municipalities. Annual appropriated budgets are adopted for the general fund, the special revenue funds, and the debt service fund. The final budget amount as amended for the fiscal year is reflected in the financial section. An encumbrance accounting system is used to record outstanding purchase commitments on a line item basis. Open encumbrances at year-end are either canceled or are included as re-appropriations of fund balance in the subsequent year. CASH MANAGEMENT The investment policy of the District is guided in large part by state statute as detailed in Notes to the Basic Financial Statements, Note 3. The District has adopted a cash management plan, which requires it to deposit public funds in public depositories protected from loss under the provision of the Governmental Unit Protection Act ("GUDPA"). GUDPA was enacted in 1970 to protect Governmental Units from a loss of funds on deposit with a failed banking institution in New Jersey. The law requires governmental units to deposit public funds only in public depositories located in New Jersey, where the funds are secured in accordance with the Act. RISK MANAGEMENT The Board carries various forms of insurance, including but not limited to general liability, automobile liability and comprehensive/collision, hazard and theft insurance on property and contents, fidelity bonds and worker's compensation. A schedule of insurance coverage is found in Exhibit J-20.
-4-

-5-

Bus
ines
s O
ffice
Sta
ff
Tran
spor
tatio
n S
taff
Supp
ort S
taff
Prin
cipa
lsD
irect
or o
f Inf
orm
atio
n S
yste
ms Te
chni
cal S
uppo
rt St
aff
Ass
ista
nt
Prin
cipa
ls
Bus
ines
s A
dmin
istra
tor/
Boa
rd S
ecre
tary
Inst
ruct
iona
l S
taff
Cur
ricul
um
Sup
ervi
sors
Dire
ctor
of P
upil
Pers
onne
l Ser
vice
sD
irect
or o
f Ph
ysic
al P
lant
Tran
spor
tatio
n C
oord
inat
orA
sst.
Supe
rinte
nden
t C
urric
ulum
/Hum
an
Res
ourc
esM
aint
enan
ce
Cus
todi
al S
taff
Ass
t. Tr
ansp
orta
tion
Coo
rdin
ator
Ass
t. Bu
sine
ss
Adm
inis
trato
r/ Bo
ard
Secr
etar
y
Man
alap
an-E
nglis
htow
nR
egio
nal B
oard
of E
duca
tion
Org
aniz
atio
nal C
hart
Ass
t. D
irect
or o
f Pup
il Pe
rson
nel S
ervi
ces
Boar
d of
Edu
catio
n
Sup
erin
tend
ent
-6-

MANALAPAN-ENGLISHTOWN REGIONAL SCHOOL DISTRICT
ENGLISHTOWN, NEW JERSEY
ROSTER OF OFFICIALS
JUNE 30, 2011
Term Members of the Board of Education Expires Michele Stipelman, President 2014 Lori Semel, Vice President 2012 James Mumolie 2013 Joseph De Pasquale 2012 AnnaMarie Galante 2012 Ralph Cafaro 2014 Diane Bindler 2013 Dotty Porcaro 2014 Brian Graime 2013
Other Officials John J. Marciante, Jr., Ph.D., Superintendent Veronica Wolf, Business Administrator/Board Secretary Sharon Silvia, Assistant Business Administrator/Assistant Board Secretary Sanford Brown, Solicitor
-7-

MANALAPAN-ENGLISHTOWN BOARD OF EDUCATION
Consultants and Advisors
June 30, 2011
Architect
The Musial Group 191 Mill Lane
Mountainside, NJ 07092
Audit Firm
Jump, Scutellaro & Co., LLP 12 Lexington Ave.
Toms River, NJ 08754
Attorney
Sanford D. Brown, Esq. 1127 Highway 35
Ocean Township, NJ 07712
Official Depository
PNC Bank 109 Route 9
Marlboro, New Jersey 07726
Financial Advisor
Public Resources, Inc. 39 South Point Blvd.
Barnegat, New Jersey 08005
Bond Council
John L. Kraft, Esq. Lomurro, Eastman & Munoz, P.A
100 Willowbrook Road Freehold, NJ 07728
-8-

FINANCIAL SECTION
-9-

-10-

-11-

-12-

REQUIRED SUPPLEMENTARY INFORMATION – PART I
-13-

-14-

MANALAPAN-ENGLISHTOWN REGIONAL SCHOOL DISTRICT ENGLISHTOWN, NJ
MANAGEMENT’S DISCUSSION AND ANALYSIS FOR THE FISCAL YEAR ENDED JUNE 30, 2011
UNAUDITED The Discussion and Analysis (MD&A) of Manalapan-Englishtown Regional School District’s (the District) financial performance provides an overall review of the District’s financial activities for the fiscal year ended June 30, 2011. The intent of this discussion and analysis is to look at the District’s financial performance as a whole; readers should also review the basic financial statements and notes to enhance their understanding of the District’s financial performance. Certain comparative information between the current year (2010-2011) and the prior year (2009-2010) is required to be presented in the MD&A. Financial Highlights
Key financial highlights for 2011 are as follows:
� In total, net assets of governmental activities increased $1,546,375, which represents a 2.91% increase from 2010. Net assets of business-type activities increased $3,425, which represents a .57% increase from 2010.
� General revenues accounted for $72,498,351 in revenue or 91.42% of all revenues.
Program specific revenues in the form of charges for services, operating grants and contributions, and capital grants and contributions accounted for $6,808,229 or 8.58% of total revenues of $79,306,580.
� Total assets of governmental activities decreased by $314,426 as cash and cash
equivalents increased by $583,391, receivables increased by $12,532, net capital assets decreased by $263,000, and other assets decreased by $647,349.
� The District had $77,760,205 in governmental activity expenses; only $6,808,229 of these
expenses was offset by program specific charges for services, grants or contributions. General revenues (primarily property taxes) of $72,498,351 were adequate to provide for these programs.
� In the governmental funds, the general fund had $72,957,387 in revenues and
$71,432,269 in expenditures. The general fund’s fund balance increased $1,642,717 over 2010.
Using this Comprehensive Annual Financial Report (CAFR) This annual report consists of a series of financial statements and notes to those statements. These statements are organized so the reader can understand the Manalapan-Englishtown Regional Public School District as a financial whole, an entire operating entity. The statements then proceed to provide an increasingly detailed look at specific financial activities. The focus of governmental accounting differs from that of business enterprises. In government, the financial statement user is concerned with determining accountability for funds, evaluating operating results, and assessing services that can be provided by the government along with its ability to meet obligations as they become due. In comparison, the primary emphasis in the private sector from both an operational and reporting perspective is on the maximization of profits. The Statement of Net Assets and Statement of Activities provide information about the activities of the whole District, presenting both an aggregate view of the District’s finances and a longer-term view of those finances. Fund financial statements provide the next level of detail. For governmental funds, these statements tell how services were financed in the short-term as well as what remains for future spending. In the case of Manalapan-Englishtown Regional School District, the general fund is by far the most significant fund.
-15-
MANALAPAN-ENGLISHTOWN REGIONAL SCHOOL DISTRICT
ENGLISHTOWN, NJ
MANAGEMENT’S DISCUSSION AND ANALYSIS FOR THE FISCAL YEAR ENDED JUNE 30, 2011
UNAUDITED (CONTINUED) Reporting the School District as a Whole Statement of Net Assets and the Statement of Activities This document contains the large number of funds used by the District to provide programs and activities. The view of the District as a whole looks at all financial transactions and asks the question, “How did we do financially during 2011?” The Statement of Net Assets and the Statement of Activities help answer this question. These statements include all assets and liabilities using the accrual basis of accounting similar to the accounting used by most private-sector companies. This basis of accounting takes into account all of the current year’s revenues and expenses, regardless of when cash is received or paid. These two statements report the school district’s net assets and changes in those assets. This change in net assets is important because it tells the reader that, for the District as a whole, the financial position of the District has improved or diminished. The causes of this change may be the result of many factors, some financial, and some not. Non-financial factors include the District’s property tax base, current laws in New Jersey restricting revenue growth, facility condition, required educational programs and others. In the Statement of Net Assets and the Statement of Activities, the school district is divided into two distinct kinds of activities:
Governmental Activities – All of the District’s programs and services are reported here including, but not limited to, instruction, support services, operation and maintenance of plant facilities, pupil transportation, and extracurricular activities.
Business-Type Activities – This service is provided on a charge for goods or services
basis in order to recover all the expenses of the goods or services provided. The Food Service enterprise fund is reported as a business activity.
Reporting the School District’s Most Significant Funds Fund Financial Statements Fund financial reports provide detailed information about the District’s major funds. The District uses many funds to account for a multitude of financial transactions. The District’s major governmental funds are the General Fund, Special Revenue Fund, Capital Projects Fund, and Debt Service Fund. Governmental Funds The District’s activities are reported in governmental funds, which focus on how money flows into and out of those funds and the balances left at year-end available for spending in future years. These funds are reported using an accounting method called modified accrual accounting, which measures cash and all other financial assets that can readily be converted to cash. The governmental fund statements provide a detailed short-term view of the District’s general government operations and the basic services it provides. Governmental funds information help the reader determine whether there are more or fewer financial resources that can be spent in the near future to finance educational programs. The relationship (or differences) between governmental activities (reported in the Statement of Net Assets and the Statement of Activities) and governmental funds is reconciled in the financial statements.
-16-

MANALAPAN-ENGLISHTOWN REGIONAL SCHOOL DISTRICT ENGLISHTOWN, NJ
MANAGEMENT’S DISCUSSION AND ANALYSIS FOR THE FISCAL YEAR ENDED JUNE 30, 2011
UNAUDITED (CONTINUED) Proprietary Fund The enterprise fund uses the same basis of accounting as business-type activities; therefore, these statements are essentially the same. Notes to the Basic Financial Statements The notes provide additional information that is essential to a full understanding of the data provided in the district-wide and fund financial statements. The notes to the basic financial statements can be found on pages 34 to 54 of this report. The School District as a Whole Recall that the Statement of Net Assets provides the perspective of the school district as a whole. Net assets may serve over time as a useful indicator of a government’s financial position. The district’s financial position is the product of several financial transactions including the net results of activities, the acquisition and payment of debt, the acquisition and disposal of capital assets, and the depreciation of capital assets. Table 1 provides a summary of the school district’s net assets for 2011 and 2010
Assets 2011 2010 2011 2010Current and Other Assets 12,137,237$ 12,188,663$ 327,844$ 324,142$ Capital Assets, Net 98,860,279 99,123,279 371,425 400,723 Total Assets 110,997,516$ 111,311,942$ 699,269$ 724,865$
LiabilitiesLong-term Liabilities 50,587,829$ 52,607,593$ -$ -$ Other Liabilities 5,690,737 5,531,774 92,644 121,665 Total Liabilities 56,278,566$ 58,139,367$ 92,644$ 121,665$
Net AssetsInvested in Capital Assets, Net of Related Debt 48,214,716$ 47,152,557$ 371,425$ 400,723$ Restricted 8,644,609 6,876,066 - - Unrestricted (2,140,375) (856,048) 235,200 202,477 Total Net Assets 54,718,950$ 53,172,575$ 606,625$ 603,200$
Table 1Net Assets
Governmental Activities Business-type Activities
The district’s combined net assets were $55,325,575 on June 30, 2011. This was an increase of $1,549,800, 2.88% from the prior year.
-17-

MANALAPAN-ENGLISHTOWN REGIONAL SCHOOL DISTRICT
ENGLISHTOWN, NJ
MANAGEMENT’S DISCUSSION AND ANALYSIS FOR THE FISCAL YEAR ENDED JUNE 30, 2011
UNAUDITED (CONTINUED)
Table 2 shows the changes in net assets from fiscal year 2011 and fiscal year 2010.
Revenues 2011 2010 2011 2010Program Revenues: Charges for Services -$ 618$ 1,494,172$ 1,492,831$ Operating Grant & Contributions 6,808,229 6,716,398 360,597 354,794 General Revenues: Property Taxes 53,051,585 51,592,782 - - Grants and Entitlements 19,140,955 20,633,679 - - Other 305,811 219,862 - - Total Revenues 79,306,580 79,163,339 1,854,769 1,847,625
Program ExpensesInstruction 48,228,392 48,117,074 - - Support Services: Pupils and Instructional Staff 8,068,021 9,034,478 - - General Administration, School Administration, and Central Srvcs 5,330,274 5,622,186 - - Operations and Maint. Of Facilities 7,355,550 8,451,271 - - Pupil Transportation 5,723,635 5,442,491 - - Interest on debt 3,054,333 2,428,292 - - Food Service - - 1,851,344 1,856,888 Total Expenses 77,760,205 79,095,792 1,851,344 1,856,888
Increase(Decrease) in Net Assets 1,546,375$ 67,547$ 3,425$ (9,263)$
Table 2Changes in Net Assets
Governmental Activities Business-type Activities
Governmental Activities The unique nature of property taxes in New Jersey creates the legal requirements to annually seek voter approval for the District operations. Property taxes made up 66.89% of revenues for governmental activities for the Manalapan-Englishtown Regional Public School District for fiscal year 2011 and 65.17% of revenues for fiscal year 2010. Property tax revenues increased by $1,458,803, which is a 2.8% increase from the prior year. The District’s total revenues for governmental activities were $79,306,580 for the year ended June 30, 2011. Federal, state and local grants accounted for another 24.14% of revenue.
-18-

MANALAPAN-ENGLISHTOWN REGIONAL SCHOOL DISTRICT ENGLISHTOWN, NJ
MANAGEMENT’S DISCUSSION AND ANALYSIS FOR THE FISCAL YEAR ENDED JUNE 30, 2011
UNAUDITED (CONTINUED)
Sources of Revenues for Fiscal Year 2011
Expenses for Fiscal Year 2011
The total cost of all programs and services was $77,760,205. Instruction comprised 62.0% of district expenses. Business-Type Activities Revenues for the District’s business-type activities (food service program) were comprised of charges for services and federal and state reimbursements.
� Food service revenues exceeded expenses by $3,425.
� Charges for services, which are the amounts paid by patrons for daily food services, represent $1,494,172 of total revenue.
� Federal and state reimbursements for meals, including payments for free and
reduced lunches and donated commodities, were $360,597.
State Aid24.1%
Property Taxes66.9%
Operating Grants8.6%
Other0.4%
Administration6.9%
Student Support Services
10.4%
Instruction62.0%
Other3.9%Maintenance &
Operations9.5%
Transportation7.4%
-19-

MANALAPAN-ENGLISHTOWN REGIONAL SCHOOL DISTRICT ENGLISHTOWN, NJ
MANAGEMENT’S DISCUSSION AND ANALYSIS FOR THE FISCAL YEAR ENDED JUNE 30, 2011
UNAUDITED (CONTINUED) Governmental Activities The Statement of Activities shows the cost of program services and the charges for services and grants offsetting those services. Table 3 shows the total cost of services and the net cost of services. The net cost shows the financial burden that was placed on the District’s taxpayers by each of these functions.
Total Cost of Net Cost of Total Cost of Net Cost ofServices 2011 Services 2011 Services 2010 Services 2010
Instruction 48,228,392$ 43,376,390$ 48,117,074$ 43,511,662$ Support Services: Pupils and Instructional Staff 8,068,021 7,692,496 9,034,478 8,618,798 General Administration, School Administration, and Central Srvcs 5,330,274 4,712,512 5,622,186 4,878,100 Operations and Maint. Of Facilities 7,355,550 6,916,529 8,451,271 7,958,426 Pupil Transportation 5,723,635 5,382,016 5,442,491 5,125,106 Interest on debt 3,054,333 2,872,033 2,428,292 2,286,684 Total Expenses 77,760,205$ 70,951,976$ 79,095,792$ 72,378,776$
Table 3Cost of Services
� Instruction expenses include activities directly dealing with the teaching of pupils and the interaction between teacher and student, including extracurricular activities.
� Pupils and instructional staff include the activities involved with assisting staff with the
content and process of teaching to students, including curriculum and staff development.
� General administration, school administration and business include expenses associated with administrative and financial supervision of the District.
� Operation and maintenance of facilities activities involve keeping the school grounds,
buildings, and equipment in effective working condition.
� Pupil transportation includes activities involved with the conveyance of students to and from school, as well as to and from school activities, as provided by state law.
� Interest and fiscal charges involve the transactions associated with the payment of
interest and other related charges to District debt. The School District’s Funds All governmental funds (i.e., general fund, special revenue fund, capital projects fund and debt service fund presented in the fund-based statements) are accounted for using the modified accrual basis of accounting. Total revenues amounted to $79,282,799 and expenditures were $79,178,578. The net positive changes in fund balances for the year were in the general fund, which showed an increase of $1,642,717, the capital projects fund, which showed a decrease of $1,422,281 and the debt service fund, which showed an increase of $1,384. The most significant change was in the capital projects fund, which is due to continued construction costs paid during the year for the Taylor Mills, Lafayette Mills, Manalapan-Englishtown Middle School and Pine Brook schools. The increase in the general fund was primarily due to budget cuts, employee
-20-

MANALAPAN-ENGLISHTOWN REGIONAL SCHOOL DISTRICT
ENGLISHTOWN, NJ
MANAGEMENT’S DISCUSSION AND ANALYSIS FOR THE FISCAL YEAR ENDED JUNE 30, 2011
UNAUDITED (CONTINUED)
layoffs and wage freezes. As demonstrated by the various statements and schedules included in the financial section of this report, the District continues to meet its responsibility for sound financial management.
2011 2010 PercentAmount Amount Change
Property taxes 53,051,585$ 51,592,782$ 2.83%Tuition - 618 -100.00%Interest earnings 5,380 8,984 -40.12%Miscellaneous 296,182 241,804 22.49%State sources 23,723,115 22,454,877 5.65%Federal sources 2,206,537 4,864,274 -54.64%
Total 79,282,799$ 79,163,339$ 0.15%
Table 4Revenues for the Fiscal Year Ended June 30,
Revenues were up $119,360 or .15% over the prior year, mostly due to an increase in state aid and property taxes. We saw a decrease in federal funding due to the one year funding of American Reinvestment Recovery Act (ARRA) funds in 2010. Interest earnings significantly decreased due to lowered interest rates because of current economic conditions.
2011 2010 PercentAmount Amount Change
Salaries and wages 43,286,024$ 45,961,920$ -5.82%Benefits 17,320,315 16,331,470 6.05%Purchased services 9,629,553 9,705,410 -0.78%Supplies and other 2,582,023 2,810,274 -8.12%Capital outlay 2,309,714 2,107,383 9.60%Debt service 4,050,949 4,066,662 -0.39%
Total 79,178,578$ 80,983,119$ -2.23%
Table 5Expenditures for the Fiscal Year Ended June 30,
Expenditures were down $1,804,541 or 2.23% over the prior year. The overall decrease is due to budget cuts, employee layoffs and wage freezes. Capital outlay increased due to projects being completed.
-21-

MANALAPAN-ENGLISHTOWN REGIONAL SCHOOL DISTRICT ENGLISHTOWN, NJ
MANAGEMENT’S DISCUSSION AND ANALYSIS FOR THE FISCAL YEAR ENDED JUNE 30, 2011
UNAUDITED (CONTINUED) Fund balance is an integral part of the district financial position. The unreserved and undesignated fund balances in the general fund for the past six years are as follows:
School Year GAAP Budgetary Basis05-06 418,537 1,324,202 06-07 478,393 1,323,525 07-08 511,166 1,420,992 08-09 (424,907) 372,805 09-10 (563,211) 1,571,181 10-11 (91,073) 1,672,188
Table 6Fund Balance
In 2003, P.L. 2003, c.97 provided that in the event a state school aid payment is not made until the following school budget year, districts must record the last state aid payment as revenue, for budget purposes only, in the current school budget year. The bill provides the legal authority for school districts to recognize this revenue in the current budget year. For intergovernmental transactions, GASB Statement No. 33 requires that recognition (revenue, expenditure, asset, liability) should be in symmetry, i.e., if one government recognizes an asset, the other government recognizes the liability. Since the state is recording the last state aid payment in the subsequent fiscal year, the District cannot recognize the last state aid payment on the GAAP financial statements until the year the state records the payable. General Fund Budgeting Highlights The District’s budget is prepared according to New Jersey law, and is based on accounting for certain transactions on a basis of modified accrual and encumbrance accounting. The most significant budgeted fund is the general fund. During the course of the fiscal year 2011, the District revised the annual operating budget several times. Revisions in the budget were made to recognize revenues that were not anticipated and to prevent over-expenditures in specific line item accounts. The following explains the reasons for significant budget transfers:
� The district received $303,476 in extraordinary aid for special education costs that was not budgeted. The district is eligible to receive additional funding for each special education student whose program costs exceed $40,000. However, the state does not have adequate funding for these students and prorates the amount given to districts based on the applications received for this aid and the total amount allocated. Since there is no guarantee that the district will receive any funds in this category, we do not include this potential source of funds in our revenue budget.
� TPAF, which is the state’s contribution to the pension fund, is an “on-behalf” revenue and expenditure item to the District and is required to be reflected in the financial statements.
� Legal services for construction litigation, employee litigation and special education cases.
� Significant price increases for fuel for the district buses and other district vehicles. � Increases in transportation contract repair services. � Additional students sent out of district.
-22-
MANALAPAN-ENGLISHTOWN REGIONAL SCHOOL DISTRICT ENGLISHTOWN, NJ
MANAGEMENT’S DISCUSSION AND ANALYSIS FOR THE FISCAL YEAR ENDED JUNE 30, 2011
UNAUDITED (CONTINUED)
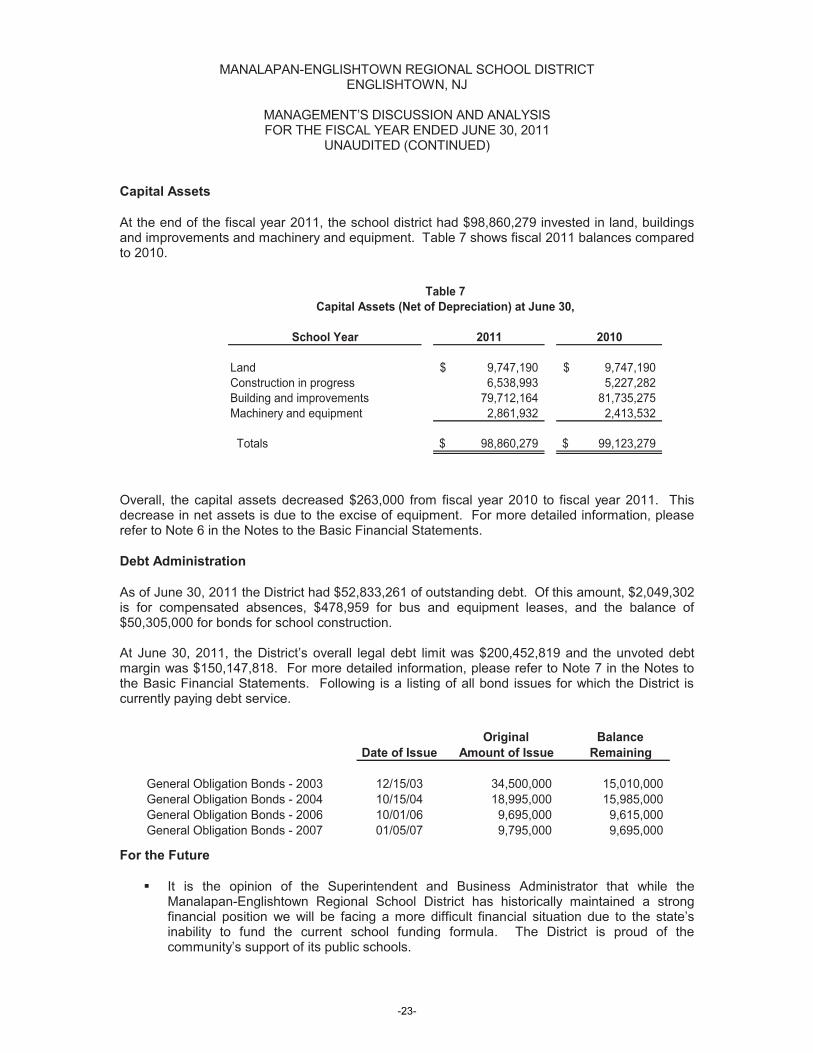
Capital Assets At the end of the fiscal year 2011, the school district had $98,860,279 invested in land, buildings and improvements and machinery and equipment. Table 7 shows fiscal 2011 balances compared to 2010.
School Year 2011 2010
Land 9,747,190$ 9,747,190$ Construction in progress 6,538,993 5,227,282 Building and improvements 79,712,164 81,735,275 Machinery and equipment 2,861,932 2,413,532
Totals 98,860,279$ 99,123,279$
Table 7Capital Assets (Net of Depreciation) at June 30,
Overall, the capital assets decreased $263,000 from fiscal year 2010 to fiscal year 2011. This decrease in net assets is due to the excise of equipment. For more detailed information, please refer to Note 6 in the Notes to the Basic Financial Statements. Debt Administration As of June 30, 2011 the District had $52,833,261 of outstanding debt. Of this amount, $2,049,302 is for compensated absences, $478,959 for bus and equipment leases, and the balance of $50,305,000 for bonds for school construction. At June 30, 2011, the District’s overall legal debt limit was $200,452,819 and the unvoted debt margin was $150,147,818. For more detailed information, please refer to Note 7 in the Notes to the Basic Financial Statements. Following is a listing of all bond issues for which the District is currently paying debt service.
Original BalanceDate of Issue Amount of Issue Remaining
General Obligation Bonds - 2003 12/15/03 34,500,000 15,010,000 General Obligation Bonds - 2004 10/15/04 18,995,000 15,985,000 General Obligation Bonds - 2006 10/01/06 9,695,000 9,615,000 General Obligation Bonds - 2007 01/05/07 9,795,000 9,695,000
For the Future
� It is the opinion of the Superintendent and Business Administrator that while the Manalapan-Englishtown Regional School District has historically maintained a strong financial position we will be facing a more difficult financial situation due to the state’s inability to fund the current school funding formula. The District is proud of the community’s support of its public schools.
-23-

MANALAPAN-ENGLISHTOWN REGIONAL SCHOOL DISTRICT ENGLISHTOWN, NJ
MANAGEMENT’S DISCUSSION AND ANALYSIS FOR THE FISCAL YEAR ENDED JUNE 30, 2011
UNAUDITED (CONTINUED)
� Key areas of concern are the decreased state funding, the new funding formula for
schools that was enacted in January 2008 and the continued necessary increased reliance on local property taxes. Manalapan-Englishtown Regional is primarily a residential community with very few commercial ratables; thus the burden is focused on homeowners to bear the tax burden.
� With the continued concern over property taxes it is important to highlight the areas of
either shared services or buying cooperatives in an effort to reduce expenses. These areas include utilizing Educational Data Services, Middlesex Regional Educational Services Commission, Monmouth Ocean Educational Services Commission, and Manalapan Township Refuse & Recycling Co-Op for the purchase of classroom supplies, art supplies, maintenance supplies, copy paper, and other services. As part of the 1998 bond referendum, the district built a new fuel facility at the Wemrock School site; this includes a fully operating maintenance center and includes bus washing capabilities, which the district will offer to neighboring districts as part of on-going cost efficiencies. The District is exploring further opportunities for future purchases jointly with other districts within the Freehold Regional area.
� In conclusion, the Manalapan-Englishtown Regional Public School District has committed
itself to financial excellence for many years. In addition, the District’s system for financial planning, budgeting and internal financial controls are well regarded. The District plans to continue its sound fiscal management practices to meet the challenges of the future.
Contacting the School District’s Financial Management This financial report is designed to provide our citizens, taxpayers, investors and creditors with a general overview of the school district’s finances and to show the school district’s accountability for the money it receives. If you have questions about this report or need additional information, contact Veronica Wolf, School Business Administrator/Board Secretary, Manalapan-Englishtown Regional Board of Education, 54 Main Street, Englishtown, NJ 07746 or e-mail [email protected].
-24-

DISTRICT-WIDE FINANCIAL STATEMENTS
The statements of net assets and the statement of activities display information about the District. These statements include the financial activities of the overall District; except for fiduciary activities. Eliminations have been made to minimize the double-counting of internal activities. These statements distinguish between the governmental and business type activities of the District.
-25-

-26-

Exhibit A-1
Governmental Business-typeActivities Activities Total
ASSETSCash and cash equivalents 9,443,423$ 279,413$ 9,722,836$ Receivables, net 12,468 2,002 14,470 Receivables - state 1,611,969 - 1,611,969 Receivables - other governments 513,586 17,993 531,579 Inventory - 28,436 28,436 Bond defeasance cost 365,000 - 365,000 Deferred bond issuance costs, net 190,791 - 190,791 Capital assets, net (Note 6): 98,860,279 371,425 99,231,704 Total assets 110,997,516 699,269 111,696,785
LIABILITIESAccounts payable 1,131,166 80,156 1,211,322 Accrued expenses - - - Accrued bond interest 417,395 - 417,395 Other current liabilities 1,825,851 - 1,825,851 Deferred revenue 70,893 12,488 83,381 Noncurrent liabilities (Note 7): Due within one year 2,245,432 - 2,245,432 Due beyond one year 50,587,829 - 50,587,829 Total liabilities 56,278,566 92,644 56,371,210
NET ASSETSInvested in capital assets, net of related debt 48,214,716 371,425 48,586,141 Restricted for: Debt service 1,810 - 1,810 Capital projects 2,397,817 - 2,397,817 Other purposes 6,244,982 - 6,244,982 Unrestricted (2,140,375) 235,200 (1,905,175) Total net assets 54,718,950$ 606,625$ 55,325,575$
MANALAPAN-ENGLISHTOWN REGIONAL SCHOOL DISTRICTStatement of Net Assets
June 30, 2011
See accompanying notes to basic financial statements.
-21--27-

Exhibit A-2
Net (Expense) Revenue andProgram Revenues Changes in Net Assets
Operating CapitalCharges for Grants and Grants and Governmental Business-type
Functions/Programs Expenses Services Contributions Contributions Activities Activities Total
Governmental activities:Current: Regular instruction 33,965,643$ -$ 2,859,977$ -$ (31,105,666)$ -$ (31,105,666)$ Special schools instruction 11,552,809 - 1,799,463 - (9,753,346) - (9,753,346) Other special instruction 2,679,122 - 159,905 - (2,519,217) (2,519,217) Nonpublic school programs 30,818 - 32,657 - 1,839 1,839 Support services and undistributed costs: Tuition 1,776,313 - - - (1,776,313) (1,776,313) Student & instruction related services 6,291,708 - 375,525 - (5,916,183) - (5,916,183) General administration 1,195,452 - 370,973 - (824,479) - (824,479) School administrative services 2,771,894 - 165,442 - (2,606,452) - (2,606,452) Central services 972,595 - 58,050 - (914,545) - (914,545) Administrative information technology 390,333 - 23,297 - (367,036) - (367,036) Plant operations & maintenance 7,355,550 - 439,021 - (6,916,529) - (6,916,529) Pupil transportation 5,723,635 - 341,619 - (5,382,016) - (5,382,016) Other support services - - - - - - - Special schools - - - - - - - Interest on long-term debt 3,054,333 - 182,300 - (2,872,033) - (2,872,033) Unallocated depreciation - - - - - - - Total governmental activities 77,760,205 - 6,808,229 - (70,951,976) - (70,951,976)
Business-type activities: Food service 1,851,344 1,494,172 360,597 - - 3,425 3,425 Total business-type activities 1,851,344 1,494,172 360,597 - - 3,425 3,425
Total primary government 79,611,549$ 1,494,172$ 7,168,826$ -$ (70,951,976)$ 3,425$ (70,948,551)$
General revenues:Taxes: Property taxes levied for general purpose 49,550,724 - 49,550,724
Taxes levied for debt service 3,500,861 - 3,500,861Federal and state aid - not restricted 18,590,865 - 18,590,865 State aid - restricted 550,090 - 550,090Miscellaneous income 300,431 - 300,431Investment earnings 5,380 - 5,380
Total general revenues, special items, extraordinary items and transfers 72,498,351 - 72,498,351
Change in net assets 1,546,375 3,425 1,549,800
Net assets—beginning 53,172,575 603,200 53,775,775
Net assets—ending 54,718,950$ 606,625$ 55,325,575$
MANALAPAN-ENGLISHTOWN REGIONAL SCHOOL DISTRICTStatement of Activities
For the Fiscal Year Ended June 30, 2011
See accompanying notes to basic financial statements.
-22--28-

FUND FINANCIAL STATEMENTS
The individual fund statements and schedules present more detailed information for the individual fund in a format that segregates information by fund type.
-29-

-30-

Exhibit B-1
Special Capital Debt TotalGeneral Revenue Projects Service Governmental
Fund Fund Fund Fund Funds
ASSETS Cash and cash equivalents 3,989,348$ -$ 1,412,454$ 380,663$ 5,782,465$ Receivables, net - 12,468 - - 12,468 Due from other funds 728,540 - - - 728,540 Receivables from other governments 573,576 513,586 1,038,393 - 2,125,555 Restricted cash and cash equivalents 3,660,958 - - - 3,660,958 Total assets 8,952,422$ 526,054$ 2,450,847$ 380,663$ 12,309,986$
LIABILITIES AND FUND BALANCES Liabilities: Accounts payable 1,014,246 63,890 53,030 - 1,131,166 Interfund payable - 349,687 - 378,853 728,540 Payable to state government - 53,297 - - 53,297 Deferred revenue 28,113 42,780 - - 70,893 Other current liabilities 1,756,154 16,400 - - 1,772,554 Total liabilities 2,798,513 526,054 53,030 378,853 3,756,450
Fund Balances: Restricted for: Excess surplus 587,514 - - - 587,514 Excess surplus -- designated for Subsequent year's expenditures 657,729 - - - 657,729 Maintenance reserve account 1,600,000 - - - 1,600,000 Capital reserve account 2,060,958 - - - 2,060,958 Debt service fund - - - 1,810 1,810 Capital Projects - - 777,951 - 777,951 Committed to: Other purposes 963,782 - 1,619,866 - 2,583,648 Assigned to: Designated by the BOE for subsequent year's expenditures 374,999 - - - 374,999 Unreserved, reported in: General fund (91,073) - - - (91,073) Capital projects fund - - - - - Permanent fund - - - - - Total Fund balances 6,153,909 - 2,397,817 1,810 8,553,536 Total liabilities and fund balances 8,952,422$ 526,054$ 2,450,847$ 380,663$
Amounts reported for governmental activities in the statement of net assets (A-1) are different because:
Capital assets used in governmental activities are not financial resources and therefore are not reported in the funds. The cost of the assets are $135,390,854 and the accumulated depreciation is $36,530,575. 98,860,279
The costs associated with the issues of the various bonds are expensed in the governmental funds in the year the bonds are issued, but are capitalized in the Statement of Net Assets. The bond issuance costs are $559,255 and the accumulated amortization is $368,464. 190,791
Accrued bond interest (417,395)
Bond defeasance cost are $1,095,000 and the accumulated amortization is $730,000. 365,000
Long-term liabilities, including bonds payable, are not due and payable in the current period and therefore are not reported as liabilties in the funds. (52,833,261)
Net assets of governmental activities 54,718,950$
Major Funds
MANALAPAN-ENGLISHTOWN REGIONAL SCHOOL DISTRICTBalance Sheet
Governmental FundsJune 30, 2011
See accompanying notes to basic financial statements.
-23--31-

Exhibit B-2
Special Capital Debt TotalGeneral Revenue Projects Service Governmental
Fund Fund Fund Fund Funds
REVENUESLocal sources: Local tax levy 49,550,724$ -$ -$ 3,500,861$ 53,051,585$ Tuition charges - - - - - Interest on investments 2,350 - 1,382 - 3,732 Interest earned on capital reserve funds 1,648 - - - 1,648 Miscellaneous 276,650 19,532 - - 296,182 Total - Local Sources 49,831,372 19,532 1,382 3,500,861 53,353,147 State sources 23,126,015 47,010 - 550,090 23,723,115 Federal sources - 2,206,537 - - 2,206,537 Total revenues 72,957,387 2,273,079 1,382 4,050,951 79,282,799
EXPENDITURESCurrent: Regular instruction 22,951,719 832,713 - - 23,784,432 Special education instruction 7,841,838 1,109,926 - - 8,951,764 Other special instruction 2,011,394 - - - 2,011,394 Nonpublic school programs - 30,818 - - 30,818 Support services and undistributed costs: Tuition 1,776,313 - - - 1,776,313 Student & instruction related services 6,094,814 - - - 6,094,814 General administration 921,129 272,823 - - 1,193,952 School administrative services 2,752,470 - - - 2,752,470 Central services 972,595 - - - 972,595 Administrative information technology 390,333 - - - 390,333 Plant operations & maintenance 7,404,814 - - - 7,404,814 Pupil transportation 5,728,581 - - - 5,728,581 Employee benefits 11,128,801 - - - 11,128,801 Debt service: Principal - - - 1,750,000 1,750,000 Interest and other charges - - - 2,300,949 2,300,949 Capital outlay 1,457,468 26,799 1,422,281 - 2,906,548
Total expenditures 71,432,269 2,273,079 1,422,281 4,050,949 79,178,578
Excess (Deficiency) of revenues over expenditures 1,525,118 - (1,420,899) 2 104,221
OTHER FINANCING SOURCES (USES)Capital leases 117,599 - - - 117,599 Transfer in - - - 1,382 1,382 Transfers out - - (1,382) - (1,382) Total other financing sources and uses 117,599 - (1,382) 1,382 117,599
Net change in fund balances 1,642,717 - (1,422,281) 1,384 221,820 Fund balance—July 1 4,511,192 - 3,820,098 426 8,331,716 Fund balance—June 30 6,153,909$ -$ 2,397,817$ 1,810$ 8,553,536$
MANALAPAN-ENGLISHTOWN REGIONAL SCHOOL DISTRICTStatement of Revenues, Expenditures, And Changes in Fund Balances
Governmental FundsFor the Fiscal Year Ended June 30, 2011
See accompanying notes to basic financial statements.
-24--32-

Exhibit B-3
Total net change in fund balances - governmental funds (from B-2) 221,820$
Amounts reported for governmental activities in the statementof activities (A-2) are different because:
Capital outlays are reported in governmental funds as expenditures. However, in the statement of activities, the cost of those assets is allocated over their estimated useful lives as depreciation expense.This is the amount by which capital outlays exceeded depreciation in the period.
Depreciation expense 2,912,007 Capital outlays (3,390,984) (478,977)
In the statement of activities, only the gain on the disposal of capital assets is reported, whereasin the governmental funds, the proceeds from a sale increase financial resources. Thus, the change innet assets will differ from the change in fund balance by the cost of the asset removed.
Accumulated depreciation on capital assets sold orretired during the fiscal year ended June 30, 2011 (3,817,955)
Cost basis of capital assets sold or retired during the fiscal year ended June 30, 2011 4,010,151 192,196
Repayment of bond principal is an expenditure in the governmental funds, but the repayment reduceslong-term liabilities in the statement of net assets and is not reported in the statement of activities. 1,750,000
In the statement of activities, interest on long-term debt is accrued, regardless of when due. In the governmental funds, interest is reported when due. The change in accrued interest is an addition to the reconciliation. 9,485
In the Statement of Net Assets, the bond defeasance costs is capitalized as an other asset. In the governmental funds, the cost is amortized. (634,187)
In the Statement of Activities, the amortization of bond issuance costs is recorded as interest expense . In the governmental funds, the amortization is not recorded. (13,162)
In the Statement of Activities, the principal payments on capital leases are recorded as a reduction in the long-term liability. In the governmental funds, the payments is an expenditure.(Amount is net of payments included in capital outlay) 213,023
In the Statement of Activities, the payment for litigation settlement is recorded as a reduction in the long-term liability. In the governmental funds, the payments is an expenditure. 253,954
In the statement of activities, the fair market value of donated capital assets should be recognizedas revenue in the period when all eligibility requirements are met (typically in the period whenownership is transferred). In the Governmental Funds, however, the fair market value of thesedonated assets are not reported as an increase in financial resources. 23,781
In the statement of activities, certain operating expenses, e.g., compensated absences (sick leave) andspecial termination benefits (early retirement incentive) are measured by the amounts earned during the year. In the governmental funds, however, expenditures for these items are reported in the amount of financial resources used, essentially, the amounts actually paid. When the earned amount exceeds the paid amount, the difference is a reduction in the reconciliation; when the paid amount exceeds the earned amount, the difference is an addition to the reconciliation. 8,442
Change in net assets of governmental activities 1,546,375$
MANALAPAN-ENGLISHTOWN REGIONAL SCHOOL DISTRICT
For the Fiscal Year Ended June 30, 2011
Reconciliation of the Statement of Revenues, Expenditures,and Changes in Fund Balances of Governmental Funds
to the Statement of Activities
See accompanying notes to basic financial statements.
-25--33-

Exhibit B-4
Food Service
ASSETS
Current assets:Cash and cash equivalents 279,413$ Investments - Accounts receivable 17,993 Other receivables 2,002 Inventories 28,436 Total current assets 327,844
Noncurrent assets:Building improvements 192,533 Furniture, machinery & equipment 1,303,303 Less accumulated depreciation (1,124,411) Total noncurrent assets 371,425 Total assets 699,269$
LIABILITIES
Current liabilities:Accounts payable 80,156$ Deferred revenue 12,488 Compensated absences - Total current liabilities 92,644
Noncurrent liabilities:Compensated absences - Total noncurrent liabilities - Total liabilities 92,644
NET ASSETS
Invested in capital assets net of related debt 371,425 Restricted for: Capital projects - Unrestricted 235,200 Total net assets 606,625 Total liabilities and net assets 699,269$
Business-type-activities-Enterprise Funds
MANALAPAN-ENGLISHTOWN REGIONAL SCHOOL DISTRICTStatement of Net Assets
Proprietary FundsJune 30, 2011
See accompanying notes to basic financial statements.
-26--34-

Exhibit B-5
Business-type Activities - Enterprise Fund
Food Service
Operating revenues:Charges for services: Daily sales - reimbursable programs 844,570$ Daily sales - non-reimbursable programs 639,863 Special functions 9,739 Total operating revenues 1,494,172
Operating expenses:Cost of sales 858,345 Salaries 529,810 Employee benefits 176,070 Other purchased professional services 129,562 Cleaning, repair and maintenance services 40,793 Miscellaneous expense 7,202 General supplies 43,011 Depreciation 66,551 Total Operating Expenses 1,851,344 Operating income (loss) (357,172)
Nonoperating revenues (expenses):State sources: State school lunch program 22,205 Federal sources: National school lunch program 250,405 Special milk program 5,977 Food distribution program 81,889 Interest and investment revenue 121 Total nonoperating revenues (expenses) 360,597 Change in net assets 3,425
Total net assets—beginning 603,200 Total net assets—ending 606,625$
MANALAPAN-ENGLISHTOWN REGIONAL SCHOOL DISTRICTStatement of Revenues, Expenses, and Changes in Fund Net Assets
Proprietary FundsFor the Year Ended June 30, 2011
See accompanying notes to basic financial statements.
-27--35-

Exhibit B-6
Food Service
Cash Flows from Operating Activities: Receipts from customers and other funds 1,497,835$ Payments to employees (529,810) Payments for employee benefits (176,070) Payments to suppliers (1,035,052)
Net cash used for operating activities (243,097)
Cash Flows from Noncapital Financing Activities State sources 22,205 Federal sources 256,382
Net cash provided by noncapital financing activities 278,587
Cash Flows from Capital and Related Financing Activities Purchases of fixed assets (37,253)
Net cash used for capital and related financing activities (37,253)
Cash Flows from Investing Activities Interest on investments 121
Net cash provided by investing activities 121
Net increase (decrease) in cash and cash equivalents (1,642) Balances-beginning of the year 281,055 Balances-end of the year 279,413$
Reconciliation of operating income (loss) to net cash provided by (used for) opeating activities:
Operating loss (357,172)$ Adjustments to reconcile operating loss to cash used by operating activities: Depreciation 66,551 Federal commodities 81,889 Change in assets and liabilities: Decrease (increase) in interfund receivable 3,225 Decrease (increase) in accounts receivable 438 Decrease (increase) in inventory (5,782) Increase (decrease) in accounts payable (32,246)
Total adjustments 114,075 Net cash used by operating activities (243,097)$
MANALAPAN-ENGLISHTOWN REGIONAL SCHOOL DISTRICTFood Services Enterprise Fund
Statement of Cash Flowsfor the Fiscal Year ended June 30, 2011
See accompanying notes to basic financial statements.
-28--36-

Exhibit B-7
Unemployment Private Purpose Total Student Flex TotalCompensation Trust Scholarship Fund Trust Fund Activity Payroll Spending Agency
ASSETSCash and cash equivalents 600,982$ 3,540$ 604,522$ 49,497$ 123,911$ 26,390$ 199,798$ Other Accounts Receivable - - - - - - - Intrafund receivable 68,844 - 68,844 - - - - Total assets 669,826 3,540 673,366 49,497$ 123,911$ 26,390$ 199,798$
LIABILITIES Accounts payable 25,748 - 25,748 - 14 - 14 Payroll deductions and withholdings - - - - 55,053 26,390 81,443 Payable to student groups - - - 49,497 - - 49,497 Intrafund payable - - - - 68,844 - 68,844 Other current liabilities - - - - - - - Total liabilities 25,748$ -$ 25,748$ 49,497$ 123,911$ 26,390$ 199,798$
NET ASSETSHeld in trust for unemployment claims and other purposes 644,078 - 644,078 Reserved for scholarships - 3,540 3,540 Total net assets 644,078 3,540 647,618
- - - Total liabilities and net assets 669,826$ 3,540$ 673,366$
Trust Agency
MANALAPAN-ENGLISHTOWN REGIONAL SCHOOL DISTRICTStatement of Fiduciary Net Assets
June 30, 2011
See accompanying notes to basic financial statements.
-29--37-

Exhibit B-8
Unemployment Private Purpose TotalCompensation Trust Scholarship Fund Trusts
ADDITIONSContributions: Plan member 68,844$ -$ 68,844$ Other 300,000 - 300,000 Total Contributions 368,844 - Investment earnings: Net increase (decrease) in fair value of investments - - - Interest 211 - 211 Dividends - - - Less investment expense - - - Net investment earnings 211 - Total additions 369,055 -
DEDUCTIONSQuarterly contribution reports - - - Unemployment claims 446,151 - 446,151 Scholarships awarded - - - Refunds of contributions - - - Administrative expenses 1,491 - 1,491 Total deductions 447,642 -
Change in net assets (78,587) - (78,587)
Net assets—beginning of the year 722,665 3,540 726,205
Net assets—end of the year 644,078$ 3,540$ 647,618
MANALAPAN-ENGLISHTOWN REGIONAL SCHOOL DISTRICTStatement of Changes in Fiduciary Net Assets
Fiduciary FundsFor the Fiscal Year Ended June 30, 2011
See accompanying notes to basic financial statements.
-30--38-

MANALAPAN-ENGLISHTOWN REGIONAL SCHOOL DISTRICT
Notes to Basic Financial Statements
June 30, 2011 1. DESCRIPTION OF THE SCHOOL DISTRICT AND REPORTING ENTITY
Manalapan-Englishtown Regional School District (District) is organized under the Constitution of the State of New Jersey. The District operates under a locally elected Board form of government consisting of nine members elected to three-year terms, which are staggered. The District provides educational services as authorized by state and federal guidelines. The District serves an area of 32 square miles. It is located in Monmouth County and provides education for all of Manalapan-Englishtown Regional’s students in grades K through 8. The District currently operates eight instructional buildings, a transportation depot, buildings and grounds office, and an administrative building. The District services approximately 5,200 students and is one of the largest K through 8 Districts in Monmouth County.
A. Reporting Entity
The Board of Education (Board) is an instrumentality of the State of New Jersey, established
to function as an educational institution. The Board consists of elected officials and is responsible for the fiscal control of the District. A superintendent is appointed by the Board and is responsible for the administrative control of the District. The operations of the District include an early learning center, five elementary schools and two middle schools located in Manalapan and Englishtown, New Jersey.
In evaluating how to define the governmental reporting entity, the District follows the provisions of GASB Statement No. 14 as amended by GASB 39, The Financial Reporting Entity, under which the financial statements include all the organizations, activities, functions and component units for which the District is financially accountable. Financial accountability is defined as the appointment of a voting majority of the component unit’s Board and either (1) the District’s ability to impose its will over the component unit, or (2) the possibility that the component unit will provide a financial benefit to or impose a financial burden on the District. On this basis, the District’s financial reporting entity has no component units.
2. SUMMARY OF SIGNIFICANT ACCOUNTING POLICIES
The financial statements of the Board of the District have been prepared in conformity with generally accepted accounting principles (GAAP) as applied to governmental units. The Governmental Accounting Standards Board (GASB) is the accepted standard-setting body for establishing governmental accounting and financial reporting principles. The more significant of the Board's accounting policies are described below. A. Basis of Presentation
The School District’s basic financial statements consist of District-wide statements, including a statement of net assets and a statement of activities, and fund financial statements which provide a more detailed level of financial information. District-wide Statements: The district-wide financial statements (A-1 and A-2) include the statement of net assets and the statement of activities. These statements report financial information of the District as a whole excluding the fiduciary activities. All interfund activity, excluding the fiduciary funds, has been eliminated in the statement of activities. Individual funds are not displayed but the statements distinguish governmental activities, generally supported through taxes and user fees, from business-type activities, generally financed in whole or in part with fees charged to external customers.
-39-

MANALAPAN-ENGLISHTOWN REGIONAL SCHOOL DISTRICT
Notes to Basic Financial Statements 2. SUMMARY OF SIGNIFICANT ACCOUNTING POLICIES (CONTINUED)
A. Basis of Presentation (continued) The statement of net assets presents the financial condition of the governmental and business-type activity of the School District at fiscal year–end. The statement of activities presents a comparison between direct expenses and program revenues for the business-type activity of the District and for each function of the District’s governmental activities. Direct expenses are those that are specifically associated with a program or function and, therefore, are clearly identifiable to a particular function. Program revenues include (a) fees and charges paid by the recipients of goods or services offered by the programs and (b) grants and contributions that are restricted to meeting the operational or capital requirements of a particular program. Revenues that are not classified as program revenues, including all taxes, are presented as general revenues. The comparison of direct expenses with program revenues identifies the extent to which each governmental function or business segment is self-financing or draws from the general revenues of the School District. Fund Financial Statements: During the fiscal year, the School District segregates transactions related to certain School District functions or activities in separate funds in order to aid financial management and to demonstrate legal compliance. The fund financial statements provide detail of the governmental, proprietary and fiduciary funds. Separate statements for each fund category – governmental, proprietary, and fiduciary – are presented. The New Jersey Department of Education (NJDOE) has elected to require New Jersey districts to treat each governmental fund as a major fund in accordance with the option noted in GASB No. 34, Paragraph 76. The NJDOE believes that the presentation of all funds as major is important for pubic interest and to promote consistency among district financial reporting models.
The District reports the following governmental funds:
General Fund: The general fund is the general operating fund of the District. It is used to account for all financial resources except those required to be accounted for in another fund. Included are certain expenditures for vehicles and movable instructional or non-instructional equipment which are classified in the Capital Outlay sub-fund.
As required by the New Jersey State Department of Education, the District includes in this fund budgeted Capital Outlay. Generally accepted accounting principles as they pertain to governmental entities state that General Fund resources may be used to directly finance capital outlays for long-lived improvements as long as the resources in such cases are derived exclusively from unrestricted revenues.
Resources for budgeted capital outlay purposes are normally derived from State of New Jersey Aid, district taxes and appropriated fund balance. Expenditures are those that result in the acquisition of or additions to capital assets for land, existing buildings, improvements of grounds, construction of buildings, additions to or remodeling of buildings and the purchase of built-in equipment. These resources can be transferred from and to Current Expense by Board resolution.
-40-

MANALAPAN-ENGLISHTOWN REGIONAL SCHOOL DISTRICT
Notes to Basic Financial Statements 2. SUMMARY OF SIGNIFICANT ACCOUNTING POLICIES (CONTINUED)
A. Basis of Presentation (continued)
Special Revenue Fund: The special revenue fund is used to account for the proceeds of specific revenue from state and federal Government, (other than major capital projects, debt service or the enterprise funds) and local appropriations that are legally restricted to expenditures for specified purposes.
Capital Projects Fund: The capital projects fund is used to account for all financial resources to be used for the acquisition or construction of major capital facilities (other than those financed by proprietary funds). The financial resources are derived from temporary notes or serial bonds that are specifically authorized by the voters as a separate question on the ballot either during the annual election or at a special election. Debt Service Fund: The debt service fund is used to account for the accumulation of resources for, and the payment of principal and interest on bonds issued to finance major property acquisition, construction and improvement programs.
The District reports the following proprietary fund:
Enterprise Funds: The Enterprise Funds are utilized to account for operations that are financed and operated in a manner similar to private business enterprises where the intent of the District is that the costs (i.e. expenses including depreciation and indirect costs) of providing goods or services to the students on a continuing basis be financed or recovered primarily through user charges; or, where the District has decided that periodic determination of revenues earned, expenses incurred, and/or net income is appropriate for capital maintenance, public policy, management control, accountability or other purposes. The District's Enterprise Fund is comprised of the Food Service Fund.
Depreciation of all capital assets used by proprietary funds is charged as an expense against their operations. Accumulated depreciation is reported on proprietary fund balance sheets. Depreciation has been provided over the estimated useful lives using the straight-line method. The estimated useful lives are as follows:
Equipment 5-20 Years
Additionally, the District reports the following fund type:
Fiduciary Funds: The Fiduciary Funds are used to account for assets held by the District on behalf of others and includes the Student Activities Fund, Payroll Agency Fund, Unemployment Compensation Insurance Trust Fund and Private Purpose Trust Funds.
-41-

MANALAPAN-ENGLISHTOWN REGIONAL SCHOOL DISTRICT
Notes to Basic Financial Statements
2. SUMMARY OF SIGNIFICANT ACCOUNTING POLICIES (CONTINUED)
B. Basis of Accounting
Basis of accounting determines when transactions are recorded in the financial records and reported on the financial statements. District-wide, proprietary, and fiduciary fund financial statements: The district-wide financial statements are prepared using the accrual basis of accounting. Governmental funds use the modified accrual basis of accounting; the enterprise fund and fiduciary funds use the accrual basis of accounting. Differences in the accrual and modified accrual basis of accounting arise in the recognition of revenue, the recording of deferred revenue, and in the presentation of expenses versus expenditures. The tax revenues are recognized in the year for which they are levied (see Note 2.c.). Revenue from grants, entitlements, and donations is recognized in the fiscal year in which all requirements have been satisfied.
Governmental fund financial statements: Governmental funds are reported using the current financial resources measurement focus and the modified accrual basis of accounting. Revenues are recognized when they are both measurable and available. Available means collectible within the current period or soon thereafter to pay current liabilities. The District considers revenues to be available if they are collected within 60 days of the end of the fiscal year. Expenditures are recorded when the related fund liability is incurred, except for principal and interest on general long-term debt, claims and judgments, and compensated absences, which are recognized as expenditures to the extent they have matured. General capital asset acquisitions are reported as expenditures in governmental funds. Proceeds of general long-term debt and acquisitions under capital leases are reported as other financing sources.
All business-type activities and enterprise funds of the district follow FASB Statements and
Interpretations issued on or before November 30, 1989, Accounting Principles Board Opinions, and Accounting Research Bulletins, unless those pronouncements conflict with GASB pronouncements.
C. Property Taxes
Ad Valorem (Property) Taxes are susceptible to accrual as per New Jersey State Statute whereby a municipality is required to remit to its school district the entire balance of taxes in the amount voted upon or certified, prior to the end of the school year. The District records the entire approved tax levy as revenue (accrued) at the start of the fiscal year, since the revenue is both measurable and available. The District is entitled to receive moneys under the established payment schedule and the unpaid amount is considered to be an "accounts receivable". D. Budgets/Budgetary Control
Annual appropriated budgets are prepared in the spring of each year for the general, special
revenue and debt service funds. The budgets are submitted to the county office and are voted upon at the annual school election on the third Tuesday in April. Budgets are prepared using the modified accrual basis of accounting. The legal level of budgetary control is established at line item accounts within each fund. Line item accounts are defined as the lowest (most specific) level of detail as established pursuant to the minimum chart of accounts referenced in N.J.A.C. 6a:23-1.2.
-42-

MANALAPAN-ENGLISHTOWN REGIONAL SCHOOL DISTRICT
Notes to Basic Financial Statements
2. SUMMARY OF SIGNIFICANT ACCOUNTING POLICIES (CONTINUED)
D. Budgets/Budgetary Control (continued) All budget amendments must be approved by School Board resolution. Budget
amendments were made during the year ended June 30, 2011. Formal budgetary integration into the accounting system is employed as a management
control device during the year. For governmental funds there are no substantial differences between the budgetary basis of accounting and generally accepted accounting principles with the exception of the legally mandated revenue recognition of the last state aid payment for budgetary purposes only and the special revenue fund as noted below. Encumbrance accounting is also employed as an extension of formal budgetary integration in the governmental fund types. Unencumbered appropriations lapse at fiscal year end.
The accounting records of the special revenue fund are maintained on the grant accounting
budgetary basis. The grant accounting budgetary basis differs from GAAP in that the grant accounting budgetary basis recognizes encumbrances as expenditures and also recognizes the related revenues, whereas the GAAP basis does not. Sufficient supplemental records are maintained to allow for the presentation of GAAP basis financial reports.
E. Encumbrances
Under encumbrance accounting purchase orders, contracts and other commitments for the
expenditure of resources are recorded to reserve a portion of the applicable appropriation. Open encumbrances in governmental funds other than the special revenue fund are reported as reservations of fund balances at fiscal year end as they do not constitute expenditures or liabilities but rather commitments related to unperformed contracts for goods and services.
Open encumbrances in the special revenue fund, for which the District has received
advances, are reflected in the balance sheet as deferred revenues at fiscal year end. The encumbered appropriation authority carries over into the next fiscal year. An entry will
be made at the beginning of the next fiscal year to increase the appropriation reflected in the certified budget by the outstanding encumbrance amount as of the current fiscal year end. F. Cash, Cash Equivalents and Investments
Cash and cash equivalents include petty cash, change funds, cash in banks and all highly liquid investments with a maturity of three months or less at the time of purchase and are stated at cost plus accrued interest. U.S. Treasury and agency obligations and certificates of deposit with maturities of one year or less when purchased are stated at cost. All other investments are stated at fair value.
G. Interfund Activity Transfers between governmental and business-type activities on the district-wide statements are reported in the same manner as general revenues. Flows of cash or goods from one fund to another without a requirement for repayment are reported as interfund transfers. Interfund transfers are reported as other financing sources/uses in governmental funds and after non-operating revenues/expenses in the enterprise fund. Repayments from funds responsible for particular expenditures/expenses to the funds that initially paid for them are not presented on the financial statements.
-43-

MANALAPAN-ENGLISHTOWN REGIONAL SCHOOL DISTRICT
Notes to Basic Financial Statements 2. SUMMARY OF SIGNIFICANT ACCOUNTING POLICIES (CONTINUED)
G. Interfund Activity (continued) On fund financial statements, short-term interfund loans are classified as interfund receivables/payables. These amounts are eliminated in the statement of net assets, except for amounts between governmental and business-type activities or governmental and agency funds, which are presented as internal balances.
H. Allowances for Uncollectible Accounts No allowance for uncollectible accounts has been recorded as all amounts are considered collectible. I. Inventories and Prepaid Expenses
Inventories and prepaid expenses, which benefit future periods are recorded as an
expenditure during the year of purchase.
Inventories in the enterprise funds are valued at cost, which approximates market, using the first-in-first-out (FIFO) method. Prepaid expenses in the enterprise fund represent payments made to vendors for services that will benefit periods beyond June 30, 2011.
J. Capital Assets
The District has established a formal system of accounting for its capital assets. Purchased or constructed capital assets are reported at cost. Donated capital assets are valued at their estimated fair market value on the date received. The cost of normal maintenance and repairs is not capitalized. The School District does not possess any infrastructure. The capitalization threshold used by school districts in the State of New Jersey is $2,000.
All reported capital assets except for land and construction in progress are depreciated. Depreciation is computed using the straight-line method under the half-year convention over the following estimated useful lives:
Estimated Asset Class Useful Lives
School Building 50 Building Improvements 20 Electrical/Plumbing 30 Vehicles 8 Office & computer equipment 5-10 Instructional equipment 10 Grounds equipment 15 In the fund financial statements, capital assets used in governmental fund operations are accounted for as capital outlay expenditures of the governmental fund upon acquisition. Capital assets are not capitalized and related depreciation is not reported in the fund financial statements.
-44-

MANALAPAN-ENGLISHTOWN REGIONAL SCHOOL DISTRICT
Notes to Basic Financial Statements 2. SUMMARY OF SIGNIFICANT ACCOUNTING POLICIES (CONTINUED)
K. Compensated Absences
Compensated absences are those absences for which employees will be paid, such as vacation, sick leave, and sabbatical leave. A liability for compensated absences that are attributable to services already rendered, and that are not contingent on a specific event that is outside the control of the District and its employees, is accrued as the employees earn the rights to the benefits. Compensated absences that relate to future services, or that are contingent on a specific event that is outside the control of the District and its employees, are accounted for in the period in which such services are rendered or in which such events take place.
In governmental and similar trust funds, compensated absences that are expected to be liquidated with expendable available financial resources are reported as an expenditure and fund liability in the fund that will pay for the compensated absences. In proprietary and similar trust funds, compensated absences are recorded as an expense and liability of the fund that will pay for them.
L. Deferred Revenue
Deferred revenue in the general and special revenue funds represent cash which has been
received but not yet earned.
M. Accrued Liabilities and Long-Term Obligations All payables, accrued liabilities, and long-term obligations are reported on the District-wide
financial statements. In general, governmental fund payables and accrued liabilities that, once incurred, are paid in a timely manner and in full from current financial resources are reported as obligations of the funds. However, contractually required pension contributions and compensated absences that are paid from governmental funds are reported as liabilities on the fund financial statements only to the extent that they are due for payment during the current year. Bonds are recognized as a liability on the fund financial statements when due. The general fund is utilized to liquidate all long-term liabilities other than debt via annual budget appropriation.
N. Net Assets
Net assets represent the difference between assets and liabilities. Net assets invested in capital assets, net of related debt consists of capital assets, net of accumulated depreciation, reduced by the outstanding balance of any borrowing used for the acquisition, construction, or improvement of those assets. Net assets are reported as restricted in the District-wide financial when there are limitations imposed on their use either through the enabling legislation adopted by the School District or through external restrictions imposed by creditors, grantors, or laws or regulations of other governments. The School District’s policy is to first apply restricted resources when an expense is incurred for purposes for which both restricted and unrestricted net assets are available.
-45-

MANALAPAN-ENGLISHTOWN REGIONAL SCHOOL DISTRICT Notes to Basic Financial Statements 2. SUMMARY OF SIGNIFICANT ACCOUNTING POLICIES (CONTINUED)
O. Fund Balance Reserves
In February 2009, the GASB issued GASB Statement No. 54, Fund Balance Reporting and Governmental Fund Type Definitions (“GASB 54”). GASB 54 is effective for periods beginning after June 15, 2010 and established fund balance classifications that comprise a hierarchy based primarily on the extent to which a government is bound to observe constraints imposed upon the use of the use of the resources reported in governmental funds. Under GASB 54, fund balances in the governmental funds financial statements are reported under the modified accrual basis of accounting and classified into the following five categories, as defined below:
1) Nonspendable – includes amounts that cannot be spent because they are either (a) not in spendable form or (b) legally or contractually required to be maintained intact. Assets included in this fund balance category include prepaid assets, inventories, long-term receivables, and corpus of any permanent funds.
2) Restricted – includes amounts that can be spent only for the specific purposes stipulated by constitution, external resource providers, or through enabling legislation.
3) Committed – includes amounts that can be spent only for the specific purposes determined by a formal action of the government’s highest level of decision-making authority.
4) Assigned – amounts intended to be used by the government for specific purposes but do not meet the criteria to be classified as restricted or committed.
5) Unassigned – includes all spendable amounts not contained in the other classifications.
P. Revenues – Exchange and Non-exchange Transactions
Revenue resulting from exchange transactions, in which each party gives and receives essentially equal value, is recorded on the accrual basis when the exchange takes place. On the modified accrual basis, revenue is recorded in the fiscal year in which the resources are measurable and become available. Available means the resources will be collected within the current fiscal year or are expected to be collected soon enough thereafter to be used to pay liabilities of the current fiscal year. For the District, available means within sixty days of the fiscal year-end. Non-exchange transactions, in which the School District receives value without directly giving equal value in return, include property taxes, grants, entitlements, and donations. On the accrual basis, revenue from property taxes is recognized in the fiscal year for which the taxes are levied. Revenue from grants, entitlements, and donations is recognized in the fiscal year in which all eligibility requirements have been satisfied. Eligibility requirements include timing requirements, which specify the year when the resources are required to be used or the fiscal year when use is first permitted; matching requirements, in which the School District must provide local resources to be used for a specified purposes; and expenditure requirements, in which the resources are provided to the School District on a reimbursement basis. On the modified accrual basis, revenue from non-exchange transactions must also be available before it can be recognized. Under the modified accrual basis, the following revenue sources are considered to be both measurable and available at fiscal year-end: property taxes available as an advance, interest, and tuition.
-46-

MANALAPAN-ENGLISHTOWN REGIONAL SCHOOL DISTRICT
Notes to Basic Financial Statements
2. SUMMARY OF SIGNIFICANT ACCOUNTING POLICIES (CONTINUED)
Q. Operating Revenues and Expenses
Operating revenues are those revenues that are generated directly from the primary activity of the enterprise fund. For the School District, these revenues are sales for food service. Operating expenses are necessary costs incurred to provide the service that is the primary activity of the enterprise fund.
R. Management Estimates
The preparation of financial statements in conformity with GAAP requires management to
make estimates and assumptions that affect the reported amounts of revenues and expenditures/expenses during the reporting period. Actual results could differ from those estimates.
S. Allocation of Indirect Expense The District reports all direct expense by function in the statement of activities. Direct expenses are those that are clearly identifiable with a function. Indirect expenses are allocated to functions but are reported separately in the statement of activities. Employee benefits, including the employer’s share of social security, workers’ compensation, and medical, dental and prescription benefits, were allocated based on salaries of that program. Depreciation expense, where practicable, is specifically identified by function and is included in the indirect expense column of the statement of activities. Depreciation expense that could not be attributed to a specific function is considered an indirect expense and is reported separately on the statement of activities. Interest on long-term debt is considered an indirect expense and is reported separately on the statement of activities.
3. CASH AND CASH EQUIVALENTS AND INVESTMENTS
New Jersey school districts are limited as to the types of investments and types of financial institutions they may invest in. New Jersey statute 18A:20-37 provides a list of permissible investments that may be purchased by New Jersey school districts. Additionally, the District has adopted a cash management plan that requires it to deposit public funds in public depositories protected from loss under the provisions of the Governmental Unit Deposit Protection Act ("GUDPA"). GUDPA was enacted in 1970 to protect governmental units from a loss of funds on deposit with a failed banking institution in New Jersey.
N.J.S.A. 17:9-41 et. seq. establishes the requirements for the security of deposits of governmental units. The statute requires that no governmental unit shall deposit public funds in a public depository unless such funds are secured in accordance with GUDPA. Public depositories include savings and loan institutions, banks (both state and national banks) and savings banks the deposits of which are federally insured. All public depositories must pledge collateral, having a market value at least equal to five percent of the average daily balance of collected public funds, to secure the deposits of governmental units. If a public depository fails, the collateral it has pledged, plus the collateral of all other public depositories, is available to pay the full amount of their deposits to the governmental units.
-47-
MANALAPAN-ENGLISHTOWN REGIONAL SCHOOL DISTRICT
Notes to Basic Financial Statements
3. CASH AND CASH EQUIVALENTS AND INVESTMENTS (CONTINUED)
Deposits:
New Jersey statutes require that school districts deposit public funds in public depositories located in New Jersey that are insured by the Federal Deposit Insurance Corporation, the Federal Savings and Loan Insurance Corporation, or by any other agency of the United States that insures deposits made in public depositories. School districts are also permitted to deposit public funds in the State of New Jersey Cash Management Fund.
New Jersey statutes require public depositories to maintain collateral for deposits of public funds that exceed depository insurance limits as follows:
The market value of the collateral must equal at least 5% of the average daily balance of collected public funds on deposit.
In addition to the above collateral requirement, if the public funds deposited exceed 75% of the capital funds of the depository, the depository must provide collateral having a market value at least equal to 100% of the amount exceeding 75%.
All collateral must be deposited with the Federal Reserve Bank of New York, the Federal Reserve Bank of Philadelphia, the Federal Home Loan Bank of New York, or a banking institution that is a member of the Federal Reserve System and has capital funds of not less than $25,000,000. The District’s cash and cash equivalents are classified below to inform financial statement users about the extent to which a government’s deposits and investments are exposed to custodial credit risk. Pursuant to GASB Statement No. 40, “Deposit and Investment Risk Disclosures” (GASB 40), the District’s operating cash accounts are profiled in order to determine exposure, if any, to Custodial Credit Risk (risk that in the event of failure of the counterparty the District would not be able to recover the value of its deposits and investments). Deposits are considered to be exposed to Custodial Credit Risk if they are: uncollateralized (securities not pledged to the depositor), collateralized with securities held by the pledging financial institution, or collateralized with securities held by the financial institution’s trust department or agent but not in the government’s name. As of June 30, 2011 all of the District’s deposits, except as noted below, were collateralized by securities held in its name and, accordingly, not exposed to custodial credit risk. New Jersey statutes require that school districts deposit public funds in public depositories located in New Jersey that are insured by the Federal Deposit Insurance Corporation, the Federal Savings and Loan Insurance Corporation, or by any other agency of the United States that insures deposits made in public depositories. School districts are also permitted to deposit public funds in the State of New Jersey Cash Management Fund. As of June 30, 2011, the carrying amount of the District’s deposits for all funds was $10,527,356 and the bank balance was $11,455,054. All bank deposits, as of the balance sheet date are entirely insured or collateralized by a collateral pool maintained by public depositories as required by GUDPA. Investments: New Jersey statutes permit the Board to purchase the following types of securities: a. Bonds or other obligations of the United States or obligations guaranteed by the United
States. b. Bonds of any Federal Intermediate Credit Bank, Federal Home Loan Bank, Federal
National Mortgage Agency or of any United States Bank for Cooperatives that have a maturity date not greater than twelve months from the date of purchase.
c. Bonds or other obligations of the school district.
-48-

MANALAPAN-ENGLISHTOWN REGIONAL SCHOOL DISTRICT
Notes to Basic Financial Statements
3. CASH AND CASH EQUIVALENTS AND INVESTMENTS (CONTINUED)
b. Bonds of any Federal Intermediate Credit Bank, Federal Home Loan Bank, Federal National Mortgage Agency or of any United States Bank for Cooperatives that have a maturity date not greater than twelve months from the date of purchase.
c. Bonds or other obligations of the school district. As of June 30, 2011, the District’s Cash and Cash Equivalents consisted of the following:
Cash and Cash
Equivalents
Checking Accounts 8,459,161 Capital Reserve 2,060,958 N.J. CMF(Money Market) 7,037 Change Funds 200
Totals 10,527,356 The fiduciary funds had a balance of $804,320 at June 30, 2011.
Custodial Credit Risk: Pursuant to GASB 40, the NJCMF, which is a pooled investment, is exempt from custodial credit risk disclosure. The District does not have a policy for custodial credit risk other than depositing all of its funds in banks covered by GUDPA. Credit Risk: The District does not have an investment policy regarding the management of credit risk. GASB 40 requires that disclosure be made as to the credit rating of all debt security investments except for obligations of U.S. government or investments guaranteed by the U.S. government. The NJCMF is not rated by a rating agency.
Interest Rate Risk: The District does not have a policy to limit interest rate risk. The average maturity of the District’s sole investment, the NJCMF, is less than one year.
4. RESTRICTED CASH RESERVES A. Capital Reserve Account
A capital reserve account was established by the District during fiscal year 2001-2002 in which it deposited $100,000 for the accumulation of funds for use as capital outlay expenditures in subsequent fiscal years. The capital reserve account is maintained in the general fund and its activity is included in the general fund annual budget. Funds placed in the capital reserve account are restricted to capital projects in the District’s Long Range Facilities Plan, (“LRFP”). Upon submission of the LRFP to the department, a district may deposit funds by appropriating funds in the annual general fund budget certified for taxes or by transfer by board resolution at year end of any unanticipated revenue or unexpended line-item appropriation amounts, or both. A district may also appropriate amounts when the express approval of the voters has been obtained either by a separate proposal at budget time or by a special question at one of the four special elections authorized pursuant to N.J.S.A. 19:60-2. Pursuant to N.J.A.C. 6A:23-2.12(g), the balance in the account cannot at any time exceed the local support costs of uncompleted capital projects in its approved LRFP.
-49-

MANALAPAN-ENGLISHTOWN REGIONAL SCHOOL DISTRICT
Notes to Basic Financial Statements
4. RESTRICTED CASH RESERVES (CONTINUED)
A. Capital Reserve Account (Continued)
The activity of the capital reserve for the July 1, 2010 to June 30, 2011 fiscal year is as follows: Beginning balance, July 1, 2010 $778,364 Interest earnings 1,648 Deposit - June 14, 2011 2,000,000 Withdrawals 719,054 Ending balance, June 30, 2011 $2,060,958 The June 30, 2009 LRFP balance of local support costs of uncompleted capital projects is $3,978,750. There were no withdrawals from the capital reserve for DOE approved facilities projects.
B. Maintenance Reserve
A maintenance reserve account was established by the District during fiscal year 2007-2008 in which it deposited $484,791 for the accumulation of funds for use as maintenance expenditures in subsequent fiscal years. The District approved a transfer in June 2009 to the maintenance reserve in the amount of $600,000. The District withdrew $484,791 during the 2009-2010 school year for required maintenance projects. The District approved a transfer in June 2010 to the maintenance reserve in the amount of $500,000. The District withdrew $600,000 during the 2010-2011 school year for required maintenance projects. The District approved a transfer in June 2011 to the maintenance reserve in the amount of $1,100,000. The balance in the maintenance reserve at June 30, 2011 is $1,600,000.
C. Emergency Reserve
An emergency reserve account was established by the District during fiscal year 2008-2009 in which it deposited $250,000 for the accumulation of funds for use as emergency expenditures in subsequent fiscal years. The District withdrew $250,000 during the 2010-2011 school year as approved in the budget. The balance in the emergency reserve at June 30, 2011 is $0.
5. RECEIVABLES
Receivables at June 30, 2011, consisted of accounts (rent and tuition), accrued interest, interfund, intergovernmental, and property taxes. All receivables are considered collectible in full. A summary of the principal items of governmental receivables follows:
Governmental Fund Financial
Statements
District-Wide financial
StatementsProperty Taxes -$ -$ State Aid 1,611,969 3,375,230 Federal Aid 513,586 513,586 Other 12,468 12,468 Gross Receivables 2,138,023 3,901,284 Less: Allowance for Uncollectibles - - Total Receivables, Net 2,138,023 3,901,284
-50-

MANALAPAN-ENGLISHTOWN REGIONAL SCHOOL DISTRICT
Notes to Basic Financial Statements
6. CAPITAL ASSETS
Capital assets consisted of the following at June 30, 2011:
Balance Transfers/ Transfers/ Balance6/30/2010 Additions Retirements 6/30/2011
Governmental Activities:Capital assets not being depreciated Land and land improvements 9,747,190$ -$ -$ 9,747,190$ Construction in progress 5,227,282 1,460,157 (148,446) 6,538,993
Total capital assets not being depreciated 14,974,472 1,460,157 (148,446) 16,286,183
Capital assets being depreciated Building and building imprvmts 106,372,871 531,223 (184,070) 106,720,024 Machinery & equipment 14,949,664 1,261,064 (3,826,081) 12,384,647 Totals at historical cost 121,322,535 1,792,287 (4,010,151) 119,104,671 Less accumulated depreciation for: Building and bldg & land imprvmts (24,637,596) (2,370,264) - (27,007,860) Machinery & equipment (12,536,132) (541,743) 3,555,160 (9,522,715) Total accumulated depreciation (37,173,728) (2,912,007) 3,555,160 (36,530,575) Total capital assets being depreciated, net of accumulated depreciation 84,148,807 (1,119,720) (454,991) 82,574,096
Governmental activity capital assets, net 99,123,279$ 340,437$ (603,437)$ 98,860,279$
Business-type Activities:Capital assets being depreciated Building improvements 192,533$ -$ -$ 192,533$ Machinery & equipment 1,266,050 37,253 - 1,303,303 Totals at historical cost 1,458,583 37,253 - 1,495,836 Less accumulated depreciation for: Building improvements (83,580) (9,627) - (93,207) Machinery & equipment (974,280) (56,924) - (1,031,204) Total accumulated depreciation (1,057,860) (66,551) - (1,124,411)
Enterprise fund capital assets, net 400,723$ (29,298)$ -$ 371,425$
Depreciation expense was charged to governmental functions as follows:
Regular instruction 2,176,627$ Special instruction 152,709 Student & instruction services 196,894 General administration 1,500 School administration 19,424 Plant operations & maintenance 124,405 Student transportation 240,448 Total depreciation expense 2,912,007$
-51-
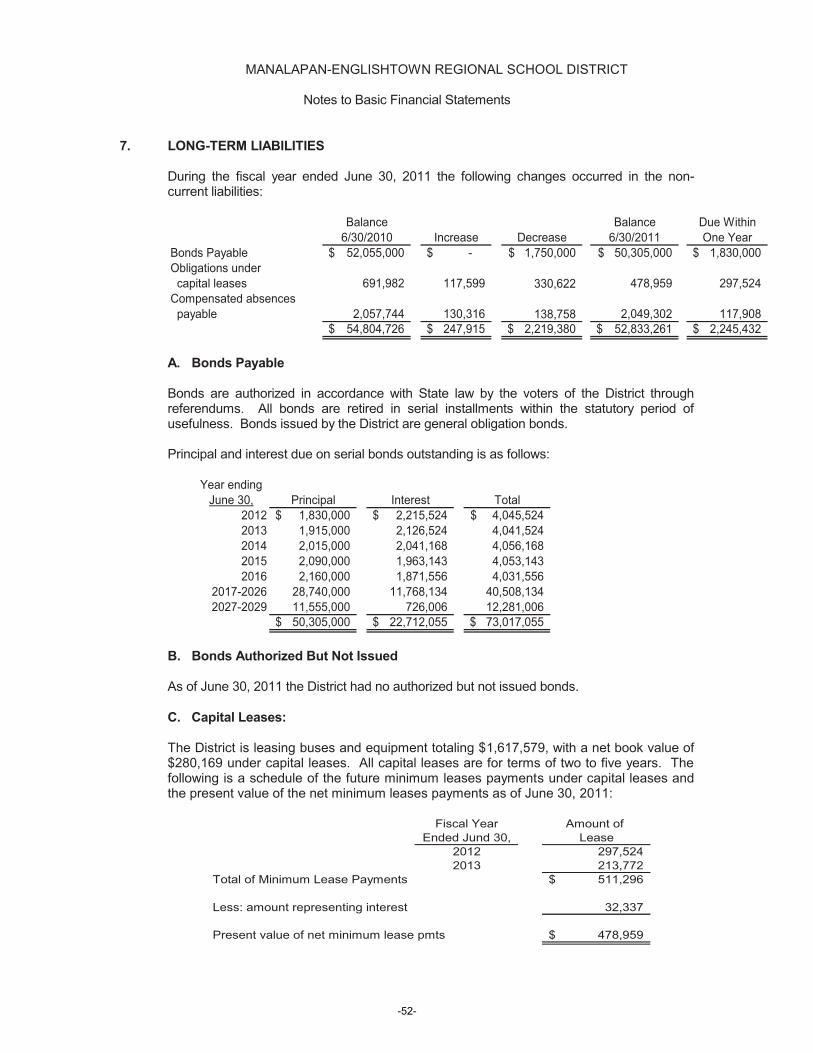
MANALAPAN-ENGLISHTOWN REGIONAL SCHOOL DISTRICT
Notes to Basic Financial Statements
7. LONG-TERM LIABILITIES During the fiscal year ended June 30, 2011 the following changes occurred in the non-
current liabilities:
Balance Balance Due Within6/30/2010 Increase Decrease 6/30/2011 One Year
Bonds Payable 52,055,000$ -$ 1,750,000$ 50,305,000$ 1,830,000$ Obligations under capital leases 691,982 117,599 330,622 478,959 297,524 Compensated absences payable 2,057,744 130,316 138,758 2,049,302 117,908
54,804,726$ 247,915$ 2,219,380$ 52,833,261$ 2,245,432$
A. Bonds Payable
Bonds are authorized in accordance with State law by the voters of the District through referendums. All bonds are retired in serial installments within the statutory period of usefulness. Bonds issued by the District are general obligation bonds.
Principal and interest due on serial bonds outstanding is as follows:
Year endingJune 30, Principal Interest Total
2012 1,830,000$ 2,215,524$ 4,045,524$ 2013 1,915,000 2,126,524 4,041,524 2014 2,015,000 2,041,168 4,056,168 2015 2,090,000 1,963,143 4,053,143 2016 2,160,000 1,871,556 4,031,556
2017-2026 28,740,000 11,768,134 40,508,134 2027-2029 11,555,000 726,006 12,281,006
50,305,000$ 22,712,055$ 73,017,055$
B. Bonds Authorized But Not Issued
As of June 30, 2011 the District had no authorized but not issued bonds.
C. Capital Leases:
The District is leasing buses and equipment totaling $1,617,579, with a net book value of $280,169 under capital leases. All capital leases are for terms of two to five years. The following is a schedule of the future minimum leases payments under capital leases and the present value of the net minimum leases payments as of June 30, 2011:
Fiscal Year Amount of Ended Jund 30, Lease
2012 297,524 2013 213,772
511,296$
32,337
478,959$
Total of Minimum Lease Payments
Less: amount representing interest
Present value of net minimum lease pmts
-52-

MANALAPAN-ENGLISHTOWN REGIONAL SCHOOL DISTRICT
Notes to Basic Financial Statements
8. PENSION PLANS
Description of Systems:
All required employees of the District are covered by either the Public Employees' Retirement System or the Teachers' Pension and Annuity Fund which have been established by state statute and are administered by the New Jersey Division of Pension and Benefits (Division). According to the State of New Jersey Administrative Code, all obligations of both Systems will be assumed by the State of New Jersey should the Systems terminate. The Division issues a publicly available financial report that includes the financial statements and required supplementary information for the Public Employees Retirement System and the Teachers' Pension and Annuity Fund. These reports may be obtained by writing to the Division of Pensions and Benefits, PO Box 295, Trenton, New Jersey, 08625. Teachers' Pension and Annuity Fund (TPAF) - The Teachers' Pension and Annuity Fund was established as of January 1, 1955, under the provisions of N.J.S.A. 18A:66 to provide retirement benefits, death, disability and medical benefits to certain qualified members. The Teachers' Pension and Annuity Fund is considered a cost-sharing multiple-employer plan with a special funding situation, as under current statute, all employer contributions are made by the State of New Jersey on behalf of the District and the system's other related non-contributing employers. Membership is mandatory for substantially all teachers or members of the professional staff certified by the State Board of Examiners, and employees of the Department of Education who have titles that are unclassified, professional and certified. Public Employees' Retirement System (PERS) - The Public Employees' Retirement System (PERS) was established as of January 1, 1955 under the provisions of N.J.S.A. 43:15A to provide retirement, death, disability and medical benefits to certain qualified members. The Public Employees' Retirement System is a cost-sharing multiple-employer plan. Membership is mandatory for substantially all full-time employees of the State of New Jersey or any county, municipality, school district, or public agency, provided the employee is not required to be a member of another state-administered retirement system or other state or local jurisdiction.
Vesting and Benefit Provisions - The vesting and benefit provisions for PERS are set by N.J.S.A. 43:15A and 43.3B, and N.J.S.A. 18A:6C for TPAF. All benefits vest after eight to ten years of service, except for medical benefits that vest after 25 years of service. Retirement benefits for age and service are available at age 60 and are generally determined to be 1/60 of the final average salary for each year of service credit, as defined. Final average salary equals the average salary for the final three years of service prior to retirement (or highest three years' compensation if other than the final three years). Members may seek early retirement after achieving 25 years of service credit or they may elect deferred retirement after achieving eight to ten years of service in which case benefits would begin the first day of the month after the member attains normal retirement age. The TPAF and PERS provides for specified medical benefits for members who retire after achieving 25 years of qualified service, as defined, or under the disability provisions of the System.
Members are always fully vested for their own contributions and, after three years of service credit, become vested for 2% of related interest earned on the contributions. In the case of death before retirement, members' beneficiaries are entitled to full interest credited to the members' accounts.
-53-

MANALAPAN-ENGLISHTOWN REGIONAL SCHOOL DISTRICT
Notes to Basic Financial Statements 8. PENSION PLANS (CONTINUED)
Contribution Requirements - The contribution policy is set by N.J.S.A. 43:15A, Chapter 62, P.L. of 1994, Chapter 115, P.L. of 1997 and N.J.S.A. 18:66, and requires contributions by active members and contributing employers. Plan member and employer contributions may be amended by State of New Jersey legislation. TPAF and PERS provide for employee contributions of 5.5% of employees’ annual compensation, as defined. Employers are required to contribute at an actuarially determined rate in both TPAF and PERS. The actuarially determined contribution includes funding for both cost-of-living adjustments, noncontributory death benefits, and post-retirement medical premiums. Under current statute the District is a non-contributing employer of the TPAF.
During the fiscal year ended June 30, 2011, the State of New Jersey contributed $2,207,932 to the TPAF for post-retirement medical benefits on behalf of the District. Also, in accordance with N.J.S.A. 18A:66-66 the State of New Jersey reimbursed the District $2,327,218 during the year ended June 30, 2011 for the employer's share of social security contributions for TPAF members, as calculated on their base salaries. This amount has been included in the basic financial statements as a revenue and expenditure in accordance with GASB 24.
9. POST-RETIREMENT BENEFITS
Chapter 384 of Public Laws 1987 and Chapter 6 of Public Laws 1990 required TPAF and PERS, respectively, to fund post-retirement medical benefits of those State employees who retire after reaching age 60 and accumulating 25 years of credited service. P.L. 2007, c.103 amended the law to eliminate the funding of post-retirement medical benefits thru TPAF and PERS. It created separate funds outside of the pension plans for the funding and payment of post-retirement medical benefits for retired State employees and retired educational employees. As of June 30, 2010, there were 87,288 retirees eligible for post-retirement medical benefits. The cost of these benefits is funded through contributions by the State in accordance with Chapter 62, P.L. 1994.
The State is also responsible for the cost attributable to Chapter 126, P.L. 1992 c.126,
which provides free health benefits to members of PERS and the Alternate Benefit Program who retired from a board of education or county college with 25 years of service. In fiscal year 2010, the State paid $126.3 million toward Chapter 126 benefits for 14,050 eligible retired members.
10. COMPENSATED ABSENCES
The District accounts for compensated absences (e.g., unused vacation, sick leave) as directed by Governmental Accounting Standards Board Statement No. 16 (GASB 16), “Accounting for Compensated Absences”.
District employees are granted varying amounts of sick leave in accordance with the districts personnel policy. Unused sick leave may be accumulated and carried forward to the subsequent years. Upon separation the District shall pay the employee for unused sick leave in accordance with the Districts' agreements with the various employees. Vacation days not used during the year may only be carried forward with approval from the Superintendent.
The liability for vested compensated absences of the governmental fund types is recorded in the Statement of Net Assets. The liability for vested compensated absences of the proprietary fund types is recorded within those funds as the benefits accrue to employees.
-54-

MANALAPAN-ENGLISHTOWN REGIONAL SCHOOL DISTRICT
Notes to Basic Financial Statements
11. DEFERRED COMPENSATION
The Board offers its employees a choice of various deferred compensation plans created in accordance with Internal Revenue Code Section 403(b). The plans, which are administered by the entities listed below, permit participants to defer a portion of their salary until future years. Amounts deferred under the plans are not available to employees until termination, retirement, death or unforeseeable emergency. The plan administrators are as follows:
Lincoln Investment Planning, Inc. Equitable
12. RISK MANAGEMENT
The District is exposed to various risks of loss related to torts; theft of, damage to, and destruction of assets; errors and omissions; injuries to employees; and natural disasters.
Property and Liability Insurance – The District maintains commercial insurance coverage for property, liability, student accident and surety bonds. A complete schedule of insurance coverage can be found in the Statistical Section of this Comprehensive Annual Financial Report. There have been no significant reductions in insurance coverage from prior year and no settlements have exceeded insurance coverage’s over the past three years. New Jersey Unemployment Compensation Insurance – The District has elected to fund its New Jersey Unemployment Compensation Insurance under the “Benefit Reimbursement Method”. Under this plan, the District is required to reimburse the New Jersey Unemployment Trust Fund for benefits paid to its former employees and charged to its account with the State. The District is billed quarterly for amounts due to the State. The following is a summary of District contributions, employee contributions, reimbursements to the State for benefits paid and the ending balance of the District’s expendable trust fund for the current and prior two years:
District Employee Amount EndingFiscal Year Contributions Contributions Reimbursed Balance2010-2011 300,211$ 68,844$ 446,151$ 644,078$ 2009-2010 250,120 74,002 155,402 722,665 2008-2009 7,084 74,162 99,278 555,235
13. INTERFUND BALANCES AND ACTIVITY The following interfund balances remained on the balance sheet at June 30, 2011:
Interfund InterfundFund Receivable Payable
General Fund 728,540$ -$ Special Revenue Fund - 349,687 Debt Service Fund - 378,853
728,540$ 728,540$
The General Fund had to fund Special Revenue and Debt Service Funds for shortages due to the delay in the District receiving State aid funds. All interfund balances are expected to be repaid within one year.
-55-

MANALAPAN-ENGLISHTOWN REGIONAL SCHOOL DISTRICT
Notes to Basic Financial Statements 14. INVENTORY
Inventory in the Food Service Fund at June 30, 2011 consisted of the following:
Food 16,114$ Supplies 6,970
Commodities 5,352 28,436$
The value of Federal donated commodities as reflected on Schedule A (required by the Single Audit Law of 1984) is the difference between market value and cost of the commodities at the date of purchase and has been included as an item of non-operating revenue in the financial statements.
15. CONTINGENT LIABILITIES
Grant Programs The school district participates in federal awards and state financial assistance grant programs. These programs are subject to program compliance audits by the grantors or their representatives. The school district is potentially liable for expenditures which may be disallowed pursuant to the terms of these grant programs. Management is not aware of any material items of noncompliance which would result in the disallowance of program expenditures.
16. FUND BALANCES
General Fund – Of the $6,153,909 General Fund balance at June 30, 2011, $963,782 of encumbrances is committed to other purposes, $587,514 is restricted for excess surplus, $657,729 is restricted for excess surplus designated for subsequent year’s expenditures, $374,999 is assigned to offset 2011-12 general fund expenditures, $2,060,958 is restricted for capital reserve, $1,600,000 is restricted for maintenance reserve, and $(91,073) is unreserved and undesignated.
17. DEFICIT FUND BALANCES
The District has a deficit fund balance of $91,073 in the General Fund as of June 30, 2011 as reported in the fund statements. N.J.S.A. 18A:22-44.2 provides that in the event a state school aid payment is not made until the following school budget year, districts must record the delayed one or more June state aid payments as revenue, for budget purposes only, in the current school budget year. The bill provides legal authority for school districts to recognize this revenue in the current budget year. For intergovernmental transactions, GASB Statement No. 33 requires that recognition revenue, expenditure, asset, liability) should be in symmetry, i.e., if one government recognizes an asset, the other government recognizes a liability. Since the State is recording the June state aid payments in the subsequent fiscal year, the school district can not recognize the June state aid payments (on the GAAP financial statements) until the year the State records the payable. Due to the timing difference of recording the June state aid payments, the General Fund balance deficit does not alone indicate that the district is facing financial difficulties. Pursuant to N.J.S.A. 18A:22-44.2 any negative unreserved, undesignated general fund balance that is reported as a direct result from a delay in June payments of state aid until the following fiscal year is not considered in violation of New Jersey statute and regulation nor in need of corrective action. The District deficit in the GAAP funds statements of $1,145,132 is less than the two state aid payments.
-56-

MANALAPAN-ENGLISHTOWN REGIONAL SCHOOL DISTRICT
Notes to Basic Financial Statements
18. CALCULATION OF EXCESS SURPLUS
In accordance with N.J.S.A. 18A:7F-7, as amended by P.L. 2004, c.73 (S1701), the designation for Reserved Fund Balance - Excess Surplus is a required calculation pursuant to the New Jersey Comprehensive Educational Improvement and Financing Act of 1996 (CEIFA). New Jersey school districts are required to reserve General Fund balance at the fiscal year end of June 30 if they did not appropriate a required minimum amount as budgeted fund balance in their subsequent years' budget. The excess fund balance at June 30, 2011 is $587,514.
19. UNCERTAIN TAX POSITIONS
The school district adopted the accounting pronouncement dealing with uncertain tax positions, as of July 1, 2009. Upon adoption of this accounting pronouncement, the school district had no unrecognized tax benefits. Furthermore, the school district had no unrecognized tax benefits at June 30, 2011. The school district files tax returns in the U.S. federal jurisdiction and various states. The school district has no open year prior to June 30, 2008.
20. SUBSEQUENT EVENTS
Management has evaluated subsequent events through November 16, 2011, the date the financial statements were available to be issued.
-57-

-58-

REQUIRED SUPPLEMENTARY INFORMATION – PART II
-59-

-60-

BUDGETARY COMPARISON SCHEDULES
-61-

-62-

Exhibit C-1
Original Budget Final VarianceBudget Transfers Budget Actual Final to Actual
REVENUES:Local sources: Local tax levy 49,550,724$ -$ 49,550,724$ 49,550,724$ -$ Interest - - - 2,350 2,350 Interest earned on capital reserve funds 1,000 - 1,000 1,648 648 Miscellaneous 561,721 - 561,721 276,650 (285,071) Total - local sources 50,113,445 - 50,113,445 49,831,372 (282,073)
State sources: Equilization aid 13,316,882 - 13,316,882 13,316,882 - Transportation aid 1,234,642 - 1,234,642 1,234,642 - Special education aid 2,928,266 - 2,928,266 2,928,266 - Security aid 403,346 - 403,346 403,346 - Extraordinary aid 145,000 - 145,000 303,476 158,476 Other state aid - - - 33,122 33,122 TPAF post retirement medical (on-behalf - Non-budgeted) - - - 2,207,932 2,207,932 TPAF social security (reimbursed - Non-budgeted) - - - 2,327,218 2,327,218 Total state sources 18,028,136 - 18,028,136 22,754,884 4,726,748
Total revenues 68,141,581 - 68,141,581 72,586,256 4,444,675
EXPENDITURES:Current Expense:Regular Programs - Instruction
Preschool/Kindergarten - Salaries of teachers 776,137 34,997 811,134 786,654 24,480 Grades 1-5 - Salaries of teachers 10,164,612 (352,825) 9,811,787 9,726,108 85,679 Grades 6-8 - Salaries of teachers 7,813,564 (308,116) 7,505,448 7,457,775 47,673
Regular Programs - Home Instruction:Salaries of teachers 50,000 - 50,000 37,340 12,660 Purchased professional-educational services 5,000 - 5,000 4,974 26
Regular Programs - Undistributed InstructionOther salaries for instruction - 33,755 33,755 33,755 - Purchased professional-educational services 18,000 (690) 17,310 16,646 664 Purchased technical services 9,600 (8,735) 865 865 - Other purchased services (400-500 series) 308,110 (890) 307,220 290,801 16,419 General supplies 1,015,991 365,372 1,381,363 1,225,278 156,085 Textbooks 6,500 196,353 202,853 104,394 98,459 Other objects - 1,843 1,843 1,821 22 TOTAL REGULAR PROGRAMS - INSTRUCTION 20,167,514 (38,936) 20,128,578 19,686,411 442,167
SPECIAL EDUCATION - INSTRUCTIONLearning and/or Language Disabilities:
Salaries of teachers 654,974 (459,468) 195,506 190,408 5,098 Other salaries for instruction 418,437 (45,780) 372,657 350,527 22,130 General supplies 2,000 197 2,197 2,035 162
Total Learning and/or Language Disabilities 1,075,411 (505,051) 570,360 542,970 27,390 Multiple Disabilities:
Salaries of teachers 247,092 446,377 693,469 679,389 14,080 Other salaries for instruction 74,748 104,247 178,995 178,995 - Purchased technical services 2,500 - 2,500 610 1,890 General supplies 2,750 - 2,750 - 2,750
Total Multiple Disabilities 327,090 550,624 877,714 858,994 18,720 Resource Room/Resource Center:
Salaries of teachers 4,622,952 91,376 4,714,328 4,683,468 30,860 Other salaries for instruction 141,771 (6,558) 135,213 123,404 11,809 General supplies 7,500 - 7,500 1,506 5,994
Total Resource Room/Resource Center 4,772,223 84,818 4,857,041 4,808,378 48,663 PSH
Salaries of teachers 634,054 (74,340) 559,714 501,753 57,961 Other salaries for instruction 254,397 (104,352) 150,045 127,500 22,545 General supplies 3,000 - 3,000 431 2,569
Total PSH: 891,451 (178,692) 712,759 629,684 83,075 Home Instruction
Salaries of teachers 5,000 - 5,000 4,079 921 Total Home Instruction: 5,000 - 5,000 4,079 921
TOTAL SPECIAL EDUCATION - INSTRUCTION 7,071,175 (48,301) 7,022,874 6,844,105 178,769
MANALAPAN-ENGLISHTOWN REGIONAL SCHOOL DISTRICTBudgetary Comparison Schedule
General FundFor the Fiscal Year Ended June 30, 2011
-49--63-

Exhibit C-1
Original Budget Final VarianceBudget Transfers Budget Actual Final to Actual
MANALAPAN-ENGLISHTOWN REGIONAL SCHOOL DISTRICTBudgetary Comparison Schedule
General FundFor the Fiscal Year Ended June 30, 2011
Basic Skills/Remedial - InstructionSalaries of teachers 1,303,248$ -$ 1,303,248$ 1,299,557$ 3,691$ General supplies 4,800 (593) 4,207 3,497 710
Total Basic Skills/Remedial - Instruction 1,308,048 (593) 1,307,455 1,303,054 4,401 Bilingual Education - Instruction
Salaries of teachers 230,534 - 230,534 225,211 5,323 Purchased technical services 2,000 (2,000) - - - General supplies 2,000 - 2,000 1,789 211
Total Bilingual Education - Instruction 234,534 (2,000) 232,534 227,000 5,534 School-Spon. Cocurricular Actvts. - Instruction
Salaries 186,334 - 186,334 88,509 97,825 Other purchased services (400-500 series) 17,350 (2,500) 14,850 9,104 5,746 Supplies and materials - 2,500 2,500 1,150 1,350 Other objects 11,250 - 11,250 355 10,895
Total School-Spon. Cocurric. Actvts. - Instruction 214,934 - 214,934 99,118 115,816 School-Spon. Athletics - Instruction
Salaries 94,862 - 94,862 89,446 5,416 Other purchased services (400-500 series) 10,500 - 10,500 9,818 682 Supplies and materials 13,500 - 13,500 8,490 5,010 Other objects 3,500 - 3,500 2,359 1,141
Total School-Spon. Athletics - Instruction 122,362 - 122,362 110,113 12,249 Total Instruction 29,118,567 (89,830) 29,028,737 28,269,801 758,936
Undistributed Expenditures - Instruction:Tuition to other LEAs within the state - Regular - 26,664 26,664 26,664 - Tuition to other LEAs within the state - Special 294,071 1,050 295,121 278,881 16,240 Tuition to CSSD & Regional Day Schools 268,647 - 268,647 175,266 93,381 Tuition to Private Schools for the Disabled - Within State 1,501,170 (280,000) 1,221,170 1,065,023 156,147 Tuition to Private Schools for the Disabled - Outside the State - 280,000 280,000 230,479 49,521 Tuition - Other 111,594 (35,964) 75,630 - 75,630
Total Undistributed Expenditures - Instruction: 2,175,482 (8,250) 2,167,232 1,776,313 390,919 Undist. Expend. - Health Services
Salaries 659,973 6,315 666,288 663,587 2,701 Purchased professional and technical services 27,775 - 27,775 19,604 8,171 Supplies and materials 27,300 - 27,300 14,643 12,657
Total Undistributed Expenditures - Health Services 715,048 6,315 721,363 697,834 23,529 Undist. Expend. - Speech, OT, PT & Related Services
Salaries of other professional staff 1,275,975 48,356 1,324,331 1,321,299 3,032 Purchased professional - educational services 23,600 9,300 32,900 15,086 17,814 General supplies 3,300 - 3,300 1,051 2,249
Total Undist. Expend. - Speech, OT, PT & Related Services 1,302,875 57,656 1,360,531 1,337,436 23,095 Undist. Expend. - Other Supp. Services - Stud. - Extraord. Ser.
Other salaries for instruction 606,603 43,142 649,745 642,319 7,426 Purchased professional - educational services 35,000 650 35,650 12,582 23,068 Supplies and materials 10,000 - 10,000 9,675 325
Total Undist. Expend. - Other Supp. Serv. Stud. - Extraord. Ser. 651,603 43,792 695,395 664,576 30,819 Undist. Expend. - Guidance
Salaries of other professional staff 460,490 (6,007) 454,483 454,483 - Salaries of secretarial and clerical assistants 46,262 - 46,262 46,262 - Other purchased services (400-500 series) - 21,432 21,432 21,432 - Supplies and materials 61,200 (17,904) 43,296 27,973 15,323
Total Undist. Expend. - Guidance 567,952 (2,479) 565,473 550,150 15,323 Undist. Expend. - Child Study Teams
Salaries of other professional staff 1,073,492 65,634 1,139,126 1,129,784 9,342 Salaries of secretarial and clerical assistants 130,069 - 130,069 130,069 - Other purchased professional and technical services 25,500 - 25,500 10,732 14,768 Misc. purchased service 450 - 450 - 450 Supplies and materials 12,500 (1,884) 10,616 3,994 6,622 Other objects 800 - 800 100 700
Total Undist. Expend. - Child Study Teams 1,242,811 63,750 1,306,561 1,274,679 31,882 Undist. Expend. - Improvement of Instruction Services
Salaries of supervisor of instruction 140,803 - 140,803 132,121 8,682 Salaries of other professional staff 130,152 - 130,152 119,802 10,350 Salaries of secretarial and clerical assist. 33,062 - 33,062 32,925 137 Other salaries 2,000 - 2,000 - 2,000 Other purchased services (400-500) 13,250 2,665 15,915 4,819 11,096 Supplies and materials 3,500 (3,000) 500 27 473 Other objects 2,600 - 2,600 1,754 846
Total Undist. Expend. - Improvement of Instruction Services 325,367 (335) 325,032 291,448 33,584 Undist. Expend. - Educational Media Services/School Library
Salaries 944,551 (1) 944,550 943,465 1,085 Supplies and materials 44,750 (18) 44,732 41,787 2,945 Other objects 11,000 - 11,000 8,988 2,012
Total Undist. Expend. - Ed. Media Services/School Library 1,000,301 (19) 1,000,282 994,240 6,042
-50--64-

Exhibit C-1
Original Budget Final VarianceBudget Transfers Budget Actual Final to Actual
MANALAPAN-ENGLISHTOWN REGIONAL SCHOOL DISTRICTBudgetary Comparison Schedule
General FundFor the Fiscal Year Ended June 30, 2011
Undist. Expend. - Instruction Staff Training ServicesSalaries of supervisors of instruction 236,201$ (10,500)$ 225,701$ 198,061$ 27,640$ Salaries of other professional staff 29,951 - 29,951 29,951 - Salaries of secretarial & clerical assist. 49,593 - 49,593 49,388 205 Purchased professional - educational services 14,800 - 14,800 - 14,800 Other purchased services (400-500 series) 3,600 5,838 9,438 3,793 5,645 Supplies and materials 5,419 258 5,677 3,169 2,508 Other objects 500 300 800 89 711
Total Undist. Expend. - Instruction Staff Training Services 340,064 (4,104) 335,960 284,451 51,509 Undist. Expend. - Support Service - General Administration
Salaries 227,998 (4,000) 223,998 221,310 2,688 Legal services 137,500 25,000 162,500 154,391 8,109 Audit fees 52,500 6,400 58,900 46,400 12,500 Architectural/Engineering Services 26,250 8,470 34,720 31,642 3,078 Other purchased professional services 49,650 (4,900) 44,750 34,650 10,100 Communications/Telephone 235,000 46,385 281,385 280,159 1,226 BOE Other Purchased Services 4,500 (1,500) 3,000 - 3,000 Misc purchased services (400-500 series) 169,622 (900) 168,722 83,819 84,903 General supplies 6,000 (300) 5,700 1,471 4,229 BOE In-House Training/Meeting Supplies 3,250 2,500 5,750 1,572 4,178 Judgements against the School District - 35,000 35,000 35,000 - Miscellaneous expenditures 5,250 - 5,250 4,052 1,198 Membership Dues and Fees 31,500 - 31,500 26,663 4,837
Total Undist. Expend. - Support Service - Gen. Admin. 949,020 112,155 1,061,175 921,129 140,046 Undist. Expend. - Support Service - School Administration
Salaries of principals/Assistant principals 1,699,602 (2,880) 1,696,722 1,689,414 7,308 Salaries of other professional staff 211,157 1,481 212,638 212,638 - Salaries of secretarial and clerical assistants 756,560 - 756,560 751,723 4,837 Other purchased services (400-500 series) 40,150 (4,264) 35,886 20,486 15,400 Supplies and materials 59,575 20,548 80,123 64,525 15,598 Other objects 19,000 1,523 20,523 13,684 6,839
Total Undist. Expend. - Support Service - School Admin. 2,786,044 16,408 2,802,452 2,752,470 49,982 Undist. Expend. - Support Service - Central Services
Salaries 683,592 (30,000) 653,592 650,345 3,247 Purchased professional services 61,000 (7,010) 53,990 40,531 13,459 Purchased technical services 157,450 (33,075) 124,375 115,803 8,572 Miscellaneous purchased services 329,250 (147,354) 181,896 147,543 34,353 Supplies and materials 32,500 (11,171) 21,329 13,559 7,770 Other objects 4,500 1,200 5,700 4,814 886
Total Undist. Expend. - Support Service - Central Services 1,268,292 (227,410) 1,040,882 972,595 68,287 Undist. Expend. - Support Service - Admin. Information Tech.
Salaries 165,267 - 165,267 165,267 - Purchased technical services 137,000 68,564 205,564 187,489 18,075 Other purchased services 20,000 (7,795) 12,205 11,477 728 Supplies and materials 6,100 20,000 26,100 26,100 - Other objects 1,300 (1,300) - - -
Total Undist. Expend. - Support Service - Admin. Info. Tech. 329,667 79,469 409,136 390,333 18,803 Undist. Expend. - Required Maintenance for School Facilities
Cleaning, repair and maintenance services 505,210 539,321 1,044,531 892,393 152,138 General supplies 183,750 7,460 191,210 144,265 46,945 Other objects - 5,193 5,193 5,193.00 -
Total Undist. Expend. - Required Maint. for School Facilities 688,960 551,974 1,240,934 1,041,851 199,083 Undist. Expend. - Custodial services
Salaries 3,242,859 1 3,242,860 3,146,553 96,307 Salaries of Non-instructional Aides 283,227 - 283,227 251,575 31,652 Purchased professional and technical services 20,000 (20,000) - - - Cleaning, repair and maintenance services 601,879 (68,628) 533,251 327,067 206,184 Other purchased property services 170,000 - 170,000 155,202 14,798 Insurance 313,273 (16,000) 297,273 288,215 9,058 Miscellaneous purchased services - 1,000 1,000 - 1,000 General supplies 215,250 62,810 278,060 242,491 35,569 Energy - Natural gas 685,000 (181,507) 503,493 437,815 65,678 Energy - Electricity 1,310,000 (25,000) 1,285,000 1,074,536 210,464 Other objects 10,700 (60) 10,640 8,645 1,995
Total Undist. Expend. - Custodial Services 6,852,188 (247,384) 6,604,804 5,932,099 672,705 Undistributed Expenditures - Care and Upkeep of Grounds
Salaries 232,916 (10,000) 222,916 212,098 10,818 Cleaning, Repair, and Maintenance Services 138,192 7,485 145,677 98,600 47,077 Other purchased services - 660 660 657 3 General Supplies 63,878 52,000 115,878 83,474 32,404 Other Objects 650 440 1,090 625 465
Total Undistributed Expenditures - Care and Upkeep of Grounds 435,636 50,585 486,221 395,454 90,767 Undistributed Expenditures - Security
Cleaning, Repair, and Maintenance Services 83,567 18,526 102,093 35,410 66,683 General Supplies - 500 500 - 500
Total Undistributed Expenditures - Security 83,567 19,026 102,593 35,410 67,183
-51--65-

Exhibit C-1
Original Budget Final VarianceBudget Transfers Budget Actual Final to Actual
MANALAPAN-ENGLISHTOWN REGIONAL SCHOOL DISTRICTBudgetary Comparison Schedule
General FundFor the Fiscal Year Ended June 30, 2011
Undist. Expend. - Student Transportation ServicesSalaries of Non-instructional Aides 401,065$ -$ 401,065$ 279,057$ 122,008$ Salaries for pupil transp.(between home and school) - Regular 1,889,321 (100,000) 1,789,321 1,725,205 64,116 Salaries for pupil transp.(between home and school) - Special 501,246 (139,000) 362,246 239,533 122,713 Salaries for pupil transp.(other than between home and school) 35,000 - 35,000 6,806 28,194 Social security contributions 217,650 - 217,650 169,493 48,157 Workers compensation 250,000 - 250,000 235,138 14,862 Health benefits 1,198,810 - 1,198,810 1,198,810 - Other purchased professional and technical services 10,000 - 10,000 6,080 3,920 Cleaning, repair and maintenance services 62,500 20,000 82,500 76,696 5,804 Lease purchase payments - School buses 275,000 (27,000) 248,000 186,652 61,348 Contract services - Aid in Lieu of Payment for NP school students 165,000 - 165,000 121,307 43,693 Contract services (Between Home and School) - Joint agreements 125,000 - 125,000 65,331 59,669 Contract services (Sp Ed Stds) - Joint agreements 675,000 - 675,000 583,005 91,995 Miscellaneous purchased services - Transportation 77,388 - 77,388 62,354 15,034 Supplies and materials 15,000 - 15,000 11,212 3,788 Transportation Supplies 703,500 147,000 850,500 757,089 93,411 Miscellaneous expenditures 11,000 - 11,000 4,813 6,187
Total Undist. Expend. - Student Transportation Services 6,612,480 (99,000) 6,513,480 5,728,581 784,899
UNALLOCATED EMPLOYEE BENEFITS Group insurance - 292 292 292 - Social security contributions 834,736 - 834,736 778,732 56,004 Other Retirement Contributions 1,097,750 150,000 1,247,750 1,243,731 4,019 Unemployment Compensation 544,088 - 544,088 300,000 244,088 Workmen's compensation 165,000 - 165,000 119,551 45,449 Health benefits 9,744,793 (662,955) 9,081,838 8,447,223 634,615 Tuition reimbursement 175,000 4,994 179,994 93,830 86,164 Other employee benefits 272,200 (292) 271,908 145,442 126,466
TOTAL UNALLOCATED EMPLOYEE BENEFITS 12,833,567 (507,961) 12,325,606 11,128,801 1,196,805 On-behalf TPAF post retirement med. contrib.(non-budgeted) - - - 2,207,932 (2,207,932)
Reimbursed TPAF social security contributions (non-budgeted) - - - 2,327,218 (2,327,218) TOTAL ON-BEHALF CONTRIBUTIONS - - - 4,535,150 (4,535,150)
TOTAL PERSONAL SERVICES - EMPLOYEE BENEFITS 12,833,567 (507,961) 12,325,606 15,663,951 (3,338,345)
TOTAL UNDISTRIBUTED EXPENDITURES 41,160,924 (95,812) 41,065,112 41,705,000 (639,888)
TOTAL GENERAL CURRENT EXPENSE 70,279,491 (185,642) 70,093,849 69,974,801 119,048
CAPITAL OUTLAYEquipmentRegular Programs - Instruction:
Grades 1-5 25,000 13,060 38,060 13,968 24,092 Undistributed:
Undistributed expenditures - Central services 15,000 (5) 14,995 3,046 11,949 Undistributed expenditures - Admin Info Tech. 10,000 1,225 11,225 11,225 - Undistributed expenditures - School administration - 2,529 2,529 2,529 - Undistributed expenditures - Operation & maint. of plant services 50,000 23,565 73,565 39,035 34,530 Undistributed expenditures - Student transp. - Non-inst. Serv. 55,586 18,975 74,561 25,650 48,911 Undistributed expenditures - Non-instr. Serv. - 25,000 25,000 - 25,000
Total Equipment 155,586 84,349 239,935 95,453 144,482 Facilities Acquisition and Construction Services
Architectural/Engineering Services - 324,298 324,298 281,816 42,482 Construction Services 781,221 252,320 1,033,541 813,065 220,476 Other Objects 143,833 5,702 149,535 149,535 -
Total Facilities Acquisition and Construction Services 925,054 582,320 1,507,374 1,244,416 262,958 Assets Acquired Under Capital Leases (non-budgeted)Undistributed Expenditures:
School Administration - - - 117,599 (117,599) Assets Acquired Under Capital Leases (non-budgeted) - - - 117,599 (117,599)
Capital reserve - Transfer to 1,000 - 1,000 - 1,000 TOTAL CAPITAL OUTLAY 1,081,640 666,669 1,748,309 1,457,468 290,841
TOTAL EXPENDITURES 71,361,131 481,027 71,842,158 71,432,269 409,889
-52--66-

Exhibit C-1
Original Budget Final VarianceBudget Transfers Budget Actual Final to Actual
MANALAPAN-ENGLISHTOWN REGIONAL SCHOOL DISTRICTBudgetary Comparison Schedule
General FundFor the Fiscal Year Ended June 30, 2011
Excess (Deficiency) of RevenuesOver (Under) Expenditures (3,219,550)$ 481,027$ (3,700,577)$ 1,153,987$ 4,854,564$
Other Financing Sources(Uses):Capital leases - Non-budgeted - - - 117,599 117,599
Total Other Financing Sources: - - - 117,599 117,599
Excess (Deficiency) of Revenues and Other Financing SourcesOver (Under) Expenditures and Other Financing Sources (Uses) (3,219,550) 481,027 (3,700,577) 1,271,586 4,972,163
Fund Balance, July 1 6,645,584 - 6,645,584 6,645,584 -
Fund Balance, June 30 3,426,034$ 481,027$ 2,945,007$ 7,917,170$ 4,972,163$
Recapitulation:Restricted Fund Balance: Capital reserve 2,060,958 Maintenance reserve 1,600,000 Excess surplus - current year 587,514 Excess surplus - designated for subsequent year's expenditures 657,729 Committed Fund Balance: Other purposes - Year-end encumbrances 963,782 Assigned Fund Balance: Designated for subsequent year's expenditures 374,999 Unrestricted/undesignated fund balance 1,672,188
Reconciliation to governmental funds statements (GAAP) State aid payments not recongized on GAAP basis (1,763,261) Fund balance per governmental funds (GAAP) (91,073)$
-53--67-

-68-

OTHER SUPPLEMENTARY INFORMATION
-69-

-70-

Exhibit C-2
Original Budget Final VarianceBudget Transfers Budget Actual Final to Actual
REVENUES Local sources -$ 46,839$ 46,839$ 19,532$ (27,307)$ State sources 65,070 (14,393) 50,677 47,010 (3,667) Federal sources 1,304,841 1,272,858 2,577,699 2,164,249 (413,450)
Total Revenues 1,369,911 1,305,304 2,675,215 2,230,791 (444,424)
EXPENDITURESInstruction: Salaries of teachers 1,289,397 (80,826) 1,208,571 1,144,165 64,406 Other salaries for instruction - - - - - Purchased professional services - 221,143 221,143 200,410 20,733 Textbooks 12,341 (5,009) 7,332 3,665 3,667 Tuition - 354,490 354,490 232,302 122,188 Miscellaneous expense 6,984 6,984 6,180 804 General supplies 15,444 396,938 412,382 288,960 123,422
Total instruction 1,317,182 893,720 2,210,902 1,875,682 335,220
Support services: Other professional staff salaries - 150,524 150,524 112,836 37,688 Secretarial/clerical salaries - - - - - Personal services - employee benefits - 75,984 75,984 52,922 23,062 Purchased professional - educational services 15,944 69,376 85,320 70,821 14,499 Other purchased professional services - 26,815 26,815 24,661 2,154 Purchased technical services 36,785 (5,967) 30,818 17,322 13,496 Travel - 6,418 6,418 4,450 1,968 Other purchased services (400-500 series) - - - - - Supplies & materials - 24,434 24,434 22,235 2,199
Total support services 52,729 347,584 400,313 305,247 95,066
EXPENDITURES (CONT'D):Facilities acquisition and const. serv.: Instructional equipment - 64,000 64,000 49,862 14,138
Total facilities acquisition and const. serv. - 64,000 64,000 49,862 14,138
Total expenditures 1,369,911 1,305,304 2,675,215 2,230,791 444,424
Excess (deficiency) of revenues Over (under) expenditures -$ -$ -$ -$ -$
MANALAPAN-ENGLISHTOWN REGIONAL SCHOOL DISTRICTBudgetary Comparison Schedule
Special Revenue FundFor the Fiscal Year Ended June 30, 2011
-56--71-

-72-

NOTES TO THE REQUIRED SUPPLEMENTARY INFORMATION
-73-

-74-

Exhibit C-3
MANALAPAN-ENGLISHTOWN REGIONAL SCHOOL DISTRICT
Note A - Explanation of Differences between Budgetary Inflows and Outflows and GAAP Revenues and Expenditures
General SpecialFund Revenue
FundSources/inflows of resourcesActual amounts (budgetary basis) "revenue"
from the budgetary comparison schedule [C-1] 72,586,256$ [C-2] 2,230,791$ Difference - budget to GAAP:
Grant accounting budgetary basis differs from GAAP in that encumbrances are recognized as expenditures, and the related revenue is recognized. - 42,288
The 2009-10 State aid payments are recognized as revenuefor budgetary purposes, and differs from GAAPwhich does not recognize this revenue until thesubsequent year when the State recognizes the relatedexpense. 2,134,392 -
The 2010-11 State aid payments are recognized as revenuefor budgetary purposes, and differs from GAAPwhich does not recognize this revenue until thesubsequent year when the State recognizes the relatedexpense. (1,763,261) -
Total revenues as reported on the statement of revenues, expendituresand changes in fund balances - governmental funds. [B-2] 72,957,387$ [B-2] 2,273,079$
Uses/outflows of resourcesActual amounts (budgetary basis) "total outflows" from the [C-1] 71,432,269$ [C-2] 2,230,791$
budgetary comparison scheduleDifferences - budget to GAAP
Encumbrances for supplies and equipment ordered but not received are reported in the year the order is placed for budgetary purposes, but in the year the supplies are received for financial reporting purposes. - 42,288
Total expenditures as reported on the statement of revenues, expenditures, and changes in fund balances - governmental funds [B-2] 71,432,269$ [B-2] 2,273,079$
For the Fiscal Year Ended June 30, 2010
Required Supplementary Information Budgetary Comparison Schedule
Note to Required Supplementary Information
-57--75-

-76-

SPECIAL REVENUE FUND DETAIL STATEEMENTS
The Special Revenue Fund is used to account for the proceeds of specific revenue sources (other than expendable trusts or major capital projects) that are legally restricted to specific purposes,
-77-

-78-

Exhibit E-1
Title I Title II Title IIPart A Part A Part A Title III Title IV10/11 10/11 09/10 10/11 09/10
Revenues: Local sources -$ -$ -$ -$ -$ State sources - - - - - Federal sources 182,424 81,361 46,236 11,873 1,277
Total revenues 182,424 81,361 46,236 11,873 1,277
Expenditures: Instruction: Salaries of teachers 159,128 50,725 17,822 - - Other salaries/instruction - - - - - Purchased professional services - - - - 1,277 General supplies - - 22,255 11,122 - Tuition - - - - - Textbooks - - - - - Miscellaneous expenses - - - - -
Total instruction 159,128 50,725 40,077 11,122 1,277
Support services: Other support services - students - special: Other professional staff salaries - - - - - Secretarial/Clerical salaries - - - - - Purchased professional services - 15,800 - - - Other purchased professional services - - - - - Purchased technical services - - 4,795 - - Employee benefits 23,296 3,880 1,363 - - Travel - 1,538 - 647 - Miscellaneous purchased services - - - - - General supplies - 9,418 1 104 - Purchased prof.-educ.services - - - - -
Total other support services - students - special 23,296 30,636 6,159 751 -
Total support services 23,296 30,636 6,159 751 -
Equipment: Regular programs instruction - - - - - Non-instructional equipment - - - - -
Total equipment - - - - -
Total expenditures 182,424$ 81,361$ 46,236$ 11,873$ 1,277$
(continued on next page)
Special Revenue FundCombining Schedule of Program Revenues and Expenditures - Budgetary Basis
For the Fiscal Year Ended June 30, 2011
MANALAPAN-ENGLISHTOWN REGIONAL SCHOOL DISTRICT
-58--79-

Exhibit E-1
(Continued from prior page)
IDEA-Part IDEA-Part IDEA-Part IDEA-Part IDEA-PartB-Basic B-Basic B-Preschool B-Basic B-Preschool
Reg Prog Reg Prog Reg Prog Reg Prog Reg Prog09/10 10/11 10/11 09/10 09/10
Revenues: Local sources -$ -$ -$ -$ -$ State sources - - - - - Federal sources 139,491 1,133,447 55,200 510,209 2,731
Total revenues 139,491 1,133,447 55,200 510,209 2,731
Expenditures: Instruction: Salaries of teachers 92,015 761,012 52,470 10,993 - Other salaries/instruction - - - - - Purchased professional services - 45,499 - 153,134 - General supplies 30,858 122,017 2,730 81,091 2,710 Tuition - - - 232,302 - Textbooks - - - - - Miscellaneous expenses - 3,325 - - -
Total instruction 122,873 931,853 55,200 477,520 2,710
Support services: Other support services - students - special: Other professional staff salaries 1,561 107,263 - 4,012 - Secretarial/Clerical salaries - - - - - Purchased professional services 15,057 2,300 - 6,846 - Other purchased professional services - - - 20,000 21 Purchased technical services - - - - - Employee benefits - 23,542 - 841 - Travel - 2,265 - - - Miscellaneous purchased services - 4,640 - - - General supplies - 11,722 - 990 - Purchased prof.-educ.services - - - - -
Total other support services - students - special 16,618 151,732 - 32,689 21
Total support services 16,618 151,732 - 32,689 21
Equipment: Regular programs instruction - 49,862 - - - Non-instructional equipment - - - - -
Total equipment - 49,862 - - -
Total expenditures 139,491$ 1,133,447$ 55,200$ 510,209$ 2,731$
(continued on next page)
ARRA
MANALAPAN-ENGLISHTOWN REGIONAL SCHOOL DISTRICTSpecial Revenue Fund
Combining Schedule of Program Revenues and Expenditures - Budgetary BasisFor the Fiscal Year Ended June 30, 2011
-59--80-

Exhibit E-1
(Continued from prior page)
Nursing Textbook Classification Speech Instruction10/11 10/11 10/11 10/11 10/11
Revenues: Local sources -$ -$ -$ -$ -$ State sources 12,527 3,665 9,088 20,340 1,390 Federal sources - - - - -
Total revenues 12,527 3,665 9,088 20,340 1,390
Expenditures: Instruction: Salaries of teachers - - - - - Other salaries/instruction - - - - - Purchased professional services - - - - - General supplies - - - - - Tuition - - - - - Textbooks - 3,665 - - - Miscellaneous expenses - - - - -
Total instruction - 3,665 - - -
Support services: Other support services - students - special: Other professional staff salaries - - - - - Secretarial/Clerical salaries - - - - - Purchased professional services - - - - - Other purchased professional services - - - - - Purchased technical services 12,527 - - - - Employee benefits - - - - Travel - - - - - Miscellaneous purchased services - - - - - General supplies - - - - - Purchased prof.-educ.services - - 9,088 20,340 1,390 Other purchased services - - - - -
Total other support services - students - special 12,527 - 9,088 20,340 1,390
Total support services 12,527 - 9,088 20,340 1,390
Equipment: Regular programs instruction - - - - - Non-instructional equipment - - - - -
Total equipment - - - - -
Total expenditures 12,527$ 3,665$ 9,088$ 20,340$ 1,390$
(continued on
Chapter 193 Nonpublic
MANALAPAN-ENGLISHTOWN REGIONAL SCHOOL DISTRICTSpecial Revenue Fund
Combining Schedule of Program Revenues and Expenditures - Budgetary BasisFor the Fiscal Year Ended June 30, 2010
Non-Public
-60--81-

Exhibit E-1
(Continued from prior page)Target Take Foundation
Pass Charge of for Other LocalGrants Education MERS Grants Total10/11 10/11 10/11 10/11 2011
Revenues: Local sources 2,972$ 11,548$ 3,355$ 1,657$ 19,532$ State sources - - - - 47,010 Federal sources - - - - 2,164,249
Total revenues 2,972 11,548 3,355 1,657 2,230,791$
Expenditures: Instruction: Salaries of teachers - - - - 1,144,165$ Other salaries/instruction - - - - - Purchased professional services - - 500 - 200,410 General supplies 2,972 11,548 - 1,657 288,960 Tuition - - - - 232,302 Textbooks - - - - 3,665 Miscellaneous expenses - - 2,855 - 6,180
Total instruction 2,972 11,548 3,355 1,657 1,875,682
Support services: Other support services - students - special: Other professional staff salaries - - - - 112,836 Secretarial/Clerical salaries - - - - - Purchased professional services - - - - 40,003 Other purchased professional services - - - - 20,021 Purchased technical services - - - - 17,322 Employee benefits - - - - 52,922 Travel - - - - 4,450 Miscellaneous purchased services - - - - 4,640 General supplies - - - - 22,235 Purchased prof.-educ.services - - - - 30,818 Other purchased services - - - - -
Total other support services - students - special - - - - 305,247
Total support services - - - - 305,247
Equipment: Regular programs instruction - - - - 49,862 Non-instructional equipment - - - - -
Total equipment - - - - 49,862
Total expenditures 2,972$ 11,548$ 3,355$ 1,657$ 2,230,791$
MANALAPAN-ENGLISHTOWN REGIONAL SCHOOL DISTRICTSpecial Revenue Fund
Combining Schedule of Program Revenues and Expenditures - Budgetary BasisFor the Fiscal Year Ended June 30, 2011
-61--82-

CAPITAL PROJECTS FUND
DETAIL STATEMENT
The Capital Project Fund is used to account for the acquisition, construction and/or renovation of major facilities and equipment purchases other than those financed by Proprietary Funds.
-83-

-84-

Exhi
bit F
-1
Rev
ised
Une
xpen
ded
Bud
geta
ryPr
ior
Cur
rent
Appr
opria
tions
Proj
ect T
itle/
Issu
eAp
prov
al D
ate
Appr
opria
tions
Year
sYe
arJu
ne 3
0, 2
011
Add
ition
s an
d A
ltera
tions
to C
lark
Mill
s El
emen
tary
Sch
ool
4/14
/200
517
,508
,103
$
17
,508
,103
$
-
$
-$
Alte
ratio
ns to
Tay
lor M
ills
Ele
men
tary
Sch
ool
4/14
/200
52,
571,
048
1,07
6,94
6
89
7,87
8
59
6,22
4
Alte
ratio
ns to
Pin
e B
rook
Ele
men
tary
Sch
ool
4/14
/200
52,
032,
879
2,55
3,93
3
28
8,72
8
(8
09,7
82)
Alte
ratio
ns to
Milf
ord
Bro
ok E
lem
enta
ry S
choo
l4/
14/2
005
431,
325
32
,911
-
398,
414
Alte
ratio
ns to
Laf
ayet
te M
ills
Ele
men
tary
Sch
ool
4/14
/200
51,
878,
354
1,21
5,72
0
18
5,02
9
47
7,60
5
Man
alap
an-E
nglis
htow
n M
iddl
e S
choo
l Ret
rofit
Lig
htin
g5/
25/2
005
723,
760
67
3,11
4
50,6
46
-
Add
ition
s an
d A
ltera
tions
to M
anal
apan
-Eng
lisht
own
Mid
dle
Sch
ool
4/14
/200
523
,334
,189
22
,952
,571
-
381,
618
Tota
ls48
,479
,658
$
46
,013
,298
$
1,
422,
281
$
1,
044,
079
$
MAN
ALAP
AN-E
NG
LISH
TOW
N R
EGIO
NAL
SC
HO
OL
DIS
TRIC
TC
apita
l Pro
ject
s Fu
ndSu
mm
ary
Sche
dule
of P
roje
ct E
xpen
ditu
res
For t
he F
isca
l Yea
r End
ed J
une
30, 2
011
GA
AP E
xpen
ditu
res
to D
ate
[Upd
ated
8/0
6]
-85-

Exhibit F-2
Revenues and Other Financing SourcesState Sources - SCC Grant -$ Bond proceeds and transfers - Contribution from private source - Transfer from capital reserve - Interest -
Total revenues -
Expenditures and Other Financing UsesPurchased professional and technical services 279,403 Construction services 2,762,744 Transfers out -
Total expenditures 3,042,147
Excess (deficiency) of revenues over (under) expenditures (3,042,147)
Fund balance - beginning 3,820,098
Fund balance - ending 777,951$
MANALAPAN-ENGLISHTOWN REGIONAL SCHOOL DISTRICT
Summary Schedule of Revenues, Expenditures, and Changes in Fund Balance-Budgetary BasisFor the Year Ended June 30, 2011
Capital Projects Fund
-62--86-

Exhibit F-2a
Prior Periods Current Year TotalsRevised Authorized
CostRevenues and Other Financing Sources
State Sources - SCC Grant 3,768,607$ -$ 3,768,607$ 3,768,607$ Bond proceeds and transfers 14,253,235 (212,462) 14,040,773 14,040,773
Total revenues 18,021,842 (212,462) 17,809,380 17,809,380
Expenditures and Other Financing UsesPurchased prof. and technical services 1,584,107 - 1,584,107 1,584,107 Construction services 15,577,643 - 15,577,643 15,577,643 Equipment purchases 346,353 - 346,353 346,353
Total expenditures 17,508,103 - 17,508,103 17,508,103
Excess (deficiency) or revenuesover (under) expenditures 513,739$ (212,462)$ 301,277$ 301,277$
Additional project information:Project Number 2920-050-03-1217Grant Date 4/14/2005Bond Authorization Date 9/30/2003Bonds Authorized 12,577,967$ Bonds Issued 12,577,967$ Original Authorized Cost 13,459,393$ Additional Authorized Cost 4,349,986$ Revised Authrorized Cost 17,809,379$
Percentage Increase over OriginalAuthorized Cost 32.32%
Percentage Completion 98.31%Original target completion date September 06Revised target completion date September 11
Additions and Alterations to Clark Mills Elementary SchoolFor the Fiscal Year Ended June 30, 2011
MANALAPAN-ENGLISHTOWN REGIONAL SCHOOL DISTRICTCapital Projects Fund
Schedule of Project Revenues, Expenditures, Project Balance, and Project Status - Budgetary Basis
-63--87-

Exhibit F-2b
Prior Periods Current Year TotalsRevised Authorized
CostRevenues and Other Financing Sources
State Sources - SCC Grant 1,008,279$ -$ 1,008,279$ 1,008,279$ Bond proceeds and transfers 1,562,769 13,975 1,576,744 1,562,769
Total revenues 2,571,048 13,975 2,585,023 2,571,048
Expenditures and Other Financing UsesPurchased prof. and technical services 272,984 53,663 326,647 249,272 Construction services 803,962 1,430,760 2,234,722 2,321,776 Equipment purchases - - - -
Total expenditures 1,076,946 1,484,423 2,561,369 2,571,048
Excess (deficiency) or revenuesover (under) expenditures 1,494,102$ (1,470,448)$ 23,654$ -$
Additional project information:Project Number 2920-090-03-1222Grant Date 4/14/2005Bond Authorization Date 9/30/2003Bonds Authorized 1,512,419$ Bonds Issued 1,512,419$ Original Authorized Cost 2,520,698$ Additional Authorized Cost 64,325$ Revised Authrorized Cost 2,585,023$
Percentage Increase over OriginalAuthorized Cost 2.55%
Percentage Completion 99.08%Original target completion date September 07Revised target completion date September 11
Alterations to Taylor Mills Elementary SchoolFor the Fiscal Year Ended June 30, 2011
MANALAPAN-ENGLISHTOWN REGIONAL SCHOOL DISTRICTCapital Projects Fund
Schedule of Project Revenues, Expenditures, Project Balance, and Project Status - Budgetary Basis
-64--88-

Exhibit F-2c
Prior Periods Current Year TotalsRevised Authorized
CostRevenues and Other Financing Sources
State Sources - SCC Grant 700,000$ -$ 700,000$ 700,000$ Bond proceeds and transfers 1,896,879 5,000 1,901,879 1,056,879 Transfer from capital reserve 276,000 - 276,000 276,000
Total revenues 2,872,879 5,000 2,877,879 2,032,879
Expenditures and Other Financing UsesPurchased prof. and technical services 398,337 16,456 414,793 230,370 Construction services 2,155,596 274,034 2,429,630 1,802,509 Equipment purchases - - - -
Total expenditures 2,553,933 290,490 2,844,423 2,032,879
Excess (deficiency) or revenuesover (under) expenditures 318,946$ (285,490)$ 33,456$ -$
Additional project information:Project Number 2920-075-03-1221Grant Date 4/14/2005Bond Authorization Date 9/30/2003Bonds Authorized 1,050,000$ Bonds Issued 1,050,000$ Original Authorized Cost 1,750,000$ Additional Authorized Cost 1,127,879$ Revised Authrorized Cost 2,877,879$
Percentage Increase over OriginalAuthorized Cost 64.45%
Percentage Completion 98.84%Original target completion date September 06Revised target completion date September 11
Alterations to Pine Brook Elementary SchoolFor the Fiscal Year Ended June 30, 2011
MANALAPAN-ENGLISHTOWN REGIONAL SCHOOL DISTRICTCapital Projects Fund
Schedule of Project Revenues, Expenditures, Project Balance, and Project Status - Budgetary Basis
-65--89-

Exhibit F-2d
Prior Periods Current Year TotalsRevised Authorized
CostRevenues and Other Financing Sources
State Sources - SCC Grant 172,730$ -$ 172,730$ 172,730$ Bond proceeds and transfers 258,595 64,750 323,345 258,595
Total revenues 431,325 64,750 496,075 431,325
Expenditures and Other Financing UsesPurchased prof. and technical services 32,911 69,500 102,411 42,297 Construction services - - - 389,028 Equipment purchases - - - -
Total expenditures 32,911 69,500 102,411 431,325
Excess (deficiency) or revenuesover (under) expenditures 398,414$ (4,750)$ 393,664$ -$
Additional project information:Project Number 2920-063-03-1220Grant Date 4/14/2005Bond Authorization Date 9/30/2003Bonds Authorized 259,095$ Bonds Issued 259,095$ Original Authorized Cost 431,325$ Additional Authorized Cost 64,750$ Revised Authrorized Cost 496,075$
Percentage Increase over OriginalAuthorized Cost 15.01%
Percentage Completion 20.64%Original target completion date September 07Revised target completion date September 11
Alterations to Milford Brook Elementary SchoolFor the Fiscal Year Ended June 30, 2011
MANALAPAN-ENGLISHTOWN REGIONAL SCHOOL DISTRICTCapital Projects Fund
Schedule of Project Revenues, Expenditures, Project Balance, and Project Status - Budgetary Basis
-66--90-

Exhibit F-2e
Prior Periods Current Year TotalsRevised Authorized
CostRevenues and Other Financing Sources
State Sources - SCC Grant 755,760$ -$ 755,760$ 755,760$ Bond proceeds and transfers 1,122,592 508,330 1,630,922 1,122,594
Total revenues 1,878,352 508,330 2,386,682 1,878,354
Expenditures and Other Financing UsesPurchased prof. and technical services 145,775 89,138 234,913 159,835 Construction services 1,069,945 1,057,950 2,127,895 1,718,519 Equipment purchases - - - -
Total expenditures 1,215,720 1,147,088 2,362,808 1,878,354
Excess (deficiency) or revenuesover (under) expenditures 662,632$ (638,758)$ 23,874$ -$
Additional project information:Project Number 2920-050-03-1218Grant Date 4/14/2005Bond Authorization Date 9/30/2003Bonds Authorized 1,133,640$ Bonds Issued 1,133,640$ Original Authorized Cost 1,889,400$ Additional Authorized Cost 497,282$ Revised Authrorized Cost 2,386,682$
Percentage Increase over OriginalAuthorized Cost 26.32%
Percentage Completion 99.00%Original target completion date September 07Revised target completion date September 11
Alterations to Lafayette Mills Elementary SchoolFor the Fiscal Year Ended June 30, 2011
MANALAPAN-ENGLISHTOWN REGIONAL SCHOOL DISTRICTCapital Projects Fund
Schedule of Project Revenues, Expenditures, Project Balance, and Project Status - Budgetary Basis
-67--91-

Exhibit F-2f
Prior Periods Current Year TotalsRevised Authorized
CostRevenues and Other Financing Sources
State Sources - SCC Grant 259,096$ -$ 259,096$ 259,096$ Bond proceeds and transfers 464,665 (1) 464,664 464,664
Total revenues 723,761 (1) 723,760 723,760
Expenditures and Other Financing UsesPurchased prof. and technical services 99,124 50,646 149,770 10,000 Construction services 573,990 - 573,990 713,760 Equipment purchases - - - -
Total expenditures 673,114 50,646 723,760 723,760
Excess (deficiency) or revenuesover (under) expenditures 50,647$ (50,647)$ -$ -$
Additional project information:Project Number 2920-060-04-1000Grant Date 5/25/2005Bond Authorization Date N/ABonds Authorized -$ Bonds Issued -$ Original Authorized Cost 309,776$ Additional Authorized Cost 413,984$ Revised Authrorized Cost 723,760$
Percentage Increase over OriginalAuthorized Cost 133.64%
Percentage Completion 100.00%Original target completion date September 08Revised target completion date September 10
Manalapan-Englishtown Middle School Retrofit LightingFor the Fiscal Year Ended June 30, 2011
MANALAPAN-ENGLISHTOWN REGIONAL SCHOOL DISTRICTCapital Projects Fund
Schedule of Project Revenues, Expenditures, Project Balance, and Project Status - Budgetary Basis
-68--92-

Exhibit F-2g
Prior Periods Current Year TotalsRevised Authorized
CostRevenues and Other Financing Sources
State Sources - SCC Grant 7,920,940$ -$ 7,920,940$ 7,920,940$ Bond proceeds and transfers 15,413,249 (379,592) 15,033,657 15,033,657
Total revenues 23,334,189 (379,592) 22,954,597 22,954,597
Expenditures and Other Financing UsesPurchased prof. and technical services 2,254,550 - 2,254,550 2,254,550 Construction services 20,018,091 - 20,018,091 20,399,709 Equipment purchases 679,930 - 679,930 679,930
Total expenditures 22,952,571 - 22,952,571 23,334,189
Excess (deficiency) or revenuesover (under) expenditures 381,618$ (379,592)$ 2,026$ (379,592)$
Additional project information:Project Number 2920-060-03-1219Grant Date 4/14/2005Bond Authorization Date 9/30/2003Bonds Authorized 20,854,060$ Bonds Issued 20,854,060$ Original Authorized Cost 28,775,000$ Additional Authorized Cost (5,820,403)$ Revised Authrorized Cost 22,954,597$
Percentage Increase over OriginalAuthorized Cost -20.23%
Percentage Completion 99.99%Original target completion date September 06Revised target completion date September 07
For the Fiscal Year Ended June 30, 2011
Schedule of Project Revenues, Expenditures, Project Balance, and Project Status - Budgetary Basis
MANALAPAN-ENGLISHTOWN REGIONAL SCHOOL DISTRICTCapital Projects Fund
Additions and Alterations to Manalapan-Englishtown Middle School
-69--93-

-94-

PROPRIETARY FUND DETAIL STATEMENTS
Proprietary Funds are used to account for operations that are financed and operated in a manner similar to private business enterprises – where the intent of the district’s board is that the costs of providing goods or services be financed through user charges.
Food Services Fund – This fund provides for the operation of food services in all schools within the School District.
-95-

-96-

Exhibit G-1
Food Service
Assets:
Current assets: Cash and cash equivalents 279,413$ Accounts receivable: State 2,605 Federal 15,388 Other 2,002 Inventories 28,436
Total current assets 327,844
Capital assets: Building improvements 192,533 Equipment 1,303,303 Accumulated depreciation (1,124,411)
Total capital assets 371,425
Total assets 699,269$
Liabilities and Fund Equity: Liabilities: Accounts payable 80,156 Deferred revenue 12,488
Total liabilities 92,644
Net assets: Invested in capital assets, net of related debt 371,425 Unrestricted net assets 235,200
Total net assets 606,625
Total liabilities and net assets 699,269$
MANALAPAN-ENGLISHTOWN REGIONAL SCHOOL DISTRICTEnterprise Fund
Statement of Net AssetsJune 30, 2011
-70--97-

Exhibit G-2
Food Service
Operating revenues: Local sources: Daily sales-reimbursable programs: School lunch program 844,570$ Special functions 9,739
Total-daily sales-reimbursable programs 854,309
Daily sales non-reimbursable programs 639,863 Total operating revenues 1,494,172
Operating expenses: Salaries 529,810 Employee benefits 176,070 Purchased property - Other purchased services 129,562 Repairs and maintenance 40,793 Supplies and materials 43,011 Miscellaneous expenses 7,202 Depreciation 66,551 Cost of sales 858,345
Total operating expenses 1,851,344
Operating loss (357,172)
Nonoperating revenues: State sources: State school lunch program 22,205 Federal sources: National school lunch program 250,405 Special milk program 5,977 U.S.D.A. commodities 81,889 Interest income 121
Total nonoperating revenues 360,597
Change in net assets 3,425
Total net assets beginning 603,200
Total net assets ending 606,625$
MANALAPAN-ENGLISHTOWN REGIONAL SCHOOL DISTRICTFood Services Enterprise Fund
Statement of Revenues, Expenses andChanges in Net Assets
for the Fiscal Year ended June 30, 2011
-71--98-

Exhibit G-3
Food Service
Cash Flows from Operating Activities: Receipts from customers and other funds 1,497,835$ Payments to employees (529,810) Payments for employee benefits (176,070) Payments to suppliers (1,035,052)
Net cash used for operating activities (243,097)
Cash Flows from Noncapital Financing Activities State sources 22,205 Federal sources 256,382
Net cash provided by noncapital financing activities 278,587
Cash Flows from Capital and Related Financing Activities Purchases of fixed assets (37,253)
Net cash used for capital and related financing activities (37,253)
Cash Flows from Investing Activities Interest on investments 121
Net cash provided by investing activities 121
Net increase in cash and cash equivalents (1,642) Balances-beginning of the year 281,055 Balances-end of the year 279,413$
Reconciliation of operating loss to net cash provided by (used for) opeating activities: Operating loss (357,172)$ Adjustments to reconcile operating loss to cash used by operating activities: Depreciation 66,551 Federal commodities 81,889 Change in assets and liabilities: Increase in deferred revenue 3,225 Decrease in accounts receivable 438 Increase in inventory (5,782) Decrease in accounts payable (32,246)
Total adjustments 114,075 Net cash used by operating activities (243,097)$
MANALAPAN-ENGLISHTOWN REGIONAL SCHOOL DISTRICTFood Services Enterprise Fund
Statement of Cash Flowsfor the Fiscal Year ended June 30, 2011
-72--99-

-100-
FIDUCIARY FUNDS DETAIL STATEMENTS
The Fiduciary Funds are used to account for funds received by the School District for a specific purpose. Agency Funds are used to account for assets held by the School District as an agent for Individuals, private organization, other governments and/or other funds. Student Activity Fund – This agency fund is used to account for student funds held at the school. Payroll Fund – This agency fund is used to account for the payroll transactions of the School District.
-101-

-102-

Exhi
bit H
-1
Une
mpl
oym
ent
Priv
ate
Purp
ose
Tota
lSt
uden
t Fl
exTo
tal
Com
pens
atio
n Tr
ust
Scho
lars
hip
Fund
Trus
t Fun
dA
ctiv
ityPa
yrol
lSp
endi
ngA
genc
y
ASS
ETS C
ash
and
cash
equ
ival
ents
600,
982
$
3,54
0$
604,
522
$
49,4
97$
12
3,91
1$
26
,390
$
199,
798
$
O
ther
Acc
ount
s R
ecei
vabl
e-
-
-
-
-
-
-
In
trafu
nd re
ceiv
able
68,8
44
-
68
,844
-
-
-
-
T
otal
ass
ets
669,
826
3,54
0
673,
366
49,4
97$
12
3,91
1$
26
,390
$
199,
798
$
LIA
BIL
ITIE
S A
ccou
nts
paya
ble
25,7
48
-
25
,748
-
14
-
14
Pay
roll
dedu
ctio
ns a
nd w
ithho
ldin
gs-
-
-
-
55
,053
26
,390
81,4
43
P
ayab
le to
stu
dent
gro
ups
-
-
-
49
,497
-
-
49
,497
Intra
fund
pay
able
-
-
-
-
68,8
44
-
68
,844
Oth
er c
urre
nt li
abilit
ies
-
-
-
-
-
-
-
T
otal
liab
ilitie
s25
,748
-
25,7
48
49,4
97
12
3,91
1
26
,390
199,
798
NET
ASS
ETS
Hel
d in
trus
t for
une
mpl
oym
ent
cl
aim
s an
d ot
her p
urpo
ses
644,
078
-
64
4,07
8
R
eser
ved
for s
chol
arsh
ips
-
3,54
0
3,54
0
T
otal
net
ass
ets
644,
078
3,54
0
647,
618
Tota
l lia
bilit
ies
and
net a
sset
s66
9,82
6$
3,
540
$
67
3,36
6$
Age
ncy
Trus
t
MA
NA
LAPA
N-E
NG
LISH
TOW
N R
EGIO
NA
L SC
HO
OL
DIS
TRIC
TSt
atem
ent o
f Age
ncy
Fund
Ass
ets
and
Liab
ilitie
sFi
duci
ary
Fund
sJu
ne 3
0, 2
011
-73-
-103-

Exhibit H-2
Unemployment Private Purpose TotalCompensation Trust Scholarship Fund Trusts
ADDITIONSContributions: Plan member 68,844$ -$ 68,844$ Other 300,000 - 300,000 Total Contributions 368,844 - 368,844 Investment earnings: Net increase (decrease) in fair value of investments - - - Interest 211 - 211 Dividends - - - Less investment expense - - - Net investment earnings 211 - 211 Total additions 369,055 - 369,055
DEDUCTIONSQuarterly contribution reports - - - Unemployment claims 446,151 - 446,151 Scholarships awarded - - - Refunds of contributions - - - Administrative expenses 1,491 - 1,491 Total deductions 447,642 - 447,642
Change in net assets (78,587) - (78,587)
Net assets—beginning of the year 722,665 3,540 726,205
Net assets—end of the year 644,078$ 3,540$ 647,618$
Fiduciary FundsFor the Fiscal Year Ended June 30, 2011
MANALAPAN-ENGLISHTOWN REGIONAL SCHOOL DISTRICTStatement of Changes in Fiduciary Net Assets
-74--104-

Exhibit H-3
Student Activity Agency FundSchedule of Receipts and Disbursements
Balance BalanceJuly 1, 2010 Receipts Disbursements June 30, 2011
Pine Brook School 238$ 1$ -$ 239$
Manalapan-Englishtown Middle School 21,520 2,973 4,618 19,875
Odyssey of the Mind Fundraising 886 1 - 887
Wemrock Brook School 590 231 72 749
General - unallocated 27,702 45 - 27,747
Total all schools 50,936$ 3,251$ 4,690$ 49,497$
MANALAPAN-ENGLISHTOWN REGIONAL SCHOOL DISTRICT
For the Fiscal Year ended June 30, 2011
-75--105-

Exhibit H-4
Balance Cash Cash BalanceJuly 1, 2010 Receipts Disbursements June 30, 2011
Payroll deductions and witholdings 356,322$ 20,686,227$ 20,961,106$ 81,443$ Intrafund accounts payable 74,002 68,844 74,002 68,844
Total 430,324$ 20,755,071$ 21,035,108$ 150,287$
MANALAPAN-ENGLISHTOWN REGIONAL SCHOOL DISTRICTPayroll Agency Fund
Schedule of receipts and disbursementsFor the Fiscal Year ended June 30, 2011
-76--106-

LONG-TERM DEBT SCHEDULES
The Long-Term Debt Schedules are used to reflect the outstanding principal balances of the general long-term liabilities of the School District. This includes serial bonds outstanding and obligations under capital leases.
-107-

-108-

Exh
ibit
I-1
Dat
eA
mou
ntIn
tere
stB
alan
ceIs
sue
of Is
sue
of Is
sue
Dat
eA
mou
ntR
ate
July
1, 2
010
Issu
edR
etire
dJu
ne 3
0, 2
011
Sch
ool D
istr
ict B
onds
12/1
5/20
0334
,500
,000
$
10/0
1/11
425,
000
4.12
5%15
,385
,000
$
-
375,
000
$
15,0
10,0
00$
10
/01/
1251
5,00
0
4.
125%
10/0
1/13
605,
000
4.12
5%10
/01/
1470
0,00
0
4.
125%
10/0
1/15
795,
000
4.12
5%10
/01/
1690
0,00
0
4.
125%
10/0
1/17
1,01
0,00
0
4.25
0%10
/01/
181,
125,
000
4.
250%
10/0
1/19
1,24
0,00
0
4.25
0%10
/01/
201,
370,
000
4.
250%
10/0
1/21
1,50
0,00
0
4.35
0%10
/01/
221,
640,
000
4.
375%
10/0
1/23
3,18
5,00
0
4.40
0%
Sch
ool D
istr
ict B
onds
10/1
5/20
0418
,995
,000
$
12/0
1/11
1,36
0,00
0
5.00
0%17
,315
,000
-
1,33
0,00
0
15,9
85,0
00
12/0
1/12
1,35
5,00
0
5.0%
, 3.3
75%
12/0
1/13
1,35
5,00
0
4.00
0%12
/01/
141,
335,
000
3.
375%
12/0
1/15
1,31
0,00
0
5.50
0%12
/01/
161,
315,
000
5.
500%
12/0
1/17
1,31
5,00
0
5.50
0%12
/01/
181,
320,
000
5.
500%
12/0
1/19
1,32
0,00
0
5.75
0%12
/01/
201,
325,
000
5.
750%
12/0
1/21
1,33
5,00
0
5.75
0%12
/01/
221,
340,
000
5.
750%
MA
NA
LA
PA
N-E
NG
LIS
HT
OW
N R
EG
ION
AL
SC
HO
OL
DIS
TR
ICT
SC
HE
DU
LE
OF
SE
RIA
L B
ON
DS
PA
YA
BL
EA
S O
F J
UN
E 3
0, 2
011
-109
-
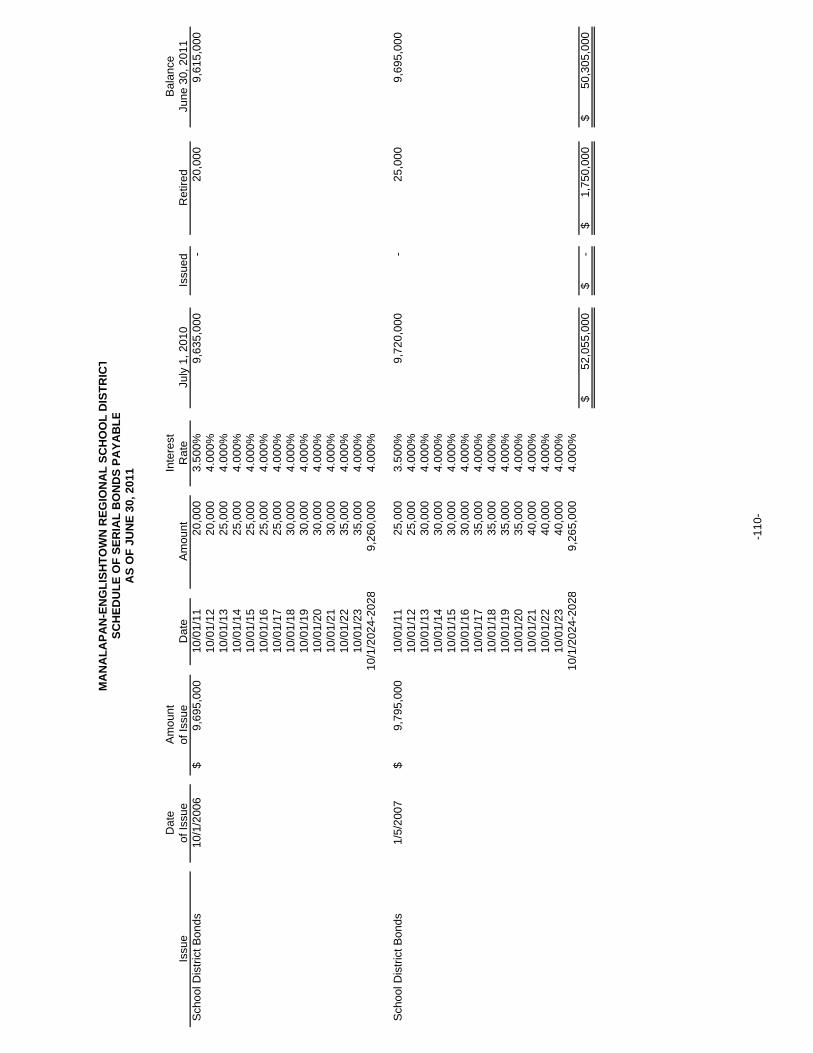
Dat
eA
mou
ntIn
tere
stB
alan
ceIs
sue
of Is
sue
of Is
sue
Dat
eA
mou
ntR
ate
July
1, 2
010
Issu
edR
etire
dJu
ne 3
0, 2
011
MA
NA
LA
PA
N-E
NG
LIS
HT
OW
N R
EG
ION
AL
SC
HO
OL
DIS
TR
ICT
SC
HE
DU
LE
OF
SE
RIA
L B
ON
DS
PA
YA
BL
EA
S O
F J
UN
E 3
0, 2
011
Sch
ool D
istr
ict B
onds
10/1
/200
69,
695,
000
$
10
/01/
1120
,000
3.
500%
9,63
5,00
0
-
20
,000
9,
615,
000
10/0
1/12
20,0
00
4.00
0%10
/01/
1325
,000
4.
000%
10/0
1/14
25,0
00
4.00
0%10
/01/
1525
,000
4.
000%
10/0
1/16
25,0
00
4.00
0%10
/01/
1725
,000
4.
000%
10/0
1/18
30,0
00
4.00
0%10
/01/
1930
,000
4.
000%
10/0
1/20
30,0
00
4.00
0%10
/01/
2130
,000
4.
000%
10/0
1/22
35,0
00
4.00
0%10
/01/
2335
,000
4.
000%
10/1
/202
4-20
289,
260,
000
4.
000%
Sch
ool D
istr
ict B
onds
1/5/
2007
9,79
5,00
0$
10/0
1/11
25,0
00
3.50
0%9,
720,
000
-
25,0
00
9,69
5,00
0
10
/01/
1225
,000
4.
000%
10/0
1/13
30,0
00
4.00
0%10
/01/
1430
,000
4.
000%
10/0
1/15
30,0
00
4.00
0%10
/01/
1630
,000
4.
000%
10/0
1/17
35,0
00
4.00
0%10
/01/
1835
,000
4.
000%
10/0
1/19
35,0
00
4.00
0%10
/01/
2035
,000
4.
000%
10/0
1/21
40,0
00
4.00
0%10
/01/
2240
,000
4.
000%
10/0
1/23
40,0
00
4.00
0%10
/1/2
024-
2028
9,26
5,00
0
4.00
0%52
,055
,000
$
-$
1,
750,
000
$
50,3
05,0
00$
-110
-

Exhibit I-2
Interest Amount of RetiredRate Original Balance Additions Current Balance
Payables Issue July 1, 2010 Current Year Year June 30, 20112 - 54 Passenger Buses 3.98% 164,110 34,578 - 34,578 -
Dell Computers 6.46% 55,786 4,193 - 4,193 -
6 - 54 Passenger Buses 4.62% 547,494 223,600 - 109,276 114,324
1 - 16 Passenger Buses 4.62% 48,695 19,887 - 9,719 10,168
2 16 Passenger Buses 4.19% 91,990 55,007 - 17,626 37,381
Apple Computers 4.33% 591,905 354,717 - 113,265 241,452
Dell Computers 7.00% 117,599 - 117,599 41,965 75,634
691,982$ 117,599$ 330,622$ 478,959$
MANALAPAN-ENGLISHTOWN REGIONAL SCHOOL DISTRICTSCHEDULE OF OBLIGATIONS UNDER CAPITAL LEASES
AS OF JUNE 30, 2011
-79--111-

Exhibit I-3
VarianceOriginal Budget Final FavorableBudget Transfers Budget Actual (Unfavorable)
REVENUES: Local sources: Local tax levy 3,500,861$ -$ 3,500,861$ 3,500,861$ -$ Miscellaneous - - - - - Total revenues - local sources 3,500,861 - 3,500,861 3,500,861 -
State sources: Debt service aid type II 550,090 - 550,090 550,090 - Total state sources 550,090 - 550,090 550,090 -
TOTAL REVENUES 4,050,951 - 4,050,951 4,050,951 -
EXPENDITURES Regular debt service: Interest 2,300,951 - 2,300,951 2,300,949 2 Redemption of principal 1,750,000 - 1,750,000 1,750,000 - Total regular debt service 4,050,951 - 4,050,951 4,050,949 2
TOTAL EXPENDITURES 4,050,951 - 4,050,951 4,050,949 2
EXCESS (DEFICIENCY) OF REVENUES OVER (UNDER) EXPENDITURES - - - 2 2
OTHER FINANCING SOURCES (USES): Operating transfers in: Transfer from General Fund - - - - - Interest Earned in Capital Projects Fund - - - 1,382 1,382
TOTAL OTHER FINANCING SOURCES (USES) - - - 1,382 1,382
EXCESS (DEFICIENCY) OF REVENUES AND OTHERFINANCING SOURCES (USES) OVER (UNDER)EXPENDITURES - - - 1,384 1,384
FUND BALANCES, July 1 - - - 426 426
FUND BALANCES, June 30 -$ -$ -$ 1,810$ 1,810$
MANALAPAN-ENGLISHTOWN REGIONAL SCHOOL DISTRICTDEBT SERVICE FUND
BUDGETARY COMPARISON SCHEDULEFOR THE FISCAL YEAR ENDED JUNE 30, 2011
-80--112-

STATISTICAL SECTION
-113-

-114-

Contents Pages
Financial Trends 117-122
Revenue Capacity 123-126
Debt Capacity 127-130
Demographic and Economic Information 131-132
Operating Information 133-138
Manalapan-Englishtown Regional School DistrictStatistical Section
These schedules contain service and infrastructure data to help the reader understand how the information in the district's financial report relates to the services the district provides and the activities it performs.
Sources: Unless otherwise noted, the information in these schedules is derived from the comprehensive annual financial reports (CAFR) for the relevant year. The district implemented GASB Statement 34 in the fiscal year ending June 30, 2003; schedules presenting district-wide information include information beginning in that year.
These schedules contain trend information to help the reader understand how the district's financial performance and well being have changed over time.
These schedules contain information to help the reader assess the district's most significant local revenue source, the property tax.
These schedules present information to help the reader assess the affordability of the district' s current levels of outstanding debt and the district's ability to issue
These schedules offer demographic and economic indicators to help the reader understand the environment within which the district's financial activities take place.
-115-

-116-
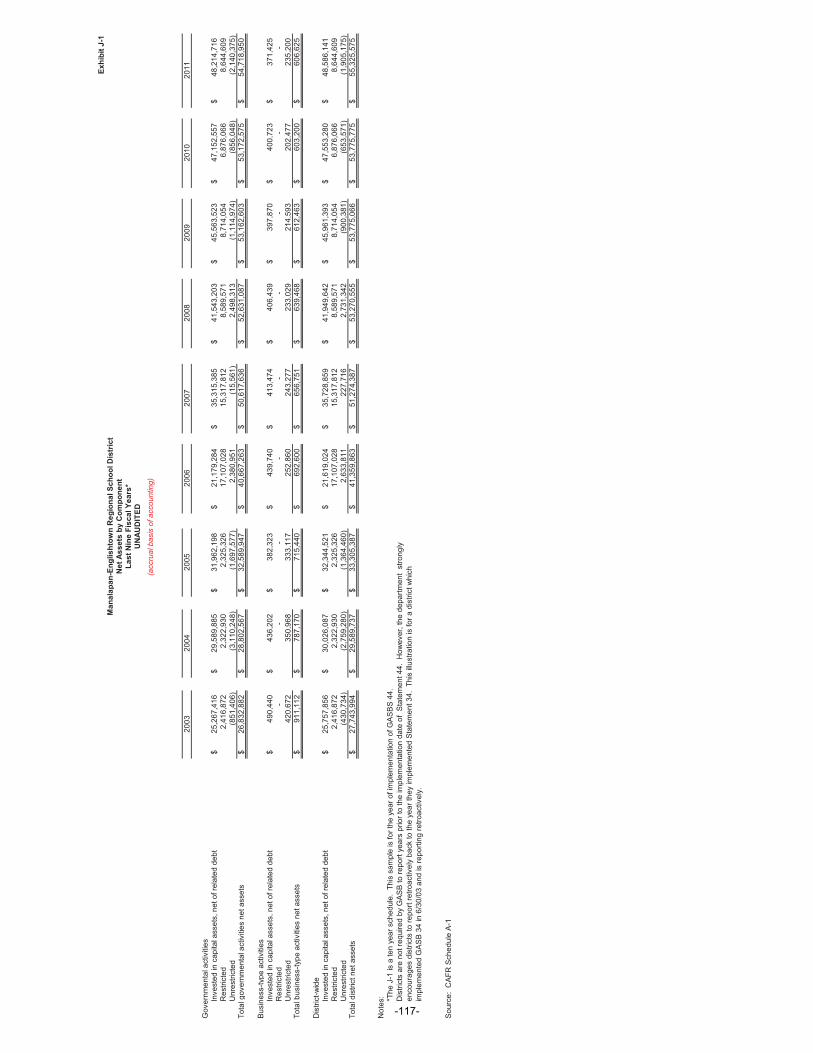
Exhi
bit J
-1
2003
2004
2005
2006
2007
2008
2009
2010
2011
Gov
ernm
enta
l act
iviti
esIn
vest
ed in
cap
ital a
sset
s, n
et o
f rel
ated
deb
t25
,267
,416
$
29,5
89,8
85$
31
,962
,198
$
21,1
79,2
84$
35
,315
,385
$
41,5
43,2
03$
45
,563
,523
$
47,1
52,5
57$
48
,214
,716
$
R
estri
cted
2,41
6,87
2
2,32
2,93
0
2,32
5,32
6
17,1
07,0
28
15
,317
,812
8,58
9,57
1
8,71
4,05
4
6,87
6,06
6
8,64
4,60
9
U
nres
trict
ed(8
51,4
06)
(3
,110
,248
)
(1
,697
,577
)
2,
380,
951
(1
5,56
1)
2,
498,
313
(1
,114
,974
)
(8
56,0
48)
(2
,140
,375
)
Tota
l gov
ernm
enta
l act
iviti
es n
et a
sset
s26
,832
,882
$
28,8
02,5
67$
32
,589
,947
$
40,6
67,2
63$
50
,617
,636
$
52,6
31,0
87$
53
,162
,603
$
53,1
72,5
75$
54
,718
,950
$
Bus
ines
s-ty
pe a
ctiv
ities
Inve
sted
in c
apita
l ass
ets,
net
of r
elat
ed d
ebt
490,
440
$
436,
202
$
382,
323
$
439,
740
$
413,
474
$
406,
439
$
397,
870
$
400,
723
$
371,
425
$
R
estri
cted
-
-
-
-
-
-
-
-
-
U
nres
trict
ed42
0,67
2
35
0,96
8
33
3,11
7
25
2,86
0
24
3,27
7
23
3,02
9
21
4,59
3
20
2,47
7
23
5,20
0
Tota
l bus
ines
s-ty
pe a
ctiv
ities
net
ass
ets
911,
112
$
787,
170
$
715,
440
$
692,
600
$
656,
751
$
639,
468
$
612,
463
$
603,
200
$
606,
625
$
Dis
trict
-wid
eIn
vest
ed in
cap
ital a
sset
s, n
et o
f rel
ated
deb
t25
,757
,856
$
30,0
26,0
87$
32
,344
,521
$
21,6
19,0
24$
35
,728
,859
$
41,9
49,6
42$
45
,961
,393
$
47,5
53,2
80$
48
,586
,141
$
R
estri
cted
2,41
6,87
2
2,32
2,93
0
2,32
5,32
6
17,1
07,0
28
15
,317
,812
8,58
9,57
1
8,71
4,05
4
6,87
6,06
6
8,64
4,60
9
U
nres
trict
ed(4
30,7
34)
(2
,759
,280
)
(1
,364
,460
)
2,
633,
811
22
7,71
6
2,
731,
342
(9
00,3
81)
(6
53,5
71)
(1
,905
,175
)
Tota
l dis
trict
net
ass
ets
27,7
43,9
94$
29
,589
,737
$
33,3
05,3
87$
41
,359
,863
$
51,2
74,3
87$
53
,270
,555
$
53,7
75,0
66$
53
,775
,775
$
55,3
25,5
75$
Not
es:
Sou
rce:
CA
FR S
ched
ule
A-1
(acc
rual
bas
is o
f acc
ount
ing)
*The
J-1
is a
ten
year
sch
edul
e. T
his
sam
ple
is fo
r the
yea
r of i
mpl
emen
tatio
n of
GA
SB
S 4
4.D
istri
cts
are
not r
equi
red
by G
AS
B to
repo
rt ye
ars
prio
r to
the
impl
emen
tatio
n da
te o
f S
tate
men
t 44.
How
ever
, the
dep
artm
ent
stro
ngly
en
cour
ages
dis
trict
s to
repo
rt re
troac
tivel
y ba
ck to
the
year
they
impl
emen
ted
Sta
tem
ent 3
4. T
his
illust
ratio
n is
for a
dis
trict
whi
ch
impl
emen
ted
GA
SB
34
in 6
/30/
03 a
nd is
repo
rting
retro
activ
ely.
Man
alap
an-E
nglis
htow
n R
egio
nal S
choo
l Dis
tric
tN
et A
sset
s by
Com
pone
ntLa
st N
ine
Fisc
al Y
ears
*U
NAU
DIT
ED
-81-
-117-

Exhi
bit J
-2
2003
2004
2005
2006
2007
2008
2009
2010
2011
Expe
nses
Gov
ernm
enta
l act
iviti
esIn
stru
ctio
nR
egul
ar22
,663
,105
$
23,8
08,6
25$
24
,276
,030
$
27,1
39,7
25$
28
,994
,649
$
31,1
71,3
81$
33
,506
,644
$
33,8
46,7
47$
33
,965
,643
$
S
peci
al e
duca
tion
6,68
8,30
7
7,
859,
802
8,56
8,10
7
8,
688,
674
10,6
47,2
62
9,
922,
314
10,6
82,1
91
11
,389
,023
11,5
52,8
09
Oth
er in
stru
ctio
n1,
801,
936
1,82
4,19
8
1,
886,
902
2,28
2,00
8
2,
242,
841
2,64
1,43
8
2,
655,
615
2,83
8,02
6
2,
679,
122
N
onpu
blic
sch
ool p
rogr
ams
-
-
-
99
,239
343,
008
93
,242
84,2
67
43
,278
30,8
18
Sup
port
Ser
vice
s:Tu
ition
-
-
-
-
-
1,
888,
440
2,05
0,14
2
1,
906,
419
1,77
6,31
3
Stu
dent
& in
stru
ctio
n re
late
d se
rvic
es7,
357,
979
7,72
7,18
1
7,
735,
817
7,70
2,45
6
7,
193,
342
7,77
9,38
2
6,
845,
377
7,12
8,05
9
6,
291,
708
G
ener
al a
nd B
usin
ess
adm
inis
trativ
e se
rvic
es2,
286,
246
2,36
9,10
7
2,
934,
638
2,78
8,35
9
2,
787,
010
2,73
2,55
2
2,
044,
524
2,71
8,55
5
2,
558,
380
S
choo
l adm
inis
trativ
e se
rvic
es2,
747,
114
2,88
3,28
0
3,
125,
213
3,25
6,41
1
3,
489,
906
3,78
6,23
3
2,
897,
738
2,90
3,63
1
2,
771,
894
P
lant
ope
ratio
ns a
nd m
aint
enan
ce6,
804,
910
7,05
4,53
8
7,
456,
433
7,91
8,52
1
8,
136,
749
8,90
2,22
9
7,
973,
821
8,45
1,27
1
7,
355,
550
P
upil
trans
porta
tion
4,20
4,12
3
4,
282,
351
4,36
5,13
7
4,
817,
676
5,75
1,59
6
5,
921,
455
5,77
8,03
9
5,
442,
491
5,72
3,63
5
Inte
rest
on
long
-term
deb
t1,
919,
530
2,60
4,78
9
2,
796,
411
3,03
7,34
5
3,
033,
991
2,62
4,90
9
2,
608,
523
2,42
8,29
2
3,
054,
333
U
nallo
cate
d de
prec
iatio
n96
4,20
9
959,
914
86
3,24
4
-
-
-
-
-
-
To
tal g
over
nmen
tal a
ctiv
ities
exp
ense
s57
,437
,459
61,3
73,7
85
64
,007
,932
67,7
30,4
14
72
,620
,354
77,4
63,5
75
77
,126
,881
79,0
95,7
92
77
,760
,205
Bus
ines
s-ty
pe a
ctiv
ities
:Fo
od s
ervi
ce1,
082,
446
1,31
7,88
5
1,
295,
088
1,37
0,23
3
1,
545,
177
1,65
0,43
3
1,
709,
349
1,85
6,88
8
1,
851,
344
To
tal b
usin
ess-
type
act
iviti
es e
xpen
se1,
082,
446
1,31
7,88
5
1,
295,
088
1,37
0,23
3
1,
545,
177
1,65
0,43
3
1,
709,
349
1,85
6,88
8
1,
851,
344
To
tal d
istri
ct e
xpen
ses
58,5
19,9
05$
62
,691
,670
$
65,3
03,0
20$
69
,100
,647
$
74,1
65,5
31$
79
,114
,008
$
78,8
36,2
30$
80
,952
,680
$
79,6
11,5
49$
Prog
ram
Rev
enue
sG
over
nmen
tal a
ctiv
ities
:C
harg
es fo
r ser
vice
s-
$
-$
-
$
-$
-
$
-$
-
$
-$
-
$
O
pera
ting
gran
ts a
nd c
ontri
butio
ns2,
854,
193
2,86
0,84
2
2,
906,
935
7,53
2,45
0
15
,045
,299
10,1
62,3
08
6,
402,
574
6,71
6,39
8
6,
808,
229
C
apita
l gra
nts
and
cont
ribut
ions
-
-
-
-
7,83
7,95
6
-
-
-
-
Tota
l gov
ernm
enta
l act
iviti
es p
rogr
am re
venu
es2,
854,
193
2,86
0,84
2
2,
906,
935
7,53
2,45
0
22
,883
,255
10,1
62,3
08
6,
402,
574
6,71
6,39
8
6,
808,
229
Fisc
al Y
ear E
nded
Jun
e 30
,
Man
alap
an-E
nglis
htow
n R
egio
nal S
choo
l Dis
tric
tC
hang
es in
Net
Ass
ets
Last
Nin
e Fi
scal
Yea
rs*
(acc
rual
bas
is o
f acc
ount
ing)
UN
AU
DIT
ED
-82-
-118-

Exhi
bit J
-2
2003
2004
2005
2006
2007
2008
2009
2010
2011
Fisc
al Y
ear E
nded
Jun
e 30
,
Man
alap
an-E
nglis
htow
n R
egio
nal S
choo
l Dis
tric
tC
hang
es in
Net
Ass
ets
Last
Nin
e Fi
scal
Yea
rs*
(acc
rual
bas
is o
f acc
ount
ing)
UN
AU
DIT
ED
Bus
ines
s-ty
pe a
ctiv
ities
:C
harg
es fo
r ser
vice
sFo
od s
ervi
ce1,
020,
518
1,02
0,51
8
1,
044,
555
1,16
3,35
6
1,
265,
852
1,36
2,81
5
1,
391,
715
1,49
2,83
1
1,
494,
172
O
pera
ting
gran
ts a
nd c
ontri
butio
ns17
3,42
5
173,
425
17
8,80
3
184,
037
24
3,47
6
270,
335
29
0,62
9
354,
794
36
0,59
7
To
tal b
usin
ess
type
act
iviti
es p
rogr
am re
venu
es1,
193,
943
1,19
3,94
3
1,
223,
358
1,34
7,39
3
1,
509,
328
1,63
3,15
0
1,
682,
344
1,84
7,62
5
1,
854,
769
To
tal d
istri
ct p
rogr
am re
venu
es4,
048,
136
$
4,05
4,78
5$
4,
130,
293
$
8,87
9,84
3$
24
,392
,583
$
11,7
95,4
58$
8,
084,
918
$
8,56
4,02
3$
8,
662,
998
$
Net
(Exp
ense
)/Rev
enue
Gov
ernm
enta
l act
iviti
es(5
4,58
3,26
6)$
(58,
512,
943)
$
(6
1,10
0,99
7)$
(60,
197,
964)
$
(4
9,73
7,09
9)$
(67,
301,
267)
$
(7
0,72
4,30
7)$
(72,
379,
394)
$
(7
0,95
1,97
6)$
B
usin
ess-
type
act
iviti
es11
1,49
7
(123
,942
)
(71,
730)
(22,
840)
(35,
849)
(17,
283)
(27,
005)
(9,2
63)
3,42
5
To
tal d
istri
ct-w
ide
net e
xpen
se(5
4,47
1,76
9)$
(58,
636,
885)
$
(6
1,17
2,72
7)$
(60,
220,
804)
$
(4
9,77
2,94
8)$
(67,
318,
550)
$
(7
0,75
1,31
2)$
(72,
388,
657)
$
(7
0,94
8,55
1)$
Gen
eral
Rev
enue
s an
d O
ther
Cha
nges
in N
et A
sset
sG
over
nmen
tal a
ctiv
ities
:P
rope
rty ta
xes
levi
ed fo
r gen
eral
pur
pose
s, n
et35
,527
,327
$
35,5
27,3
27$
36
,796
,835
$
38,1
23,3
31$
41
,439
,169
$
45,2
71,2
65$
46
,624
,684
$
48,1
75,8
74$
49
,550
,724
$
Ta
xes
levi
ed fo
r deb
t ser
vice
3,33
1,53
1
3,
331,
531
4,66
3,72
5
3,
804,
014
4,43
2,46
4
4,
654,
157
3,08
6,70
1
3,
416,
908
3,50
0,86
1
Unr
estri
cted
gra
nts
and
cont
ribut
ions
21,1
17,2
71
21
,117
,271
21,7
95,1
55
24
,890
,813
12,7
15,6
39
18
,651
,092
20,8
81,8
11
20
,633
,679
19,1
40,9
55
Tuiti
on re
ceiv
ed-
-
-
28
,502
16,3
04
6,
722
2,
101
61
8
-
Inve
stm
ent e
arni
ngs
391,
835
39
1,83
5
866,
707
1,
212,
736
893,
960
33
7,24
6
183,
020
8,
984
5,
380
Mis
cella
neou
s in
com
e 11
4,66
4
114,
664
76
5,95
6
215,
883
25
3,73
8
393,
236
47
7,50
5
210,
878
30
0,43
1
To
tal g
over
nmen
tal a
ctiv
ities
60,4
82,6
28
60
,482
,628
64,8
88,3
78
68
,275
,279
59,7
51,2
74
69
,313
,718
71,2
55,8
22
72
,446
,941
72,4
98,3
51
Bus
ines
s-ty
pe a
ctiv
ities
:In
vest
men
t ear
ning
s-
-
-
-
-
-
-
-
-
To
tal b
usin
ess-
type
act
iviti
es-
-
-
-
-
-
-
-
-
To
tal d
istri
ct-w
ide
60,4
82,6
28$
60
,482
,628
$
64,8
88,3
78$
68
,275
,279
$
59,7
51,2
74$
69
,313
,718
$
71,2
55,8
22$
72
,446
,941
$
72,4
98,3
51$
Cha
nge
in N
et A
sset
sG
over
nmen
tal a
ctiv
ities
5,89
9,36
2$
1,
969,
685
$
3,78
7,38
1$
8,
077,
315
$
10,0
14,1
75$
2,
012,
451
$
531,
515
$
67
,547
$
1,54
6,37
5$
Bus
ines
s-ty
pe a
ctiv
ities
111,
497
(1
23,9
42)
(7
1,73
0)
(2
2,84
0)
(3
5,84
9)
(1
7,28
3)
(2
7,00
5)
(9
,263
)
3,
425
Tota
l dis
trict
6,01
0,85
9$
1,
845,
743
$
3,71
5,65
1$
8,
054,
475
$
9,97
8,32
6$
1,
995,
168
$
504,
510
$
58
,284
$
1,54
9,80
0$
* G
AS
B re
quire
s th
at te
n ye
ars
of s
tatis
tical
dat
a be
pre
sent
ed, h
owev
er
in c
urre
nt y
ear o
nly
the
year
s ab
ove
need
to b
e pr
esen
ted.
Eac
h ye
ar
here
afte
r, an
add
ition
al y
ear's
dat
a w
ill be
incl
uded
unt
il te
n ye
ars
of
da
ta is
pre
sent
ed.
-83-
-119-

Exhi
bit J
-3
2003
2004
2005
2006
2007
2008
2009
2010
2011
Gen
eral
Fun
dR
eser
ved
1,45
2,08
0$
1,
088,
948
$
1,80
9,37
5$
1,
678,
453
$
1,
988,
901
$
1,
741,
564
$
5,
049,
103
$
5,
074,
406
$
6,
244,
982
$
U
nres
erve
d1,
357,
737
1,66
8,88
2
1,
830,
114
1,39
7,85
9
1,39
1,83
7
1,57
9,78
7
(424
,907
)
(5
63,2
11)
(91,
073)
To
tal g
ener
al fu
nd2,
809,
817
$
2,75
7,83
0$
3,
639,
489
$
3,07
6,31
2$
3,38
0,73
8$
3,32
1,35
1$
4,62
4,19
6$
4,51
1,19
5$
6,15
3,90
9$
All
Oth
er G
over
nmen
tal F
unds
Res
erve
d19
2,41
5$
1,90
1,48
4$
15
,712
,535
$
13,1
27,4
96$
12,0
87,7
09$
-
$
5,
627,
141
$
3,
820,
098
$
2,
397,
817
$
U
nres
erve
d, re
porte
d in
:S
peci
al re
venu
e fu
nd(1
2,31
7)
-
-
-
-
-
-
-
-
C
apita
l pro
ject
s fu
nd22
7,42
1
31,2
74,2
93
13
,025
,880
5,10
3,45
3
-
7,42
9,79
5
-
-
-
Deb
t ser
vice
fund
78,9
58
34
1,51
8
404,
927
13
8,46
1
327,
758
173,
382
(9
9,84
2)
426
1,
810
Tota
l all
othe
r gov
ernm
enta
l fun
ds48
6,47
7$
33,5
17,2
95$
29
,143
,342
$
18,3
69,4
10$
12,4
15,4
67$
7,
603,
177
$
5,
527,
299
$
3,
820,
524
$
2,
399,
627
$
* GA
SB
requ
ires
that
ten
year
s of
sta
tistic
al d
ata
be p
rese
nted
, how
ever
in
cur
rent
yea
r onl
y th
e ye
ars
abov
e ne
ed to
be
pres
ente
d. E
ach
year
he
reaf
ter,
an a
dditi
onal
yea
r's d
ata
will
be in
clud
ed u
ntil
ten
year
s of
data
is p
rese
nted
.
Fisc
al Y
ear E
nded
Jun
e 30
,
Man
alap
an-E
nglis
htow
n R
egio
nal S
choo
l Dis
tric
tFu
nd B
alan
ces,
Gov
ernm
enta
l Fun
ds,
Last
Nin
e Fi
scal
Yea
rs*
(mod
ified
acc
rual
bas
is o
f acc
ount
ing)
UN
AUD
ITED
-84-
-120-

Exhi
bit J
-4
2002
2003
2004
2005
2006
2007
2008
2009
2010
2011
Rev
enue
sTa
x le
vy33
,744
,311
$
35,9
89,3
89$
38
,858
,858
$
41,4
60,5
60$
41
,927
,345
$
45
,871
,633
$
49,9
25,4
22$
49
,711
,385
$
51,5
92,7
82$
53
,051
,585
$
Tuiti
on c
harg
es2,
669
97
0
1,
091
3,
066
28
,502
16
,305
6,72
2
2,10
1
618
-
In
tere
st e
arni
ngs
108,
406
64,5
12
94
,091
158,
463
1,21
2,73
6
893,
960
337,
246
183,
020
8,98
4
5,38
0
Mis
cella
neou
s2,
032,
894
18
5,04
5
88
,975
383,
993
215,
883
265,
865
393,
236
497,
002
241,
804
296,
182
Stat
e so
urce
s20
,301
,528
20,8
29,1
08
22
,665
,762
23,2
80,6
02
30
,556
,663
33
,926
,997
26,8
51,4
58
25
,479
,664
22,4
54,8
77
23
,723
,115
Fede
ral s
ourc
es1,
037,
890
1,
271,
346
1,
312,
351
1,
421,
488
1,
789,
024
1,
595,
967
1,
997,
503
1,
785,
224
4,
864,
274
2,
206,
537
To
tal r
even
ue57
,227
,698
58,3
40,3
70
63
,021
,128
66,7
08,1
72
75
,730
,153
82
,570
,727
79,5
11,5
87
77
,658
,396
79,1
63,3
39
79
,282
,799
Expe
nditu
res
Inst
ruct
ion
Reg
ular
Inst
ruct
ion
16,6
91,1
30
17
,151
,711
17,7
36,5
47
17
,968
,698
25,7
87,9
84
27,4
79,3
20
30
,064
,503
31,7
98,8
53
24
,832
,870
23,7
84,4
32
Sp
ecia
l edu
catio
n in
stru
ctio
n4,
206,
572
5,
332,
343
5,
781,
589
6,
184,
188
8,
599,
184
10
,521
,685
9,81
6,93
2
10,5
58,3
65
8,
894,
859
8,
951,
764
O
ther
inst
ruct
ion
1,59
9,04
1
1,74
9,21
6
1,76
5,34
4
1,82
1,47
7
2,28
2,00
8
2,23
4,48
4
2,64
1,43
8
2,65
5,61
5
2,20
0,04
2
2,01
1,39
4
Non
publ
ic s
choo
l pro
gram
s-
-
-
-
99
,239
34
1,91
2
93
,242
84,2
67
43
,278
30,8
18
Su
ppor
t Ser
vice
s:St
uden
t & in
stru
ctio
n re
late
d se
rvic
es5,
499,
681
6,
122,
834
6,
323,
702
6,
360,
814
7,
579,
855
7,
039,
216
9,
508,
313
8,
725,
739
8,
834,
805
7,
871,
127
G
ener
al a
dmin
istra
tive
serv
ices
1,04
4,86
2
1,06
1,63
5
1,15
6,12
9
840,
757
3,24
4,15
7
841,
606
1,04
6,95
2
760,
764
1,38
5,29
5
1,19
3,95
2
Scho
ol A
dmin
istra
tive
serv
ices
2,24
0,91
1
2,17
8,78
1
2,24
0,27
1
2,38
5,83
1
918,
308
3,46
4,30
7
3,76
9,49
8
2,88
0,78
5
2,88
3,93
4
2,75
2,47
0
Busi
ness
adm
inis
trativ
e se
rvic
es87
0,43
0
96
6,13
2
1,
009,
737
1,
836,
955
1,
251,
726
1,
803,
465
1,
685,
600
1,
283,
760
1,
333,
260
1,
362,
928
Pl
ant o
pera
tions
and
mai
nten
ance
5,15
0,16
9
6,02
7,42
9
6,18
4,49
5
6,47
9,42
1
417,
825
8,08
0,78
1
8,78
8,45
6
7,94
5,28
1
8,01
7,57
8
7,40
4,81
4
Pupi
l tra
nspo
rtatio
n3,
542,
247
3,
622,
082
4,
038,
683
4,
026,
766
7,
870,
532
5,
469,
811
5,
449,
955
5,
514,
689
5,
589,
827
5,
728,
581
U
nallo
cate
d em
ploy
ee b
enef
its6,
737,
823
8,
909,
104
10
,149
,618
11,0
87,3
93
4,
575,
302
-
-
-
10,6
33,0
68
11
,128
,801
Cap
ital o
utla
y1,
312,
102
1,
314,
141
3,
812,
566
5,
321,
604
18
,667
,020
15
,034
,457
6,11
6,65
2
3,72
2,02
4
2,26
7,64
0
2,90
6,54
8
Deb
t ser
vice
:-
-
-
-
-
-
-
-
-
-
Prin
cipa
l1,
925,
000
2,
865,
000
3,
020,
000
3,
420,
000
3,
190,
000
21
,755
,000
3,58
0,00
0
1,63
0,00
0
1,69
5,00
0
1,75
0,00
0
Inte
rest
and
oth
er c
harg
es2,
905,
581
1,
938,
908
1,
795,
933
3,
301,
351
3,
037,
345
2,
880,
600
2,
624,
909
2,
439,
462
2,
371,
662
2,
300,
949
To
tal e
xpen
ditu
res
53,7
25,5
49
59
,239
,316
65,0
14,6
14
71
,035
,255
87,5
20,4
85
106,
946,
644
85
,186
,450
79,9
99,6
03
80
,983
,118
79,1
78,5
78
Ex
cess
(Def
icie
ncy)
of r
even
ues
ove
r (un
der)
exp
endi
ture
s3,
502,
149
(8
98,9
46)
(1
,993
,486
)
(4
,327
,083
)
(1
1,79
0,33
2)
(2
4,37
5,91
7)
(5,6
74,8
63)
(2,3
41,2
07)
(1,8
19,7
79)
104,
221
Oth
er F
inan
cing
sou
rces
(use
s)C
apita
l lea
ses
(non
-bud
gete
d)70
7,36
0
-
138,
230
10,3
00
50
9,28
0
33
1,40
0
80
3,18
6
68
3,89
5
-
117,
599
Bond
pro
ceed
s-
-
-
-
-
18
,395
,000
-
-
-
-
Par a
mou
nt o
f bon
ds-
-
34
,500
,000
78,8
36
-
-
-
-
-
-
Accr
ued
inte
rest
-
-
34,9
34
34
,239
-
-
-
-
-
-
Tr
ansf
ers
in51
,508
16,3
98
30
9,48
9
70
8,24
4
1,
314,
834
81
8,63
4
29
,277
945,
160
100,
266
1,38
2
Tran
sfer
s ou
t(5
1,50
8)
(1
6,39
8)
(3
09,4
89)
(7
08,2
44)
(1
,370
,891
)
(818
,634
)
(29,
277)
(60,
881)
(100
,266
)
(1,3
82)
Tota
l oth
er fi
nanc
ing
sour
ces
(use
s)70
7,36
0
-
34,6
73,1
64
12
3,37
5
45
3,22
3
18
,726
,400
803,
186
1,56
8,17
4
-
11
7,59
9
Net
cha
nge
in fu
nd b
alan
ces
4,20
9,50
9$
(898
,946
)$
32,6
79,6
78$
(4
,203
,708
)$
(1
1,33
7,10
9)$
(5
,649
,517
)$
(4
,871
,677
)$
(7
73,0
33)
$
(1
,819
,779
)$
22
1,82
0$
Deb
t ser
vice
as
a pe
rcen
tage
of
nonc
apita
l exp
endi
ture
s9.
2%8.
3%7.
9%10
.2%
9.0%
26.8
%7.
8%5.
3%5.
2%5.
3%
Sour
ce: D
istr
ict r
ecor
ds
Not
e: N
onca
pita
l exp
endi
ture
s ar
e to
tal e
xpen
ditu
res
less
cap
ital o
utla
y.
C
entra
l Ser
vice
and
Adm
inis
trativ
e In
form
atio
n Te
chno
logy
acc
ount
cla
ssifi
catio
ns w
ere
add
ed b
egin
ning
with
yea
r end
Jun
e 30
, 200
5.Pr
ior t
o Ju
ne 3
0, 2
005,
Cen
tral S
ervi
ce a
nd A
dmin
istra
tive
Info
rmat
ion
Tech
nolo
gy w
ere
c
ombi
ned
in O
ther
Sup
port
Serv
ices
as
Busi
ness
and
Oth
er S
uppo
rt Se
rvic
es
Fisc
al Y
ear E
nded
Jun
e 30
,
Man
alap
an-E
nglis
htow
n R
egio
nal S
choo
l Dis
tric
tC
hang
es in
Fun
d B
alan
ces,
Gov
ernm
enta
l Fun
ds,
Last
Ten
Fis
cal Y
ears
(mod
ified
acc
rual
bas
is o
f acc
ount
ing)
UN
AU
DIT
ED
-85-
-121-

Exhibit J-5
Fiscal Year Interest on TuitionEnded June 30, Investments Revenue Rentals Misc. Total
2002 108,406 2,669 26,160 232,799 370,034 2003 64,512 970 29,433 155,612 250,527 2004 94,091 1,091 29,678 59,297 184,157 2005 158,463 3,006 37,500 346,493 545,462 2006 306,509 28,502 1,000 201,109 537,120 2007 351,326 16,305 10,578 166,689 544,898 2008 307,969 6,722 16,223 355,998 686,912 2009 116,351 2,101 16,610 477,505 612,567 2010 173 618 - 210,878 211,669 2011 2,350 - - 276,650 279,000
Source: District records
Manalapan-Englishtown Regional School DistrictGeneral Fund - Other Local Revenue by Source
Last Ten Fiscal Years
(modified accrual basis of accounting)UNAUDITED
-86--122-

Exhi
bit J
-6
MA
NA
LAPA
N T
OW
NSH
IP
Fisc
al
Year
E
nded
Ju
ne 3
0,V
acan
t Lan
dR
esid
entia
lFa
rm R
eg.
Qfa
rmC
omm
erci
alIn
dust
rial
Apa
rtmen
tTo
tal A
sses
sed
Val
ue
Less
:
Ta
x-E
xem
pt
Pro
perty
Pub
lic U
tiliti
es a
Net
Val
uatio
n Ta
xabl
e
Tota
l Dire
ct
Sch
ool T
ax
Rat
e b
Est
imat
ed A
ctua
l (C
ount
y E
qual
ized
Val
ue)
2002
59,2
36,7
002,
013,
660,
600
17,7
22,5
003,
025,
900
171,
351,
300
11,1
42,6
00-
2,
276,
139,
600
-
4,
033,
844
2,28
0,17
3,44
41.
469
3,02
8,01
7,29
020
0351
,469
,900
2,07
4,98
6,50
017
,829
,900
2,94
0,70
017
9,21
9,00
011
,519
,100
-
2,33
7,96
5,10
0-
3,81
8,26
22,
341,
783,
362
1.53
53,
483,
837,
544
2004
47,7
46,8
002,
116,
801,
900
16,9
05,6
002,
828,
900
178,
727,
000
11,5
19,1
00-
2,
374,
529,
300
-
3,
330,
216
2,37
7,85
9,51
61.
660
3,97
7,92
1,78
120
0579
,348
,800
2,15
4,59
2,60
016
,211
,800
2,12
6,10
018
1,79
9,70
011
,519
,100
-
2,44
5,59
8,10
0-
2,97
7,35
52,
448,
575,
455
1.59
24,
480,
195,
412
2006
85,6
83,9
002,
214,
784,
300
17,3
55,1
002,
183,
400
182,
740,
300
11,5
19,1
00-
2,
514,
266,
100
-
2,
632,
821
2,51
6,89
8,92
11.
674
5,05
6,91
0,19
220
0720
0,22
9,10
05,
485,
094,
000
36,5
88,5
002,
296,
200
402,
831,
900
24,6
03,5
00-
6,
151,
643,
200
-
5,
707,
918
6,15
7,35
1,11
81.
674
5,83
7,55
0,66
720
0820
0,47
8,70
05,
658,
484,
200
36,7
79,5
002,
315,
700
403,
109,
300
24,6
03,5
00-
6,
325,
770,
900
-
6,
259,
661
6,33
2,03
0,56
10.
747
6,26
7,55
9,71
020
0916
0,21
9,40
05,
732,
755,
580
36,7
25,8
602,
314,
400
425,
667,
160
24,6
03,5
00-
6,
382,
285,
900
-
7,
636,
903
6,38
9,92
2,80
30.
776
6,48
0,94
8,40
220
1010
2,80
3,80
05,
111,
385,
600
32,9
33,9
602,
338,
000
377,
965,
540
24,6
67,0
00-
5,
652,
093,
900
-
9,
382,
496
5,66
1,47
6,39
61.
888
6,54
2,67
7,04
620
1110
2,80
3,80
05,
111,
395,
600
32,9
33,9
002,
253,
000
380,
040,
400
22,6
67,2
00-
5,
652,
093,
900
-
9,
382,
496
5,66
1,47
6,39
61.
961
6,28
1,82
0,51
6
ENG
LISH
TOW
N T
OW
NSH
IP
Fisc
al
Year
E
nded
Ju
ne 3
0,V
acan
t Lan
dR
esid
entia
lFa
rm R
eg.
Qfa
rmC
omm
erci
alIn
dust
rial
Apa
rtmen
tTo
tal A
sses
sed
Val
ue
Less
:
Ta
x-E
xem
pt
Pro
perty
Pub
lic U
tiliti
es a
Net
Val
uatio
n Ta
xabl
e
Tota
l Dire
ct
Sch
ool T
ax
Rat
e b
Est
imat
ed A
ctua
l (C
ount
y E
qual
ized
Val
ue)
2002
1,49
6,10
072
,832
,900
164,
000
2,50
014
,991
,500
3,25
9,80
063
3,00
093
,379
,800
-
2,
234,
590
95,6
14,3
901.
408
109,
374,
056
2003
1,48
6,20
073
,641
,200
164,
000
2,50
014
,516
,500
3,25
9,80
063
3,00
093
,703
,200
-
2,
363,
187
96,0
66,3
871.
615
129,
907,
273
2004
1,44
4,60
074
,025
,200
164,
000
2,50
013
,026
,100
3,27
5,90
063
3,00
092
,571
,300
-
1,
980,
282
94,5
51,5
821.
729
151,
953,
225
2005
1,57
6,40
074
,384
,600
164,
000
2,50
013
,476
,100
3,27
5,90
063
3,00
093
,512
,500
-
1,
725,
109
95,2
37,6
091.
775
169,
651,
537
2006
2,78
1,40
075
,336
,000
-
-
13
,585
,100
3,27
5,90
074
3,20
095
,721
,600
-
1,
551,
774
97,2
73,3
741.
806
189,
388,
163
2007
1,45
4,00
080
,771
,800
-
-
14
,729
,700
2,97
5,90
074
3,20
010
0,67
4,60
0-
1,17
0,83
110
1,84
5,43
11.
789
218,
018,
531
2008
3,35
3,40
019
8,83
8,40
0-
-
42,4
25,9
0010
,229
,600
1,26
2,10
025
6,10
9,40
0-
3,77
2,71
725
9,88
2,11
71.
927
238,
835,
137
2009
3,97
8,00
019
8,11
0,00
0-
-
42,0
80,1
009,
879,
300
1,26
2,10
025
5,30
9,50
0-
5,90
4,75
926
1,21
4,25
90.
758
246,
645,
548
2010
3,89
2,30
019
8,20
6,20
0-
-
42,0
19,6
009,
879,
300
1,26
2,10
025
5,25
9,50
0-
4,45
4,06
325
9,71
3,56
31.
775
250,
643,
293
2011
3,78
8,70
019
8,27
9,70
0-
-
39,1
34,1
009,
879,
300
1,26
2,10
025
2,34
3,90
0-
4,45
4,06
325
6,79
7,96
31.
788
242,
547,
058
Sou
rce:
Dis
trict
reco
rds
Tax
list s
umm
ary
& M
unic
ipal
Tax
Ass
esso
r
Not
e:R
eass
essm
ent o
ccur
s w
hen
orde
red
by th
e C
ount
y B
oard
of T
axat
ion
aTa
xabl
e V
alue
of M
achi
nery
, Im
prov
emen
ts a
nd E
quip
men
t of T
elep
hone
, Tel
egra
ph a
nd M
esse
nger
Sys
tem
Com
pani
esb
Tax
rate
s ar
e pe
r $10
0
Rea
l pro
perty
is re
quire
d to
be
asse
ssed
at s
ome
perc
enta
ge o
f tru
e va
lue
(fair
or m
arke
t val
ue) e
stab
lishe
d by
eac
h co
unty
boa
rd o
f tax
atio
n.
Man
alap
an-E
nglis
htow
n R
egio
nal S
choo
l Dis
tric
tA
sses
sed
Valu
e an
d A
ctua
l Val
ue o
f Tax
able
Pro
pert
yLa
st T
en F
isca
l Yea
rs
-87-
-123-

Exhibit J-7
Fiscal Year
Ended June 30, Basic Rate a
General Obligation Debt Service b Total Direct
Freehold Regional School District
Manalapan Township Library/Other
Monmouth County
Total Direct and Overlapping Tax
Rate
2002 1.411 0.058 1.469 0.710 0.480 0.029 0.584 3.272 2003 1.477 0.058 1.535 0.795 0.490 0.030 0.606 3.456 2004 1.594 0.066 1.660 0.798 0.499 0.031 0.603 3.591 2005 1.529 0.063 1.592 0.812 0.494 0.031 0.599 3.528 2006 1.606 0.068 1.674 0.812 0.494 0.031 0.582 3.593 2007 0.675 0.072 0.747 0.363 0.268 0.014 0.252 1.644 2008 0.700 0.076 0.776 0.360 0.284 0.014 0.230 1.664 2009 0.700 0.076 0.776 0.364 0.295 0.014 0.235 1.684 2010 0.753 0.076 0.829 0.432 0.332 0.016 0.279 1.888 2011 0.849 0.060 0.909 0.421 0.332 0.020 0.279 1.961
Fiscal Year
Ended June 30, Basic Rate a
General Obligation Debt Service b Total Direct
Freehold Regional School District
Englishtown Borough Library/Other
Monmouth County
Total Direct and Overlapping Tax
Rate
2002 1.208 0.200 1.408 0.466 0.439 0.034 0.507 2.854 2003 1.399 0.216 1.615 0.525 0.439 0.027 0.551 3.157 2004 1.497 0.214 1.711 0.631 0.668 0.028 0.566 3.604 2005 1.558 0.200 1.758 0.595 0.725 0.030 0.583 3.691 2006 1.625 0.164 1.789 0.683 0.785 0.030 0.574 3.861 2007 1.741 0.186 1.927 0.646 0.785 0.031 0.586 3.975 2008 0.687 0.071 0.758 0.268 0.328 0.012 0.225 1.591 2009 0.707 0.045 0.752 0.303 0.365 0.013 0.236 1.669 2010 0.784 0.024 0.808 0.318 0.385 0.013 0.251 1.775 2011 0.785 0.054 0.839 0.299 0.405 0.013 0.232 1.788
Source: District Records and Municipal Tax Collector
Note:
a The district's basic tax rate is calculated from the A4F form which is submitted with the budget and the Net valuation taxable.b Rates for debt service are based on each year's requirements.
Manalapan Township
Last Ten Fiscal YearsDirect and Overlapping Property Tax Rates
Manalapan-Englishtown Regional School District
NJSA 18A:7F-5d limits the amount that the district can submit for a general fund tax levy . The levy when added to other components of the
Manalapan-Englishtown Board of Education
Manalapan-Englishtown Board of Education
(rate per $100 of assessed value)
Overlapping Rates
Overlapping RatesEnglishtown Borough
-88--124-

Exhibit J-8
Taxable % of Total Taxable % of TotalAssessed Rank District Net Assessed Rank District Net
Taxpayer Value [Optional] Assessed Value Value [Optional] Assessed Value
Manalapan Realty 42,593,600$ 1 0.72% 10,519,600$ 3 0.49%Manalapan VF 29,989,700 2 0.51% - 0.00%K Hovnanian at Manalapan II 28,026,800 3 0.47% - 0.00%Towne Point Associates 11,867,500 4 0.20% 7,216,900 4 0.33%Trans Equity Realty, LLC 9,694,600 5 0.16% 4,450,000 8 0.21%Reiss Manufacturing, Inc. 7,958,000 6 0.13% - 0.00%Taylor 9 South Associates, LLC 7,593,400 7 0.13% - 0.00%Monmouth Investors, LLC 7,500,000 8 0.13% - 0.00%Lenine, LLC 7,356,000 9 0.12% - 0.21%Pension Road Realty 7,200,000 10 0.12% 4,192,000 9 0.19%Muscarelle/Am Properties 12,374,800 1 0.57%Manalapan Industries 11,400,000 2 0.53%Calton Homes, Inc. 6,985,800 5 0.32%SGS Communities 4,642,500 6 0.21%Westmon Corp. 4,471,800 7 0.21%Bell Atlantic - NJ 4,174,774 10 0.20%Total 159,779,600$ 2.71% 70,428,174$ 3.27%
Taxable % of Total Taxable % of TotalAssessed Rank District Net Assessed Rank District Net
Taxpayer Value [Optional] Assessed Value Value [Optional] Assessed Value
BAL Governor's Crossing LLC 7,425,200$ 1 0.13% - 0.00%BTR Englishtown LLC 7,229,300 2 0.12% -$ 0.00%Dorothy Leo Inc. 3,495,400 3 0.06% - 0.00%Wemacs, LLC 3,366,700 4 0.06% 598,000 5 0.67%Village Center Associates LLC 3,312,700 5 0.06% - 0.00%Durling Realty, LLC 2,150,300 6 0.04% - 0.00%Brooklawn Gardens, Inc. 2,021,800 7 0.03% - 0.00%K & K Englishtown, Inc. 1,782,800 8 0.03% 550,000 6 0.62%Moskowitz, K Trust & Berger V 1,374,700 9 0.02% - 0.00%Carr, Pauline H & Carr, John 1,293,800 10Ruck, DiRubbio & MacCauley 6,500,000 1 7.34%Englishtown Industrial Park 2,462,500 2 2.78%Individual Taxpayer #1 1,203,100 3 1.36%Verizon New Jersey 600,000 4 0.68%Jolor Realty Co. 422,800 7 0.48%Individual Taxpayer #2 406,300 8 0.46%Individual Taxpayer #3 399,400 9 0.45%Exxon Corporation 372,400 10 0.42%Total 26,027,500$ 0.42% -$ 15.26%
2011 2002
Manalapan-Englishtown Regional School DistrictPrincipal Property Tax Payers
Current Year and Nine Years Ago
ENGLISHTOWN BOROUGH
MANALAPAN TOWNSHIP
2011 2002
-89-
-125-

Exhibit J-9
AmountPercentage of
Levy
2004 89,387,231 87,443,600 97.83% - 2005 89,914,296 88,520,335 98.45% - 2006 95,442,237 94,037,409 98.53% - 2007 105,569,145 103,781,032 98.31% - 2008 111,238,139 109,196,505 98.16% - 2009 111,863,760 110,272,757 98.58% - 2010 115,530,685 113,968,838 98.65% -
AmountPercentage of
Levy
2004 1,551,411 1,551,411 100.00% - 2005 1,635,126 1,635,126 100.00% - 2006 1,691,301 1,691,301 100.00% - 2007 1,757,710 1,757,710 100.00% - 2008 1,780,484 1,780,484 100.00% - 2009 1,983,899 1,983,899 100.00% - 2010 1,976,369 1,976,369 100.00% -
Note: School taxes are collected by the Municipal Tax Collector. Under New Jersey State Statute, a municipality is required to remit to the school district the entire property tax balance, which is the amount voted upon or certified, prior to the end of the school year.
Manalapan-Englishtown Regional School DistrictProperty Tax Levies and Collections
Last Seven Fiscal Years
MANALAPAN TOWNSHIP
Source: District records including the Certificate and Report of School Taxes (A4F form)
Taxes Levied for the Fiscal Year
Collected within the Fiscal Year of the Levy Collections in
Subsequent Years
Fiscal Year
Ended June 30,
Taxes Levied for the Fiscal Year
Collected within the Fiscal Year of the Levy Collections in
Subsequent Years
ENGLISHTOWN BOROUGH
Fiscal Year
Ended June 30,
-90--126-

Exhi
bit J
-10
Bus
ines
s-Ty
pe
Act
iviti
esFi
scal
Ye
ar
End
ed
June
30,
Gen
eral
Obl
igat
ion
Bon
ds b
Cer
tific
ates
of
Par
ticip
atio
nC
apita
l Lea
ses
Bon
d A
ntic
ipat
ion
Not
es (B
AN
s)C
apita
l Lea
ses
Tota
l Dis
trict
Per
cent
age
of
Per
sona
l Inc
ome
aP
er C
apita
a
2002
39,6
95,0
00
-
1,12
8,32
3
-
-
40
,823
,323
0.11
%43
,521
20
0336
,830
,000
-
63
8,79
7
-
-
37,4
68,7
97
0.
11%
42,8
49
2004
68,3
10,0
00
-
382,
963
-
-
68
,692
,963
0.06
%43
,427
20
0564
,415
,000
-
14
7,80
1
-
-
64,5
62,8
01
0.
07%
44,0
05
2006
61,2
25,0
00
-
429,
286
-
-
61
,654
,286
0.07
%44
,599
20
0758
,960
,000
-
48
7,10
6
-
-
59,4
47,1
06
0.
08%
45,2
01
2008
55,3
80,0
00
-
809,
476
-
-
56
,189
,476
0.09
%51
,455
20
0953
,750
,000
-
1,
087,
289
-
-
54,8
37,2
89
0.
10%
54,8
01
2010
52,0
55,0
00
-
691,
982
-
-
52
,746
,982
0.11
%56
,755
20
1150
,305
,000
-
47
8,95
9
-
-
50,7
83,9
59
0.
11%
54,7
71
Sou
rce:
Dis
trict
CA
FR S
ched
ules
I-1,
I-2
Not
e: D
etai
ls re
gard
ing
the
dist
rict's
out
stan
ding
deb
t can
be
foun
d in
the
note
s to
the
finan
cial
sta
tem
ents
.
aS
ee E
xhib
it N
J J-
13 fo
r per
sona
l inc
ome
and
popu
latio
n da
ta.
Thes
e ra
tios
are
calc
ulat
ed u
sing
per
sona
l inc
ome
and
popu
latio
n fo
r the
prio
r cal
enda
r yea
r.
bIn
clud
es E
arly
Ret
irem
ent I
ncen
tive
Pla
n (E
RIP
) ref
undi
ng
Gov
ernm
enta
l Act
iviti
es
Man
alap
an-E
nglis
htow
n R
egio
nal S
choo
l Dis
tric
tR
atio
s of
Out
stan
ding
Deb
t by
Type
Last
Ten
Fis
cal Y
ears
UN
AUD
ITED
-91-
-127-

Exhibit J-11
Fiscal Year Ended June
30,General
Obligation Bonds Deductions
Net General Bonded Debt Outstanding
Percentage of Actual Taxable
Value a of Property Per Capita b
2002 39,695,000 - 39,695,000 1.67% 43,521 2003 36,830,000 - 36,830,000 1.51% 42,849 2004 68,310,000 - 68,310,000 2.76% 43,427 2005 64,415,000 - 64,415,000 2.53% 44,005 2006 61,225,000 - 61,225,000 2.34% 44,599 2007 58,960,000 - 58,960,000 0.94% 45,201 2008 55,380,000 - 55,380,000 0.84% 51,455 2009 53,750,000 - 53,750,000 0.81% 54,801 2010 52,055,000 - 52,055,000 0.88% 56,755 2011 50,305,000 - 50,305,000 0.85% 54,771
Note:
a See Exhibit NJ J-6 for property tax data. b Population data can be found in Exhibit NJ J-14.
Manalapan-Englishtown Regional School DistrictRatios of Net General Bonded Debt Outstanding
Last Ten Fiscal Years
Details regarding the district's outstanding debt can be found in the notes to the financial statements.
General Bonded Debt Outstanding
-92--128-

Exhibit J-12
Governmental Unit Debt Outstanding
Estimated Percentage Applicable a
Estimated Share of Overlapping Debt
Debt repaid with property taxesManalapan Township 16,930,221$ 100.0000% 16,930,221$ Englishtown Borough 1,115,000 100.0000% 1,115,000
Other debtWestern Monmouth Utility Authority 13,042,550 50.3840% 6,571,358 Freehold Regional High School: - Manalapan Township 38,490,000 20.0468% 7,716,015 Englishtown Borough 38,490,000 0.6333% 243,757 Monmouth County: Manalapan Township 488,135,115 5.0640% 24,719,027 Englishtown Borough 488,135,115 0.1916% 935,052
Subtotal, overlapping debt 58,230,431
Manalapan-Englishtown School District Direct Debt 50,305,000
Total direct and overlapping debt 108,535,431$
Sources: Manalapan Township Finance Officer, Englishtown Borough Finance Officer, Monmouth County Finance Office and Utility Authorities.
Note: Overlapping governments are those that coincide, at least in part, with the geographic boundaries of the District. This schedule estimates the portion of the outstanding debt of those overlapping governments that is borne by the residents and businesses of Marlboro. This process recognizes that, when considering the District's ability to issue and repay long-term debt, the entire debt burden borne by the residents and businesses should be taken into account. However this does not imply that every taxpayer is a resident, and therefore responsible for repaying the debt, of each overlapping payment.
a For debt repaid with property taxes, the percentage of overlapping debt applicable is estimated using taxableassessed property values. Applicable percentages were estimated by determining the portion of another governmental unit's taxable value that is within the district's boundaries and dividing it by each unit's total taxable value.
Manalapan-Englishtown Regional School DistrictRatios of Overlapping Governmental Activities Debt
As of June 30, 2011
-93--129-

Exhi
bit J
-13
Lega
l Deb
t Mar
gin
Cal
cula
tion
for F
isca
l Yea
r 201
1
Equa
lized
val
uatio
n ba
sis
2011
6,28
1,82
0,51
6$
2010
6,54
2,67
7,04
6
2009
6,48
0,94
8,40
2
[A]
19,3
05,4
45,9
64$
Aver
age
equa
lized
val
uatio
n of
taxa
ble
prop
erty
[A/3
]6,
435,
148,
655
$
Deb
t lim
it (3
% o
f ave
rage
equ
aliz
atio
n va
lue)
[B]
193,
054,
460
aN
et b
onde
d sc
hool
deb
t[C
]48
,126
,794
Lega
l deb
t mar
gin
[B-C
]14
4,92
7,66
6$
2002
2003
2004
2005
2006
2007
2008
2009
2010
2011
Deb
t lim
it81
,914
,765
$
92,0
53,7
57$
10
4,77
7,49
7$
119,
289,
724
$
13
5,04
9,01
6$
14
6,52
7,03
3$
171,
620,
206
$
185,
860,
588
$
192,
081,
122
$
193,
054,
460
$
Tota
l net
deb
t app
licab
le to
lim
it38
,189
,636
35,5
43,9
85
65
,892
,814
62,0
99,1
38
61
,225
,000
87
,958
,491
52,9
82,0
46
51,4
22,6
25
49,8
01,0
19
48
,126
,794
Lega
l deb
t mar
gin
43,7
25,1
29$
56
,509
,772
$
38,8
84,6
83$
57
,190
,586
$
73,8
24,0
16$
58,5
68,5
42$
11
8,63
8,16
0$
13
4,43
7,96
3$
14
2,28
0,10
3$
14
4,92
7,66
6$
Tota
l net
deb
t app
licab
le to
the
limit
as a
per
cent
age
of d
ebt l
imit
46.6
2%38
.61%
62.8
9%52
.06%
45.3
4%60
.03%
30.8
7%27
.67%
25.9
3%24
.93%
Lega
l Deb
t Mar
gin
Cal
cula
tion
for F
isca
l Yea
r 201
1
Equa
lized
val
uatio
n ba
sis
2011
242,
547,
058
$
2010
250,
643,
293
2009
246,
645,
548
[A]
739,
835,
899
$
Aver
age
equa
lized
val
uatio
n of
taxa
ble
prop
erty
[A/3
]24
6,61
1,96
6$
Deb
t lim
it (3
% o
f ave
rage
equ
aliz
atio
n va
lue)
[B]
7,39
8,35
9
aN
et b
onde
d sc
hool
deb
t[C
]2,
178,
207
Le
gal d
ebt m
argi
n[B
-C]
5,22
0,15
2$
2002
2003
2004
2005
2006
2007
2008
2009
2010
2011
Deb
t lim
it2,
848,
317
$
3,
330,
193
$
3,
843,
616
$
4,
449,
340
$
5,
049,
243
$
5,
078,
616
$
6,46
2,41
8$
7,03
4,99
2$
7,36
4,51
2$
7,39
8,35
9$
Tota
l net
deb
t app
licab
le to
lim
it1,
505,
364
1,
286,
015
2,
471,
186
2,
315,
862
2,
579,
498
2,
608,
871
2,39
7,95
4
2,32
7,37
5
2,25
3,98
2
2,17
8,20
7
Lega
l deb
t mar
gin
1,34
2,95
3$
2,04
4,17
8$
1,37
2,43
0$
2,13
3,47
8$
2,46
9,74
5$
2,46
9,74
5$
4,
064,
464
$
4,
707,
617
$
5,
110,
530
$
5,
220,
152
$
Tota
l net
deb
t app
licab
le to
the
limit
as a
per
cent
age
of d
ebt l
imit
52.8
5%38
.62%
64.2
9%52
.05%
51.0
9%51
.37%
37.1
1%33
.08%
30.6
1%29
.44%
Sour
ce:
Abst
ract
of R
atab
les
and
Dis
trict
Rec
ords
CAF
R S
ched
ule
J-6
aLi
mit
set b
y N
JSA
18A:
24-1
9 fo
r a K
thro
ugh
8 di
stric
t; ot
her %
lim
its w
ould
be
appl
icab
le fo
r oth
er d
istri
cts
Fisc
al Y
ear f
or E
nglis
htow
n Bo
roug
h
Man
alap
an-E
nglis
htow
n R
egio
nal S
choo
l Dis
tric
tLe
gal D
ebt M
argi
n In
form
atio
n,La
st T
en F
isca
l Yea
rsU
NA
UD
ITED
Fisc
al Y
ear f
or M
anal
apan
Tow
nshi
p
-94-
-130-

Exhibit J-14
Year Population aPersonal Income
(thousands of dollars) b
Per Capita Personal Income c
Unemployment Rate d
2002 36,257 1,548,690,075 42,819 4.1%2003 36,956 1,583,147,687 42,962 4.2%2004 37,175 1,711,653,408 46,066 3.5%2005 37,257 1,782,595,500 47,724 3.5%2006 37,628 1,868,675,299 51,455 3.3%2007 38,591 1,975,131,600 54,286 3.5%2008 39,063 2,071,718,441 57,028 3.2%2009 38,956 2,134,827,756 54,801 4.2%2010 39,390 2,235,579,450 56,755 7.8%2011 38,872 2,129,058,312 54,771 7.8%
Year Population aPersonal Income
(thousands of dollars) b
Per Capita Personal Income c
Unemployment Rate d
2002 1,829 78,214,500 42,819 4.2%2003 1,827 78,377,498 42,962 4.4%2004 1,830 84,334,648 46,066 3.6%2005 1,817 87,019,764 47,724 3.4%2006 1,862 89,954,852 51,455 3.5%2007 1,893 93,813,970 54,286 3.4%2008 1,914 96,970,411 57,028 3.1%2009 1,917 105,053,517 54,801 4.0%2010 1,916 108,742,580 56,755 6.7%2011 1,916 104,941,236 54,771 6.8%
Source: a Population information provided by the NJ Dept of Labor and Workforce Developmentb Personal income not available by municipality.c Per Capita Income not available by municipalityd Unemployment data provided by the NJ Dept of Labor and Workforce Development
ENGLISHTOWN BOROUGH
MANALAPAN TOWNSHIP
Manalapan-Englishtown Regional School DistrictDemographic and Economic Statistics
Last Ten Fiscal YearsUNAUDITED
-95--131-

Exhi
bit J
-15
Empl
oyer
Empl
oyee
sR
ank
(Opt
iona
l)
Perc
enta
ge o
f To
tal
Empl
oym
ent
Empl
oyee
sR
ank
(Opt
iona
l)
Perc
enta
ge o
f To
tal
Empl
oym
ent
Man
alap
an-E
nglis
htow
n R
egio
nal S
cho
815
1
0.00
%W
egm
an's
Sup
er M
arke
t58
8
20.
00%
Targ
et19
6
30.
00%
Man
alap
an T
owns
hip
171
4
0.00
%S
top-
N-S
hop
87
50.
00%
Appl
ebee
's65
6
0.00
%W
este
rn M
onm
outh
Util
ities
55
70.
00%
Bab
ies
R U
s52
8
0.00
%R
ex L
umbe
r50
9
0.00
%P
etsm
art
37
100.
00%
2,11
6
0.
00%
-
0.
00%
Sour
ce: T
owns
hip
Adm
inis
tratio
n O
ffice
Not
e: In
form
atio
n fo
r 200
1 no
t ava
ilabl
e. P
erce
ntag
e of
tota
l em
ploy
men
t not
ava
ilabl
e.
2002
2011
Man
alap
an-E
nglis
htow
n R
egio
nal S
choo
l Dis
tric
tPr
inci
pal E
mpl
oyer
s,C
urre
nt Y
ear a
nd T
en Y
ears
Ago
UN
AUD
ITED
-96-
-132-

Exhi
bit J
-16
2002
2003
2004
2005
2006
2007
2008
2009
2010
2011
Func
tion/
Prog
ram
Inst
ruct
ion
Reg
ular
396
399
408
408
411
339
339
349
256
270
Spe
cial
edu
catio
n12
1
12
5
12
5
12
4
13
5
10
5
11
8
12
8
16
3
16
0
O
ther
spe
cial
edu
catio
n-
-
-
-
-
-
-
-
-
-
V
ocat
iona
l-
-
-
-
-
-
-
-
-
-
O
ther
inst
ruct
ion
-
-
-
-
-
-
-
-
-
-
Non
publ
ic s
choo
l pro
gram
s-
-
-
-
-
-
-
-
-
-
A
dult/
cont
inui
ng e
duca
tion
prog
ram
s-
-
-
-
-
-
-
-
-
-
Supp
ort S
ervi
ces:
Tuiti
on-
-
-
-
-
-
-
-
-
-
S
tude
nt &
inst
ruct
ion
rela
ted
serv
ices
69
72
72
70
78
163
154
154
131
133
Gen
eral
adm
inis
trativ
e se
rvic
es4
4
4
2
1
21
21
4
3
2
S
choo
l adm
inis
trativ
e se
rvic
es25
25
26
28
26
40
40
40
40
35
B
usin
ess
adm
inis
trativ
e se
rvic
es8
8
8
8
11
6
6
6
6
14
P
lant
ope
ratio
ns a
nd m
aint
enan
ce52
53
53
51
51
66
63
63
62
65
P
upil
trans
porta
tion
65
68
62
67
72
79
75
75
85
86
Spe
cial
Sch
ools
-
-
-
-
-
-
-
-
-
-
Food
Ser
vice
-
-
-
-
-
-
-
-
-
-
Tota
l74
0
75
4
75
8
75
8
78
5
81
9
81
6
81
9
74
6
76
5
Sour
ce: D
istri
ct P
erso
nnel
Rec
ords
Man
alap
an-E
nglis
htow
n R
egio
nal S
choo
l Dis
tric
tFu
ll-tim
e Eq
uiva
lent
Dis
tric
t Em
ploy
ees
by F
unct
ion/
Prog
ram
,La
st T
en F
isca
l Yea
rsU
NAU
DIT
ED
-97-
-133-

Exhi
bit J
-17
Fisc
al
Year
En
ded
June
30,
Enro
llmen
tO
pera
ting
Expe
nditu
res a
Cos
t Per
Pu
pil
Perc
enta
ge
Cha
nge
Teac
hing
Sta
ff b
Elem
enta
ryM
iddl
e Sc
hool
Ave
rage
Dai
ly
Enro
llmen
t (A
DE)
c
Ave
rage
Dai
ly
Atte
ndan
ce
(AD
A) c
% C
hang
e in
A
vera
ge D
aily
En
rollm
ent
Stud
ent
Atte
ndan
ce
Perc
enta
ge
2002
5,
568
48,8
94,9
68
8,
781
12.1
2%44
51:
151:
17
5
,710
5,44
6 0.
30%
96.2
4%20
03
5,53
3
52
,618
,286
9,51
0 8.
30%
453
1:15
1:17
5,5
83
5,
337
-2.2
2%95
.85%
2004
5,
486
57,0
23,9
23
10,
394
9.30
%45
41:
151:
17
5
,566
5,31
5 -0
.30%
96.0
1%20
05
5,49
5
58
,339
,003
1
0,61
7 2.
14%
452
1:15
1:17
5,5
00
5,
244
-1.1
9%95
.86%
2006
5,
446
61,6
14,2
60
11,
314
6.56
%46
41:
151:
17
5
,518
5,27
8 0.
33%
95.8
0%20
07
5,55
2
66
,001
,695
1
1,88
8 5.
08%
467
1:15
1:17
5,4
93
5,
253
-0.4
5%96
.30%
2008
5,52
1
64,1
69,3
11
1
1,62
3 -2
.23%
457
1:13
1:14
5,4
99
5,
266
0.11
%95
.80%
2009
5,46
4
72,2
08,1
17
1
3,21
5 13
.70%
819
1:13
1:14
5,4
64
5,
204
-0.6
4%95
.20%
2010
5,36
4
74,6
48,8
16
1
3,91
7 5.
31%
746
1:13
1:14
5,4
00
5,
176
-1.1
7%95
.90%
2011
5,27
5
72,2
21,0
81
1
3,69
1 -1
.62%
765
1:13
1:14
5,2
92
5,
047
-2.0
0%95
.90%
Sour
ces:
D
istri
ct re
cord
s, A
SSA
and
Sche
dule
s J-
4,J-
12, J
-14
Not
e: E
nrol
lmen
t bas
ed o
n an
nual
Oct
ober
dis
trict
cou
nt.
aO
pera
ting
expe
nditu
res
equa
l tot
al e
xpen
ditu
res
less
deb
t ser
vice
and
cap
ital o
utla
y; S
ched
ule
J-4
bTe
achi
ng s
taff
incl
udes
onl
y fu
ll-tim
e eq
uiva
lent
s of
cer
tific
ated
sta
ff.c
Aver
age
daily
enr
ollm
ent a
nd a
vera
ge d
aily
atte
ndan
ce a
re o
btai
ned
from
the
Scho
ol R
egis
ter S
umm
ary
(SR
S).
Pupi
l/Tea
cher
Rat
io
Man
alap
an-E
nglis
htow
n R
egio
nal S
choo
l Dis
tric
tO
pera
ting
Stat
istic
sLa
st T
en F
isca
l Yea
rsU
NA
UD
ITED
-98-
-134-

2002 2003 2004 2005 2006 2007 2008 2009 2010 2011District BuildingEarly Learning CenterJohn I. Dawes Early Learning Center (2008)
Square Feet - - - - - - 42,000 42,000 42,000 42,000 Capacity (students) - - - - - - 550 550 550 550Enrollment - - - - - - 530 530 530 530
ElementaryClark Mills Elementary (1957)
Square Feet 73,551 73,551 73,551 73,551 73,551 73,551 73,551 73,551 73,551 73,551 Capacity (students) 851 851 851 851 851 851 851 851 851 851 Enrollment 735 723 733 775 766 813 605 605 605 605
Taylor Mills Elementary (1965)Square Feet 73,454 73,454 73,454 73,454 73,454 73,454 73,454 73,454 73,454 73,454 Capacity (students) 521 521 521 521 521 521 521 521 521 521 Enrollment 740 691 698 688 676 676 519 519 519 519
Pine Brook Elementary (1966)Square Feet 83,260 83,260 83,260 83,260 83,260 83,260 83,260 83,260 83,260 83,260 Capacity (students) 816 816 816 816 816 816 816 816 816 816 Enrollment 884 887 890 839 844 814 778 778 778 778
Lafayette Mills Elementary (1968)Square Feet 63,230 63,230 63,230 63,230 63,230 63,230 63,230 63,230 63,230 63,230 Capacity (students) 517 517 517 517 517 517 517 517 517 517 Enrollment 590 521 539 521 524 495 508 508 508 508
Milford Brook Elementary (1971)Square Feet 68,900 68,900 68,900 68,900 68,900 68,900 68,900 68,900 68,900 68,900 Capacity (students) 584 584 584 584 584 584 584 584 584 584 Enrollment 827 802 807 760 745 773 604 604 604 604
Wemrock Brook Elementary (2002)Square Feet 98,252 98,252 98,252 98,252 98,252 98,252 98,252 98,252 98,252 98,252 Capacity (students) 642 642 642 642 642 642 642 642 642 642 Enrollment 551 574 579 585 565 609 631 631 631 631
Middle SchoolManalapan Englishtown Middle (1992)
Square Feet 205,977 205,977 205,977 205,977 278,977 278,977 278,977 278,977 278,977 278,977 Capacity (students) 1,346 1,346 1,346 1,346 1,424 1,424 1,424 1,424 1,424 1,424 Enrollment 1,390 1,390 1,345 1,364 1,417 1,372 1,346 1,346 1,346 1,346
OtherAdministration Building (1909)
Square Feet 12,109 12,109 12,109 12,109 12,109 12,109 12,109 12,109 12,109 12,109 Transportation (2002)
Square Feet 4,760 4,760 4,760 4,760 4,760 4,760 4,760 4,760 4,760 4,760 Bus Repair Facility (2003)
Square Feet - 4,500 4,500 4,500 4,500 4,500 4,500 4,500 4,500 4,500 Bus Wash Facility (2002)
Square Feet 4,000 4,000 4,000 4,000 4,000 4,000 4,000 4,000 4,000 4,000 Fuel Facility (2002)
Square Feet - - - - - - - - - -
Number of Schools at June 30, 2010Early Learning Center = 1Elementary = 6 Source: District records, ASSA
Middle School = 1Other = 5
Exhibit J-18
Note: Year of original construction is shown in parentheses. Increases in square footage and capacity are the result of renovations and additions. Enrollment is based on the annual October district count.
Manalapan-Englishtown Regional School DistrictSchool Building Information
Last Ten Fiscal YearsUNAUDITED
-99-
-135-

Exhi
bit J
-19
*S
choo
l Fac
ilitie
s C
lark
Mills
E
lem
enta
ry
Laf
ayet
te M
ills
Ele
men
tary
Man
alap
an-
Eng
lisht
own
Mid
dle
Milf
ord
Bro
ok
Ele
men
tary
P
ine
Bro
ok
Ele
men
tary
T
aylo
r Mills
E
lem
enta
ry
Wem
rock
Bro
ok
Ele
men
tary
Joh
n I.
Daw
es
Ear
ly L
earn
ing
Cen
ter
Oth
er
Faci
litie
sTo
tal
Proj
ect #
(s)
N/A
N/A
N/A
N/A
N/A
N/A
N/A
N/A
2004
155,
178
$
154,
378
$
23
6,35
1$
15
0,77
8$
159,
678
$
152,
278
$
177,
827
$
-$
-$
1,18
6,46
8
2005
127,
818
104,
706
34
0,90
4
11
1,80
6
146,
967
122,
373
162,
611
-
45
,700
1,
162,
885
20
0613
5,17
6
16
3,35
7
225,
016
153,
538
15
8,12
9
13
2,41
3
15
7,61
9
-
18,0
66
1,14
3,31
4
2007
123,
041
156,
191
21
1,82
3
14
4,64
2
150,
042
119,
792
149,
442
-
-
1,
054,
973
20
0815
4,12
3
18
1,76
6
244,
945
169,
653
17
6,58
9
14
1,70
2
15
9,25
9
11
,799
-
1,
239,
836
20
0914
4,11
1
12
3,88
9
546,
608
134,
998
16
3,13
4
14
3,92
1
19
2,50
8
82
,292
49
,706
1,
581,
167
20
1013
7,42
0
11
8,13
7
521,
230
128,
730
15
5,56
0
13
7,23
9
18
3,57
0
78
,471
47
,399
1,
507,
756
20
1194
,956
81,6
32
36
0,16
7
88
,952
107,
491
94,8
31
12
6,84
6
54
,223
32
,752
1,
041,
851
Tota
l Sch
ool F
acilit
ies
1,07
1,82
3$
1,08
4,05
5$
2,
687,
045
$
1,
083,
097
$
1,21
7,59
0$
1,04
4,54
9$
1,30
9,68
3$
226,
785
$
193,
623
$
9,
918,
250
$
*S
choo
l fac
ilitie
s as
def
ined
und
er E
FCFA
. (N
.J.A
.C. 6
A:2
6-1.
2 an
d N
.J.A
.C. 6
A:2
6A-1
.3)
Sou
rce:
Dis
trict
reco
rds
UN
DIS
TRIB
UTE
D E
XPEN
DIT
UR
ES -
REQ
UIR
ED
MAI
NTE
NAN
CE
FOR
SC
HO
OL
FAC
ILIT
IES
11-0
00-2
61-x
xx
Man
alap
an-E
nglis
htow
n R
egio
nal S
choo
l Dis
tric
tSc
hedu
le o
f Req
uire
d M
aint
enan
ceLa
st S
even
Fis
cal Y
ears
UN
AUD
ITED
-100
-
-136-

Exhibit J-20Manalapan-Englishtown Regional School District
Insurance ScheduleFor the Fiscal Year Ended June 30, 2011
Unaudited
Company Type of Coverage Coverage DeductibleCOMMERCIAL PACKAGE POLICYUtica Mutual Insurance Property Blanket Building & Contents 214,204,207$ 1,000$
(Replacement Cost Values)Flood/Earthquake 2,500,000 25,000 Personal Property Limit Included - Business Income/Extra Expense Actual loss sustained - Valuation Replacement Cost - Extra Expense Included - Boiler & Machinery Included - Ordinance or Law Coverage Coverage B - Demolition Cost 1,000,000 - Coverage C - Inc Cost of Insurance 1,000,000 1,000 Musical Instruments 500,000 250
Utica Mutual Insurance Inland Marine: Additional LimitsData/Media Computer Programs - Blanket All Locations 6,094,729 1,000 Extra Expense - Blanket All Locations 240,000 1,000 Musical Instruments 500,000 250 Outside Equipment 25,000 -
Utica Mutual Insurance Crime CoverageEmployee Dishonesty 100,000 NoneForgery or Alteration 100,000 NoneTheft, Disappearance and Destruction 25,000 -
Utica Mutual Insurance Comprehensive General LiabilityPer Occurrence 1,000,000 NoneGeneral Aggregate 3,000,000 NoneProducts/Completed Operations 3,000,000 NonePersonal/Advertising Injury 1,000,000 NoneFire/Legal Damage 1,000,000 NoneMedical Expense 10,000 NoneEmployee Benefit Liability(excludes students) 1,000,000 None Aggregate 3,000,000 NoneSchool District/Educational Legal Occurrence 1,000,000 - Aggregate 3,000,000 - Retention 10,000 - Maximum Additional Defense 100,000/50,000 - Abuse/Molestation Liability - Each Claim 1,000,000 - Aggregate 3,000,000 -
(Continued)Source: District Records
-101-
-137-

Exhibit J-20Manalapan-Englishtown Regional School District
Insurance ScheduleFor the Fiscal Year Ended June 30, 2011
Unaudited
Company Type of Coverage Coverage Deductible
Utica Mutual Insurance Automobile PolicyAutomobile Liability 1,000,000$ -$ Uninsured/Underinsured Motorist 1,000,000 - Medical Payments 10,000 Comprehensive General Liability Included 500 Collision Coverage Included 1,000
Utica Mutual Insurance Umbrella LiabilityEach Occurrence 10,000,000 - General Aggregate 10,000,000 - Self Insured Retention 10,000 -
Fireman's Fund Excess Umbrella - NJ CAP ProgramLimit of Insurance 50,000,000 NoneAggregate 50,000,000 None
Midwest Employers Excess Worker's Compensation Casualty Company Coverage A - Worker's Compensation 25,000,000 -
Coverage B - Employers Liability 1,000,000 - Self Insured Retention 350,000
- Peoples Benefit Life Student Accident - Voluntary Program Insurance Company Benefit Period - 5 years 1,000,000 -
Western Surety Fidelity BondsSchool Business Administrator/Board Secy. 300,000 NoneAsst. School Bus. Admin./Asst. Bd. Secy. 200,000 NoneTreasurer of School Monies 350,000 None
Commerce & Industry Underground Storage Tank
Each Occurrence 1,000,000 5,000 Annual Aggregate 1,000,000 5,000
-102-
-138-

SINGLE AUDIT SECTION
-139-

-140-

-141-

-142-

-143-

-144-

Exhi
bit K
-3
Fede
ral
Rep
aym
ent
(Acc
ount
sD
ue to
Fede
ral G
rant
or/P
ass-
Thro
ugh
CFD
AG
rant
Awar
dB
alan
ce a
tC
arry
over
Cas
hB
udge
tary
of P
rior y
ears
'D
efer
red
Rev
enue
Rec
eiva
ble)
Gra
ntor
at
Gra
ntor
/Pro
gram
Titl
e
N
umbe
r
Per
iod
Am
ount
June
30,
201
0 A
mou
nt
Rec
eive
dEx
pend
iture
sAd
just
men
ts
Bal
ance
s
at J
une
30, 2
011
at J
une
30, 2
011
June
30,
201
1
U.S
. Dep
artm
ent o
f Agr
icul
ture
Pas
sed-
thro
ugh
Sta
te D
epar
tmen
t of
Edu
catio
n:
Ent
erpr
ise
Fund
:Fo
od D
istri
butio
n P
rogr
am10
.550
7/
1/10
-6/3
0/11
81,8
89
-
-
81,8
89
(8
1,88
9)
-
-
-
-
-
N
atio
nal S
choo
l Lun
ch P
rogr
am10
.555
7/
1/10
-6/3
0/11
250,
405
-
-
23
5,41
2
(250
,405
)
-
-
-
(1
4,99
3)
-
N
atio
nal S
choo
l Lun
ch P
rogr
am10
.555
7/
1/09
-6/3
0/10
225,
670
(1
6,69
2)
-
16,6
92
-
-
-
-
-
-
Spe
cial
Milk
Pro
gram
10.5
56
7/1/
10-6
/30/
115,
977
-
-
5,58
2
(5
,977
)
-
-
-
(3
95)
-
Spe
cial
Milk
Pro
gram
10.5
56
7/1/
09-6
/30/
106,
784
(540
)
-
54
0
-
-
-
-
-
-
Tota
l Ent
erpr
ise
Fund
(17,
232)
-
34
0,11
5
(338
,271
)
-
-
-
(1
5,38
8)
-
U
.S. D
epar
tmen
t of E
duca
tion
Pas
sed-
thro
ugh
Sta
te D
epar
tmen
t of
Edu
catio
n:
Spe
cial
Rev
enue
Fun
d:Ti
tle I
84.0
10A
9/1/
10-8
/31/
1119
0,95
4
-
-
127,
302
(1
82,4
24)
-
-
-
(55,
122)
-
Title
I84
.010
A9/
1/09
-8/3
1/10
180,
585
(3
6,40
6)
-
36,4
06
-
-
-
-
-
-
Title
II P
art A
84.3
67A
9/1/
10-8
/31/
1110
4,95
9
-
-
65,6
36
(8
1,36
1)
-
-
-
(15,
725)
-
Title
II P
art A
84.3
67A
9/1/
09-8
/31/
1010
4,32
5
19,4
54
-
36,1
15
(4
6,23
6)
-
-
9,
333
-
-
Title
II P
art D
84.3
18X
9/1/
10-8
/31/
1141
6
-
-
-
-
-
-
-
-
-
Title
II P
art D
84.3
18X
9/1/
08-8
/31/
091,
672
(1,6
52)
-
1,
652
-
-
-
-
-
-
Ti
tle II
I84
.365
A9/
1/10
-8/3
1/11
19,7
44
-
-
10,6
37
(1
1,87
3)
-
-
-
(1,2
36)
-
Ti
tle II
I84
.365
A9/
1/09
-8/3
1/10
25,5
17
(1,3
68)
1,
828
-
-
-
-
460
-
-
Ti
tle II
I84
.365
A9/
1/07
-8/3
1/08
16,9
28
1,82
8
(1
,828
)
-
-
-
-
-
-
-
Ti
tle IV
84.1
86A
9/1/
07-8
/31/
0814
,402
1,27
7
-
-
(1,2
77)
-
-
-
-
-
Ti
tle V
84.2
98A
9/1/
07-9
/1/0
86,
394
963
-
-
-
-
(963
)
-
-
-
Title
V84
.298
A9/
1/06
-8/3
1/07
7,26
7
12
4
-
-
-
-
(1
24)
-
-
-
I.D
.E.A
. Par
t B B
asic
Reg
ular
84.0
27
9/1/
10-8
/31/
111,
260,
613
-
80,4
21
750,
776
(1
,133
,447
)
-
-
-
(382
,671
)
-
I.D.E
.A. P
art B
Bas
ic R
egul
ar84
.027
9/
1/09
-8/3
1/10
1,17
6,34
3
(2
43,7
37)
(80,
421)
38
4,65
8
(139
,491
)
-
-
1,43
0
-
-
I.D
.E.A
. Par
t B P
resc
hool
84.1
73
9/1/
10-8
/31/
1155
,505
-
8
36,7
30
(5
5,20
0)
-
-
-
(18,
470)
-
I.D.E
.A. P
art B
Pre
scho
ol84
.173
9/
1/09
-8/3
1/10
53,8
64
(32,
973)
(8
)
32
,973
-
-
-
-
-
-
A
RR
A I.
D.E
.A. P
art B
Bas
ic R
egul
ar84
.391
9/
1/09
-8/3
1/10
1,17
7,55
7
(1
93,6
16)
-
562,
341
(5
10,2
09)
-
-
-
(141
,484
)
-
AR
RA
I.D
.E.A
. Par
t B P
resc
hool
84.3
92
9/1/
09-8
/31/
1042
,596
(9
,885
)
-
9,36
1
(2
,731
)
-
-
-
(3
,255
)
-
Mol
ly P
itche
r Lib
erty
His
tory
84
.215
X9/
1/06
-8/3
1/09
953,
990
(1
0,51
3)
-
10,5
13
-
-
-
-
-
-
Tota
l Spe
cial
Rev
enue
Fun
d(5
06,5
04)
-
2,06
5,10
0
(2
,164
,249
)
-
(1,0
87)
11,2
23
(6
17,9
63)
-
To
tal E
xpen
ditu
res
of F
eder
al A
war
ds(5
23,7
36)
$
-$
2,40
5,21
5$
(2
,502
,520
)$
-
$
(1,0
87)
$
11,2
23$
(6
33,3
51)
$
-
$
See
acc
ompa
nyin
g no
tes
to s
ched
ules
of e
xpen
ditu
res.
MAN
ALAP
AN-E
NG
LISH
TOW
N R
EGIO
NAL
SC
HO
OL
DIS
TRIC
TSc
hedu
le o
f Exp
endi
ture
s of
Fed
eral
Aw
ards
for t
he F
isca
l Yea
r end
ed J
une
30, 2
011
-107
-
-145-

Exhi
bit K
-4
Adj
ustm
ents
/Fi
nal
Rep
aym
ent
Stat
e G
rant
or/
Gra
nt o
r Sta
teG
rant
A
war
dB
alan
ce a
tC
arry
over
Cas
hB
udge
tary
of P
rior Y
ears
'D
efer
red
Rev
enue
(Acc
ount
s R
ecei
vabl
e)D
ue to
Gra
ntor
Bud
geta
ryTo
tal
Prog
ram
Titl
ePr
ojec
t Num
ber
Perio
dA
mou
ntJu
ne 3
0, 2
010
Am
ount
Rec
eive
dEx
pend
iture
sB
alan
ces
at J
une
30, 2
011
at J
une
30, 2
011
at J
une
30, 2
011
Rec
eiva
ble
Expe
nditu
res
Stat
e D
epar
tmen
t of E
duca
tion
Gen
eral
Fun
d: T
rans
porta
tion
Aid
11-4
95-0
34-5
120-
014
7/1/
10-6
/30/
111,
234,
642
-
$
-
$
1,23
4,64
2$
(1
,234
,642
)$
-$
-
$
-
$
-
$
12
3,46
4$
1,
234,
642
$
Spe
cial
Edu
catio
n Ai
d11
-495
-034
-512
0-08
97/
1/10
-6/3
0/11
2,92
8,26
6
-
2,
928,
266
(2,9
28,2
66)
-
-
-
-
292,
827
2,92
8,26
6
E
qual
izat
ion
Aid
11-4
95-0
34-5
120-
078
7/1/
10-6
/30/
1113
,316
,882
-
-
13,3
16,8
82
(1
3,31
6,88
2)
-
-
-
-
1,30
6,63
5
13,3
16,8
82
S
ecur
ity A
id11
-495
-034
-512
0-08
47/
1/10
-6/3
0/11
403,
346
-
40
3,34
6
(403
,346
)
-
-
-
-
40,3
35
403,
346
E
xtra
ordi
nary
Aid
11
-495
-034
-512
0-04
47/
1/10
-6/3
0/11
303,
476
-
-
-
(303
,476
)
-
-
(303
,476
)
-
-
-
E
xtra
ordi
nary
Aid
10-4
95-0
34-5
120-
044
7/1/
09-6
/30/
1017
9,80
3
(1
79,8
03)
-
17
9,80
3
-
-
-
-
-
-
-
N
on-p
ublic
tran
spor
tatio
n ai
d11
-495
-034
-512
0-01
47/
1/10
-6/3
0/11
30,1
25
-
-
-
(30,
125)
-
-
(30,
125)
-
-
-
Non
-pub
lic tr
ansp
orta
tion
aid
10-4
95-0
34-5
120-
014
7/1/
09-6
/30/
1023
,518
(2
3,51
8)
-
23
,518
-
-
-
-
-
-
-
T
PAF
Gra
ntW
age
Free
ze7/
1/10
-6/3
0/11
2,99
7
1,
498
(2
,997
)
-
-
(1
,499
)
-
-
-
Rei
mbu
rsed
TPA
F So
cial
Secu
rity
Con
tribu
tion
11-4
95-0
34-5
095-
002
7/1/
10-6
/30/
112,
327,
218
-
-
2,21
3,32
5
(2
,327
,218
)
-
-
(1
13,8
93)
-
-
-
Rei
mbu
rsed
TPA
F So
cial
Secu
rity
Con
tribu
tion
10-4
95-0
34-5
095-
002
7/1/
09-6
/30/
102,
444,
272
(1
19,5
77)
-
11
9,57
7
-
-
-
11
9,57
7
-
-
-
O
n-be
half
TPAF
Pos
t-Ret
irem
ent M
edic
al
Con
tribu
tion
(1)
11-4
95-0
34-5
095-
001
7/1/
10-6
/30/
112,
207,
932
-
-
2,20
7,93
2
(2
,207
,932
)
-
-
-
-
-
(2,2
07,9
32)
Tota
l Gen
eral
Fun
d25
,402
,477
(3
22,8
98)
-
22
,628
,789
(22,
754,
884)
-
-
(3
29,4
16)
-
1,76
3,26
1
15,6
75,2
04
Spec
ial R
even
ue F
und:
N.J
. Non
publ
ic A
id:
Tex
tboo
k11
-100
-034
-512
0-06
47/
1/10
-6/3
0/11
7,33
2
-
-
7,33
2
(3,6
65)
-
-
-
3,66
7
-
-
T
extb
ook
10-1
00-0
34-5
120-
064
7/1/
09-6
/30/
1014
,519
9,
187
-
-
-
(9,1
87)
-
-
-
-
-
N
ursi
ng11
-100
-034
-512
0-07
07/
1/10
-6/3
0/11
12,5
27
-
-
12
,527
(12,
527)
-
-
-
-
-
-
Nur
sing
10-1
00-0
34-5
120-
070
7/1/
09-6
/30/
1018
,758
2,
470
-
-
-
(2,1
02)
-
-
36
8
-
-
Exa
m a
nd C
lass
ifica
tion
11-1
00-0
34-5
120-
066
7/1/
10-6
/30/
119,
088
-
-
9,
088
(9
,088
)
-
-
-
-
-
-
S
uppl
emen
tal I
nstru
ctio
n11
-100
-034
-512
0-06
67/
1/10
-6/3
0/11
1,39
0
-
-
1,39
0
(1,3
90)
-
-
-
-
-
-
Cor
rect
ive
Spee
ch11
-100
-034
-512
0-06
67/
1/10
-6/3
0/11
20,3
40
-
-
20
,340
(20,
340)
-
-
-
-
-
-
Tota
l Spe
cial
Rev
enue
Fun
d83
,954
11
,657
-
50,6
77
(4
7,01
0)
(11,
289)
-
-
4,03
5
-
-
Deb
t Ser
vice
Fun
d: D
ebt s
ervi
ce a
id11
-495
-034
-512
0-12
57/
1/10
-6/3
0/11
550,
090
-
-
55
0,09
0
(550
,090
)
-
-
-
-
-
-
550,
090
-
-
55
0,09
0
(550
,090
)
-
-
-
-
-
-
Ente
rpris
e Fu
nd:
Sta
te S
choo
l Lun
ch P
rogr
am11
-100
-010
-336
0-06
77/
1/10
-6/3
0/11
22,2
05
-
-
19
,600
(22,
205)
-
-
(2,6
05)
-
-
-
S
tate
Sch
ool L
unch
Pro
gram
10-1
00-0
10-3
360-
067
7/1/
09-6
/30/
1022
,518
(1
,661
)
-
1,
661
-
-
-
-
-
-
-
44,7
23
(1,6
61)
-
21,2
61
(2
2,20
5)
-
-
(2
,605
)
-
-
-
Tota
l Exp
endi
ture
s of
Sta
te A
war
ds26
,081
,244
$
(3
12,9
02)
$
-$
23
,250
,817
$
(23,
374,
189)
$
(11,
289)
$
-$
(332
,021
)$
4,
035
$
1,76
3,26
1$
15,6
75,2
04$
See
acco
mpa
nyin
g no
tes
to s
ched
ules
of e
xpen
ditu
res.
(1) N
ot s
ubje
ct to
Sin
gle
Audi
t
MA
NA
LAPA
N-E
NG
LISH
TOW
N R
EGIO
NA
L SC
HO
OL
DIS
TRIC
TSc
hedu
le o
f Exp
endi
ture
s of
Sta
te A
war
dsfo
r the
Fis
cal Y
ear e
nded
Jun
e 30
, 201
1
-108
-
-146-

Manalapan-Englishtown Regional School District
Notes to Schedules of Expenditures of Federal and State Awards
Year ended June 30, 2011
1. General The accompanying schedules of expenditures of federal and state awards present the activity of all federal and state award programs of the Manalapan-Englishtown Regional School District (District). The District is defined in Note 1 to the District’s basic financial statements. All federal and state awards received directly from federal and state agencies, as well as federal and state awards passed through other government agencies are included on the schedules of expenditures of federal and state awards. 2. Basis of Accounting The accompanying schedules of expenditures of federal and state awards are presented using the modified accrual basis of accounting with the exception of programs recorded in the Food Service Fund, which are presented using the accrual basis of accounting, and those recorded in the special revenue fund, which are presented using the budgetary basis of accounting. These bases of accounting are described in Note 1 to the District's basic financial statements. The information in these schedules are presented in accordance with the requirements of OMB Circular A-133, Audits of States, Local Governments, and Non-Profit Organizations. Therefore, some amounts presented in this schedule may differ from amounts presented, or used in the preparation of, the basic financial statements. 3. Relationship to Basic Financial Statements Amounts reported in the accompanying schedules agree with or reconcile to amounts reported in the basic financial statements which present the General Fund and Special Revenue Fund on a GAAP basis. Budgetary comparison statements and schedules (RSI) are presented for the General Fund and Special Revenue Fund to demonstrate finance-related legal compliance in which certain revenue is permitted by law or grant agreement to be recognized in the fiscal year, whereas for GAAP reporting, revenue is not recognized until the subsequent year or when expenditures have been made. The General Fund is presented in the accompanying schedules on the modified accrual basis of accounting with the exception of the revenue recognition of the last two state aid payments in the current year, which is mandated pursuant to NJSA 18A:22-44.2. For GAAP purposes, those payments are not recognized until the subsequent year due to the state deferral and recording of
-147-

Manalapan-Englishtown Regional School District
Notes to Schedules of Expenditures of Federal and State Awards
Year ended June 30, 2011
3. Relationship to Basic Financial Statements (continued) the last two state aid payments in the subsequent year. The Special Revenue Fund is presented in the accompanying schedules on the grant accounting budgetary basis, which recognizes encumbrances as expenditures and also recognizes the related revenues, whereas the GAAP basis does not. The Special Revenue Fund also recognizes the last two state aid payments in the current budget year, consistent with N.J.S.A. 18A:22-44.2. For GAAP purposes, those payments are not recognized until the subsequent year due to the state deferral and recording of the last two state aid payments in the subsequent year. The Special Revenue Fund is presented in the accompanying schedules on the grant accounting budgetary basis, which recognizes encumbrances as expenditures and also recognizes the related revenues, whereas the GAAP basis does not. The Special Revenue Fund also recognizes the last two state aid payments in the current budget year, consistent with N.J.S.A. 18A:22-44.2. The net adjustment to reconcile from the budgetary basis to the GAAP basis is $371,131 for the General Fund and $42,288 for the Special Revenue Fund. See the Note to Required Supplementary Information (C-3) for a reconciliation of the budgetary basis to the GAAP basis of accounting for the General Fund and Special Revenue Fund. Financial award revenues are reported in the District’s basic financial statements on a GAAP basis as follows:
Federal State Total
General Fund -$ 23,126,015$ 23,126,015$ Special Revenue Fund 2,206,537 47,010 2,253,547 Debt Service Fund - 550,090 550,090 Food Service Fund 338,271 22,205 360,476 Total awards and financial assistance 2,544,808$ 23,745,320$ 26,290,128$
4. Relationship to Federal and State Financial Reports Amounts reported in the accompanying schedules agree with the amounts reported in the related federal and state financial reports.
-148-

Manalapan-Englishtown Regional School District
Notes to Schedules of Expenditures of Federal and State Awards
Year ended June 30, 2011
5. Other Revenues and expenditures reported under the Food Donation Program represent current year value received and current year distributions respectively. TPAF Social Security and Post Retirement/Medical Benefits Contributions represent the amounts reimbursed by the State for the employer’s share of social security contributions and Post Retirement/Medical Benefits for TPAF members for the year ended June 30, 2011. The TPAF post retirement/medical benefits expenditures are not subject to New Jersey OMB Circular 04-04.
-149-

MANALAPAN-ENGLISHTOWN REGIONAL SCHOOL DISTRICT SCHEDULE OF FINDINGS AND QUESTIONED COSTS
FOR THE FISCAL YEAR ENDED JUNE 30, 2011
Section I --Summary of Auditor's Results
Financial Statement Section Type of auditor's report issued: Unqualified opinion Internal control over financial reporting:
1) Material weakness(es) identified? __________ yes X no 2) Reportable condition(s) identified
that are not considered to be material weaknesses? __________ yes X none reported
Noncompliance material to basic financial statements noted? __________ yes X no
Federal Awards Section Internal Control over major programs:
1) Material weakness(es) identified? __________ yes X no
2) Significant deficiencies identified that are not considered to be material weaknesses? __________ yes X none reported
Type of auditor's report issued on compliance for major programs: Unqualified Opinion Any audit findings disclosed that are required to be reported in accordance with section .510(a) of Circular A-133? __________ yes X no Identification of major programs: CFDA Number(s) Name of Federal Program or Cluster
84.027,84.173,84.391 ARRA - IDEA Part B and Preschool Cluster Dollar threshold used to distinguish between type A and type B programs: $300,000 Auditee qualified as low-risk auditee? X yes _________ no
-150-

MANALAPAN-ENGLISHTOWN REGIONAL SCHOOL DISTRICT SCHEDULE OF FINDINGS AND QUESTIONED COSTS
FOR THE FISCAL YEAR ENDED JUNE 30, 2011
Section I --Summary of Auditor's Results (cont'd.) State Awards Section Dollar threshold used to distinguish between type A and type B programs: $701,226 Auditee qualified as low-risk auditee? X yes __________ no Type of auditor's report issued on compliance for major programs: Unqualified Opinion Internal Control over major programs:
1) Material weakness(es) identified? ______ __ yes X no
2) Reportable condition(s) identified that are not considered to be material weaknesses? __________ yes X none reported Any audit findings disclosed that are required to be reported in accordance with NJOMB Circular Letter 04-04? __________ yes X no Identification of major programs:
GMIS Number(s) Name of State Program 11-495-034-5120-078 Equalization Aid
-151-

MANALAPAN-ENGLISHTOWN REGIONAL SCHOOL DISTRICT SCHEDULE OF FINDINGS AND QUESTIONED COSTS
FOR THE FISCAL YEAR ENDED JUNE 30, 2011
Section II – Financial Statement Findings
No matters were reported for the period ended June 30, 2011.
Section III – Federal Awards and State Financial Assistance Findings and Questioned Costs
No matters were reported for the period ended June 30, 2011.
-152-

MANALAPAN-ENGLISHTOWN REGIONAL SCHOOL DISTRICT
Summary Schedule of Prior-Year Audit Findings
and Questioned Costs as Prepared by Management
For the Fiscal Year Ended June 30, 2011
STATUS OF PRIOR YEAR FINDINGS No matters were reported.
-153-