mandated marketing programs for california commodities
TRANSCRIPT

Mandated Marketing Programs For California Commodities
Hyunok Lee
Julian M. Alston
Hoy F. Carman
William Sutton*
Giannini Foundation Information Series No. 96-1
Division of Agriculture and Natural Resources PRINTED AUGUST 1996


AUTHORIZED ACTIVITIES
Both federal and state marketing programs may c?ntain provisions for one or more of the following SIX types of activities: 1) generic advertising and sales promotion; 2) production, processing and market-ing research; 3) quality regulations with inspection; 4) supply management or volume control; 5) stan-dardization of containers or packs; and 6) prohibi-tion of unfair trade practices. Quality standards and supply management are regulatory in nature while advertising and research are nonregulatory, market support programs. Category ( 6) has been used very infrequently (Nuckton and French).' These activi-ties are authorized by AMAA for federal marketing orders, and by the California Marketing Act for the state marketing orders. Patterned after state market-ing orders, commission and council laws also include provisions authorizing similar activities.
An important distinction between state and fed- eral marketing programs arises with respect to ac- tivities authorized. Various types of quantity (vol- ume) controls are authorized under both federal and state law. However, state programs typically focus on research and promotion activities. Volume con- trols are not common practice under the state law. Quality controls are also more common in federal pro- grams than in state programs. Of the 48 existing state marketing programs, 11 are authorized to exercise quality controls and only seven are active.
A major exception to the above discussion is the California state marketing order for milk. California is the only major dairy producing state that operates outside the federal milk marketing order system. California law and regulations provide for price pool-ing, classified pricing by end use, and a quota sys-tem, that together dete1n1ine individual producer revenues. This program is quite distinct from the ?ther state marketing programs and is not analyzed m the present paper. For a description and analysis of this program the reader is referred to Sumner and Wolf (1995) and Ekboir, Sumner, and Wolf (1995).
6 The most common use has been to comply with regulations about price .posting so that growers will know what price they are to be paid for cu11ent deliveries. Since the mid~I960s, it has only been applied to cling peaches, strawberries for processing, and pistachios, under the California Act. -1 The Federal orders for almonds, hazelnuts and olives per111it brand advertising credits but these credits are not presently be-ing used (Powers, p.20)
6
4.1 Advertising and Promotion Generic advertising and commodity promotion
are designed to increase demand and prices for a rela-tively homogene?~s commodity produced by many farmers. Advertismg and promotion include con-sumer e_ducation and public relations. Media used for these ac~vities include television, radio, newspa-pers, m_ass cm:ulation magazines, and cooking dem-· ~trations. From an expenditure standpoint, adver-tismg and promotion is the most important market-ing activity. (In what follows, advertising and other types of promotion are referred to as promotion.)
. Most commodity groups focus on generic pro-motion. A successful promotion, thus, usually re-quires that the commodity group accounts for a high p~portion of the supply of the commodity; Califor-rua producers are particularly active in promotion, given that California is the major or only U.S. pro-ducer of such specialty crops as almonds, avocados, pistachios, prunes, walnuts, kiwifruit, olives, table grapes and artichokes. Because California produc-ers ~ontrol ~ost of the supply of these crops, they are m a position to capture the benefits from adver-tising to increase demand for them (Carman et al.) ·
In addition to self-financed promotion, supple-mental federal and state funding is sometimes avail-able to these commodity groups. The U.S. Depart-ment of Agriculture grants promotion funds through
Figure 1: 1992 Promotion Expenditure Shares by Crop (Total California Promotion Budget
for State Marketing Programs = $86 million)
Plstac:ihlo. 2 ·-·S""b•...Wbeni 3%

the Market Access Program (MAP) (formerly, Tar-geted Export Access program (prior to 1990) and Mar-ket Promotion Program (prior to 1996)), and CDFA makes funds available through the Export Program. These funds are specifically targeted for promotion of U.S. (for MAP) and California (for state funding) farm products in overseas markets.
4.2 Research Research provisions pe111tit the industry to use
program funds to conduct farm-related and off-farm (post-harvest) research and development projects to improve the production, distribution, and con-sumption of the commodity covered. Farm-related research may include, for example, control or eradi-cation of insects and diseases and the development of new varieties resistant to a certain disease or with better handling properties. Off-fa111t research in-cludes such efforts as developing a package that ex-tends shelf-life, or evaluating P!'tential marketing opportunities. Any production or processing research carried out under a California marketing order, re-quires joint selection and approval by the Vice Presi-dent for Agriculture and Natural Resources of the University of California, and the marketing order board. The research projects are performedby theuniversity unless research facilities are unavailable.
Figure 2: 1992 Research Expenditure Shares by Crop (Total California Research Budget
for State Marketing Programs = $8.7 million)
Cutf,.
le 1berg lMluoe ••
......,,.
_·'Pl, taeA111li1 ' '_:1'"'
4.3 Quality Standards Quality standards include such items as mini
mum size, grade, minimum sugar content, and ma-
turity requirements for the commodity marketed. Regulations on quality standards are intended to maintain or enhance market demand by keeping in-ferior products from the market. Inorder to set grade standards through a federal or state marketing pro-gram, there must be no federal minimum grade standards applied to the domestic market for that product.
Marketing programs can provide mandatory in-spection to enforce minimum standards. On the other hand, inspection relating to California minimum stan-dards in the Food and Agricultural Code is not man-datory (CDFA). All minimum grade standards es-tablished in the California Food and Agricultural Code apply only to commodities that are marketed in fresh fo1111. Therefore, state marketing programs are often used to regulate the quality of the products for processing use.
4.4 Volume Control Supply management authorizes famt commod-
ity groups to legally regulate the supply of agricul-tural products. Quantity provisions regulate the to-tal volume that can be marketed, how the product willbe used (fresh vs. processed), or the flow of prod-ucts into the market. Various volume control meth-ods have been used. Reserve pools are used to limit supply to a particular end-use or to manage supply within and across crop years (Alston et al.). Flow-to-market restrictions regulate the amount of prod-uct shipped to a given market during a given time period.
One role of supply management is to minimize product shortages or gluts in the market by evening out flow of the commodity to the market. However, volume controls have been controversial. The de-bate concerns whether the industry exercises mo-nopoly power to the detriment ofconsumers through legal means of marketing programs. Volume con-trols are generally implemented under federal orders and have not been used by any state marketing or-der since the 1970s (CDFA).
4.5 Standardization of containers or packs These requirements fix the size, capacity, weight,
dimensions or packing of the container that handlers must use in the packaging, sale, shipment, or han-dling of produce. Standardization of containers and packages can lower marketing costs by eliminating deceptive pricing or by lowering handling and transportation costs. However, as with quality con-trols and supply controls, requiring these standards has not been without controversy.
7

Table 2. Value Shares of Commodities Under California Marketing Programs, 1993
Value of Production
California Commodities Under Ratio of Value Category• Total Marketing Programs•• Under Marketing
($1000) ($1000) Programs to CA Total
Field 3,125,108 557,582 0.18 Crops Jnr1uding
Alfalfa Seed 34,100 Wheat 141,390 Dry Beans 76,571 Wild Rice 5,560
Rice 299,961
Fruits 5,701,396 and Nuts
Apples 138,320 Apricots 31,993
Avocados 117,939 Cherries 43,203
Citrus 745,100 Figs 24,592
Kiwifruit 17,413 Cling Peaches 113,033
2,948,804 0.52 Inr1uding
Pears 78,848 Pistachios 162,640
Plums 93,954 Prunes 140,360
Fr. Strawberries 457,808 Proc. Strawberries 92,531
Table Grapes 326,070 Walnuts 364,000
Vegetables . 4,206,762 2,765,730 0.66 Including
Artichokes 45,499 Melons 233,043 Asparagus 88,900 Peppers 149,057
Fresh Carrots 195,172 Potatoes 189,636 Celery 230,545 Fresh Tomatoes 267,300
Iceberg Lettuce 837,540 Proc. Tomatoes 92,531
Animal 5,233,145 4,455,566 0.85 Products Including
Dairy 2,662,824 Beef 1,526,230 Eggs 266,512
Nursery 1,920,876 241,042 0.13 Including
Cut Flowers 241,042
Total 20,187,287 10,968,724 0.54
• Fishery and forestry are excluded . H Commodities listed below are based on 1995 marketing programs. However, value of production data
used here are based on 1993because1993 was the most recent year for which consistent value data were available for various categories.
Source: California Agriculture Statistical Review 1993 and other marketing program materials.
8

RECENT MARKETING PROGRAMS IN CALIFORNIA
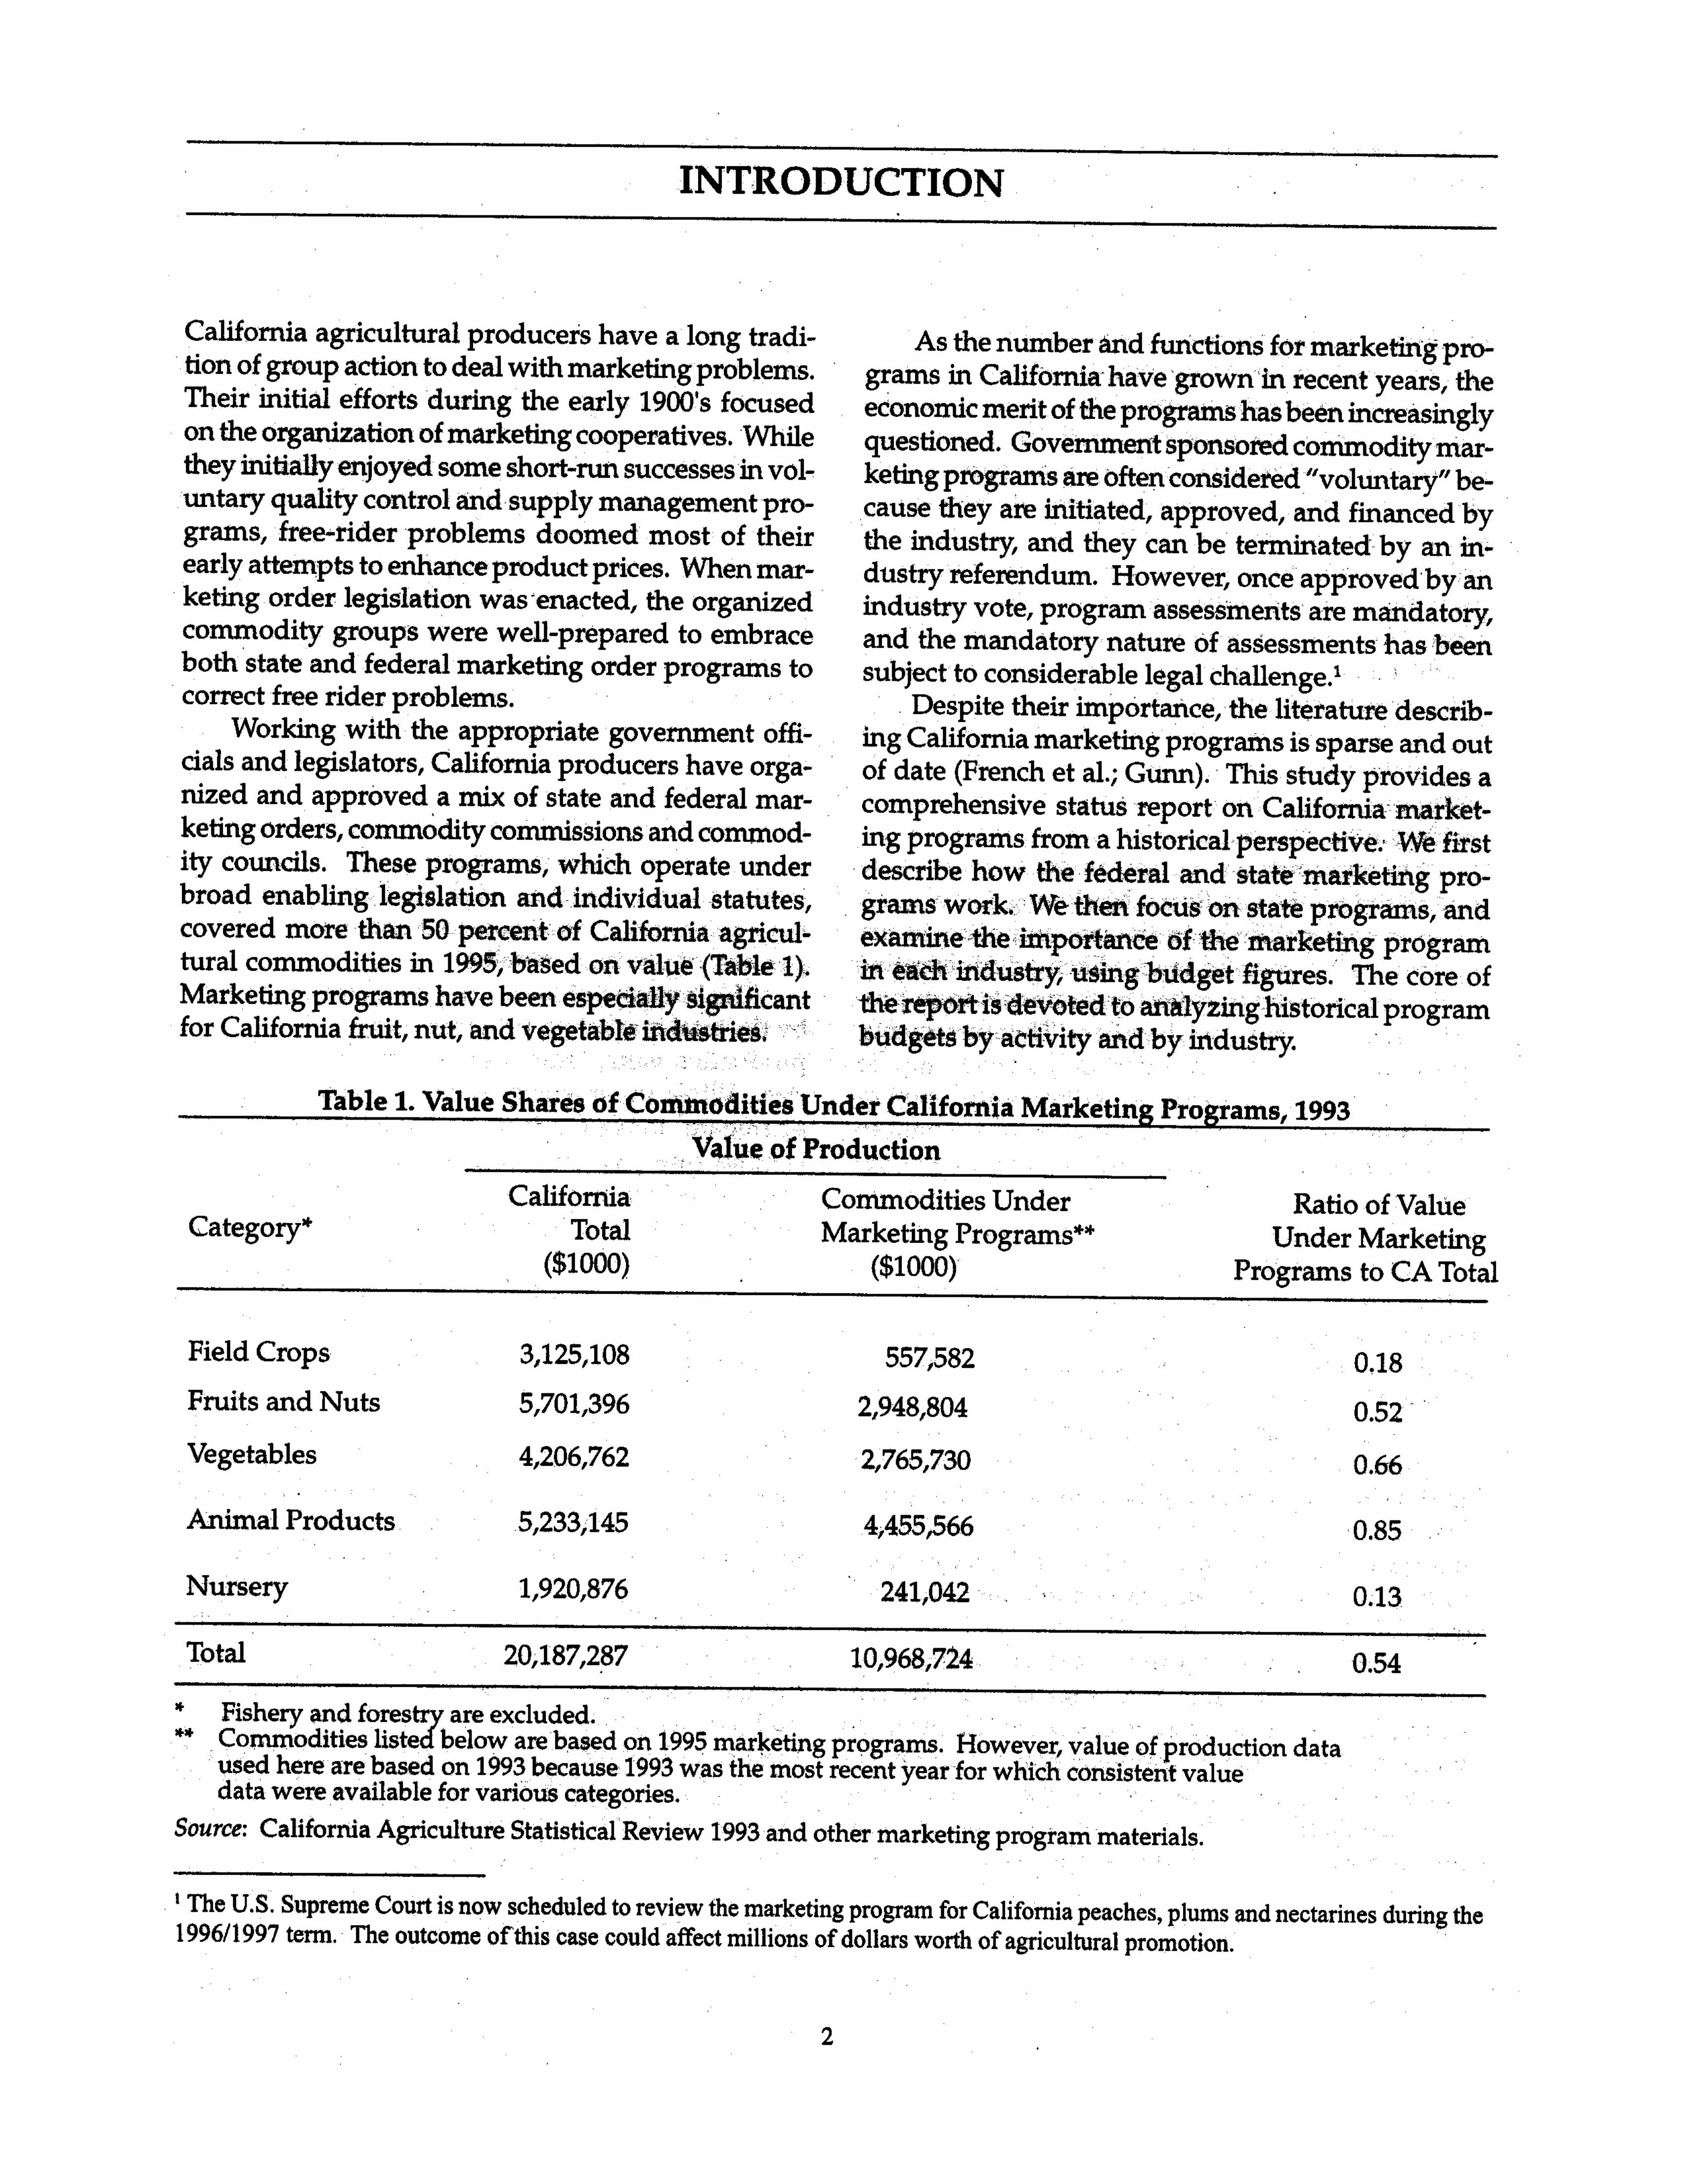
In 1995, the state had 48 active marketing programs including 28 marketing orders and agreements, 16 commissions, and four councils. The importance of these marketing programs in the state's agriculture is.indicatedby the fact that state marketing programs cover more than half of value of the state's agricul- tural products (this figure excludes fishery and for- estry products). Table 2 shows commodity value un- der state marketing programs as a proportion of to- tal commodity value produced in California, for each commodity category.
California marketing programs cover over 80 percent of the state's production of animal prod- ucts. Milk and beef have been among the oldest and largest program commodities in the state's market- ing program history. Next, in terms of value, 66 per- cent of all vegetable production is covered under state marketing programs, followed by the fruit and nut category in which 52 percent of production is cov- ered by state marketing programs. However, while fruit and nut crops in California have had a long his- tory of active marketing programs, such. programs are rather recent for California vegetable industrres.
· In the next section, we examine how state marketing programs have changed over the decades.
5.1 Evolution of California Marketing Programs
California marketing programs have undergone continuing changes since their beginnings in 1937. While a majority of marketing programs have been effective for decades, new programs have been added and many past programs have beeneither terminated or consolidated with others. There are now a greater number of state marketing programs than in the early 1970s; 38 in 1971 increased to 48 in 1995 (Appendix Table 2). As of January 1995, state marketing pro-grams included: 1) 28 marketing orders and agree-ments (including those for alfalfa seed, apricots, arti-chokes, dry beans, cantaloupes, fresh carrots, celery, cherries, citrus, figs, iceberg lettuce, melons, milk, cling peaches, pears, plums, pistachios, potatoes, prunes, rice handlers, rice research, wild rice, pro-cessing strawberries, tomatoes, and processing toma-toes); 2) 16 commissions (including those for apples, asparagus, avocados, eggs, cut flowers, forest prod-ucts, grape rootstock, kiwifruit, peppers, pistachios, fresh strawberries, table grapes, walnuts, wheat, Lake
county wine grapes, and Lodi-Woodbridge wine grapes); and 3) four councils (including those for beef, dairy, salmon, and seafood).
During the 1970s and the early 1980s, the total number of marketing programs declined. This de-cline was mostly due to the termination of multiple programs that covered the same (or similar) com-modities. For example, during the 1970s, there were four marketing orders for various types of peaches: a marketing order for processing cling peaches, a joint marketing order for canning and freezing cling peaches, a processors' marketing order for clingstone peaches, and a marketing order for California fresh peaches. By 1984, only the joint marketing order for processing cling peaches remained. A similar situa-tion existed with pears. Since the 1950s, there were four marketing orders for pears: fresh Bartlett, fresh Bartlett promotion, fresh fall and winter pears, and canning Hardy pears. These programs were either terminated or consolidated, and now only one pear program remains.
The California fruit industries have been actively involved in marketing programs since their initiation. For instance, of the 11 marketing programs that were established prior to 1950and continued to existat least for two decades (since then, some were terminated), seven were for fruits.• Tree crops continue to have a strong representation in marketing programs and in . 1995 there were 20 programs for fruits and nuts.
Although the total number of marketing pro-grams has not always increased, the number of com-modities covered under the marketing programs ex-panded, and became more diverse over time. Veg-etables have emerged as an important category of marketing programs. Only one vegetable crop, let-tuce, was included in the 11 early commodity mar-keting programs (prior to 1950). However, over time, marketing programs for vegetables were steadily added. In 1971, five programs covered four different vegetables (artichokes, asparagus, brussels sprouts, and lettuce). This number increased to seven pro-grams by the early 1980s, covering artichokes, celery, iceberg lettuce, melons, potatoes, and fresh
' These 11 commodities were early apples (established in 1948), dried figs (1944), desert grapefruit (1941), lettuce (1942), fresh Bartlett pears (1937), fresh fall and winter pears (1941), poultry and turkey (1947), raisins (1949), wine (1938), processing pears (1938), and dairy council (1945).
9

tomatoes. In the early 1980s, the marketing order for Brussels sprouts was terminated and the marketing order for lettuce was split into two programs by ac-tivity, research and promotion.' There were 11 pro-grams for vegetables in 1995, covering artichokes, cantaloupes, carrots, iceberg lettuce, melons, pota-toes, fresh tomatoes, processing tomatoes, asparagus, and peppers.
The evolution of marketing programs also ex-tends to the choice of the type of program. Recent marketing programs have tended to be in the fotnL of a commission or a council rather than a market-ing order. In 1980, there were seven commissions, two councils and 26 marketing orders and agree-ments, whereas in 1995, marketing programs in-cluded 16 commissions, four councils, and 28 mar-keting orders and agreements. This is a 129 percent increase in the number of commissions and a 100 percent increase in councils, compared to an eight percent increase in the number of orders and agree-ments. The recent tendency to fomt commissions .and councils may be attributable to the greater autonomy provided under commission and council laws than under the California Marketing Act of 1937.
Figure 3: 1992 Total Marketing Expenditure by Crop (Total California Marketing Budget= $116.8 million)
Rice 2
Proc. Tomat 2%
Fr. Stnwbwri•• 3%
other Crop• 14%
9 Lettuce research and promotion were administered by the Iceberg Lettuce Research Advisory Board and the Iceberg Lettuce Commission, respectively. The Iceberg Lettuce Commission was terminated in 1992. 10 These six orders were for Washington peaches, Georgia peaches, Maine potatoes, Texas valley tomatoes, Florida celery and South Texas lettuce. 11 There were 14 federal orders in California in January 1995, but the order for California Tokay grapes was terminated in May 1995. The order for potatoes affects only two north- ern counties of California, Siskiyou and Modoc counties.
5.2 Activities of Recent California Marketing Programs
Appendix Tuble 3 lists the authorized marketing activities for all California marketing programs and shows whether the authorized activities are currently active or not. As shown in the Table, while market promotion and research are typical activities of mar-keting groups (31 programs are engaged in active re-search and promotion, and 14 are active in either re-search or promotion), quality standards and inspec-tion are not (seven active programs). Quality stan-dards and inspection are more relevant for the com-modities that are processed or dried such as figs, cling peaches, processed strawberries, and processed to-matoes. Furthetntore, some programs authorize only promotion or only research. For example, the pro-grams for alfalfa seed, celery, citrus research, iceberg lettuce, melons, and rice research, deal only with research activities. On the other hand, the rice han-dlers' marketing program manages only market pro-motion · activities.
Beforebeing marketed, the commodities that are subject to qt1ality standards and inspection provisions are required to be inspected and certified by an agri-cultural commissioner to ensure compliance with quality provisions. The quality standards include minimum sugar content, maturity standards, color requirements, size requirements, and other require-ments for appearance. Quality inspections are usu-ally perfo11ned at the time of packing (''in-line'') for both shed and field operations. For products sold in bulk, that are usually designated for processing use, inspections are perfom1ed at the time of unloading and a certificate of compliance is issued upon inspection.
5.3 Federal Marketing Orders Affecting California Commodities
In 1995, there were 42 federal marketing orders and agreements for fruit, vegetable and specialty crops. Of these 42, six federal orders were non-func-tioning because they were either suspended for a period of time or inactive.'' Thirteen of these federal marketing orders directly affect California products: nectarines, peaches, winter pears, kiwifruit, desert grapes, olives, potatoes, almonds, walnuts, dates, raisins, dried prunes, and spearmint oil (Appendix Table 4).11
Regarding activities authorized, quality regula-. lions are most common. All of the 13 programs affecting California crops, except spea111tint oiL have
10

grade and size regulations, and seven have pack or container regulations. Quantity controls are, how-ever, less common-four orders out of ten are autho-rized to regulate quantities, but two are inactive. Market allocation12 and a reserve pool'' are autho-rized for California almonds and raisins (USDA).
Concerning research and promotion activities, federal and state marketing programs are comple-mentary with each other. For walnuts, the state pro-gram conducts promotion and the federal program conducts research. For potatoes, both federal and state programs are authorized to conduct research, with no promotion activity authorized by either. However, only the state program for potatoes is in effect with the federal program ren1aining inactive. The state program for kiwifruit is currently active for both promotion and research while the federal program for kiwifruit is authorized to conduct re-
search but does not. The federal kiwifruit order is used for minimum grade and size standards that complement the state sponsored promotion.
12 A market allocation is a quantity provision in a fruit and vegetable marketing order specifying a maximum quan-tity that can be sold for a given use or market. This provi-sion usually raises producer/handler returns by limiting supplies in a use for whichdemand is relatively unrespon-sive to price, while diverting supplies to a market use with . .
a more price responsive (elastic) demand. '' A reserve pool is a quantity provision in a fruit and veg- etable marketing order that requires that some marketable supplies be withheld from the primary (fresh) market for sale in a secondary food market (such as frozen or pro- cessed), for sale in a nonfood use, or for stocks to be sold in a future marketing year.
11


• •
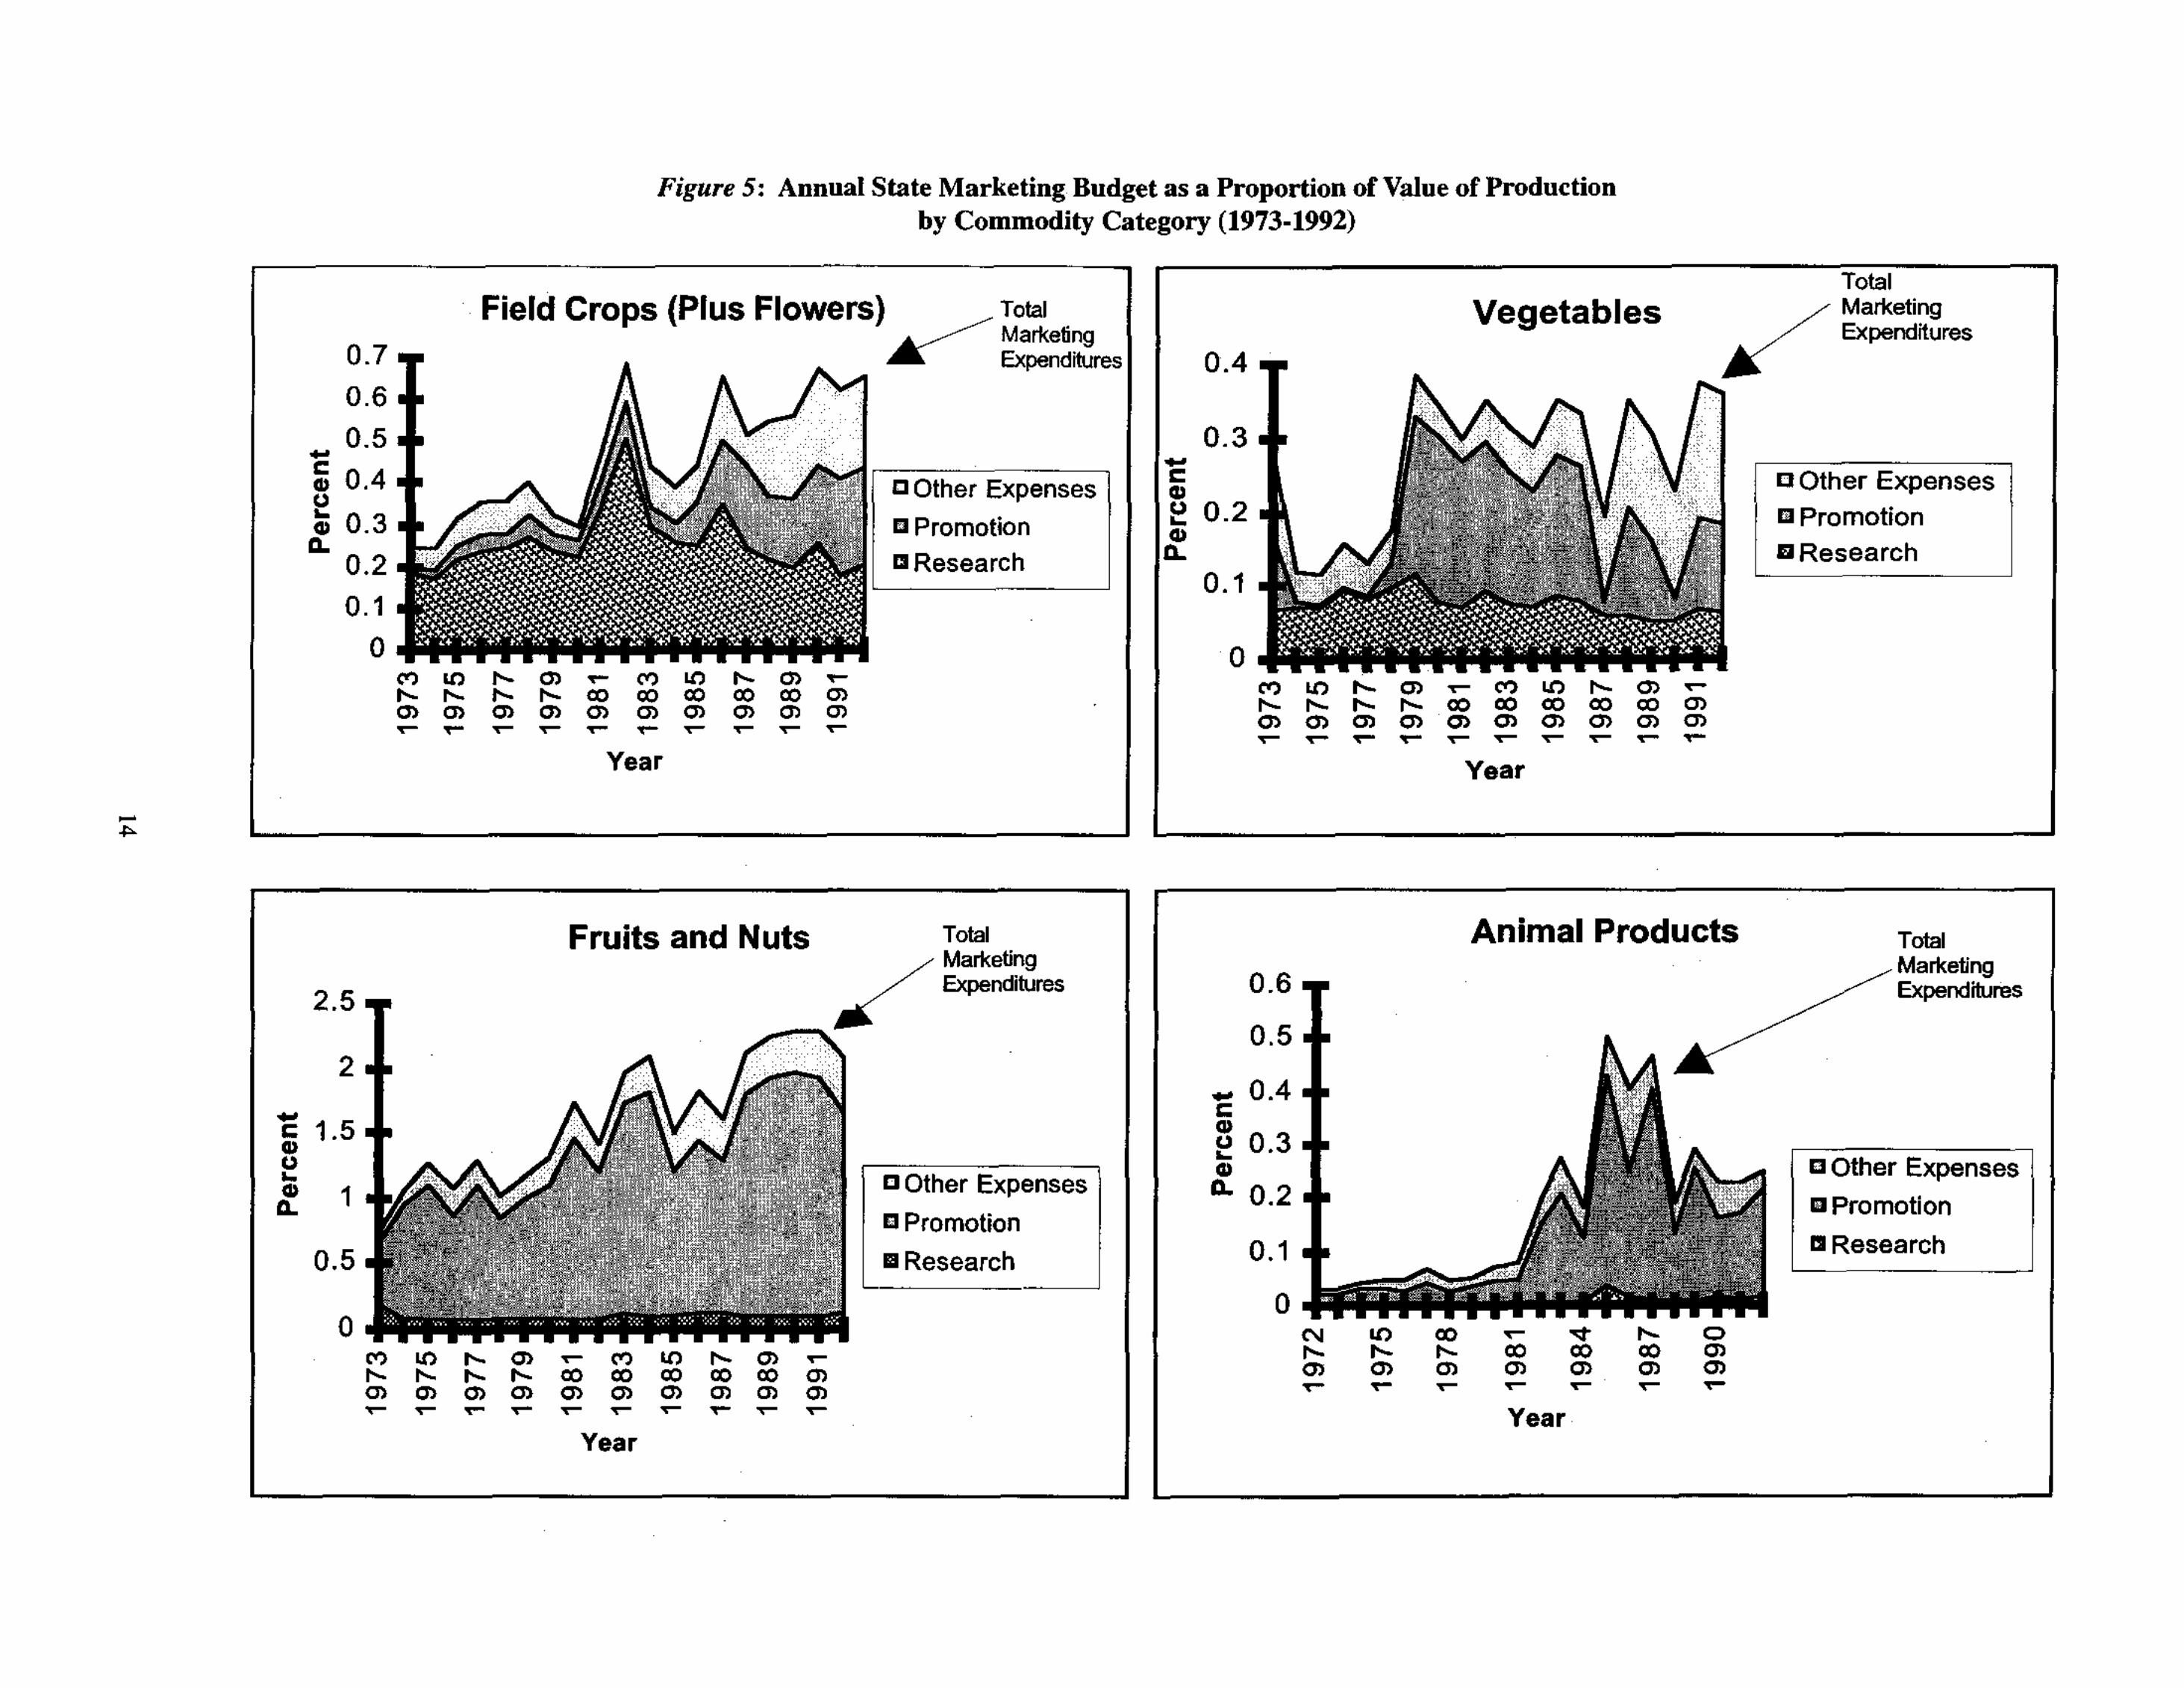
Figure 5: Annual State Marketing Budget as a Proportion of Value of Production by Commodity Category (1973-1992)
Total
-
Total Marketing Expenditures
c Other Expenses
a Promotion
0.4
0.3-11 ~ 0.2
Cl Research I I llL 0.1
Vegetables
0
~ ~ ~ ~ ~ ~ ~ ~ ~ ~ "' "'
,.._ "' ~ "' "' "'
,.._ ,.._ ,.._ ,.._ ,.._ ~
co co co co co "' "' "' "' "' "' "' "' "' "' "' ~ ~ ~ ~ ~ ~ ~ ~ ~ ~
Year Year
- -- - - - -
Marketing Expenditures
c Other Expenses
a Promotion
I El Research
Total Animal Products Fruits and Nuts Total Marketing MarketingExpenditures
0.7 0.6 0.5-c .. 0.4
"; 0.3 IL
0.2 0. 1
0
- / I I 0.6 Expenditures2.5 . . 0.5 -
2 .. 0.4 ..c.. ..c 1.5 I:! 0.3 ..".. j c Other Expenses j.. IL 0.21IL
13 Promotion I I I 0.1I 111 Research
Field Crops (Plus Flowers)
-----------------,.._ ,.._ ,.._ ,.._ ,.._ ,.._ co ~ co co co co ~"' "' "' "' "' "' "' "' "' "' "' "' "' "' "' "' "'
-----------------
-,.
13 Other Expenses
mPromotion
Cl Research

6.3 Program-Average of Promotion and Research Budget Shares
This section examines the patterns of how each program has allocated its marketing budget between research and promotion. To investigate this alloca-tion, we calculated the expenditures on promotion and research as a share of each program's total mar-keting budget. Table 3 shows the average allocation for each commodity, over the period 1976-1994. First, to examine the budget allocation pattern for commod-ity categories, the simple averages of these shares across programs were calculated for each commod-ity category and are presented in Figure 6.
For fruits and nuts and animal products, promo-tion is far more important than research-both spent more than half of their funds on promotion and very little on research.'' Promotion shares for fruits and nuts rose gradually from 0.4 to 0.6 from 1973-1983. From 1983 to 1992, the shares leveled off at around 0.6. Promotion shares for animal products were also
high, fluctuating around 0.6 and 0.7. Regarding re-search budgets, while fruits and nuts programs were engaged in some research, animal product programs conducted very little research, allocating less than 10 percent of their total budget to these activities. Small research budgets for animal products may be, in part, due to their programs' functional differences. The majority of programs for animal products are orga-nized under councils, whose main functions involve consumer education on food safety and nutrition. These education and infonnation expenses are the major part of their promotion expenses.
Contrary to the emphasis on promotion by the programs for fruits and nuts and animal products, those for field crops and vegetables allocated much more funds, on average, to research than to promo-tion, even though this tendency has been declining. In particular, the relative emphasis on research is most pronounced for vegetables.'' While promotion shares ranged around 0.2, research shares ranged between 0.6 and 0.4. For vegetables, research expenditures have always been greater than promotion expenditures.
18 When promotion activities of federal marketing orders are included, promotion budgets become much larger (see Table 5). Most federal orders affecting California are for tree crops and their promotion budgets are, on average, over 50 percent of the total budget (see Carman et al. 1992). 19 This result may seem contradictory to what we observed in Figure 5. In Figure 5, for vegetables, the percentage of research budgets to total production value was much lower than that of promotion budgets to total production value. Figure 5 was generated based on the sum of research budgets normalized by the sum of production value (thus, weighted by the program importance) for each category while the figures here are based on the simple average, giving equal weight to minor and major programs. Ifonly a few large (budget-wise) programs had a tendency to allocate the major part of their budgets to promotion with most small programs conducting mostly research, then the program average will wash out the effect of large promotion budgets. When we investigated the data, this was in fact the case. The Iceberg Lettuce Commis- sion was the largest marketing agency which was engaged in promotion among vegetables. During the 1980s, its annual promotion budgets were almost as large as the sum of the rest of the marketing budgets in vegetables. Further, until the late 1980s, many vegetable marketing programs were engaged exclusively in research activities.
15

Table 3. Average Research and Promotion Budget Shares Out ofTotal Marketing Funds by Commodity (1970-1994)
Promotion Research Category Commodity Share Share
Field Crops Cut Flowers 0.51 0.16 (Pin• Flowers) Dry Beans 0.39 0.16
Wild Rice 0.37 0.26 Wheat 0.24 0.17 Rice 0.12 0.77 Alfalfa Seed 0 0.71
Fruits and Nuts Walnuts Raisins Plums Table Grapes Prunes Avocadoes Wine Grapes Apricots Kiwifruit Fresh Strawberries Grapefruit Pistachios Pears Peaches Figs Proc. Strawberries Citrus Desert Grapes
0.95 0.90 0.88 0.82 0.79 0.78 0.74 0.70 0.69 0.68 0.67 0.60 0.59 0.56 0.44 0.01
0 0
0 0.03 0.00 0.03 0.09 0.05 0.13 0.01 0.04 0.15
0 0.13 0.03 0.04 0.05 0.00 0.91
0
Vegetables Artichokes Iceberg Lettuce Asparagus Carrots Cantaloupe Fresh Tomatoes Celery Melons Peppers Potatoes Proc. Tomatoes
0.69 0.46 0.39 0.34 0.27 0.21
0 0 0 0 0
0.04 0.37 0.05 0.51
0 0.55 0.69 0.68 0.61 0.68 0.13
Animal Products Eggs 0.81 0.05 Beef 0.70 0.02 Dairy 0.58 0.04 Turkey 0.57 0.02 Honey 0.52 0.02
16


Appendix Table 1. Federal Marketing Orders and Agreements (as of January 1995)
Pack& Flow to Market Reserve Producer Research & Year Commodity Grade Size Container Market Allocation Pool Allotments Development Advertising Effective
Florida Citrus Fruit A A 1 2 1939 Texas Oranges & Grapefruit A A A A A 1960 Florida Limes A A A I A A 1955 Florida Avocados A A A 2 A A 1954 CA Nectarines A A A A A 1958 CA Peaches A A A A A 1939 Georgia Peaches I I I 1942 CA Kiwifruit A A A I 1984 Washington Peaches I I I I 1960 Washington Apricots A A A A 1957 Washington Cherries A A A A 1957 WA-OR Fresh Prunes A A A A 1960 CA Desert Grapes A A I 2 A 1980 CA Tokay Grapes A A A I A A 1940 OR-WA-CA Winter Pears I I A A 1939 Hawaii Papayas I I I A A 1971 10 States-Cranberries 3 3 I A 1962 WA-OR Bartlett Pears I I A 1966 CA Olives A A A A 1965
N 0 Idaho-E. Oregon Potatoes A A Pack 1941
WA Potatoes A A Pack 1949 OR-CA Potatoes A A Pack I 1942 Colorado Potatoes A A Pack I 1941 Maine Potatoes I I I 1954 VA-NC Potatoes A A 1948 Georgia Vidalia Onions A A A A 1989 Idaho-Oregon Onions A A Pack 2 A A 1957 South Texas Onions A A A 2 A 1961 Texas Valley Tomatoes I I I I I 1959 Florida Tomatoes A A A A A 1955 Florida Celery I I I I I I I 1965 South Texas Lettuce I I I I I 1%0 South Texas Melons A I A A 1961 CA Almonds A 4 A A I 1950 OR-WA Filberts A A Pack A A A 1949 CA-OR-WA Walnuts A A Pack I I A 1948 Far West Spearmint Oil • A A A 1980 CA Dates A A Cont. I A A 1955 CA Raisins A A A A A A 1949 CA Dried Prunes A A Pack I I I 1949 Peanuts not under M.A. 146 A A 1990 M.A. 146 Peanuts A A 1965 •Spearmint Oil Order covers the states of Washington, Idaho, Montana, Nevada, Utah, Oregon and California I. Export Only 2. Shipping Holiday 3. Applies only to withheld (reserve) cranberries 4. Reserve Only A;:. Active, l=Inactive

Appendix Table 2. California Marketing Programs (1995)
Marketing Program Year the Program Varieties or End-Organizations Became Effective Use Covered
Alfalfa Seed Production Research Board Apricot Advisory Board Artichoke Advisory Board Dry Bean Advisory Board Cantaloupe Advisory Board CA Fresh Carrot Advisory Board CA Celery Research Advisory Board CA Cherry Marketing Program Citrus Research Board Fig Advisory Board Iceberg Lettuce Research Advisory Board Melon Research Manufacturing Milk Advisory Board CA Milk Producers Advisory Board CA Fluid Milk Processor Advisory Board CA Cling Peach Advisory Board Pear Advisory Board Pistachio Marketing Agreement Plum Marketing Board Plum Advisory Board Potato Research Advisory Board CA Prune Board Rice Handlers' Advisory Board Rice Research Advisory Board Processing Strawberry Advisory Board CA Tomato Board Processing Tomato Advisory Board CA Wild Rice Board
CA Apple Commission CA Asparagus Commission CA Avocado Commission CA Egg Commission CA Cut Flower Commission CA Forest Products Commission CA Grape Rootstock Improv. Commission CA Kiwifruit Commission CA Pepper Commission CA Pistachio Commission CA Strawberry Commission CA Table Grape Commission CA Walnut Commission CA Wheat Commission Lake County Winegrape Commission Lodi-Woodbridge Wmegrape Commission
CA Beef Council Dairy Council of California CA Salmon Council CA Seafood Council
1973 1971 1960 1970 1988 1992 1976 1993 1968 1944 1973 1972 1970 1969 1969 1984 1992 1994 1994 1994 1974 1947 1984 1969 1960 1972 1986 1968
1994 1990 1978 1984 1990 1991 1993 1980 1988 1981 1955 1968 1986 1983 1992 1991
1957 1945 1991 1991
All Citrus Except Limes Dried Figs
All Melons Except Watermelons
Bartlett
Dried Prunes
Fresh Tomatoes
Fresh Strawberries
21

Appendix Table 3. Authorized Activities of California Marketing Programs (1995)
Activities Marketing Programs Promotion Research Quality Standards Unique
and Inspection Authorities
Programs Established Under the Marketing Act of 1937
Alfalfa Seed Production Apricot A Artichoke Promotion A Bean (Dry) A Cantaloupe A Carrot (Fresh) A Celery Cherry A Citrus Research Figs (Dried) A Iceberg Lettuce Research Melon Research Manufacuting Milk (MMAB) A Market Milk (CMAB) A Milk (Fluid) A Peach (Cling) A Pear A Pistachio Agreement Plum Agreement (Inactive) Plum Order A Potato Research Prunes (Dried) A Rice Handlers A Rice Research Strawberry (Processing) I Tomato (Fresh) A Tomato (Processing) Wild Rice A
Commissions
Apple A Asparagus A Avocado A Egg A
. A A I
A I A A A A A A A A A
A A
A A A
A A A
A
A A A A
I
A 1•
A I"" Ad
A A
A•
A
A•• A
A I I'
I
I
Continues on page 23
22

Appendix Table 3 (Cont'd). Authorized Activities of California Marketing Programs (1995)
Activities Marketing Programs Promotion Research Quality Standards Unique
and Inspection Authorities
Cut Flower Forest Products Grape Rootstock Kiwifruit Pepper Pistachio Strawberry (Fresh) Table Grape Walnut Wheat I .ake County Winegrape Lodi-Woodbridge Winegrape
Councils Beef Council Dairy Council Salmon Council
Seafood Council
A A
A
A
A
A
A
A
A
A
A
A Ah
A
A
A A A
A
A
A
A
A
A
A
A
A
A
A
A
I'
A•
a Weather data dissemination I ;:: inactive A= active b Unfair trade practices ' Stabilization pool ' Subtandard fig pool e Price posting ' Purchase of fishing rights ' Voluntary h Nutrition education
23


1992
Appendix Table 6. Research Marketing Budget for Selected Years by Commodity
1985 1990 Research Research Research
Commodity Budget Commodity Budget Commodity Budget ($1000) ($1000) ($1000)
Rice 1,438.4 Rice 1,423.6 Rice 1,382.9 Dairy 1,026.7 Dairy 1,362.0 Citrus 1,073.2 Citrus 683.4 Citrus 928.8 Fresh Strawberries 896.7 WmeGrapes 500.0 Fresh Strawberries 745.4 Dairy 681.0 Fresh Strawberries 461.8 WmeGrapes 600.0 Eggs 494.4 Beef 379.4 Avocados 475.0 Avocados 475.0 Raisins 360.0 Eggs 351.0 Iceberg Lettuce 474.7
~
Iceberg Lettuce 336.4 Raisins 350.0 Fresh Tomatoes 365.9 Fr. Tomatoes 261.7 Fr. Tomatoes 342.5 Prunes 328.9 Eggs 255.2 Pistachios 270.0 Pistachios 325.0 Peaches 200.9 Table Grapes 246.7 Carrots 311.1 Avocados 189.5 Prunes 235.1 Raisins 250.0 Pistachios 178.3 Peaches 213.0 Cut Flowers 240.0 Celery 165.1 Carrots 200.0 Peaches 206.5 Melons 120.8 Melons 170.9 Celery 182.0 Wheat 109.1 Wheat 118.5 Melons 123.1 Prunes 95.7 Dry Beans 93.0 Pears 112.7 Alfalfa Seed 76.2 Potatoes 80.0 Peppers 106.8 Pears 57.8 Figs 70.0 Dry Beans 103.8 Kiwifruit 45.2 Kiwifruit 66.7 Wheat 93.6 Dry Beans 37.6 Alfalfa Seed 52.7 Potatoes 80.0 Figs 25.0 Pears 50.0 Alfalfa Seed 44.3 Proc. Strawberries 3.0 Peppers 32.8 Kiwifruit 38.8 Apricots 1.1 Wild Rice 13.6 Lodi 25.0 (1) (2) Asparagus 16.4
Wild Rice 13.0 Apricots 8.0 Figs 7.0 (3)
Total 7,008.2 Total 8,491.4 Total 8,459.9
1. In 1985 there were no research expenditures for artichokes, honey and turkey. 2. In 1990 there were no research expenditures for artichokesi cantaloupes, processing strawberries, processing tomatoes, apricots, walnuts, beef and turkey. 3. In 1992 there were no research expenditures for artichokes, cantaloupes, processing strawberries, processing tomatoes, plums, walnuts and beef.
26
1992
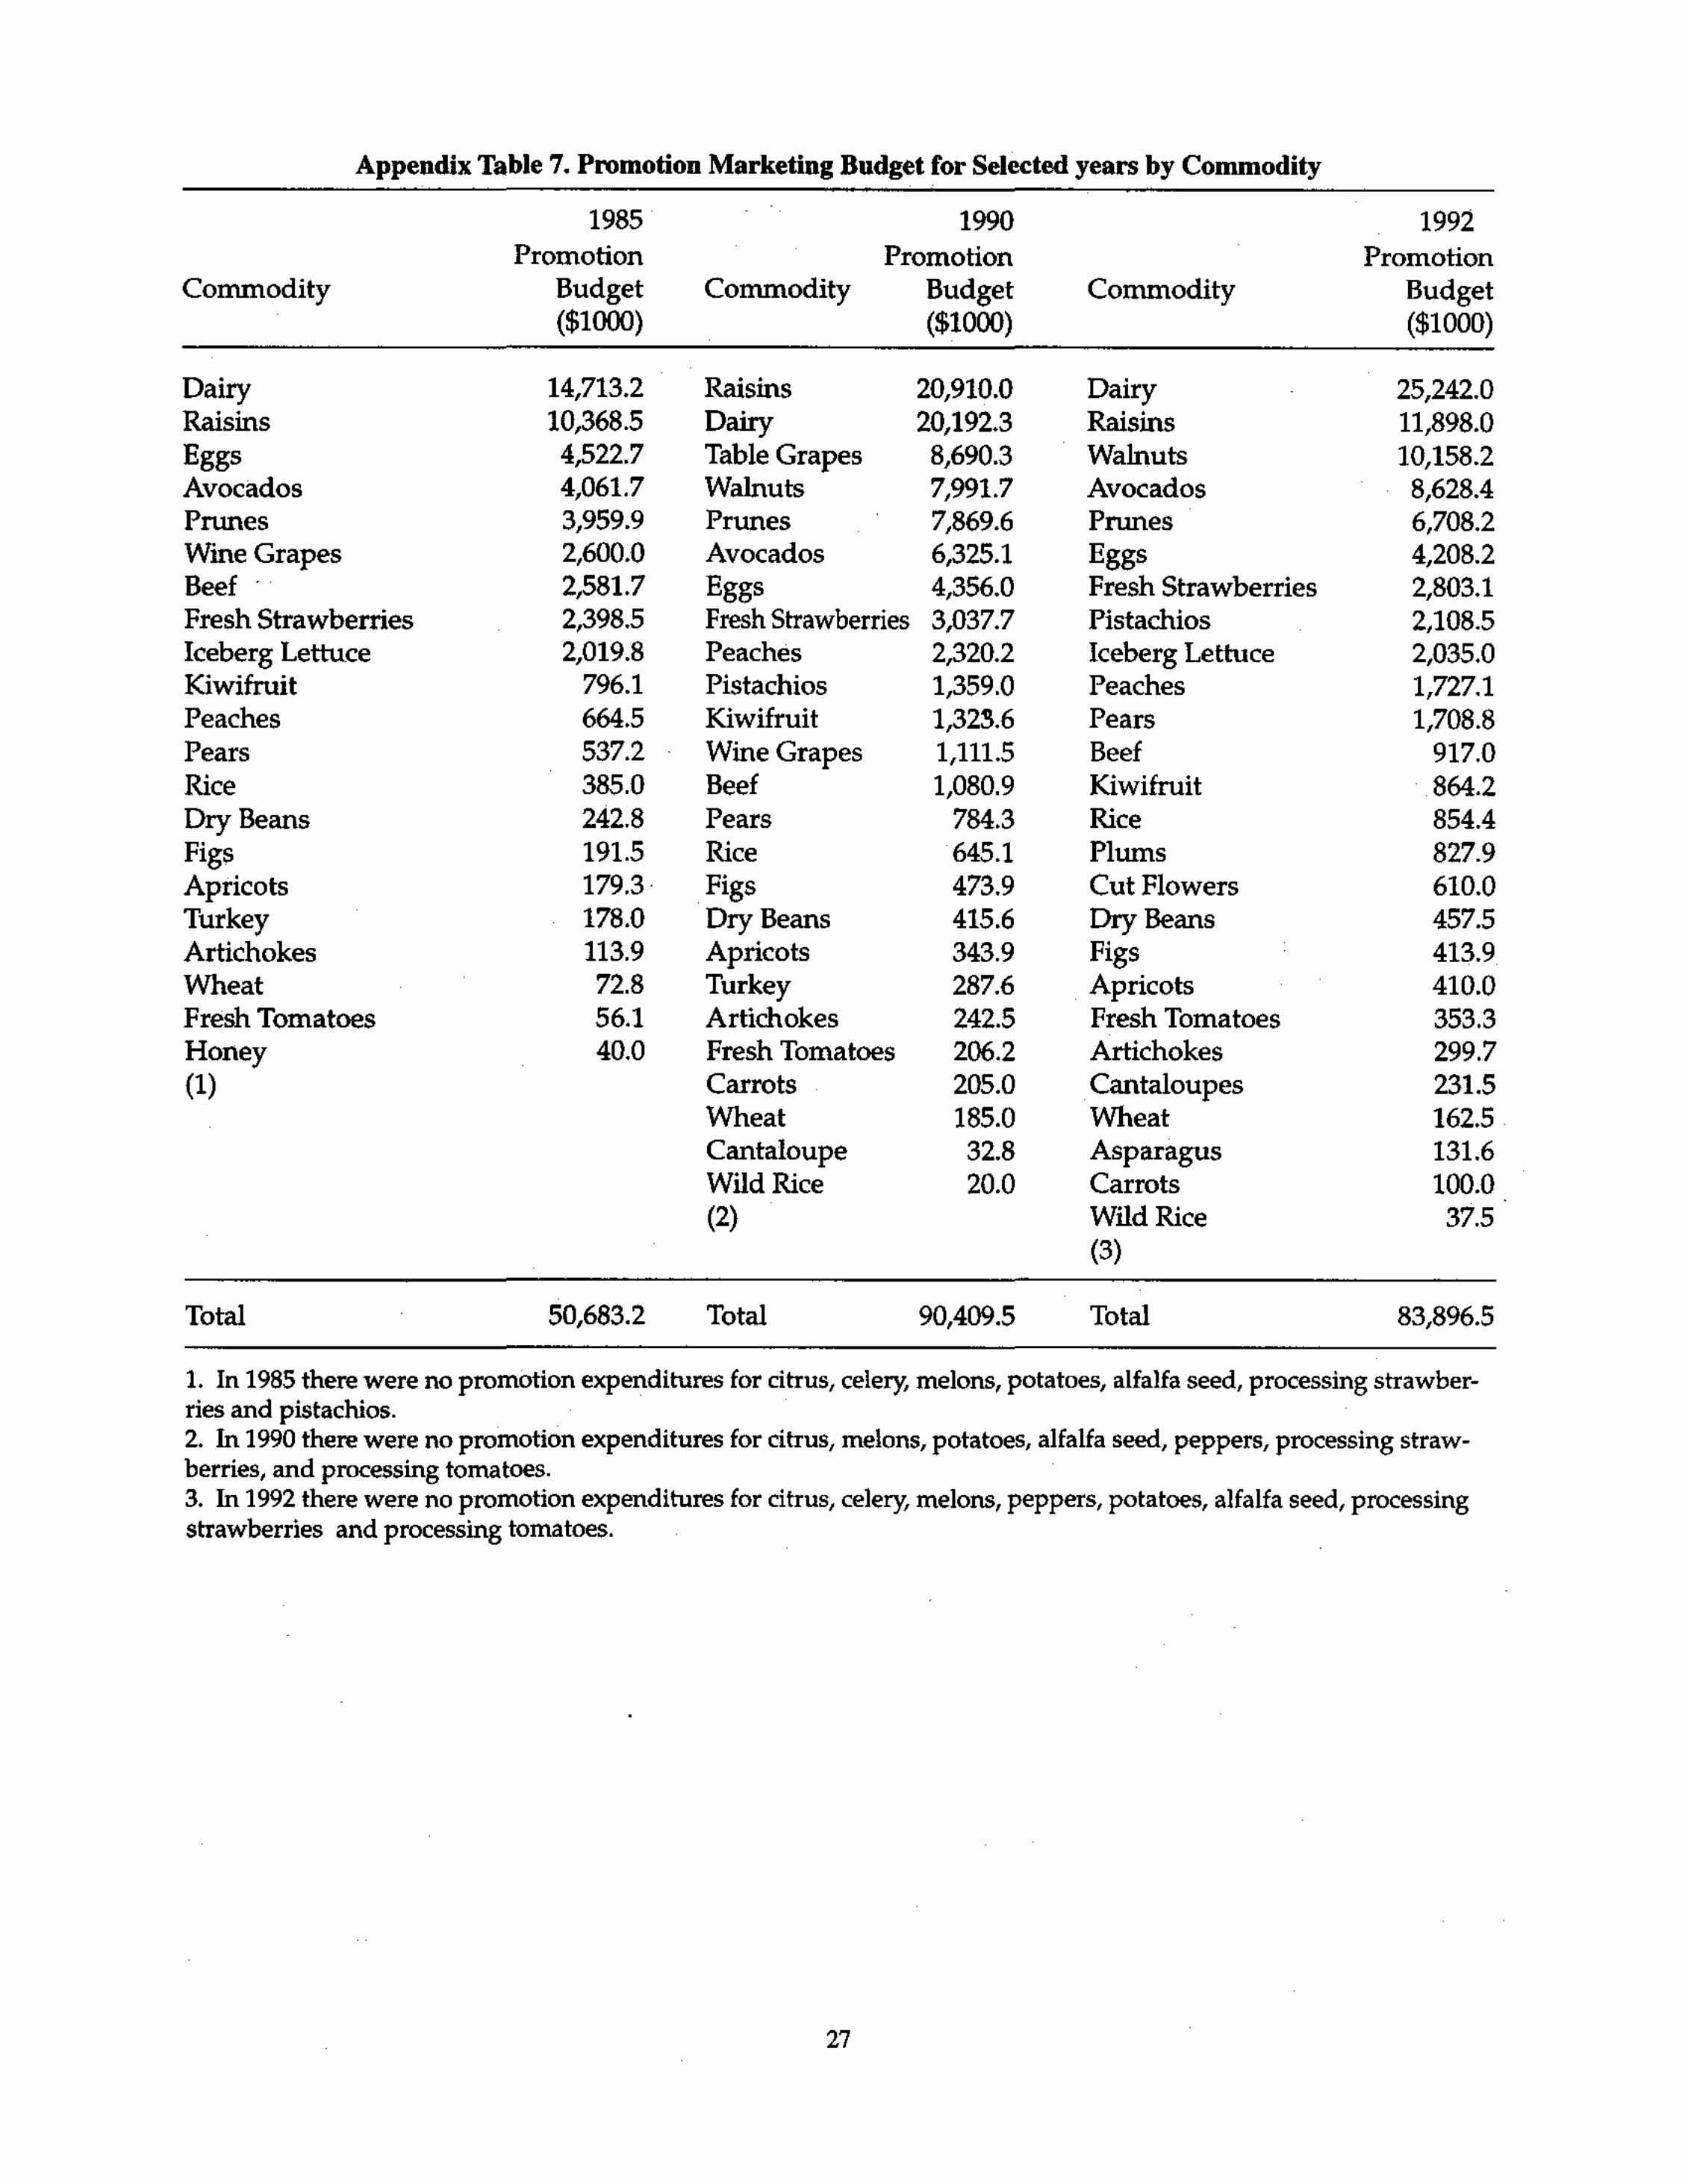
Appendix Table 7. Promotion Marketing Bndget for Selected years by Commodity
1985 1990 Promotion Promotion Promotion
Commodity Budget Commodity Budget Commodity Budget ($1000) ($1000) ($1000)
Dairy 14,713.2 Raisins 20,910.0 Dairy 25,242.0 Raisins 10,368.5 Dairy 20,192.3 Raisins 11,898.0 Eggs 4,522.7 Table Grapes 8,690.3 Walnuts 10,158.2 Avocados 4,061.7 Walnuts 7,991.7 Avocados 8,628.4 Prunes 3,959.9 Prunes 7,869.6 Prunes 6,708.2 Wine Grapes 2,600.0 Avocados 6,325.1 Eggs 4,208.2 Beef · 2,581.7 Eggs 4,356.0 Fresh Strawberries 2,803.1 Fresh Strawberries 2,398.5 Fresh Strawberries 3,037.7 Pistachios 2,108.5 Iceberg Lettuce 2,019.8 Peaches 2,320.2 Iceberg Lettuce 2,035.0 Kiwifruit 796.1 Pistachios 1,359.0 Peaches 1,727.1 Peaches 664.5 Kiwifruit 1,323.6 Pears 1,708.8 Pears 537.2 Wine Grapes 1,111.5 Beef 917.0 Rice 385.0 Beef 1,080.9 Kiwifruit 864.2 Dry Beans 242.8 Pears 784.3 Rice 854.4 Figs 191.5 Rice 645.1 Plums 827.9 Apricots 179.3. Figs 473.9 Cut Flowers 610.0 Turkey 178.0 Dry Beans 415.6 Dry Beans 457.5 Artichokes 113.9 Apricots 343.9 Figs 413.9 Wheat 72.8 Turkey 287.6 Apricots 410.0 Fresh Tomatoes 56.1 Artichokes 242.5 Fresh Tomatoes 353.3 Honey 40.0 Fresh Tomatoes 206.2 Artichokes 299.7 (1) Carrots 205.0 Cantaloupes 231.5
Wheat 185.0 Wheat 162.5 Cantaloupe 32.8 Asparagus 131.6 Wild Rice 20.0 Carrots 100.0 (2) Wild Rice 37.5
(3)
Total 50,683.2 Total 90,409.5 Total 83,896.5
1. In 1985 there were no promotion expenditures for citrus, celery, melons, potatoes, alfalfa seed, processing strawberries and pistachios. 2. In 1990 there were no promotion expenditures for citrus, melons, potatoes, alfalfa seed, peppers, processing strawberries, and processing tomatoes. 3. In 1992 there were no promotion expenditures for citrus, celery, melons, peppers, potatoes, alfalfa seed, processing strawberries and processing tomatoes.
•
27

REFERENCES
Alston, J.M., H.F. Carrnan, J. Christian, J.H. Dorfman, J.-R. Murua and R.J. Sexton. Optimal Reserve and Export Policies for the California Almond Industry: Theory, Econometrics and Simulations. California Agricultural Experiment Station, Giannini Foundation Monograph No. 42, February 1995.
California Department of Food and Agriculture, Marketing Branch. Purpose and Nature of Marketing Order, Commission, and Council Programs. 1985.
Can11an, H.F., R Green, and G. Mandour. "Commodity Advertising Pays ... or Does It?" California Agriculture, Vol. 46. No.2, 1992, pp. 8-12.
Ekboir, J., D. A. Sumner, and C. A. Wolf. ''A Study of California's Milk Quota System." Working paper, De-partr11ent of Agricultural and Resoun;e Economics, University of California, Davis, October 1995.
Farrell, K. and W. Wood. ''Federal Marketing Orders and Agreements for California Fruits, Vegetables, and Tree nuts." Working paper, University of California, Agricultural Extension Service, Berkeley, 1963.
French, B., N. Tamimi, and C. Nuckton. Marketing Order Program Alternatives: Use and Importance in California, 1949-1975. California Agricultural Experiment Station, Giannini Foundation Inforn•ation Series No. 78-2, May 1978.
Gunn, T. California Agricultural Market Development. Center for Agricultural Business California State Univer-sity, Fresno. November 1989.
Neff, S. and G. Plato. Federal Marketing Orders and Federal Research and Promotion Programs. Washington, DC: USDA, Economic Research Service, Agricultural Economic Report No. 707, May 1995.
Nuckton, C. F and B. French. "Marketing Orders in U.S. and California Agriculture." Working paper, Univer-sity of California, Davis, Department of Agricultural Economics, 1984.
Powers, N. J. Federal Marketing Orders for Fruits, Vegetables, Nuts and Specialty Crops. Washington, DC: USDA, Economic Research Service, Agricultural Economic Report, No. 629, March 1990.
Sumner, D.A. and C. A. Wolf. ''Quotas without Supply Control: Effects of Dairy Quota Policy in California." working paper, Department of Agricultural and Resource Economics, University of California, Davis, September 1995.
U.S. Department of Agriculture, Guidelines for Fruit, Vegetable, and Specialty Crop Marketing Orders. Washing-ton, DC, January 25, 1982
28