mandatory summer school and student achievement...
TRANSCRIPT

ARTICLE IN PRESS
0304-4076/$ - se
doi:10.1016/j.je
E-mail addr1A recent exc
Journal of Econometrics 142 (2008) 829–850
www.elsevier.com/locate/jeconom
Mandatory summer school and student achievement
Jordan D. Matsudaira
Policy Analysis and Management, Cornell University, 251 MVR Hall, Ithaca, NY 14853, USA
Available online 2 June 2007
Abstract
Using administrative data from a large school district, I exploit the fact that students are mandated to attend summer
school based on a discontinuous function of their score on year-end exams to identify the effect of summer school
attendance on achievement. I find an average effect of about .12 standard deviations for both math and reading
achievement, an effect size on the low end of the range of prior estimates. These averages mask considerable heterogeneity,
however, with effect size estimates ranging from just below zero to one-quarter of a standard deviation. The estimates on
the upper end of the range presented here suggest that summer school may be a more cost-effective way of raising student
achievement scores than class-size reductions.
r 2007 Elsevier B.V. All rights reserved.
JEL classification: C21; I21; I28
Keywords: Summer school; Remedial education; Regression discontinuity research design
1. Introduction
As part of a movement to introduce ‘‘accountability’’ into public education, mandatory remedial summerschool programs have been adopted by school districts in nearly all large urban areas in the US. ChicagoPublic Schools was first to adopt mandatory summer school in 1996. Subsequently, Baltimore, Boston,Denver, New York, Los Angeles, Philadelphia, Washington, DC and other school districts followed Chicagoin requiring students who fail year-end achievement tests to take summer remedial classes. According to oneestimate, by the year 2000, 27% of the nation’s school districts required failing students to attend summerschool as a condition for promotion (Cooper, 2001).
Despite the growing adoption of such programs, virtually no credible evidence exists supporting summerschool’s effectiveness in raising student achievement. In their meta-analysis of 93 studies, Cooper et al. (2000)find that on average, summer school raises subsequent student achievement scores by between one-seventhand one-quarter of a standard deviation. Cooper et al. also observed, however, that the underlying basis forthis assessment was quite weak: most studies rely on simple prepost comparisons with little attempt to controlfor preprogram differences among students.1 As Cooper et al. note, ‘‘the ambiguity associated with a lack ofrandom assignment is the single greatest threat to the conclusions we have drawn.’’
e front matter r 2007 Elsevier B.V. All rights reserved.
conom.2007.05.015
ess: [email protected]
eption is Jacob and Lefgren (2004), who analyze the Chicago program in a framework similar to that utilized here.
ARTICLE IN PRESSJ.D. Matsudaira / Journal of Econometrics 142 (2008) 829–850830
In this paper I argue that the accountability policy implemented by a Large Urban School District in theNortheast (hereafter, LUSDiNE2) generates ‘‘as-good-as random assignment’’ of attendance that can be usedto produce credible estimates of the effect of summer school on achievement. Similar to other mandatorysummer school programs, the LUSDiNE program requires students in Grade 3 and above to score higher thana preset cutoff score on year-end examinations in both math and reading as one criterion for promotion to thenext grade. Students who score below the cutoff score are mandated to attend a four to six week summerschool program. As I will show, this facet of the accountability policy creates a sharp discontinuity in theprobability of attending summer school as a function of both test scores—students barely failing either examare much more likely to attend summer school than those barely passing. I also demonstrate that the observedcharacteristics of students in the neighborhood of the critical pass–fail cutoff scores are nearly identical. Thissupports the claim that the subsequent differences in mean outcomes of students just below and just above thecritical scores are attributable to the causal impact of summer school. That is, the heart of the identificationstrategy I employ in this paper is to compare the achievement outcome scores of students just failing thebaseline test to those just passing. Under the assumption that all student characteristics affecting achievementvary smoothly with baseline test scores, the difference in outcome scores at the pass–fail cutoff can be used toidentify the causal impact of summer school on achievement.
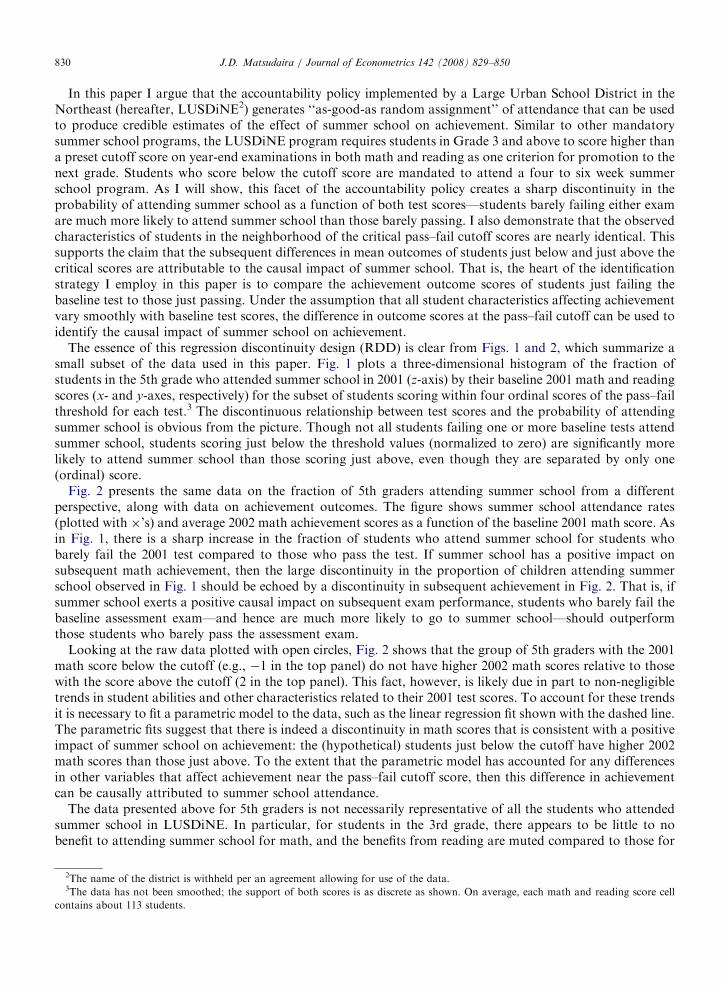
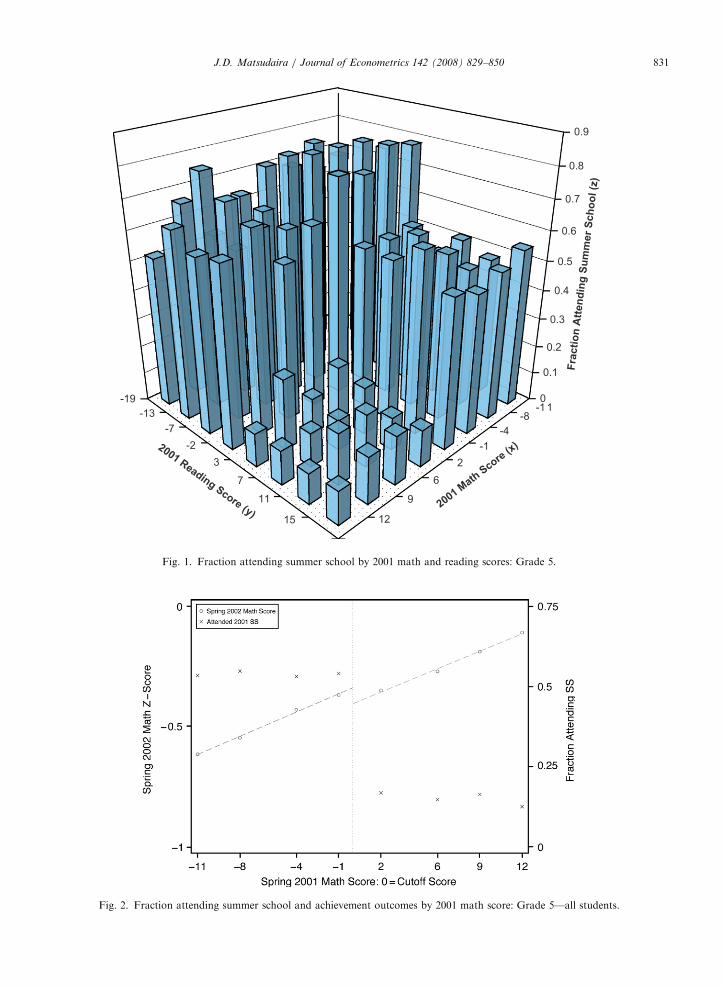
The essence of this regression discontinuity design (RDD) is clear from Figs. 1 and 2, which summarize asmall subset of the data used in this paper. Fig. 1 plots a three-dimensional histogram of the fraction ofstudents in the 5th grade who attended summer school in 2001 (z-axis) by their baseline 2001 math and readingscores (x- and y-axes, respectively) for the subset of students scoring within four ordinal scores of the pass–failthreshold for each test.3 The discontinuous relationship between test scores and the probability of attendingsummer school is obvious from the picture. Though not all students failing one or more baseline tests attendsummer school, students scoring just below the threshold values (normalized to zero) are significantly morelikely to attend summer school than those scoring just above, even though they are separated by only one(ordinal) score.
Fig. 2 presents the same data on the fraction of 5th graders attending summer school from a differentperspective, along with data on achievement outcomes. The figure shows summer school attendance rates(plotted with �’s) and average 2002 math achievement scores as a function of the baseline 2001 math score. Asin Fig. 1, there is a sharp increase in the fraction of students who attend summer school for students whobarely fail the 2001 test compared to those who pass the test. If summer school has a positive impact onsubsequent math achievement, then the large discontinuity in the proportion of children attending summerschool observed in Fig. 1 should be echoed by a discontinuity in subsequent achievement in Fig. 2. That is, ifsummer school exerts a positive causal impact on subsequent exam performance, students who barely fail thebaseline assessment exam—and hence are much more likely to go to summer school—should outperformthose students who barely pass the assessment exam.
Looking at the raw data plotted with open circles, Fig. 2 shows that the group of 5th graders with the 2001math score below the cutoff (e.g., �1 in the top panel) do not have higher 2002 math scores relative to thosewith the score above the cutoff (2 in the top panel). This fact, however, is likely due in part to non-negligibletrends in student abilities and other characteristics related to their 2001 test scores. To account for these trendsit is necessary to fit a parametric model to the data, such as the linear regression fit shown with the dashed line.The parametric fits suggest that there is indeed a discontinuity in math scores that is consistent with a positiveimpact of summer school on achievement: the (hypothetical) students just below the cutoff have higher 2002math scores than those just above. To the extent that the parametric model has accounted for any differencesin other variables that affect achievement near the pass–fail cutoff score, then this difference in achievementcan be causally attributed to summer school attendance.
The data presented above for 5th graders is not necessarily representative of all the students who attendedsummer school in LUSDiNE. In particular, for students in the 3rd grade, there appears to be little to nobenefit to attending summer school for math, and the benefits from reading are muted compared to those for
2The name of the district is withheld per an agreement allowing for use of the data.3The data has not been smoothed; the support of both scores is as discrete as shown. On average, each math and reading score cell
contains about 113 students.
ARTICLE IN PRESS
Fig. 2. Fraction attending summer school and achievement outcomes by 2001 math score: Grade 5—all students.
-11-8
-4
-1
2
6
9
12
-19
-13
-7
-2
3
7
11
15
0
0.1
0.2
0.3
0.4
0.5
0.6
0.7
0.8
0.9
Fra
cti
on
Att
en
din
g S
um
mer
Sch
oo
l (z
)
2001 Math
Score
(x) 2001 Reading Score (y)
Fig. 1. Fraction attending summer school by 2001 math and reading scores: Grade 5.
J.D. Matsudaira / Journal of Econometrics 142 (2008) 829–850 831
ARTICLE IN PRESSJ.D. Matsudaira / Journal of Econometrics 142 (2008) 829–850832
5th grade students. Overall, however, the results in this paper suggest that summer school has a positiveimpact on student test scores in both math and reading, at least in the short term, of about .12 standarddeviations.
The paper is organized as follows. Section 2 provides institutional background on LUSDiNE’saccountability policy and describes how it lends itself to the regression discontinuity research design. Section3 describes the econometric framework and some conceptual issues that guide its implementation. Empiricalresults are described in Section 4 followed by a discussion of the internal validity of the analysis in Section 5.Section 6 discusses the empirical findings and concludes.
To reduce the length of the discussion, throughout the paper the analysis is described in detail for studentsin Grades 3 and 5 only, with results from other grades referenced occasionally when qualitative differencesexist. The main results for other grades are described in the tables.4
2. LUSDiNE’s accountability policy and the RDD
In 1996, Chicago Public Schools began a national movement by requiring students in the 3rd, 6th, and 8thgrades, to, inter alia, meet predefined standards on tests given at the end of the school year as a condition forpromotion. Feeling pressure to act to end ‘social promotion’—the practice of allowing students to advancethrough grades with their age cohort regardless of achievement outcomes—and from Chicago’s example,LUSDiNE passed a similar accountability policy shortly afterwards. The policy requires all students in gradelevels three and above to meet four basic criteria in order to advance to the next grade (or graduate, forseniors):
1.
4
5
bec
or6
sum
als
Score at or above a set proficiency level (score) on a standardized test in Math;
2. Score at or above a set proficiency level (score) on a standardized test in reading; 3. Attain at least 90% attendance during the school year; and 4. Meet literacy and math performance standards as evidenced by student work, teacher observation andassessments, and grades during the year.
If a student fails to meet any of these criteria, he or she may be mandated to attend summer school. Studentsmandated to summer school are required to retake any exams failed in the normal spring testing period againat the end of the summer, and in principle, failure to pass results in being retained a grade level.
It is readily apparent that under this policy the probability that a student will attend summer school is(potentially) a discontinuous function of student test scores on the math and reading baseline exams. Inparticular, a student who scores just below the cutoff score on either test should be more likely to attendsummer school than a student who barely passes the test.5 District policy is explicit in discouraging the use ofany one of the above criteria in isolation to determine whether a student will be sent to summer school. Asshown in Fig. 1, however, though fewer than 100% of the students failing the exams end up attending summerschool, the prediction of a discontinuous relationship is still borne out in the data for most cases. This keyfeature of the policy allows us to employ a regression discontinuity design (RDD) to estimate the causalimpact of summer school on student achievement.6
Comparable results for all grades are available from the author on request.
In this paper, I focus on discontinuities associated with test scores only. Information on attendance rates are not used in this analysis
ause (1) District officials have expressed concern about its reliability, and (2) it is arguable that attendance is manipulable by students
teachers in a way that may compromise the validity of the RDD.
It should be noted that many students attend summer school voluntarily for ‘‘enrichment.’’ While the gap in the likelihood of attending
mer school is primarily driven by differences in the probability of being required to attend, in most cases students who barely fail are
o slightly more likely (on the order of 6 percentage points or less) to attend summer school voluntarily.

ARTICLE IN PRESSJ.D. Matsudaira / Journal of Econometrics 142 (2008) 829–850 833
There are several reasons to believe that summer school might have an effect on achievement. Depending onwhich school a student attends, students in summer school attend classes for between 20 and 30 days duringthe summer, usually for a half of the school day. This represents between an 11% and 16% increase in days inschool over the typical 180 instruction days in the normal school year. While this is a relatively small amountof time, evaluations of other programs7 have suggested that time in summer school may be more effective inproducing test score gains than time during the school year. Class sizes tend to be smaller, and studentmotivation may be higher given the threat of repeating grades if they do not learn material. Further, comparedto the school year curriculum, instruction is more tightly aligned with concepts that appear on the end of yeartests.
The LUSDiNE policy also encourages schools to tailor summer curricula to individual students’weaknesses: students failing the baseline math exam should get remedial education predominantly in math,students failing reading should get help in reading, and those failing both should get both. This aspect of thepolicy suggests that students attending summer school may receive different ‘‘treatments,’’ depending onwhether they were mandated to attend summer school because of failing the math, reading, or both baselineexams. For example, students mandated to attend summer school because of failing the math exam are likelyto receive more remedial instruction in math than those students mandated to attend due to failing the readingexam. We would thus expect the measured effect of summer school on math achievement to be higher amongthe former group, whereas the opposite might be true if the achievement outcome under consideration is thereading score.8
With this in mind, I investigate the effects of summer school in a way that isolates students receiving each ofthese different treatments. For example, to isolate the effect of ‘‘attending summer school for math’’, Icondition on the set of students who passed the 2001 reading exam and assess the differences in 2002 math(and reading) scores. As Fig. 1 shows, there is little change in the probability of attending summer school thatresults from failing one of the tests given that a student already failed the other. Since this results in noisyestimates of the impact of summer school, I omit the results for these students from the discussion below.
3. Methods
The data underlying the empirical analysis presented here is a subset of an administrative data set I obtainedfrom LUSDiNE officials containing individual level data for all students in Grades 3 through 8 between 1999and 2002. I restrict attention to those students in Grades 3 through 7 whose achievement outcomes weremeasured on both math and reading exams in the springs of 2001 (baseline) and 2002 (outcomes), leaving ananalysis sample of 338,608.9 To prevent errors in norming test scores across grade levels from affecting theresults, I treat the outcome scores of retained students as missing and discuss the implications of their omissionin Section 5. Descriptive statistics for the sample used for the analyses are presented in Table 1.
3.1. Econometric framework
Suppose the relationship between achievement and summer school attendance is given by the constanttreatment effects model
Y i ¼ aþ Tiyþ ni, (1)
where Y i is student i’s test score on the spring 2002 examination in either math or reading, depending on theoutcome of interest; Ti is an indicator function equal to one if student i attends summer school; and ni
7See, for example, Roderick et al. (2003) for a detailed evaluation of the Chicago summer school program. Similar information is not
available for LUSDiNE’s program.8Some observers familiar with LUSDiNE’s policy have suggested that curricula are not in fact individually tailored to the subjects a
student failed. Unfortunately, there is no empirical evidence that I know of on the extent to which this aspect of the policy was
implemented.9As the conditional expectations for indicator variables for each of these sample restrictions are smooth through the cutoff scores, these
sample selection criteria should not introduce any bias in the results below. For a slightly more detailed description of the data used, see
the Data Appendix.

ARTICLE IN PRESS
Table 1
Descriptive statistics of estimation sample by summer school attendance: Grades 3 and 5
Grade 3 Grade 5
Attended SS Attended SS
Total Yes No Total Yes No
Outcomes
2002 math score 641.8 620.4 648.5 668.7 640.9 676.1
(.142) (.241) (.16) (.18) (.337) (.198)
[36.57] [45.29]
2002 reading score 649.7 621.6 658.6 655.7 634.7 661.2
(.176) (.241) (.204) (.138) (.235) (.154)
[46.40] [36.21]
Summer school attendance
Attended summer school 2001 .24 1 0 .207 1 0
(.002) (0) (0) (.002) (0) (0)
Days attended 4.373 18.208 0 3.655 17.643 0
(.033) (.05) (0) (.03) (.057) (0)
Past test scores
2000 math score n.a. n.a. n.a. 635.7 612.4 641.8
(–) (–) (–) (.142) (.254) (.156)
2000 reading score n.a. n.a. n.a. 640.2 616.5 646.4
(–) (–) (–) (.16) (.27) (.18)
Demographics
Female .500 .489 .504 .498 .481 .502
(.002) (.004) (.002) (.002) (.004) (.002)
Asian .115 .094 .122 .112 .061 .126
(.001) (.002) (.001) (.001) (.002) (.001)
Hispanic .357 .396 .344 .364 .394 .356
(.002) (.004) (.002) (.002) (.004) (.002)
Black .363 .427 .343 .363 .478 .333
(.002) (.004) (.002) (.002) (.004) (.002)
Home language not English .362 .377 .357 .421 .389 .429
(.002) (.004) (.002) (.002) (.004) (.002)
Eligible for free lunch .761 .875 .725 .765 .883 .735
(.002) (.003) (.002) (.002) (.003) (.002)
Neighborhood characteristics
Percent unemployment 11.875 13.018 11.513 11.955 13.688 11.502
(.021) (.042) (.024) (.021) (.044) (.023)
Percent housing units owner occupied 28.73 24.997 29.91 28.717 24.234 29.889
(.078) (.14) (.091) (.078) (.154) (.089)
Percent of households very poor 13.162 14.626 12.699 13.235 15.361 12.68
(.027) (.054) (.031) (.027) (.058) (.03)
Grade retention
Retained .065 .188 .017 .028 .102 .007
(.001) (.003) (.001) (.001) (.002) (.001)
Number of observations 66,035 15,861 50,174 66,839 13,847 52,992
Note: Standard errors are given in parentheses. Standard deviations of the outcome scores are provided in brackets. Other variables used
in the paper are noted in separate tables when relevant. The statistics are for the estimation sample which excludes students who are
retained between 2001 and 2002, with the exception of the last row (‘retained’) which includes these students.
J.D. Matsudaira / Journal of Econometrics 142 (2008) 829–850834
represents all other determinants of achievement. Letting Ski represent the student’s test score on the 2001
baseline exam in subject k 2 ðmðathÞ; rðeadingÞÞ (depending on whether the treatment of interest is summerschool for math or for reading, respectively), also define an indicator variable Di ¼ 1fSk
i o0g which equals one

ARTICLE IN PRESSJ.D. Matsudaira / Journal of Econometrics 142 (2008) 829–850 835
if the student failed the baseline exam in subject k (the pass–fail cutoff is normalized to zero). Abusingconcepts slightly, hereafter I refer to students for whom Di ¼ 1 as those ‘‘mandated to attend summer schooldue to failing exam k,’’ or equivalently ‘‘students mandated to summer school for subject k.’’10
The empirical challenge in obtaining a consistent estimate of y, the causal effect of summer school, is thatattendance is endogenous. As shown in Table 1, students who attend summer school have lower priorachievement levels, are more likely to be black and hispanic, are more likely to qualify for free lunch, and livein neighborhoods with higher unemployment and poverty rates, and lower owner occupancy rates. Differencesin these and other unobserved student characteristics are all likely to exert a negative bias on estimates of theeffect of summer school based on comparisons of students who did and did not attend. To avoid this, I usewhether a student was mandated as an instrument for summer school attendance in the RDD.
If Ti ¼ Di—that is, if all students mandated to attend summer school actually attend with probability one—Hahn et al. (2001) demonstrate that the treatment effect of summer school for subject k would be identified bythe difference in 2002 test scores for students just below and just above the pass fail cutoff, or
ysharp ¼ lims"0
E½Y ijSki ¼ s� � lim
s#0E½Y ijS
ki ¼ s�, (2)
so long as E½nijSki ¼ s� is continuous at the pass–fail cutoff, s ¼ 0. This identification condition requires that
the conditional expectations of all other characteristics affecting achievement are continuous at the cutoffscore (for a formal statement, see Lee, 2005). That is, analogous to a randomized controlled trial, studentswho barely fail the math (reading) exam should on average have the same value of any predetermined attributeas those students who barely pass the math (reading) exam. Identification of the treatment effect of summerschool essentially requires that the only thing that is changing discontinuously at the threshold is theprobability that the student receives the treatment. If some other variable varied discontinuously at thethreshold we would be concerned that our estimated treatment effects would be confounded by otherdifferences between treatments and controls. While, similar to the case of a randomized study, it is not possibleto verify that all unobserved determinants of achievement are balanced on either side of the cutoff, I presentevidence that observable student characteristics are balanced in Section 5.
As demonstrated in Fig. 1 and discussed above, however, the RDD available in LUSDiNE is ‘‘fuzzy’’ in thesense that the relationship between test scores and summer school attendance is not deterministic.11 In thiscontext, it is still possible to interpret the estimand given by (2) analogously to an ‘‘intent to treat’’ parameterof a randomized controlled trial where the treatment remains summer school, but because of ‘‘lack ofcompliance’’ some people assigned to treatment by barely passing failing the exam do not actually end upgoing to summer school.
Alternatively, if one is willing to assume that the effect of summer school is a constant, the appropriateestimand is
y ¼lims"0 E½Y ijS
ki ¼ s� � lims#0 E½Y ijS
ki ¼ s�
lims"0 E½TijSki ¼ s� � lims#0 E½TijS
ki ¼ s�
. (3)
If the assumption that y is constant is not appropriate, it is still appropriate to interpret the estimand from (3)as the causal effect of summer school albeit a ‘local average treatment effect’: the average effect of summerschool for those persons induced to go to summer school by being mandated to attend.12 Intuitively, we needto ‘‘scale up,’’ or magnify, the estimate in the discontinuity in achievement scores given by (2) by the inverse ofthe fraction of students who are induced to attend summer school by failing the exam in subject k. In essence,this approach uses whether a student is mandated to summer school (Di) as an instrument for summerschool attendance (Ti). In a constant treatment effects model, (3) is identified if the denominator is finite and
10In fact not all students who fail the exams are actually mandated by the District to attend summer school. Strictly speaking, by
‘‘mandated’’ I mean that the student failed exam k, and by doing so was more likely to be induced to attend summer school and receive
remedial education in that subject.11The terminology ‘‘sharp’’ and ‘‘fuzzy’’ is from Trochim (1984).12In this case, we further require that assignment to treatment satisfy a monotonicity property. In this context it requires that the sample
not include individuals who would have gone to summer school but did not because they were mandated to go by barely failing the exam.
See Hahn et al. (2001).
ARTICLE IN PRESSJ.D. Matsudaira / Journal of Econometrics 142 (2008) 829–850836
non-zero—the standard assumption of instrument relevance. In other words, failing exam k must be associatedwith a discontinuous change in the probability of attending summer school relative to passing. I show belowthat the accountability policy in LUSDiNE ensures that this condition is satisfied in most, but not all, cases.
3.2. Estimation
There are a variety of options for estimators of the numerator and denominator of Eq. (3). Adapting thenotation of Porter (2003), suppose that a student’s achievement outcomes and summer school participationcan be expressed in terms of their baseline test score in subject k as
Y i ¼ a1 þm1ðSki Þ þDip1 þ v1i where E½v1jS
k;D� ¼ 0 and Di ¼ 1fSki o0g (4)
and
Ti ¼ a0 þm0ðSki Þ þDip0 þ v0i where E½v0jS
k;D� ¼ 0 and Di ¼ 1fSki o0g. (5)
As long as m1ð�Þ and m0ð�Þ are continuous at Sk ¼ 0, then p1 and p0 represent the size of the discontinuitiesin the numerator (average achievement scores) and denominator (probability of summer school attendance),respectively, of (3). The challenge in implementing the RD design is thus to find an appropriate estimator form1ð�Þ and m0ð�Þ.
To estimate the size of the discontinuities at the threshold I specify a flexible parametric model for m1ð�Þ andm0ð�Þ.
13 Specifically, I estimate Eqs. (4) and (5) by including a 3rd degree polynomial in Sk, fully interactedwith the indicator Di ¼ 1fSk
i o0g, allowing the parameters of each term of the polynomial to vary on eitherside of the pass–fail cutoff.14 For clarity, the equations for estimating the discontinuities in achievementoutcomes and the probability of attending summer school as a function of a student’s baseline score in subjectk, are
Y i ¼ a1 þDip1 þDi
X3p¼1
g1pðSki Þ
pþ ð1�DiÞ
X3p¼1
g01pðSki Þ
pþ v1i, (6)
and
Ti ¼ a0 þDip0 þDi
X3p¼1
g0pðSki Þ
pþ ð1�DiÞ
X3p¼1
g00pðSki Þ
pþ v0i. (7)
In Eq. (6), a1 and p1 represent, respectively, a constant term and the ‘‘intent to treat’’ treatment effect ofbeing mandated to summer school for subject k, while g1p and g01p represent the coefficients on the p
polynomial terms for the case when D ¼ 1 and D ¼ 0, respectively. This allows the shape of the underlyingconditional expectation to be different to the left and right of the threshold. Eq. (7) is analogous to Eq. (5) andthe coefficient p0 identifies the discontinuity in the probability of attending summer school induced by barelyfailing exam k.
In both equations, it is possible to include a vector of demographic and socio-economic status variables. AsLee (2005) observes, however, the estimates of p1 and p0 should be unaffected by this if these covariates do notvary discontinuously at s ¼ 0. While we might still include these covariates for variance reduction, in practicetheir inclusion has little effect on either the magnitude or precision of the main estimates presented in thispaper. This appears to be due to the fact that the additional covariates do not explain much variance in 2002
13A similar approach is employed by DiNardo and Lee (2004) and Card et al. (2004).14The choice of the 3rd order polynomial specification was based on a model selection algorithm using the Schwarz criterion (see
Schwarz, 1978). For each outcome (2002 math and reading scores) and grade, I fit models of the form described here with from 1 to 7
polynomial terms in the baseline score on the test of the same subject (and their interactions with Di). For each grade and outcome, I
selected the model (indexed by the highest order polynomial term) that maximized the Schwarz statistic—essentially choosing the model
based on goodness of fit with a penalty for increasing the number of regressors. In the majority of cases, the 3rd order polynomial was the
preferred specification. I present sensitivity analyses to other polynomial choices below.

ARTICLE IN PRESSJ.D. Matsudaira / Journal of Econometrics 142 (2008) 829–850 837
test scores after already flexibly controlling for 2001 scores. In the interest of simplicity I therefore presentresults and figures for models that do not control for covariates.15
If this parametrization in (6) and (7) is adequate, then p1 and p0 can be consistently estimated using leastsquares. In all specifications presented in this paper, I estimate standard errors clustered on each value of Sk toallow for heteroscedasticity due to misspecification of mð�Þ.16 Under the assumptions outlined above, the ratioof the estimates of the two coefficients bp1= bp0 ¼ y estimates the causal effect of summer school. Since thismodel is exactly identified I estimate this quantity via two-stage least squares.17
4. Empirical results
In this section I present estimates of the effect of being mandated to summer school on attendance, and thendiscuss the results for the effects of summer school attendance on math and reading achievement outcomes. Ifocus first on summer school for math, using only the population of students who passed the reading test andare thus not at risk for being sent to summer school for reading. Following that, I present the analogousresults for reading.
4.1. Summer school mandates and attendance
To what extent did the accountability policies in LUSDiNE create a discontinuous relationship betweenstudents’ baseline 2001 math and reading scores and the probability of attending summer school? As we willsee, the illustration in Fig. 1 appears to be representative of the accountability policy’s impact in many, but notall, cases: among students passing one of the achievement tests, barely failing the other generally results in amarked increase in the probability of attending summer school.
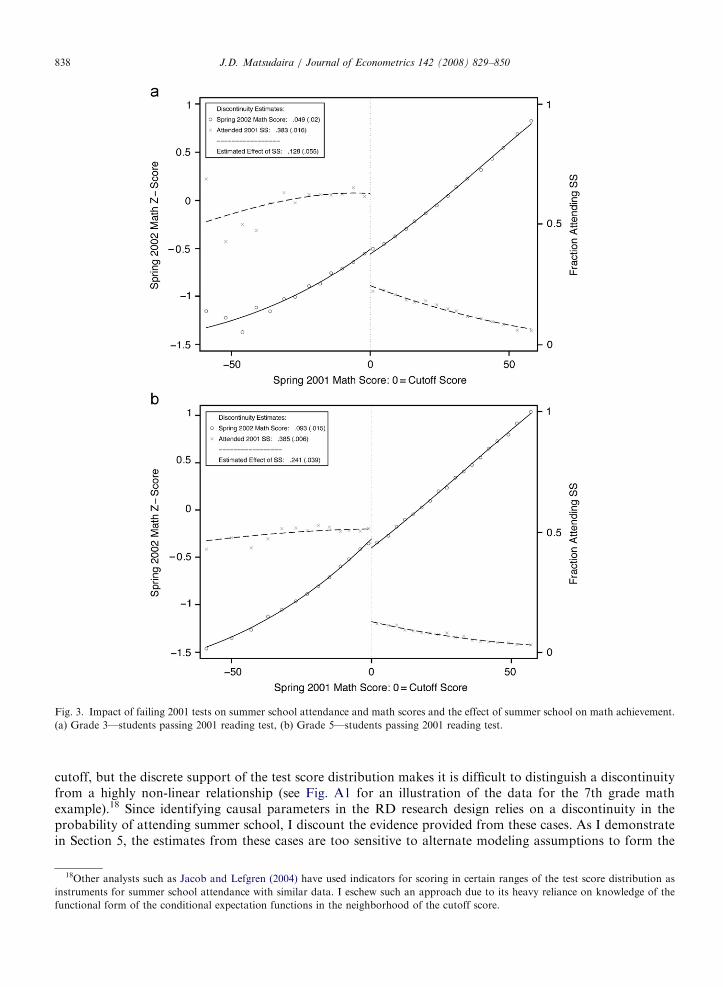
Fig. 3 presents the parametric estimates of the discontinuities (along with the averages of the raw data) inthe probability of summer school attendance around the math pass–fail cutoff score that correspond to theearlier discussion of Fig.1 for both Grades 3 and 5. In the top and bottom panels, the x’s represent the fractionof students with each spring 2001 math score who attended summer school that summer. While thediscontinuity at the cutoff score (equal to zero on the x-axis) is visually apparent, the cubic parametric fitshown with the dashed line provides both a point estimate and standard error. Note that while in the figure thesupport of the 2001 math score is truncated beyond 60 points in either direction of the cutoff score, the modelis estimated using the entire range of the data. In both the 3rd and 5th grade, being mandated to summerschool for math (i.e., scoring below the cutoff) is associated with a 38 percentage point (s.e.: .016) increase inthe chance of attending summer school. It appears, then, that while failing the math exam was not the onlydeterminant of whether a student attended summer school, being mandated for failing math did have a strongimpact on the probability of attendance. In the context of the research design described above, this is akin todemonstrating the existence of a strong first stage relationship between the instrument, Di, and summer schoolattendance.
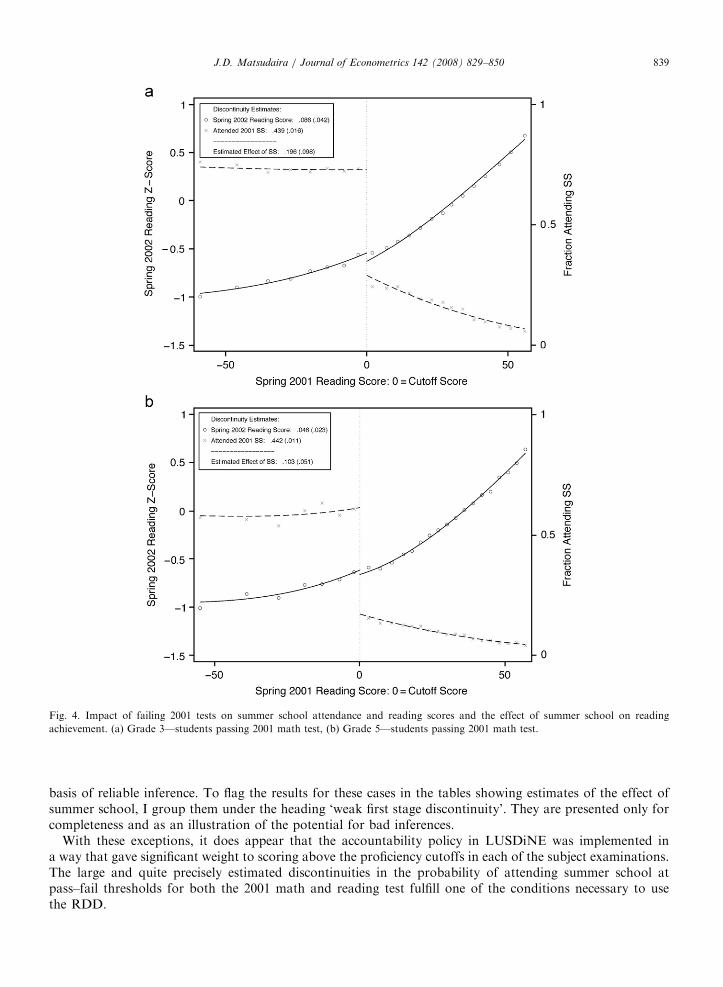
Fig. 4 shows even stronger results for the reading test among students who passed the math test. In bothGrades 3 and 5, being mandated to summer school for reading causes about a 44% increase in the probabilityof summer school attendance. Similar discontinuities in the fraction of students attending summer school areapparent in Grade 6 on the math test, and Grade 4 on the reading test (see Tables 2 and 3).
There are several cases, however, in which the policy appears not to have been implemented as described inSection 2, or factors other than test scores may have been more determinative of whether a student wasmandated to summer school. In particular, there is no detectable discontinuity in the probability of attendingsummer school across the math pass–fail cutoff score in Grade 4. And in Grade 7 for both math and reading,the probability of attending summer school drops sharply as baseline test scores increase through the pass–fail
15The results with covariates are available from the author on request.16See Lee and Card (2004) for a discussion of specification errors in the RDD in cases where the ‘‘running variable’’—the baseline test
score S in this paper—is discrete.17Specifically, in the structural model Y i ¼ mþ TiyþDi
P3p¼1c1pðS
ki Þ
pþ ð1�DiÞ
P3p¼1c
01pðS
ki Þ
pþ �i, I instrument for Ti using Di and
the polynomial terms of Si and their interactions.
ARTICLE IN PRESS
Fig. 3. Impact of failing 2001 tests on summer school attendance and math scores and the effect of summer school on math achievement.
(a) Grade 3—students passing 2001 reading test, (b) Grade 5—students passing 2001 reading test.
J.D. Matsudaira / Journal of Econometrics 142 (2008) 829–850838
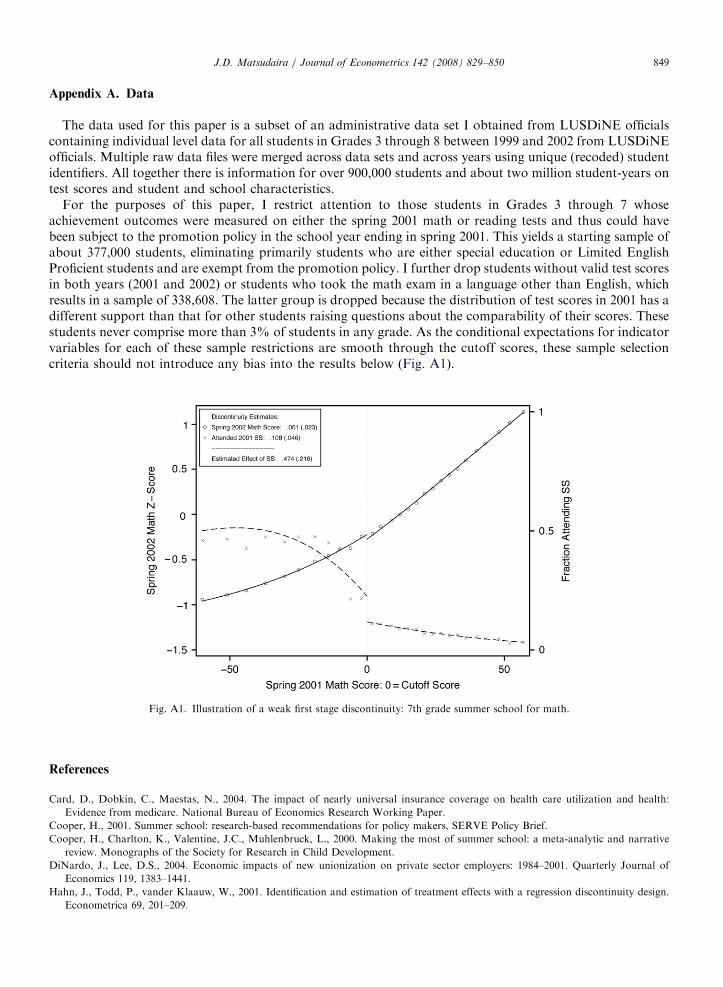
cutoff, but the discrete support of the test score distribution makes it is difficult to distinguish a discontinuityfrom a highly non-linear relationship (see Fig. A1 for an illustration of the data for the 7th grade mathexample).18 Since identifying causal parameters in the RD research design relies on a discontinuity in theprobability of attending summer school, I discount the evidence provided from these cases. As I demonstratein Section 5, the estimates from these cases are too sensitive to alternate modeling assumptions to form the
18Other analysts such as Jacob and Lefgren (2004) have used indicators for scoring in certain ranges of the test score distribution as
instruments for summer school attendance with similar data. I eschew such an approach due to its heavy reliance on knowledge of the
functional form of the conditional expectation functions in the neighborhood of the cutoff score.
ARTICLE IN PRESS
Fig. 4. Impact of failing 2001 tests on summer school attendance and reading scores and the effect of summer school on reading
achievement. (a) Grade 3—students passing 2001 math test, (b) Grade 5—students passing 2001 math test.
J.D. Matsudaira / Journal of Econometrics 142 (2008) 829–850 839
basis of reliable inference. To flag the results for these cases in the tables showing estimates of the effect ofsummer school, I group them under the heading ‘weak first stage discontinuity’. They are presented only forcompleteness and as an illustration of the potential for bad inferences.
With these exceptions, it does appear that the accountability policy in LUSDiNE was implemented ina way that gave significant weight to scoring above the proficiency cutoffs in each of the subject examinations.The large and quite precisely estimated discontinuities in the probability of attending summer school atpass–fail thresholds for both the 2001 math and reading test fulfill one of the conditions necessary to usethe RDD.

ARTICLE IN PRESS
Table 2
The effect of being mandated to summer school on attendance and 2002 math scores and the effect of summer school attendance for math
(students who passed the 2001 reading exam)
Effect of being mandated Effect of SS attendance No. observations
Attendance (1st Stage) Math (Reduced form) Math (TSLS) Reading (TSLS)
Strong 1st stage discontinuity
Grade 3 .383 .049 .128 .087 55,931
(.016) (.02) (.055) (.065)
Grade 5 .385 .093 .241 .083 59,258
(.006) (.015) (.039) (.055)
Grade 6 .320 .061 .19 n.a. 51,810
(.011) (.014) (.047) (–)
Weak 1st stage discontinuity
Grade 4 .000 .004 10.258 57.724 58,689
(.015) (.031) (373) (2111)
Grade 7 .108 .051 .474 .303 48,199
(.046) (.023) (.216) (.215)
Note: Estimates in the first two columns refer to coefficients on the dummy variable for scoring below the pass–fail threshold in Eqs. (7)
and (6) in the text in a model using a 3rd order polynomial on the full range of data. Reading scores are not available as an outcome for
Grade 6.
J.D. Matsudaira / Journal of Econometrics 142 (2008) 829–850840
4.2. Summer school for math
Given the large impact of being mandated to summer school for math or reading on the probabilityof attending summer school, we should expect to see similar discontinuities in the plots of average achievementscores if summer school is effective. As mentioned above, Cooper et al. (2000) conclude that summerschool programs increase student achievement by between one-seventh and one-quarter of a standarddeviation in test-scores, implying that y 2 ð:14; :25Þ. If this is true, then our estimates of p1—the discontinuityin the 2002 achievement score—should be proportional to p0 by a factor of y, since p1 ¼ y� p0. In theanalyses presented here, outcome scores were all transformed to z-scores, so estimated impacts are mea-sured in units of standard deviations of the grade and subject specific test score distribution for the entiresample.
Looking at the results for average math scores for Grades 3 and 5 in Fig. 319, this prediction appears to beborne out. For 3rd graders, p1 is about .049, implying an effect of summer school of .128 standard deviations(with a standard error of .055.). Note, however, that in this case that the cubic polynomial model may notconvince the eye that a discontinuity exists in the raw data (the open circles). As I show below, this is one ofseveral cases where the cubic model was rejected in favor of a quartic specification. While all figures in thissection show a cubic fit for comparability, in Section 4.4 I present estimates for several different polynomialspecifications and note which models are preferred by the model selection algorithm discussed above. Indeed,for 3rd graders the quartic specification suggests an effect of summer school of �:029 (.037) standarddeviations that is statistically insignificantly different from zero.
For Grade 5, there appears to be an unambiguous break in the graph of 2002 math scores on 2001 scores,suggesting a relatively large impact of summer school for math. Being mandated to summer school for mathresults in an increase in math test scores of .093 z-scores, implying an effect of summer school of .241 (.039)standard deviations. This is a surprisingly high estimate, as it is on the upper end of the effect sizes surveyed byCooper et al., and they report that studies using randomization tended to find smaller effect sizes. As reportedin column (3) of Table 2, however, roughly the same size effect is found for students attending summer schoolfor math in Grade 6—the estimated effect is .190 (.047) standard deviations.
19Note that the lower panel of Fig. 3 is based on a wider range of the same raw data as shown in Fig. 2.

ARTICLE IN PRESS
Table 3
The effect of being mandated to summer school on attendance and 2002 reading scores and the effect of summer school attendance for
reading (students who passed the 2001 math exam)
Effect of being mandated Effect of SS attendance No. observations
Attendance (1st Stage) Reading (Reduced form) Reading (TSLS) Math (TSLS)
Strong 1st stage discontinuity
Grade 3 .439 .086 .196 .201 55,385
(.016) (.042) (.098) (.068)
Grade 4 .303 .052 .173 .109 60,052
(.014) (.024) (.08) (.062)
Grade 5 .442 .046 .103 .095 47,484
(.011) (.023) (.051) (.049)
Weak 1st stage discontinuity
Grade 7 .127 �:013 �:103 �:364 36,243
(.078) (.034) (.290) (.423)
Note: Estimates in the first two columns refer to coefficients on the dummy variable for scoring below the pass–fail threshold in Eqs. (7)
and (6) in the text in a model using a 3rd order polynomial on the full range of data. Reading scores are not available as an outcome for
Grade 6.
J.D. Matsudaira / Journal of Econometrics 142 (2008) 829–850 841
Column (4) of Table 2 reports the effect of attending summer school for math on 2002 reading test scores.While the curriculum over the summer is supposed to be tailored to student weaknesses, it is quite possiblethat the students who passed the reading test but ended up being mandated to summer school for math spentsome of their time reviewing reading concepts. It is also plausible that students learn general studying or test-taking techniques that are applicable across subject area. While the point estimates suggest a small positiveeffect of summer school—between .08 and .09 standard deviations for both 3rd and 5th graders—for math onreading achievement, the estimates are somewhat imprecise. Thus, the effects cannot conclusively beestablished to be positive, nor can they be said to be less than the effects on math outcomes in terms ofstatistical significance.
4.3. Summer school for reading
Cooper and his coauthors reported that summer school programs tended to be more effective in raisingachievement scores for math relative to reading, a finding that is not uncommon in evaluations of schoolinterventions. Table 3 shows that there was a clear effect of being mandated to summer school for reading onattendance for students in Grades 3 through 5. Looking at the data for 2002 reading scores presented in Fig. 4,this discontinuity in summer school attendance again appears to be mirrored by an increase in achievementat the pass–fail cutoff. In 3rd grade, the cubic fit suggests that students scoring just below the threshold onthe 2001 reading test have 2002 achievement scores that are .086 standard deviations above those ofstudents scoring just above the threshold. This implies an effect of summer school of .196 (.098) standarddeviations. Looking at the fit of the lines to the local averages shown in the open circles, however, we mayagain quibble with the fit of the model, and in any event the standard error is fairly large yielding a t-statisticof about 2.
The results for Grade 4 (shown in Table 3) and Grade 5 fit roughly the same pattern. The estimates of theeffect of summer school yielded by the 3rd order polynomial specification are .173 and .103 standarddeviations, respectively, with each having a t-statistic of about 2. For math outcomes, the results are similar tothose presented for reading outcomes of summer school for math above. In each case the estimated effects arepositive, ranging from .201 (.068) standard deviations for 3rd graders to .095 (.049) for 5th graders.

ARTICLE IN PRESS
Table 4
Sensitivity of estimates to alternative model specifications
Support restriction Full range jTest Score� Cutoff jp35
Polynomial order 3 4 1 2 3
Effect of summer school attendance for math on 2002 math score
Strong 1st stage discontinuity
Grade 3 .128 �:029y .101 :038y .017
(.055) (.037) (.043) (.028) (.013)
Grade 5 :241y .154 :187y .214 .176
(.039) (.04) (.041) (.041) (.034)
Grade 6 :190y .114 :172y .151 .219
(.047) (.061) (.049) (.069) (.073)
Weak 1st stage discontinuity
Grade 4 10:258y 1.019 �:473y �:079 .409
(3.388) (1.216) (.718) (.510) (.497)
Grade 7 .474 :214y :235y 5.42 1.159
(.216) (.413) (.208) (68.11) (1.385)
Effect of summer school attendance for reading on 2002 reading score
Strong 1st stage discontinuity
Grade 3 .196 �:079 .135 :079y .119
(.098) (.075) (.070) (.046) (.051)
Grade 4 :173y .152 :157y .173 .111
(.080) (.088) (.059) (.097) (.117)
Grade 5 :103y �:024 :231y .097 .011
(.051) (.066) (.068) (.090) (.045)
Weak 1st stage discontinuity
Grade 7 �:103 �1:773y �:077y �1:304 1.318
(.29) (2.129) (.165) (1.715) (1.236)
Note: All entries represent two-stage least squares estimates of the effect of summer school attendance on 2002 test scores, reported in z-
scores. In the panel reporting effects of summer school for math (reading), the estimates in the first two columns are based on a sample
including only students who passed the reading (math) test. The latter three columns narrow this sample by restricting attention to a band
of 35 points in either direction from the cutoff on the 2001 test score support. Within each sample, all observations are weighted equally.
Estimates marked with a dagger (y) denote the polynomial specification that maximizes the Schwarz statistic for a given support restriction
from a regression of the outcome test score on the polynomial terms of the 2001 test score, a dummy variable equal to one if the score is
below the cutoff, and a full set of interaction terms. For the full sample for reading, the preferred model is a 5th order polynomial— the
resulting estimate is .121 (.038). Reading scores are not available as an outcome for Grade 6.
J.D. Matsudaira / Journal of Econometrics 142 (2008) 829–850842
4.4. Robustness to alternative model specifications and summary
As alluded to above, the 3rd order polynomial specification is not always the model that best fits theconditional expectations of the achievement score outcomes. If mðSÞ is thus misspecified, our estimates of theeffect of summer school attendance may be biased even if the other identification conditions discussed aboveare satisfied. Before summarizing the evidence presented above, I therefore discuss the sensitivity of the resultsto alternative model specifications.
Table 4 presents estimates of y for a variety of different model choices for mðSÞ, separately for math andreading, and separately for cases with strong and weak first stage relationships between summer schoolmandates and attendance. Column (1) presents the estimates from the 3rd order specification presented above,estimated on student data spanning the full range of 2001 test scores. For the 2002 math score outcomes forGrade 3, and for the Grade 7 outcomes, the Schwarz criterion favored a 4th order polynomial specification. Asshown in column (2), this results in a much lower estimate of the effect of summer school for math on 2002math scores: the estimated effect is now �:029 (.037) standard deviations, rather than the .128 (.055) estimate
ARTICLE IN PRESSJ.D. Matsudaira / Journal of Econometrics 142 (2008) 829–850 843
from the 3rd order specification. Similarly, for the estimates of the effect of summer school for reading, a 5thorder polynomial is suggested by the Schwarz criterion for Grade 3. Using that specification (not shown in thetable) results in an estimate of .121 (.038) standard deviations, rather than the .196 (.098) given by the cubicmodel.
The baseline cubic specification tends to perform poorly in cases where the conditional expectations of theoutcome scores become highly non-linear in the tails of their support, at extreme values of the 2001 test score(this is not visible since Figs. 3 and 4 truncate the regions of support beyond 60 points in either direction of thecutoff). To explore the robustness of the results further, in columns 3 through 5 of Table 4, I estimate the effectof summer school using data only for students scoring ‘near’—within 35 points of—the cutoff score.20 Asshown in column 3, a linear specification is generally chosen by the model selection algorithm for thisrestricted set of data, except in Grade 3 for both math and reading where a quadratic specification is preferred.A comforting feature of the estimates in columns 3 through 5 is that they are similar to each other for anygiven grade and outcome. They also tend to be a bit smaller, but broadly similar to the Schwarz-preferredestimate from the first two columns.
Overall, the analysis in Table 4 affirms the results from the 3rd order polynomial specification presentedabove, except for the estimates for 3rd graders. For these students, there appears to be little to no effect ofsummer school on achievement for math. The point estimates from the preferred models for mðSÞ (markedwith a dagger) in Table 4 are �:029 and .038 standard deviations, with standard errors that are roughlyconsistent with an effect size between plus and minus one-tenth of a standard deviationð�:029� 2� ð:037Þ to :038þ 2� ð:028ÞÞ. This is perhaps surprising given that previous studies of summerschool programs spanning multiple grades have suggested that the benefits of summer school are highest forstudents in lower grades, and many mandatory summer school programs have accordingly targeted onlyyounger students.
Indeed, for students in Grades 5 and 6, there appears to be a much larger impact of attending summerschool for math. Here the preferred estimates range between .172 (.039) and .241 (.049) standard deviations,with the estimates on the restricted support of the 2001 test score distribution yielding slightly smallerestimates than those presented above.
For summer school for reading, the results of the analysis in Table 4 is again to revise downward ourestimate of the 3rd grade effects from the 3rd order specification. The preferred estimates are between .079(.046) and .121 (.038) standard deviations. Overall, the estimated effects of summer school for reading arepositive for all grades, although some of the standard errors are slightly larger and so admit a wide confidenceinterval that overlaps zero in some cases.
I note in passing the extreme sensitivity of results to different model specifications in cases where there is aweak first stage discontinuity in the probability of attending summer school. For Grade 7 summer school formath depicted in Fig. A1, for example, the estimated first stage discontinuity estimated from fitting a linearmodel on the restricted support is .12 (.048). Adding a quadratic term reduces the estimate of the 1st stagediscontinuity to .003 (.046). The resulting treatment effect estimates are wildly different, illustrating a potentialdanger in applying the RDD in cases where the first stage relationship is highly non-linear near the cutoff anddiscontinuity estimates are not robust.
The results of the preceding analysis are summarized in Table 5, which presents minimum distance averagesof all the robustly estimated effect sizes presented in Table 4. I present the averages of all the estimates usingeither a 3rd order specification or a linear specification for the for the restricted sample estimates in columns(1) and (3). Since these estimates are potentially biased by misspecification, however, I focus attention on theestimates derived from the model chosen by Schwarz criterion. For analyses on the full sample, the averageeffect of summer school for math attendance on math achievement is .121 standard deviations, with astandard error implying a confidence interval from about .075 to .167 standard deviations. While this is on thelow end of the interval suggested by Cooper et al.’s review, recall that this average masks significant andunexpected heterogeneity. Column two of the bottom row shows the average estimated effect of summerschool attendance for reading is nearly identical at .122 standard deviations, with a slightly larger confidenceband.
20In most cases, this subsample includes about half of the sample used for the estimates in columns 1 and 2.

ARTICLE IN PRESS
Table 5
Summary of effect size estimates minimum distance estimates of effect of summer school on math and reading achievement
Support restriction Full range jTest Score�Cutoff jp35
Polynomial order All 3rd order Schwarz selected models All linear Schwarz selected models
Effect of summer school attendance for math on 2002 math score
.199 .121 .153 .101
(.026) (.023) (.025) (.021)
Effect of summer school attendance for reading on 2002 reading score
.135 .122 .173 .136
(.039) (.028) (.038) (.032)
Note: All estimates represent minimum distance averages of estimates under ‘‘strong 1st stage discontinuity’’ in Table 4. Columns (1) and
(3) represent averages of the estimates of the same columns in Table 4. Column (2) averages the estimates from the models that maximize
the Schwarz criteria as described in the text in models run on the full range of the 2001 test score, denoted with daggers in the first
two columns of Table 4. Column (4) averages the estimates from the models that maximize the Schwarz criterion on models run restricting
the support of the test score distribution to 35 points above and below the cutoff score, denoted with daggers in the last three columns of
Table 4.
J.D. Matsudaira / Journal of Econometrics 142 (2008) 829–850844
5. Validity of the RDD
Overall, it is clear that the accountability policy in LUSDiNE causes students who barely fail either the 2001math or reading test to attend summer school at much higher rates than students who barely pass.Furthermore, barely failing students have higher subsequent achievement scores in both math and readingthan students barely passing. To the extent that these two groups of students are similar in the othercharacteristics that determine achievement outcomes, then these results imply that summer school raisesstudent achievement on math and reading exams by about .12 standard deviations. In this section, I presentseveral different pieces of evidence suggesting that this key identification condition is met.
As emphasized by Lee (2005), assignment to summer school around the pass–fail threshold should berandomized as long as test scores cannot be perfectly manipulated by students, teachers, etc. For example, ona test scored by a teacher we might worry that the teacher selects (presumably based on other unobservedindicators of high competence) some students scoring just below the threshold and adjusts their score to falljust above the cutoff. This could lead to biased (downward) estimates of the effect of summer school byleaving a relatively low-achieving group of students below the cutoff.
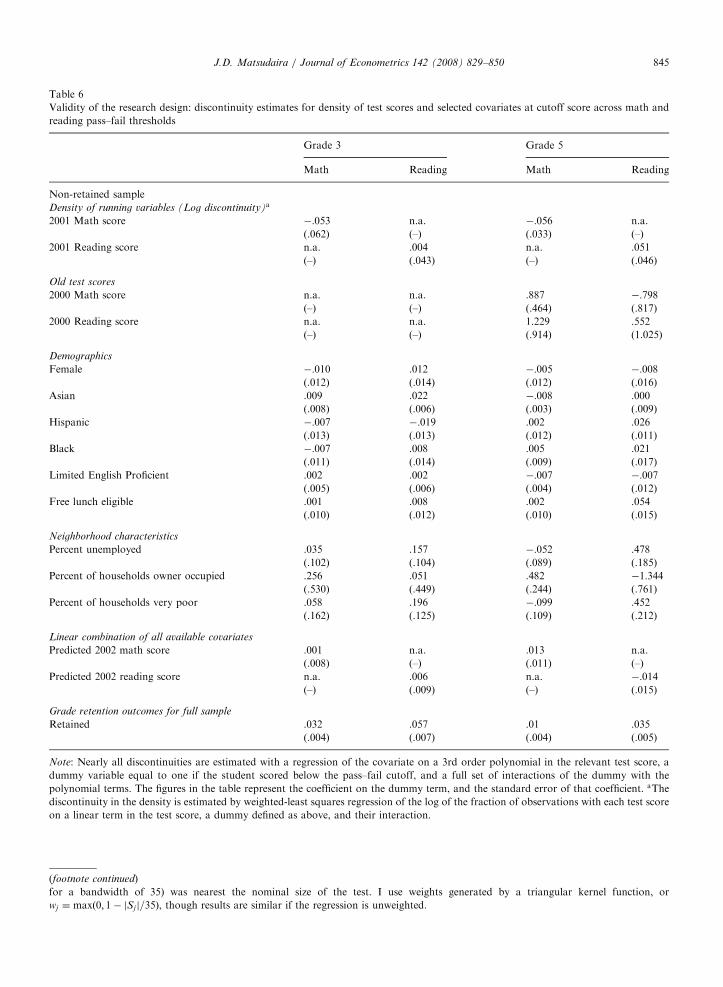
In the present case this seems quite unlikely. The achievement tests given at the end of the year arecomprised of many questions, and the completed test forms are scored by the test publisher outside of theschool. The room for students or teachers to finely manipulate test scores around the pass–fail cutoffs wouldthus seem narrow. Further, if such manipulation were taking place, it should be observable in a discontinuityin the density of baseline test scores at the pass–fail cutoff—in the example above there should be ‘‘missing’’scores just below the cutoff and a corresponding ‘‘hump’’ above. I test for a discontinuity in the densityfunction of math and reading test scores using a variant of a test proposed by McCrary (2004). Since thesupport of the test score distribution is discrete, I fit a linear term in the baseline test score, a dummy equal toone if a student fails, and their interaction to the log of the fraction of students with each baseline score usingweighted least squares regression.21 The first two rows of Table 6 confirm that no statistically significant
21The regression is run using only data within 35 points of the cutoff score. The discrete and sparse support of test scores militates
against using a bandwidth selection algorithm that requires the bandwidth to shrink with sample size—in the limit no observations will be
included in the regression. The 35-point ‘‘bandwidth’’ is chosen so that a reasonable number of points of support (at least 8) are included
on either side of the cutoff and is supported by the results of Monte Carlo experimentation. Using 5th grade reading as a test case, I
generated 10,000 samples drawing from a normal distribution with the mean and variance observed in the data, and then binned the
generated scores in a way that closely replicated the discrete support of the actual test score data. I then applied the test for a discontinuity
in the density function using the method described here with different bandwidths, and chose the bandwidth where the actual size (5.23%
ARTICLE IN PRESS
Table 6
Validity of the research design: discontinuity estimates for density of test scores and selected covariates at cutoff score across math and
reading pass–fail thresholds
Grade 3 Grade 5
Math Reading Math Reading
Non-retained sample
Density of running variables (Log discontinuity)a
2001 Math score �:053 n.a. �:056 n.a.
(.062) (–) (.033) (–)
2001 Reading score n.a. .004 n.a. .051
(–) (.043) (–) (.046)
Old test scores
2000 Math score n.a. n.a. .887 �:798(–) (–) (.464) (.817)
2000 Reading score n.a. n.a. 1.229 .552
(–) (–) (.914) (1.025)
Demographics
Female �:010 .012 �:005 �:008(.012) (.014) (.012) (.016)
Asian .009 .022 �:008 .000
(.008) (.006) (.003) (.009)
Hispanic �:007 �:019 .002 .026
(.013) (.013) (.012) (.011)
Black �:007 .008 .005 .021
(.011) (.014) (.009) (.017)
Limited English Proficient .002 .002 �:007 �:007(.005) (.006) (.004) (.012)
Free lunch eligible .001 .008 .002 .054
(.010) (.012) (.010) (.015)
Neighborhood characteristics
Percent unemployed .035 .157 �:052 .478
(.102) (.104) (.089) (.185)
Percent of households owner occupied .256 .051 .482 �1:344(.530) (.449) (.244) (.761)
Percent of households very poor .058 .196 �:099 .452
(.162) (.125) (.109) (.212)
Linear combination of all available covariates
Predicted 2002 math score .001 n.a. .013 n.a.
(.008) (–) (.011) (–)
Predicted 2002 reading score n.a. .006 n.a. �:014(–) (.009) (–) (.015)
Grade retention outcomes for full sample
Retained .032 .057 .01 .035
(.004) (.007) (.004) (.005)
Note: Nearly all discontinuities are estimated with a regression of the covariate on a 3rd order polynomial in the relevant test score, a
dummy variable equal to one if the student scored below the pass–fail cutoff, and a full set of interactions of the dummy with the
polynomial terms. The figures in the table represent the coefficient on the dummy term, and the standard error of that coefficient. aThe
discontinuity in the density is estimated by weighted-least squares regression of the log of the fraction of observations with each test score
on a linear term in the test score, a dummy defined as above, and their interaction.
(footnote continued)
for a bandwidth of 35) was nearest the nominal size of the test. I use weights generated by a triangular kernel function, or
wj ¼ maxð0; 1� jSj j=35Þ, though results are similar if the regression is unweighted.
J.D. Matsudaira / Journal of Econometrics 142 (2008) 829–850 845

ARTICLE IN PRESSJ.D. Matsudaira / Journal of Econometrics 142 (2008) 829–850846
discontinuities are evident in the (log of the) test score densities for the baseline exams in math or reading ineither Grade 3 or 5.22
An implication of the assumption that the accountability policy creates local randomization of summerschool attendance at the pass–fail cutoffs is that all preset characteristics (that is, fixed at the time of the spring2001 exams) should be similar for the groups of students barely failing and barely passing the exams. While wecan never be certain that the unobservable characteristics of students satisfy this condition, the validity of thisassumption can be tested by ensuring that the conditional expectations of the observable characteristics do notvary discontinuously in the neighborhood of the cutoff score. Table 6 presents the results of estimating modelssimilar to (6) on selected covariates available in the data.
As seen in the table, the estimated discontinuities for nearly all of the demographic, SES, and neighborhoodcharacteristics are vanishingly small. It is particularly notable that average test scores one year prior to the2001 test are nearly identical: the greatest estimated difference is a 1.2 point (.02 standard deviations)difference in reading scores for students on either side of the 2001 math pass–fail cutoff.23 The greatest numberof significant differences are found for 5th graders around the reading cutoff score. Even in this case, however,the statistically significant estimates are generally quite small in magnitude—about a .5 percentage pointdifference in both zip-code level unemployment and very poor rates—with the exception of a 5.4 percentagepoint difference in the percent of students who are eligible for free lunch. In the case of independent covariates,we would expect about 5 percent of the discontinuity estimates to be statistically significantly different fromzero under the null hypothesis that all student characteristics are balanced. In the table, about 10 percent ofthe estimates are significant, though some covariates are clearly not independent: neighborhoodcharacteristics, for example, are all estimated by linking a student’s zip-code address to Census information.
As a final omnibus test of whether students near the pass–fail cutoff differ from each other in terms of theirobserved characteristics, the penultimate section of Table 6 presents the estimated discontinuities in thepredicted 2002 achievement scores as a function of 2001 test scores. The predicted values are generated from aregression of 2002 achievement scores on all of the available covariates24 excluding any functions of the 2001test scores (including Di) and whether a student attended summer school. These predicted values represent allthe information contained in the covariates that predict future achievement. As shown in the table, there isessentially no difference in students’ predicted performance at the cutoff score for either math or reading,demonstrating again that students above and below the threshold are nearly identical in terms of thecharacteristics that affect achievement. This provides further confidence in the assumption that theunobservable determinants of achievement may also be balanced.
An exception to the pattern of no differences among students barely above and below the cutoff is thatstudents, particularly in lower grades, who barely fail the end of year exams are slightly more likely to beretained in the following year. As explained above, the accountability policy in LUSDiNE required failingstudents to attend summer school and to retake similar achievement exams at the end of the summer.25
Students who did not pass those exams were at risk of being retained, and as Table 1 shows, about 18% and10%, respectively, of 3rd and 5th graders who attended summer school were forced to repeat the same grade.Implementation of this retention aspect of the policy, however, appears to have been rather lax. As a result,the discontinuity in the likelihood that a student was retained in the same grade due to being mandated ismuch smaller than the discontinuity in whether a student attends summer school.
22Similar results are found for both math and reading in the other grades, and the results are robust to increasing or decreasing the
bandwidth by 10 points. The lone exception is that for the 5th grade reading test, the estimates imply that students are 9.8% (standard
error: 4.1%) more likely to barely fail the test than to barely pass. There is not, however, consistent support for this finding in the pattern
of results for other grades and tests.232000 test scores are not available for 3rd graders since no exam is given in the 2nd grade.24The complete list of covariates includes indicators for student gender, racial and ethnic background, free lunch eligibility, whether
English is spoken at home, whether born abroad, and whether categorized as Limited English Proficient; information at the 3-digit zip-
code level on the fraction of single parents, percent unemployment, percent of housing units owner-occupied, and the percent of
households that are very poor in the students’ neighborhood; and previous year (2000) math and reading test scores only for students in
the 5th grade. All variables are entered linearly in the regression.25Unfortunately, I do not have data for the end of summer exams.
ARTICLE IN PRESSJ.D. Matsudaira / Journal of Econometrics 142 (2008) 829–850 847
The estimates of differential retention for Grades 3 and 5 are shown in the last row of Table 6. Compared tostudents barely passing the test, students barely failing the reading exam are 5.7 percentage points more likely torepeat the 3rd grade, and students barely failing math are 3.2 percentage points more likely to be retained. Similarresults are obtained in other grades, but the gap in grade retention across both math and reading thresholds isalways less than in the 3rd grade and is generally declines as the grade level increases—for 5th graders the gap isonly 1 percentage point. Of course, this discontinuity is natural given that LUSDiNE’s accountability policythreatens to retain those students who fail the baseline exams unless they pass similar tests at the end of thesummer. In other words, retention is an outcome of the policy, not a predetermined characteristic and this findingdoes not reject the hypothesis that summer school attendance is effectively randomized near the cutoff score.
Nonetheless, from the standpoint of measuring outcomes in the empirical analysis presented above, thisdifference in retention poses a potential problem. First, it implies that the treatment effect being identified bythe analysis is more complicated than that of attending summer school; it also captures the effect of repeatinga grade for a (small) fraction of students. A second issue is perhaps more important. If the norming of testswas done perfectly across years—i.e., a score of 650 on the 3rd grade math exam meant exactly the same thingin terms of achievement as a 650 on the 4th grade math exam—then the treatment effect just described couldstill be consistently estimated. If the norming is incorrect, however, then the metric used to measureachievement will change discontinuously at the pass–fail threshold, and so the RDD may fail to consistentlyestimate p1, and thus y. To avoid these complications, throughout the analysis presented above I droppedthese observations to prevent norming errors in exam scores across grade-levels from corrupting estimates.26
To the extent that students with baseline test scores near the threshold who are retained are systematically differentfrom those who are not retained, dropping these observations may bias estimates of the effect of summer school. Forexample, if students who barely failed the baseline exam and were retained had lower unobserved measures ofachievement, then we might expect retained students to score lower on the 2002 achievement tests than those whowere not retained even if their baseline scores were identical. Since slightly more students scoring just below thethreshold were retained and thus dropped from the analysis, this would mechanically raise the average test scores ofthe remaining group of students, making it appear as though summer school had a more positive impact.
To investigate the potential bias caused by this, I divide students into subgroups of students and estimatethe differential retention rates for each subgroup at the pass–fail cutoff. I then estimate the effect of summerschool attendance for each subgroup using the same methods as above. If retention outcomes aresystematically related to future achievement even within students with the same baseline test score, thensubgroups with higher retention discontinuities should have higher estimated effects of summer schoolattendance. In generating the discontinuities around the math (reading) cutoff score, I use different values ofthe reading (math) score to define subgroups. For example, referring back to Fig. 1 I calculate separateestimates of y and the discontinuity in the probability of retention across the math cutoff score separately forstudents with reading scores ¼ j, for j ¼ 7; 11; 15; . . . ; etc. I generate these pairs of p0 and y for Grades 3 and 5for each subject, and then compute demeaned values for the 4 grade � subject categories.
The resulting pairs of treatment effect and differential retention discontinuity estimates do not display a strong(linear) relationship with each other for either math or reading. The estimated slope from unweighted OLS regressionsthrough the data are .679 for reading and�:505 for math, but these estimates are quite noisy. Taking the estimates atface value, they imply that differential retention might bias the estimates above by up to .039 standard deviations (amaximum discontinuity in retention of .057 for 3rd grade reading, multiplied by .679) for the worst case scenario of3rd grade reading.27 Overall, then, the results presented in this section provide strong evidence that the estimatedeffects of summer school presented above are not confounded by other factors that may affect achievement.
6. Conclusion
The empirical results presented above point to several substantive conclusions about the impact of summerschool on achievement. The overall average effects presented in Table 5 are on the low end of Cooper et al.’s
26I note, however, that the results of the analysis are nearly identical if retained students are included.27An alternative explanation is that both the treatment effect of summer school for math (reading) and the effect of being mandated for
math on the probability of being retained are systematically related to a student’s reading (math) score in a way that masks (biases towards
zero) the effect of retention.

ARTICLE IN PRESSJ.D. Matsudaira / Journal of Econometrics 142 (2008) 829–850848
range, reinforcing their observation that the handful of studies that have employed randomized trials tend tofind much smaller effects of summer school than other studies. While the average effects are small, however,there is significant heterogeneity evident in the results. The measured impacts of summer school range from alow of �:03 standard deviations for 3rd graders in math summer school, to .24 standard deviations for 5thgraders for math.
Some of the findings presented above are at odds with the results of previous work in this area. For bothmath and reading, I find that students in higher grades benefit more from summer school attendance thanstudents in the 3rd grade. This may warrant further research, including replication of the results presented herein different years, to establish the robustness of the finding. If true, the common feature of manyaccountability policies of focusing on 3rd grade students may warrant reconsideration. The finding thatstudents appear to benefit equally for remedial education in math and reading is also at odds with previousstudies suggesting that reading interventions are less likely to be successful.
How credible are these results in demonstrating a positive role for summer school in boosting studentsachievement test scores? The analyses presented in Table 6 are convincing in demonstrating that studentsaround the pass–fail cutoff scores are nearly identical to one another in terms of the observed characteristicsthat might affect achievement. As a result, it seems reasonable to believe that the RDD has effectivelyrandomized summer school attendance near the cutoff with respect to predetermined student characteristics.
It is conceivable, however, that attending summer school is not the only ‘‘treatment’’ that is producing theachievement gains for students scoring just below the threshold. For example, it may be that failing exams perse has an effect of students by stigmatizing them as failures in the eyes of their peers and teachers. On the otherhand, it may be that parents become more involved in their student’s education if they learn that he or shefailed the exam and was mandated to summer school. While I know of no credible study documenting theexistence of these types of responses to being mandated to a program, it would seem that these effects cannotbe ruled out as an alternative mechanism (besides summer school) through which failing exams influencesstudent outcomes. To the extent that they are important, however, the reduced form estimates of the effect ofbarely failing the exams on achievement scores captures the combined effect of all these influences.
While further research will be necessary to rule out these competing hypotheses for the effects presented above,if taken at face value the results here suggest that summer school may be an exceptionally cost-effective way toraise student achievement. For students in higher grades, in some cases I estimate effect sizes on the order of one-fifth to one-quarter of a standard deviation of test scores. This is comparable to the .22 standard deviation effectsize found for reducing class size by one-third in the Project Star experiment (see, for example Krueger, 2002).Although rigorous studies of the economic costs of summer school are not available, a simple calculation suggeststhat the budgetary cost of summer school per student may be well less than half of the cost of class-sizereduction.28 The rather negative results for 3rd graders, however, should give us pause before endorsing continuedemphasis on the mandatory remedial summer school programs currently in place in nearly all the nation’s urbanschool districts. Further research should attempt to establish whether this negative finding was the result ofchance, or important evidence against summer school programs, at least for younger students.
Acknowledgments
I thank the editors and two anonymous referees for extremely helpful comments, as well as John DiNardo,Justin McCrary, Julie Cullen, Sheldon Danziger, Rebecca Blank, Mary Corcoran and Lai-Wan Wong fortheir continuous support on this project. I am also grateful to David Card, David Lee, and other participantsat the workshop ‘‘The Regression Discontinuity Method in Economics: Theory and Applications’’ in May2003 for many valuable insights and suggestions and to the National Poverty Center at the University ofMichigan for a grant to purchase the data for this project. I also thank the Spencer Foundation and theRobert Wood Johnson Foundation for financial support.
28Following a calculation in Krueger (2002), per pupil spending in LUSDiNE is about $13,000 per student, suggesting that reducing
class size by one-third would cost an additional $4,333 per student. By contrast, the per student budget of summer school in 2000 was
about $1,250. This calculation is imprecise and meant only to be broadly suggestive.
ARTICLE IN PRESSJ.D. Matsudaira / Journal of Econometrics 142 (2008) 829–850 849
Appendix A. Data
The data used for this paper is a subset of an administrative data set I obtained from LUSDiNE officialscontaining individual level data for all students in Grades 3 through 8 between 1999 and 2002 from LUSDiNEofficials. Multiple raw data files were merged across data sets and across years using unique (recoded) studentidentifiers. All together there is information for over 900,000 students and about two million student-years ontest scores and student and school characteristics.
For the purposes of this paper, I restrict attention to those students in Grades 3 through 7 whoseachievement outcomes were measured on either the spring 2001 math or reading tests and thus could havebeen subject to the promotion policy in the school year ending in spring 2001. This yields a starting sample ofabout 377,000 students, eliminating primarily students who are either special education or Limited EnglishProficient students and are exempt from the promotion policy. I further drop students without valid test scoresin both years (2001 and 2002) or students who took the math exam in a language other than English, whichresults in a sample of 338,608. The latter group is dropped because the distribution of test scores in 2001 has adifferent support than that for other students raising questions about the comparability of their scores. Thesestudents never comprise more than 3% of students in any grade. As the conditional expectations for indicatorvariables for each of these sample restrictions are smooth through the cutoff scores, these sample selectioncriteria should not introduce any bias into the results below (Fig. A1).
Fig. A1. Illustration of a weak first stage discontinuity: 7th grade summer school for math.
References
Card, D., Dobkin, C., Maestas, N., 2004. The impact of nearly universal insurance coverage on health care utilization and health:
Evidence from medicare. National Bureau of Economics Research Working Paper.
Cooper, H., 2001. Summer school: research-based recommendations for policy makers, SERVE Policy Brief.
Cooper, H., Charlton, K., Valentine, J.C., Muhlenbruck, L., 2000. Making the most of summer school: a meta-analytic and narrative
review. Monographs of the Society for Research in Child Development.
DiNardo, J., Lee, D.S., 2004. Economic impacts of new unionization on private sector employers: 1984–2001. Quarterly Journal of
Economics 119, 1383–1441.
Hahn, J., Todd, P., vander Klaauw, W., 2001. Identification and estimation of treatment effects with a regression discontinuity design.
Econometrica 69, 201–209.

ARTICLE IN PRESSJ.D. Matsudaira / Journal of Econometrics 142 (2008) 829–850850
Jacob, B.A., Lefgren, L., 2004. Remedial education and student achievement: a regression-discontinuity design. Review of Economics and
Statistics 86 (1), 226–244.
Krueger, A., 2002. Economic considerations and class size. National Bureau of Economics Research Working Paper.
Lee, D.S., 2005. Randomized experiments from non-random selection in U.S. house elections, mimeo, University of California, Berkeley.
Lee, D.S., Card, D., 2004. Regression discontinuity inference with specification error. Center for Labor Economics WP74, University of
California, Berkeley.
McCrary, J., 2004. Testing for manipulation of the running variable in the regression discontinuity design, Mimeo, University of
Michigan.
Porter, J., 2003. Estimation in the regression discontinuity model, unpublished mimeo, Harvard University.
Roderick, M., Engel, M., Nagaoka, J., 2003. Ending social promotion: results from summer bridge. Consortium on Chicago School
Research, Chicago.
Schwarz, G., 1978. Estimating the dimension of a model. The Annals of Statistics 6, 497–511.
Trochim, W., 1984. Research Design for Program Evaluation: the Regression-Discontinuity Approach. Sage Publications, Beverley Hills, CA.