mangubhai etal12 review bird's head seascape
TRANSCRIPT

This article appeared in a journal published by Elsevier. The attachedcopy is furnished to the author for internal non-commercial researchand education use, including for instruction at the authors institution
and sharing with colleagues.
Other uses, including reproduction and distribution, or selling orlicensing copies, or posting to personal, institutional or third party
websites are prohibited.
In most cases authors are permitted to post their version of thearticle (e.g. in Word or Tex form) to their personal website orinstitutional repository. Authors requiring further information
regarding Elsevier’s archiving and manuscript policies areencouraged to visit:
http://www.elsevier.com/copyright

Author's personal copy
Review
Papuan Bird’s Head Seascape: Emerging threats and challenges in the globalcenter of marine biodiversity
Sangeeta Mangubhai a,⇑, Mark V. Erdmann b,j, Joanne R. Wilson a, Christine L. Huffard b, Ferdiel Ballamu c,Nur Ismu Hidayat d, Creusa Hitipeuw e, Muhammad E. Lazuardi b, Muhajir a, Defy Pada f, Gandi Purba g,Christovel Rotinsulu h, Lukas Rumetna a, Kartika Sumolang i, Wen Wen a
a The Nature Conservancy, Indonesia Marine Program, Jl. Pengembak 2, Sanur, Bali 80228, Indonesiab Conservation International, Jl. Dr. Muwardi 17, Renon, Bali 80235, Indonesiac Yayasan Penyu Papua, Jl. Wiku No. 124, Sorong West Papua 98412, Indonesiad Conservation International, Jl. Kedondong Puncak Vihara, Sorong, West Papua 98414, Indonesiae World Wide Fund for Nature – Indonesia Program, Graha Simatupang Building, Tower 2 Unit C 7th-11th Floor, Jl. TB Simatupang Kav C-38, Jakarta Selatan 12540, Indonesiaf Conservation International, Jl. Batu Putih, Kaimana, West Papua 98654, Indonesiag University of Papua, Jl. Gunung Salju, Amban, Manokwari, West Papua 98314, Indonesiah University of Rhode Island, College of Environmental and Life Sciences, Department of Marine Affairs, 1 Greenhouse Road, Kingston, RI 02881, USAi World Wide Fund for Nature – Indonesia Program, Jl. Manggurai, Wasior, West Papua, Indonesiaj California Academy of Sciences, Golden Gate Park, San Francisco, CA 94118, USA
a r t i c l e i n f o
Keywords:Coral TriangleIndonesiaCoral reefsFisheriesSustainable developmentMarine protected areas
a b s t r a c t
The Bird’s Head Seascape located in eastern Indonesia is the global epicenter of tropical shallow watermarine biodiversity with over 600 species of corals and 1,638 species of coral reef fishes. The Seascapealso includes critical habitats for globally threatened marine species, including sea turtles and cetaceans.Since 2001, the region has undergone rapid development in fisheries, oil and gas extraction, mining andlogging. The expansion of these sectors, combined with illegal activities and poorly planned coastaldevelopment, is accelerating deterioration of coastal and marine environments. At the same time,regency governments have expanded their marine protected area networks to cover 3,594,702 ha ofislands and coastal waters. Low population numbers, relatively healthy natural resources and a strongtenure system in eastern Indonesia provide an opportunity for government and local communities to col-laboratively manage their resources sustainably to ensure long-term food security, while meeting theirdevelopment aspirations.
� 2012 Elsevier Ltd. All rights reserved.
1. Introduction
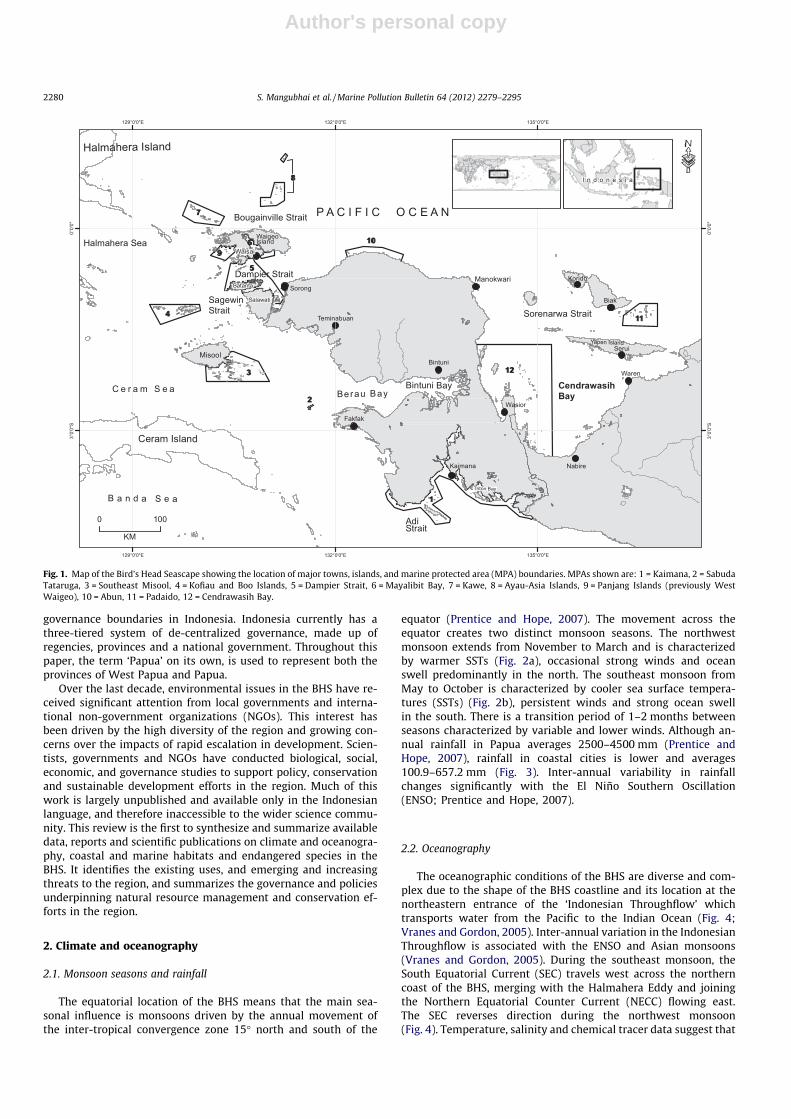
Located in the heart of the ‘Coral Triangle’, the Papuan Bird’sHead Seascape (BHS) in eastern Indonesia encompasses over22.5 million hectares of sea and small islands off the West PapuaProvince between the latitudes 4�050S–1�100N and longitudes129�140E–137�470E (Fig. 1). The BHS has the richest diversity of reeffish and coral species recorded in the world and is regarded bysome as the global epicenter of tropical shallow water marine bio-diversity (Veron et al., 2009; Allen and Erdmann, 2009, 2012). The
Seascape encompasses a diversity of habitats, including the highlyenclosed shallow Cendrawasih Bay, to shallow fringing, barrier,patch, lagoon and atoll reefs in Raja Ampat, to mangrove domi-nated coasts, rivers and inlets in Bintuni Bay. The Seascape also in-cludes critical habitats for globally threatened marine species,including sea turtles and cetaceans.
The boundaries of the BHS were delineated based on biogeo-graphic integrity, oceanic and genetic connectivity between reefareas, shared ecological characteristics and environmental factorsthat may explain how species are distributed (Green and Mous,2008). The geographic scale of this review is the Seascape becauseof its practicality for marine conservation strategies, particularlyfor the design and implementation of marine protected area(MPA) networks, and its adoption by the six countries of the CoralTriangle – Indonesia, Timor-Leste, Philippines, Malaysia, PapuaNew Guinea and the Solomon Islands (Coral Triangle Initiative,2009). The BHS boundaries fall primarily within the West Papuaprovince with only a small portion falling within the adjacentprovince of Papua. Therefore, BHs boundaries closely align with
0025-326X/$ - see front matter � 2012 Elsevier Ltd. All rights reserved.http://dx.doi.org/10.1016/j.marpolbul.2012.07.024
⇑ Corresponding author. Tel.: +62 361 287272; fax: +62 361 270737.E-mail addresses: [email protected] (S. Mangubhai), [email protected]
com (M.V. Erdmann), [email protected] (J.R. Wilson), [email protected](C.L. Huffard), [email protected] (F. Ballamu), [email protected] (N.I.Hidayat), [email protected] (C. Hitipeuw), [email protected] (M.E. La-zuardi), [email protected] ( Muhajir), [email protected] (D. Pada), [email protected] (G. Purba), [email protected] (C. Rotinsulu),[email protected] (L. Rumetna), [email protected] (K. Sumolang), [email protected] (W. Wen).
Marine Pollution Bulletin 64 (2012) 2279–2295
Contents lists available at SciVerse ScienceDirect
Marine Pollution Bulletin
journal homepage: www.elsevier .com/locate /marpolbul
Author's personal copy
governance boundaries in Indonesia. Indonesia currently has athree-tiered system of de-centralized governance, made up ofregencies, provinces and a national government. Throughout thispaper, the term ‘Papua’ on its own, is used to represent both theprovinces of West Papua and Papua.
Over the last decade, environmental issues in the BHS have re-ceived significant attention from local governments and interna-tional non-government organizations (NGOs). This interest hasbeen driven by the high diversity of the region and growing con-cerns over the impacts of rapid escalation in development. Scien-tists, governments and NGOs have conducted biological, social,economic, and governance studies to support policy, conservationand sustainable development efforts in the region. Much of thiswork is largely unpublished and available only in the Indonesianlanguage, and therefore inaccessible to the wider science commu-nity. This review is the first to synthesize and summarize availabledata, reports and scientific publications on climate and oceanogra-phy, coastal and marine habitats and endangered species in theBHS. It identifies the existing uses, and emerging and increasingthreats to the region, and summarizes the governance and policiesunderpinning natural resource management and conservation ef-forts in the region.
2. Climate and oceanography
2.1. Monsoon seasons and rainfall
The equatorial location of the BHS means that the main sea-sonal influence is monsoons driven by the annual movement ofthe inter-tropical convergence zone 15� north and south of the
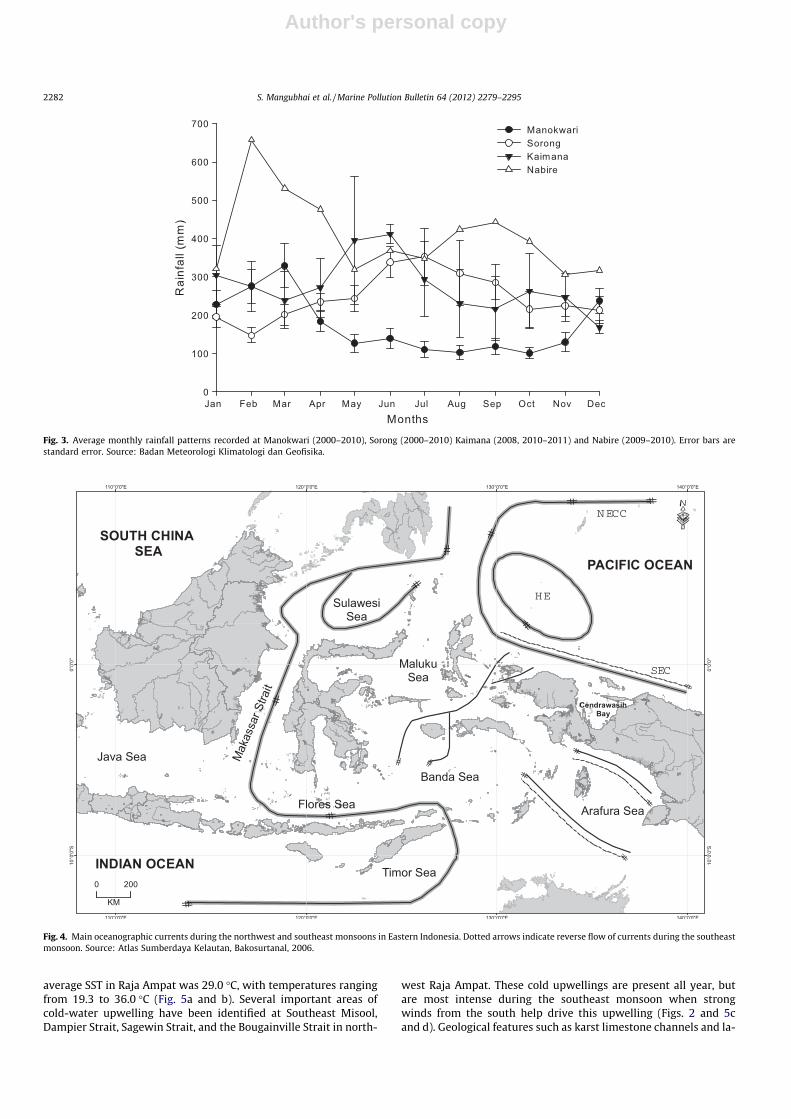
equator (Prentice and Hope, 2007). The movement across theequator creates two distinct monsoon seasons. The northwestmonsoon extends from November to March and is characterizedby warmer SSTs (Fig. 2a), occasional strong winds and oceanswell predominantly in the north. The southeast monsoon fromMay to October is characterized by cooler sea surface tempera-tures (SSTs) (Fig. 2b), persistent winds and strong ocean swellin the south. There is a transition period of 1–2 months betweenseasons characterized by variable and lower winds. Although an-nual rainfall in Papua averages 2500–4500 mm (Prentice andHope, 2007), rainfall in coastal cities is lower and averages100.9–657.2 mm (Fig. 3). Inter-annual variability in rainfallchanges significantly with the El Niño Southern Oscillation(ENSO; Prentice and Hope, 2007).
2.2. Oceanography
The oceanographic conditions of the BHS are diverse and com-plex due to the shape of the BHS coastline and its location at thenortheastern entrance of the ‘Indonesian Throughflow’ whichtransports water from the Pacific to the Indian Ocean (Fig. 4;Vranes and Gordon, 2005). Inter-annual variation in the IndonesianThroughflow is associated with the ENSO and Asian monsoons(Vranes and Gordon, 2005). During the southeast monsoon, theSouth Equatorial Current (SEC) travels west across the northerncoast of the BHS, merging with the Halmahera Eddy and joiningthe Northern Equatorial Counter Current (NECC) flowing east.The SEC reverses direction during the northwest monsoon(Fig. 4). Temperature, salinity and chemical tracer data suggest that
Fig. 1. Map of the Bird’s Head Seascape showing the location of major towns, islands, and marine protected area (MPA) boundaries. MPAs shown are: 1 = Kaimana, 2 = SabudaTataruga, 3 = Southeast Misool, 4 = Kofiau and Boo Islands, 5 = Dampier Strait, 6 = Mayalibit Bay, 7 = Kawe, 8 = Ayau-Asia Islands, 9 = Panjang Islands (previously WestWaigeo), 10 = Abun, 11 = Padaido, 12 = Cendrawasih Bay.
2280 S. Mangubhai et al. / Marine Pollution Bulletin 64 (2012) 2279–2295

Author's personal copy
some of the SEC flows south past Raja Ampat into the Ceram andHalmahera Seas (Gordon and Fine, 1996). Some waters howevermove between the Raja Ampat islands where complex coastlines,deep channels and strong tidal currents create local eddies and tur-bulence (Gordon and Fine, 1996; DeVantier et al., 2009) and likelypromote good larval connectivity among reefs (Crandall et al.,2008; DeBoer et al., 2008). In contrast to these strong and complexcurrents, Cendrawasih Bay is relatively enclosed with limited ex-
change with the SEC, which likely promotes larval retention(Crandall et al., 2008; DeBoer et al., 2008).
2.3. Temperature and salinity patterns
Ninety-eight in situ temperature loggers (HOBO ProV2) installedin the BHS across a wide range of coral reef habitats showedmarked geographic and seasonal differences in SSTs (Fig. 5). The
Fig. 2. Broad scale seasonal sea surface temperature (SST) patterns in the Bird’s Head Seascape. SST data at 4 km-weekly resolution (Heron et al., 2010), based uponPathfinder Version 5.0 SST data (Kilpatrick et al., 2001), were averaged to produce seasonal mean temperatures (a) November to March; and (b) May to October for the period1985–2009. Data deep within enclosed bays were masked in the images (gray color) due to the reduced confidence in gapfilled data quality, related to extended cloud periodsregularly experienced in the region (particularly during November to March).
S. Mangubhai et al. / Marine Pollution Bulletin 64 (2012) 2279–2295 2281
Author's personal copy
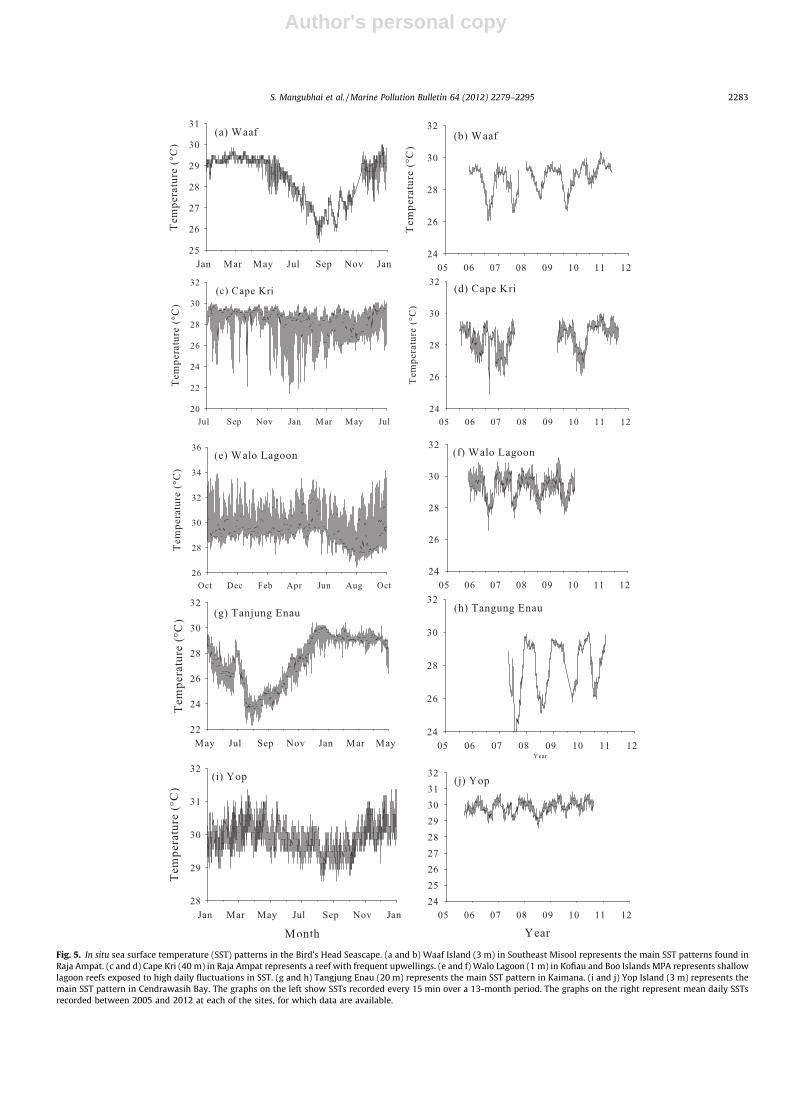
average SST in Raja Ampat was 29.0 �C, with temperatures rangingfrom 19.3 to 36.0 �C (Fig. 5a and b). Several important areas ofcold-water upwelling have been identified at Southeast Misool,Dampier Strait, Sagewin Strait, and the Bougainville Strait in north-
west Raja Ampat. These cold upwellings are present all year, butare most intense during the southeast monsoon when strongwinds from the south help drive this upwelling (Figs. 2 and 5cand d). Geological features such as karst limestone channels and la-
Fig. 3. Average monthly rainfall patterns recorded at Manokwari (2000–2010), Sorong (2000–2010) Kaimana (2008, 2010–2011) and Nabire (2009–2010). Error bars arestandard error. Source: Badan Meteorologi Klimatologi dan Geofisika.
Fig. 4. Main oceanographic currents during the northwest and southeast monsoons in Eastern Indonesia. Dotted arrows indicate reverse flow of currents during the southeastmonsoon. Source: Atlas Sumberdaya Kelautan, Bakosurtanal, 2006.
2282 S. Mangubhai et al. / Marine Pollution Bulletin 64 (2012) 2279–2295
Author's personal copy
Fig. 5. In situ sea surface temperature (SST) patterns in the Bird’s Head Seascape. (a and b) Waaf Island (3 m) in Southeast Misool represents the main SST patterns found inRaja Ampat. (c and d) Cape Kri (40 m) in Raja Ampat represents a reef with frequent upwellings. (e and f) Walo Lagoon (1 m) in Kofiau and Boo Islands MPA represents shallowlagoon reefs exposed to high daily fluctuations in SST. (g and h) Tangjung Enau (20 m) represents the main SST pattern in Kaimana. (i and j) Yop Island (3 m) represents themain SST pattern in Cendrawasih Bay. The graphs on the left show SSTs recorded every 15 min over a 13-month period. The graphs on the right represent mean daily SSTsrecorded between 2005 and 2012 at each of the sites, for which data are available.
S. Mangubhai et al. / Marine Pollution Bulletin 64 (2012) 2279–2295 2283
Author's personal copy
goons in some parts of Raja Ampat highly restrict water circulationwhere dramatic heating occurs during the day and cooling at night(Fig. 5e and f). Mayalibit Bay experiences temperatures rangingfrom 28.0 to 34.1 �C, and intertidal reef flats in Raja Ampat are alsoexposed to wide temperature swings of 7–8 �C on a daily basis.
The Kaimana region is on average significantly cooler than RajaAmpat (average temperature of 28.1 �C), with a recorded range of22.3–30.9 �C (Fig. 5g and h). This southern region showed a strongseasonality of SST fluctuations, with cold-water upwellings prom-inent during the southeast monsoon period (Fig. 2). These coldupwellings coincide with increased chlorophyll-a and primary pro-ductivity in Kaimana’s coastal and marine waters and further southto the Arafura Sea (see Fig. 3b in Gordon, 2005). Biak, Manokwariand Cendrawasih Bay showed a much less variable temperature re-gime in the eastern BHS, with SSTs staying between 29.4 and30.0 �C for most of the year (Fig. 5i and j).
3. Coastal and marine habitats and ecosystems
3.1. Mangrove forests
Coastal areas and islands in the BHS have a range of forest types– sago, palm and mixed swamps, mangrove wetlands, sub-mon-tane and primary lowland rain forests. Papua contains the world’smost extensive and diverse mangrove communities (Alongi, 2007;Spalding et al., 2010) and more than half of Indonesia’s 40,000 km2
of mangroves. Many of these mangrove stands are still in good con-dition, although increasing development and mining are now
significant threats (Alongi, 2007). Mangrove forests are a valuablesource of firewood, timber and traditional medicines for local Pap-uan communities. Within the BHS, 35 species of mangrove havebeen recorded (Huffard et al., 2009). The region’s most extensivemangrove forest (450,000 ha) that contains old growth mangrovestands, occurs in Bintuni Bay (Alongi, 2007; Gandi et al., 2008), partof which is designated as a National Nature Reserve. Other signif-icant mangrove stands occur on the eastern coast of CendrawasihBay and the western coastline of the Bird’s Head around Kaimana(Alongi, 2007). In Raja Ampat, mangroves are considered sparsecompared to mainland communities, although these are quite di-verse with 25 species recorded from fringing and estuarine man-grove communities (Firman and Azhar, 2006). The fauna ofPapuan mangroves is poorly known and there are little data onthe current status of mangrove forests throughout the BHS.
3.2. Seagrass beds
The BHS lies in the center of biodiversity for seagrass (Shortet al., 2007), with 11 species reported by McKenzie et al. (2007).Little is known about the distribution, ecology or condition of sea-grass beds in this region. Seagrass occurs in four main habitat types– estuarine, coastal, reef flats and deep water. Deep water seagrass-es are the least understood but nonetheless ecologically important;they are generally dominated by Halophila, the main genus eatenby dugongs (McKenzie et al., 2007). Cendrawasih Bay has extensivelagoonal seagrass beds in the southwestern area of the Bay whichwere reported to support dugongs (Petocz, 1989). In Raja Ampat,
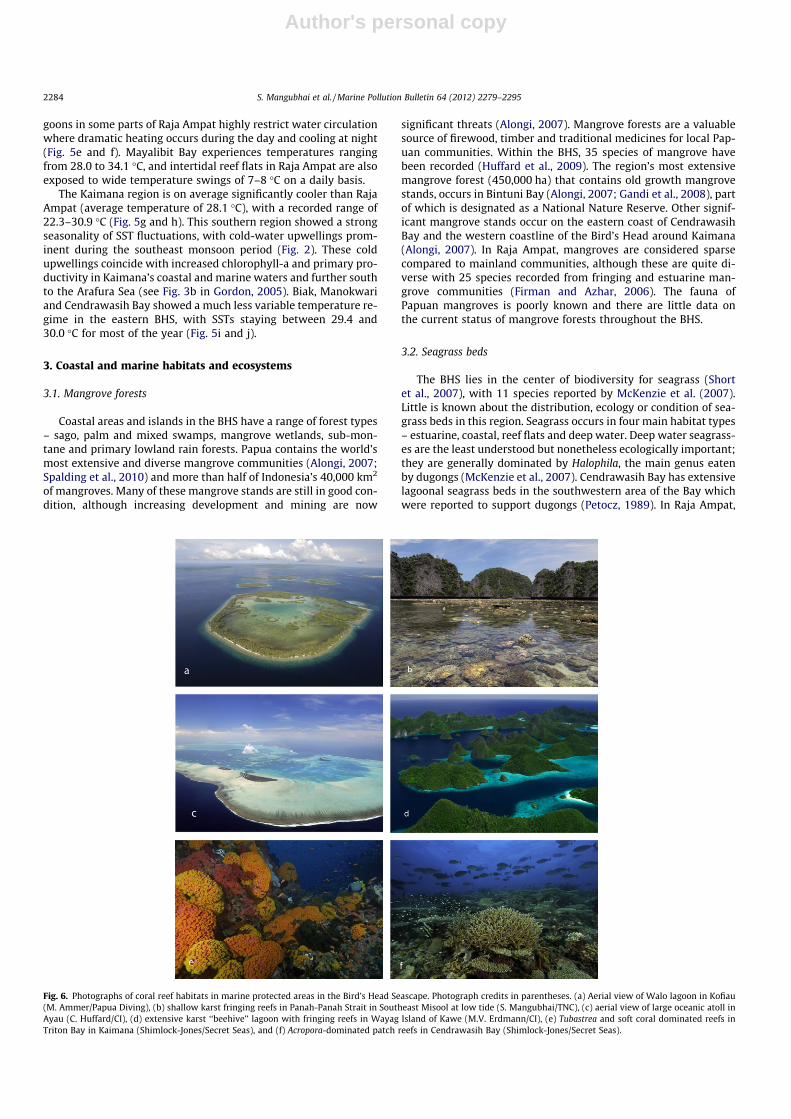
Fig. 6. Photographs of coral reef habitats in marine protected areas in the Bird’s Head Seascape. Photograph credits in parentheses. (a) Aerial view of Walo lagoon in Kofiau(M. Ammer/Papua Diving), (b) shallow karst fringing reefs in Panah-Panah Strait in Southeast Misool at low tide (S. Mangubhai/TNC), (c) aerial view of large oceanic atoll inAyau (C. Huffard/CI), (d) extensive karst ‘‘beehive’’ lagoon with fringing reefs in Wayag Island of Kawe (M.V. Erdmann/CI), (e) Tubastrea and soft coral dominated reefs inTriton Bay in Kaimana (Shimlock-Jones/Secret Seas), and (f) Acropora-dominated patch reefs in Cendrawasih Bay (Shimlock-Jones/Secret Seas).
2284 S. Mangubhai et al. / Marine Pollution Bulletin 64 (2012) 2279–2295
Author's personal copy
the islands of Sayang, Kawe, Waigeo, Batanta and Salawati, as wellas several smaller islands support seagrass beds that are importantforaging sites for green turtles and habitat for rabbitfish (Sigani-dae), an important subsistence and small scale commercial fisheryfor local communities (Firman and Azhar, 2006; McKenzie et al.,2007). In the eastern BHS, extensive seagrass beds are foundaround Biak, Padaido and Yapen Islands, while in the south bedsare found in Arguni, Kayumerah and Etna Bays near Kaimana.The most significant threats to seagrass in the BHS are deforesta-tion and coastal development causing increased turbidity and sed-imentation from runoff, as well as reclamation of shallow coastalhabitats that smothers seagrass beds.
3.3. Coral reefs
The BHS boasts the highest diversity of corals, reef fishes andstomatopods in the world (Veron et al., 2009; Huffard et al., 2009;
Allen and Erdmann, 2009, 2012). Surveys have recorded over 577described species of scleractinian corals (75% of the world’s total),with individual reefs hosting up to 280 species per hectare (Veronet al., 2009; Wallace et al., 2011). An additional 25–40 unde-scribed coral species have also been collected, such that the totalscleractinian diversity in the BHS is expected to exceed 600 spe-cies once taxonomic work is completed on these collections (L.DeVantier and E. Turak, personal communication). Within theBHS the highest diversity of corals has been recorded in Raja Am-pat, with 553 known species (Veron et al., 2009). Two rapid eco-logical assessments conducted in 2001 and 2002 in Raja Ampatalso recorded 41 of the 90 Alcyonacean (soft coral) genera and699 mollusc species (McKenna et al., 2002; Donnelly et al.,2003), while more recent studies have documented 57 reef-asso-ciated stomatopod species in the BHS, four of which are consid-ered endemic to the region (Huffard et al., 2009). Corals havebeen found to 160m depth in Raja Ampat, though those beyond
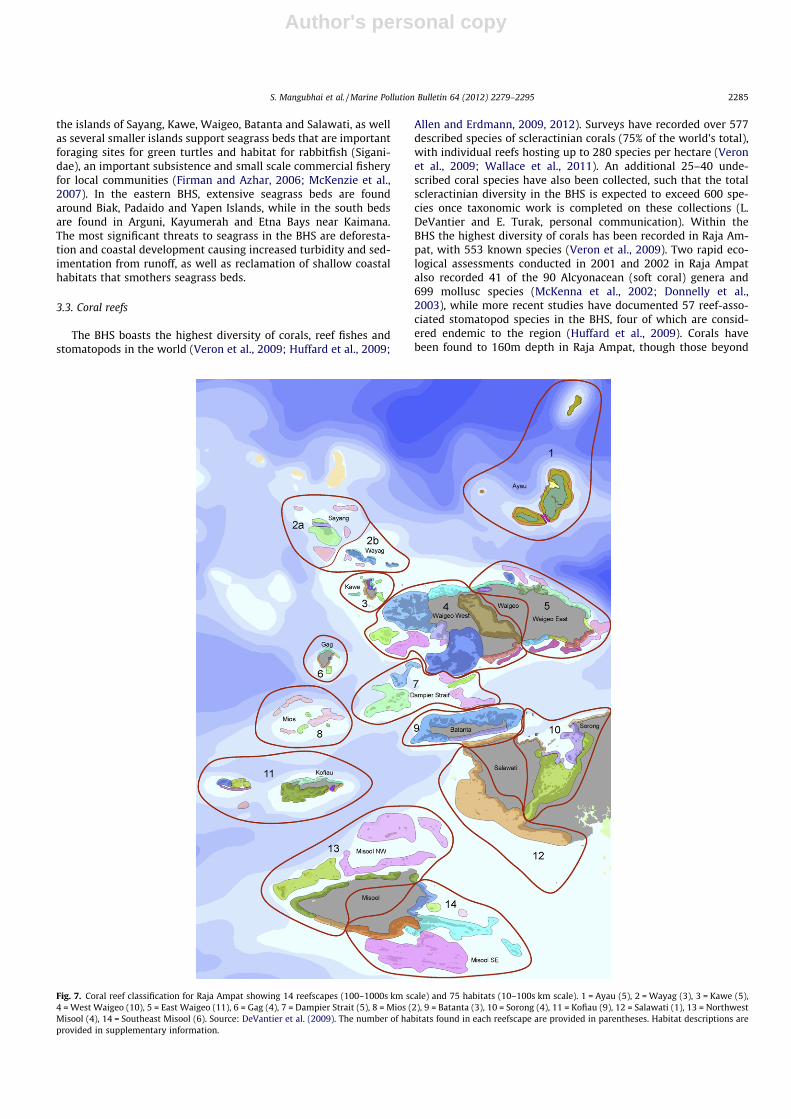
Fig. 7. Coral reef classification for Raja Ampat showing 14 reefscapes (100–1000s km scale) and 75 habitats (10–100s km scale). 1 = Ayau (5), 2 = Wayag (3), 3 = Kawe (5),4 = West Waigeo (10), 5 = East Waigeo (11), 6 = Gag (4), 7 = Dampier Strait (5), 8 = Mios (2), 9 = Batanta (3), 10 = Sorong (4), 11 = Kofiau (9), 12 = Salawati (1), 13 = NorthwestMisool (4), 14 = Southeast Misool (6). Source: DeVantier et al. (2009). The number of habitats found in each reefscape are provided in parentheses. Habitat descriptions areprovided in supplementary information.
S. Mangubhai et al. / Marine Pollution Bulletin 64 (2012) 2279–2295 2285

Author's personal copy
Tabl
e1
Bent
hic
cove
r(m
ean
±st
anda
rdde
viat
ion)
inm
arin
epr
otec
ted
area
s(M
PAs)
the
Bird
’sH
ead
Seas
cape
.No
data
are
avai
labl
efo
rre
efs
outs
ide
ofM
PAs.
Onl
yth
em
ost
rece
ntda
tais
pres
ente
dhe
re(y
ear)
.PIT
=po
int
inte
rcep
ttr
anse
ct(W
ilson
and
Gre
en,2
009)
,MT
=m
anta
tow
ing
(Eng
lish
etal
.,19
97).
PIT
surv
eys
wer
edo
neat
8–10
mde
pth
atal
lsi
tes.
N=
num
ber
ofsi
tes
sam
pled
,whe
reap
plic
able
.‘–’
mea
nsno
data
colle
cted
.
MPA
sM
eth
ods
Yea
rN
Hab
itat
(PIT
only
)H
ard
cora
lSo
ftco
ral
Cor
alli
ne
alga
eM
acro
alga
eR
ock
subs
trat
eR
ubb
leSa
nd
Dat
aso
urc
e
Kai
man
aM
T20
10–
15.2
±14
.2–
––
16.4
±14
.0a
9.9
±10
.041
.4±
29.1
CI
Sou
thea
stM
isoo
lPI
TPI
TM
T
2011
2009
2008
32 37 –
Frin
gin
gre
efs,
sem
i-ex
pose
d/se
mi-
shel
tere
dre
efs
40.9
±12
.544
.4±
16.2
16.1
±10
.2
11.2
±9.
210
.5±
10.5
13.2
±9.
9
5.0
±3.
87.
1±
5.8
–
4.7
±5.
88.
8±
10.1
3.7
±7.
8
16.2
±6.
29.
3±
7.7
34.0
±30
.9
12.4
±10
.711
.8±
10.2
17.4
±12
.8
2.9
±4.
22.
0±
5.3
13.9
±12
.4
TNC
Kofi
auan
dB
ooIs
lan
dsPI
TPI
TPI
TM
T
2011
2010
2009
2008
25 30 31 –
Frin
gin
gre
efs,
expo
sed
and
sem
i-ex
pose
d30
.8±
10.4
28.5
±15
.536
.0±
14.7
26.7
±17
.5
12.1
±7.
48.
2±
7.2
14.8
±9.
614
.8±
10.1
2.5
±2.
311
.1±
9.9
0.0
±0.
0–
4.2
±5.
14.
0±
5.4
3.9
±5.
24.
2±
5.3
14.0
±6.
43.
5±
4.1
9.2
±7.
217
.6±
18.8
13.7
±9.
816
.5±
15.6
18.7
±11
.810
.5±
9.4
14.7
±10
.214
.5±
11.5
8.8
±9.
126
.2±
24.3
TNC
Dam
pier
Stra
itb
PIT
PIT
MT
MT
2011
2010
2010
2008
21 33 – –
Frin
gin
gan
dpa
tch
reef
s,ex
pose
d,an
dse
mi-
expo
sed
24.4
±16
.023
.2±
13.8
27.4
±15
.624
.9±
12.0
15.8
±18
.59.
3±
13.8
– –
0.5
±1.
40.
7±
1.4
– –
1.7
±4.
51.
4±
2.9
– –
9.4
±13
.48.
4±
14.0
14.3
±9.
5a
21.0
±13
.9a
11.8
±14
.617
.6±
14.6
18.0
±10
.718
.9±
14.2
30.7
±26
.311
.2±
12.1
22.0
±17
.212
.1±
13.9
CI
May
alib
itB
ayb
PIT
MT
MT
2010
2010
2008
8 – –
Frin
gin
gba
rrie
ran
dpa
tch
reef
s,ex
pose
d,se
mi-
expo
sed,
and
shel
tere
d17
.4±
14.8
21.9
±15
.918
.8±
13.2
13.4
±11
.8– –
1.4
±2.
5– –
7.3
±12
.5– –
9.3
±10
.619
.2±
12.0
a
21.8
±15
.6a
17.7
±22
.211
.4±
10.1
9.5
±10
.4
24.0
±23
.322
.8±
23.8
26.8
±23
.6
CI
Kaw
ePI
TM
T20
1020
0818 –
Frin
gin
gre
efs,
expo
sed
and
sem
i-ex
pose
d30
.2±
20.1
20.6
±16
.715
.0±
16.7
–0.
6±
2.0
–9.
0±
14.7
–17
.4±
18.9
40.9
±22
.8a
12.1
±14
.88.
8±
11.9
14.8
±20
.112
.2±
15.8
CI
Raj
aA
mpa
tar
chip
elag
o(S
outh
wes
tW
aige
o)PI
TM
T20
1120
1114
Frin
gin
gan
dre
efs,
expo
sed
and
sem
i-ex
pose
d29
.3±
13.0
25.2
±14
.69.
0±
7.4
–1.
6±
3.9
–0.
6±
1.4
–6.
6±
5.3
15.7
±7.
8a24
.0±
17.8
19.9
±9.
925
.2±
13.9
25.7
±15
.0C
I
Aya
u-A
siab
PIT
PIT
MT
2010
2009
2007
20 10 –
Ato
llfr
ingi
ng
reef
s,ex
pose
d38
.1±
18.1
14.3
±7.
233
.6±
15.8
12.6
±13
.55.
4±
6.4
–
0.9
±1.
90.
0±
0.0
–
5.2
±8.
04.
6±
5.8
–
23.5
±15
.914
.7±
8.2
33.4
±17
.2a
23.3
±15
.914
.7±
8.2
33.4
±17
.2
4.8
±9.
23.
5±
6.1
5.3
±8.
3
CI
Cen
draw
asih
Bay
PIT
PIT
2011
2010
29 15Fr
ingi
ng
reef
s,ex
pose
d,se
mi-
expo
sed
and
shel
tere
d40
.5±
12.5
38.3
±14
.42.
5±
4.6
4.3
±5.
60.
2±
0.7
0.9
±1.
90.
6±
1.9
2.8
±3.
53.
4±
4.0
10.5
±5.
919
.2±
9.8
19.9
±11
.716
.1±
12.9
10.1
±13
.0W
WF
aFo
rC
Ida
taco
llec
ted
thro
ugh
man
tato
ws,
dead
cora
lw
aspl
aced
un
der
‘roc
ksu
bstr
ate’
inth
eta
ble.
bY
earl
ysu
rvey
sdo
not
repr
esen
tre
peat
mea
sure
sof
the
sam
esi
tes.
Dif
fere
nt
sect
ors
ofth
eM
PAs
wer
em
easu
red
indi
ffer
ent
year
s.
2286 S. Mangubhai et al. / Marine Pollution Bulletin 64 (2012) 2279–2295

Author's personal copy
the reaches of SCUBA remain uncharacterized (B. Robison, unpub-lished data).
Similarly, intensive survey work around the BHS over the lastdecade has recorded 1638 species of coral reef fishes comprising476 genera and 117 families (Allen and Erdmann, 2009, 2012).Within the BHS, the highest diversities have been recorded in RajaAmpat (1437 spp.), the Fakfak-Kaimana coast (1005 spp.) andCendrawasih Bay (965 spp.). Allen and Erdmann (2009) reporteda total of 26 endemic reef fish species (from 14 families) in theBHS, though more recent surveys have now increased this totalto 41 (Dimara et al., 2010; Allen and Erdmann, 2012). The factorsthat contribute to local endemism are thought to be in part associ-ated with the geological history of the region. For example, there isevidence that Cendrawasih Bay was isolated for a substantial per-iod over the past 5 million years, resulting in high local endemism(11 endemic reef fishes and 18 endemic reef-building corals cur-rently recognized), and significant genetic divergence of manymarine invertebrate populations in the Bay (DeBoer et al., 2008;Crandall et al., 2008; Wallace et al., 2011; Allen and Erdmann,2012).
The main reef types found in the region are fringing and patchreefs, and to a lesser extent seamounts, atolls and barrier reefs(Fig. 6; McKenna et al., 2002; WWF, 2003; Donnelly et al.,2003;). In Raja Ampat, published and unpublished informationand expert opinion on oceanography, bathymetry and physico-chemical parameters, habitats and distributions of coral communi-ties and reef fishes were used to develop a more detailed reef clas-sification comprising 14 broad scale reef types termed ‘reefscapes’(scale of 100–1000s km) and 75 reef habitats (scale of 10–100s km)(Fig. 7, Supplementary materials, DeVantier et al., 2009). Reefendemism is high, with 5–6% of all coral species and 2.5% of reeffish found only in this region (Allen and Erdmann, 2012).
Unlike many other parts of Indonesia and wider Southeast Asia(Burke et al., 2011), the coral reefs in the BHS are in a relativelyhealthy state. Reef health monitoring in 9 of the 12 BHS MPAsusing point intercept transect methods (Wilson and Green, 2009)showed average live hard coral cover ranged from 14.3% to 44.4%across all the MPAs (Table 1). Manta towing (English et al., 1997)covering a much wider area of the MPAs recorded average coralcover ranging from 15.2% to 33.6 across all the MPAs (Table 1).
The main threats to coral reefs are from destructive fishing suchas bomb, cyanide and compressor fishing, though this does not oc-cur to the same intensity or geographic spread as other parts ofIndonesia, and is mainly done by outside fishers frequenting thearea (McKenna et al., 2002; Ainsworth et al., 2008). There is no doc-umentation of major widespread crown-of-thorns starfish (Acanth-aster planci) outbreaks on reefs in the BHS. Damaged reefs in theBHS MPAs (based on percentage of rubble), ranged from 11.8% to24.0% and 8.8% to 33.4% in point intercept transect and manta tow-ing surveys, respectively (Table 1). Formal patrols with enforce-ment agencies and informal patrols with local communities have
been largely effective in reducing and in some case stoppingdestructive fishing in MPAs (TNC and CI, unpublished data). How-ever, overfishing continues and is largely uncontrolled (seeSection 5.2 for details) and poses a significant and growing threatto coral reefs.
3.4. Marine lakes
Marine lakes are land-locked water bodies that have a marinecharacter maintained by tidal fluctuations pushing seawaterthrough subterranean crevices or porous karst (Becking et al.,2009). At least 45 marine lakes have been identified in Raja Ampat,with the highest numbers occurring in Kawe and Southeast MisoolMPAs (Becking et al., 2009, 2011). These lakes vary in biophysicalparameters such as bathymetry, size, coastline, salinity, water tem-perature, pH and degree of connection to the sea, which results in avariety of biotic assemblages (Fig. 8; Becking et al., 2011). Faunaobserved in Raja Ampat’s lakes include corals, nudibranchs,shrimps, fish, bivalves, sponges (including a number of endemicspecies), ascidians, ctenophores, and jellyfish including Cassiopeia,Mastigias and Aurelia spp. (Becking et al., 2009). With the exceptionof six, all lakes in Raja Ampat are in a pristine state with littlethreats from invasive species or tourism activities (Becking et al.,2009, 2011). The majority of lakes in Raja Ampat do not have sting-less jellyfish and are difficult to access safely, which may focustourism and any impacts from tourism on just a few marine lakes(Becking et al., 2009).
3.5. Soft sediment communities
Soft sediment communities are well represented but poorlyunderstood in the BHS. Rodoliths, soft corals and sponges providelow-rugosity shelter covering up to 75% of substrata in some areas.Both black and white sand habitats exist in sheltered bays, covesand barrier habitats along Raja Ampat, the Wasior peninsula (par-ticularly the eastern coast) in Cendrawasih Bay, Bintuni Bay andthe greater Fakfak-Kaimana coast, especially Arguni, Etna and Tri-ton Bays. Preliminary ROV surveys of deeper waters (100–865 m)soft-sediment communities revealed a wide range of speciesincluding deep-sea frogfish, Oegopsid squid, chaetognaths andsiphonophores (B. Robison, personal communication).
4. Threatened and protected species
4.1. Turtles
Major nesting beaches for green (Chelonia mydas), hawksbill(Eretmochelys imbricata), olive ridley (Lepidochelys olivacea) andleatherback (Dermochelys coriacea) turtles are found on the coastsand small islands of the BHS. Among these are Indo-Pacific region-
Fig. 8. Marine lake in limestone karst in Raja Ampat (left photo, Muhajir/TNC). Stingless jellyfish (Mastigias sp.) found in marine lakes (right photo, C. Huffard/CI).
S. Mangubhai et al. / Marine Pollution Bulletin 64 (2012) 2279–2295 2287
Author's personal copy
ally significant nesting beaches for leatherback and olive ridley tur-tles at Jamursba-Medi and Wermon in Abun MPA; green turtles atPiai and Sayang Islands in Kawe MPA, Pisang Island in the SabudaTataruga MPA and Venu Island in the Kaimana MPA; and hawksbillturtles at Venu Island (WWF and Yayasan Penyu Papua, unpub-lished data; see also Tapilatu and Tiwari, 2007; Hitipeuw et al.,2007; Benson et al., 2007, 2011).
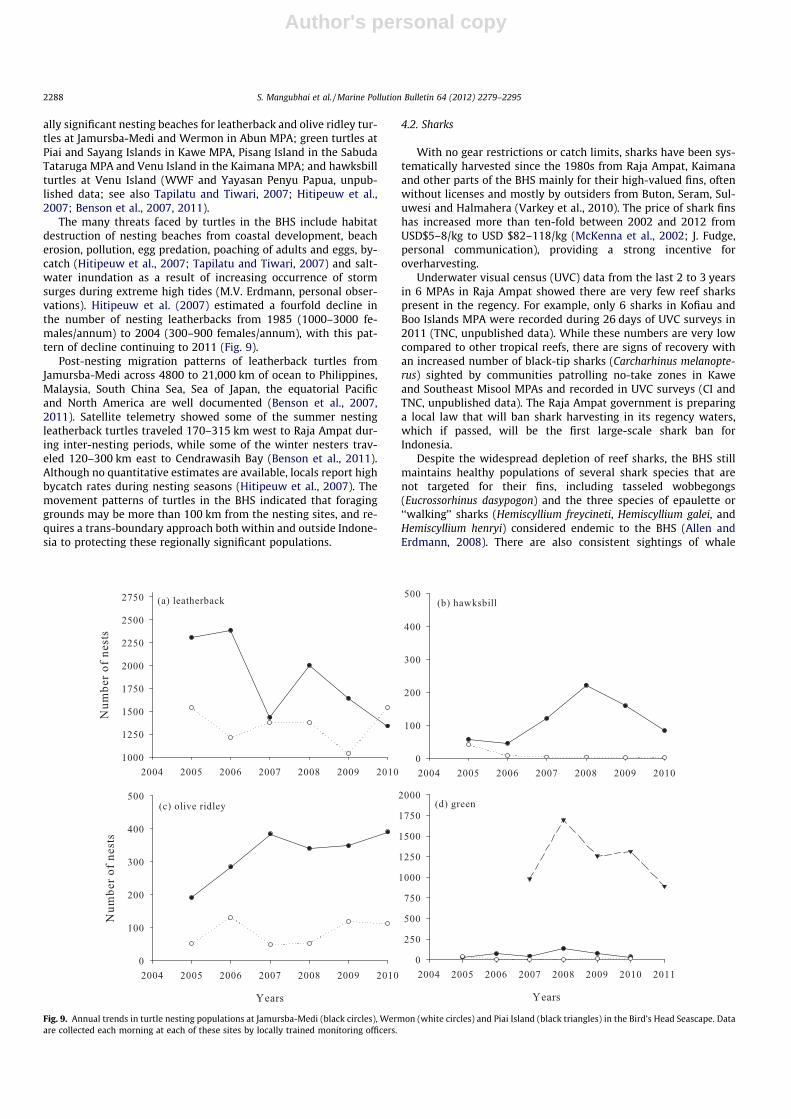
The many threats faced by turtles in the BHS include habitatdestruction of nesting beaches from coastal development, beacherosion, pollution, egg predation, poaching of adults and eggs, by-catch (Hitipeuw et al., 2007; Tapilatu and Tiwari, 2007) and salt-water inundation as a result of increasing occurrence of stormsurges during extreme high tides (M.V. Erdmann, personal obser-vations). Hitipeuw et al. (2007) estimated a fourfold decline inthe number of nesting leatherbacks from 1985 (1000–3000 fe-males/annum) to 2004 (300–900 females/annum), with this pat-tern of decline continuing to 2011 (Fig. 9).
Post-nesting migration patterns of leatherback turtles fromJamursba-Medi across 4800 to 21,000 km of ocean to Philippines,Malaysia, South China Sea, Sea of Japan, the equatorial Pacificand North America are well documented (Benson et al., 2007,2011). Satellite telemetry showed some of the summer nestingleatherback turtles traveled 170–315 km west to Raja Ampat dur-ing inter-nesting periods, while some of the winter nesters trav-eled 120–300 km east to Cendrawasih Bay (Benson et al., 2011).Although no quantitative estimates are available, locals report highbycatch rates during nesting seasons (Hitipeuw et al., 2007). Themovement patterns of turtles in the BHS indicated that foraginggrounds may be more than 100 km from the nesting sites, and re-quires a trans-boundary approach both within and outside Indone-sia to protecting these regionally significant populations.
4.2. Sharks
With no gear restrictions or catch limits, sharks have been sys-tematically harvested since the 1980s from Raja Ampat, Kaimanaand other parts of the BHS mainly for their high-valued fins, oftenwithout licenses and mostly by outsiders from Buton, Seram, Sul-uwesi and Halmahera (Varkey et al., 2010). The price of shark finshas increased more than ten-fold between 2002 and 2012 fromUSD$5–8/kg to USD $82–118/kg (McKenna et al., 2002; J. Fudge,personal communication), providing a strong incentive foroverharvesting.
Underwater visual census (UVC) data from the last 2 to 3 yearsin 6 MPAs in Raja Ampat showed there are very few reef sharkspresent in the regency. For example, only 6 sharks in Kofiau andBoo Islands MPA were recorded during 26 days of UVC surveys in2011 (TNC, unpublished data). While these numbers are very lowcompared to other tropical reefs, there are signs of recovery withan increased number of black-tip sharks (Carcharhinus melanopte-rus) sighted by communities patrolling no-take zones in Kaweand Southeast Misool MPAs and recorded in UVC surveys (CI andTNC, unpublished data). The Raja Ampat government is preparinga local law that will ban shark harvesting in its regency waters,which if passed, will be the first large-scale shark ban forIndonesia.
Despite the widespread depletion of reef sharks, the BHS stillmaintains healthy populations of several shark species that arenot targeted for their fins, including tasseled wobbegongs(Eucrossorhinus dasypogon) and the three species of epaulette or‘‘walking’’ sharks (Hemiscyllium freycineti, Hemiscyllium galei, andHemiscyllium henryi) considered endemic to the BHS (Allen andErdmann, 2008). There are also consistent sightings of whale
Fig. 9. Annual trends in turtle nesting populations at Jamursba-Medi (black circles), Wermon (white circles) and Piai Island (black triangles) in the Bird’s Head Seascape. Dataare collected each morning at each of these sites by locally trained monitoring officers.
2288 S. Mangubhai et al. / Marine Pollution Bulletin 64 (2012) 2279–2295

Author's personal copy
sharks (Rhincodon typus) in Cendrawasih Bay and Kaimana, oftenassociated with lift net (‘bagan’) fisheries that target anchovyaggregations. While whale sharks are sighted year round in Cen-drawasih Bay, it is not known if these represent a resident ormigratory population. In 2011, up to 26 whale sharks (ca. 8–10 m in length) at a time were sighted in Nabire regency in Cen-drawasih (C. Hitipeuw, personal observations), and 16 individualswere observed in the Iris Strait in Kaimana (D. Pada, personalobservations). The observed annual increase in the number of liftnet fishers operating in the BHS may impact upon these whaleshark populations through over-harvesting of their anchovy prey.
4.3. Whales and dolphins
Although there are few published studies of cetaceans in theBHS, short term surveys and long term incidental observationsindicate that this region is a cetacean ‘hotspot’ and supports di-verse and healthy populations for numerous species on the IUCNRed List. Of the 31 cetacean species recorded in Indonesian waters(Tomascik et al., 1997; Rudolf et al., 1997), 15 have been recordedin the BHS including Bryde’s, false killer, killer and sperm whales,and Indo Pacific humpback, pan tropical spotted and Fraser’s dol-phins (Rudolf et al., 1997; Kahn, 2007, 2009). Migratory speciessuch as baleen and sperm whales are sighted annually in Dampierand Sagewin Straits in Raja Ampat (Wilson et al., 2010a, TNC/CI,unpublished data). Frequent year-round sightings of Bryde’swhales from Raja Ampat south to Bintuni Bay (Kahn et al., 2006)and Triton Bay suggest resident populations (Kahn, 2009). Thishigh species diversity reflects the diversity and proximity of coast-al and oceanic habitats including seamounts and canyons – a con-sequence of the narrow continental shelves in this region (Kahn,2007).
Although cetaceans are protected from harvest in Indonesianwaters, they face increasing threats and stressors from ship strikes,entanglement in fishing nets, loss of coastal habitats and plasticpollution. One emerging threat to cetaceans in BHS is from under-sea mining and seismic testing. Extensive seismic testing occurredin Raja Ampat and Cendrawasih Bay in 2010 with numerous min-ing leases already granted over areas identified as migratory corri-dors or feeding grounds for cetaceans. Seismic surveys are knownto disrupt cetaceans and their natural migration and feeding pat-terns, and the animals can become displaced and may show avoid-ance or stress behavior estimated up to 7–12 km from a largeseismic source (McCauley et al., 2000).
4.4. Dugongs
Dugongs have been recorded in coastal areas throughout theBHS including Cendrawasih Bay, Biak and Padaido Islands, Kwati-sore Bay, Sorong, Raja Ampat, Bintuni Bayand the Fakfak-Kaimanacoast (Marsh et al., 2002; De Iongh et al., 2009; Kahn, 2009). In RajaAmpat, aerial surveys have shown that dugongs are widely distrib-uted around the main islands with sightings commonly reportedaround Salawati and Batanta Islands, east Waigeo Island, DampierStrait (particularly in southern Gam Island) and northern Misool,including offshore (Wilson et al., 2010a). Numerous sightings ofboth individuals and family groups of dugongs (5–10 animals)were recorded in eastern Waigeo, Batanta and western Salawati Is-lands (Wilson et al., 2010a) and should be a focus for conservationefforts. These sightings have increased the reported range of dug-ongs in West Papua and highlight the importance of protectingseagrass beds, particularly deep water beds dominated by Halophil-a/Halodule species, and reducing threats from fishing gears and ille-gal hunting.
4.5. Crocodiles
All four crocodile species found in Indonesia are protected un-der national law. Crocodiles have been hunted for their valuableskins in Papua since the colonial period, though very little dataare available on the distribution and status of populations in theBHS. Saltwater Crocodylus porosus and freshwater Crocodylusnovaeguineae populations have been documented in the Mambera-mo delta and Cendrawasih Bay in the northern BHS (WWF, 2003)as well as in Bintuni and Arguni Bays in the southern BHS, whileremnant populations of saltwater crocodiles have also been ob-served in Yapen, Mayalibit Bay, and Waigeo, Batanta and Misool is-lands. Recent coastal development, including the filling in ofbrackish streams and the destruction of nesting beaches for roadconstruction, is reducing available crocodile habitat in the BHS.
5. Resource use and threats to coastal and marine ecosystems
Despite having the highest marine biodiversity, the richest fish-eries resources, the most extensive intact lowland rainforests inIndonesia, and vast energy reserves in the oil and gas sectors, theBHS has the highest levels of poverty in the country (Resosudarmoand Jotzo, 2009). Over 40% of the 761,000 people living in the BHSfall below the poverty line (2010 census, Central Statistics Agency).Since the early 1960s the Indonesian government has imple-mented transmigration programs to encourage families from over-populated islands in Indonesia, to settle in West Papua and Papuaprovinces and develop an export agricultural sector (Petocz, 1989;GRM International, 2009). The region exports small quantities ofcrops such as palm oil, nutmeg, cacao and coffee, but the main re-sources are fish, primary forest timber and rich deposits of oil, gasand minerals. Economic growth rates are very high in the region,averaging 10% per annum from 2001 to 2005 (GRM International,2009); unfortunately this is driven primarily by migrant workersand the indigenous Papuan communities see little benefit from thisgrowth (Resosudarmo and Jotzo, 2009).
While coastal and marine ecosystems here are no longer pris-tine and the fishery stocks of some areas are severely depleted –in some cases up to an order of magnitude decline since the1970s (Ainsworth et al., 2008) – low human population densityand environmental factors have kept them relatively healthy com-pared to many other areas of Southeast Asia (Ainsworth et al.,2008; Burke et al., 2011). However, unsustainable exploitation—both legal and illegal—of natural resources, irresponsible develop-ment practices, and the BHS’s rapid human population growth rate(5.5% per year, 2010 census, Central Statistics Agency), threaten thehealth of these ecosystems and the local communities who dependon them. The following section provides a summary of resourceuses and threats to coastal and marine ecosystems in the BHS.
5.1. Fisheries
Fisheries provide a main source of income and food to coastalpeople throughout the BHS (e.g. Larsen et al., 2011). Traditionalsubsistence fishing – predominantly using handlines from smallcanoes – was the only form of fishing in the region prior to the1960s and is still extensively practiced today. The introduction ofcommercial fisheries – both legal and illegal – in the 1960s her-alded a rapid decline in fishery resources due to over-exploitation(Palomares et al., 2007). The introduction of destructive fishingmethods such as bomb fishing, cyanide and compressor fishingin the 1980s further contributed to the decline of fishery resources.By the 1990s some fisheries were reporting a decline of up to 90%in catch per unit effort (Ainsworth et al., 2008). While the use ofdestructive fishing methods has been curtailed by the arrival of
S. Mangubhai et al. / Marine Pollution Bulletin 64 (2012) 2279–2295 2289
Author's personal copy
conservation NGOs in the early 2000s and outreach campaigns onthe impacts of destructive fishing, the underlying social and eco-nomic climate which promotes illegal, unregulated and unreported(IUU) fisheries continues throughout Indonesia (Heazle and Butch-er, 2007).
Despite fishing being the primary livelihood of coastal people inthe BHS, there is little published or current data on how much thissector contributes to the local economy and how much money isgenerated as a local tax income for regency and provincial govern-ments. In the BHS, there is a diverse base of fisheries includinginvertebrates (sea cucumber, Trochus, giant clams, lobster), liftnet fisheries (anchovy, sardine and squids), reef fisheries (snapperand grouper), coastal and pelagic shark fisheries, and small andlarge pelagic fisheries (Indian and Spanish mackerel, big-eye tuna,skipjacks and trevally species). Large shrimp fisheries operate inBintuni Bay which have increased in intensity since the 1990s asa result of an increase in the number and size of boats and theintroduction of improved catch techniques and technology (Pet-Soede et al., 2006). Most fishing gears are used in the BHS includingfactory trawling along the Fakfak-Kaimana coastline, a gear typethat is illegal thoughout Indonesia except in the Arafura Sea.
The live reef fish trade has operated in the BHS since the 1980stargetting larger grouper species, snappers and Napoleon wrasse(Cheilinus undulatus) (Sadovy and Liu, 2004). This fishery has beenparticularly devastating because of the practice of targettingspawning aggregations and its inherent boom-and-bust nature(Mangubhai et al., 2011). The use of cyanide and compressor byboth local and outside fishers, particularly from Sulawesi, hascaused the rapid decline in Napoleon wrasse in Raja Ampat from1985 to the late 1990s (Sadovy and Liu, 2004). During this period,local fishers could not stop outsiders from using destructive fishingmethods, as boats were often accompanied by military or policeofficers. To date, only one significant grouper spawning aggrega-tion (>300 individuals) has been recorded in the BHS in Raja Ampat(Wilson et al., 2010b). This remaining aggregation is now closed tofishing but remains vulnerable to over-exploitation by adjacentfisheries in migratory corridors during spawning seasons. This pat-tern of exploitation is consistent with those recorded across Indo-nesia, where grouper spawning aggregations have largelydisappeared (Wilson et al., 2010b; Mangubhai et al., 2011). Currentefforts by the Indonesian government to finally regulate this fish-ery, particularly for slow growing species, may be ineffective.
An assessment of fish stocks versus reported fish catches in RajaAmpat estimated that illegal, unreported and unregulated (IUU)fishing accounted for more than 20% of reef fisheries catches (Var-key et al., 2010). Fisheries with more than 50% of the catch esti-mated as IUU include shark, tuna, and anchovy (see Table 1 inVarkey et al., 2010), with IUU fisheries valued at USD $40 millionin 2006. Anchovy are caught using lift nets (bagan) and in somecases mesh sizes are so fine that the catch consists primarily ofjuveniles. This unregulated fishery produces hundreds of tonnesof fish which are either dried for human consumption or used aslive bait for tuna fisheries. A study of the lift net fishery in onebay in Raja Ampat estimated that 2493–4468 tonnes of anchovywere caught each year with a total value of USD $1.2–2.1 million(Bailey et al., 2008). These types of operations are commonthroughout Indonesia and are largely operated by outside fishersfrom Sulawesi or other parts of Indonesia. Other than the loss ofpotential revenue for the local government, the effects of unregu-lated harvest of the base of the food chain is likely to impact notonly the productivity of larger prey species such as tuna but alsoendangered species such as baleen whales that frequent the area.
Overall, there is little information on current fisheries trends inthe BHS with almost all fisheries operating in the absence of criticalinformation on stocks, few management regulations and little orsporadic enforcement. Pelagic fisheries in northern BHS and
shrimp fisheries in southern BHS are already considered overexploited by the Indonesian government. While there is a growinginterest in applying ecosystem based approaches to fisheries man-agement in Indonesia, the concept is still relatively new with noexamples of how to best apply this model. With the exception ofMPAs in the BHS where there are some efforts to manage localand commercial fisheries (see Section 6), coordinated efforts tomanage coastal or pelagic fisheries sustainably are largely absentin the region. Though there are some encouraging signs of govern-mental interest in improving fisheries management, in the absenceof critical baseline information on fish, shark and invertebratestocks and poor enforcement of existing regulations, fisheriesstocks will likely continue to decline in the BHS.
5.2. Tourism
The past 10 years have seen a dramatic expansion of marinetourism in the BHS as the region has developed a reputation asone of the top diving destinations on the planet (Jones et al.,2011). In Raja Ampat alone, the industry has expanded from a sin-gle diving resort and one live-aboard dive vessel visiting the area in2001 (with a combined total of approximately 300 guests/year) to8 resorts and over 40 dive live-aboard boats servicing over 6400guests per year in 2011. Tourism development is comparativelyat an earlier stage in Cendrawasih Bay and Kaimana’s Triton Bay,though recent cover features in international dive magazines onboth of these destinations have attracted global attention andthere are now 6–10 dive liveaboard vessels offering trips to both.
In order to ensure benefits to the local economy, the Raja Ampatregency government developed a tourism entrance fee system in2007 that requires every guest visiting the regency to pay Rp.500,000 (approximately USD $55) for a waterproof tag valid forthe calendar year. Thirty percent of the tag revenues are utilizedby the government for tourism management, while 70% fund con-servation and community development programs in all 135 vil-lages of Raja Ampat. Since its inception, the fee system hasaccrued nearly USD $1,000,000 and has funded a nutrition programfor pregnant and nursing mothers and MPA enforcement and turtlerookery guarding programs. Kaimana Regency and the Cendraw-asih Bay National Park have recently commenced their own en-trance fee systems.
The Raja Ampat government enacted legislation in July 2011 toestablish the first marine tourism licensing system in Indonesia,setting an upper limit of 40 liveaboard dive vessel and 20 dive resortlicenses for the regency while also stipulating strong requirementsfor environmentally-sensitive construction of resorts and employ-ment of local community members in tourism operations. Boththe West Papua provincial government and the Raja Ampat regencygovernment have now explicitly recognized marine tourism as oneof the main sectors for economic development of the regency, andincreasingly this sector is providing benefits to local communitiesnot only through entrance fee revenues, but also through directemployment in resorts and on dive vessels as well as through pro-viding important markets for sale of handicrafts and of fish, fruitsand vegetables harvested by community members.
5.3. Mariculture and aquaculture
The largest mariculture industry in the BHS is pearl oyster farm-ing. There are currently two large pearl farms in Kaimana and se-ven pearl farms in Raja Ampat. The pearl farms focus exclusivelyon silver and gold pearls from the oyster Pinctada maxima. Theindustry operates in sheltered bays with unpolluted waters, lowsedimentation, high dissolved nutrient levels, good water ex-change and relatively stable cool water temperatures. Pearl farm-ing companies enter into private lease agreements with local
2290 S. Mangubhai et al. / Marine Pollution Bulletin 64 (2012) 2279–2295
Author's personal copy
Papuan communities over large areas of water, generally have lowenvironmental impact and can provide strong socioeconomic ben-efits for local communities. Cendana Indopearls for example, em-ploys around 200 staff, provides training and livelihoods formany members of the community, and supplies electricity, trans-portation, medical services and schooling for the two local commu-nities in Raja Ampat with whom they have their lease agreements.While the overall contribution of pearl farms to the local economyis not known, it is estimated that Cendana Indopearls investsnearly USD $3 million per annum into the local economy in theform of operational costs, salaries, rents, royalties and taxes (J. Tay-lor, personal communication). Additionally, pearl farm waters arewell-patrolled and serve as de facto marine reserves.
The Raja Ampat Marine Affairs and Fisheries Agency establisheda grouper hatchery in mid-2011 focusing on highfin grouper(Cromileptes altivelis) to support community grow-out of hatcherygrouper to reduce pressure on wild stocks which are largely de-pleted in the region. The larvae are currently being sourced fromoutside the region during the trial phase, but it is hoped that oncea local brood stock has been established fingerlings can be sourcedfrom Raja Ampat to minimize genetic mixing of stocks and intro-duction of pathogens. Seaweed has also been established in RajaAmpat and Kaimana Regencies and Cendrawasih Bay, with severalvillages now actively cultivating Eucheumoid algae for sale to thecarrageenan industry. More recently, villages in Mayalibit Bay inRaja Ampat are trialing mangrove crab (Scylla serrata) grow-out,whereby juvenile crabs are collected and placed in pens con-structed in healthy mangrove forest environments for grow-out.With the exception of pearl farms, other mariculture and aquacul-ture efforts are still in their infancy in the region.
5.4. Oil, gas and mineral mining
The BHS is not only rich in renewable natural resources but alsoin crude oil, gas and minerals such as gold, copper and nickel. Theregion’s main mining products are oil and gas located in the regen-cies of South Sorong, Bintuni Bay, and Fakfak and Kaimana. Themost controversial mine in Eastern Indonesia is Indonesia’s (and
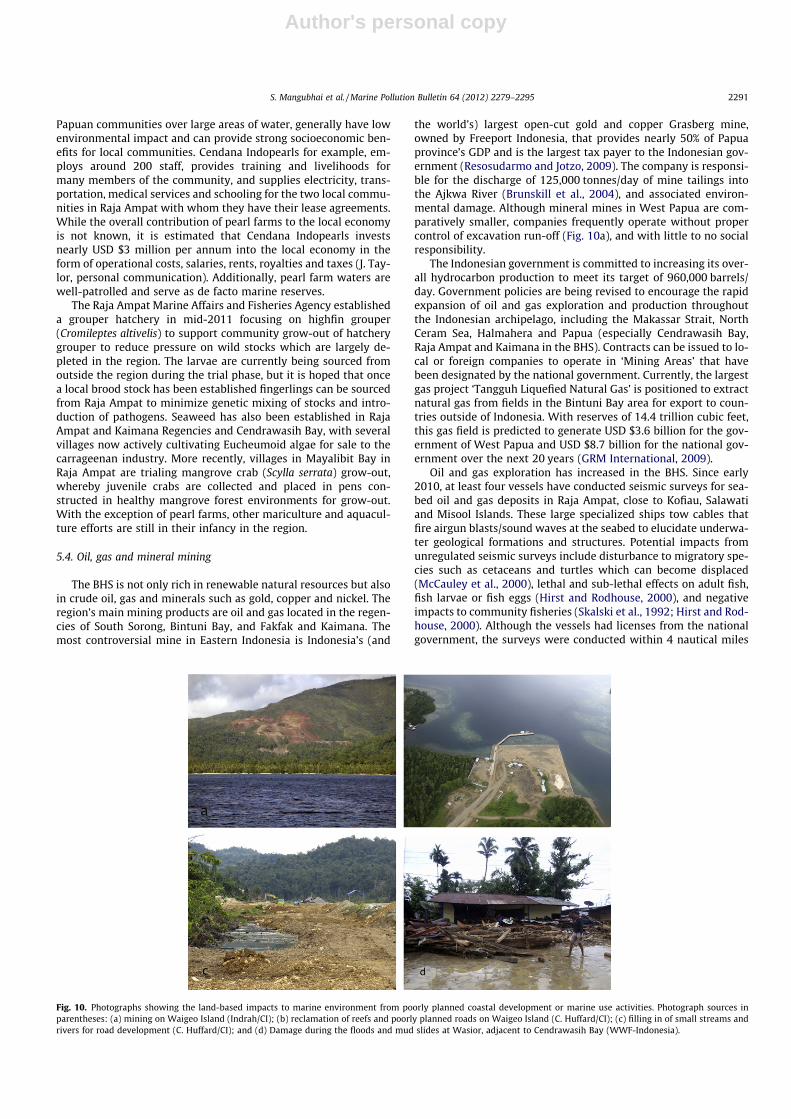
the world’s) largest open-cut gold and copper Grasberg mine,owned by Freeport Indonesia, that provides nearly 50% of Papuaprovince’s GDP and is the largest tax payer to the Indonesian gov-ernment (Resosudarmo and Jotzo, 2009). The company is responsi-ble for the discharge of 125,000 tonnes/day of mine tailings intothe Ajkwa River (Brunskill et al., 2004), and associated environ-mental damage. Although mineral mines in West Papua are com-paratively smaller, companies frequently operate without propercontrol of excavation run-off (Fig. 10a), and with little to no socialresponsibility.
The Indonesian government is committed to increasing its over-all hydrocarbon production to meet its target of 960,000 barrels/day. Government policies are being revised to encourage the rapidexpansion of oil and gas exploration and production throughoutthe Indonesian archipelago, including the Makassar Strait, NorthCeram Sea, Halmahera and Papua (especially Cendrawasih Bay,Raja Ampat and Kaimana in the BHS). Contracts can be issued to lo-cal or foreign companies to operate in ‘Mining Areas’ that havebeen designated by the national government. Currently, the largestgas project ‘Tangguh Liquefied Natural Gas’ is positioned to extractnatural gas from fields in the Bintuni Bay area for export to coun-tries outside of Indonesia. With reserves of 14.4 trillion cubic feet,this gas field is predicted to generate USD $3.6 billion for the gov-ernment of West Papua and USD $8.7 billion for the national gov-ernment over the next 20 years (GRM International, 2009).
Oil and gas exploration has increased in the BHS. Since early2010, at least four vessels have conducted seismic surveys for sea-bed oil and gas deposits in Raja Ampat, close to Kofiau, Salawatiand Misool Islands. These large specialized ships tow cables thatfire airgun blasts/sound waves at the seabed to elucidate underwa-ter geological formations and structures. Potential impacts fromunregulated seismic surveys include disturbance to migratory spe-cies such as cetaceans and turtles which can become displaced(McCauley et al., 2000), lethal and sub-lethal effects on adult fish,fish larvae or fish eggs (Hirst and Rodhouse, 2000), and negativeimpacts to community fisheries (Skalski et al., 1992; Hirst and Rod-house, 2000). Although the vessels had licenses from the nationalgovernment, the surveys were conducted within 4 nautical miles
Fig. 10. Photographs showing the land-based impacts to marine environment from poorly planned coastal development or marine use activities. Photograph sources inparentheses: (a) mining on Waigeo Island (Indrah/CI); (b) reclamation of reefs and poorly planned roads on Waigeo Island (C. Huffard/CI); (c) filling in of small streams andrivers for road development (C. Huffard/CI); and (d) Damage during the floods and mud slides at Wasior, adjacent to Cendrawasih Bay (WWF-Indonesia).
S. Mangubhai et al. / Marine Pollution Bulletin 64 (2012) 2279–2295 2291
Author's personal copy
of the coast without the approval of the provincial or regency gov-ernments, and without public consultation or adherence to inter-national standards. This issue highlights the lack of coordinationbetween national, provincial and regency governments in the en-ergy sector.
5.5. Deforestation and coastal development
Deforestation and coastal development have escalated over thelast 10 years in the BHS, and are leading to yet unmeasured, butnonetheless observable impacts on watersheds, coastlines andmarine environments (Fig. 10). Highly erodible soils, very steepslopes and high rainfall (Fig. 3) in the BHS makes coastal habitats(particularly shallow coral reefs), more vulnerable to damage fromland based activities. One or more authors are aware of impactsfrom deforestation and poorly planned coastal developmentincluding: (a) run-off of topsoil to beaches and marine habitatscausing smothering of coral and soft-sediment communities; (b)loss of mangroves due to road construction and logging; (c) directloss of critical habitat for threatened species (e.g. green, hawksbill,and leatherback turtles, estuarine crocodiles, and Wilson’s Bird ofParadise Cicinnurus respublica) through beach modification andcoastal vegetation removal; (d) direct loss of coral reefs throughreclamation; (e) altered salinity and temperature profiles at rivermouths due to interrupted water flow; and (f) introduction of inva-sive species to forests.
It has been estimated that 85% of Papua is still covered with in-tact forests (GRM International, 2009). However, most of the low-land forests have been designated for logging and agriculture.There is extensive logging in the Bomberai Peninsula between Fak-fak and Kaimana, and the Wandammen Peninsula in CendrawasihBay (M.V. Erdmann, personal observations). As far back as 2002,illegal logging has been taking place on the islands of Waigeoand Batanta in Raja Ampat, including in three gazetted nature re-serves (McKenna et al., 2002) and appears to be increasing as infra-structure improves to support the capital of Raja Ampat. Inaddition, the Indonesian government is committed to establish5.6 million ha of oil palm plantations over the next decade, partic-ularly in Sumatra, Kalimantan and Papua to meet global demandsfor biofuels (GRM International, 2009). There are well establishedplantations on the south coast of Bintuni Bay and northern Manok-wari regency, with plans for expansion to primary lowland forestsin Sorong, South Sorong, Fakfak and Kaimana regencies. If loggingand the conversion of land for agriculture in coastal areas is poorlymanaged, there will be increasing risk of negative impacts oncoastal biodiversity and adjacent marine environments. Given thescale and remoteness of many areas in the BHS, much of the im-pacts or loss in biodiversity is likely to go undocumented.
5.6. Climate change
In addition to the anthropogenic threats detailed above, coastaland marine areas in the BHS are threatened by a combination ofclimate change impacts – increased frequency and severity of ele-vated SSTs and extreme weather events, sea-level rise and oceanacidification. Similar to other regions, it is expected that sea-levelrise in the BHS will result in increased coastal erosion, inundationand displacement of wetlands and coastal lowlands, increasedflood and storm damage, and saltwater intrusion into freshwatersources (Klein and Nicholls, 1999). All of the important turtle nest-ing beaches in the BHS (including Abun, Sayang/Piai, Venu, SabudaTuturuga, and Wairundi) have experienced significant beach ero-sion over the past 5 years, causing the death of hundreds of turtleeggs.
To date, the BHS has not recorded severe coral bleaching eventscaused by extreme SST as recorded in some Indian Ocean and Pa-
cific Ocean locations. However, the magnitude and frequency ofthermal stress events severe enough to cause bleaching is pre-dicted to increase more than two fold in the BHS over the next100 years (McLeod et al., 2010). Small-scale coral bleaching was re-corded in March 2010 and 2011 in MPAs in Kofiau, Southeast Mis-ool, Mayalibit Bay, Dampier Strait with no significant mortalitywas recorded during subsequent reef health surveys (Table 1).However, in 2010–2011 Cendrawasih Bay experienced large scalebleaching with some reefs recording 90% mortality. The lack ofmortality in Raja Ampat and Kaimana, suggests that large temper-ature variation (Fig. 5a–h) may confer some level of resistance tobleaching, whereas Cendrawasih with low temperature variation(Fig. 5i and j) may be more vulnerable to thermally induced bleach-ing events, as has been observed elsewhere (e.g. Ateweberhan andMcClanahan, 2010). Given the reliance of local communities onfisheries and other coastal resources, including groundwater forconsumption and crop irrigation, climate change impacts resultingfrom sea level rise and heat stress and related coral leaching andmortality may likely affect their future livelihoods and foodsecurity.
6. Management and protected measures
6.1. National and traditional laws of governance
Special autonomy was granted in 2001 (Law 21/2001) by theNational government to enable provincial and regency govern-ments in Papua to self-govern and manage their economic devel-opment. Local governments were given authority to manage themajority of their affairs except for those related to internationalpolitics, national security, and fiscal and monetary policy (Reso-sudarmo and Jotzo, 2009). Although overall national policies aredeveloped by the national government and guide nature conserva-tion in Indonesia, implicit in the autonomy law is the rights ofindigenous Papuans to protect, manage and exploit their naturalresources, including fisheries and forests.
Indigenous Papuan communities have long-ago established asystem of territorial use rights fisheries to manage the access offamily clans to reefs in the BHS, which is fundamental to their soci-etal structure (Donnelly et al., 2003; McLeod et al., 2009). The cus-tomary (‘adat’) law is a set of unwritten laws, which regulate therights and duties of indigenous communities, including towardstheir natural resources. Traditional systems of tenure for landand sea are highly complex and highly variable across Papua(McLeod et al., 2009). Land and sea tenure is not written into for-mal law, but passed on verbally from one generation to anotherwith resource rights vested in individuals, families, clans or entirecommunities. Consequently there is very little formal private landownership in Papua, though communities have the rights to leasetheir areas to outsiders or give permission to outsiders to exploittheir natural resources.
Many coastal Papuan communities in eastern Indonesia alsoimplement a traditional system of natural resource managementon the land and in the sea called ‘sasi’. In the sea, sasi most ofteninvolves temporal closures of specific fisheries resources (e.g. seacucumbers, Trochus) or fisheries areas for periods ranging from6 months to 5 years (McLeod et al., 2009). The degree to which sasiand other conservation-oriented customary practices are honoredby villages throughout the BHS varies from full compliance todisuse.
6.2. Marine protected areas
MPAs or MPA networks are seen as a key tool to address inwater threats to BHS reefs and to contribute to biodiversity conser-
2292 S. Mangubhai et al. / Marine Pollution Bulletin 64 (2012) 2279–2295

Author's personal copy
Table 2Marine protected areas (MPAs) in the Bird’s Head Seascape. MPA type: KKPD = Kawasan Konservasi Perairan Daerah (Regional Marine Protected Area), KKPN = KawasanKonservasi Perairan Nastional (National Marine Conservation Area), TN = Taman Nasional (National Park), SM = Suaka Margasatwa (Wildlife Santuary) SML = Suaka MargasatwaLaut (Marine Wildlife Sanctuary), TWA = Taman Wisata Alam (Nature Tourism Park), CA = Cagar Alam (Strict Nature Reserve). MPA designation legislation: Perbup = PeraturanBupati (head of government decree), Perda = Peraturan Daerah (regency law), SK = Surat Keputusan (Government decree). Managing agency: KKP = Kementrian Kelautan danPerikanan (Ministry of Marine Affairs and Fisheries), DKP = Dinas Kelautan dan Perikanan (Regency Marine Affairs and Fisheries Agency), PHKA = Perlindungan Hutan danKonservasi Alam (Department of Forest Protection and Nature Conservation), BBKSDA = Balai Besar Konservasi Sumber Daya Alam (Regional Office of Nature Conservation),BTNTC = Balai Taman Nasional Teluk Cendrawasih (Cendrawasih National Park Management Authority). RI = Republic of Indonesia.
Regency MPA name MPAtype
Size (ha) MPA designationlegislation
Managingagency
Conservation values
Kaimana Kaimana KKPD 597,747 Perbup Kaimana No. 4/2008
DKP Soft-coral dominated reefs in unique low-salinity environment.Large, mostly intact mangrove and nipah palm bays, includinginland saltwater fjord of Arguni Bay. Abundant saltwatercrocodiles. Nesting hawksbill and green turtles. Whale sharkaggregations. Resident populations of Bryde’s whales and Indo-Pacific humpback dolphins. Paleolithic coastal rock art.
Fakfak Sabuda Tataruga SML 5000 SK Menteri Kehutanan RINo. 82/Kpts-II/1993
PHKA Offshore set of low coral cay islands with expansive green turtlenesting beaches. Suspected use of nesting beaches by flatbackturtles.
Raja Ampat Southeast Misool KKPD 343,200a Perbup No. 66/2007,Perda No. 27/2008,Perbup No. 5/2009
DKP High diversity of reef types. Diverse sea fans and soft coralcommunities. Large, intact marine lakes. Resident crocodiles.Nesting hawksbill turtles. Manta aggregations. Uniquelimestone karst ecological features. Rock paintings, sacred cavesand other cultural sites.
Raja Ampat Kofiau and Booislands
KKPD 170,000 Perbup No. 66/2007,Perda No. 27/2008,Perbup No. 5/2009
DKP High diversity of reef types. Important area for migratory whalespecies as well as dolphins. Coconut crab populations. Diversespecies of small fish. Variety of lagoon habitats. Endemic birdspecies.
Raja Ampat Dampier Strait KKPD 303,200 Perbup No. 66/2007,Perda No. 27/2008,Perbup No. 5/2009
DKP Extensive fringing and patch reef habitat subject to frequentupwellings and strong currents. Manta aggregation sites.Grouper spawning aggregation. Populations of dugongs andcoconut crabs. Major cetacean corridor for sperm whales, orcas,numerous species of dolphin and blackfish. Scattered crocodilepopulations.
Raja Ampat Mayalibit Bay KKPD 53,100 Perbup No. 66/2007,Perda No. 27/2008,Perbup No. 5/2009
DKP Large mangrove-lined bays and extensive seagrass beds. Uniquesponge and filter-feeder dominated reefs. Spawningaggregations of Indian and Spanish mackerel. Indo-pacifichumpback dolphins. Remnant crocodile and dugongpopulations.
Raja Ampat Kaweb KKPD 155,000 Perbup No. 66/2007,Perda No. 27/2008,Perbup No. 5/2009
KKP/KKPD Unique rocky reefs subject to open oceanic swell, withassociated system of large underwater caves. Regionallysignificant green & hawksbill turtle nesting beaches. Shark andray pupping area in Wayag lagoon. Manta aggregations.Populations of coconut crabs. Spectacular karst ‘‘beehive’’formations.
Raja Ampat Ayau-Asia KKPD 101,440 Perbup No. 66/2007,Perda No. 27/2008,Perbup No. 5/2009
DKP Open oceanic atoll system unique within the Bird’s Head, withextensive atoll lagoon habitat and sheer reef drop-offs to 1000sm depth. Green turtle nesting beaches. Aggregations of dolphinsand manta rays. Regionally significant reef fish spawningaggregation sites (including grouper and Napoleon wrasse).
Raja Ampat Panjang islands KKPN 60,000 SK Menteri Kelautan danPerikanan No. 64/2009
KKP Extensive coastal fringing reefs and mangrove forests. Largebaitfish aggregations. Remnant grouper spawning aggregationsites. Scattered dugong and crocodile populations.
Tambrau Abun Jamursba-Medic
KKPDSM
169,51527,825
SK Bupati Sorong No. 142/2005, SK MenteriKehutanan danPerkebunan No. 891/Kpts-II/1999
PHKABBKSDA
Extensive sandy beaches and lowland rainforests. BBKSDAGlobally significant leatherback turtle nesting beaches (largestPacific leatherback rookery in the world). Nesting habitat forOlive Ridley, greens and hawksbill turtles.
WondamaBay,Nabire
Cendrawasih Bayd TN 1,453,500 SK Menteri Kehutanan RINo. 8009/Kpts-II/2002
PHKABBTNTC
Indonesia’s second largest marine national park. High diversityof habitats within a large deep-water and semi-enclosed bay.Healthy dugong and crocodile populations. Whale sharks. Atleast 15 endemic coral reef fish species and many uniquehaplotypes of a wide range of marine organisms (due togeographic isolation of populations within bay). Nesting habitatfor the green and hawksbill turtle, and feeding area forleatherback and olive ridley turtle.
Biak-Numfor Padaido TWA 183,000 SK Menteri Kelautan danPerikanan RI No. 68/2009
KKP Extensive fringing reefs in an archipelago of small islands risingout of deep water and exposed to largely oceanic conditions.High cetacean diversity including sperm whales and orcas.Hammerhead shark aggregations. Remnant turtle nestingbeaches.
a There is a current proposal to expand this MPA to 366,000 ha.b KKPD Kawe is also overlaid by a more recent gazettement of KKPN West Waigeo (as per SK Menteri Kelautan dan Perikanan RI No. 65/2009); it is however, likely to be
managed as part of the Raja Ampat KKPD network.c The SML overlaps with the KKPD, though is smaller in size.d Cendrawasih Bay is sometimes spelt Cenderawasih Bay in some government documents.
S. Mangubhai et al. / Marine Pollution Bulletin 64 (2012) 2279–2295 2293

Author's personal copy
vation and sustainable fisheries (Coral Triangle Initiative, 2009).The identification of critical marine areas for protection and man-agement first began in the BHS in the early 1990s, mostly initiatedby WWF/IUCN, and followed by a number of conservation projectsthat focused on community empowerment in implementing mar-ine resource management. Since then, conservation initiativeshave grown and there are currently 12 MPAs in the BHS with activemanagement in place, ranging in size from 5000 to 1,453,500 haand covering a total area of 3,594,702 ha (Fig. 1; Table 2). This fig-ure includes Cendrawasih Bay National Marine Park, which is thesecond largest MPA in Indonesia covering 1,453,500 ha, and theKaimana MPA which covers all of Kaimana’s jurisdictional waters(597,747 ha). The majority of the MPAs in the BHS have beenestablished and gazetted ‘bottom up’ through community custom-ary adat declarations and regency laws, and reinforced by nationallaws. MPAs in the BHS are integrating traditional practices such assasi into MPA zoning and management, and developing co-man-agement structures that allow communities to actively manageand patrol their MPAs.
The majority of the MPAs in the BHS are in Raja Ampat regency,which has a network of seven MPAs covering 1,185,940 ha of coralreef habitat and associated small islands (Fig. 1; Table 2). Currentefforts are underway to institutionalize the Raja Ampat MPA net-work under a co-management body (termed ‘Badan Layanan UmumDaerah’ or regency technical unit) and framework that has beensuccessfully applied to hospitals in many parts of Indonesia. Thispublic–private co-management model provides two major benefitscompared to traditional Indonesian governance of MPAs. Firstly, itallows the management body to largely manage its own finances,including both governmental budget allocations and grants fromaid agencies and private donors, as well as any revenues generated(e.g. tourism entrance fees). Secondly, it allows non-governmentpartners to sit on the management board and private individualsto be recruited as MPA staff and paid a professional (i.e., non-civilservant) salary. If successful, this co-management model has thepotential to be applied to other MPA networks that are beingdeveloped in Indonesia (Coral Triangle Initiative, 2009).
The long term success of MPAs in the BHS will mostly dependon the management of waters outside MPAs and an integrated ap-proach to coastal management across the BHS. Since 2007 and thepassing of laws relating to spatial planning (Law 26/2007) andmanagement of coastal areas and small islands (Law 27/2007),the Indonesian Government has provided a legal framework to re-form spatial planning processes and achieve more effective andintegrated urban and rural planning and sectoral development,and enable greater synergies between spatial plans developed atthe regency, province and at the national level. In the BHS, throughthe efforts of international and national NGOs there has been apush for coastal development, fisheries, spatial planning and spe-cies management to align with the principles of ‘ecosystem-basedmanagement’ and recognize that ecosystems, communities, andeconomic opportunities are strongly connected.
7. Future for the Bird’s Head Seascape
The BHS is currently struggling to keep up with rapid environ-mental, social and economic change. Local communities and theregional economy rely heavily on natural resources – both terres-trial and marine – for industries such as fishing, mining, forestry,oil and gas, mariculture and tourism. However, certain activitiesassociated with these industries threaten the biodiversity andhealth of marine and terrestrial ecosystems in the BHS. Biodiver-sity conservation is increasingly an economic issue of growingimportance, where the future prosperity of this region will dependon policies and management which support sustainable industries
for the benefit of local communities and protect the outstandingbiodiversity of this region.
The Seascape is at a critical juncture at which local governmentsrequire strong technical advice and increased capacity to balancedevelopment pressures with sustainable management of theircoastal and marine resources. Although capacity to manage marineresources is slowly increasing through the combined efforts of gov-ernment and NGOs, local governments still and stakeholders re-quire support in developing effective and sustainable coastal andmarine resource management. The current focus on capacity build-ing of government staff in marine management in the BHS (whichis linked to a larger national program by the Ministry of Marine Af-fairs and Fisheries to build MPA training centers across Indonesia)is both crucial and timely. Low population numbers, relativelyhealthy natural resources and a strong tenure system in Papua,provide a real opportunity for government and local communitiesto manage their resources sustainably, ensure long-term foodsecurity, while meeting their development aspirations. Theempowerment of local governments and local communities tomanage these resources is critically important for the future sus-tainability and food security of the BHS.
Acknowledgements
We would first and foremost like to acknowledge our key Indo-nesian government partners, including PHKA, KKP, UNIPA, LIPI andRegency governments of Raja Ampat, Teluk Wondama, Nabire andKaimana. We also thank the following people for sharing theirknowledge and reports on the Bird’s Head: G. Allen, M. Ammer,P. Barber, L. Becking, P. Boli, L. DeVantier, A. Fauzan, H. Ferdinan-dus, E. Frommenwiler, J. Fudge, S. Haddock, K. Haisfield, B. Jones,J. Jorgensen, B. Kahn, L. Katz, T. Lamuasa, Y. Maturbongs, A. Muljadi,M. Mongdong, T. Nai, A. Nebore, H. Newman, L. Pet-Soede, Purwan-to, R. Robison, I. Tarmidji, M. Shimlock, R. Tapilatu, J. Taylor, E. Tur-ak, A. Wijonarno and R. Wright. Special thanks to S. Heron of NOAACoral Reef Watch for assistance with processing of satellite dataand R. Salm and M. Sparding for pre-reviewing this manuscript.Funding for many of the studies presented here was provided bythe David and Lucille Packard Foundation, Walton Family Founda-tion, Henry Foundation, USAID, US National Science Foundationand generous private donors. All funding sources listed in theacknowledgement section have not been involved in the study de-sign, collection, and interpretation of data, or the decision to sub-mit this manuscript for publication to Marine Pollution Bulletin.
Appendix A. Supplementary data
Supplementary data associated with this article can be found, inthe online version, at http://dx.doi.org/10.1016/j.marpolbul.2012.07.024.
References
Ainsworth, C.H., Pitcher, T.J., Rotinsulu, C., 2008. Evidence of fishery depletions andshifting cognitive baselines in Eastern Indonesia. Biological Conservation 141,848–859.
Allen, G.R., Erdmann, M.V., 2008. Two new species of bamboo sharks(Orectolobiformes: Hemiscyllidae) from western New Guinea. Aqua,International Journal of Ichthyology 13, 93–108.
Allen, G.R., Erdmann, M.V., 2009. Reef fishes of the Bird’s Head Peninsula, WestPapua, Indonesia. Check List 5, 587–628.
Allen, G.R., Erdmann, M.V., 2012. Reef Fishes of the East Indies. Volumes I–III.Tropical Reef Research, Perth.
Alongi, D.M., 2007. Mangrove forests of Papua. In: Marshall, A.J., Beehler, B. (Eds.),The Ecology of Papua (Part Two). Periplus, Singapore, pp. 824–857.
Ateweberhan, M., McClanahan, T.R., 2010. Relationship between historical sea-surface temperature variability and climate change-induced coral mortality inthe western Indian Ocean. Marine Pollution Bulletin 60, 964–970.
2294 S. Mangubhai et al. / Marine Pollution Bulletin 64 (2012) 2279–2295

Author's personal copy
Bailey, M., Rotinsulu, C., Sumaila, U., 2008. The migrant anchovy fishery in KabuiBay, Raja Ampat, Indonesia: Catch, profitability, and income distribution.Marine Policy 32, 483–488.
Becking, L.E., Renema, W., Dondorp, E., 2009. Marine Lakes of Raja Ampat, WestPapua, Indonesia. General Overview of First Sightings. National Museum ofNatural History – Naturalis, The Netherlands.
Becking, L.E., Renema, W., Santodomingo, N.K., Hoeksema, B.W., Tuti, Y., de Voogd,N.J., 2011. Recently discovered landlocked basins in Indonesia reveal highhabitat diversity in anchialine systems. Hydrobiologia 677, 89–105.
Benson, S., Dutton, P., Hitipeuw, C., Samber, B., Bakarbessy, J., Parker, D., 2007. Post-nesting migrations of leatherback turtles (Dermochelys coriacea) from Jamursba-Medi, Bird’s Head Penninsula, Indonesia. Chelonian Conservation and Biology 6,150–154.
Benson, S.R., Eguchi, T., Foley, D.G., Forney, K.A., Bailey, H., Hitipeuw, C., Samber,B.P., Tapilatu, R.F., Rei, V., Ramohia, P., Pita, J., Dutton, P.H., 2011. Large-scalemovements and high-use areas of western Pacific leatherback turtles,Dermochelys coriacea. Ecosphere 2 (84), 1–27.
Brunskill, G.J., Zagorskis, I., Pfitzner, J., Ellison, J., 2004. Sediment and trace elementdepositional history from the Ajkwa River estuarine mangroves of Irian Jaya(West Papua), Indonesia. Continental Shelf Research 24, 2535–2551.
Burke, L., Reytar, K., Spalding, M., Perry, A., 2011. Reefs at risk revisited. WorldResources Institute, The Nature Conservancy, World Fish Center, InternationalCoral Reef Action Network, UNEP world conservation monitoring centre andglobal coral reef monitoring network, Washington DC.
Coral Triangle Initiative, 2009. Regional Plan of Action on Coral Triangle Initiative onCoral Reefs, Fisheries and Food Security. Interim Regional CTI Secretariat,Indonesia.
Crandall, E.D., Jones, M.E., Munoz, M.M., Akinronbi, B., Erdmann, M.V., Barber, P.H.,2008. Comparative phylogeography of two seastars and their ectosymbiontswithin the Coral Triangle. Molecular Ecology 17, 5276–5290.
de Iongh, H.H., Hutomo, M., Moraal, M., Kiswara, W., 2009. Scientific Report Part I.National Strategy and Action Plan for the Dugong in Indonesia. Institute ofEnvironmental Sciences, Leiden.
DeBoer, T.C., Subia, M.D., Ambariyanto, Erdmann, M.V., Kovitvongsa, K., Barber, P.H.,2008. Phylogeography and limited genetic connectivity in the endangeredboring giant clam across the Coral Triangle. Conservation Biology 22, 1255–1266.
DeVantier, L., Turak, E., Allen, G., 2009. Reef-scapes, Reef Habitats and CoralCommunities of Raja Ampat, Bird’s Head Seascape, Papua, Indonesia. The NatureConservancy, Bali.
Dimara, R., Fauzan, A., Lazuardi, M., Pada, D., Allen, G.R., Erdmann, M.V., Huffard,C.L., Katz, L.S., Winterbottom, R., 2010. Pisces, Teleostidae, Gobiidae, illustratedlist of additions to the fauna of the Raja Ampat Islands, Indonesia. Check List 6,619–625.
Donnelly, R., Neville, D., Mous, P.J., 2003. Report on a rapid ecological assessment ofthe Raja Ampat Islands, Papua, Eastern Indonesia held October 30 – November22, 2002. The Nature Conservancy, Bali.
English, S.E., Wilkinson, C., Baker, V., 1997. Survey Manual for Tropical MarineResources. Australian Institute of Marine Science, Townsville.
Firman, A., Azhar, I., 2006. Atlas Sumberdaya Pesisir Raja Ampat Provinsi Irian JayaBarat. Pemerintah Kabupaten Raja Ampat, Sorong.
Gandi, Y., Hardiono, M., Rahawarini, Y., Nugrohoi, J., Manusawai, J., 2008.Interpretation of mangrove ecosystem dynamic in Bintuni Bay Nature Reserveusing geographic information system. Biodiversitas 9, 156–159.
Gordon, A.L., 2005. Oceanography of the Indonesian Seas and their flow-through.Oceanography 18, 14–27.
Gordon, A.L., Fine, R.A., 1996. Pathways of water between the Pacific and Indianoceans in the Indonesian seas. Nature 379, 146–149.
Green, A.L., Mous, P.J., 2008. Delineating the Coral Triangle, Its Ecoregions andFunctional Seascapes. Version 5.0. Report1/08. The Nature Conservancy, Bali.
GRM International, 2009. Papua Assessment USAID/Indonesia, Final Report. GRMInternational, Jakarta.
Heazle, M., Butcher, J.G., 2007. Fisheries depletion and the state in Indonesia:towards a regional regulatory regime. Marine Policy 31, 276–286.
Heron, S., Willis, B., Skirving, W., Eakin, M., Page, C., Miller, I., 2010. Summer hotsnaps and winter conditions: modelling white syndrome outbreaks on GreatBarrier Reef corals. PLoS One 5 (8), e12210. http://dx.doi.org/10.1371/journal.pone.0012210.
Hirst, A.G., Rodhouse, P.G., 2000. Impacts of geophysical seismic surveying onfishing success. Reviews in Fish Biology and Fisheries 10, 113–118.
Hitipeuw, C., Dutton, P., Benson, S., Thebu, J., Bakarbessy, J., 2007. Population statusand internesting movement of leatherback turtles, Dermochelys coriacea,nesting on the northwest coast of Papua, Indonesia. Chelonian Conservationand Biology 6, 28–36.
Huffard, C.L., Erdmann, M.V., Gunawan, T., 2009. Defining Geographic Priorities forMarine Biodiversity Conservation in Indonesia. Coral Triangle Support Program,Jakarta.
Jones, B., Shimlock, M., Erdmann, M.V., Allen, G.R., 2011. Diving Indonesia’s Bird’sHead Seascape. Conservation International, Bali.
Kahn, B., 2007. Marine Mammals of the Raja Ampat Islands: Visual and AcousticCetacean Survey and Training Program. Apex Environmental, Bali.
Kahn, B., 2009. Marine Mammal Survey and Training in Triton Bay, West Papua,Indonesia: Management Implications for Resident Bryde’s Whales. ApexEnvironmental, Bali.
Kahn, B., Gearheart, G., Tapilatu, R., 2006. Bintuni Berau Bay Rapid EcologicalAssessment (REA) for Marine Mammals and Marine Reptiles: Initial evaluation
of risk mitigation measures for Tangguh LNG Project, Papua, Indonesia.Technical Report AE-BP0601.
Kilpatrick, K.A., Podestá, G.P., Evans, R., 2001. Overview of the NOAA/NASAadvanced very high resolution radiometer Pathfinder algorithm for seasurface temperature and associated matchup database. Journal of GeophysicalResearch 106, 9179–9197.
Klein, R.J.T., Nicholls, R.J., 1999. Assessment of coastal vulnerability to climatechange. Ambio 28, 182–187.
Larsen, S.N., Leisher, C., Mangubhai, S., Muljadi, A., Tapilatu, R., 2011. Report on aCoastal Rural Appraisal in Raja Ampat Regency, West Papua, Indonesia. TheNature Conservancy, Bali.
Mangubhai, S., Muhammed, S., Suprayitno, Muljadi, A., Purwanto, Rhodes, K.L.,Tjandra, K., 2011. Do not stop: the importance of seamless monitoring andenforcement in an Indonesian Marine Protected Area. Journal of Marine Biology,1–11 (Article ID 501465).
Marsh, H., Eros, C., Penrose, H., Hugues, J., 2002. The Dugong (Dugong dugon) StatusReports and Action Plans for Countries and Territories in its Range. IUCN, Gland.
McCauley, R.D., Fewtreli, J., Duncan, A.J., Jenner, C., Jenner, M.-N., Penrose, J.D.,Prince, R.I.T., Adhitya, A., Murdoch, J., McCAbe, K., 2000. Marine seismic surveys– a study of environmental implications. APPEA Journal, 692–708.
McKenna, S.A., Allen, G.R., Suryadi, S., 2002. A Marine Rapid Assessment of the RajaAmpat Islands, Papua Province, Indonesia. RAP Bulletin of Biological Assessment22. Conservation International, Washington DC.
McKenzie, C.R., Coles, R., Erftemeijer, P., 2007. Seagrass ecosystems of Papua. In: TheEcology of Papua Part 2. Periplus, Singapore, pp. 800–823.
McLeod, E., Szuster, B., Salm, R., 2009. Sasi and marine conservation in Raja Ampat,Indonesia. Coastal Management 37, 656–676.
McLeod, E., Moffitt, R., Timmermann, A., Salm, R., Menviel, L., Palmer, M.J., Selig, E.R.,Casey, K.S., Bruno, J.F., 2010. Warming seas in the Coral Triangle: coral reefvulnerability and management implications. Coastal Management 38, 518–539.
Palomares, M.L.D., Heymans, J.J., Pauly, D., 2007. Historical ecology of the RajaAmpat Archipelago, Papua Province, Indonesia. Historical Phil Life Science 29,35–56.
Petocz, R., 1989. Conservation and Development in Irian Jaya: A Strategy forRational Resource Utilization. E.J. Brill, Leiden.
Pet-Soede, L., Monintja, D., Wanggai, F., Bawole, R., Abdullah, Y., Rochani, A., Tokede,M.J., 2006. Sustainable Fisheries in Bintuni Bay. University of Papua,Manokwari.
Prentice, M.L., Hope, G.S., 2007. Climate of Papua. In: The Ecology of Papua Part 2.Periplus, Singapore, pp. 177–195.
Resosudarmo, B.P., Jotzo, F., 2009. Workign with Nature Against Poverty.Development, Resources and the Environment in Eastern Indonesia. Instituteof Southeast Asian Studies, Singapore.
Rudolf, P., Smeenk, C., Leatherwood, S., 1997. Preliminary checklist of cetacea in theIndonesian Archipelago and adjacent waters. Zoologische Verhandilingen 312,3–48.
Sadovy, Y., Liu, M., 2004. Report on the Current Status and Exploitation History ofReef Fish Spawning Aggregations in Eastern Indonesia. University of Hong Kong,Hong Kong.
Short, F.T., Carruthers, T.J., Dennison, W.C., Waycott, M., 2007. Global seagrassdistribution and diversity: a bioregional model. Journal of Experimental MarineBiology and Ecology 350, 3–20.
Skalski, J.R., Pearson, W.H., Malme, C.I., 1992. Effects of sounds from a geophysicaldevice on catch per unit effort in hook and line fishery for rockfish (Sebastesspp.). Canadian Journal of Fisheries and Aquatic Sciences 49, 1357–1365.
Spalding, M., Kainuma, M., Collins, L., 2010. World Atlas of Mangroves. Earthscan,London.
Tapilatu, R.F., Tiwari, M., 2007. Leatherback turtle, Dermochelys coriacea, hatchingsuccess at Jamursba-Medi and Wermon beaches in Papua, Indonesia. ChelonianConservation and Biology 6, 154–158.
Tomascik, T., Mah, A.J., Nontji, A., Moosa, M.K., 1997. Seagrasses. In: Tomascik, T.,Mah, A.J., Nontji, A., Moosa, M.K. (Eds.), The Ecology of the Indonesian Seas VIII,Part II. Oxford University Press, Oxford, pp. 829–906.
Varkey, D.A., Ainsworth, C.H., Pitcher, T.J., Goram, Y., Sumaila, R., 2010. Illegal,unreported and unregulated fisheries catch in Raja Ampat Regency, EasternIndonesia. Marine Policy 34, 228–236.
Veron, J.E.N., DeVantier, L.M., Turak, E., Green, A.L., Kininmonth, S., Stafford-Smith,M., Peterson, N., 2009. Delineating the Coral Triangle. Galaxea 11, 91–100.
Vranes, K., Gordon, A.L., 2005. Comparison of Indonesian Throughflow transportobservations, Makassar Strait to eastern Indian Ocean. Geophysical ResearchLetters 32, 1–5.
Wallace, C.C., Turak, E., DeVantier, L., 2011. Novel characters in a conservative coralgenus: three new species of Astreopora (Scleractinia: Acroporidae) from WestPapua. Journal of Natural History 45, 1905–1924.
Wilson, J., Green, A., 2009. Biological Monitoring Methods for Assessing Coral ReefHealth and Management Effectiveness of Marine Protected Areas in Indonesia.The Nature Conservancy, Bali.
Wilson, J., Rotinsulu, C., Muljadi, A.M., Wen, W., Barmawai, M., Mandagi, S., 2010a.Spatial and Temporal Patterns in Marine Resource Use Within Raja AmpatRegion from Aerial Surveys 2006. The Nature Conservancy, Bali.
Wilson, J., Rhodes, K.L., Rotinsulu, C., 2010b. Aggregation fishing and localmanagement within a marine protected area in Indonesia. SPC Live Reef FishInformation Bulletin 19, 713.
WWF, 2003. Bismarck Solomon Sea Ecoregion Biophysical and Socio-EconomicAssessment Report. Indonesian Territory-North Papua. WWF IndonesiaProgram, Bali.
S. Mangubhai et al. / Marine Pollution Bulletin 64 (2012) 2279–2295 2295