manipulating political stock markets:
TRANSCRIPT
Manipulating Political Stock Markets: A Field Experiment and a Century of Observational Data*
Paul W. Rhode** Koleman S. Strumpf Univ. of Arizona and NBER Univ. of Kansas School of Business
June 2008
Preliminary
Abstract Political stock markets have a long history in the United States. Organized prediction markets for Presidential elections have operated on Wall Street (1880-1944), the Iowa Electronic Market (1988-present), and the internet (2000-present). Proponents claim such markets efficiently aggregate information and provide forecasts superior to polls. An important counterclaim is that such markets may be subject to manipulation by interested parties. We investigate the impact of actual and alleged speculative attacks— large trades, uninformed by fundamentals, intended to change prices— in political stock markets. First we report the results of a field experiment involving a series of planned, random investments-- accounting for two percent of total market volume-- in the Iowa Electronic Market in 2000. We next examine the historical Wall Street markets where political operatives from the contending parties actively and openly bet on city, state and national races; the record is rife with accusations that parties tried to boost their candidates through investments and wash bets. Finally, we investigate the speculative attacks on TradeSports market in 2004 when a single trader made a series of large investments in an apparent attempt to make one candidate appear stronger. In the cases studied, the speculative attack initially moved prices, but these changes were quickly undone and prices returned close to their previous levels. We find little evidence that political stock markets can be systematically manipulated beyond short time periods. Our results potentially have implications for trader behavior in broader financial markets.
*We thank Tim Groseclose, Robin Hanson, Donald Luskin, Tom Mroz, Sergio Parreiras, Marco Ottaviani, Charles Plott, David Primo, Mark Stegeman, Justin Wolfers, participants at the DIMACS Workshop on Markets as Predictive Devices, the 2005 International Symposium on Forecasting, London Business School Information and Prediction Markets Conference, 2006 NBER DAE Program Meeting, 2006 Prediction Markets Summit East, and workshops at Arizona, Iowa State, UNC Chapel Hill, UNC Greensboro, University of Virginia, Yale, and WZB for assistance and comments. We are particularly grateful to Intrade (part of the Trade Exchange Network) and Betfair for providing data from the 2004 Presidential Election market, Steve Cornwell of Intertops.com and Ken Kittlitz of the Foresight Exchange for data on the 2000 Presidential Election market, and Bo Cowgill of Google for detailing that company’s internal prediction markets. **Corresponding author. McClelland Hall Room 401NN. Department of Economics. Univ. of Arizona. Tucson, AZ 85718. email: [email protected]
I. Introduction
Prediction markets involve contracts which have payoffs explicitly linked to future
events. An example is a binary option which pays a dollar on the outcome of a specific
event, such as a candidate’s victory or an on-time product launch. An efficient prediction
market aggregates available information, yielding prices that are the best forecast of the
event’s probability. Such forecasts can be socially valuable if the market involves a topic
of great importance.
Prediction markets are currently the subject of intensive research in fields ranging
from economics to political science to computer science (Berg, et al, 2005; Hanson,
1999; Pennock, 2004; Wolfers and Zitzewitz, 2004; Ledyard, 2005; Snowberg, Wolfers
and Zitzewitz, 2007). There is also growing interest outside of academia. In the popular
press, James Surowiecki (2004) has championed the Wisdom of Crowds and in the private
sector, Abbott Labs, Best Buy, Corning, Electronic Arts, General Electric, Goldman
Sachs, Google, Hewlett-Packard, Intel, Lilly, Microsoft, Siemens, and Yahoo! have set
up internal prediction markets. Public prediction markets on current events, economic
outcomes, and even the weather have become increasing common as the internet has
opened access to a growing number of on-line sites such as TradeSports-Intrade, Betfair,
and News Futures. In political prediction markets alone, one-hundred thousand
participants conducted over three million trades in 2006. The hope is such markets can
aid forecasting and improve decision-making in economic policy, corporate project
selection, and other areas.
Skeptics have advanced several theoretical challenges to the efficiency and
predictive power of these markets. For example Manski (2006) questions the received
wisdom that prices can be interpreted as probabilities. In his model, market prices only
provide information about the wide interval in which mean beliefs over probabilities lie.
Responses include Wolfers and Zitzewitz (2005), Gjerstad (2005), and Ottaviani and
Sørensen (2005).
A more damaging challenge to the forecasting ability of prediction markets is the
possibility that investors could distort prices away from fundamentals for the strategic
purpose of influencing the expectations and actions of others. Such manipulation is an
inherent danger for prediction markets for several reasons. First, the potential reward
1
from a successful manipulation can far exceed the financial resources needed to
implement it. Consider the case of political markets. The reported odds might influence
the election if voters are unwilling to support a candidate who is faring poorly. Such
changes in price require relatively small stakes (even big political markets attract volume
in the tens of millions of dollars) but can shape a very large outcome (the federal budget
involves trillions of dollars). As their visibly rises, prediction markets will likely become
increasingly tempting targets for manipulators. A second issue is that insiders are not
prohibited from trading in these markets. On-line services such as TradeSports or the
Hollywood Stock Exchange do not explicitly ban insider traders and the Commodities
Futures Trading Commission (CFTC) regulations permit such trading in future markets.
So traders cannot be sure a seemingly inexplicable price change is the result of a
manipulator or rather is the result of some new private information.
Theory aside, the potential for manipulation is often levied as a criticism of
prediction markets. Stiglitz (2003) criticized the proposed Policy Analysis Market, a
heavily publicized futures market on Middle East economic and military events, because
it “could be subject to manipulation.” Such behavior is also an issue for internal
corporate markets, with the organizer of Google’s market noting that he “repeatedly
encountered concern about the potential for market manipulation from average
employees as well as senior leadership” (Cowgill, 2006). At least one trader at Google
later admitted to attempting to manipulate prices. .
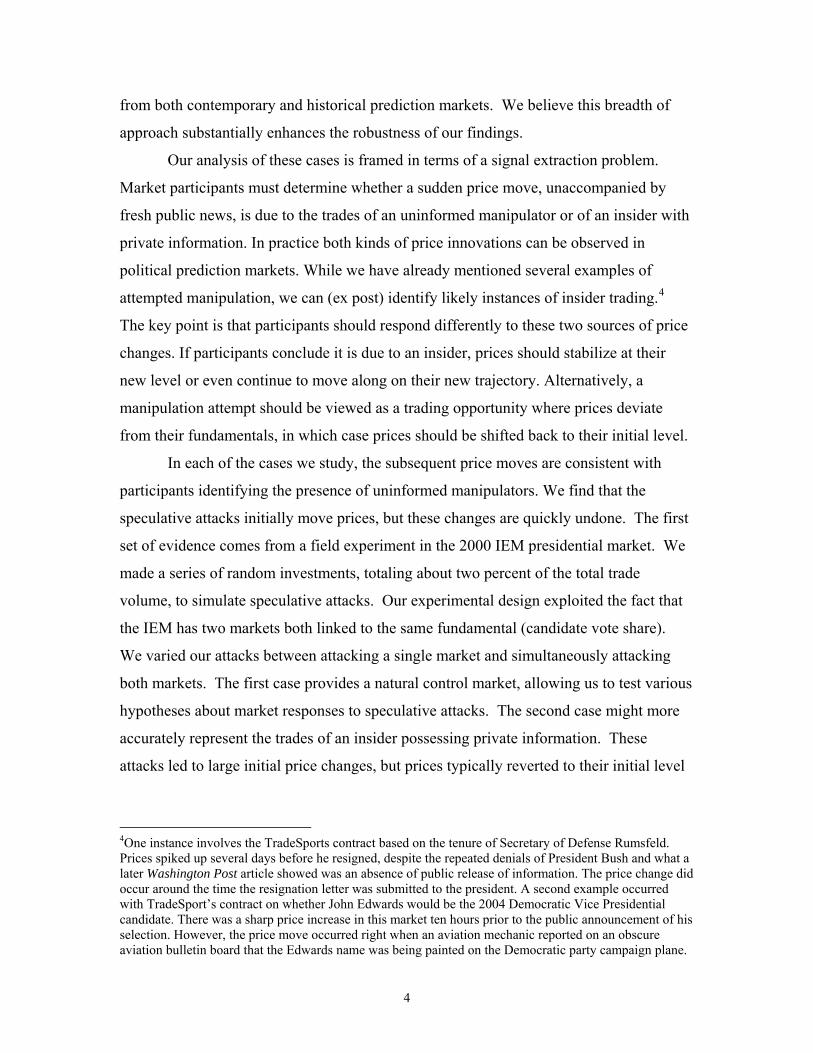
Manipulation attempts are readily observed in the field. As a motivating example,
consider movements in the price of shares for George W. Bush in the 2004 US
Presidential election at TradeSports.1 Figure 16 displays the price and volume during
September and October. Shortly after 2:30 pm (EDT) on Friday, October 15, 2004, the
TradeSports odds price on the re-election of President Bush began to fall precipitously.
1This was a large and influential market, attracting more than $15M in trade volume. Shares in the main election market paid a fixed amount if Bush won, and the prices were scaled between zero and a hundred to give the usual probability interpretation. TradeSports markets are listed at http://www.tradesports.com. It is part of the Trade Exchange Network which provides an electronic matching service for trading futures on sports, entertainment, legal, and political events. The company, based in Dublin, Ireland, was founded in 2001. Its shares pay $10 upon winning but are quoted between 0 and 100. When share prices are between 6 and 94, or exactly 0 or 100, then TradeSports charges a commission of 0.04 dollars (about 0.8 percent) per shared trades. Outside that range to the extremes the commission rate is 0.02.
2
From a plateau of 54 points at 2:30 pm, a series of thirty trades in less than a second
dropped the price to 48 at 2:31 pm. After stabilizing for two minutes, another rapid set of
trades led prices to tumble to 10 at 2:33 pm. Thus prices fell by 44 points in just three
minutes, suggesting that Bush went from a slight favorite to serious underdog. This sharp
drop was the most dramatic of a series of trades that National Review Online blogger
Donald Luskin soon charged were politically-motivated speculative attacks on Bush
futures “to sway the election towards Kerry.”2 Reports circulated that George Soros was
behind the October 15 plunge as well as earlier bear raids on Bush. Such rumors gained
currency when a TradeSports press release, publicized in Wall Street Journal and Time,
confirmed that the large trades of a single investor produced the October 15 price
moves.3 The press release asserted “Bush contract has become the battle ground of wills
between a cadre of large, well financed rogue traders seemingly bent on driving down the
Bush re-election contract and a growing list of financial traders who think they can
predict the outcome of this election.”
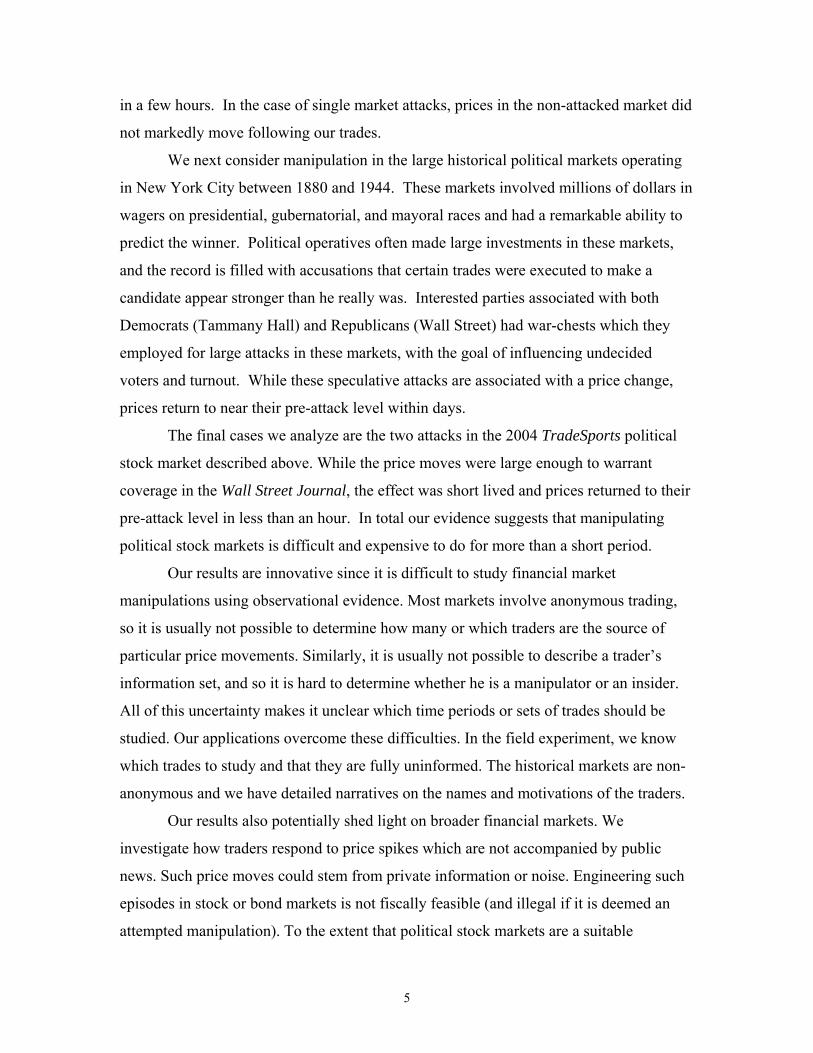
In addition to the October 15 episode, the price of the “Bush Winner” contract
also experienced a a 13-point drop during a fourteen minute period around 12 pm EDT
on Monday, September 13. Figure 17 shows the manipulation events in greater focus
(Time in the figures is reported in GMT which is four hours later than EDT).
This paper investigates the open empirical question of whether manipulation
causes important distortions in U.S. political prediction markets. We analyze speculative
attacks, both alleged and actual, in three political stock markets: the 2000 Iowa Electronic
Market (IEM) for President; the historical Wall Street betting markets for national, state,
and city races; and the 2004 TradeSports market for President. The cases we study
involve large price jumps, with the initial price changes comparable to those in recent
Securities and Exchange Commission (SEC) cases regarding stock market manipulation
as summarized in Aggarwal and Wu (2005). Our empirical analysis ranges over a wide
terrain, covering both observational data and field experiments, and evaluating evidence
2Donald Luskin, “Who’s Behind the Bush-Futures Attacks?” National Review Online, 18 Oct. 2004, 11:32 AM. http://www.nationalreview.com/nrof_luskin/luskin200410181132.asp. See also the 16 Oct. 2004 entry, “Bush Futures Being Manipulated” in Luskin’s blog, http://www.poorandstupid.com/2004_10_10_chronArchive.asp. 3“Bids and Offers,” Wall Street Journal, 22 Oct. 2004, p. C4; and “Let's Make This Vote Interesting, Shall We?” Time. 25 Oct. 2004.
3
from both contemporary and historical prediction markets. We believe this breadth of
approach substantially enhances the robustness of our findings.
Our analysis of these cases is framed in terms of a signal extraction problem.
Market participants must determine whether a sudden price move, unaccompanied by
fresh public news, is due to the trades of an uninformed manipulator or of an insider with
private information. In practice both kinds of price innovations can be observed in
political prediction markets. While we have already mentioned several examples of
attempted manipulation, we can (ex post) identify likely instances of insider trading.4
The key point is that participants should respond differently to these two sources of price
changes. If participants conclude it is due to an insider, prices should stabilize at their
new level or even continue to move along on their new trajectory. Alternatively, a
manipulation attempt should be viewed as a trading opportunity where prices deviate
from their fundamentals, in which case prices should be shifted back to their initial level.
In each of the cases we study, the subsequent price moves are consistent with
participants identifying the presence of uninformed manipulators. We find that the
speculative attacks initially move prices, but these changes are quickly undone. The first
set of evidence comes from a field experiment in the 2000 IEM presidential market. We
made a series of random investments, totaling about two percent of the total trade
volume, to simulate speculative attacks. Our experimental design exploited the fact that
the IEM has two markets both linked to the same fundamental (candidate vote share).
We varied our attacks between attacking a single market and simultaneously attacking
both markets. The first case provides a natural control market, allowing us to test various
hypotheses about market responses to speculative attacks. The second case might more
accurately represent the trades of an insider possessing private information. These
attacks led to large initial price changes, but prices typically reverted to their initial level
4One instance involves the TradeSports contract based on the tenure of Secretary of Defense Rumsfeld. Prices spiked up several days before he resigned, despite the repeated denials of President Bush and what a later Washington Post article showed was an absence of public release of information. The price change did occur around the time the resignation letter was submitted to the president. A second example occurred with TradeSport’s contract on whether John Edwards would be the 2004 Democratic Vice Presidential candidate. There was a sharp price increase in this market ten hours prior to the public announcement of his selection. However, the price move occurred right when an aviation mechanic reported on an obscure aviation bulletin board that the Edwards name was being painted on the Democratic party campaign plane.
4
in a few hours. In the case of single market attacks, prices in the non-attacked market did
not markedly move following our trades.
We next consider manipulation in the large historical political markets operating
in New York City between 1880 and 1944. These markets involved millions of dollars in
wagers on presidential, gubernatorial, and mayoral races and had a remarkable ability to
predict the winner. Political operatives often made large investments in these markets,
and the record is filled with accusations that certain trades were executed to make a
candidate appear stronger than he really was. Interested parties associated with both
Democrats (Tammany Hall) and Republicans (Wall Street) had war-chests which they
employed for large attacks in these markets, with the goal of influencing undecided
voters and turnout. While these speculative attacks are associated with a price change,
prices return to near their pre-attack level within days.
The final cases we analyze are the two attacks in the 2004 TradeSports political
stock market described above. While the price moves were large enough to warrant
coverage in the Wall Street Journal, the effect was short lived and prices returned to their
pre-attack level in less than an hour. In total our evidence suggests that manipulating
political stock markets is difficult and expensive to do for more than a short period.
Our results are innovative since it is difficult to study financial market
manipulations using observational evidence. Most markets involve anonymous trading,
so it is usually not possible to determine how many or which traders are the source of
particular price movements. Similarly, it is usually not possible to describe a trader’s
information set, and so it is hard to determine whether he is a manipulator or an insider.
All of this uncertainty makes it unclear which time periods or sets of trades should be
studied. Our applications overcome these difficulties. In the field experiment, we know
which trades to study and that they are fully uninformed. The historical markets are non-
anonymous and we have detailed narratives on the names and motivations of the traders.
Our results also potentially shed light on broader financial markets. We
investigate how traders respond to price spikes which are not accompanied by public
news. Such price moves could stem from private information or noise. Engineering such
episodes in stock or bond markets is not fiscally feasible (and illegal if it is deemed an
attempted manipulation). To the extent that political stock markets are a suitable
5
microcosm for these more traditional financial markets, the results here suggest that
traders can correctly identify non-informative price moves and therefore that successful
manipulations will be difficult to execute.
II. Manipulation
a. Definitions and Literature
The finance literature does not provide detailed guidance on how to perform this
analysis. First, academic papers define the concept of manipulation in different and
inconsistent ways (we discuss the alternate definitions below).5 For the purpose of this
study, fundamentals are any information that influences the underlying value of the
contract. A speculative attack is defined as any trade, uninformed by fundamentals,
intended to change prices. A (successful) manipulation is a speculative attack that
achieves its objective of changing prices. A successful manipulation is usually not
possible unless the trades influence the beliefs of other market participants (An investor’s
beliefs are defined with respect to the fundamentals, as well as the future actions and
beliefs of other investors)6 Second, most papers utilize the decisions of regulatory
agencies (such as the SEC, CFTC, or Congressional Committees) to define when a
manipulation attempt has occurred. Since there is no regulatory authority for political
stock markets, we had to identify the manipulations ourselves. A third difficulty arises
from differences between prediction markets and more traditional derivative markets
which are studied in most analyses of market manipulation. In the case of financial
futures, a standard technique is to look for squeezes or corners in the underlying
deliverable asset (Pirrong, 1993, 2004). With financial options, one can look for
deviations from the Black-Scholes equilibrium relationship for prices of the option and
5These differences probably stem from the lack of a statutory definition of manipulation. For example the Commodity Exchange Act does not define manipulation, and so the CFTC uses the rather tautological definition developed in the federal courts that a manipulation is an attempt to set a price “higher or lower than it would if it reflected the forces of supply and demand” (http://www.cftc.gov). 6Consider a large purchase, which will tend to increase the price. If the position is rapidly unwound, no share will sell for more than the initial price unless the beliefs underlying prices change. Alternatively if investors believe this purchase reflects more favorable fundamentals or will lead other investors to buy, then higher prices are possible. Models formalizing this intuition are discussed below.
6
underlying asset. There are no underlying assets in political stock markets, and so
manipulation can only be detected using data from the prediction market alone.
Our definition of manipulation differs from others which focus on the goal of
investor profits. The reason we focus on market prices stems from the richer set of
motives for manipulating prediction markets. While profit-seeking is the main objective
of manipulation in traditional financial markets, investors in prediction markets may be
willing to accept losses if this has large and lasting effects on prices. These manipulators
might be primarily interested in the feedback effect of such prices. For example, in
political prediction markets an investor could sell shares to lower prices and signal a
candidate has weakened. This might influence the choice of undecided voters, either
directly or through the media. The manipulator also might be interested in other indirect
effects, such as a spillover into other financial markets such as the NYSE. We are
agnostic on the exact incentives of the manipulating trader. As long as the manipulator’s
goal involves a long-term change in prices and there is no new information—a common
feature of the objectives listed above-- the market response should be similar.7 Our goal
is to focus on how markets respond to these attacks. Still they suggest care is needed in
the empirical work. For example, rather than focusing on volume-weighted prices
(reflecting the typical price a manipulator might get) we might be more interested in a
time-weighted price (since an extended period with unusual price might attract attention,
even if trading is light).
Our work complements two related papers. Hanson, Oprea, and Porter (2006)
find that manipulators are unable to influence the predictive capacity of prices in an
experimental prediction market.8 Camerer (1998) conducts a field experiment at the
horse-track. At the track a wager on a horse pays-off only if that horse wins the race, so
prices can be stated in terms of probabilities. The author simulates manipulation by
placing and then removing a large wager on a specific horse. The final price on this
7Some apparent speculative attacks may not be primarily designed to change prices. For example, a trader from another political market might seek to hedge his position (this is referred to as a lay-off bet) or might seek to learn the market’s depth / resiliency. Still, these are costly activities and there are often far cheaper ways to obtain these objectives. For example a layoff bettor should try and spread his money across different markets to get the lowest purchase price, while the free TradeSports trading screen reports the top fifteen orders (both price and quantity) in the bid and ask queue. 8 Hanson and Opreas (2004) advance a theoretical model arguing that the activities of manipulators increase market accuracy by covering the cost of information acquisition by non-manipulators.
7
horse is virtually identical to that of a control horse, which has similar characteristics but
whose price was not manipulated. We built on his innovative work using both
observational data and field experiments. The markets we study are sufficiently different
to warrant further investigation. For example, the incentives for manipulators may be
different, with profit-making paramount at the track and other objectives outlined earlier
playing a role in the political market.9
Manipulations are traditionally defined as attempt to profit from artificially
changing stock prices. Allen and Gale (1992) divide manipulations into three categories:
action-based (attempting to influence the fundamentals of the underlying asset),
information-based (spreading false information), and trade-based (buying and selling
shares). The first two are explicitly outlawed in the Securities and Exchange Act of 1934
and are not considered here.
b. Models Allowing Successful Manipulation
A range of market microstructure models allow trade-based manipulation
attempts to have long-term effects on prices under rational expectations. The common
feature is information asymmetry, with some traders unsure whether there is an insider
with private information.
Allen and Gale (1992) show that an uninformed manipulator may be able to profit
by making a large purchase or sale which he then rapidly unwinds. In a pooling
equilibrium an informed insider will make the same set of trades, and so the remaining
traders will sustain the price move if their prior is that manipulators are uncommon. The
key point is that the price movements are believed to convey information, and it is the
information asymmetry which is central to this and other models discussed later. Various
9 While our field experiment for the IEM Presidential contracts is similar to Camerer (1998), there are some key differences relating to timing and incentives. First, the track manipulations occurred far before the race started while a preponderance of the wagers is placed right before post time. Investments are more uniform in political stock markets, and the market is fairly thick even months before the election. Second, the payoff of a winning wager at the track is inversely related to the bet total on that horse. An insider has strong incentive to delay his wager until the last possible moment so as to not draw attention (and potentially additional bets) on his horse. Political stock market participants are more likely to infer that even our earliest price shocks were due to an insider, since there is no incentive to delay an investment (payoffs in these markets are fixed at the time of the wager). Third, our cases include markets where wagering is non-anonymous.
8
empirical papers have documented the existence of trade-based manipulation in
traditional financial markets.10
A second class of models involves all traders having private information. In this
case rational investors may chase trends in prices, even when the underlying
fundamentals are unchanged or only slightly perturbed. A survey of these dynamic
models is presented in Brunnermeier (2001) and O’Hara (1995).11 Past prices and
volume can help forecast future values when there is information asymmetry and
investors are learning about one another’s private information (Blume, Easley, and
O’Hara, 1994). In this environment it may also be optimal for investors to herd, to repeat
the last observed action. In this case bad news may not be fully reflected in current
prices, and the herd may be fragile with a small shock leading to a large price change
(Bikhchandani, Hirshleifer, and Welch, 1992; Bulow and Klemperer, 1994). Similarly,
following Keynes’ beauty contest interpretation of financial markets, investors may all
collect the same kind of information and ignore others (Froot, Scharfstein, and Stein,
1992).
There are additional models in which manipulation may be possible. If there are
multiple equilibria, large price changes can be triggered by a sunspot, an uninformative
public information revelation, or small changes in fundamental parameters (Cass and
Shell, 1983; Romer, 1993). And finally manipulation is possible when traders are not
fully rational and exhibit behavioral biases (Mei, et al, 2004)
A common theme from all of these models in which manipulation is possible is
that prices do not serve as a sufficient statistic for public information. This would call
into question the predictive capacity of prediction market.
c. Comments on the Cases We Analyze
Before turning to the analysis, there are two comments about the cases we
consider. First, our cases all involve episodic manipulation in which the trades (and in
some cases supporting limit orders) are executed rather quickly. We do not consider the 10The more recent empirical evaluations have focused on stock pools during the 1920s (Mahoney, Jiang, Mei, 2005), “pump-and-dumps” of penny stocks (Aggarwal and Wu, 2005) or by brokers making personal trades (Khwaja and Mian, 2005), and cornering in futures markets (Merrick, Naik, and Yadav, 2005). 11While a bubble would allow prices to exceed an asset’s fundamental value, rational bubbles are difficult to sustain when there is a known termination time as with prediction markets.
9
case of a deep-pocketed investor who continues to buttress prices for an extended period
of time (weeks rather than days). While the latter case would of interest to study in future
research, such sustained manipulation is more akin to a shift in the demand since it will
involve significant increase in resources on one side of the market. We limit our attention
to traders with some financial constraints.
A second note is that we are focusing on “trade-based” manipulation rather than
“information-based” manipulation, such as the dissemination of false or misleading
information to manipulate securities prices. A potential criticism of our approach is that
real-world manipulators might rely mainly on information-based manipulation, or
perhaps even combine the two approaches and support large trades with the simultaneous
release of information (perhaps false) which justifies the resulting price movements. We
do not believe that rumor-spreading could be successfully employed in political stock
markets.12 Nonetheless, we test this possibility using postings in the TradeSports
Politics/Current Events forum, http://forum.tradesports.com. Among the
thousands of messages from 2004, 174 advocated a specific action (buy, sell, or hold) in
the Presidential market we study. Appendix B shows that these postings are often in the
opposite direction predicted by the criticism (e.g. they suggest trading against the
speculative attacks we study), are often in conflict with one another, and have little
predictive power for future prices or volume. These results support our decision to not
include information-based manipulation in our experimental design or empirical analysis.
III. Iowa Electronic Market (IEM): Field Experiment
a. Background
The IEM is a real-money online futures market operated by the University of
Iowa (http://www.biz.uiowa.edu/iem). It is currently the sole legal U.S. site to
trade in election futures using real money. In contrast to either the historical markets or
12First, it is not clear why traders would listen to such cheap-talk communications. And if they do, traders holding shares on the other side of the manipulator will have incentive to release false information to contradict the original communication. Second, it is difficult for traders to communicate with one another in some prediction markets such as the IEM. Third, the empirical evidence suggests that when communication is possible in financial markets that it has little impact on the direction of future prices (Antweiler and Frank, 2004 who study Internet stock message boards).
10
TradeSports, participants are limited to relatively modest stakes ($5 to $500). The IEM’s
clientele tends to be a select group: highly educated, young, predominately male,
employed with academic or research job (Oliven and Rietz, 2004). Despite these
constraints, the IEM political stock markets have performed quite well. The market
typically forecasts better than polls and passes many efficiency tests (Berg, Nelson, and
Rietz, 2003).
IEM participants purchase contracts whose expiry payoffs are contingent on a
future election outcome. Shares may be bought or sold at anytime via an anonymous and
continually running double auction. A participant can either trade at the current best bid
or ask, or can enter a limit order (an offer to buy or sell some number of shares at a
particular price). Only limited information about the order book is observable, with only
the best bid and ask price listed and no details on quantities. The only historical data
available are daily summaries and the last traded price of each contract.
This paper focuses on the IEM markets on the 2000 presidential election. These
markets had $0.167 million in trading volume and had about one thousand active
investors. In the IEM presidential markets, there were two forms of contracts: Winner-
Take-All (WTA) and vote share (VS) contracts. Both assets were available for the
Democratic candidate (DEM), the Republican (GOP), and the Reform party (REF).All
contracts have expiration payoffs linked to three-party vote shares: each WTA share pays
one dollar if the candidate receives the most votes and zero otherwise, while the VS
payoff equals the candidate’s vote share (prior to expiry, prices are constrained to the unit
interval). For example in the 2000 presidential election the DEM candidate (Al Gore)
received 49.9% of the three-party vote, the most of any candidate. Thus one share of
DEM VS paid $0.499 and one share of DEM WTA paid $1. All other WTA contracts
expired worthless. Note that (in contrast to both the historical markets and TradeSports
presidential futures markets) the WTA is not based on the Electoral College winner.
This created much confusion on election night 2000 when the popular vote went
for Gore but the Electoral College vote was projected for Bush. Figure 1 charts the
gyrations of the IEM WTA contract on the night of 7 November 2000 and morning of 8
November. According to the IEM contract definitions, Gore won the 2000 WTA. Yet
when the major networks proclaimed that Bush had won the Electoral College at 1:20AM
11
CST, the Bush price rose to near a dollar. At this point it was already apparent that Bush
was going to lose the popular vote (he was slightly behind in the VS market at midnight
of 11/8), and he fell behind in the official aggregate vote tallies between 3:30 and
4:20AM CST. At this point, there was little uncertainty with regard to the IEM contracts
and yet the prices were the exact opposite of where they should be. This is consistent
with traders incorrectly believing the WTA contract was based on the Electoral College.
The market slowly reversed itself and (the day after the election) the correct price was
offered.
b. Experiment
In the four months preceding the 2000 election, we engaged in a series of
controlled uninformative trades in the IEM presidential markets. The trades sought to
mimic the behavior of an insider with private information and followed a formalized
protocol.13 The trades involved randomly investing real money in one or both of the
WTA and VS contracts, with the side -- DEM or GOP --determined based on hundredth
digit of Dow day before.14 Our goal was to test whether other investors recognized these
were uninformed speculative attacks (sending prices back to their initial level), or rather
they believed they were due to privately informed insiders (and so prices did not
revert).15 The next sub-section justifies our experimental design.
Figure 2 summarizes the size of our investments and the resulting change in
prices (the next sub-section interprets these magnitudes). There were 11 planned trading
episodes, roughly 10 days apart, starting 110 days before the election. The experimental
design involved four types of trades: investing in the WTA contract alone; in the VS
contact alone; in both the WTA and VS contracts; and selling all of out holdings. The
13The procedures are codified in official trade strategy document, which is available at http://people.ku.edu/~cigar. There was also an outside board which received this document prior to the execution of any trades. 14There was no attempt to manipulate the REF contract which had virtually no chance of getting a plurality (the leading third party in the 2000 election was the Green party, and the REF WTA contract was at $0.005 a month before our trades began). In the analysis below, we normalize DEM and REP VS prices to be two-party shares , priceDEM,,t/(priceDEM,,t+priceREP,,t) and priceREP,,t/(priceDEM,,t+priceREP,,t). 15The data for our analysis was collected from trader accounts, which provide basic statistics on each asset at any time: last, bid, ask, high, low. The main IEM web page updated the information every 15 minutes while the trader screen was updated in real-time. We collected data from the trader screen for several hours before, during, and after the trades
12
investments were made as follows. If the trade involved only WTA contracts, if it was
randomly determined (by the Dow) to buy GOP, then an initial investment of $160 was
used to purchase this contract at market prices. (This typically required multiple orders.
At each order, we would instead buy the entire slate and sell DEM if that was cheaper.)
Following these trades supporting limit orders were placed for $80 to buy GOP at $.006
below last Ask and $80 to sell DEM at $.006 above last Bid. (Some of these did not
trade, since the orders were set to expire two days after they were entered.) If the trade
involved only VS contracts, the procedure was identical but for one-half the amount.
When the trades involved both the WTA and VS, we used the amounts listed above and
first completed the WTA orders (we planned to stop VS trades before the $80 limit if
prices in the two markets satisfied the equilibrium condition, but this constraint was never
binding). Finally, we planned to sell all of our holdings in our second to last order (this
was on 10/28 and involved $566 in total).16 The intitial trades and subsequent limit orders
were typically executed in a 15-30 minute trading window.
The experiment was designed to exploit the existence of the two IEM presidential
markets. As we described above, some investments were in one market only (VS or
WTA) and others were in the two simultaneously. The reason for this is the two markets
are linked to the same underlying fundamental, a candidate’s final vote share. Under
efficient markets, the VS price is the best estimate of a candidate’s final vote total given
the current available information while the WTA price is the best estimate as to the
probability he will get a plurality of votes. There is an equilibrium relationship between
the VS and WTA markets. Suppose that each day an iid news shock arrives which alters
beliefs about the final vote totals. Under some functional form assumptions laid out in
Appendix A, prices for a given candidate satisfy,
(1) priceWTAt* = σνt
-1×priceVSt *
where “*” indicates an inverse normal transformation (used to transform prices, which lie
on the unit interval, to the entire real line) and is σνt is a measure of uncertainty in final
vote shares t periods before the election. Intuitively, the WTA price is higher when the
16Our trades deviated from the schedule twice. On 10/23 our limit orders could not be executed because of insufficient cash funds and the absence of shares to short in our portfolio. On 7/20, a trading mistake led to a reduced initial trade.
13
candidate is expected to received more votes and (if this candidate is the favorite) when
there is less uncertainty.17 An indirect piece of evidence in support of this equilibrium is
that daily volume in the two markets has a correlation of 0.60. We use equation (1) in the
analysis, investigating whether our trades upsets the equilibrium relationship between the
markets.
The two markets also help us distinguish between three leading hypotheses about
the market response: (i) the markets are not actively monitored; (ii) the attacks change
beliefs and markets are monitored; (iii) the attacks do not change beliefs and markets are
monitored. Under the first and second hypothesis, successful manipulations are possible.
In the second case, investors incorrectly attribute our attacks to an insider and believe that
there has been a change in fundamentals.18 Under the third hypothesis, our trades are
correctly considered uninformative in which case it is difficult to successfully manipulate
these markets. Table 1 summarizes the price dynamics following our trades under each of
the three hypotheses.
c. Justifying the Experimental Design
It is important that our traders are uncertain whether the price changes we
engineer are the result of a privately informed insider or rather are due to a manipulator.
In this section we argue that our trades are comparable to actual cases of prediction
market insiders and manipulators. Many of these cases are relatively high profile, and so
should be familiar to well-informed prediction market traders.
Our trades created a sudden price move, unaccompanied by any public news,
which we then sustain with supporting limit orders. Appendix C contains several
examples of insiders and manipulators creating similar price changes in prediction 17An interpretation (2) using the untransformed prices is possible with a first-order Taylor approximation around one-half,
x* ≈(x-0.5)/φ(0) where φ(0)≈0.399 is the normal density evaluated at zero. So long as the election is close (both priceVS
t and
priceWTAt are in the neighborhood of 0.5), this can be applied to (2),
(2’) priceWTAt ≈ 0.5 + σνt
-1×(priceVSt-0.5)
The WTA price is anchored at one-half, and is increasing in his expected vote margin (priceVSt-0.5)
Discounted by how much uncertainty remains (σνt). 18It is also possible that investors believe that other participants will change their behavior. For example, there may be a “Soros effect” where investors believe the trades were made by a single speculator who will continue to invest and himself sustain a price change. But this is not likely in the IEM, since there is a $500 limits on investments.
14
markets. First, we discuss cases in which insiders create rapid price changes.19 Intuitively
the insiders have time-sensitive information, and they must trade quickly to take
advantage of it before others learn about it. For example, in one case traders knew that
John Edwards was the Democrat’s 2004 Vice-Presidential nominee several hours before
it was announced. While this information allowed for profitable trades, it would clearly
be valueless a short time later after the choice was made public. Consistent with this
argument, prediction market prices respond rapidly to public information shocks.20
Second, we show that manipulation attempts also involve price jumps. Manipulators want
the other traders to believe there is an insider present, and so will implement price
changes that mimic what an insider would do. This is precisely the strategy discussed in
the theoretical models of market manipulation discussed earlier.
These cases aside, the main concern with our experiment is that traders might
dismiss the possibility of an inside trader because of the limited financial stakes involved.
We therefore tailored certain aspects of our trades to make insider trading appear more
plausible. Our trades were always at night, starting at either 8 pm or 11:15pm CDT/CST.
We selected this late evening schedule to make the possibility of insider trading appear
more plausible. The first reason for this is that information was less widely distributed
during these times than earlier in the day. It would be difficult for an investor to refute
that a price change was due to a non-public news shock, which at these hours might not
be widely reported and known only by the individual making the trades. A second reason
is that an insider has fewer investing options during this time, since all of the traditional
U.S financial markets are closed. Given the likely time-sensitive nature of any private
information, the most profitable trading opportunity was likely the IEM. An insider trade 19There is also evidence that insiders engage in similar trading patterns in more traditional financial markets. Such evidence stem from SEC investigations of stock market insiders who trade based on material non-public information. Stock brokers who have advance warning of favorable news stories on certain stocks made rapid trades before the information became public (Fishe and Robe, 2004), and over a third of insiders who traded on advance knowledge of Anheuser-Busch’s takeover of Campbell Taggart only made a single transaction (Cornell and Sirri, 1992). 20The rapid response to news is evident in historical markets (Rhode and Strumpf, 2004), in contemporary markets (Snowberg et al, 2007), and in experimental prediction markets (Plott and Sunder, 1982). Specific examples illustrate this as well. During the 2004 Democratic primary the two main negative news stories involving John Kerry were his poor showing in the Wisconsin primary and an announcement that he had an affair with a former intern. In both cases, prices in the TradeSports Democratic nomination market responded rapidly: within a half-hour of the first public announcement of the Wisconsin primary outcome, Kerry’s price fell from 89 to 72 and following the intern story Kerry’s price fell from 92 to 72 (the latter story could not be corroborated and Kerry’s stock returned to the mid-80’s within three hours)
15
in the IEM is less plausible during the day, since a trader could instead invest in other
thicker markets (many of the examples of insider trading discussed in the Appendix
occurred at night.
We also set the size of our trades to be large enough to be noticed, but no so large
that the resulting price movement would appear implausible. The trades in the 2004
TradeSports market discussed in the introduction were immediately recognized as a
manipulation rather an inside trade, because the price change was so anomalous. To
avoid this, we never moved prices by more than what was observed on other days. Half
of the days in which we did not trade had intra-day price ranges comparable to the
average price change we engineered. But only a tenth had price ranges as large as the
biggest which we caused. This suggests our largest trades were comparable in magnitude
to the biggest observed stories during this election, such as the revelation a week before
the election that Bush was charged with DUI in the 1970s. It is precisely the response to
information like this which we are seeking to emulate.
Finally, the IEM’s use of anonymous trading also helped lend credence to the
possibility of insider trading. Because the order book and all trades are anonymous, there
is no way for traders to realize that all this activity is the result of a single individual.
Hence a trader observing the market cannot discount the possibility that the price spike
reflects some new information which many others (but not him) know. The supporting
limit orders which we place following our initial trades furthers this illusion, since it is
consistent with the inside information propagating to additional traders.
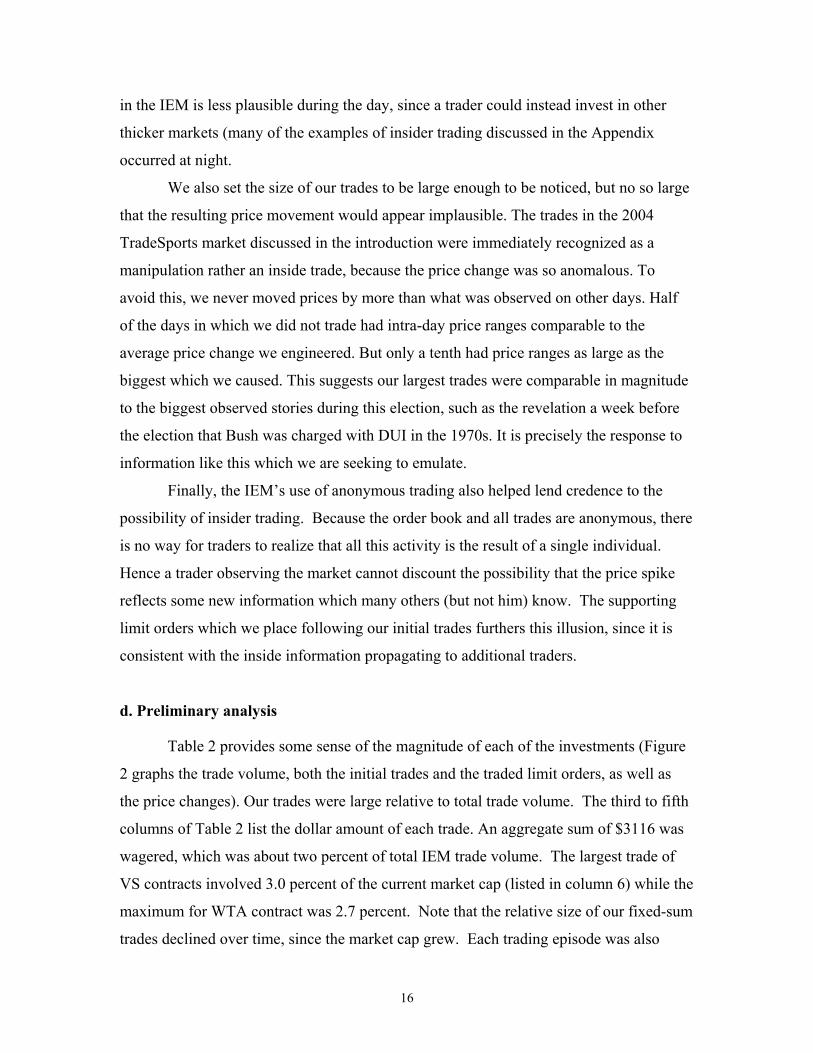
d. Preliminary analysis
Table 2 provides some sense of the magnitude of each of the investments (Figure
2 graphs the trade volume, both the initial trades and the traded limit orders, as well as
the price changes). Our trades were large relative to total trade volume. The third to fifth
columns of Table 2 list the dollar amount of each trade. An aggregate sum of $3116 was
wagered, which was about two percent of total IEM trade volume. The largest trade of
VS contracts involved 3.0 percent of the current market cap (listed in column 6) while the
maximum for WTA contract was 2.7 percent. Note that the relative size of our fixed-sum
trades declined over time, since the market cap grew. Each trading episode was also
16
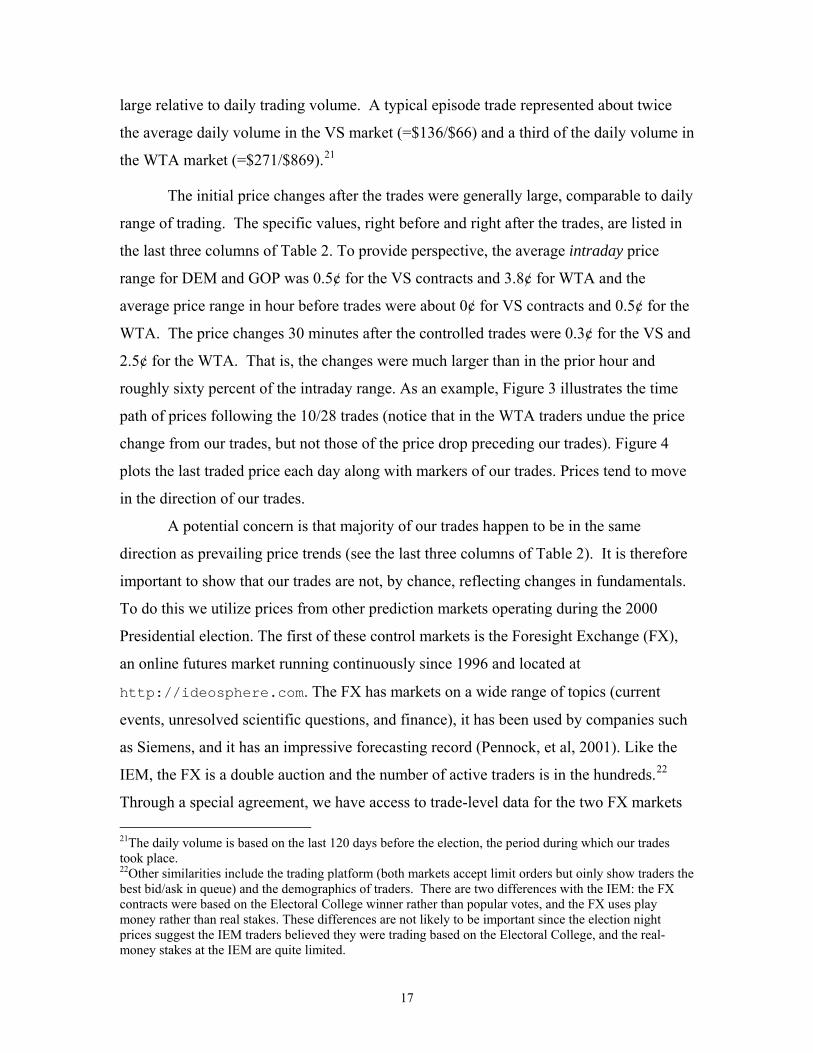
large relative to daily trading volume. A typical episode trade represented about twice
the average daily volume in the VS market (=$136/$66) and a third of the daily volume in
the WTA market (=$271/$869).21
The initial price changes after the trades were generally large, comparable to daily
range of trading. The specific values, right before and right after the trades, are listed in
the last three columns of Table 2. To provide perspective, the average intraday price
range for DEM and GOP was 0.5¢ for the VS contracts and 3.8¢ for WTA and the
average price range in hour before trades were about 0¢ for VS contracts and 0.5¢ for the
WTA. The price changes 30 minutes after the controlled trades were 0.3¢ for the VS and
2.5¢ for the WTA. That is, the changes were much larger than in the prior hour and
roughly sixty percent of the intraday range. As an example, Figure 3 illustrates the time
path of prices following the 10/28 trades (notice that in the WTA traders undue the price
change from our trades, but not those of the price drop preceding our trades). Figure 4
plots the last traded price each day along with markers of our trades. Prices tend to move
in the direction of our trades.
A potential concern is that majority of our trades happen to be in the same
direction as prevailing price trends (see the last three columns of Table 2). It is therefore
important to show that our trades are not, by chance, reflecting changes in fundamentals.
To do this we utilize prices from other prediction markets operating during the 2000
Presidential election. The first of these control markets is the Foresight Exchange (FX),
an online futures market running continuously since 1996 and located at
http://ideosphere.com. The FX has markets on a wide range of topics (current
events, unresolved scientific questions, and finance), it has been used by companies such
as Siemens, and it has an impressive forecasting record (Pennock, et al, 2001). Like the
IEM, the FX is a double auction and the number of active traders is in the hundreds.22
Through a special agreement, we have access to trade-level data for the two FX markets 21The daily volume is based on the last 120 days before the election, the period during which our trades took place. 22Other similarities include the trading platform (both markets accept limit orders but oinly show traders the best bid/ask in queue) and the demographics of traders. There are two differences with the IEM: the FX contracts were based on the Electoral College winner rather than popular votes, and the FX uses play money rather than real stakes. These differences are not likely to be important since the election night prices suggest the IEM traders believed they were trading based on the Electoral College, and the real-money stakes at the IEM are quite limited.
17

covering the 20000 presidential election. These data include price, quantity, and trader-
id’s for each transaction and cover the entire period these markets were open (04/97-
12/00).
We also consider as controls prices from two internet sports bookmakers,
Intertops (http://intertops.com, located in Antigua) and Centrebet
(http://www.centrebet.com, located in Australia). These prices differ from the
other sources in that they are set by the bookmaker, with customers able to take either
side of the bet at the listed odds.23 There are other differences from the IEM which makes
these useful control markets:
- The monetary stakes were far higher, with no limits on bet size. over one million
dollars was bet at Intertops while $0.3m was wagered at Centrebet in just the last
three weeks before the election
- The markets are isolated from the IEM (Centrebet prohibited U.S. bettors in 2000), so
persistent differences in the prices are possible. In particular, it is unlikely that bettors
will arbitrage price differences with the IEM
- Specifically with Centrebet, our trades occur during business hours in Australia, when
both the bookmaker and the predominantly Australian bettors are likely to be actively
monitoring the market.
Through a special arrangement we received posted odds from these two books: for
Centrebet the exact time and level of each price change over 10/23/00-11/7/00 (the entire
period during which they offered odds) and for Intertops the prices which were offered
each day over 7/1/00-11/7/00.
Table 3 compares prices in the IEM WTA and the three control markets (we do
not include the IEM VS since there is no analogous control market). The top two panels
show the tight connection between the IEM and the FX (see also Figure 5).24 The left part
23Bookmakers set and continuously revise odds on events, with the goal of attaining equal bet volume on all sides of the event. This suggests that prices will be comparable with those from the double auction market used at the IEM. As with FX, these markets were based on the Electoral Collage rather than popular vote winner. 24The sample covers the three months preceding the election where we made trades (7/00-11/00). For each IEM observation, we match the most recent transaction price in the FX. In the regressions, we weight observations by the inverse number of other observations in a fifteen minute window to ensure each time period receives equal weight (we get similar results if instead we use the last price in each fifteen minute window). We follow a similar procedure for the other two control markets discussed below (the one
18
of Panel A shows that the mean DEM and GOP price are virtually identical in the two
markets, and using a two-tailed t-test we cannot reject the null of identical means.
However, this link is broken in the hour following our trades: when we bought
Democrats or sold Republican shares, the IEM DEM price rose / IEM GOP price rose
relative to the FX, and this difference is statistically significant. The opposite occurs
when we made trades in the opposite direction. Panel B provides regression evidence. In
the left panel we pool DEM and GOP contracts. The first estimate shows that we cannot
reject the null that prices in the two markets are identical (the slope is one and the
intercept is zero). The next estimate adds a term which is one in the hour after we traded
in favor of this contract, negative one in the hour after we trade against this contract, and
zero otherwise. The estimates indicate that our trades had a statistically significant effect
on IEM prices: a pro-DEM / anti-GOP trade raises the DEM shares 3.3¢ in the hour after
a trade and depresses GOP share by a similar amount. The third column includes an
interaction between FX prices and the trade variable described above. This term has
neither an economic or statistically significant effect, further suggesting that our trades
are unrelated to changes in fundamentals.25 The right panel repeats the estimates using
just the DEM WTA contract and finds similar results.
Panel C considers the two internet sports books, Centrebet and Intertops. These
estimates reinforce those for the FX. The Centrebet market was open for the three weeks
prior to the election and overlaps with our last three trades. We again find that the prices
are close to the IEM market, though the estimates are far less precise than with the FX
(this in part reflects the relatively slow frequency with which internet books change their
prices, as well as the shorter sample period). Relative to the Centrebet, the IEM prices are
significantly higher in a market right we made purchases or sold in the complementary
market. The Intertops prices also matched with IEM prices, though we cannot use these
data to evaluate the impact of our trades since they are at a daily frequency.
***TO ADD:
difference is with the Intertops market; since this is daily data, we restrict the IEM data to the last traded price each day). 25 As further evidence, we examined price spikes in the FX data. There were N=90 large changes in FX prices (10 points or more relative to the previous fifteen minute price) during the times when the IEM WTA was open. None of these changes coincided with our trades, though about two-thirds of them correspond to similar price spikes in the IEM.
19
comparison with polls: CHOW test of structural break after
manipulation***
There is one last point before turning to the main analysis. We need an estimate of
the price dispersion term σνt from equation (1). Using a functional form assumption
described in Appendix A, we have σνt = sqrt(s22 + s1
2×(T-t)) where T-t=number days until
election, and si≥0.26 The estimates using daily data are listed in Table 4 (the equation is
estimated using NLLS, and bootstrapped standard errors are listed since the error term is
heteroscedastic and autocorrelated). Consistent with the equilibrium model, the constant
is economically and statistically small. The terms in σνt are consistent across parties and
also across elections. In all cases, most of the dominant term is the time invariant term.
The estimates imply that a day before election, the vote share standard deviation is about
0.04. while one hundred days before the election it is about 0.05.27
e. Results
We have eleven episodes of trades, which include fifteen attacks (four of the
episodes involved both the VS and WTA markets). We employ a standard methodology,
described below, to evaluate the economic and statistical significance of the resulting
price changes. We aggregate the data from our eleven trades into fifteen-minute periods.
For prices we use the last traded price, and if there are multiple observations in the period
we average these prices. When the attack called for shares to be sold, we take the
negative of prices. This ensures the attacks are aligned, with each case seeking to increase
prices.
We employ event study methodology (Campbell, Lo, and MacKinlay, 1997).
Since there are no dividends in this market, the rate of return from buying a contract at
time t-1 and selling it the next period t is,
(2) Rt ≡ (pricet-pricet-1)/pricet
26We also considered a non-parametric approach where we estimated a separate implied volatility measure for each day, σνt = priceWTA
t*/priceVS
t *. This approach proved infeasible since for several days σνt<0, e.g.
priceWTAt>0.5 and priceVS
t <0.5.
27Using a linear Taylor approximation StdDev(pVS) ≈ φ(0)StdDev(pVS*) and φ(0)=0.4.
20
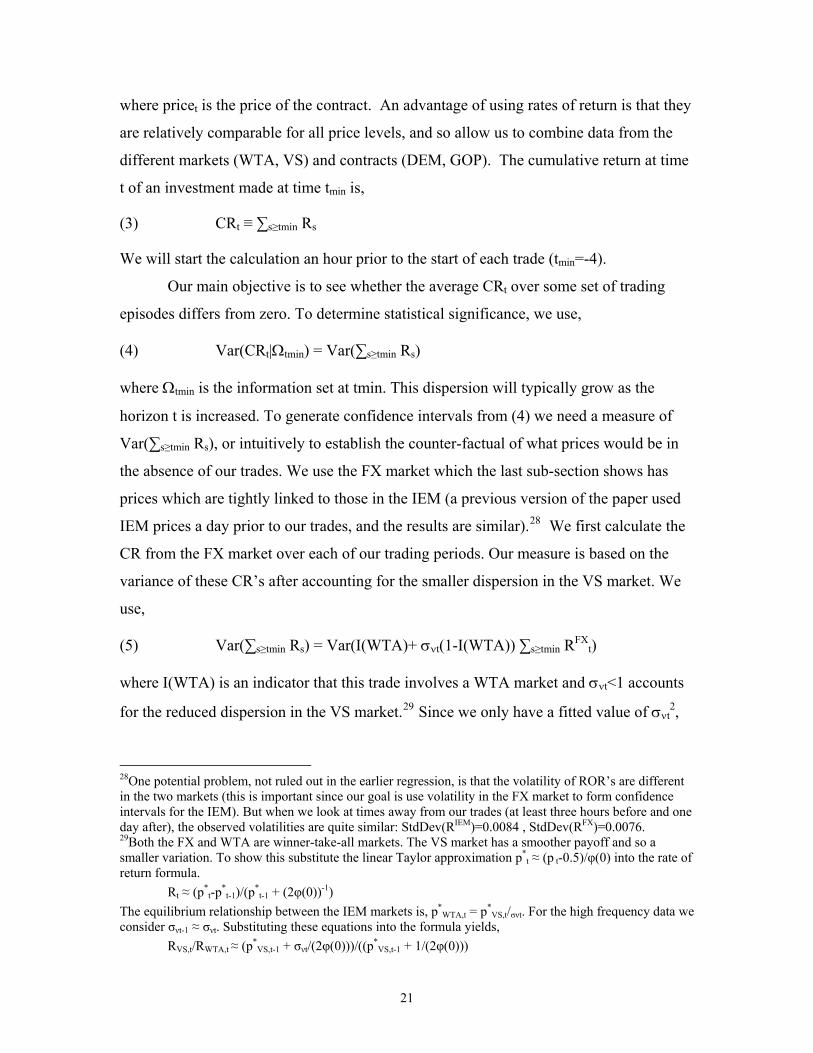
where pricet is the price of the contract. An advantage of using rates of return is that they
are relatively comparable for all price levels, and so allow us to combine data from the
different markets (WTA, VS) and contracts (DEM, GOP). The cumulative return at time
t of an investment made at time tmin is,
(3) CRt ≡ ∑s≥tmin Rs
We will start the calculation an hour prior to the start of each trade (tmin=-4).
Our main objective is to see whether the average CRt over some set of trading
episodes differs from zero. To determine statistical significance, we use,
(4) Var(CRt|Ωtmin) = Var(∑s≥tmin Rs)
where Ωtmin is the information set at tmin. This dispersion will typically grow as the
horizon t is increased. To generate confidence intervals from (4) we need a measure of
Var(∑s≥tmin Rs), or intuitively to establish the counter-factual of what prices would be in
the absence of our trades. We use the FX market which the last sub-section shows has
prices which are tightly linked to those in the IEM (a previous version of the paper used
IEM prices a day prior to our trades, and the results are similar).28 We first calculate the
CR from the FX market over each of our trading periods. Our measure is based on the
variance of these CR’s after accounting for the smaller dispersion in the VS market. We
use,
(5) Var(∑s≥tmin Rs) = Var(I(WTA)+ σνt(1-I(WTA)) ∑s≥tmin RFXt)
where I(WTA) is an indicator that this trade involves a WTA market and σνt<1 accounts
for the reduced dispersion in the VS market.29 Since we only have a fitted value of σνt2,
28One potential problem, not ruled out in the earlier regression, is that the volatility of ROR’s are different in the two markets (this is important since our goal is use volatility in the FX market to form confidence intervals for the IEM). But when we look at times away from our trades (at least three hours before and one day after), the observed volatilities are quite similar: StdDev(RIEM)=0.0084 , StdDev(RFX)=0.0076. 29Both the FX and WTA are winner-take-all markets. The VS market has a smoother payoff and so a smaller variation. To show this substitute the linear Taylor approximation p*
t ≈ (p t-0.5)/φ(0) into the rate of return formula.
Rt ≈ (p*t-p*
t-1)/(p*t-1 + (2φ(0))-1)
The equilibrium relationship between the IEM markets is, p*WTA,t = p*
VS,t/σνt. For the high frequency data we consider σνt-1 ≈ σνt. Substituting these equations into the formula yields,
RVS,t/RWTA,t ≈ (p*VS,t-1 + σνt/(2φ(0)))/((p*
VS,t-1 + 1/(2φ(0)))
21

we bootstrap this equation using the equilibrium equation estimated in Table 4. Using
equations (4) and (5), we can test whether the attacks had a statistically significant effect
on prices at any moment. The attack has a significant effect at time t if zero lies outside
the two standard error confidence interval around CRt (roughly a ninety-five confidence
band).
We begin the analysis by considering all of our market attacks. Figure 6 shows
the average CR for the full set of eleven trading episodes, which include fifteen attacks.
The figure plots CR values and their associated confidence intervals for the first four and
a half hours after the trades. There is little trend in the return for the hour prior to the
attack (t=0), which suggests the trades were not reinforcing some pre-existing price trend.
The CR increases by a statistically significant four percent in the first half hour (the
typical time to fully execute a trade), reflecting the large change in prices associated with
attacks. The CR begins to decline immediately following the end of the trade period, and
half of the effect is undone within two and a half hours (and the effect is no longer
statistically different from zero). The CR returns to zero within twelve hours (figure
omitted). The relatively rapid unwinding of the attacks is impressive given that they
occur during low volume periods, as discussed earlier.
We next consider various subsets of attacks. Figure 7 shows the average CR for
the seven episodes in which only one market is attacked (four WTA-only and three VS-
only attacks). In the WTA trades the returns spike up even more sharply following the
attack, with a six percent return in the first half hour. The mean CR stays at an elevated
level for the first two hours, at which point there is a large reversion. The price increase
is basically fully undone within four hours. The VS trades have a rather modest effect
and prices initially increase less than one percent. The mean CR remains virtually
unchanged for the next ten hours, reflecting the relatively low activity in this market (see
the market caps listed in Table 2), at which point prices return to their initial level. We do
This can be further simplified using the condition p*
VS,t≈0 which is needed for the linear approximation to be valid,
RVS,t ≈ σνtRWTA,tand so,
Var(RVS,t) ≈ σνt2Var(RWTA,t)
Note that σνt2<<1 based on the estimates described in the last subsection.
22
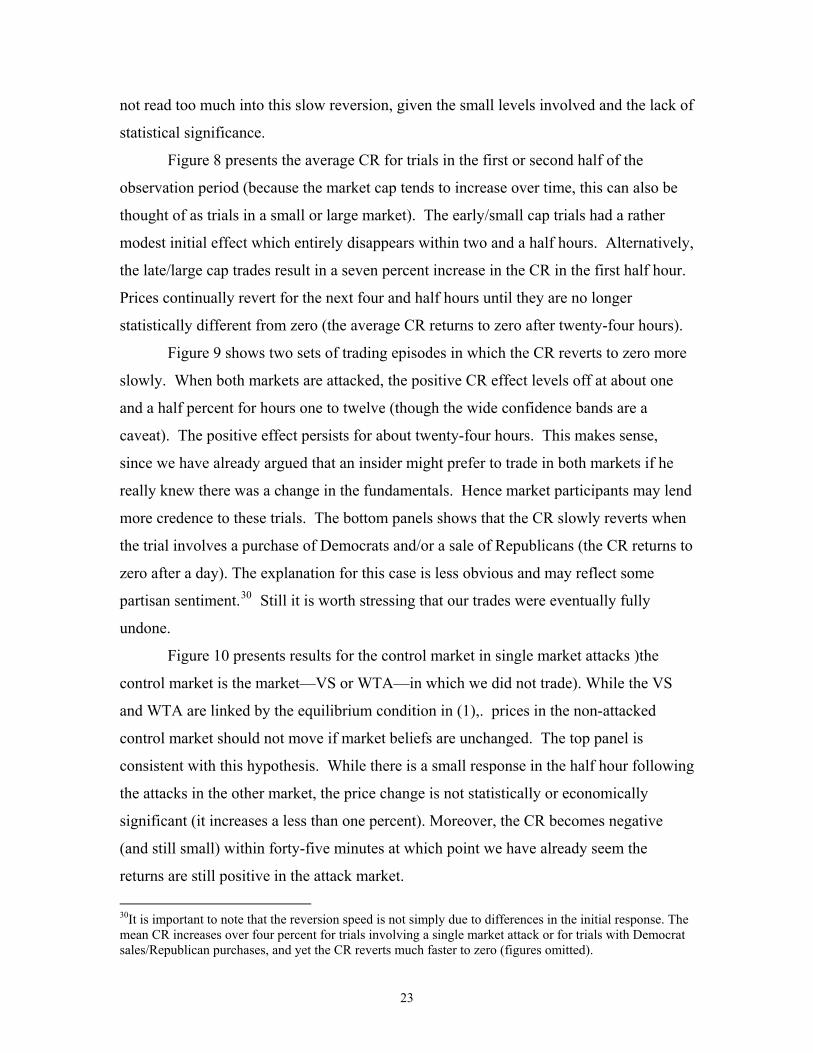
not read too much into this slow reversion, given the small levels involved and the lack of
statistical significance.
Figure 8 presents the average CR for trials in the first or second half of the
observation period (because the market cap tends to increase over time, this can also be
thought of as trials in a small or large market). The early/small cap trials had a rather
modest initial effect which entirely disappears within two and a half hours. Alternatively,
the late/large cap trades result in a seven percent increase in the CR in the first half hour.
Prices continually revert for the next four and half hours until they are no longer
statistically different from zero (the average CR returns to zero after twenty-four hours).
Figure 9 shows two sets of trading episodes in which the CR reverts to zero more
slowly. When both markets are attacked, the positive CR effect levels off at about one
and a half percent for hours one to twelve (though the wide confidence bands are a
caveat). The positive effect persists for about twenty-four hours. This makes sense,
since we have already argued that an insider might prefer to trade in both markets if he
really knew there was a change in the fundamentals. Hence market participants may lend
more credence to these trials. The bottom panels shows that the CR slowly reverts when
the trial involves a purchase of Democrats and/or a sale of Republicans (the CR returns to
zero after a day). The explanation for this case is less obvious and may reflect some
partisan sentiment.30 Still it is worth stressing that our trades were eventually fully
undone.
Figure 10 presents results for the control market in single market attacks )the
control market is the market—VS or WTA—in which we did not trade). While the VS
and WTA are linked by the equilibrium condition in (1),. prices in the non-attacked
control market should not move if market beliefs are unchanged. The top panel is
consistent with this hypothesis. While there is a small response in the half hour following
the attacks in the other market, the price change is not statistically or economically
significant (it increases a less than one percent). Moreover, the CR becomes negative
(and still small) within forty-five minutes at which point we have already seem the
returns are still positive in the attack market.
30It is important to note that the reversion speed is not simply due to differences in the initial response. The mean CR increases over four percent for trials involving a single market attack or for trials with Democrat sales/Republican purchases, and yet the CR reverts much faster to zero (figures omitted).
23
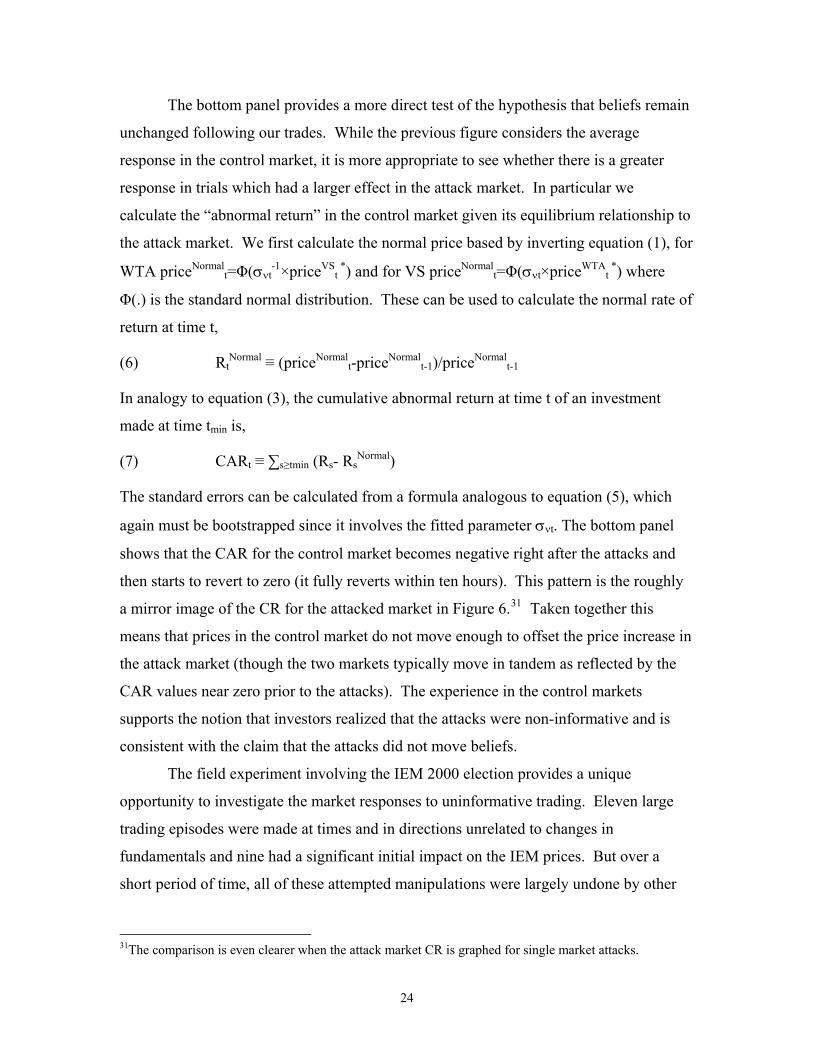
The bottom panel provides a more direct test of the hypothesis that beliefs remain
unchanged following our trades. While the previous figure considers the average
response in the control market, it is more appropriate to see whether there is a greater
response in trials which had a larger effect in the attack market. In particular we
calculate the “abnormal return” in the control market given its equilibrium relationship to
the attack market. We first calculate the normal price based by inverting equation (1), for
WTA priceNormalt=Φ(σνt
-1×priceVSt *) and for VS priceNormal
t=Φ(σνt×priceWTAt *) where
Φ(.) is the standard normal distribution. These can be used to calculate the normal rate of
return at time t,
(6) RtNormal ≡ (priceNormal
t-priceNormalt-1)/priceNormal
t-1
In analogy to equation (3), the cumulative abnormal return at time t of an investment
made at time tmin is,
(7) CARt ≡ ∑s≥tmin (Rs- RsNormal)
The standard errors can be calculated from a formula analogous to equation (5), which
again must be bootstrapped since it involves the fitted parameter σνt. The bottom panel
shows that the CAR for the control market becomes negative right after the attacks and
then starts to revert to zero (it fully reverts within ten hours). This pattern is the roughly
a mirror image of the CR for the attacked market in Figure 6.31 Taken together this
means that prices in the control market do not move enough to offset the price increase in
the attack market (though the two markets typically move in tandem as reflected by the
CAR values near zero prior to the attacks). The experience in the control markets
supports the notion that investors realized that the attacks were non-informative and is
consistent with the claim that the attacks did not move beliefs.
The field experiment involving the IEM 2000 election provides a unique
opportunity to investigate the market responses to uninformative trading. Eleven large
trading episodes were made at times and in directions unrelated to changes in
fundamentals and nine had a significant initial impact on the IEM prices. But over a
short period of time, all of these attempted manipulations were largely undone by other
31The comparison is even clearer when the attack market CR is graphed for single market attacks.
24
traders. In total, these results suggest that the long-term market dynamics were not
influenced by uninformative trading.
IV. The New York Betting Market, 1880-1944
a. Context
We now explore the impact of manipulation is the large markets for election
betting centered in New York City between 1880 and 1944 (Rhode and Strumpf, 2004;
2006). Participants wagered on national races as well as on state and local elections. In
the era before scientific polls, the leading newspapers intensively reported movements of
the betting odds, providing nearly daily quotes from early October until Election Day.
These historical markets are of special interest because partisans, including Democratic
and Republican operatives, actively and publicly traded. Accusations of manipulation
and staged bets were rife.
In contrast to our investigation of the IEM, we are outsiders rather than insiders.
We can not observe the actions and motives of the potential manipulators, only.timing
and price movements associated with public charges of speculative attacks. Nonetheless,
examining these historical episodes promises to shed substantial light on similar
accusations in modern-day prediction markets.
The structure of the historical betting markets evolved over time.32 Although it
was on the borderline of legality, election betting was open conducted, well publicized,
and employed standardized contracts, typically involving Winner-Take-All futures. The
centers of election betting activity included the New York Stock Exchange and the Curb
Market and the several uptown hotels. The standard practice was for a “betting
commissioner” to hold the stakes (or signed agreements) of both parties, charging a five
percent commission on the winnings. During the market’s heyday in the late 1890s and
early 1900s, the names and four-figure stakes of bettors filled the pages of New York’s
32Moving out of pool rooms in the 1880s, activity centered on the Curb Exchange and the major Broadway hotels until the mid-1910s. In the 1920s and 1930s, specialist firms of betting commissioners, operating out of offices in the financial district, took over the trade. These firms were variously viewed as brokerages, bucket shops, or bookie joints. New York Times, 10 Nov. 1906, p. 1; 29 May 1924, p. 21; 4 Nov. 1924, p. 2; Wall Street Journal, 29 Sept. 1924, p. 13. New York Times, 9 Nov. 1916, p. 3. For the long tradition of election betting, see New York Herald Tribune, 2 Nov. 1940, p. 23.
25
daily newspapers. Unlike today’s markets, betting in Old New York was not anonymous.
The stories may have served to advertise the political affiliation of the bettors as well as
to confirm the existence of the wagers.33 Tammany Hall, the New York City Democratic
machine, purportedly had a special war chest to finance its wagering.34
Compared with modern prediction markets, the betting volume in the historical
New York market was huge. Figure 11 assembles estimates from selected newspapers of
the sums wagered in the New York market from 1884 to 1928, converted to year 2000
purchasing power.35 The betting volume varied depending the race,, enthusiasm for the
candidates, and the legal environment. The period of greatest sustained activity was
between 1897 and 1906. But the clear peak was the 1916 Wilson-Hughes peak, when
$158 million (2000 dollars) wagered in the organized New York markets. This was more
than twice the total spending on the election campaigns in that year and ten times the
volume in the 2004 TradeSports market. The betting volume tended to be much higher in
Presidential years than in years when the NY Governor ran alone or the New York City
Mayor was up for election.36 The average bet volume for the 25 elections appearing in
the figure was roughly $22 million (in 2000 purchasing power). As a point of contrast,
trading volumes on the IEM for the 1988-2000 elections never exceeded $0.15 million in
any one contest (see Berg, et al, 2003).
The Wall Street betting market was noted for its remarkable ability to predict
election outcomes. As the New York Times put it, the “old axiom in the financial district
[is] that Wall Street betting odds are ‘never wrong’.”37 Rhode and Strumpf (2004) shows
that in the fifteen presidential elections between 1884 and 1940, the betting market
underdog in mid-October won only once -- in the close 1916 contest. In cases where 33 Politicians as a matter of loyalty could be expected to bet publicly for their party’s candidate, even when they did not favor them. For example, in 1900, Richard Croker made highly publicized bets in favor of William Jennings Bryan against his own preferences. New York Times, 5 Nov 1916. 34 SOURCE. But Tammany famously did not keep written records of its activities. 35 The reported totals in most instances represent the volume of money changing hands rather than the total amount staked. 1928 is taken as the end because quotations regarding volume become scarcer in the 1930s, not because activity appeared in that decade. Scattered evidence indicates that the betting volumes in 1932 and 1936 were higher than in 1928. 36 The ratios were on the order of 100:39:37. New York Times, 3 Nov. 1924 p. 2 estimated that in Presidential years, about two-thirds of the bets were placed on the Presidential races and the remainder on Governor and local races.. Election betting markets existed across the nation over most of this period, but New York City was the center of activity until the Second World War. 37 New York Times, 28 Sept 1924, p. E1. See also 30 Oct. 1916, p. 4; 7 Nov 1916, p. 1; 7 Oct 1924, p. 18; 6 Nov 1928, p. 46, 8 Nov. 1932 p. 33; 2 Nov. 1936, p. 20.
26
there is a decisive winner, the markets correctly forecast the next president as early as
four months prior to the election. The Wall Street Journal contended that the accuracy of
betting odds held not only for “national elections but applies equally to state and local
races.”38 The odds were “generally considered the best forecasters of Presidential
elections,” as well as “good indicators of probable results in gubernatorial and Mayoralty
results.”39 Rhode and Strumpf (2006) provides further details on the predictive capacity
of these markets in all three types of elections.40
Contrary to these assessments were the frequent assertions that active partisan
involvement, especially by Tammany Hall, systematically distorted the betting odds. As
one example, in closing days of 1926 race for the NY Governor, supporters of
Republican Ogden Mills charged that Tammany Hall was using election wagers as
“indirect propaganda” for Al Smith.41 At other times, charges circulated that Republican
brokers on Wall Street financed speculative attacks. The New York Times on 28 Oct.
1904 reported the GOP was manipulating the Presidential betting odds in favor of T.
Roosevelt. In 1916, Democrats charged “the money was being sent to Wall Street to
force the betting odds to Wilson’s disadvantage, for the effect of wider odds would have,
especially on up-State farmers, who in the past have been influenced by wagers reported
here from below Fulton street. ‘Already,’ one prominent Democrat said, ‘we are hearing
that many up-State farmers are struggling between their conscience and fear that Hughes
will be elected and it might be found out that they voted for Wilson.”42
While there are a variety of reasons for the partisans’ entry into the political
betting markets, the primary goal was to sway public opinion, alter the momentum of the
race, and affect voter turnout. As we describe below, most of the purported manipulation
attempts were made shortly before the election and almost always in close races where
small changes in public opinion could swing the outcome.
38 Wall Street Journal, 27 July 1920, p. 11. 39 Wall Street Journal, 17 Aug. 1925, p. 5. See also 27 July 1920, p. 11; 29 Sept. 1924, p. 13. 40 We show that the markets were not fully efficient and suffered from long-shot bias, a typical shortcoming of prediction markets. 41 New York Times, 17 Oct. 1926, p. XX10. 42 Washington Post 5 Nov. 1916 p. 1.
27

b. Our Data on Manipulations
To analyze the impact of manipulation, we have collected a large dataset of
betting odds on the presidential, gubernatorial, and mayoral races over the 1880s to the
1940s. Our sample is drawn from the Atlanta Constitution, Brooklyn Eagle, Chicago
Tribune, Christian Science Monitor, Los Angeles Times, New York American, New York
Daily News, New York Evening Journal, New York Herald, New York Sun, New York
Times, New York Tribune, New York World, St. Louis Post Dispatch, Wall Street Journal,
Washington Post, and Washington Star. Our sample includes 4302 daily odds price
quotes for 142 candidates in 52 contests: 16 Presidential elections (1880-1944); 22
Gubernatorial elections (1888 -1936), and 14 Mayoral races (1884-1937).43
We investigate whether episodes associated public charges of manipulations
induced long-lasting prices movements unwarranted by the fundamentals. Given the
available information, we can not state whether intentional manipulation actually
occurred, only what happened during an episode in which manipulation was publicly
charged in one of the major newspapers. Unlike our investigation of the IEM, we are
outside observers. To identify the relevant events, we have surveyed the leading New
York daily newspapers and classified the “manipulation” stories into two categories: (a)
charges of intentional manipulation with investors betting to drive odds prices away from
the levels justified by fundamentals; (b) charges of wash bets --those made between
confederates at non-market odds for publicity purposes-- and of bluffs-- offers to make
bets at non-market odds which are withdrawn when the offer is accepted. Charges were
advanced by participants in the betting markets, those in related financial markets, by
newspaper writers, as well as the supporters of the electoral campaigns involved. Figure
12 gives an example of the manipulation charges as well as the names, dates, and amount
of larger bets.44
43 That is, we may have several different observations on a candidate’s odds price on a given day from different newspapers (or much more rarely, from different articles in the same paper.) If a single article reports several wagers, we average to derive that day’s single observation. We have made no attempt to eliminate duplication resulting from multiple publications of the same article in different newspapers, as might happen if a wire service ran a story on the state of NY betting markets. We have been careful, however, to date the odds price to the day the betting took place rather than the day of the article and to focus on actual bets rather than mere offers. 44 One might think that all such charges were “cheap talk” and that they would be as ubiquitous as stories of partisan involvement or stories of voting fraud. But there were not. Charges of intentional manipulation
28
We first provide a general description of these trades and then return to the
question whether these were in fact manipulation attempts.
Table X provides summary statistics regarding the timing and market conditions
prevailing when charges of manipulation and bluffs occurred. It provides a breakdown
between democratic and republican events and examines all races and presidential
contests only. We identify 46 charges of manipulation/wash sale/bluffing events: 19
charges of full-blown manipulation, 11 raising the Democrat’s odds price and 8 the
Republican’s. 11 involved presidential races with the remainder on state and local races.
Note that Republican events occur almost exclusively in the presidential contests,
implying the analysis can be combined. In general, the accusations of manipulation
occur in the direction of the favorite. As examples, when Democratic manipulation in the
presidential race is charged, the Democratic candidate has, on average, an odds price of
0.58; when a Republican manipulation is charged, the price on the democrat is only 0.22.
This effect remains true if we examine odds several days before the charged events (to
avoid potential contamination). The Democratic odds prices three days before the
democratic and republican manipulation in the presidential market are 0.54 and 0.30,
respectively. Republican bluffs also tend to occur when the democrat is the underdog,
although the effect is not as pronounced. Only Democratic bluffs – the so-called
Tammany trick— deviate from this pattern. These occur in presidential races when the
Democratic candidate is given, on average, about a one-third chance of winning.
The manipulations and wash bets/bluffs occurred at widely-scattered times, from
election day to over three months before. The median manipulation event, in both
presidential and all races, was 4 days before the election, that is, on the Friday before the
election. The median wash bet/bluffs occurred 7 days before Election Day. For all races,
the manipulations were concentrated on Mondays (6 events) and Fridays (5) with 8 on all
other days of the week. There were no identifiable differences between political parties
regarding this aspect of timing.
occur on only about 2 percent of days with reported betting odds. One reason that charges were not made more frequently is that the election cycles represented repeated games and the making unsubstantiated charges of manipulation would aversely affect one’s reputation and the creditability of one’s future charges.
29
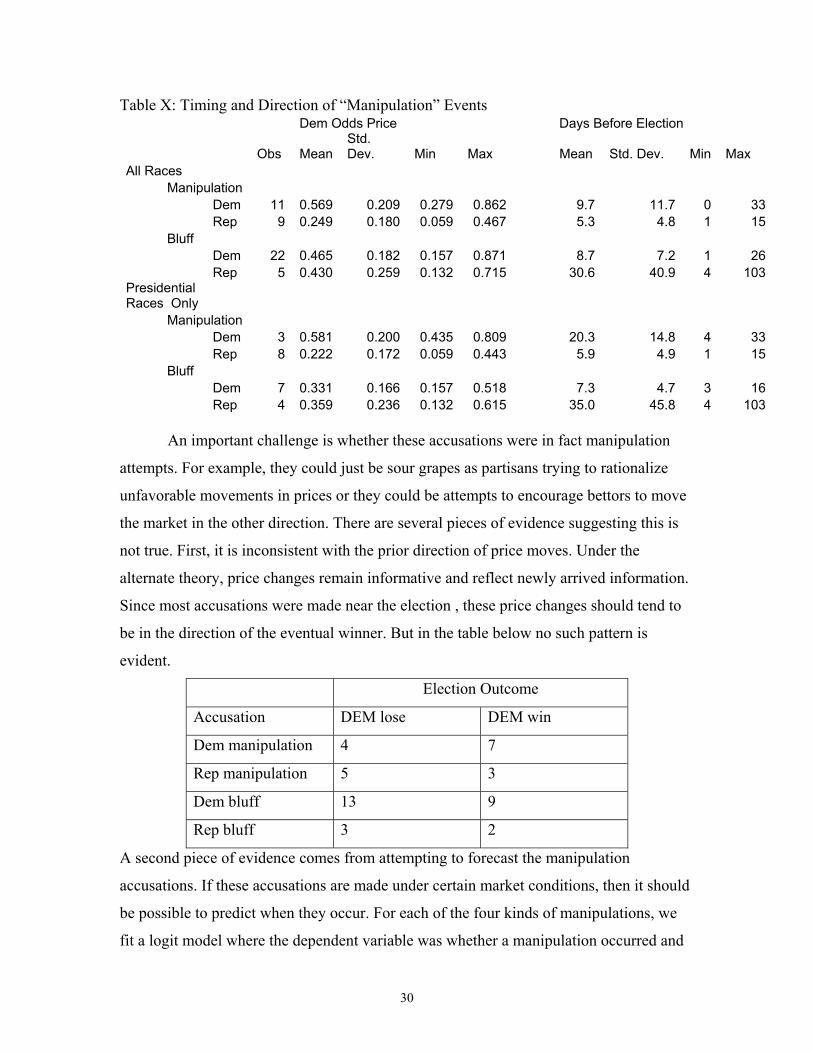
Table X: Timing and Direction of “Manipulation” Events Dem Odds Price Days Before Election
Obs MeanStd. Dev. Min Max Mean Std. Dev. Min Max
All Races Manipulation Dem 11 0.569 0.209 0.279 0.862 9.7 11.7 0 33 Rep 9 0.249 0.180 0.059 0.467 5.3 4.8 1 15 Bluff Dem 22 0.465 0.182 0.157 0.871 8.7 7.2 1 26 Rep 5 0.430 0.259 0.132 0.715 30.6 40.9 4 103Presidential Races Only Manipulation Dem 3 0.581 0.200 0.435 0.809 20.3 14.8 4 33 Rep 8 0.222 0.172 0.059 0.443 5.9 4.9 1 15 Bluff Dem 7 0.331 0.166 0.157 0.518 7.3 4.7 3 16 Rep 4 0.359 0.236 0.132 0.615 35.0 45.8 4 103
An important challenge is whether these accusations were in fact manipulation
attempts. For example, they could just be sour grapes as partisans trying to rationalize
unfavorable movements in prices or they could be attempts to encourage bettors to move
the market in the other direction. There are several pieces of evidence suggesting this is
not true. First, it is inconsistent with the prior direction of price moves. Under the
alternate theory, price changes remain informative and reflect newly arrived information.
Since most accusations were made near the election , these price changes should tend to
be in the direction of the eventual winner. But in the table below no such pattern is
evident.
Election Outcome
Accusation DEM lose DEM win
Dem manipulation 4 7
Rep manipulation 5 3
Dem bluff 13 9
Rep bluff 3 2
A second piece of evidence comes from attempting to forecast the manipulation
accusations. If these accusations are made under certain market conditions, then it should
be possible to predict when they occur. For each of the four kinds of manipulations, we
fit a logit model where the dependent variable was whether a manipulation occurred and
30
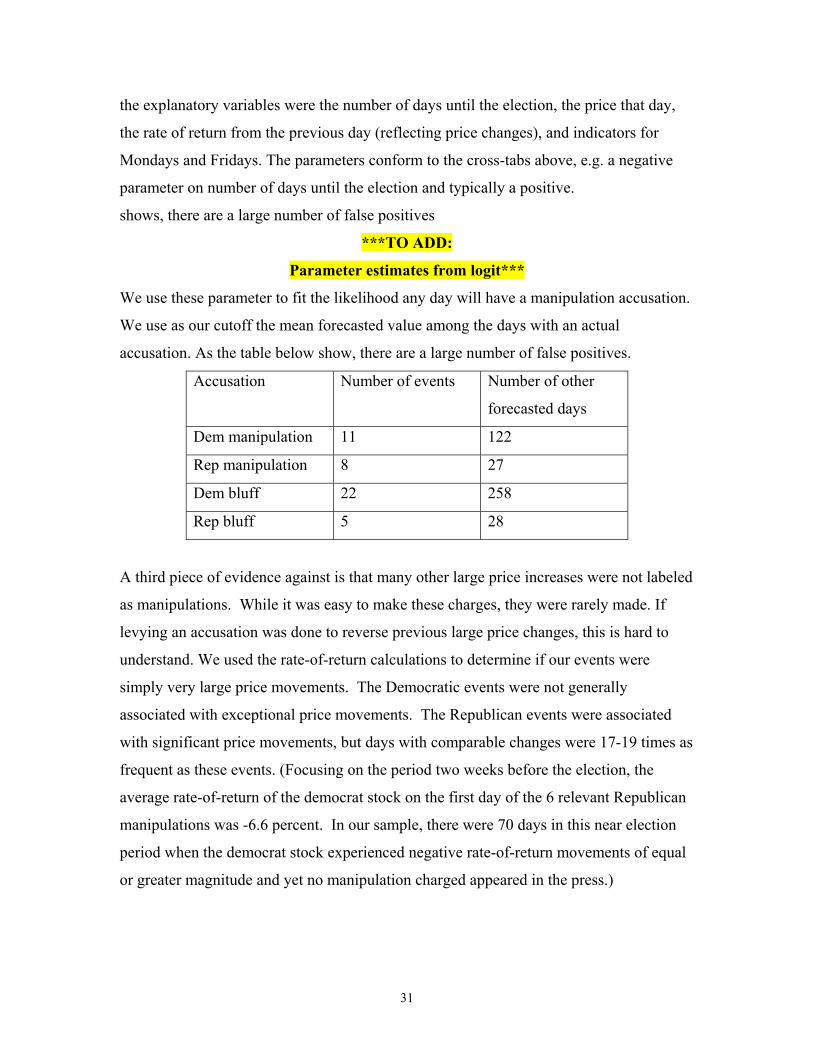
the explanatory variables were the number of days until the election, the price that day,
the rate of return from the previous day (reflecting price changes), and indicators for
Mondays and Fridays. The parameters conform to the cross-tabs above, e.g. a negative
parameter on number of days until the election and typically a positive.
shows, there are a large number of false positives
***TO ADD:
Parameter estimates from logit***
We use these parameter to fit the likelihood any day will have a manipulation accusation.
We use as our cutoff the mean forecasted value among the days with an actual
accusation. As the table below show, there are a large number of false positives.
Accusation Number of events Number of other
forecasted days
Dem manipulation 11 122
Rep manipulation 8 27
Dem bluff 22 258
Rep bluff 5 28
A third piece of evidence against is that many other large price increases were not labeled
as manipulations. While it was easy to make these charges, they were rarely made. If
levying an accusation was done to reverse previous large price changes, this is hard to
understand. We used the rate-of-return calculations to determine if our events were
simply very large price movements. The Democratic events were not generally
associated with exceptional price movements. The Republican events were associated
with significant price movements, but days with comparable changes were 17-19 times as
frequent as these events. (Focusing on the period two weeks before the election, the
average rate-of-return of the democrat stock on the first day of the 6 relevant Republican
manipulations was -6.6 percent. In our sample, there were 70 days in this near election
period when the democrat stock experienced negative rate-of-return movements of equal
or greater magnitude and yet no manipulation charged appeared in the press.)
31
c. Analysis of Manipulation
We investigate the separate effects of the Republican and Democratic “attacks”
on the “Democrat’s price.”45 To control for differences across the races, we include
election-specific dummy variables. Given that the events often occur close to the
election, we define the window as extending 5 days after the alleged manipulation. We
will begin the window one week before. (We treat new manipulations occurring within
the window as separate events.) A purported attack is dated to one day before the
newspaper allegation is published, in line with the odds quoted on that day. As will
become apparent, the price moves associated with an allegation may precede publication
by more than one day. We cannot rule out the possibility that a genuine information
shock drove the price movements. It is important to note, however, that the story
containing the allegations was written before the prices of the current day were revealed.
Our analysis examines these effects for the Presidential race and for all races
combined. Table 5 reports the regression results measuring the impacts of manipulations
and wash sales/bluffs on the “Democrat” odds price. For each election i and date t we
estimate an equation of the form,
(8) Dempriceit = ∑sαsI(t=s)I(DemM) + ∑sβsI(t=s)I(RepM) +
∑sγsI(t=s)I(DemWB) + ∑sδsI(t=s)I(RepWB) + νi + εit
We estimate the impact of a Democratic manipulation s days away from the action (αs),
the impact of a Republican manipulation (βs), the impact of a Democratic wash/ bluff
(γs), and the impact of a Republican wash/bluff (δs), all while controlling for election
fixed effects (νi). We consider these impacts roughly a week before and after each event
(-7≤s≤5). As a consequence, we will focus on the impact of manipulation events. These
impacts may be more easily visualized by examining Figures 13-15, which shows the
movements in the “Democrat” odds prices as well as the error bounds.
45 Given data availability and a desire to avoid duplication, we will use the price quotes for the favored candidate in each race. Where the favorite is the Democrat, their prices will be used directly; where the favorite is not the Democrat, we will define the “Democrat’s price” as one minus the favorite’s price. Only in the three-way 1924 race does this procedure create any problems (because odds on the Democrat were not always reported).
32
Figure 13 shows estimates for manipulation in the Presidential election market.
The effects associated with a charge of a “Republican attack” on the President market
may be described as follows. The Democrat price over the week before the attack was
trending down. In the day of the event, the price fell 0.02. Over the next day, prices
reverted back into the range prevailing in the previous week. The effects associated with
a charge of “Democrat attack” in the Presidential market were somewhat different.
Prices were far more volatile in the period before the charges. Over the day of the
alleged attack and the next day, prices jumped about 0.12. But they fall back down
sharply on day two and then trend into the range prevailing over the week before the
attack.
Figure 14 examines attacks in all races. Combining the races increases the
sample, especially of Democratic manipulations. The pattern for Republican attacks in
all races is similar to that in Presidential races. Prices were low but stable up until the
day before the charge, then jump down on the day of the “attack” before bouncing right
back up. The pattern for Democrat attacks is smoother than for the Presidential races
alone. There is a more moderate rise from the day of “attack” through day 3. Prices
begin to trend down in days 4 and 5 but remain above the range prevailing during the
week before. This suggests manipulation in local races had greater long term effects.
Figure 15 shows the price effects of manipulations on the Democrat odds prices
where Democrat and Republican manipulations are both included (in equation (1) above,
the α and β terms are combined and the Republican manipulations are multiplied by -1).
The regression results for the presidential races are sharper than those above (these
estimates are omitted). The day of the manipulation witnesses nearly a 0.035 jump up in
the Democrat odds prices. But prices quickly revert and by day two are within the range
of the pre-manipulation period. Prices then begin to rise again. For all races, the
manipulations were associated with a much smaller increase, less than 0.02. Prices drift
down by the days two and three before again beginning to rise. Nothing in these patterns
suggests that manipulation events led to large, lasting changes in prices.
As a summary, our analysis of the historical record indicates that: (1) A large
political betting market could operate despite (or perhaps because of) the active
participation of partisans. The market betting odds possessed considerable predictive
33
power and; (2) public charges of manipulations were not associated with large permanent
changes in the odds prices.
V. TradeSports 2004 Presidential Market
We now return to exploring the alleged manipulation of the TradeSports president
market in 2004. Through a special agreement. TradeSports provided access to real-time
trade data on the quantity and price (though not identity of the traders) of every
transaction for this market from its opening in June 2003 to the election day. Figure 16
displayed the price and volume during September and October when the purported
manipulations occurred. In addition to the October 15 episode, the price of the “Bush
Winner” contract also experienced a a 13-point drop during a fourteen minute period
around 12 pm EDT on Monday, September 13. Figure 17 puts the manipulation events in
greater focus (Time in the figures is reported in GMT or four hours later than EDT).
These price spikes are difficult to reconcile since large price changes in TradeSports can
usually be associated with the arrival of news.46 And while TradeSports prices typically
closely track those at Betfair (another large online political stock market), the markets
were not in sync during these episodes.
**ADD:
regressions based on Betfair data (in sync with TradeSports EXCEPT during
manipulation period) ***
Table 6 summarizes the key results from our analysis of the two alleged attacks.
The exact period of the trades is listed in the column headers, and the first four rows
summarize the activity during the attacks. The price declines were far higher than was
typically observed for such short periods. In the last three months of the market
(September-November 2004), the average price range was 0.06 over three minute
intervals (the length of the second attack) and was 0.25 over fifteen minute intervals (the
length of the first attack). The price changes following the attacks, listed in Table 6, were
46The IEM section gives two examples in which public information results in rapid price changes. Private information can also lead to price spikes. For example, in the 2006 market covering the resignation of Harvard’s president the price spiked up to nearly 100 twelve hours prior to the official announcement (and six hours before the Wall Street Journal posting), reflecting the trades of insiders.
34
an order of magnitude larger than any other price change over the market’s lifetime. The
volume was also heavy: 491.9 shares traded per minute during in the first attack and
2208.0 shares in the second attack compared with an average volume of 9.7 shares (or
$56.51) per minute over the last three months of the market’s operation.
It seems unlikely that these episodes were instigated by unusual market
conditions. While they did follow periods of slightly higher than average volume, the
prior price volatility was relatively low. Prices changed by only 1.5 in the hour prior to
attack 1, and not at all in the hour preceding attack 2.
Because volume data is available, we can investigate whether the attacks could
have been immediately financially profitable. The last row of Table 6 calculates the net
return if the manipulator immediately bought back the shares he had sold, using as data
the observed prices following his trades. If a manipulator had no effect on the beliefs of
other traders, prices would immediately return to their original level. The manipulator
will have to buy back shares at the higher, pre-attack price and therefore take a loss. This
is just what we see for attack 2, with the trader losing over ten percent of his investment.
Attack 1, however, allows a four percent gain because prices did not immediately return
to their initial level. This is an upper-bound estimate, because the trader would likely
have to re-purchase some of his shares at a price exceeding the observed level (prices
were quickly increasing and some of the other purchasers would have executed their
trades before him). Hence in practice even attack 1 would not likely be profitable.
We more precisely test this intuition using the event study methodology
introduced in the last section. We again calculate the rate of return (Rt), the cumulative
return (CRt) and the two standard error confidence interval around it to test for statistical
significance.47 Figure 18 shows the cumulative return for the two attacks. A time period
is defined as a minute, and time is normalized so the attack begins at t=0. The
47One difference is that we use the following formula to calculate the rate of return,
Rt ≡ (pricet-pricet-1)/(0.5(pricet+pricet-1))
Using mean price in the denominator ensures that the return from a price jump will be comparable to the return if prices then revert to their initial level. This is important here given the rapid price spikes.
To generate the standard error of CRt using the formulae in the Appendix, the variance σ2 is calculated from the observed dispersion in Rt during the hour before t=-5. This time period is referred to as the estimation window and is supposed to reflect the normal level of price volatility in the absence of unusual events. Our results are robust to alternative estimation windows
35
cumulative returns are calculated starting five minutes before the attack (t=-5), which
allows for the possibility that the attacks were anticipated. The bottom part of Figure 18
shows the cumulative return for the 10/15 attack. CRt is large and negative in the two
minutes when the attack was executed. However CRt is statistically indistinguishable
from zero starting five minutes after the attack began or three minutes after the attack
ended. For the 9/13 attack, the return remains negative and significant for a longer period
of about forty-five minutes after the attack ends (t=14).48
In total these calculations confirm the visual inspection of the time series graphs.
While the attacks involved extremely high volume and initially moved prices, the prices
quickly returned to their prior level and were not financially profitable for the trader.
This is consistent with the argument that attacks did not alter the price dynamics for this
market.
V. Conclusion
The promise of improving decision-making by tapping the “Wisdom of Crowds”
through the use of prediction markets has attracted great interest in recent years. An
important challenge to utilizing such markets is the possibility of manipulation and
speculative attacks by partisan or large moneyed interests. If manipulation were possible,
prices would neither aggregate information nor would they serve as a useful forecasting
tool. To assess this challenge, the paper has analyzed alleged and actual speculative
attacks— large trades, uninformed by fundamentals, intended to change prices —in three
markets: the Iowa Electronic Market in 2000, the historical Wall Street betting markets,
and the 2004 TradeSports market for President. In almost every speculative attack prices
48 Two alternative formulations are considered (the specific numbers are omitted in the interest of brevity). First, we calculate the mean CRt over the two attacks. This return is no longer statistically significant twenty-five minutes after the start of the attacks or about ten minutes after both attacks end. Second, we allow for a normal level of return. The adjusted “cumulative abnormal return” is calculated using two definitions of normal return: the mean return over the three days prior to the manipulation and the mean return over the prior hour. The cumulative values are quite similar those reported in Figure 15.
It is also possible to evaluate whether the attacks influenced the long-run price dynamics. In omitted results, we estimate Chow tests of the form:
Rt = α1 + β1×t + α2×I(Post-attack)t + β2×t×I(Post-attack)t + εt
where I(Post-attack)t is an indicator for whether this time occurs after a attack. Using all trades over the last three months prior to the election, we cannot reject H0: α2, β2 = 0 for either of the attacks. This suggests that neither set of trades had a permanent effect on the rates of return.
36
experienced measurable initial changes. However, these movements were quickly
reversed and prices returned close to their previous levels. Our investigation of evidence
from field experiments and contemporary as well as historical observational data suggests
it is difficult and expensive to manipulate political stock markets beyond short periods.
And the period appears to become shorter over time—from days (New York Markets) to
hours (IEM) to minutes (TradeSports). This differs from stock market speculations.
Aggarwal and Wu (2005) show in cases where there was SEC manipulation prosecution,
prices double in the year following the manipulation.
Our evidence is not unique. Accusations of manipulation are now common in
political stock markets. We are aware of numerous attempts to manipulate TradeSports
markets in the last year (including multiple attacks on the TradeSports 2008 Presidential
markets), and further back there were attempts to manipulate political markets at BetFair,
in Germany (Hansen, et al, 2004) and in a non-US market which prefers to remain
unnamed. Yet in each case the price changes were again short-lived. The manipulation
attempts on the Google market were similarly unsuccessful. One of the most active and
successful Google traders made several bets with the explicit goal of changing the beliefs
of other participants. But the trader later noted his attempts were unsuccessful and that
he “lost lots of money to people who really did have information and wouldn't let me
manipulate the prices” (quoted from Cowgill, 2006).
Yet it is not possible to claim that manipulative attacks such as those at
Tradesports in 2004 were failures, at least, if the goal was to attract media attention. The
second attack (15 Oct 2004) received widespread coverage in the press and involved an
investment of only twenty-thousand dollars. In contrast, a full-page advertisement in the
Wall Street Journal (one of the papers covering the attack) would have cost two-hundred
thousand dollars. If the motivation was a desire to shape press coverage and perhaps
generate momentum for a candidate, then the attack may have been a success.
Among the questions for future research are: do these results hold for other
prediction markets? What are the key characteristics that ensure markets are not easily
manipulated? We have shown that certain characteristics are not crucial, because there is
variation across the markets we study. For example, having public or anonymous
markets does not seem to matter. But there are other traits that are common to all of our
37

markets such as small number of possible outcomes and diversity of opinions. In
identifying which are the essential characteristics we might gain a better understanding of
why certain of these markets work so well at making accurate predictions.
38
Appendix A. Framework for Political Stock Markets
Winner-Take-All Market
The efficient markets test can be applied to time series data, e.g. daily contracts for the winner of the overall election. The key feature of such data is that the uncertainty should systematically decrease as we approach the election date. We present a model related to the analysis of futures markets in Samuelson (1965).
Suppose there are two candidates in the election, that time is discrete and in each period some news about the candidates arrives. For concreteness we focus on the Democrat’s electoral prospects, and presume there is a latent level of Democrat support (two-party vote share) each period. The Democrat’s latent support evolves according to,
(A1) VoteSharet* = VoteSharet-1
*+ εt
where VoteSharet is the latent support at day t, VoteSharet-1 is the latent support on the prior day, and εt~N(0,σt
2) is the independent across time news shock. The zero mean implies the news does not systematically favor any candidate, while the independence assumption precludes trends in the news. The star superscript indicates an inverse normal transform, x*≡Φ-1(x) where Φ(.) is the standard normal distribution function. This transform insures the range of the VoteShare variables is the entire real line like with the εt term. This equation can be iterated forward to yield,
(A2) VoteShareT* = VoteSharet
*+ νt
where T is the election day, VoteShareT is the election day latent support (presumed to be the actual election outcome), and νt ≡ εt + εt+1 + ... + εT.
Presuming that VoteSharet is in the time t information set Ωt, the best guess about the transformed election outcome is normally distributed, VoteShareT
*|Ωt ~N(VoteSharet
*,σνt2) where σνt
2≡σt2+σt+1
2+ ... +σT2. This means the time t prediction
about the Democrat’s election probability is,
(A3) Pr(Win)|Ωt ≡ Pr(VoteShareT*>0)|Ωt = Φ(VoteSharet
*/σνt)
Under the efficient capital markets hypothesis, the price of a contract paying a unit if Democrat’s win the election should equal Pr(Win)|Ωt: pricet=Pr(Win)|Ωt, where pricet is the market price (odds) of the contract. Using (A3) this implies pricet
*= VoteSharet
*/σνt. Vote Share Market
Equation (A2) gives the law of motion for vote shares. Under efficient markets a market for vote shares should be priced based on the best current estimate of the final vote totals, priceVS
t= E(VoteShareT|Ωt). Using equation (A2) and applying the inverse normal transform this means priceVS
t*= VoteSharet
*. Combined with the last result of the previous section, this can be used to determine the relationship between efficient prices in a winner take all and vote share market,
39
(A4) pricet* = priceVS
t */σνt.
A Functional Form for σνt
Since we will utilize the equilibrium condition (A4) it is necessary to impose some structure on σνt. We presume that each day prior to the election is expected to bring a comparably sized news shock, but that there is still some residual uncertainty remaining on election day. Formally this means σs=s1 ∀t≠0 and σT=s2 or
(A5) σνt=(s12(T-t)+s2
2)0.5
where the s1 term represents the time-varying uncertainty (presumed to be a priori identical across days), and s2 is time-invariant uncertainty (say uncertainty about the voters’ preferences).
Section B. Information-Based Manipulation
This Appendix investigates whether messages can be successfully used to influence prices, and so whether they could be an important component of an attempted manipulation. With this goal, we analyze the causes and consequences of postings on the TradeSports Politics/Current Events forum, http://forum.tradesports.com, during the 2004 Presidential election. This forum was the sole means by which traders in this market could communicate with one another during this period, and there were 3541 postings during the last year of the campaign (1/1/04-11/2/04). Among these posts, 80 advocated that other traders buy in the Bush election market, 63 advocated selling, and 31 advocated holding.49 The data analysis will focus on these postings.
One interesting feature of these data is that there are often conflicting suggestions for which way to trade. For example, a post which suggests buying is followed by another post which suggests selling. To be specific postings advocating a trade come from 73 threads (a thread is a group of messages which follow a common topic and are listed together on the forum). 41.1% of these threads have postings advocating conflicting positions. This percentage does not markedly change even if we restrict attention to threads whose first post suggests an action or to threads where the suggested action is specifically linked to new information.
These posting data can also be linked to periods with large price fluctuations. In particular we can see what postings were made following the two speculative attacks studied in the main text. While both of these involved a sharp price decline, most of the resulting messages suggested this was a buying opportunity. This is the opposite direction of what an information-based manipulator would suggest. To be more specific, five messages suggest the 13 October attack created a sell opportunity, and these postings
49To make this classification, we manually read through the 837 postings which contained a word potentially suggesting a trading action (the key words are: "buy", "sell", "hold", "buying", "selling", "holding", "short", "shorting", "long", "overpriced", "underpriced").
40
were made within two hours of the start of the attack. One posting did suggest selling, but this was made the day after the attack. Similarly, there were five buy messages following the 15 October attack and two of these messages were made within an hour of the attack; there were three sell messages, though two of these were made three days after the attack. In total, most postings suggest trading against the speculative attacks.50
We can formalize these intuitive results. We are interested in whether the messages in themselves induce predictable movements in the price and volume. In some cases the messages reflect actual news events, and so we generate an indicator NewsStory for the top twenty-five news events during the campaign (this list is based on a review of news sites, and the timing is based on the hour when the story is first posted on The Drudge Report (http://www.drudgereportarchives.com/). We also considered a variety of other news measures, such as whether the posting links to a specific story, and find similar results. Table B.1 shows the formal estimates. The top panel investigates the determinants of forum posts. We consider logits (is there a post this period?), poisson regressions (how many postings are there this period?), and Cox proportionate hazard (what is the likelihood of a posting, conditional on no postings since the last one?) models. In all cases the explanatory variables are the NewsStory indicator and the lagged change in mean price and the lagged change in shares traded over the last hour (we obtains similar estimates when we instead consider fifteen-minute or one-day lags, and also if we use different summaries of price and volume).
The results are consistent across the different approaches. In terms of explaining postings (the top panel of Table B.1), these are more likely when there was a price decline or low volume in the previous hour and also when there was a news story (the latter effect two effects however, are typically not statistically significant). The price effect is pronounced in explaining buy messages and largely absent in explaining sell messages. These results suggest that action-based behavior may have a strategic component, with suggestions to buy following price dips.
Of more interest is the impact of postings on future price and volume (the bottom panel of Table B.1). The number of messages—either the total, or buy and sell messages separately-- do not have a statistically significant effect. These effects are also not economically important. For example a buy posting in the previous hour increases price by about $0.01 (prices range from $0-$100), which is only two percent of the standard deviation of hourly price change. Note also the prices tend to go up after a sell message, so the market is moving against the suggestion. Finally, notice that a new story an hour ago has a statistically significant effect on the change in price and volume. This reflects the adjustment to prices when the event occurs, e.g. volume is lower in the current hour compared to the hour when there is a news story. Omitting these news indicators has little effect on the estimates of the message parameters. In total, these results suggest that message board postings have little impact on the dynamics of the political stock market, and in particular have little predictive power with respect to future prices.
50Consistent with this view are the postings related to a rapid and more long-lasting price change, the drop in Kerry’s price in the primary market due to the Interngate story. There were many offsetting messages posted following the initial posting on the Drudge Report, and a roughly equal number of postings suggested buying and selling Kerry.
41
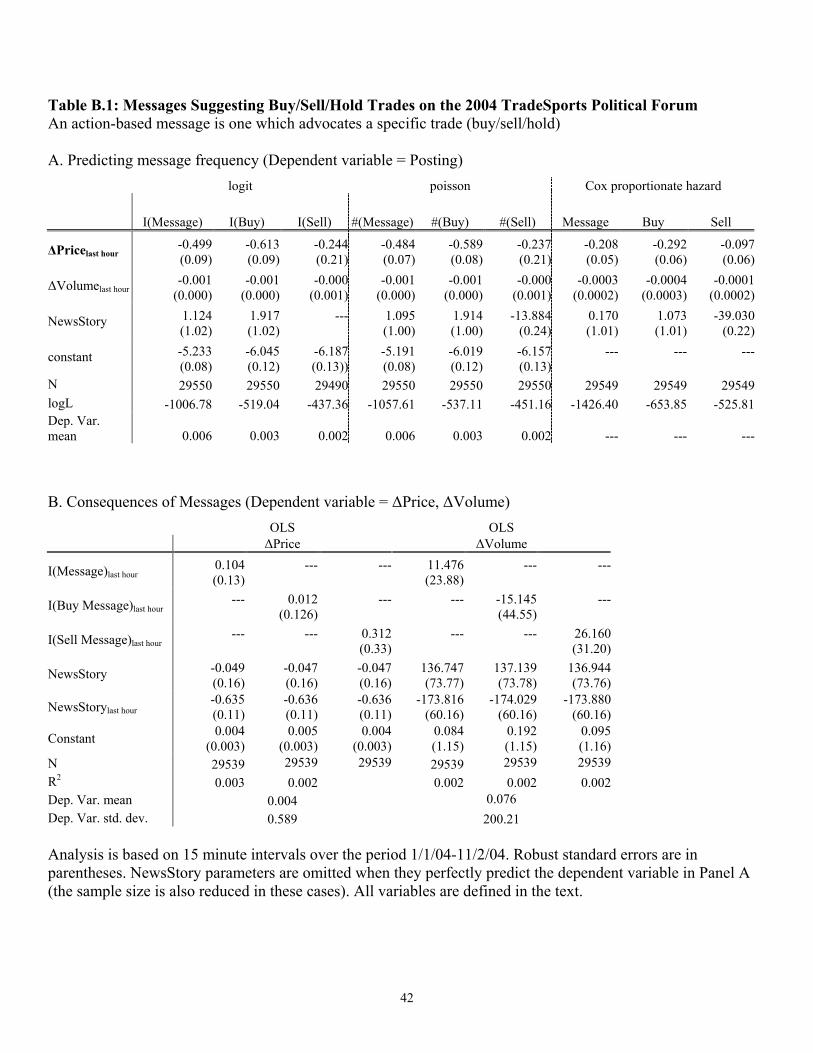
Table B.1: Messages Suggesting Buy/Sell/Hold Trades on the 2004 TradeSports Political Forum An action-based message is one which advocates a specific trade (buy/sell/hold) A. Predicting message frequency (Dependent variable = Posting)
logit poisson Cox proportionate hazard
I(Message) I(Buy) I(Sell) #(Message) #(Buy) #(Sell) Message Buy Sell
ΔPricelast hour-0.499 (0.09)
-0.613 (0.09)
-0.244(0.21)
-0.484(0.07)
-0.589(0.08)
-0.237(0.21)
-0.208 (0.05)
-0.292(0.06)
-0.097(0.06)
ΔVolumelast hour-0.001
(0.000) -0.001
(0.000) -0.000
(0.001)-0.001
(0.000)-0.001
(0.000)-0.000
(0.001)-0.0003
(0.0002) -0.0004
(0.0003)-0.0001
(0.0002)
NewsStory 1.124 (1.02)
1.917 (1.02)
--- 1.095(1.00)
1.914(1.00)
-13.884(0.24)
0.170 (1.01)
1.073(1.01)
-39.030(0.22)
constant -5.233 (0.08)
-6.045 (0.12)
-6.187(0.13))
-5.191(0.08)
-6.019(0.12)
-6.157(0.13)
---
--- ---
N 29550 29550 29490 29550 29550 29550 29549 29549 29549logL -1006.78 -519.04 -437.36 -1057.61 -537.11 -451.16 -1426.40 -653.85 -525.81Dep. Var. mean 0.006 0.003 0.002 0.006 0.003 0.002 --- --- --- B. Consequences of Messages (Dependent variable = ΔPrice, ΔVolume) OLS OLS ΔPrice ΔVolume
I(Message)last hour0.104(0.13)
---
--- 11.476(23.88)
--- ---
I(Buy Message)last hour--- 0.012
(0.126) --- --- -15.145
(44.55)---
I(Sell Message)last hour--- ---
0.312(0.33)
--- --- 26.160(31.20)
NewsStory -0.049(0.16)
-0.047 (0.16)
-0.047(0.16)
136.747(73.77)
137.139(73.78)
136.944(73.76)
NewsStorylast hour-0.635(0.11)
-0.636 (0.11)
-0.636(0.11)
-173.816(60.16)
-174.029(60.16)
-173.880(60.16)
Constant 0.004(0.003)
0.005 (0.003)
0.004(0.003)
0.084(1.15)
0.192(1.15)
0.095(1.16)
N 29539 29539 29539 29539 29539 29539R2 0.003 0.002 0.002 0.002 0.002Dep. Var. mean 0.004 0.076 Dep. Var. std. dev. 0.589 200.21 Analysis is based on 15 minute intervals over the period 1/1/04-11/2/04. Robust standard errors are in parentheses. NewsStory parameters are omitted when they perfectly predict the dependent variable in Panel A (the sample size is also reduced in these cases). All variables are defined in the text.
42
Section C. Insiders and Manipulators in Real-World Prediction Markets
This Appendix shows that insiders and manipulators in real world prediction markets both engineer rapid price changes similar to those we create in the 2000 IEM.
As with more traditional financial markets, it is difficult to know when manipulators or investors with private information are participating in the market (this is consistent with the framework in Section II, since other traders also face the same detection problem). But there are two instances in which we can be reasonably confident that insiders are present: when evidence becomes available ex post and when there is commentary from market analysts. We consider examples from both these sources below,
We begin with insiders. The cases we study are summarized in Figure C.1. The first panel shows Intrade’s 2006 market on whether Defense Secretary Donald Rumsfeld would resign. Rumsfeld publicly announced his resignation on 8 November, the day after several high profile Senate elections. The Intrade contract, however, spiked up the weekend before and stabilized about 15 points higher; there were no comparable price jumps during the contract’s history. A later news story revealed this was around the time the resignation letter was written, though it was closely guarded and only a few people saw the letter prior to the official resignation announcement (Washington Post, “Rumsfeld Resigned as Defense Secretary on Day Before Elections,” 16 August 2007). The price move was likely due to trades by of one of these insiders, or their confederates.
The second panel shows TradeSports’ 2004 market on whether John Edwards would be selected as the Democratic Vice-President. Prices in this market spiked up 40 points over five hours prior to the official announcement of his nomination. Not only was their no public announcement during this period, the New York Post incorrectly reported on their cover and their online site at this time that Richard Gephardt was selected. However, a mechanic reported on an aviation enthusiast website, usaviation.com, that Edwards name had been painted on the Democrat’s presidential campaign plane. It seems likely that this was the source of the price rise, since it was posted right around when prices began to change.
A third example of inside trading was TradeSports’ market on whether Harvard President Lawrence Summers would resign. Prices increased 20 points and then stabilized at 10 points higher six hours prior to the first public announcement of his resignation (the story appeared on the Wall Street Journal’s webpage and the timing was confirmed with blogger Richard Bradley). However, reports leaked from the Harvard Crimson circulated on various internal Harvard listservs during the time when prices increased (cambridgecommon.blogspot.com, 20 February 2006).
The last example of inside trading is Intrade’s market on who would be nominated in Fall 2005 to the Supreme Court of the United States. Following the withdrawal of Harriet Miers on 27 October, there was significant uncertainty as to who President George Bush would select. Indeed, there were several reports that three candidates were being considered on Monday 31 October, the day when Samuel Alito was officially selected (Washington Post, “President to Name Nominee for Court,” 31 October 2005). The graph shows that Alito’s price spiked three days earlier, in two sets of 20 point jumps before stabilizing 30 points higher. Several blogs noted these price moves the day they occurred and concluded they were the work of an insider since there was no public news about the nomination that day (Daily Kos, 28 October 2005; Business Law Blog, 29 October 2005).
43
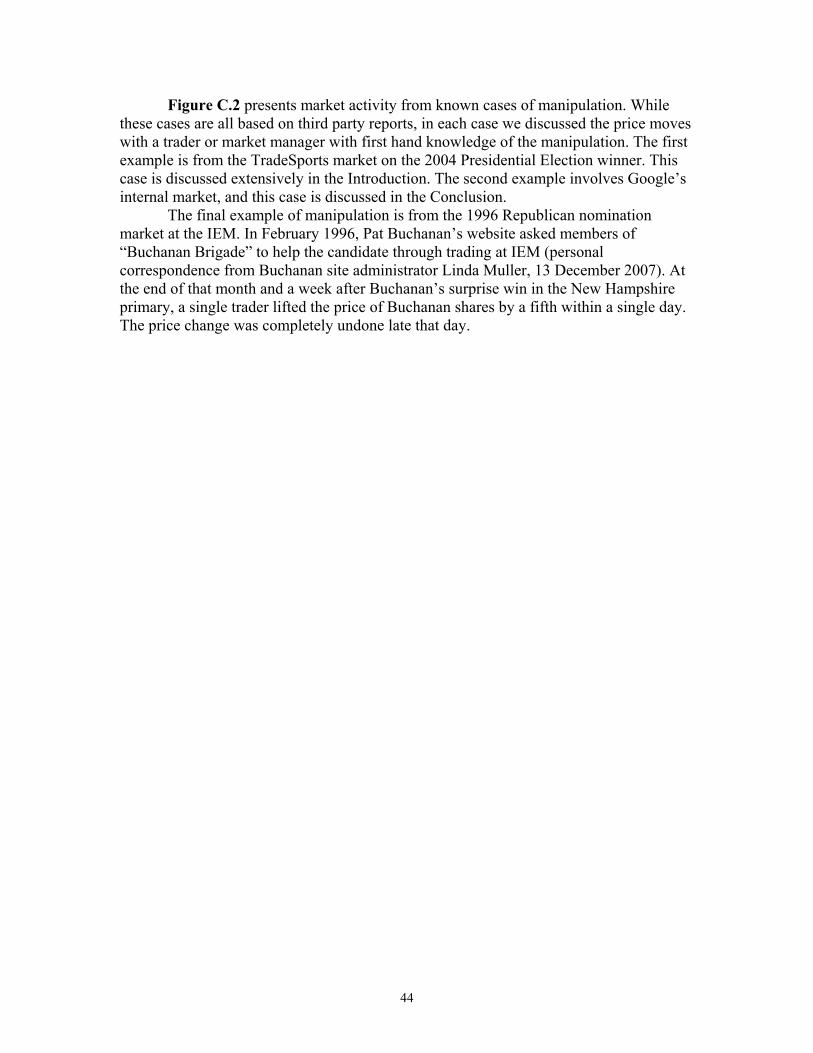
Figure C.2 presents market activity from known cases of manipulation. While these cases are all based on third party reports, in each case we discussed the price moves with a trader or market manager with first hand knowledge of the manipulation. The first example is from the TradeSports market on the 2004 Presidential Election winner. This case is discussed extensively in the Introduction. The second example involves Google’s internal market, and this case is discussed in the Conclusion.
The final example of manipulation is from the 1996 Republican nomination market at the IEM. In February 1996, Pat Buchanan’s website asked members of “Buchanan Brigade” to help the candidate through trading at IEM (personal correspondence from Buchanan site administrator Linda Muller, 13 December 2007). At the end of that month and a week after Buchanan’s surprise win in the New Hampshire primary, a single trader lifted the price of Buchanan shares by a fifth within a single day. The price change was completely undone late that day.
44
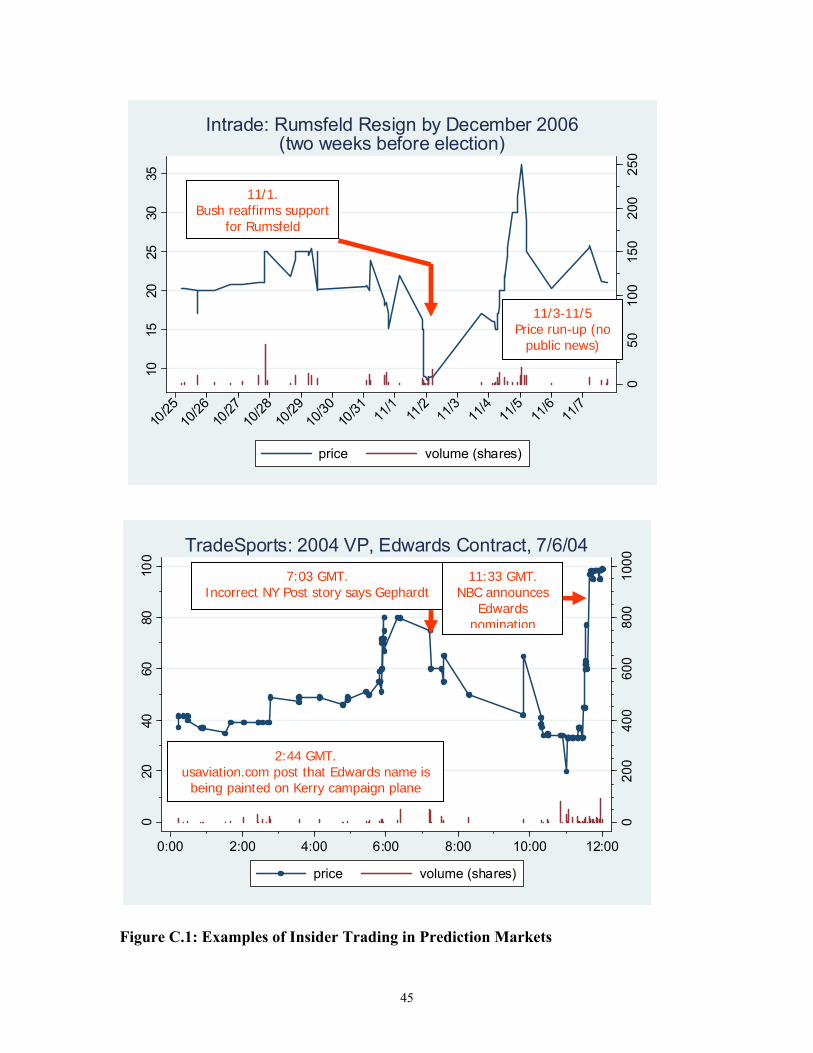
050
100
150
200
250
1015
2025
3035
10/25
10/26
10/27
10/28
10/29
10/30
10/31 11
/111
/211
/311
/411
/511
/611
/7
price volume (shares)
Intrade: Rumsfeld Resign by December 2006(two weeks before election)
11/1. Bush reaffirms support
for Rumsfeld
11/3-11/5 Price run-up (no
public news)
020
040
060
080
010
00
020
4060
8010
0
0:00 2:00 4:00 6:00 8:00 10:00 12:00
price volume (shares)
TradeSports: 2004 VP, Edwards Contract, 7/6/0411:33 GMT.
NBC announces Edwards
nomination
7:03 GMT. Incorrect NY Post story says Gephardt
2:44 GMT. usaviation.com post that Edwards name is
being painted on Kerry campaign plane
Figure C.1: Examples of Insider Trading in Prediction Markets
45
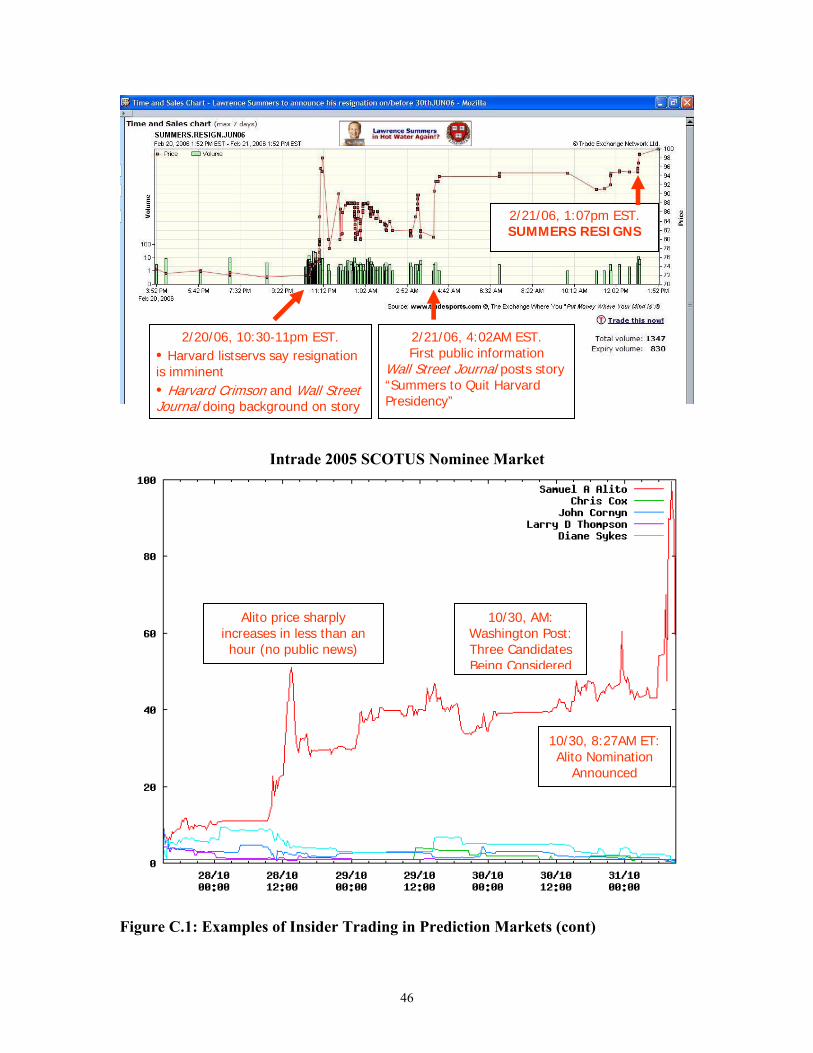
2/20/06, 10:30-11pm EST. • Harvard listservs say resignation is imminent • Harvard Crimson and Wall Street Journal doing background on story
2/21/06, 4:02AM EST. First public information
Wall Street Journal posts story “Summers to Quit Harvard Presidency”
2/21/06, 1:07pm EST. SUMMERS RESIGNS
Intrade 2005 SCOTUS Nominee Market
10/30, AM: Washington Post: Three Candidates Being Considered
10/30, 8:27AM ET: Alito Nomination
Announced
Alito price sharply increases in less than an hour (no public news)
Figure C.1: Examples of Insider Trading in Prediction Markets (cont)
46
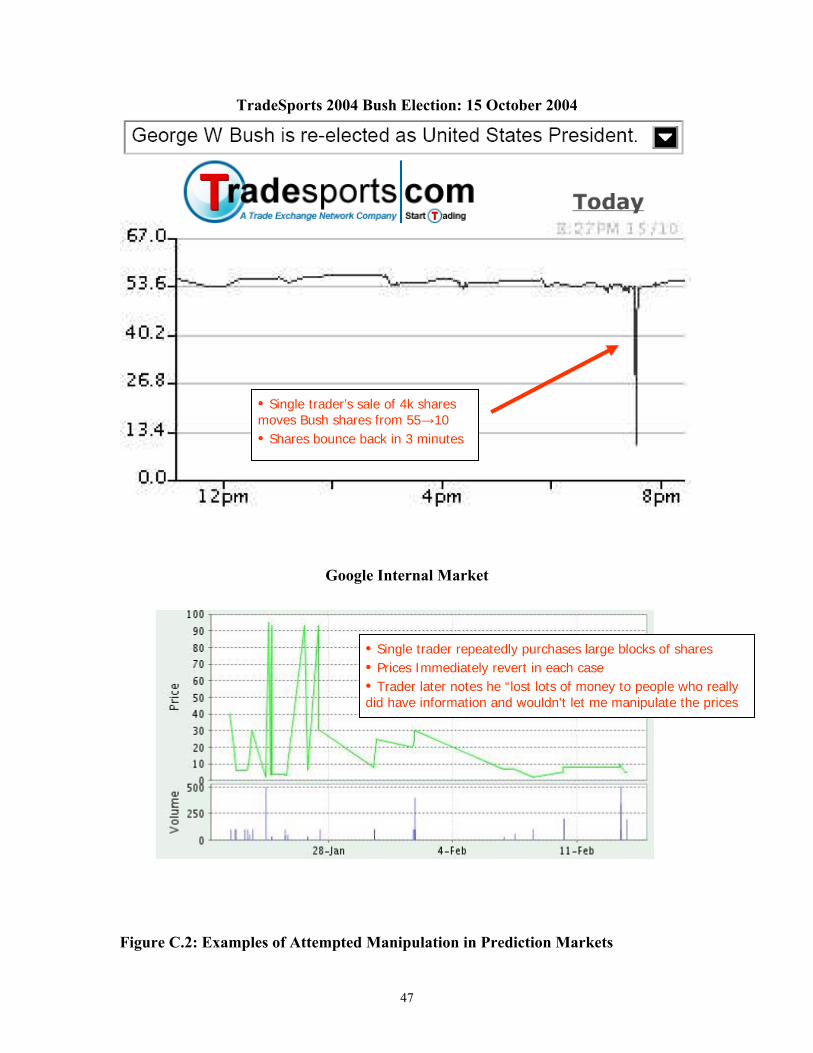
TradeSports 2004 Bush Election: 15 October 2004
• Single trader’s sale of 4k shares moves Bush shares from 55→10 • Shares bounce back in 3 minutes
Google Internal Market
• Single trader’s sale of 4k shares moves Bush shares from 55→10 • Shares bounce back in 3 minutes
• Single trader repeatedly purchases large blocks of shares • Prices Immediately revert in each case • Trader later notes he “lost lots of money to people who really did have information and wouldn't let me manipulate the prices
Figure C.2: Examples of Attempted Manipulation in Prediction Markets
47
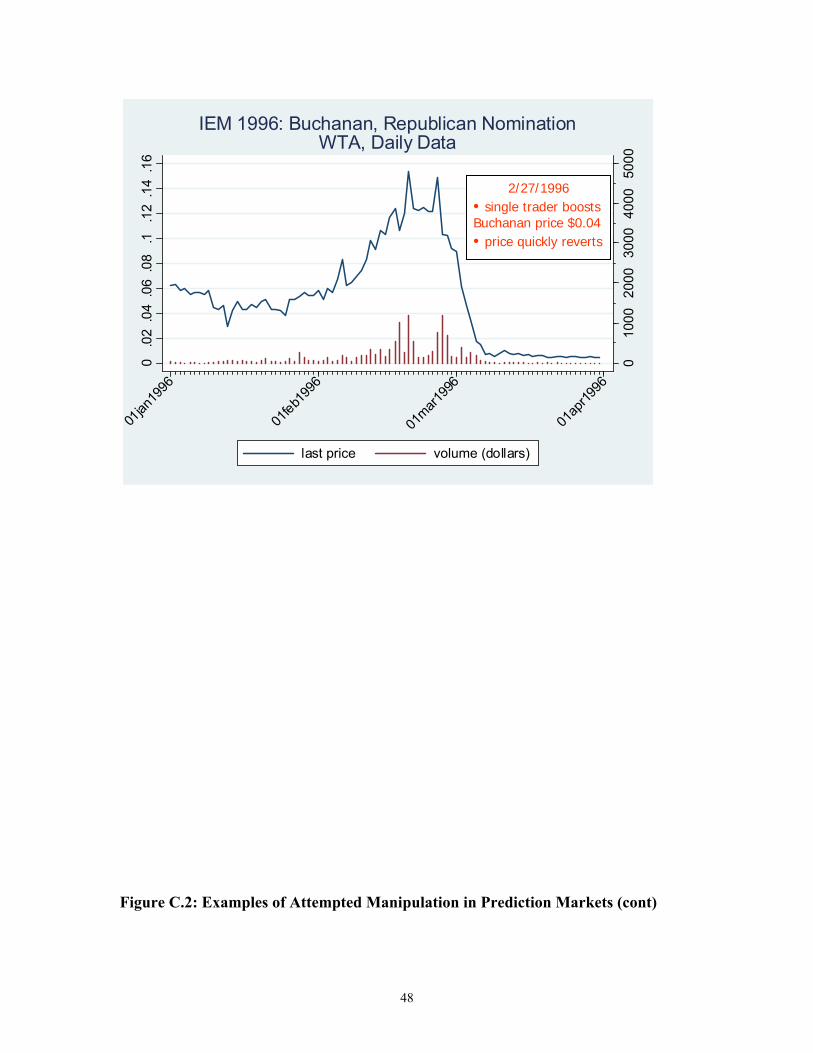
010
0020
0030
0040
0050
00
0.0
2.0
4.0
6.0
8.1
.12
.14
.16
01jan
1996
01feb1
996
01mar1
996
01ap
r1996
last price volume (dollars)
IEM 1996: Buchanan, Republican NominationWTA, Daily Data
2/27/1996 • single trader boosts Buchanan price $0.04 • price quickly reverts
Figure C.2: Examples of Attempted Manipulation in Prediction Markets (cont)
48
References Aggarwal, Rajesh and Guojun Wu (2005). “Stock Price Manipulations.” Journal of
Business.
Allen, Franklin and Douglas Gale (1992). “Stock-Price Manipulation.” Review of Financial Studies. 5: 503-529.
Antweiler, Werner and Murray Frank (2004). “Is All That Talk Just Noise? The
Information Content of Internet Stock Message Boards.” Journal of Finance. 59: 1259-1294.
Berg, Joyce, Forrest Nelson, and Thomas Rietz (2003). “Accuracy and Forecast Standard
Error of Prediction Markets.” working paper downloaded from http://www.biz.uiowa.edu/iem/archive/forecasting.pdf.
Berg, Joyce, Robert Forsythe, Forrest Nelson, Thomas Rietz (2005). “Results from a Dozen Years of Election Futures Markets Research.” Handbook of Experimental Economics Results, volume 1. C. Plott and V. Smith, editors. Elesevier. Bikhchandani, Sushil, David Hirshleifer, and Ivo Welch (1992). A Theory of Fads,
Fashion, Custom, and Cultural Change as Informational Cascades. Journal of Political Economy. 100: 992-1026.
Blume, Lawrence, David Easley, and Maureen O’Hara (1994). “Market Statistics and Technical Analysis: The Role of Volume.” Journal of Finance. 49: 153-181.
Brunnermeier, Markus (2001). Asset Pricing under Asymmetric Information: Bubbles, Crashes, Technical Analysis, and Herding. Oxford University Press: Oxford.
Bulow, Jeremy and Paul Klemperer (1994). “Rational Frenzies and Crashes.” Journal of Political Economy. 102: 1-23. Campbell, John, Andrew Lo, and Craig MacKinlay (1997). The Econometrics of Financial Markets. Princeton University Press: 1997. Camerer, Colin (1998) “Can Asset Markets be Manipulated? A Field Experiment with Racetrack Betting.” Journal of Political Economy. 106: 457-82. Cass, David and Karl Shell (1983). “Do Sunspots Matter?” Journal of Political Economy. 91: 193-227. Cornell, Bradford and Erik Sirri (1992). “The Reaction of Investors and Stock Prices to Insider Trading.” Journal of Finance. 47:3, 1031-1059. Cowgill, Bo (2006). Personal communication regarding the Google prediction market.
49
Froot, Kenneth, David Scharfstein, and Jeremy Stein (1992). “Herd on the Street:
Informational Inefficiencies in a Market with Short-Term Speculation.” Journal of Finance. 47: 1461-1484.
Fishe, Raymond and Michael Robe (2004). “The Impact of Illegal Insider Trading In Dealer and Specialist Markets: Evidence from a Natural Experiment.” Journal of Financial Economics. 71: 461-488.
Gjerstad, Steven (2005). “Risk Aversion, Beliefs, and Prediction Market.” Univ. of Arizona working paper.
Hansen, Jan, Carsten Schmidt and Martin Strobel (2004). “Manipulation in Political
Stock Markets—Preconditions and Evidence.” Applied Economics Letters. 11: 459-463.
Hanson, Robin (1999). “Decision Markets.” IEEE Intelligent Systems. 14: 16-19. Hanson, Robin and Ryan Oprea (2004). “Manipulators Increase Information Market
Efficiency.” Working paper. Hanson, Robin, Ryan Oprea and David Porter (2006). “Information Aggregation and
Manipulation in an Experimental Market.” Journal of Economic Behavior and Organization.
Khwaja, Asim and Atif Mian (2005). “Unchecked Intermediaries: Price
Manipulation in an Emerging Stock Market.” Journal of Financial Economics. 78:1 (Nov.): 203-41.
Ledyard, John (2005). “Information Markets.” Nancy L. Schwartz Memorial Lecture.
http://www.kellogg.northwestern.edu/meds/deptinfo/schwartz.htm. Mahoney, Paul, Guolin Jiang, and Jianping Mei (2005). “Market Manipulation: A
Comprehensive Study of Stock Pools.” Journal of Financial Economics.77: 147-170.
Manski, Charles (2006). “Interpreting the Predictions of Prediction Markets.” Economic Letters.91: 425-429. Mei, Jianping, Guojun Wu, and Chunsheng Zhou (2004). “Behavior Based Manipulation:
Theory and Prosecution Evidence.” Working paper. Merrick, John, Narayan Naik, and Pradeep Yadav (2005). “Strategic Trading Behavior
and Price Distortion in a Manipulated Market: Anatomy of a Squeeze.” Journal of Financial Economics. 77: 171-218.
50
O’Hara, Maureen (1995). Market Microstructure Theory. Blackwell: Cambridge, MA. Oliven, Kenneth and Thomas Rietz (2004). “Suckers are Born but Markets Are Made:
Individual Rationality, Arbitrage, and Market Efficiency on am Electronic Futures Market.” Management Science. 50: 336-351.
Ottaviani, Marco and Peter Norman Sørensen (2005). “Aggregation of Information and Beliefs in Prediction Markets.” working paper downloaded from http://faculty.london.edu/mottaviani/AIBIPM.pdf. Pennock, David, Steve Lawrence, C. Lee Giles, and Finn Årup Nielsen (2001). “The
Real Power of Artificial Markets. Science. 291(5506): 987-988. Pennock, David (2004). “A Dynamic Pari-Mutuel Market for Hedging, Wagering, and
Information Aggregation.” In proceedings of ACM Conference on Electronic Commerce. New York.
Pirrong, Stephen Craig (1993). “Manipulation of the Commodity Futures Market
Delivery Process.” Journal of Business. 66(3): 335-369. Pirrong, Craig (2004). “Detecting Manipulation in Futures Markets: The Ferruzzi
Soybean Episode.” American Law and Economics Review . 6(1): 28-71. Plott, Charles R. and Shyam Sunder (1982). “Efficiency of Experimental Security
Markets with Insider Information: An Application of Rational-Expectations Models.” The Journal of Political Economy. 90:4, 663-698
Rhode, Paul W. and Koleman Strumpf (2004). “Historical Presidential Betting Markets.”
Journal of Economic Perspectives. 18:2 (Spring): 127-142. Rhode, Paul W. and Koleman Strumpf (2006). Romer, David (1993). “Rational Asset-Price Movements Without News.” American Economic Review. 83: 1112-1130. Snowberg, Erik, Justin Wolfers and Eric Zitzewitz (2007).. “Partisan Impacts on the
Stockmarket: Evidence from Prediction Markets and Close Elections,” Quarterly Journal of Economics. 122: 807-829
Stiglitz, Joseph (2003). “Terrorism: There's No Futures in It.” Los Angeles Times. 31 July
2003. Surowiecki, James (2004). The Wisdom of Crowds. Doubleday: New York. Thaler, Richard and William Ziemba (1988). “Parimutuel Betting Markets: Racetracks and Lotteries.” Journal of Economic Perspectives. Spring (2:2), 161-174.
51

Wolfers, Justin and Eric Zitzewitz (2004). “Prediction Markets.” Journal of Economic Perspectives. 18: 107-126.
52
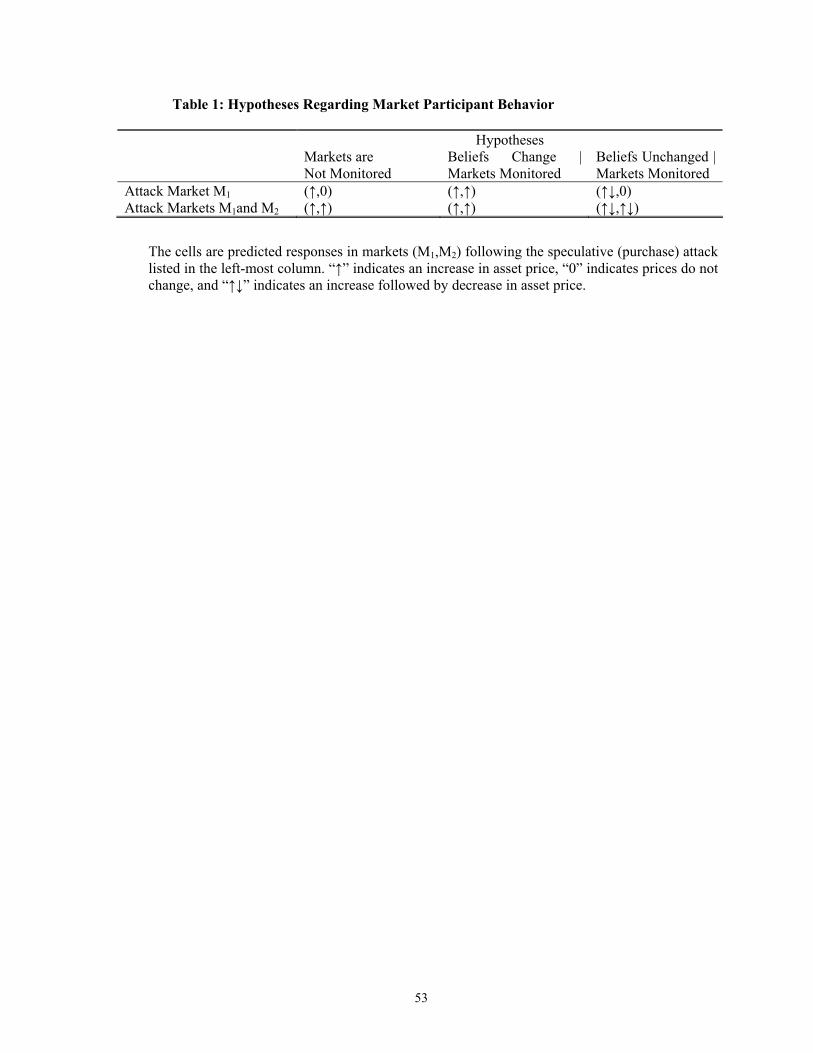
Table 1: Hypotheses Regarding Market Participant Behavior
Hypotheses Markets are
Not Monitored Beliefs Change | Markets Monitored
Beliefs Unchanged | Markets Monitored
Attack Market M1 (↑,0) (↑,↑) (↑↓,0) Attack Markets M1and M2 (↑,↑) (↑,↑) (↑↓,↑↓)
The cells are predicted responses in markets (M1,M2) following the speculative (purchase) attack listed in the left-most column. “↑” indicates an increase in asset price, “0” indicates prices do not change, and “↑↓” indicates an increase followed by decrease in asset price.
53
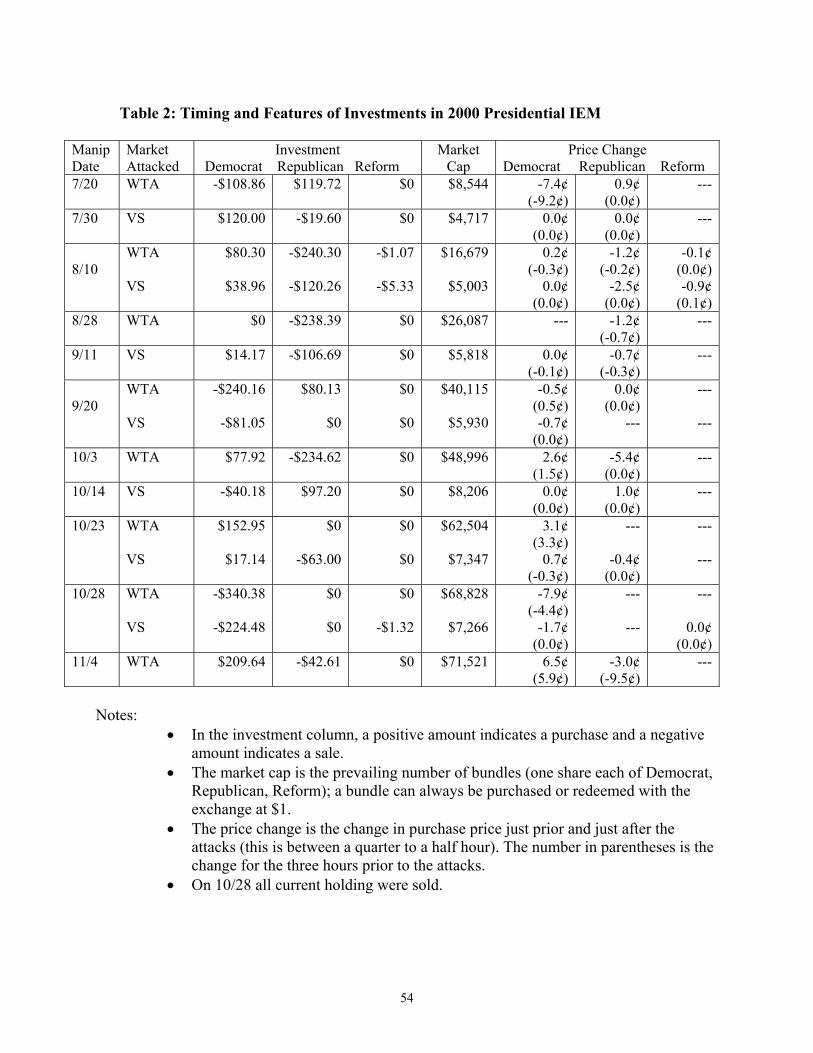
Table 2: Timing and Features of Investments in 2000 Presidential IEM
Manip Date
Market Attacked
Investment Democrat Republican Reform
Market Cap
Price Change Democrat Republican Reform
7/20 WTA -$108.86 $119.72 $0 $8,544 -7.4¢ (-9.2¢)
0.9¢ (0.0¢)
---
7/30 VS $120.00 -$19.60 $0 $4,717 0.0¢ (0.0¢)
0.0¢ (0.0¢)
---
8/10
WTA VS
$80.30
$38.96
-$240.30
-$120.26
-$1.07
-$5.33
$16,679
$5,003
0.2¢ (-0.3¢)
0.0¢ (0.0¢)
-1.2¢ (-0.2¢)
-2.5¢ (0.0¢)
-0.1¢ (0.0¢) -0.9¢
(0.1¢)8/28 WTA $0 -$238.39 $0 $26,087 --- -1.2¢
(-0.7¢) ---
9/11 VS $14.17 -$106.69 $0 $5,818 0.0¢ (-0.1¢)
-0.7¢ (-0.3¢)
---
9/20
WTA VS
-$240.16
-$81.05
$80.13
$0
$0
$0
$40,115
$5,930
-0.5¢ (0.5¢) -0.7¢
(0.0¢)
0.0¢ (0.0¢)
---
---
---
10/3 WTA $77.92 -$234.62 $0 $48,996 2.6¢ (1.5¢)
-5.4¢ (0.0¢)
---
10/14 VS -$40.18 $97.20 $0 $8,206 0.0¢ (0.0¢)
1.0¢ (0.0¢)
---
10/23 WTA VS
$152.95
$17.14
$0
-$63.00
$0
$0
$62,504
$7,347
3.1¢ (3.3¢)
0.7¢ (-0.3¢)
---
-0.4¢ (0.0¢)
---
---
10/28 WTA VS
-$340.38
-$224.48
$0
$0
$0
-$1.32
$68,828
$7,266
-7.9¢ (-4.4¢)
-1.7¢ (0.0¢)
---
---
---
0.0¢ (0.0¢)
11/4 WTA $209.64 -$42.61 $0 $71,521 6.5¢ (5.9¢)
-3.0¢ (-9.5¢)
---
Notes:
• In the investment column, a positive amount indicates a purchase and a negative amount indicates a sale.
• The market cap is the prevailing number of bundles (one share each of Democrat, Republican, Reform); a bundle can always be purchased or redeemed with the exchange at $1.
• The price change is the change in purchase price just prior and just after the attacks (this is between a quarter to a half hour). The number in parentheses is the change for the three hours prior to the attacks.
• On 10/28 all current holding were sold.
54
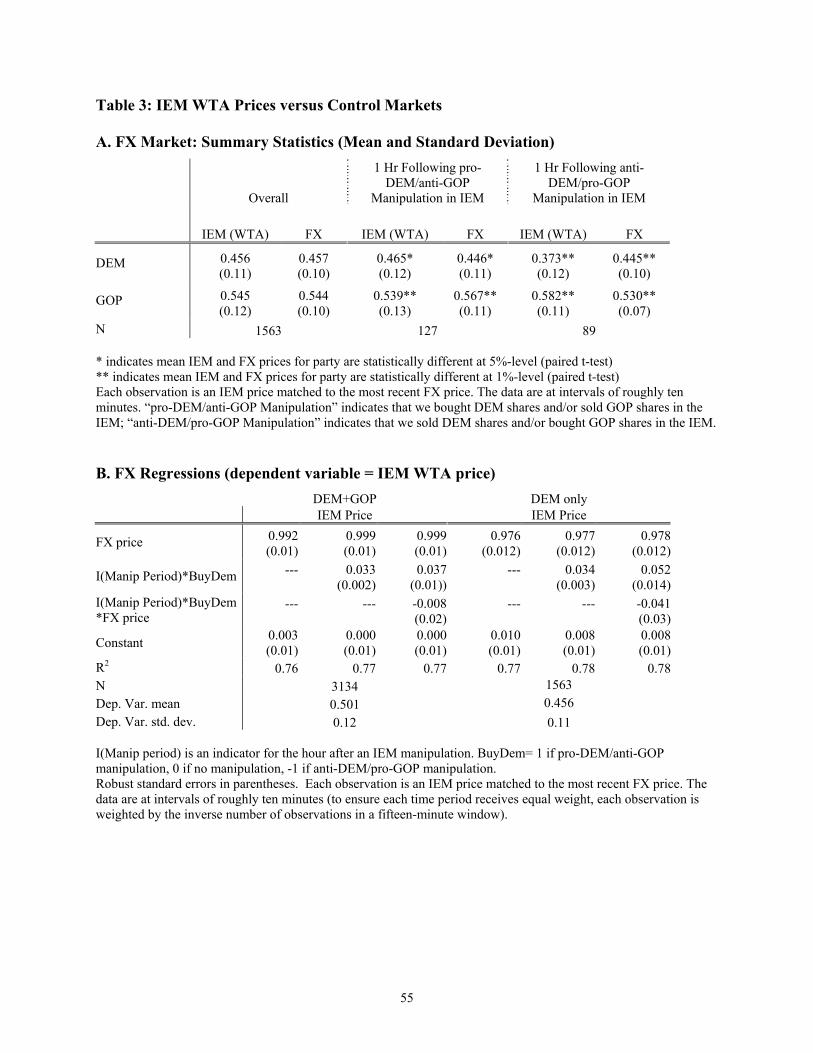
Table 3: IEM WTA Prices versus Control Markets A. FX Market: Summary Statistics (Mean and Standard Deviation)
Overall
1 Hr Following pro-DEM/anti-GOP
Manipulation in IEM
1 Hr Following anti-DEM/pro-GOP
Manipulation in IEM
IEM (WTA) FX IEM (WTA) FX IEM (WTA) FX
DEM 0.456 (0.11)
0.457 (0.10)
0.465* (0.12)
0.446* (0.11)
0.373** (0.12)
0.445** (0.10)
GOP 0.545 (0.12)
0.544 (0.10)
0.539** (0.13)
0.567** (0.11)
0.582** (0.11)
0.530** (0.07)
N 1563 127 89 * indicates mean IEM and FX prices for party are statistically different at 5%-level (paired t-test) ** indicates mean IEM and FX prices for party are statistically different at 1%-level (paired t-test) Each observation is an IEM price matched to the most recent FX price. The data are at intervals of roughly ten minutes. “pro-DEM/anti-GOP Manipulation” indicates that we bought DEM shares and/or sold GOP shares in the IEM; “anti-DEM/pro-GOP Manipulation” indicates that we sold DEM shares and/or bought GOP shares in the IEM. B. FX Regressions (dependent variable = IEM WTA price) DEM+GOP DEM only IEM Price IEM Price
FX price 0.992 (0.01)
0.999(0.01)
0.999(0.01)
0.976(0.012)
0.977 (0.012)
0.978(0.012)
I(Manip Period)*BuyDem ---
0.033(0.002)
0.037(0.01))
--- 0.034 (0.003)
0.052(0.014)
I(Manip Period)*BuyDem *FX price
---
--- -0.008(0.02)
--- ---
-0.041(0.03)
Constant 0.003 (0.01)
0.000(0.01)
0.000(0.01)
0.010(0.01)
0.008 (0.01)
0.008(0.01)
R2 0.76 0.77 0.77 0.77 0.78 0.78N 3134 1563 Dep. Var. mean 0.501 0.456 Dep. Var. std. dev. 0.12 0.11 I(Manip period) is an indicator for the hour after an IEM manipulation. BuyDem= 1 if pro-DEM/anti-GOP manipulation, 0 if no manipulation, -1 if anti-DEM/pro-GOP manipulation. Robust standard errors in parentheses. Each observation is an IEM price matched to the most recent FX price. The data are at intervals of roughly ten minutes (to ensure each time period receives equal weight, each observation is weighted by the inverse number of observations in a fifteen-minute window).
55
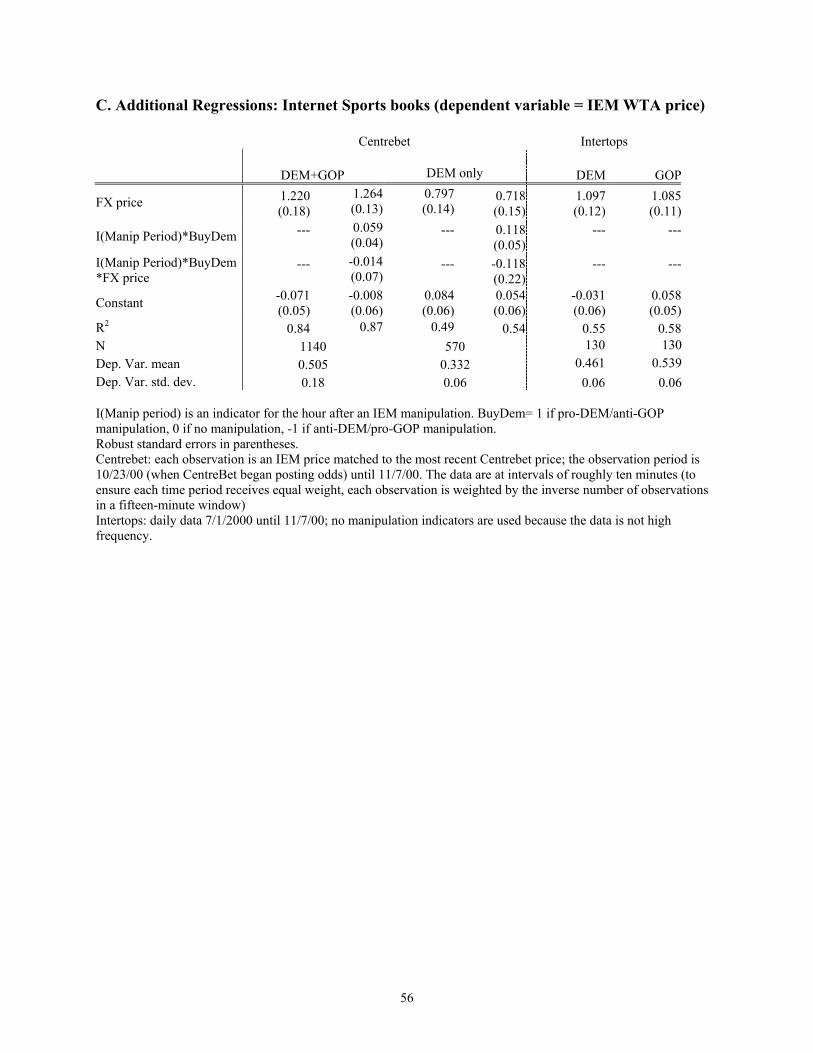
C. Additional Regressions: Internet Sports books (dependent variable = IEM WTA price)
Centrebet Intertops
DEM+GOP
DEM only DEM GOP
FX price 1.220 (0.18)
1.264(0.13)
0.797(0.14)
0.718(0.15)
1.097 (0.12)
1.085(0.11)
I(Manip Period)*BuyDem ---
0.059(0.04)
--- 0.118(0.05)
---
---
I(Manip Period)*BuyDem *FX price
---
-0.014(0.07)
--- -0.118(0.22)
---
---
Constant -0.071 (0.05)
-0.008(0.06)
0.084(0.06)
0.054(0.06)
-0.031 (0.06)
0.058(0.05)
R2 0.84 0.87 0.49 0.54 0.55 0.58N 1140 570 130 130Dep. Var. mean 0.505 0.332 0.461 0.539Dep. Var. std. dev. 0.18 0.06 0.06 0.06 I(Manip period) is an indicator for the hour after an IEM manipulation. BuyDem= 1 if pro-DEM/anti-GOP manipulation, 0 if no manipulation, -1 if anti-DEM/pro-GOP manipulation. Robust standard errors in parentheses. Centrebet: each observation is an IEM price matched to the most recent Centrebet price; the observation period is 10/23/00 (when CentreBet began posting odds) until 11/7/00. The data are at intervals of roughly ten minutes (to ensure each time period receives equal weight, each observation is weighted by the inverse number of observations in a fifteen-minute window) Intertops: daily data 7/1/2000 until 11/7/00; no manipulation indicators are used because the data is not high frequency.
56
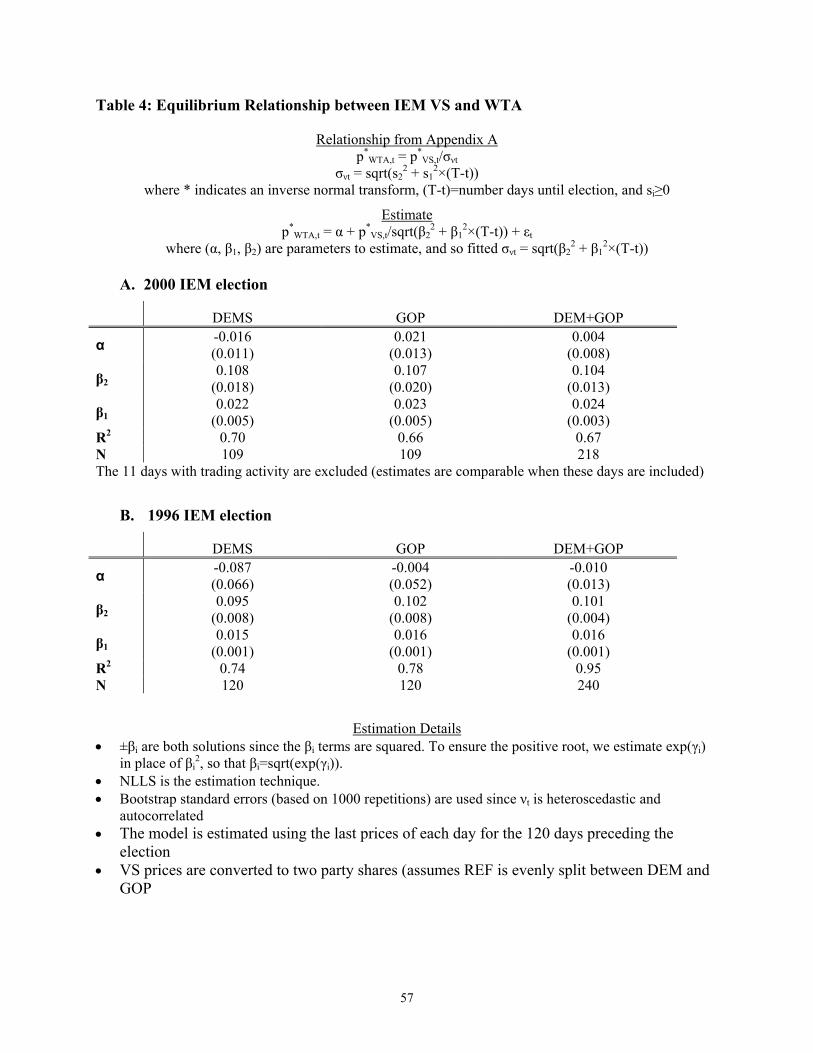
Table 4: Equilibrium Relationship between IEM VS and WTA
Relationship from Appendix A p*
WTA,t = p*VS,t/σνt
σνt = sqrt(s22 + s1
2×(T-t)) where * indicates an inverse normal transform, (T-t)=number days until election, and si≥0
Estimate p*
WTA,t = α + p*VS,t/sqrt(β2
2 + β12×(T-t)) + εt
where (α, β1, β2) are parameters to estimate, and so fitted σνt = sqrt(β22 + β1
2×(T-t))
A. 2000 IEM election DEMS GOP DEM+GOP
α -0.016 (0.011)
0.021 (0.013)
0.004 (0.008)
β20.108
(0.018) 0.107
(0.020) 0.104
(0.013)
β10.022
(0.005) 0.023
(0.005) 0.024
(0.003) R2 0.70 0.66 0.67 N 109 109 218 The 11 days with trading activity are excluded (estimates are comparable when these days are included)
B. 1996 IEM election
DEMS GOP DEM+GOP
α -0.087 (0.066)
-0.004 (0.052)
-0.010 (0.013)
β20.095
(0.008) 0.102
(0.008) 0.101
(0.004)
β10.015
(0.001) 0.016
(0.001) 0.016
(0.001) R2 0.74 0.78 0.95 N 120 120 240
Estimation Details • ±βi are both solutions since the βi terms are squared. To ensure the positive root, we estimate exp(γi)
in place of βi2, so that βi=sqrt(exp(γi)).
• NLLS is the estimation technique. • Bootstrap standard errors (based on 1000 repetitions) are used since νt is heteroscedastic and
autocorrelated • The model is estimated using the last prices of each day for the 120 days preceding the
election • VS prices are converted to two party shares (assumes REF is evenly split between DEM and
GOP
57

Table 5: Impact of Manipulations and Wash Sales/Bluffs on Democratic Odds Price in Historical New York Markets Dependent variable = Democrat odds price.
Presidential Races
(mean dep var=0.415, std dev=0.208) All Races
(mean dep var=0.473, std dev=0.200) Manipulation Wash/Bluff Manipulation Wash/Bluff
Party Days Coeff. St. Error Coeff. St. Error Coeff. St. Error Coeff. St. Error
Republican -7 0.0094 0.0096 0.0290 0.0138 0.0116 0.0090 -0.0008 0.0190
-6 0.0013 0.0091 0.0037 0.0102 0.0094 0.0096 -0.0096 0.0141
-5 0.0175 0.0106 0.0129 0.0107 0.0236 0.0111 -0.0038 0.0128
-4 0.0014 0.0084 0.0091 0.0128 0.0042 0.0085 0.0144 0.0117
-3 -0.0002 0.0077 -0.0058 0.0148 0.0029 0.0073 0.0021 0.0155
-2 -0.0123 0.0079 -0.0202 0.0097 -0.0057 0.0075 -0.0122 0.0101
-1 -0.0111 0.0084 -0.0286 0.0120 -0.0115 0.0078 -0.0095 0.0106
0 -0.0306 0.0073 -0.0533 0.0077 -0.0284 0.0071 -0.0336 0.0098
1 -0.0085 0.0089 -0.0348 0.0056 -0.0082 0.0089 -0.0107 0.0098
2 -0.0081 0.0104 -0.0424 0.0135 -0.0101 0.0105 -0.0103 0.0144
3 0.0140 0.0106 -0.0547 0.0098 0.0184 0.0109 -0.0390 0.0100
4 -0.0176 0.0111 -0.0329 0.0127 -0.0212 0.0109 -0.0297 0.0105
5 -0.0193 0.0124 -0.0494 0.0114 -0.0213 0.0116 -0.0456 0.0131
Democratic -7 0.0834 0.0268 -0.0078 0.0114 0.0000 0.0234 -0.0150 0.0081
-6 -0.0921 0.0065 -0.0117 0.0118 -0.0191 0.0133 -0.0247 0.0095
-5 0.0391 0.0288 -0.0109 0.0069 0.0163 0.0164 -0.0216 0.0070
-4 -0.0232 0.0255 -0.0143 0.0074 -0.0175 0.0108 -0.0188 0.0075
-3 0.0093 0.0236 -0.0226 0.0065 -0.0143 0.0112 -0.0202 0.0055
-2 0.0584 0.0197 -0.0171 0.0058 0.0024 0.0165 -0.0137 0.0057
-1 -0.0163 0.0185 -0.0214 0.0058 -0.0087 0.0100 -0.0233 0.0059
0 0.0594 0.0235 -0.0219 0.0052 0.0103 0.0112 -0.0181 0.0065
1 0.1046 0.0256 -0.0120 0.0050 0.0439 0.0170 -0.0155 0.0056
2 0.0420 0.0295 -0.0238 0.0064 0.0541 0.0160 -0.0287 0.0064
3 0.0648 0.0241 -0.0359 0.0064 0.0606 0.0159 -0.0414 0.0089
4 0.0553 0.0228 -0.0194 0.0056 0.0574 0.0183 -0.0130 0.0062
5 0.0222 0.0096 -0.0242 0.0064 0.0460 0.0132 -0.0122 0.0066
Election
Fixed Effects: Yes Yes No. of Obs.: 1235 2185
R-squared: 0.942 0.926 Notes: This table reports the results for two regressions measuring the impacts of manipulation events and wash or bluff bet events in: (1) presidential races and (2) all races. The standard errors are robust.
58
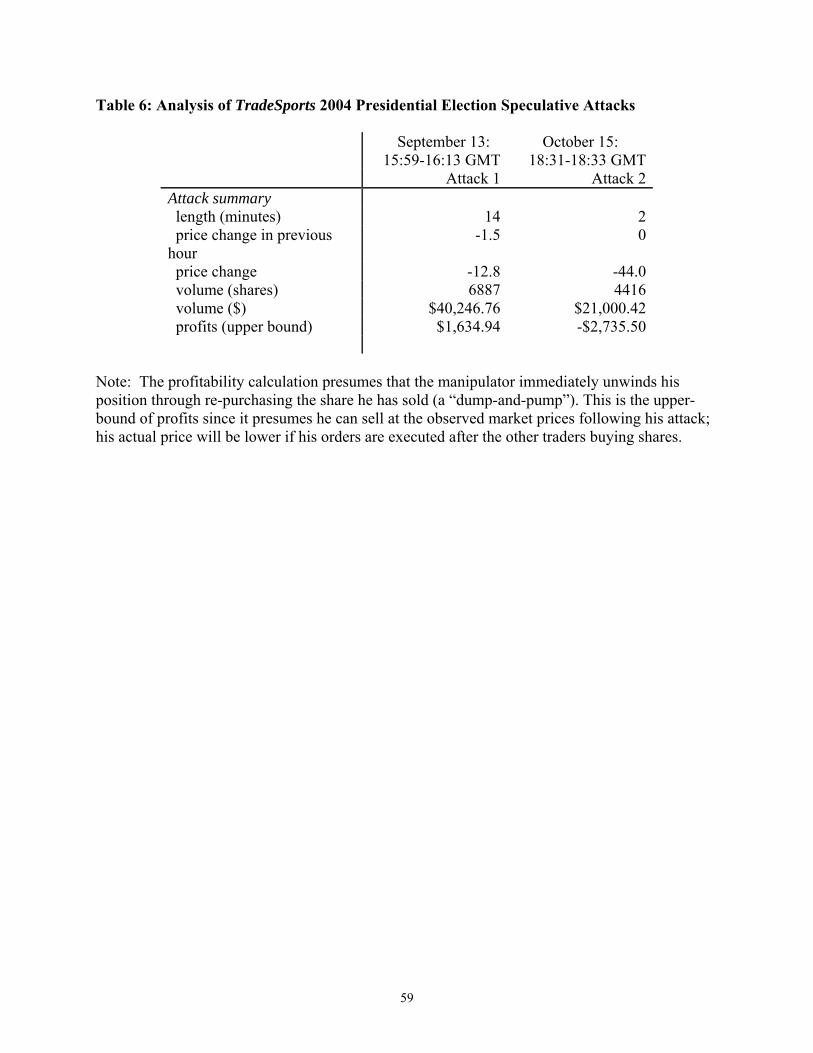
59
Table 6: Analysis of TradeSports 2004 Presidential Election Speculative Attacks
September 13: 15:59-16:13 GMT
October 15: 18:31-18:33 GMT
Attack 1 Attack 2 Attack summary length (minutes) 14 2 price change in previous hour
-1.5 0
price change -12.8 -44.0 volume (shares) 6887 4416 volume ($) $40,246.76 $21,000.42 profits (upper bound) $1,634.94 -$2,735.50
Note: The profitability calculation presumes that the manipulator immediately unwinds his position through re-purchasing the share he has sold (a “dump-and-pump”). This is the upper-bound of profits since it presumes he can sell at the observed market prices following his attack; his actual price will be lower if his orders are executed after the other traders buying shares.
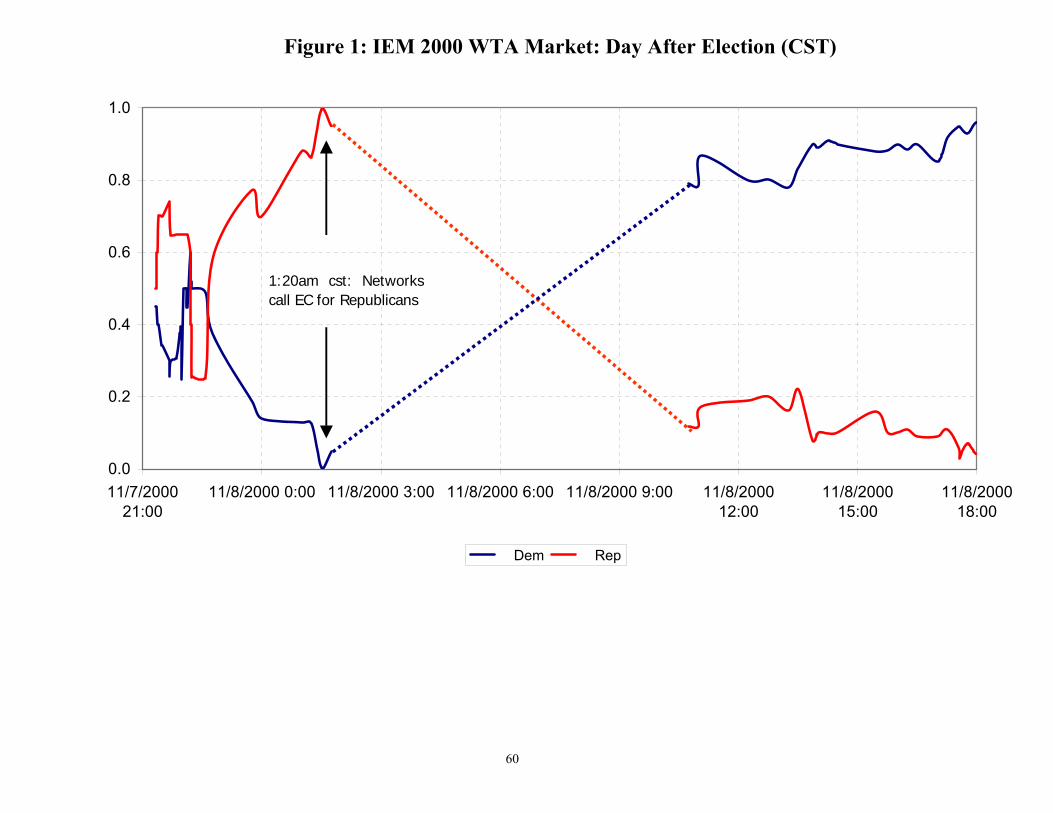
0.0
0.2
0.4
0.6
0.8
1.0
11/7/200021:00
11/8/2000 0:00 11/8/2000 3:00 11/8/2000 6:00 11/8/2000 9:00 11/8/200012:00
11/8/200015:00
11/8/200018:00
Dem Rep
1:20am cst: Networkscall EC for Republicans
Figure 1: IEM 2000 WTA Market: Day After Election (CST)
60
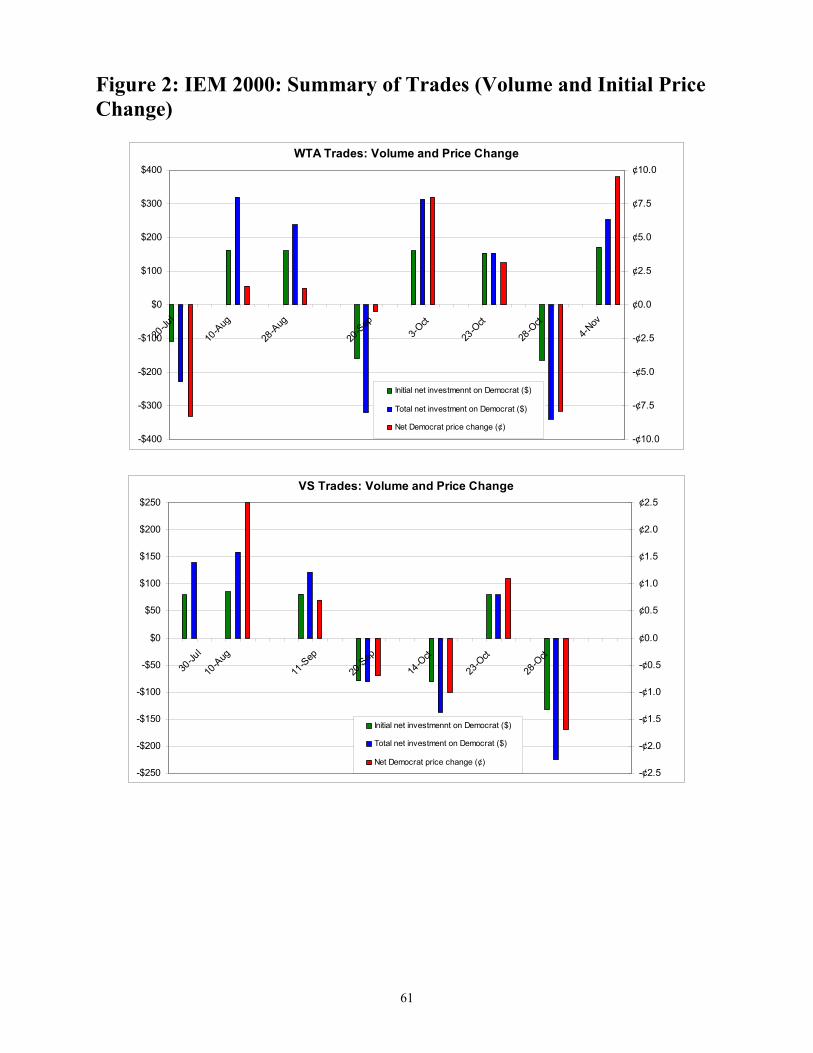
Figure 2: IEM 2000: Summary of Trades (Volume and Initial Price Change)
61
WTA Trades: Volume and Price Change
-$100
$0
$100
$200
$300
$400
20-Ju
l
10-A
ug
28-A
ug
20-S
ep3-O
ct
23-O
ct
28-O
ct4-N
ov
-¢10.0
-¢7.5
-¢5.0
-¢2.5
¢0.0
¢2.5
¢5.0
¢7.5
¢10.0
-$400
-$300
-$200
Initial net investmennt on Democrat ($)
Total net investment on Democrat ($)
Net Democrat price change (¢)
VS Trades: Volume and Price Change
-$250
-$200
-$150
-$100
-$50
$0
$50
$100
$150
$200
$250
30-Ju
l
10-A
ug
11-S
ep
20-S
ep
14-O
ct
23-O
ct
28-O
ct
-¢2.5
-¢2.0
-¢1.5
-¢1.0
-¢0.5
¢0.0
¢0.5
¢1.0
¢1.5
¢2.0
¢2.5
Net Democrat price change (¢)
Total net investment on Democrat ($)
Initial net investmennt on Democrat ($)
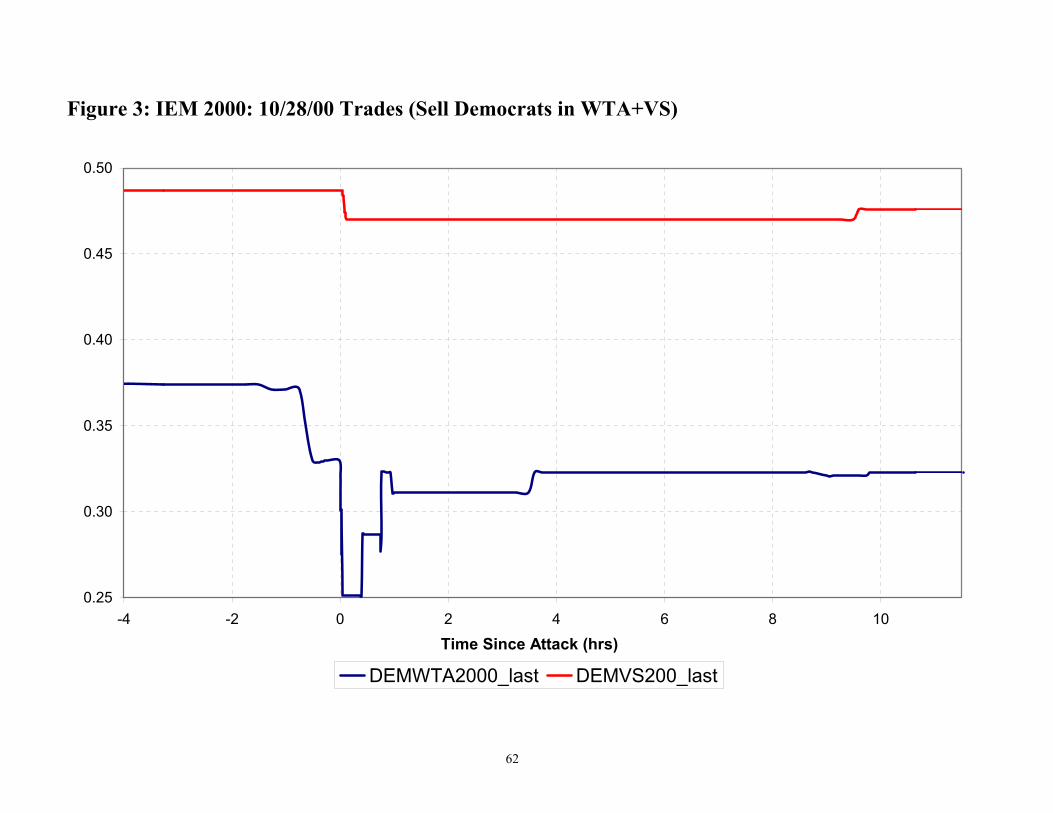
0.25
0.30
0.35
0.40
0.45
0.50
-4 -2 0 2 4 6 8 10
Time Since Attack (hrs)
DEMWTA2000_last DEMVS200_last
Figure 3: IEM 2000: 10/28/00 Trades (Sell Democrats in WTA+VS)
62
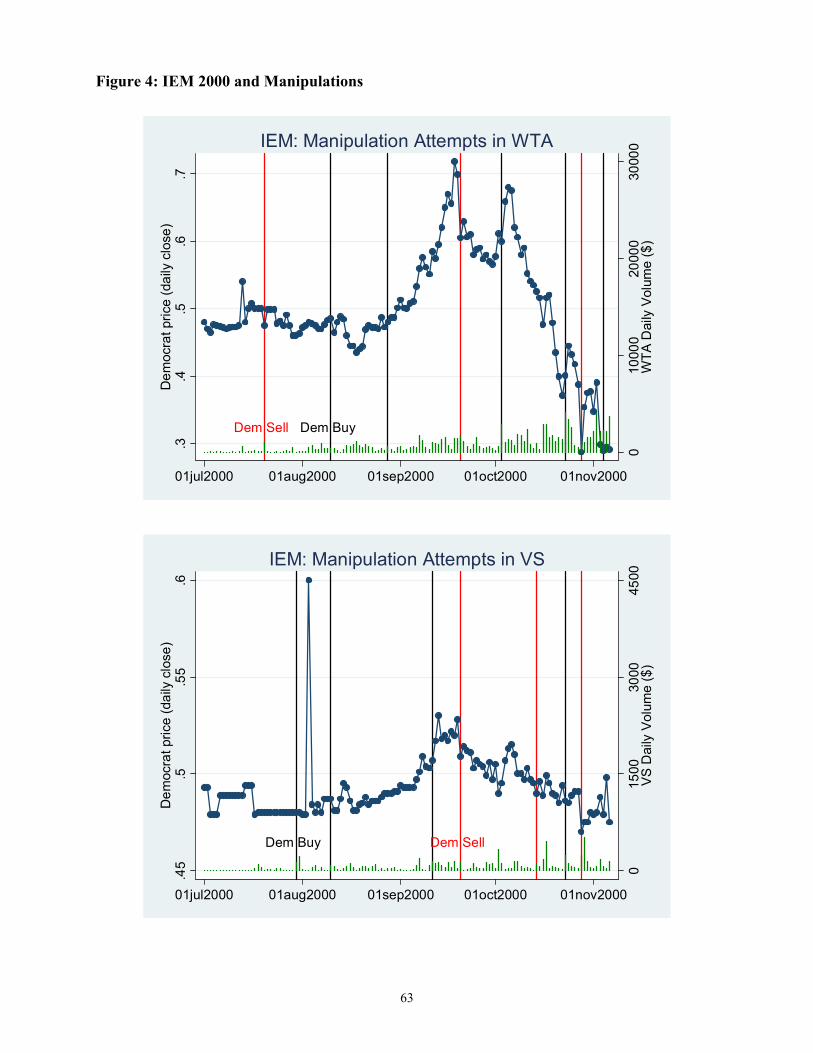
Figure 4: IEM 2000 and Manipulations
Dem Sell Dem Buy
010
000
2000
030
000
WTA
Dai
ly V
olum
e ($
)
.3.4
.5.6
.7D
emoc
rat p
rice
(dai
ly c
lose
)
01jul2000 01aug2000 01sep2000 01oct2000 01nov2000
IEM: Manipulation Attempts in WTA
Dem SellDem Buy
015
0030
0045
00V
S D
aily
Vol
ume
($)
.45
.5.5
5.6
Dem
ocra
t pric
e (d
aily
clo
se)
01jul2000 01aug2000 01sep2000 01oct2000 01nov2000
IEM: Manipulation Attempts in VS
63
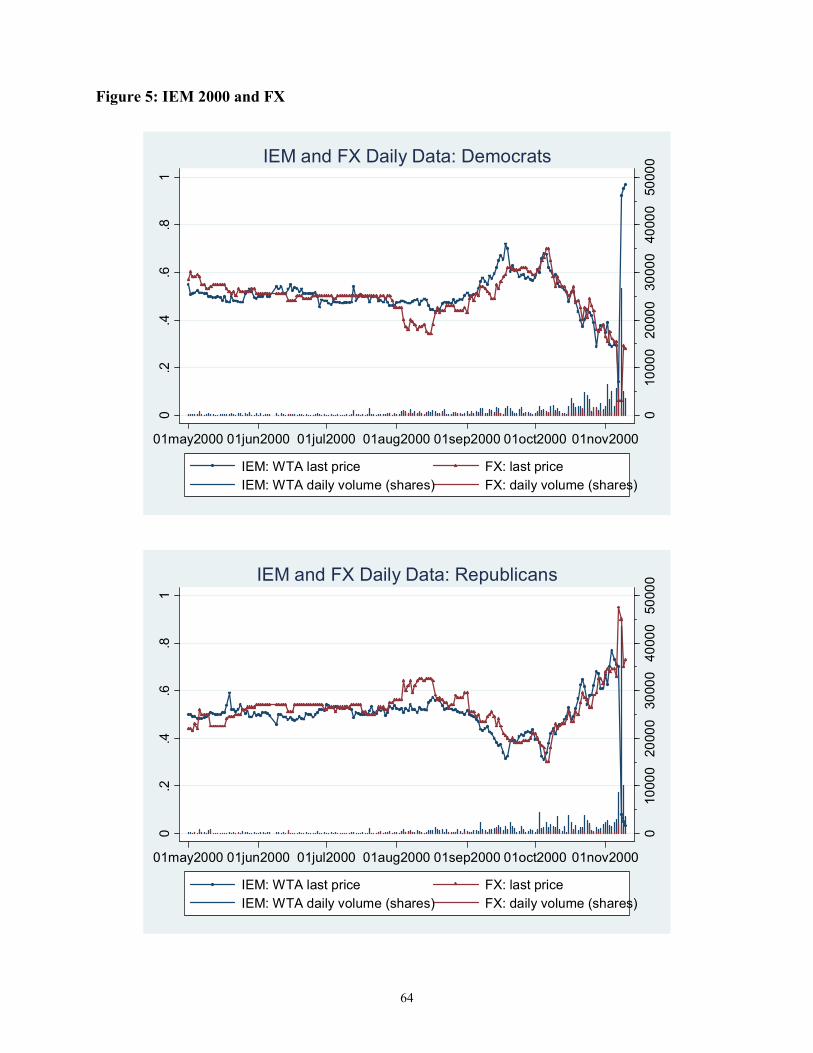
Figure 5: IEM 2000 and FX
010
000
2000
030
000
4000
050
000
0.2
.4.6
.81
01may2000 01jun2000 01jul2000 01aug2000 01sep2000 01oct2000 01nov2000
IEM: WTA last price FX: last priceIEM: WTA daily volume (shares) FX: daily volume (shares)
IEM and FX Daily Data: Democrats
010
000
2000
030
000
4000
050
000
0.2
.4.6
.81
01may2000 01jun2000 01jul2000 01aug2000 01sep2000 01oct2000 01nov2000
IEM: WTA last price FX: last priceIEM: WTA daily volume (shares) FX: daily volume (shares)
IEM and FX Daily Data: Republicans
64
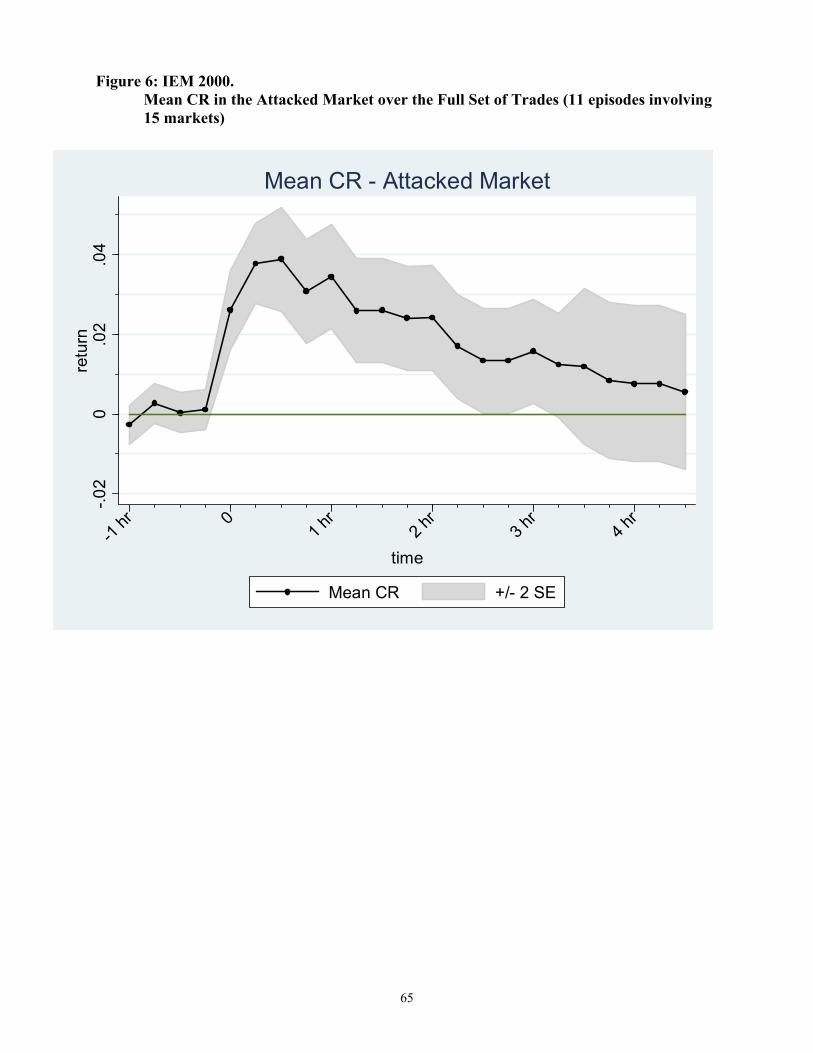
Figure 6: IEM 2000. Mean CR in the Attacked Market over the Full Set of Trades (11 episodes involving 15 markets)
-.02
0.0
2.0
4re
turn
-1 hr 0
1 hr
2 hr
3 hr
4 hr
time
Mean CR +/- 2 SE
Mean CR - Attacked Market
65
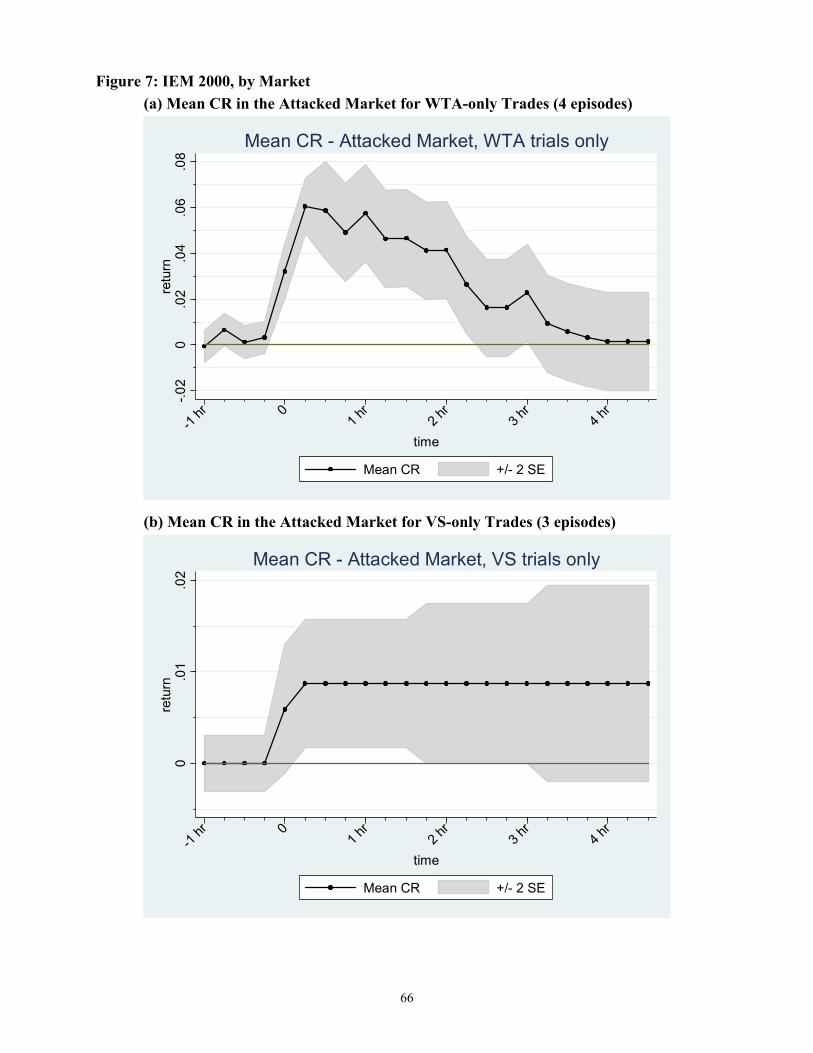
Figure 7: IEM 2000, by Market (a) Mean CR in the Attacked Market for WTA-only Trades (4 episodes)
-.02
0.0
2.0
4.0
6.0
8re
turn
-1 hr 0
1 hr
2 hr
3 hr
4 hr
time
Mean CR +/- 2 SE
Mean CR - Attacked Market, WTA trials only
(b) Mean CR in the Attacked Market for VS-only Trades (3 episodes)
0.0
1.0
2re
turn
-1 hr 0
1 hr
2 hr
3 hr
4 hr
time
Mean CR +/- 2 SE
Mean CR - Attacked Market, VS trials only
66
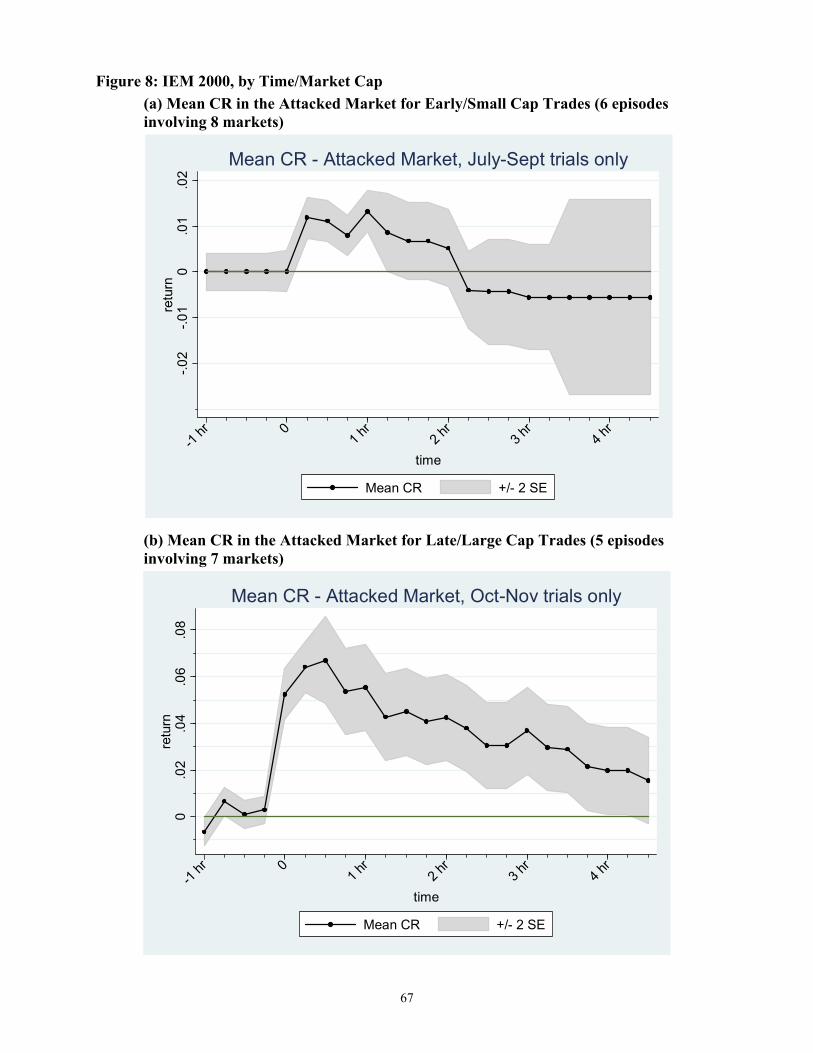
Figure 8: IEM 2000, by Time/Market Cap (a) Mean CR in the Attacked Market for Early/Small Cap Trades (6 episodes involving 8 markets)
-.02
-.01
0.0
1.0
2re
turn
-1 hr 0
1 hr
2 hr
3 hr
4 hr
time
Mean CR +/- 2 SE
Mean CR - Attacked Market, July-Sept trials only
(b) Mean CR in the Attacked Market for Late/Large Cap Trades (5 episodes involving 7 markets)
0.0
2.0
4.0
6.0
8re
turn
-1 hr 0
1 hr
2 hr
3 hr
4 hr
time
Mean CR +/- 2 SE
Mean CR - Attacked Market, Oct-Nov trials only
67
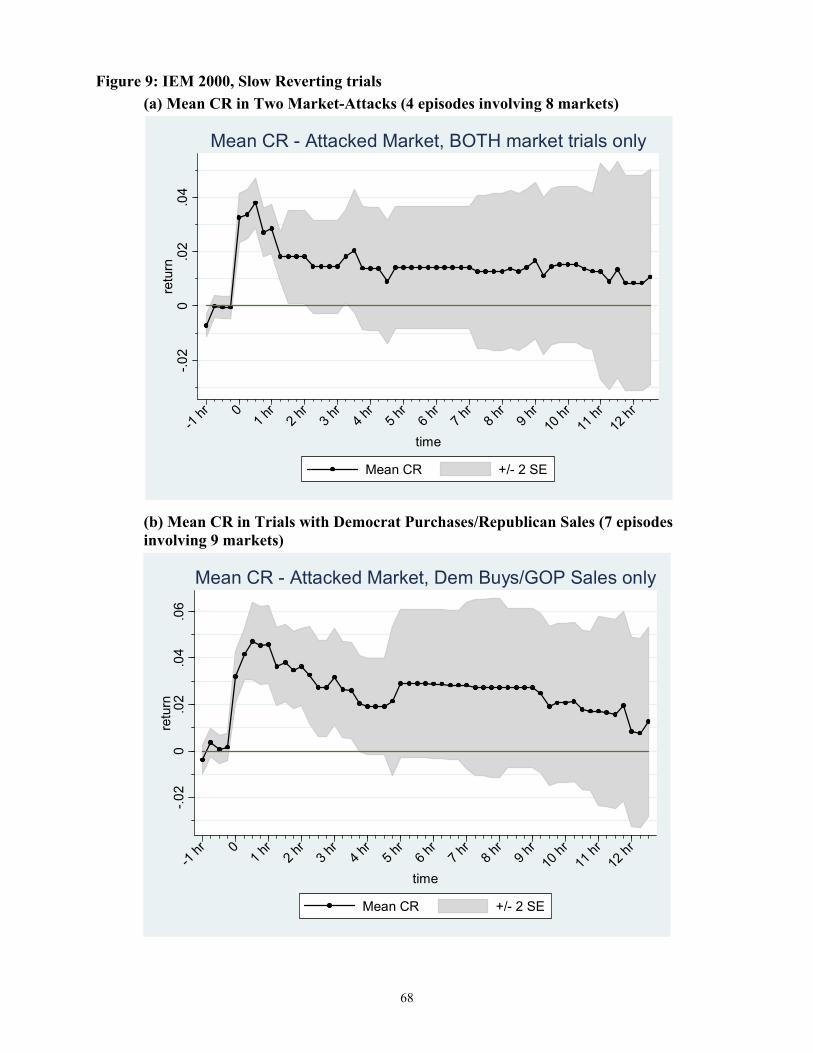
Figure 9: IEM 2000, Slow Reverting trials (a) Mean CR in Two Market-Attacks (4 episodes involving 8 markets)
-.02
0.0
2.0
4re
turn
-1 hr 0
1 hr
2 hr
3 hr
4 hr
5 hr
6 hr
7 hr
8 hr
9 hr
10 hr
11 hr
12 hr
time
Mean CR +/- 2 SE
Mean CR - Attacked Market, BOTH market trials only
(b) Mean CR in Trials with Democrat Purchases/Republican Sales (7 episodes involving 9 markets)
-.02
0.0
2.0
4.0
6re
turn
-1 hr 0
1 hr
2 hr
3 hr
4 hr
5 hr
6 hr
7 hr
8 hr
9 hr
10 hr
11 hr
12 hr
time
Mean CR +/- 2 SE
Mean CR - Attacked Market, Dem Buys/GOP Sales only
68
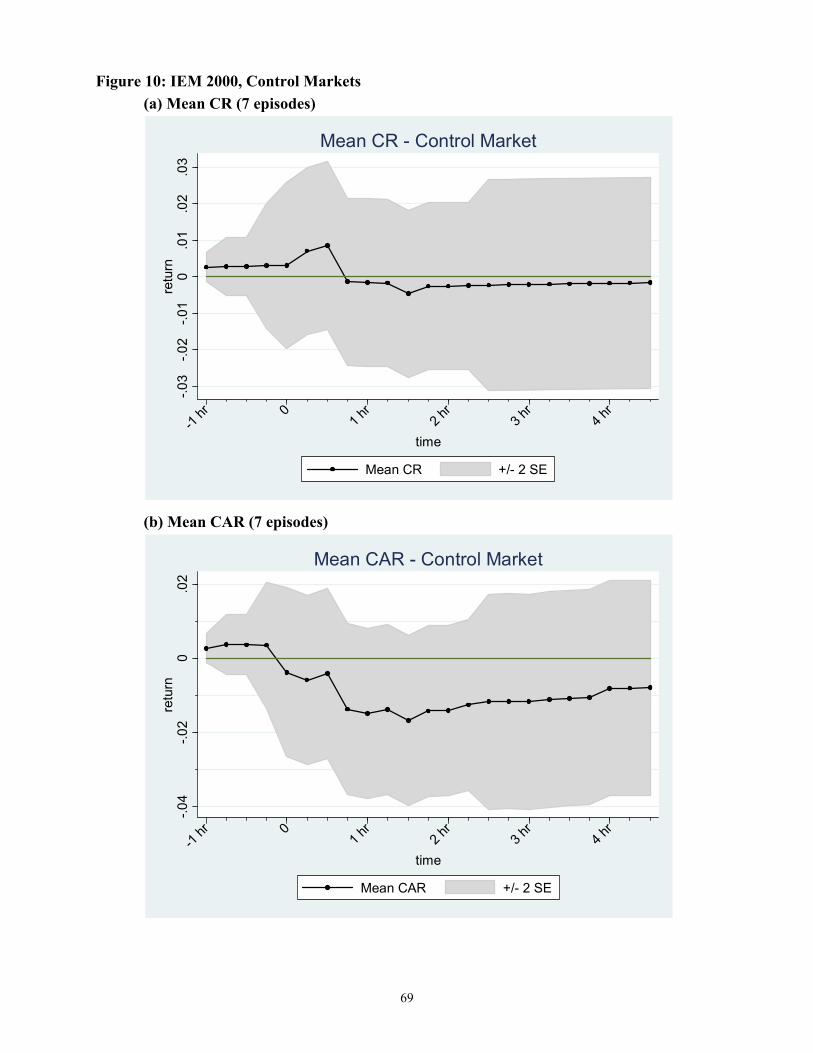
Figure 10: IEM 2000, Control Markets (a) Mean CR (7 episodes)
-.03
-.02
-.01
0.0
1.0
2.0
3re
turn
-1 hr 0
1 hr
2 hr
3 hr
4 hr
time
Mean CR +/- 2 SE
Mean CR - Control Market
(b) Mean CAR (7 episodes)
-.04
-.02
0.0
2re
turn
-1 hr 0
1 hr
2 hr
3 hr
4 hr
time
Mean CAR +/- 2 SE
Mean CAR - Control Market
69
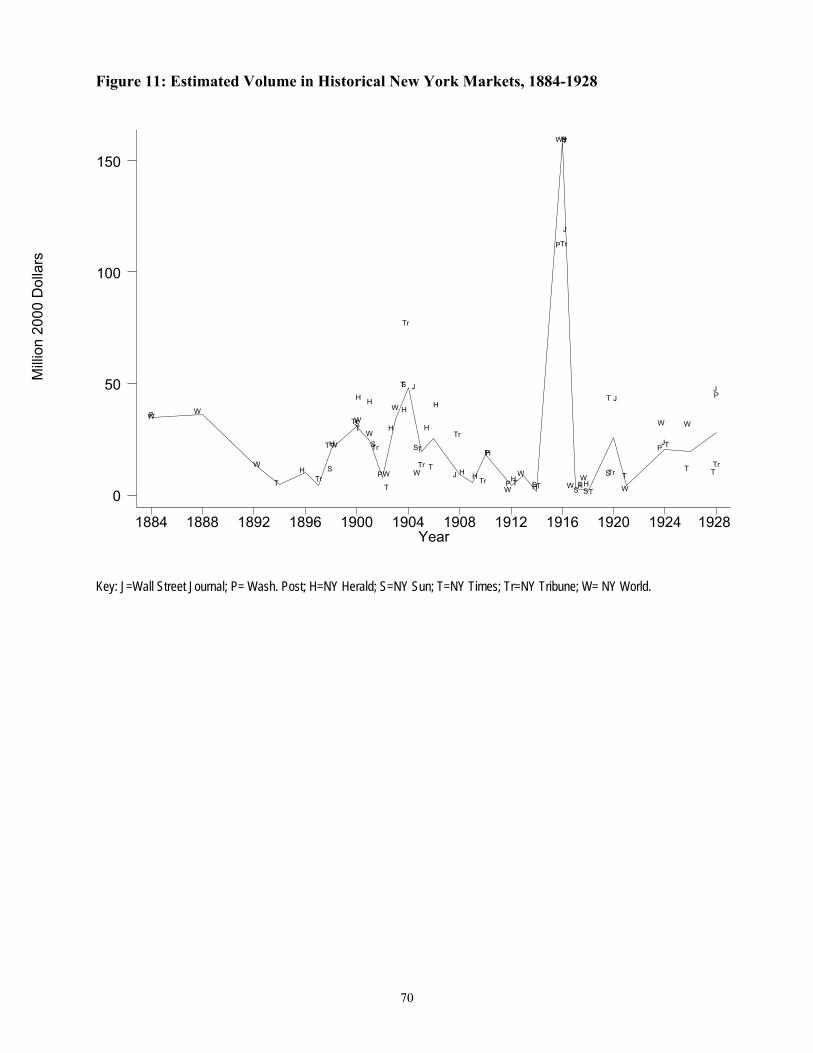
Mill
ion
2000
Dol
lars
Year1884
Key: J=Wall Street Journal; P= Wash. Post; H=NY Herald; S=NY Sun; T=NY Times; Tr=NY Tribune; W= NY World.
Figure 11: Estimated Volume in Historical New York Markets, 1884-1928
100
150
50
0
70
1888 1892 1896 1900 1904 1908 1912 1916 1920 1924 1928
WPW
W
T
HTr
HWT
S
TrTWS
H H
TrSW
WP
T
H
W
TS
Tr
H
J
TrW
TS
H
H
TJ H
Tr
H
HP
Tr TPW
HW
SHT
Tr
J
W
P
TSH
W HTS T
WHS
JT
STr T
W
TJP
W
T
W
TTr
JP
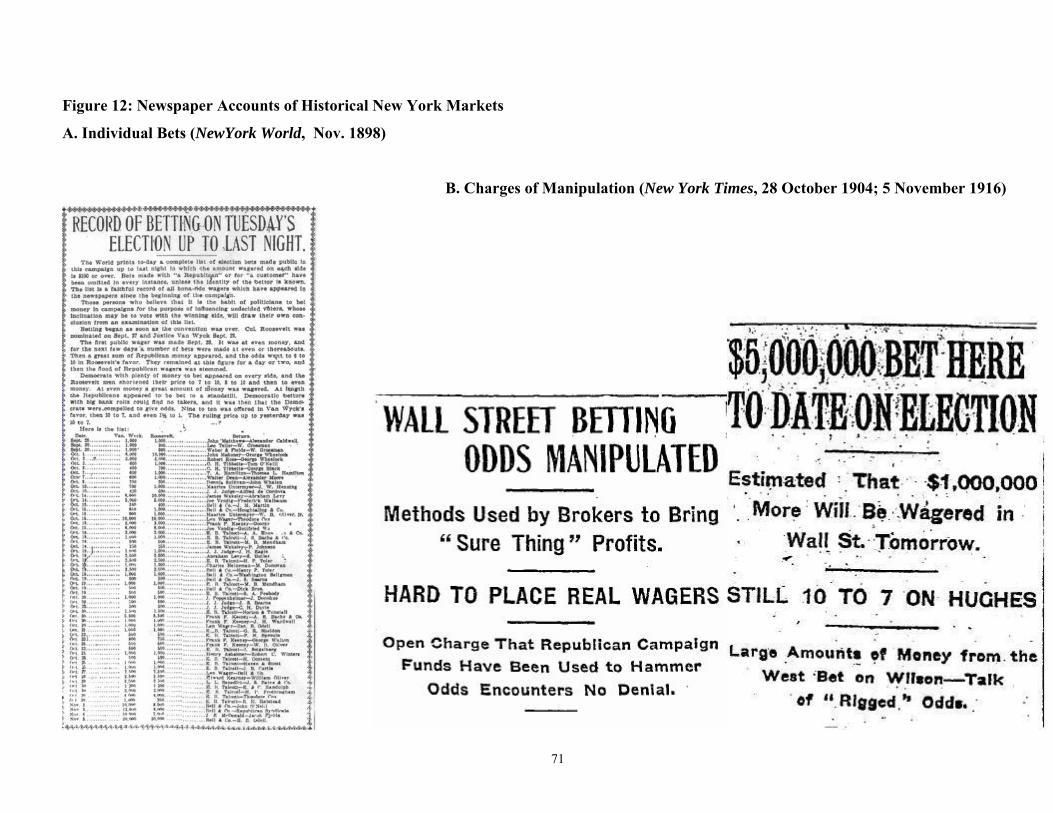
B. Charges of Manipulation (New York Times, 28 October 1904; 5 November 1916)
71
Figure 12: Newspaper Accounts of Historical New York Markets
A. Individual Bets (NewYork World, Nov. 1898)
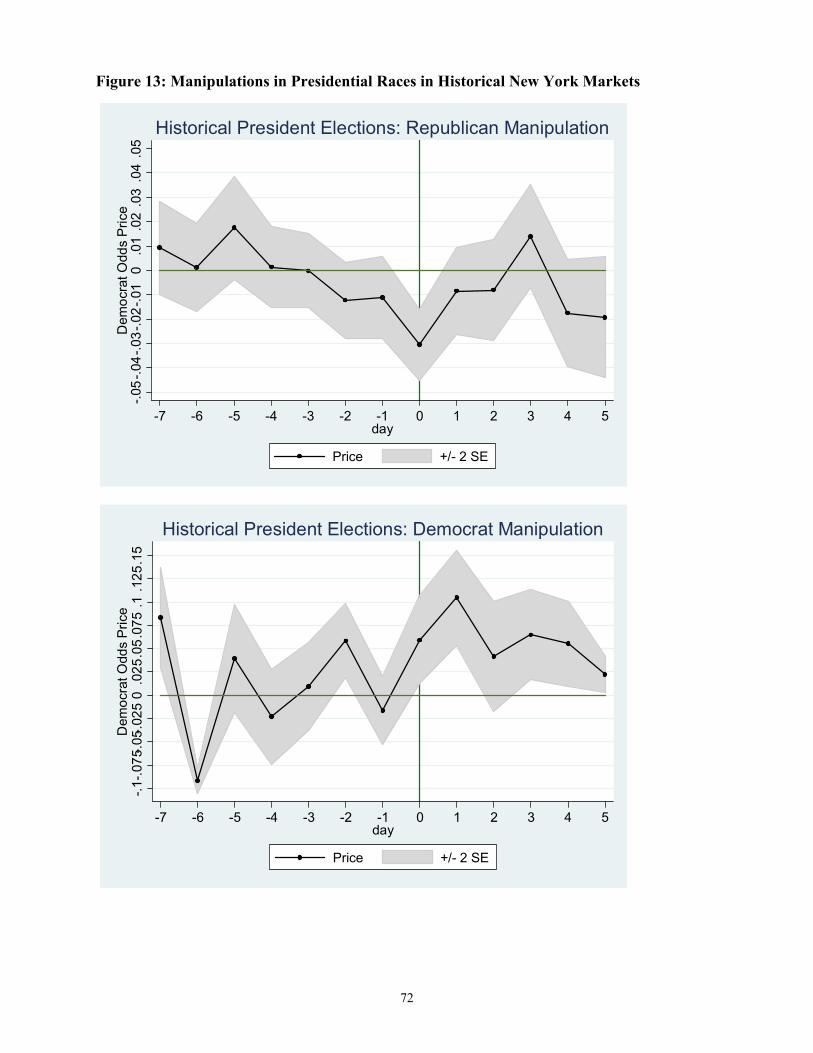
Figure 13: Manipulations in Presidential Races in Historical New York Markets
-.05
-.04-
.03-
.02-
.01
0.0
1.0
2.0
3.0
4.0
5D
emoc
rat O
dds
Pric
e
-7 -6 -5 -4 -3 -2 -1 0 1 2 3 4 5day
Price +/- 2 SE
Historical President Elections: Republican Manipulation
-.1-.0
75-.0
5-.02
50
.025
.05.
075
.1.1
25.1
5D
emoc
rat O
dds
Pric
e
-7 -6 -5 -4 -3 -2 -1 0 1 2 3 4 5day
Price +/- 2 SE
Historical President Elections: Democrat Manipulation
72
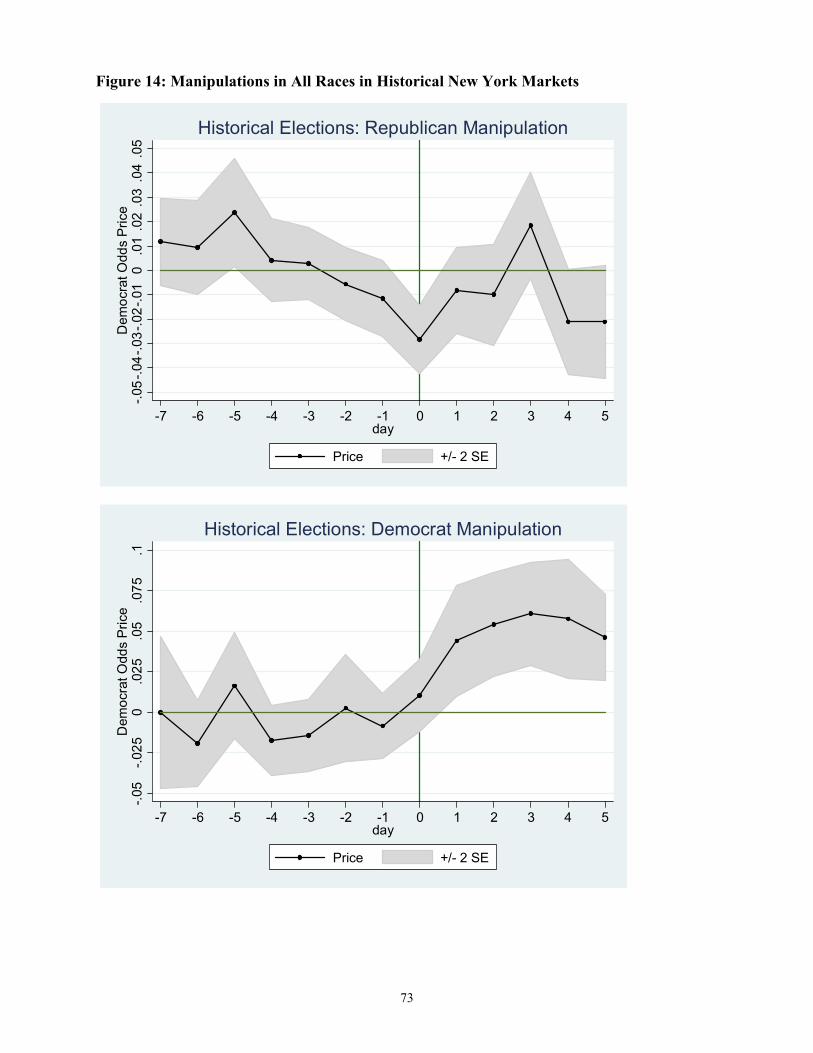
Figure 14: Manipulations in All Races in Historical New York Markets
-.05
-.04-
.03-
.02-
.01
0.0
1.0
2.0
3.0
4.0
5D
emoc
rat O
dds
Pric
e
-7 -6 -5 -4 -3 -2 -1 0 1 2 3 4 5day
Price +/- 2 SE
Historical Elections: Republican Manipulation
-.05
-.025
0.0
25.0
5.0
75.1
Dem
ocra
t Odd
s P
rice
-7 -6 -5 -4 -3 -2 -1 0 1 2 3 4 5day
Price +/- 2 SE
Historical Elections: Democrat Manipulation
73
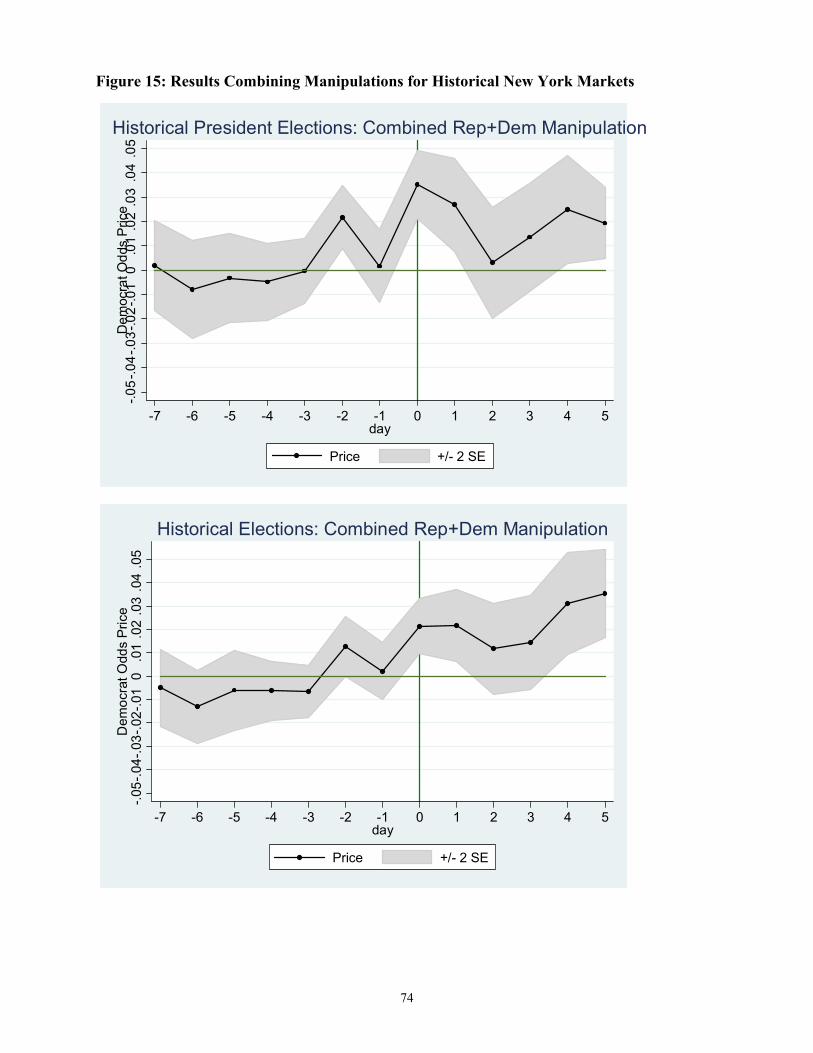
74
Figure 15: Results Combining Manipulations for Historical New York Markets
-.05
-.04-
.03-
.02-
.01
0.0
1.0
2.0
3.0
4.0
5D
emoc
rat O
dds
Pric
e
-7 -6 -5 -4 -3 -2 -1 0 1 2 3 4 5day
Price +/- 2 SE
Historical President Elections: Combined Rep+Dem Manipulation
-.05-
.04-
.03-
.02-
.01
0.0
1.0
2.0
3.0
4.0
5D
emoc
rat O
dds
Pric
e
-7 -6 -5 -4 -3 -2 -1 0 1 2day
Price +/- 2 SE
Historical Elections: Combined Rep+Dem Manipulation
3 4 5
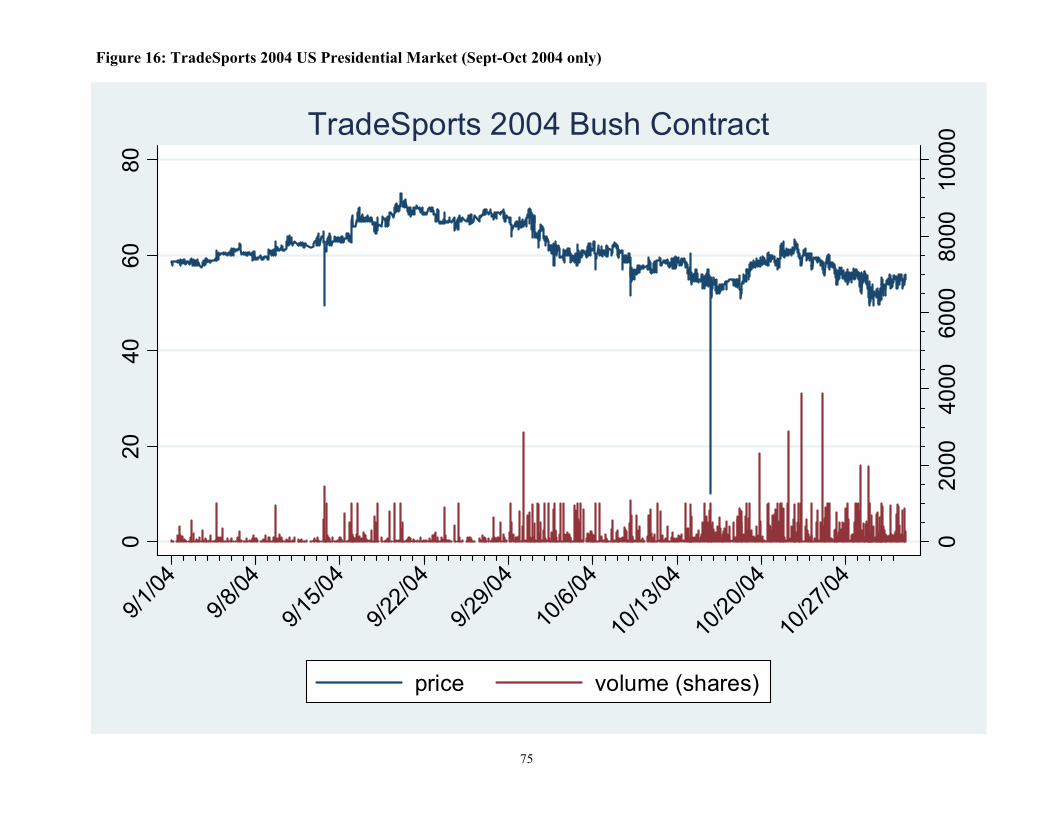
8000
6000
4000
2000
010
000
020
4060
80
9/1/04
9/8/04
9/15/0
4
9/22/0
4
9/29/0
4
10/6/
0410
/13/04
10/20
/0410
/27/04
price volume (shares)
TradeSports 2004 Bush Contract
Figure 16: TradeSports 2004 US Presidential Market (Sept-Oct 2004 only)
75
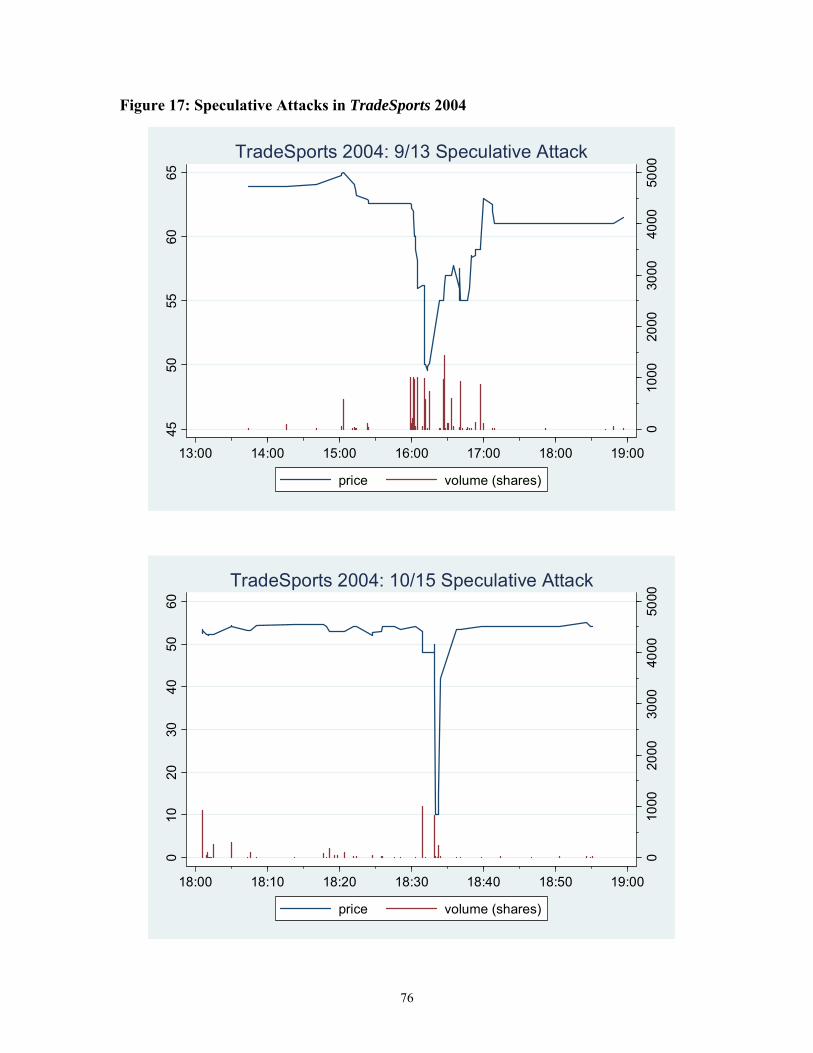
Figure 17: Speculative Attacks in TradeSports 2004
010
0020
0030
0040
0050
00
4550
5560
65
13:00 14:00 15:00 16:00 17:00 18:00 19:00
price volume (shares)
TradeSports 2004: 9/13 Speculative Attack
010
0020
0030
0040
0050
00
010
2030
4050
60
18:00 18:10 18:20 18:30 18:40 18:50 19:00
price volume (shares)
TradeSports 2004: 10/15 Speculative Attack
76
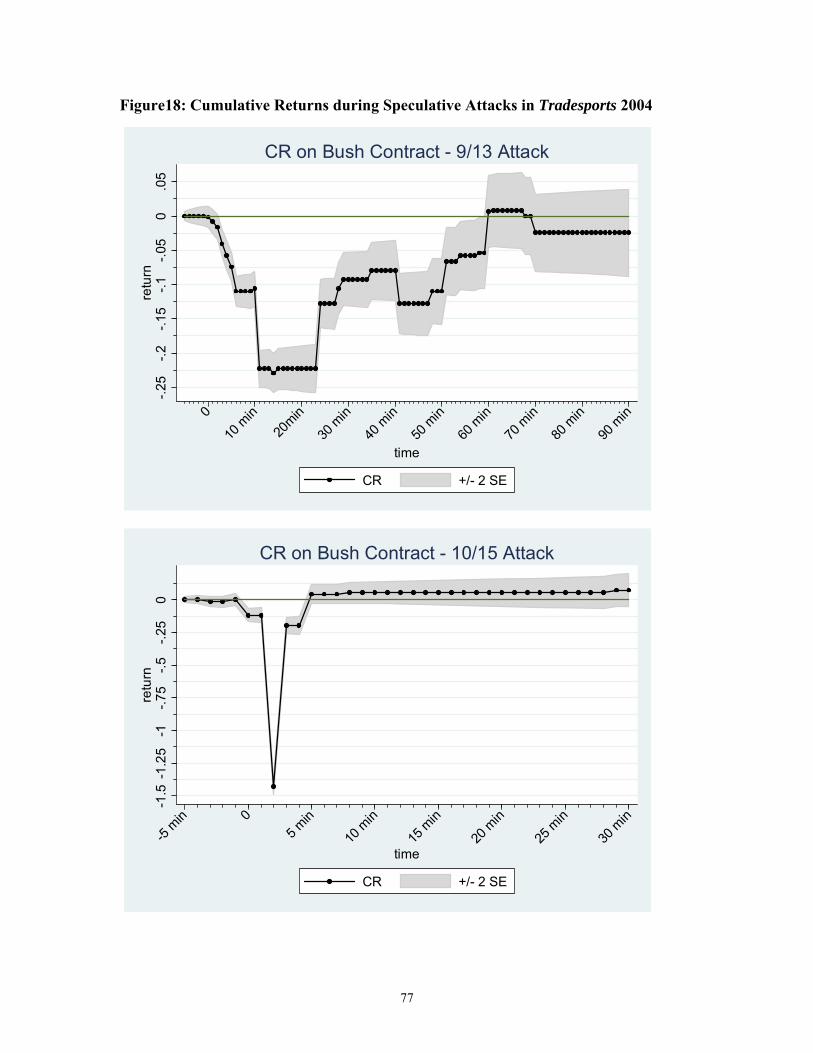
Figure18: Cumulative Returns during Speculative Attacks in Tradesports 2004
-.25
-.2-.1
5-.1
-.05
0.0
5re
turn
0
10 m
in20
min
30 m
in
40 m
in
50 m
in
60 m
in
70 m
in
80 m
in
90 m
in
time
CR +/- 2 SE
CR on Bush Contract - 9/13 Attack
-1.5
-1.2
5-1
-.75
-.5-.2
50
retu
rn
-5 min 0
5 min
10 m
in
15 m
in
20 m
in
25 m
in
30 m
in
time
CR +/- 2 SE
CR on Bush Contract - 10/15 Attack
77