manitoba budget 2018 papers a economic review and outlook b supplementary financial information c...
TRANSCRIPT

MANITOBA BUDGET 2018

This document is available on the Internet at:
www.gov.mb.ca/finance
Information available at this site includes:
• The 2018 Manitoba Budget Address
• Budget 2018
• Budget Papers
A Economic Review and Outlook
B Supplementary Financial Information
C Tax Measures
D Fiscal Arrangements
E Made-in-Manitoba Climate and Green Plan
F Reducing Poverty and Promoting Community Involvement
• Estimates of Expenditure and Revenue for the Fiscal Year Ending March 31, 2019
• Financial Reports
• Economic Highlights
• Economic Statistics
• Facts for Investors
Available in alternate formats upon request.
Les documents offerts en français sur le site Internet
www.gov.mb.ca/finance/index.fr.html comprennent :
• Discours du Budget 2018 du Manitoba
• Budget 2018
• Budget des dépenses et des recettes pour l’exercice se terminant le 31 mars 2019
• Rapports financiers
Disponible en d’autres formats, sur demande.
ISSN 1913-2492

B U D G E T 2 0 1 8 / i i i
MANITOBA BUDGET 2018
CONTENTS
SUMMARY BUDGET 2018/19 ...................................................................................................................................... 1
FISCAL RESPONSIBILITY STRATEGY 2018/19: KEEPING OUR PROMISES ................................................................... 7
BUDGET PAPERSA Economic Review and OutlookB Supplementary Financial InformationC Tax MeasuresD Fiscal ArrangementsE Made-in-Manitoba Climate and Green PlanF Reducing Poverty and Promoting Community Involvement

i v / B U D G E T 2 0 1 8

SUMMARY BUDGET 2018/19
2 / B U D G E T 2 0 1 8
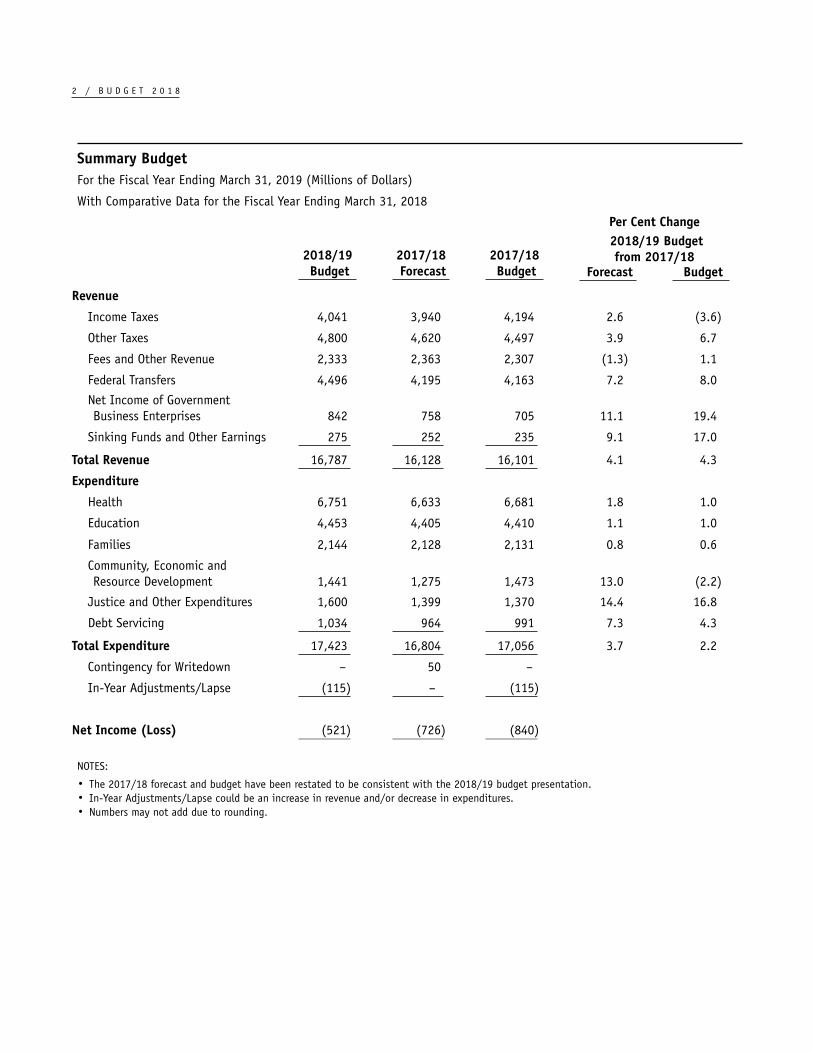
Summary BudgetFor the Fiscal Year Ending March 31, 2019 (Millions of Dollars)
With Comparative Data for the Fiscal Year Ending March 31, 2018
Per Cent Change 2018/19 Budget
from 2017/182018/19 Budget
2017/18 Forecast
2017/18 Budget Forecast Budget
Revenue
Income Taxes 4,041 3,940 4,194 2.6 (3.6)
Other Taxes 4,800 4,620 4,497 3.9 6.7
Fees and Other Revenue 2,333 2,363 2,307 (1.3) 1.1
Federal Transfers 4,496 4,195 4,163 7.2 8.0
Net Income of Government Business Enterprises 842 758 705 11.1 19.4
Sinking Funds and Other Earnings 275 252 235 9.1 17.0
Total Revenue 16,787 16,128 16,101 4.1 4.3
Expenditure
Health 6,751 6,633 6,681 1.8 1.0
Education 4,453 4,405 4,410 1.1 1.0
Families 2,144 2,128 2,131 0.8 0.6
Community, Economic and Resource Development 1,441 1,275 1,473 13.0 (2.2)
Justice and Other Expenditures 1,600 1,399 1,370 14.4 16.8
Debt Servicing 1,034 964 991 7.3 4.3
Total Expenditure 17,423 16,804 17,056 3.7 2.2
Contingency for Writedown – 50 –
In-Year Adjustments/Lapse (115) – (115)
Net Income (Loss) (521) (726) (840)
NOTES:
• The 2017/18 forecast and budget have been restated to be consistent with the 2018/19 budget presentation.• In-Year Adjustments/Lapse could be an increase in revenue and/or decrease in expenditures.• Numbers may not add due to rounding.

B U D G E T 2 0 1 8 / 3
SUMMARY BUDGET 2018/19
RevenueRevenue in 2018/19 is projected to increase $686 million, or 4.3%, from the 2017/18 Budget. Income tax revenue is projected to decrease by $153 million, with a $176 million decrease in individual income tax revenue and an increase of $23 million in corporation income tax revenue. Budget 2018 projects a $303 million, or 6.7%, increase in other tax revenue, mainly reflecting growth in retail sales tax and the new carbon tax. Fees and other revenue is projected to increase $26 million, or 1.1%. Federal transfers are projected to increase $333 million, or 8.0%. Net income of Government Business Enterprises is projected to increase $137 million and sinking funds and other earnings is projected to increase by $40 million.
ExpenditureExpenditure in 2018/19 is projected to increase $367 million, or 2.2%, from the 2017/18 Budget. The growth in health expenditure is $70 million, or 1.0%. Education-related expenditure is increasing by $43 million, or 1.0%. Families is up $13 million, or 0.6%. Community, economic and resource development expenditure will decrease by $32 million, or 2.2%. The justice and other expenditures sector will increase by $230 million, or 16.8% mainly reflecting expenses of $102 million for the establishment of the new Conservation Trust Fund. Debt servicing is expected to increase by $43 million.
4 / B U D G E T 2 0 1 8
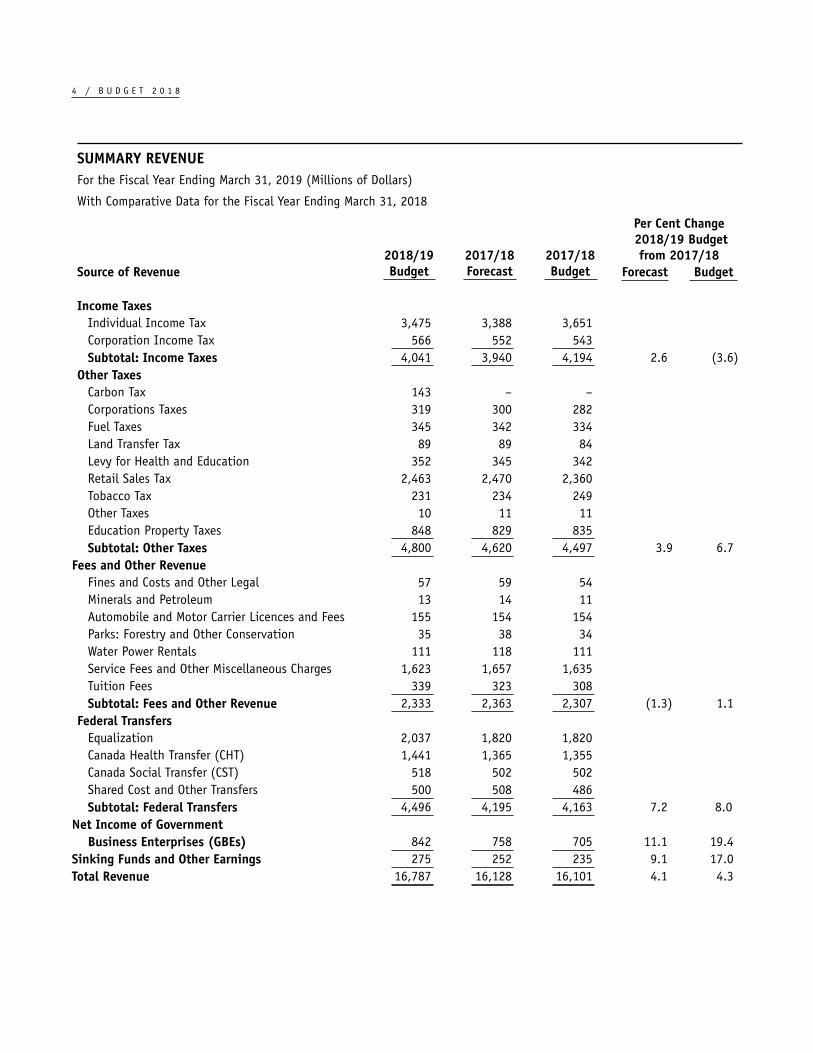
SUMMARY REVENUEFor the Fiscal Year Ending March 31, 2019 (Millions of Dollars)
With Comparative Data for the Fiscal Year Ending March 31, 2018
Per Cent Change 2018/19 Budget
from 2017/182018/19Budget
2017/18Forecast
2017/18BudgetSource of Revenue Forecast Budget
Income Taxes
Individual Income Tax 3,475 3,388 3,651 Corporation Income Tax 566 552 543Subtotal: Income Taxes 4,041 3,940 4,194 2.6 (3.6)
Other TaxesCarbon Tax 143 – –Corporations Taxes 319 300 282 Fuel Taxes 345 342 334 Land Transfer Tax 89 89 84 Levy for Health and Education 352 345 342 Retail Sales Tax 2,463 2,470 2,360Tobacco Tax 231 234 249Other Taxes 10 11 11Education Property Taxes 848 829 835Subtotal: Other Taxes 4,800 4,620 4,497 3.9 6.7
Fees and Other RevenueFines and Costs and Other Legal 57 59 54 Minerals and Petroleum 13 14 11 Automobile and Motor Carrier Licences and Fees 155 154 154 Parks: Forestry and Other Conservation 35 38 34 Water Power Rentals 111 118 111 Service Fees and Other Miscellaneous Charges 1,623 1,657 1,635 Tuition Fees 339 323 308 Subtotal: Fees and Other Revenue 2,333 2,363 2,307 (1.3) 1.1
Federal TransfersEqualization 2,037 1,820 1,820 Canada Health Transfer (CHT) 1,441 1,365 1,355 Canada Social Transfer (CST) 518 502 502 Shared Cost and Other Transfers 500 508 486 Subtotal: Federal Transfers 4,496 4,195 4,163 7.2 8.0
Net Income of GovernmentBusiness Enterprises (GBEs) 842 758 705 11.1 19.4
Sinking Funds and Other Earnings 275 252 235 9.1 17.0 Total Revenue 16,787 16,128 16,101 4.1 4.3

B U D G E T 2 0 1 8 / 5
SUMMARY EXPENDITUREFor the Fiscal Year Ending March 31, 2019 (Millions of Dollars)
With Comparative Data for the Fiscal Year Ending March 31, 2018
Per Cent Change2018/19 Budgetfrom 2017/182018/19
Budget 2017/18 Forecast
2017/18 Budget Sector/Department Forecast Budget
Health
Health, Seniors and Active Living 6,751 6,633 6,681 1.8 1.0
Education
Education and Training 4,453 4,405 4,410 1.1 1.0
Families
Families 2,144 2,128 2,131 0.8 0.6
Community, Economic and Resource Development
Agriculture 370 228 394
Growth, Enterprise and Trade 107 110 113
Indigenous and Northern Relations 34 32 32
Infrastructure 402 384 400
Municipal Relations 366 362 371
Sustainable Development 162 159 163
Subtotal: Community, Economic and Resource Development 1,441 1,275 1,473 13.0 (2.2)
Justice and Other Expenditures
Legislative Assembly 49 46 46
Executive Council 4 4 4
Civil Service Commission 21 21 21
Employee Pensions and Other Costs 81 82 77
Finance 351 347 352
Justice 671 658 661
Sport, Culture and Heritage 87 88 83
Enabling Appropriations 284 74 74
Other Appropriations 52 79 52
Subtotal: Justice and Other Expenditures 1,600 1,399 1,370 14.4 16.8
Debt Servicing 1,034 964 991 7.3 4.3
Total Expenditure 17,423 16,804 17,056 3.7 2.2
6 / B U D G E T 2 0 1 8
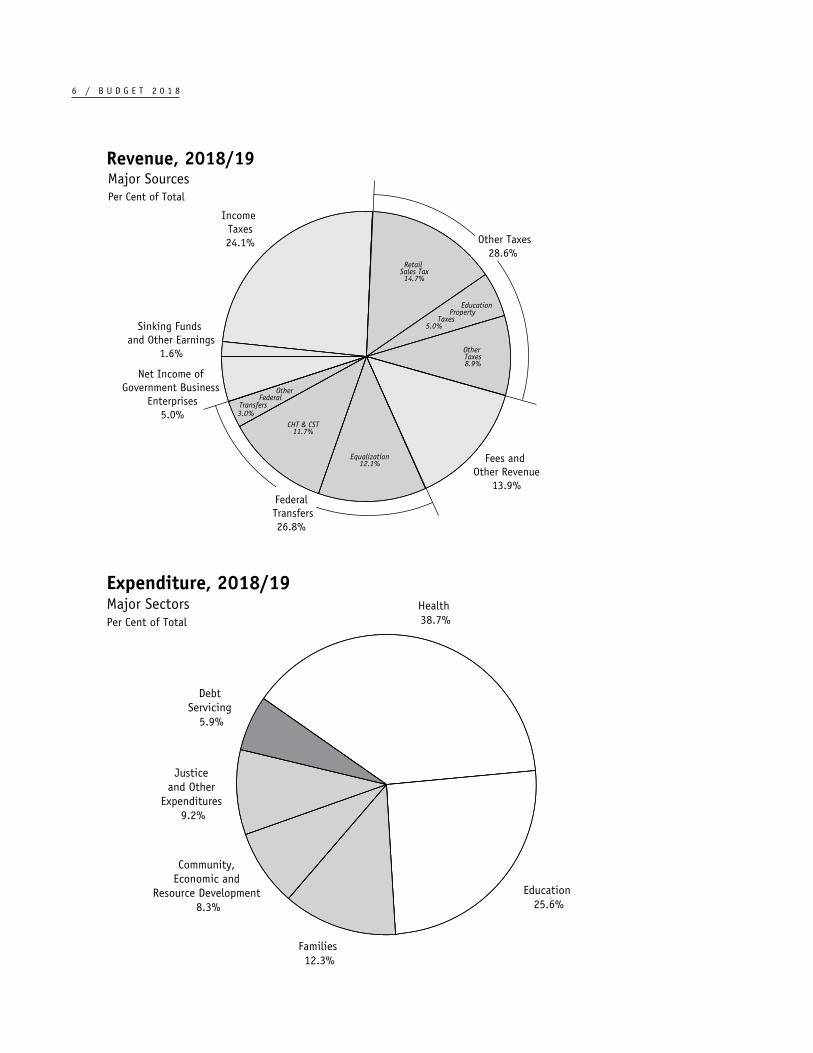
Per Cent of Total
Revenue, 2018/19Major Sources
Income Taxes24.1%
Retail Sales Tax14.7%
Education Property Taxes 5.0%
Other Taxes8.9%
Fees and Other Revenue
13.9%
Equalization12.1%
CHT & CST11.7%
Net Income of Government Business
Enterprises5.0%
Sinking Funds and Other Earnings
1.6%
Federal Transfers26.8%
Other Taxes28.6%
3.0%
Other Federal Transfers
Health 38.7%
Education 25.6%
Families 12.3%
Community, Economic and
Resource Development 8.3%
Justice and Other
Expenditures 9.2%
Debt Servicing
5.9%
Expenditure, 2018/19
Per Cent of Total Major Sectors
FISCAL RESPONSIBILITY STRATEGY 2018/19: KEEPING OUR PROMISES

FISCAL RESPONSIBILITY STRATEGY 2018/19: KEEPING OUR PROMISES
CONTENTS
FISCAL RESPONSIBILITY STRATEGY: KEEPING OUR PROMISES .................................................................................. 9
MANITOBANS MAKING CHOICES ................................................................................................................................ 11
FOCUS ON SUMMARY .................................................................................................................................................. 12
BUILDING THE BUDGET – FOCUS ON OUTCOMES ........................................................................................................ 14
REBUILDING THE ECONOMY........................................................................................................................................ 21
SECURING OUR FUTURE: IMPROVEMENTS TO THE FISCAL RESPONSIBILITY AND TAXPAYER PROTECTION ACT.......... 24
THE PATH FORWARD ................................................................................................................................................... 25

B U D G E T 2 0 1 8 / 9
FISCAL RESPONSIBILITY STRATEGY: KEEPING OUR PROMISESOur government inherited a legacy of unsustainable annual increases in spending, ballooning deficits, and faltering services. Our economy was becoming ever more dependent on public spending and increasingly exposed to risk of further credit downgrades and interest rate hikes.
We have a measured plan to deal with these challenges and make Manitoba the most improved province in Canada. This requires hard work. To keep our promise, we need to take nearly a billion dollars of wasteful spending out of our annual budget, focusing on outcomes and value for the money we are spending today in order to create better opportunities in the future.
Budget 2018 delivers on our commitment to restore stability to our finances, secure our public services and strengthen the economy for Manitobans, even as our debt servicing costs are budgeted to increase to over a billion dollars this year. We are also setting clear objectives to manage future financial volatility and to further improve financial transparency and accountability.
These are our promises. And we intend to fulfill these promises. Manitobans deserve a break.

1 0 / B U D G E T 2 0 1 8
Storm CloudsManitoba’s ability to withstand economic turbulence may be tested significantly over the coming year, as a number of factors combine to create a period of considerable volatility. As an economy that relies on export revenue in a number of key sectors, uncertainty over the future of the North American Free Trade Agreement casts an ominous shadow. The United States is Manitoba’s largest trading partner; the erosion of this relationship would have immediate and severe consequences for Manitoba. Within Canada, the increased frequency and severity of interprovincial trade disputes threatens to undermine the viability of both the New West Partnership and the Canadian Free Trade Agreement.
Manitoba’s tax competitiveness is also a growing issue. Tax reforms recently adopted by the United States government have significantly reduced both personal and corporate tax rates, challenging Manitoba’s ability to compete with American states for investment, job recruitment and skilled professionals. Exacerbating this challenge are recent tax increases implemented by the Government of Canada, which created significant volatility in provincial personal income tax receipts – from $160 million over expectations in 2016, to $262 million below expectations in 2017. We have yet to see evidence that income tax revenues will return to previous levels in 2018/19, which puts material pressure on Manitoba’s finances, despite a strong underlying economy.
Also looming over Manitoba’s economy is the probability of higher interest rates. Central banks throughout the world, including the Bank of Canada, have begun to slowly increase their rates and have signaled that additional rate hikes may occur over the coming year. In 2018/19, our borrowing costs will surpass one billion dollars – up $70 million year over year. This increase is attributable to increased debt from higher borrowings ($50 million) as well as the impact of higher interest rates ($20 million). On a full-year basis, the short-term impact of a 1% increase in interest rates could approach $100 million, with the longer term impact being much greater. To put this in context, debt servicing costs – if this were a government department – would be our fourth largest department – larger than Justice!
Major Areas of SpendingMillions of Dollars
Source: Manitoba Finance
0
1,000
2,000
3,000
4,000
5,000
6,000
7,000
8,000
6,751
4,453
2,144
1,034671 402
Health Education Families Debt Servicing
Justice Infrastructure

B U D G E T 2 0 1 8 / 1 1
MANITOBANS MAKING CHOICESBudget 2018 is informed by pre-budget consultations that engaged close to 35,000 Manitobans, almost double the previous record set in 2017.
Our consultation process included an online survey, community consultations and three telephone-based town halls. In addition, hundreds of Manitobans submitted letters to the Minister of Finance, offering their input and highlighting their priorities for Budget 2018.
Online Survey:
Over 18,000 Respondents
Telephone Town Halls:
3 Events with nearly 16,000 Participants
Written Submissions
from Stakeholders:
Nearly 80 Submitted
Community Meetings:
57 Stakeholder Presentations
Here is what Manitobans told us:
Manitobans agree that:
• fixing our fiscal situation is a top priority
• the current debt load is unsustainable
• a moderate path to balancing the budget is reasonable
• the Manitoba Civil Service can be streamlined through attrition and trimming senior management positions
Manitobans want a health care system that is cost-effective and focused on delivering quality and timely care. They agree that:
• cost savings can be found within the system
• wait times must be reduced, increasing the availability of high tech equipment and freeing up more personal care home beds
• a health care premium is not right for Manitoba
• the federal government should cover half of the province’s health care costs
Manitobans want a cannabis policy that ensures:
• criminal gangs are out of the cannabis business
• the safety of citizens, whether or not they are using cannabis

1 2 / B U D G E T 2 0 1 8
FOCUS ON SUMMARYFor many years, annual government budgets focused on core government departments, and less attention was paid to other government entities such as the crown corporations. In 2007, Manitoba fully implemented Canadian Public Sector Accounting Standards which require the consolidation of all government entities under a single budgeting and reporting framework to improve transparency and provide citizens with a “whole of government” perspective. This comprehensive approach is consistent with the way most Manitobans and credit rating agencies assess governments’ fiscal performance, and ensures that public services are consistently and properly managed.
Summary statements acknowledge this reality by reporting on all entities of government that provide provincial public services paid for by Manitobans, whether through taxes or rate payments such as hydro or auto insurance. It is for this reason that Manitoba’s balanced budget legislation applies to Summary statements, and that a portion of the ministers’ pay is impacted by these results. By extension, any summary deficit increases net debt.
While accounting and budgeting has evolved to include other entities, the related financial decision-making framework has remained largely segregated, with government focused on the core departments over which the Legislative Assembly exercises direct control. The central Manitoba government departments not influenced by multiple Other Reporting Entities (ORE) make up only 22% of Manitoba’s summary expenditure budget, while the four crown corporations that are Government Business Enterprises (GBE) represent 22% of expenditures, 25% of revenue and 70% of capital investment.
In the summary budget, GBEs are consolidated on a modified equity basis. The following illustration shows the relative total scope of GBE expenditures compared to core government and OREs. For purposes of this illustration the Health and Education sectors are included with OREs as the majority of the departmental expenditures ultimately flow to school divisions and regional health authorities.
Per Cent of Total
Total 2018/19 Expenditures
GovernmentBusiness
Enterprises22%
Health30%
Education20%
Other OREs 1%
Families 9%
Community, Economic
and Resource Development
7%
Justiceand Other
Expenditures6%
Debt Servic-
ing5%
Government Business Enterprises
22%
Other Reporting Entities
51%
Core Government
22%
Debt Servicing
Source: Manitoba Finance
Per Cent of Total
Total 2018/19 Capital
Government Business Enterprises
70%
Other Reporting Entities
12%
Core Government
18%
Hydro 67% 3%
GBEOther
Health 8%
Education 4%
Infrastructure 11%
Other Core 7%
Source: Manitoba Finance

B U D G E T 2 0 1 8 / 1 3
Summary Budget DefinedMan i t oba ’s summar y budge t i n c l u d e s r e v enue f o r e c a s t s and expenditure est imates for government departments as well as projections for the approximately 180 other repor t ing ent it ies. This is a “whole of government” reporting approach for Manitoba’s public services.
File: Impact of OREs and GBEs 18 ALT.ai Created: March 6, 2018 Revised: Fixed: March 7, 2018
-200
-100
0
100
200
300
400
09/1010/11
07/0808/09
11/1212/13
13/1414/15
15/1616/17
Impact of OREs and GBEs Millions of Dollars
Hydro Net of Hydro
Source: Manitoba Finance
There are approximately 180 reporting entities across summary government, including major crown corporations (Manitoba Hydro, Manitoba Public Insurance and Manitoba Liquor and Lotteries), universities and colleges, school divisions and the health and family services authorities, as well as major insurance providers like the Workers Compensation Board and the Manitoba Agricultural Services Corporation. Financial variability in even one of these entities dramatically impacts our ability to improve Manitoba’s fiscal position and directly impacts how much funding is available for other core programs and services.
We are asking reporting entities to take the same steps that government departments have taken – streamlining the workforce, reducing management structures and pivoting towards achieving the outcomes that Manitobans demand and deserve. We are also working to reduce volatility. Increasingly this will be a part of our plan to bring the summary budget into balance.
Taking InventoryPrudent financial stewardship requires taking stock of what you own and assessing how much of it has value going forward. In the process of taking inventory, we have discovered that the previous government’s actions resulted in over-valued or worthless assets being held on our books, creating situations where we have liabilities that are not properly recorded and are unnecessarily exposing our finances to added risk. Over the past year, as we familiarized ourselves with the extent of these risks, we have taken prudent measures to put our financial house back in order. Recovering from past decisions and clarifying the status of our assets will restore public confidence in Government’s accounting practices and, more importantly, put our books on a more predictable and stable foundation. This work continues and further details of our progress will be provided upon release of the 2017/18 Public Accounts.
1 4 / B U D G E T 2 0 1 8
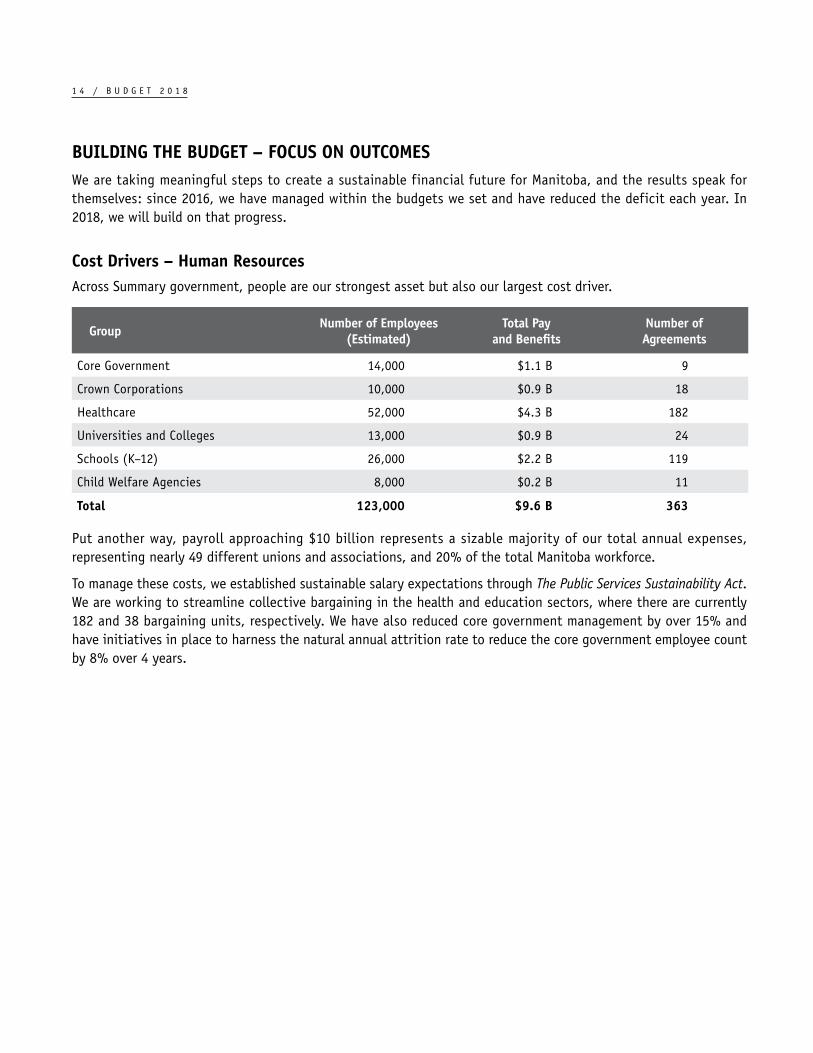
BUILDING THE BUDGET – FOCUS ON OUTCOMESWe are taking meaningful steps to create a sustainable financial future for Manitoba, and the results speak for themselves: since 2016, we have managed within the budgets we set and have reduced the deficit each year. In 2018, we will build on that progress.
Cost Drivers – Human ResourcesAcross Summary government, people are our strongest asset but also our largest cost driver.
Group Number of Employees (Estimated)
Total Pay and Benefits
Number of Agreements
Core Government 14,000 $1.1 B 9
Crown Corporations 10,000 $0.9 B 18
Healthcare 52,000 $4.3 B 182
Universities and Colleges 13,000 $0.9 B 24
Schools (K–12) 26,000 $2.2 B 119
Child Welfare Agencies 8,000 $0.2 B 11
Total 123,000 $9.6 B 363
Put another way, payroll approaching $10 billion represents a sizable majority of our total annual expenses, representing nearly 49 different unions and associations, and 20% of the total Manitoba workforce.
To manage these costs, we established sustainable salary expectations through The Public Services Sustainability Act. We are working to streamline collective bargaining in the health and education sectors, where there are currently 182 and 38 bargaining units, respectively. We have also reduced core government management by over 15% and have initiatives in place to harness the natural annual attrition rate to reduce the core government employee count by 8% over 4 years.

B U D G E T 2 0 1 8 / 1 5
Cost Drivers – Previous Capital Investments
Millions of Dollars
Debt Financed Capital Spending from 2004/05 to 2018/19
Investment at CPIActual Investment in Capital
File: Capital Investment Growth 18.aiCreated: March 7, 2018Revised: March 7, 2018 Fixed: March 9, 2018
04/0505/06
06/0707/08
08/0909/10
10/1111/12
12/1313/14
14/1515/16
16/17 17/18f
18/19b0
200
400
600
800
1,000
1,200
1,400
1,600
1,800
Source: Manitoba Financef - Forecast b - Budget
For many year s, s ignif icant capit al investments were undertaken without regard for their sustainability, and they are now compromising our ability to live within our means and make progress on eliminating the deficit. For example, in the Department of Infrastructure, capital debt repayment (including enabling expenses) represents 70% of its 2018/19 operating expenditures. Even if we were to choose to make no further capital investment in our highways and bridges, we would still be spending over $450 million annually for years to come, just to pay for the decisions of the past.
Last year’s budget highlighted the challenges resulting from past unsustainable capital spending levels; levels that had quadrupled over a period of 11 years to their peak in 2015/16, when growth at the rate of inflation would have resulted in only a 32% increase.
The level of growth in core debt-financed capital has resulted in a $2 billion increase in net debt over the past five years and a corresponding increase in interest costs to the Province, comprising a much larger share than in the past.
Not only did this growth reflect unprecedented and unsustainable increases – it also occurred without a focus on return on investment.
In response, our government has developed a comprehensive long-term strategy to bend the capital cost curve starting with a 6.9% reduction in Strategic Infrastructure from 2017/18 Budget levels. Through the later half of 2017, the Manitoba Government undertook significant work to develop tools to assess capital spending programs, resulting in some delays and related reductions in capital spending.
As promised in the 2016 Throne Speech, a new return on investment test to prioritize government investments is being applied to ensure Manitobans receive value for their money. We are making all of these changes to spend capital in more thoughtful ways, all while keeping our election promise to spend more than a billion dollars every year on Strategic Infrastructure.
The 2018/19 capital budget reflects priorities of:
• economic growth;
• minimizing costs of asset ownership;
• valuing “fix and repair” over conspicuous construction of unnecessary structures;
• investing in schools for underserved communities that have been neglected in the past;
• health transformation; and
• environmental infrastructure in response to climate change.

1 6 / B U D G E T 2 0 1 8
Strategic Infrastructure 2018/19Millions of Dollars 2018/19
Budget2017/18Forecast
2017/18Budget
Roads, Highways, Bridges and Flood Protection
Highways Infrastructure and Airport Runway Capital 355 436 510
Maintenance and Preservation – Highways 136 146 143
Water Related Infrastructure 104 45 60
Transportation Equipment and Aircraft 17 12 19
Maintenance and Preservation – Water 12 14 15
Subtotal 624 653 747
Health, Education and Housing
Health 319 183 358
Education 168 95 176
Housing 90 95 107
Subtotal 577 373 641
Other Provincial Infrastructure
Municipal and Local Infrastructure 178 181 189
Public Service Buildings, Equipment and Technology 171 57 88
Parks, Cottage and Camping 12 1 12
Subtotal 361 239 289
Total Strategic Infrastructure 1,562 1,265 1,677
NOTES:
• The 2017/18 forecast and budget have been restated to be consistent with the 2018/19 budget presentation.
For too long, our capital spending priorities have focused on new, conspicuous head offices, while ignoring basic needs like schools and failing to maintain the institutions that we own. This budget sets the stage for a major investment in five new schools that will result in schools’ share of total capital spending increasing significantly in 2019/20. This investment reflects our commitment to addressing a history of neglect, which has resulted in too many students trying to learn in crowded schools and portable classrooms.
Last year, we announced that we would explore the feasibility and benefits of building schools under a Public-Private Partnerships (P3) model, and we retained KPMG to advise us on this approach and to share the experience of other jurisdictions. While we remain fully committed to the benefits of P3s and partnering with private enterprise, we will always turn to evidence and pursue the best value for money. For a number of reasons – including lack of scale for P3 schools, the increased timeline and expense of a P3 tendering process, the urgent need to open new schools and the value for money, we have decided to build these schools using an enhanced conventional tender. Informed by our review of the P3 construction process, the Public Schools Finance Board (PSFB) has incorporated new, leading-edge practices including tendering multiple schools simultaneously. As a result, the cost of constructing these five schools has been reduced by nearly $19 million, and three of the five schools will be completed a year ahead of schedule.

B U D G E T 2 0 1 8 / 1 7
Cost Drivers – Health Care
File: Health.ai Created: March 7, 2018Revised: March 8 2018 Fixed:
Manitoba Health, Seniors and Active LivingHistorical Budget Trend
Source: Manitoba Finance
Percentage IncreaseApproved Budget98/99 02/03 06/07 10/11 14/15 18/19
0
1,000
2,000
3,000
4,000
5,000
6,000
7,000Millions of Dollars
0
2
4
6
8
10
12
14
16Per Cent
Healthcare spending has grown to represent over 40% of our core budget. Over the past 20 years, healthcare budgets have tripled, from $1.9 billion in 1998 to $6.2 billion in 2018 without a commensurate improvement in outcomes. When we took office in 2016, per capita health expenditures in Manitoba were the fourth highest expenditure level amongst the provinces. At the same time, our wait times were consistently among the longest in Canada.
We have turned to evidence in our review of Manitoba’s overall healthcare system. We have discovered that the current governance model is overly complex for a province of our size, and Manitobans are not receiving an optimal level of care. In addition, accountability for results is fractured and inadequate across the system.
2017/18 was a pivotal year for health care in Manitoba. A new Transformation Management Office is overseeing reforms to reduce costs and improve services. At the same time, we have introduced new accountability within the system to better measure outcomes and put service delivery on a more sustainable path. Even the little changes are important. Our health-related entities will be moving from government not-for-profit accounting standards to Canadian Public Sector Accounting Standards in an effort to standardize reporting, and ensure the timely verification and compilation of information for summary budgeting and reporting. It is hard to believe that for years, our province’s health-related entities did not use the same accounting standards as the Government, impairing their capacity for effective information sharing and coordination.
Cost Drivers – Legalization of CannabisThe current path toward legalization of cannabis has been rushed, and we have repeatedly expressed our concern that it is more important to get it right than to meet an arbitrary deadline.
We are focused on public safety, including elimination of the black market. If cannabis is not priced competitively, it will not gain market share and the black market will continue to thrive, which is bad for Manitobans and particularly bad for our children. Not knowing the expected tax revenue, or associated costs of cannabis, means that we are not building our budget on a hope of revenue that we cannot predict, because hope is not a plan.
What we know for certain, and all provinces agree, is that the province will bear the majority of the costs of legalizing cannabis, including healthcare, education, road safety, justice and more, and that we expect these increased costs to outweigh any revenue gains.
1 8 / B U D G E T 2 0 1 8
Focus on OutcomesIn the past, funding was provided to many of our most critical partners with limited or no reporting on outcomes – failure was not addressed and success was not rewarded.
We have talked about “bending the cost curve”, but this is about transforming our culture and rethinking how we do things. Focusing on outcomes is the only way to drive costs out of the system while preventing adverse impacts on the services Manitobans expect and deserve. Examples of our new approach to spending include:
• a new value for money assessment tool to guide our investments in cultural capital, including the Assiniboine Park Conservancy, Winnipeg Art Gallery, and Royal Aviation Museum of Western Canada;
• block funding arrangements to reduce red tape and allow agencies to deliver the right services to the right people in the right way without relying on complex funding formulas or unintended incentives to drive costs and limit innovation. We have already introduced block funding for municipalities and some family services agencies and are continuing to explore other opportunities in this area;
• a greater focus on competitive procurement processes as well as social impact procurement, including leveraging social enterprises and pay for performance models such as Social Impact Bonds; and
• working toward consolidation of common functions, such as finance and administration.
All of these tools require common approaches to public procurement processes that are transparent, comprehensive and drive value across the public sector. We are engaging support to develop better procurement practices that will harness savings across government in areas that range from information technology, to equipment purchases to maintenance and repair contracts.
We are also continuing to explore alternative service delivery opportunities, not only to improve service, but also to reduce costs. This year, we are reviewing options to improve the cost-effectiveness of aircraft services within government and will be issuing a Request for Proposals to explore better ways to achieve value in this program.
All of these innovative efforts will be carefully monitored for success. We are focusing on outcomes by deploying Balanced Scorecards throughout core government and, in the coming year, will also be reporting publicly on how we are doing – both our successes and where we find a need for improvement or a different approach.
B U D G E T 2 0 1 8 / 1 9
Transforming the Public ServiceIn addition to the economic circumstances we face, rapid advances in technology and changes in Manitobans’ expectations also present significant challenges. To face these complex issues successfully, we must learn from proven good practices and leverage the talent and ideas of public servants, and create space for innovation to grow.
In February of this year, we shared Manitoba’s Transformation Strategy, setting out a bold vision for the future and providing a framework for public servants to take action to transform both their work and their culture. This strategy provides an opportunity to build a modern public service culture that will attract and retain diverse, skilled and innovative employees into the future. Introducing Balanced Scorecards and external reporting of outcomes is a key pillar in this initiative.
We are also advancing our commitment to Open Government. This spring, we will streamline Manitoba’s process for consulting with citizens. We will launch an online portal to centralize and simplify the mechanism through which citizens provide input into government programs and services. With improved information from citizens, the public service will be better equipped to focus its efforts on priorities that will advance outcomes for Manitobans.
Giving Manitobans a Well-Deserved BreakWhen our Government was elected in April 2016, Manitoba’s tax regime was out of line with other provinces: we had one of the lowest basic personal income tax exemptions, the tax treatment for small business income was not competitive, and we were handed the highest sales tax rate in Western Canada.
Soon after taking office, we proudly introduced tax bracket indexation, and are now continuing on our work. Budget 2018 makes significant strides to give Manitoba families and individuals a well-deserved tax break and restore a competitive tax environment.
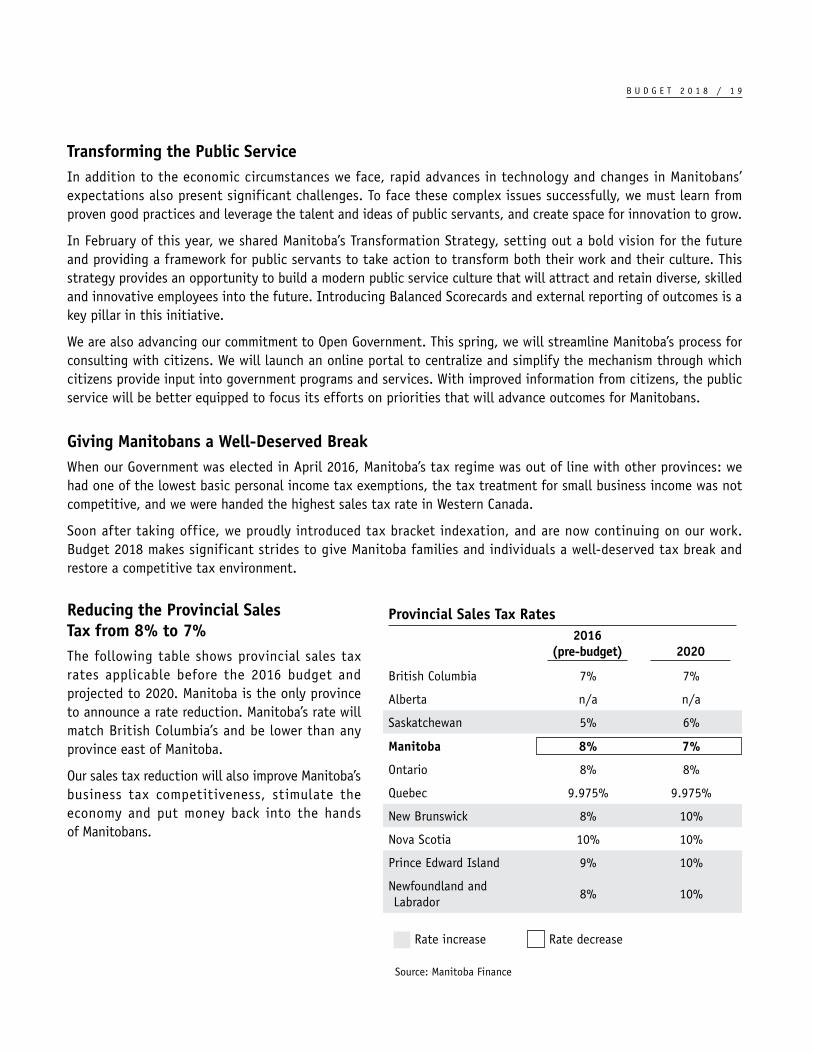
Reducing the Provincial Sales Tax from 8% to 7%The following table shows provincial sales tax rates applicable before the 2016 budget and projected to 2020. Manitoba is the only province to announce a rate reduction. Manitoba’s rate will match British Columbia’s and be lower than any province east of Manitoba.
Our sales tax reduction will also improve Manitoba’s business tax competitiveness, stimulate the economy and put money back into the hands of Manitobans.
Provincial Sales Tax Rates2016
(pre-budget) 2020
British Columbia 7% 7%
Alberta n/a n/a
Saskatchewan 5% 6%
Manitoba 8% 7%
Ontario 8% 8%
Quebec 9.975% 9.975%
New Brunswick 8% 10%
Nova Scotia 10% 10%
Prince Edward Island 9% 10%
Newfoundland and Labrador
8% 10%
Rate increase Rate decrease
Source: Manitoba Finance

2 0 / B U D G E T 2 0 1 8
Increasing the Basic Personal Amount – $2,020 by 2020
Provincial Basic Personal AmountsDollars
Source: Manitoba Finance
Manitoba Provincial Average
0
8,500
9,000
9,500
10,000
10,500
11,000
11,500
2016
9,134
10,014
9,382
10,354 10,39210,551
11,402
10,793
2018 2019 2020
The “basic personal amount” is the amount of income that is exempt from personal income taxes or, put another way, the amount a person can earn before the government starts to tax you. The larger the basic personal amount, the better for all taxpayers. In 2016, Manitoba’s basic personal amount was the only one outside of Atlantic Canada that was below $10,000. We plan to increase Manitoba’s basic personal amount by $1,010 on January 1, 2019 and again by $1,010 on January 1, 2020 – or “$2,020 by 2020”. As a result, Manitoba’s basic personal amount will exceed $11,400 and outpace the provincial average across Canada.
Increasing the basic personal amount will help all taxpayers, but will disproportionately benefit the working poor who will either no
longer pay provincial income tax at all or have a much higher percentage of their income tax-free, keeping hard earned money in the homes of those who need it most. Through this change, we anticipate that by 2020 a total of 31,000 low income earners will no longer need to pay taxes.
Increasing the Small Business Income Threshold to $500,000
Provincial Corporation Income TaxSmall Business Tax on $500,000 in 2016 and 2019
Thousands of Dollars
Source: Manitoba Finance
2016 2019
BC AB SK MB ON QC NB NS PE NL0
5
10
15
20
25
30
35
40
45
We know small businesses are the mainstay of the Manitoba economy. Manitoba recognizes their value by increasing the small business income threshold eligible for Manitoba’s 0% corporation income tax rate, the lowest in Canada. A small business with up to $500,000 taxable income will now be exempt from Manitoba corporate income tax.
Lowering Taxes to the Benefit of all ManitobansThe Manitoban economy is doing very well. At the same time, we see federal tax policies that threaten small businesses and challenge top income earners in Canada, alongside large reductions in US corporate and personal tax rates. Manitobans need a break, and businesses need to remain competitive in the Canadian and Global market place.

B U D G E T 2 0 1 8 / 2 1
REBUILDING THE ECONOMY
Climate and Green PlanThis past October, we released our Made-in-Manitoba Climate and Green Plan that aims to make Manitoba the cleanest, greenest and most climate resilient province in Canada. Our Plan integrates environmental and economic objectives across all of government based on four pillars – climate, jobs, water, and nature.
Our choices were either to agree to the federally-mandated carbon tax dictated and controlled by Ottawa, or to find our own “Made-in-Manitoba” carbon plan. Budget 2018 follows through on our commitment to develop a Made-in-Manitoba approach to reduce our greenhouse gas emissions. All carbon tax revenues received over the next four years will be returned to Manitobans through tax reductions.
Budget 2018 includes the historic establishment of a $102 million Conservation Trust Fund to protect wetlands, grasslands, forests and natural areas by providing matching funds to partnerships with private investors, landowners and community based conservation organizations. We have also formed a “Made-in-Manitoba Climate and Green Fund” that will provide the necessary funds to implement our Made-in-Manitoba Climate and Green Plan, and we look forward to partnering with the federal government on climate change programs.
Economic DevelopmentJobs and economic growth remain at the centre of our plan for a better Manitoba. A stronger economy will allow for improvements in front line services and additional investments in the programs and initiatives most important to Manitoba families while also repairing the state of the province’s finances. Manitobans recognize that better services depend on a stronger economy, and we have taken the first steps on the road to making Manitoba the most improved jurisdiction for investment and job creation.
FUNDING INPUTS
DEPARTMENT AND EXTERNAL PARTNER COLLABORATIVE PROGRAMMING
GREEN FUND SECRETARIAT REVIEW AND RECOMMENDATION
OUTCOME – ECOLOGICAL GOODS AND SERVICES
Made-in-Manitoba Climate and Green Fund
Development and implementation of various environmental innovation
and climate change projects
Federal Low Carbon Economy Fund
Federal money released upon signing the
federal carbon framework
Conservation Trust Fund
A $102 million endowment for an arms-length trust to
support community-based green projects for generations

2 2 / B U D G E T 2 0 1 8
In the past, Manitoba did not have a clearly articulated, evidence-based approach to economic development, but rather, a disjointed collection of mismatched programs that were added, incrementally, over time. Further, programs that were added were not reviewed to determine if they had achieved their intended outcomes.
This past year, we undertook a comprehensive assessment of the state of our economic development efforts. We sat down with our business leaders to gather their views and give us their expert recommendations on how to make Manitoba the most improved province when it comes to attracting business investment.
Our report confirmed the absence of clearly defined goals and objectives, significant areas of mandate overlap amongst our many economic development agencies, and a lack of coordination within government departments.
We are committed to addressing these shortcomings, and have asked senior Manitoban business leaders to direct the next step of designing our overall strategy and reforming the way we attract business investment to our province.
Look NorthAs part of advancing economic development across Manitoba, we see the North as the key to unlocking our economic potential.
The Look North Report and Action Plan for Manitoba’s Northern Economy outlines a path forward to building stronger partnerships and a brighter economic future in the North. The report identifies six priority areas including northern mineral and other resource potential; Indigenous engagement and partnerships; strategic infrastructure investment; housing challenges and opportunities; enterprise eco-system of support; and education, training and workforce development.
A northern steering committee and joint action groups for each of the priority areas have been established to lead and engage stakeholders in the next phase of work to develop more detailed strategies and action plans to help unlock the tremendous economic potential that exists in this region.
At the same time, we have committed to establishing a mineral development protocol with First Nations to create a clear pathway forward and a stable and predictable consultation process that ensures First Nations are involved in all aspects of mineral development and share in the resulting benefits. We will continue our work with First Nations communities to define a mutually agreed process that will advance mineral development projects in Indigenous traditional territories.
The Look North Report highlighted access to broadband as a priority area and one of the most common topics to arise in discussions with northerners. Our government recently announced a $20 million contribution towards a $63-million project to bring high-speed Internet to 72 rural and remote communities in the province, 37 of which are First Nation communities and 18 of which are located in remote regions of northern Manitoba. This announcement is exemplary of how strong partnerships with our federal counterparts and Indigenous organizations can advance shared priorities and modernize and transform the economic future of the region.
Reducing Red TapeAccording to industry estimates, federal, provincial and municipal regulations cost businesses in Manitoba $1.2 billion, of which $360 million is considered unnecessary. Seven out of ten business owners in Manitoba say red tape is limiting their ability to create jobs. Reducing this red tape is an important part of our plan to grow the

B U D G E T 2 0 1 8 / 2 3
economy, and we are committed to becoming Canada’s most improved province by reducing the burden of regulatory requirements that are poorly designed, duplicative, contradictory, anachronistic or overly prescriptive.
The Regulatory Accountability Act that was introduced in June 2017 requires the measurement, tracking and reporting of regulatory requirements found in legislation, regulations, policies, and forms. As part of this process, more than 906,000 regulatory requirements were identified in the baseline count measured as of April 1, 2016.
This new Act introduces a number of innovative mechanisms to promote regulatory accountability and reduce red tape, including the 2-for-1 rule, which will require two regulatory requirements to be removed for every new one introduced.
Business is taking note. Stakeholders have publicly stated that Manitoba’s red tape measure is the best of its kind in North America. During Canada’s 2018 Red Tape Awareness Week, Manitoba received an “A” grade in the Canadian Federation of Independent Business’ (CFIB) 2018 Provincial Red Tape Report Card for significant progress on regulatory accountability and red tape reduction. This ties Manitoba for first with British Columbia and Quebec. By comparison, Manitoba’s last grade under the previous government in 2016 was an “F”, the worst grade amongst provinces.
Manitoba also won the CFIB’s 2018 Golden Scissors Award in recognition of its leadership on red tape reduction through introduction of The Regulatory Accountability Act and The Red Tape Reduction and Government Efficiency Act 2017.
Allowing the Private Sector to FlourishThe underlying economy in Manitoba is strong:
• Total employment increased by 10,500 workers, the largest gain in 15 years;
• Private sector jobs increased by 11,800 workers, the largest gain in 15 years;
• Second highest increase in average weekly earnings among provinces and highest since 2014;
• Labour income growth has improved to 4.7% in 2017, compared to 0.8% in 2016;
• Manufacturing sales increase by 5.3%, best in six years;
• Wholesale merchandise sales increased by 7.4%, best since 2014;
• Motor vehicle sales increased by 10.1%, best in 15 years;
• Truck and SUV sales are up by 15.4%, best in 20 years;
• Exports to the Non-U.S. markets increased by 13.0%, best in six years;
• Manitoba crop farmers report a record volume of harvest (bushels) in 2017; and
• Total farm cash receipts surpassed $6.5 billion in 2017, the highest ever in Manitoba.

2 4 / B U D G E T 2 0 1 8
SECURING OUR FUTURE: IMPROVEMENTS TO THE FISCAL RESPONSIBILITY AND TAXPAYER PROTECTION ACTThe Fiscal Responsibility and Taxpayer Protection Act affirms fiscal discipline and accountability to Manitobans on sustainable financial management. It requires that governments show progress toward a balanced budget that is based on summary results.
Amendments will be introduced to strengthen the Act. The improvements will create greater incentives for difficult – yet essential – work in restoring our finances, and remove disincentives against early progress or the extra achievement beyond $100 million per year. Measuring progress from the 2017/18 budget, the Act will also allow for reinstatement of ministerial salary amounts withheld once a surplus is achieved in future. Finally, to improve transparency, we will now report each minister’s respective withheld salary amounts.
As a result of the tabled Budget 2017, the baseline (which is adjusted for things such as emergencies and Hydro net income) was calculated as follows:
The Fiscal Responsibility and Taxpayer Protection ActBase Line Deficit Results
(Millions of Dollars)
2017/18Budget
Revenue 16,101
Expenditure 17,056
Net Result (955)
Year-end Adjustments/Lapse (115)
Net Income (Loss) (840)
Adjustments:
1) Net Income (Loss) Manitoba Hydro 74
2) Fiscal Stabilization Fund 10
Base Line Deficit (924)
It is upon this baseline that the Government will be held accountable to make steady progress. In fact, results will need to show an improvement of $100 million a year, every year, in order for ministers to realize all of their pay.

B U D G E T 2 0 1 8 / 2 5
THE PATH FORWARDFor a 13 year period prior to 2016/17, core expenditure budgets were consistently over spent. Over that period, total overspending was $1.7 billion excluding the costs of the 2011 flood, or almost $140 million per year on average.
For 2017/18, we are forecasting the second straight year of keeping spending below budgeted levels through careful management and steady execution of our promises, and we accomplished this despite the most significant reduction in individual income tax revenue in a generation and prudently adding a contingency for writedowns. The forecasted 2017/18 year-end results, as adjusted pursuant to the Act, are estimated as set forth below.
The Fiscal Responsibility and Taxpayer Protection ActBase Line Deficit Results
(Millions of Dollars)
2017/18Budget
2017/18Forecast
Increase/(Decrease)
Revenue 16,101 16,128 27
Expenditure 17,056 16,854 (202)
Net Result (955) (726) 229
Year-end Adjustments/Lapse (115) – 115
Net Income (Loss) (840) (726) 114
Adjustments:
1) Net Income (Loss) Manitoba Hydro 74 40 (34)
2) Fiscal Stabilization Fund 10 10 –
Base Line Deficit (924) (776) 148
File: Defecit 18.ai Created: March 7, 2018 Revised: Fixed:
2017/18 2018/19 2019/20 2020/21 2021/22
Summary Budget Deficit Millions of Dollars
Revised Plan Plan in Previous Budget
Source: Manitoba Finance
17/18 18/19 19/20 20/21 21/220
100
200
300
400
500
600
700
800
900 840
726
521
388
280
142
698
549
As we look forward to the next four years, our projections show steady progress on deficit reduction into the future, while at the same time delivering tax relief from the Cabinet table to the kitchen table of Manitobans.
This revised projection dif fers from the projections offered as part of Budget 2017, showing a new and improved “trajectory” to budget reduction. We have also extended our forecast period by a further two years in order to provide further guidance in respect of our longer term plans.

2 6 / B U D G E T 2 0 1 8
Summary Budget(Millions of Dollars)
2017/18Forecast
2018/19Budget
2019/20Projection
2020/21Projection
2021/22Projection
Revenue 16,128 16,787 17,095 17,243 17,593
Expenditure 16,854 17,423 17,598 17,638 17,850
Year-End Adjustments/Lapse – (115) (115) (115) (115)
Net Income (Loss) (726) (521) (388) (280) (142)
Core Government(Millions of Dollars)
2017/18Forecast
2018/19Budget
2019/20Projection
2020/21Projection
2021/22Projection
Revenue 12,945 13,546 13,898 13,989 14,302
Expenditure 13,710 14,170 14,306 14,306 14,478
Year-End Adjustments/Lapse – (35) (35) (35) (35)
Net Result (765) (589) (373) (282) (141)
Fiscal Stabilization Account Transfer (10) (50) (50) (50) (50)
Net Income (Loss) (775) (639) (423) (332) (191)
f - Forecast b - Budget p - Projected
Fiscal Stablization Account
Millions of Dollars
Source: Manitoba Finance
09/10
10/11
11/12
12/13
13/14
14/15
15/16
16/17
17/18(f)
18/19(b)
19/20(p) 21/22(p)
20/21(p)
0
100
200
300
400
500
600
700
800
900
Through transfers to the Fiscal Stabilization Account, we are also steadily replenishing the Province’s savings that were previously drawn down – even when the economy was strong and revenue was growing.

B U D G E T 2 0 1 8 / 2 7
Restoring Credit Rating Debt to GDP Millions of Dollars Millions of Dollars
Source: Manitoba Finance
Debt f - Forecast b - Budget GDP
0
10,000
20,000
30,000
40,000
50,000
60,000
70,000
80,000
08/0909/10
10/1111/12
12/1313/14
14/1515/16
16/17 18/19b17/18f
0
5,000
10,000
15,000
20,000
25,000
30,000Credi t r a t ing agenc ie s downgraded Manitoba last year, citing the past financial mismanagement of the Province’s affairs. In fact, there were three downgrades in a space of three years. Downgrades put the entire sustainability of the province at risk, and can cost us millions of dollars in higher borrowing costs. While the path to restore our credit ratings will need to be over the course of successive responsible budgets (there are no quick fixes), we are bending the curve. By introducing responsible budgets and deliberately executing them, we have worked to arrest this alarming trend.
Looking to Budget 2019We have already commenced work for building Budget 2019. We are starting our budgeting process earlier than ever before, and our efforts will be well underway by the summer. Next year’s budget process will also continue with the ongoing priorities of refining tax credits and reviewing our tax systems.
The Storm Clouds we have seen are real – we will remain on high vigilance. We are seeking ways to reduce volatility in our summary budget – for example by reviewing the past accounting policies taken in respect of entities like Workers Compensation Board, where there may be ways for better budgeting practices across summary government. In the meanwhile, we will continue our work in finding better value for money and more cost effective outcomes, while reducing Manitobans’ excessive tax burden and bringing the summary budget into balance.

2 8 / B U D G E T 2 0 1 8