mansfield university of pennsylvania financial …2016/17 general fund appropriations from the...
TRANSCRIPT

CliftonLarsonAllen LLP
MANSFIELD UNIVERSITY OF PENNSYLVANIA
OF THE STATE SYSTEM OF HIGHER EDUCATION
FINANCIAL STATEMENTS AND SUPPLEMENTARY INFORMATION
YEARS ENDED JUNE 30, 2017 AND 2016

MANSFIELD UNIVERSITY OF PENNSYLVANIA OF THE STATE SYSTEM OF HIGHER EDUCATION
TABLE OF CONTENTS YEARS ENDED JUNE 30, 2017 AND 2016
INDEPENDENT AUDITORS’ REPORT 1
MANAGEMENT’S DISCUSSION AND ANALYSIS 3
FINANCIAL STATEMENTS
BALANCE SHEETS – PRIMARY INSTITUTION 10
STATEMENTS OF REVENUES, EXPENSES, AND CHANGES IN NET POSITION – PRIMARY INSTITUTION 12
STATEMENTS OF CASH FLOWS – PRIMARY INSTITUTION 13
COMBINED STATEMENTS OF FINANCIAL POSITION – COMPONENT UNITS 15
COMBINED STATEMENTS OF ACTIVITIES – COMPONENT UNITS 16
NOTES TO FINANCIAL STATEMENTS 17
REQUIRED SUPPLEMENTARY INFORMATION
SCHEDULES OF FUNDING PROGRESS FOR THE SYSTEM PLAN AND REHP (OPEB) 59
SCHEDULES OF PROPORTIONATE SHARE OF SERS NET PENSION LIABILITY AND CONTRIBUTIONS 60
SCHEDULES OF PROPORTIONATE SHARE OF PSERS NET PENSION LIABILITY AND CONTRIBUTIONS 61

CliftonLarsonAllen LLPCLAconnect.com
(1)
INDEPENDENT AUDITORS’ REPORT
Council of Trustees Mansfield University of Pennsylvania of the State System of Higher Education Mansfield, Pennsylvania Report on the Financial Statements
We have audited the accompanying financial statements of the business-type activities and the aggregate discretely presented component units of Mansfield University of Pennsylvania of the State System of Higher Education (the University), as of and for the years ended June 30, 2017 and 2016, and the related notes to the financial statements, which comprise the University’s basic financial statements as listed in the table of contents. Management’s Responsibility for the Financial Statements
Management is responsible for the preparation and fair presentation of these financial statements in accordance with accounting principles generally accepted in the United States of America; this includes the design, implementation, and maintenance of internal control relevant to the preparation and fair presentation of financial statements that are free from material misstatement, whether due to fraud or error. Auditors’ Responsibility
Our responsibility is to express opinions on these basic financial statements based on our audits. We did not audit the financial statements of the discretely presented component units, Mansfield Auxiliary Corporation (MAC) and College Community Services, Inc. (CCSI), which represent 100% of the assets, net assets, and revenues of the discretely presented component units of the University. Those financial statements were audited by other auditors whose reports thereon have been furnished to us, and our opinion insofar as it relates to the amounts included for MAC and CCSI, is based solely on the reports of the other auditors. We conducted our audits in accordance with auditing standards generally accepted in the United States of America. Those standards require that we plan and perform the audits to obtain reasonable assurance about whether the financial statements are free from material misstatement. An audit involves performing procedures to obtain audit evidence about the amounts and disclosures in the financial statements. The procedures selected depend on the auditors’ judgment, including the assessment of the risks of material misstatement of the financial statements, whether due to fraud or error. In making those risk assessments, the auditor considers internal control relevant to the entity’s preparation and fair presentation of the financial statements in order to design audit procedures that are appropriate in the circumstances, but not for the purpose of expressing an opinion on the effectiveness of the entity’s internal control. Accordingly, we express no such opinion. An audit also includes evaluating the appropriateness of accounting policies used and the reasonableness of significant accounting estimates made by management, as well as evaluating the overall presentation of the financial statements.
(2)
Council of Trustees Mansfield University of Pennsylvania of the State System of Higher Education We believe that the audit evidence we have obtained is sufficient and appropriate to provide a basis for our audit opinions. Opinions
In our opinion, based on our audits and the reports of other auditors, the financial statements referred to above present fairly, in all material respects, the respective financial position of the business-type activities and the aggregate discretely presented component units of the University as of June 30, 2017 and 2016, and the respective changes in financial position and, where applicable, cash flows thereof for the years then ended in conformity with accounting principles generally accepted in the United States of America. Other Matters
Required Supplementary Information Accounting principles generally accepted in the United States of America require that management’s discussion and analysis on pages 3-9 and the Schedules of Funding Progress for the System Plan and REHP (OPEB) on page 59, Schedules of Proportionate Share of SERS/PSERS Net Pension Liability and Contributions on pages 60 and 61 be presented to supplement the basic financial statements. Such information, although not a part of the basic financial statements, is required by the Governmental Accounting Standards Board who considers it to be an essential part of financial reporting for placing the basic financial statements in an appropriate operational, economic, or historical context. We have applied certain limited procedures to the required supplementary information in accordance with auditing standards generally accepted in the United States of America, which consisted of inquires of management about the methods of preparing the information and comparing the information for consistency with management’s responses to our inquiries, the financial statements, and other knowledge we obtained during our audit of the financial statements. We do not express an opinion or provide any assurance on the information because the limited procedures do not provide us with sufficient evidence to express an opinion or provide any assurance.
CliftonLarsonAllen LLP
Plymouth Meeting, Pennsylvania October 31, 2017
(3)
MANSFIELD UNIVERSITY MANAGEMENT’S DISCUSSION AND ANALYSIS
(Unaudited) 6/30/2017
Mansfield University is one of the 14 public universities of the Pennsylvania State System of Higher Education (PASSHE). Mansfield University is a public liberal arts college founded in 1857, and in January 2015 became Pennsylvania’s only member of the Council of Public Liberal Arts Colleges, or COPLAC. The 174 acre campus is located in the beautiful northern tier of Pennsylvania. Although each University is regulated and monitored by PASSHE, the general management is performed independently. Being part of PASSHE enables the University to share resources and benefits from economies of scale. The following is an overview of Mansfield University’s financial activities for the year ending June 30, 2017. FINANCIAL HIGHLIGHTS
Mansfield University experienced a sixth year of decreasing enrollments for the fall 2016 semester, similar to many higher education institutions. The fall 2016 semester headcount of 2,198 represented a decrease of 178 students (7.49%) from fall 2015.
Likewise the FTE Enrollment for fall 2016 decreased to 2,016, a decrease of 174 FTE (7.95%) from fall 2015.
The State System received a 2.5% increase in the 2016/17 General Fund appropriations from the Commonwealth of Pennsylvania. However, the effect on Mansfield University as a result of the funding formula was a decrease of 1.97%. The base appropriations decrease totaled $311,000 and the performance funding decrease totaled $194,542 for fiscal year 2016/17.
The State System’s Board of Governors approved a
tuition increase of 2.5% ($176) for undergraduate resident students for fiscal year 2016/17. Mansfield University Council of Trustees approved a $13 increase in local mandatory student fees. The tuition and mandatory fee increases helped offset the enrollment decrease and resulted in combined tuition and fee revenue (before discounts) of $22,816,883, an increase of $1,408,602 or (6.58%) from fiscal year 2015/16. Additionally, Mansfield University’s Council of Trustees approved an increase of 3% for University housing and an increase of 7.9% for the 19 meal plan with $250 of dining flex spending.
The Board of Governors approved an undergraduate
tuition pilot program that went into effect in 2016/17 in which tuition was charged on a per-credit basis and the rate is frozen for up to eight semesters (fall and spring
only) for each cohort. Per the approved pilot, the frozen rate is applicable over five years, or until the first degree is conferred, whichever occurs first. All 2016/17 incoming undergraduate students formed a cohort and paid tuition at one percent above the System’s 2016/17 per-credit undergraduate tuition rate. Returning 2016/17 undergraduates with less than 90 credits formed a single cohort and paid tuition at one percent above the System’s 2015/16 per-credit undergraduate tuition rate. Returning 2016/17 students with 90 or more credits were given the option either to pay the System’s per-credit rate or participate in Mansfield’s returning student cohort frozen tuition rate. For fall 2017 incoming students, a new cohort will be formed; those students will pay tuition at 1% above the System’s 2017/18 per-credit tuition rate as approved by the Board in July 2017.
The University acquired the ownership of the residence halls previously owned by Mansfield Auxiliary Corporation (MAC) during fiscal year 2016/17 through the participation of PASSHE issued bonds. The total bond related debt for the acquisition of the housing was $79,235,000.
During fiscal year 16/17, the University made scheduled principal payments of $2,059,500, resulting in total bond debt outstanding of $88,609,345 at June 30, 2017 as compared to $11,433,845 at June 30, 2016.
This bond debt is allocated to:
E&G $ 6,119,402 Residence Life $ 82,084,626 Student Union $ 405,317
Mansfield University purchased $77,829,591 in capital assets in fiscal year 2016/17, of which $74,675,997 was spent on buildings and improvements to buildings and grounds, $3,128,478 for equipment and furnishings, and $25,116 for library books.
(4)
THE FINANCIAL STATEMENTS
Balance Sheet
This statement reports the balances of the assets, deferred outflows, liabilities, deferred inflows, and net position of Mansfield University as of the end of the fiscal year. (The term “net position” was formerly referred as “net assets”) Assets include cash; investments reported at market value; the value of outstanding receivables due from students and other parties; and land, buildings, and equipment reported at cost, less accumulated depreciation. Deferred outflows are the consumption of net assets applicable to a future reporting period; such as the unamortized loss on refunding of debt. Liabilities include payments due to vendors and students; the balance of bonds payable; and liabilities such as workers’ compensation (PASSHE is self-insured), compensated absences (the value of sick and annual leave earned by employees), and postretirement benefits (health and tuition benefits expected to be paid to certain current and future retirees). Deferred inflows are acquisitions of net assets applicable to a future reporting period; such as the unamortized gain on refunding of debt. Net position is measured as the difference between (a) assets and deferred outflows of resources and (b) liabilities and deferred inflows of resources. Statement of Revenues, Expenses, and Changes in Net Position
This statement reports the revenues earned and the expenses incurred in the fiscal year. The result is reported as an increase or decrease in net position. In accordance with GASB requirements, Mansfield University has classified revenues and expenses as either operating or nonoperating. GASB has determined that all public colleges’ and universities’ state appropriations are nonoperating revenues. In addition, GASB requires Pell Grants, classification of gifts, investment income and expenses, and gains/losses on disposals of assets as nonoperating; Mansfield University classifies all of its remaining activities as operating. Statement of Cash Flows
This statement’s primary purpose is to provide relevant information about the cash receipts and cash payments of Mansfield University. It may be used to determine the University’s ability to generate
future net cash flows and meet its obligations as they come due, and its need for external financing.
NET POSITION
Net position decreased by $14,264,361 in fiscal year 2016/17, as compared to a decrease of $7,194,382 in fiscal year 2015/16. The loss on acquisition of the student housing accounted for $9,762,020 of the net position decrease. Other items impacting net position decrease resulted from: 1) the additional interest expense related to the housing debt purchase and 2) postretirement GASB 68 pension liability requirements.

(5)
Following is a summary of the balance sheet at June 30, 2017 and June 30, 2016.
June 30, 2017 June 30, 2016
Cash and cash equivalents $ 18,894,117 $16,662,782
Capital assets, net 101,518,982 29,434,330
Other assets 4,827,063 6,244,005
Deferred Outflows of Resources 5,092,498 4,289,197
Total Assets and Deferred Outflows of Resources $130,332,660 $56,630,314
Postretirement benefits liability $43,486,048 $41,807,591
Defined benefit pension liability 22,675,556 22,117,525
Compensated absences liability 3,199,533 3,157,728
Due to State System, AFRP 782,313 972,680
Bonds payable 88,609,345 11,433,844
Other liabilities 16,757,689 8,389,255
Deferred Inflows of Resources 1,061,455 726,609 Total Liabilities and Deferred Inflows of Resources 176,571,939 88,605,232
Net investment in capital assets 3,704,377 16,301,893
Restricted 3,053,694 2,930,082
Unrestricted (52,997,350) (51,206,893)
Total net position (46,239,279) (31,974,918)
Total liabilities, Deferred Inflows and net position $130,332,660 $56,630,314
Net investment in capital assets is the cost of land, buildings, improvements, equipment, furnishings, and library books, net of accumulated depreciation, less any associated debt (bonds payable). This balance is not available for Mansfield University’s use in ongoing operations, since the underlying assets would have to be sold in order to use the balance to pay current or long-term obligations.
Restricted net position represents the balances of funds received from the Commonwealth, donors, or grantors who have placed restrictions on the purpose for which the funds must be spent. Nonexpendable restricted net position represents corpuses of endowments and similar arrangements in which only the associated investment income can be spent. Expendable restricted net position is available for expenditure as long as any external purpose and time restrictions are met.
Unrestricted net position includes funds that the Board of Governors has designated for specific purposes, auxiliary funds, and all other funds not appropriately classified as restricted or invested in capital assets. Unrestricted net position reflects two unfunded liabilities:
o The liability for postretirement benefits for
employees who participate in the PASSHE plan increased $1,678,457, to $43,486,048 for the year ending June 30, 2017. Because this liability is expected to be realized gradually over time and because of its size, the PASSHE universities fund it only as it becomes due. Actual annuitant pay-as-you-go cost for 2016/17 was $2,082,836.
o The liability for compensated absences
increased by $41,805 to a total of $3,199,533 for the year ending June 30, 2017. Similar to the postretirement benefits

(6)
liability, cash payouts to employees upon termination or retirement for annual and sick leave balances are expected to be realized gradually over time. PASSHE universities are discouraged from funding this liability in its entirety as it would unnecessarily reduce available and already limited resources. Actual leave payouts for 2016/17 totaled $439,277 an increase of $37,988 over the prior year.
REVENUES AND EXPENSES
In addition to the changes to the appropriation and tuition revenue discussed in the Financial Highlights section of this analysis the following are the more significant revenue and expense items: Financial aid to students in the form of waivers,
grants, and scholarships was $8,682,829, an increase of $669,452 from the previous year. The aid was disbursed as follows:
Federal Pell Grants $ 4,116,927 Other Federal Aid $ 121,670 State Aid (including PHEAA) $ 2,132,264 Local grants/scholarships $ 12,992 Endowments & Restricted Aid $ 405,988 E&G Scholarships $ 203,892 Auxiliary Scholarships $ 160,400 Tuition and Fee Waivers $ 1,518,700 Housing and Dining Waivers $ 9,996
Financial aid is shown both as a reduction of student tuition and fee revenues and student aid expense.
Investment income (before investment expenses)
for fiscal year 2016/17 was $349,610, an increase of $93,011 from the prior year. The investment rate for June 2017 was 1.49% compared to the June 2016 rate of 1.24%
Salaries and benefits totaled $38,939,039. Salaries decreased by $1,073,084 and benefits decreased $919,086 for an overall decrease of $1,992,170 or 4.87% over fiscal year 2015/16. Benefits as a percentage of salaries are 58.51%.
Mansfield University’s employer health & welfare
and hospitalization benefit costs for 2016/17 totaled $3,856,476, a decrease of $512,760 or 11.74% less than the prior year.
Employer annuitant health care costs for Mansfield University (including the actuarial postretirement liability accrual) totaled $3,761,293 for 2016/17, a decrease of $793,001 or 17.41% from fiscal year 2015/16. However, the annual required contribution of $2,082,836 toward annuitant health care expense was $395,072 or 15.94% less than the prior year. Annuitant health care was 35.07% of the total 2016/17 pay-as-you-go health care costs for the University.
Fall 2016 permanent salaried complement
totaled 320, compared to 343 for fall 2015 and 353 for fall 2014.
PASSHE salaries for employee members of the
American Federation of State, County, and Municipal Employees (AFSCME) provided for a general pay increase of 2.75% effective October 2016, 2% July 2017, and 2.5% July 2018. It also includes longevity increases in January 2018 and 2019. The AFSCME contract will expire June 30, 2019. The PASSHE contract with the State College and University Professional Association (SCUPA) union will expire June 30, 2019. The SCUPA contract provided for a general pay increase effective October 2016 of 2.75%, 1.75% in July 2017, and 2.25% in July 2018, dependent on their pay level, or a one-time cash payment. Additionally, qualified SCUPA employees are eligible for a step service increment in spring semester 2018 and spring semester 2019, or a one-time cash payment of 2.5%. The Security Police and Fire Professionals of America (SPFPA) contract expired August 31, 2017. In December 2016, the PASSHE Board of Governors approved a “wage reopener” for these union members which provided them with a 3.5% pay increase retroactive to October 1, 2016. The SPFPA members continue to work under the terms of the expired agreement while negotiations continue. In December 2016, the Board of Governors approved a new collective bargaining agreement with the Association of Pennsylvania State College and University Faculties (APSCUF), which represents all faculty and coaches. The new agreement with the faculty will expire June 30, 2018, while the agreement with the coaches will

(7)
expire June 30, 2019. Under the new agreement, faculty received a salary increase of either 2.5% or 5% retroactive to January 2016 or a one-time cash payment equivalent to 2.5% of their annual salary, dependent on their pay level. Additionally, all faculty received an additional 2.75% increase retroactive to August 2016, followed by another 2% increase at the start of the fall 2017 semester. Per the terms of the agreement, Coaches received a 3% salary increase retroactive to the start of the fall 2016 semester and full-time coaches received lump sum payments of $1,500, while part-time coaches received $750. Coaches will receive pay increases of 2.75% in January 2018 and 2.5% in January 2019 and are eligible for additional merit increases of up to 2.5% in both July 2017 and July 2018. Included in the
agreements for faculty and coaches, were revisions to healthcare plans that were designed to produce cost savings similar to those covering other State System employees. Lastly, a two-year merit pool for employees not represented by a union was approved by the PASSHE Board of Governors in December 2016. In January 2017, eligible nonrepresented employees received a 2.75% merit-based increase. In January 2018, eligible nonrepresented employees will be eligible for a 4.25% merit-based increase. The amount of the merit-based increase each employee receives is determined based on his or her prior year’s performance evaluation.

(8)
Following is a summary of revenues and expenses for the years ended June 30, 2017 and 2016:
% of Total June 30, 2017
% of Total June 30, 2016
Operating revenues Tuition and fees, net of discounts & allowances 27.24% 15,265,383 28.75% 14,701,779
Grants and contracts 6.76% 3,785,697 7.06% 3,608,485
Auxiliary enterprises, net 23.54% 13,186,025 16.44% 8,403,540
Other 2.38% 1,333,930 1.78% 911,672
Total operating revenues 59.92% $33,571,035 54.03% $27,625,476
Other revenues
State appropriations 30.30% 16,977,663 34.94% 17,860,857
Investment income, net 0.66% 371,934 0.51% 258,655
Pell 7.35% 4,116,927 8.22% 4,199,717
Gifts, grants, and other 1.77% 992,496 2.30% 1,177,023
Total other revenues 40.08% $22,459,020 45.97% $23,496,252
Total revenues 100.00% $56,030,055 100.00% $51,121,728
% of Total June 30, 2017
% of Total June 30, 2016
Operating expenses
Instruction 26.48% 18,611,260 31.88% 18,590,941
Research 0.00% 0 0.00% 0
Public service 0.38% 264,959 0.37% 213,493
Academic support 5.63% 3,957,068 7.47% 4,357,775
Student services 10.03% 7,053,597 12.40% 7,228,061
Institutional support 9.26% 6,508,712 15.46% 9,014,909
Operations/Maintenance of Plant 6.06% 4,263,815 7.70% 4,491,804
Depreciation 8.17% 5,744,939 6.13% 3,574,414
Student aid 2.13% 1,498,272 2.38% 1,390,378
Auxiliary enterprises 14.22% 9,998,292 15.64% 9,121,498
Total operating expenses 82.36% $57,900,914 99.43% $57,983,273
Other expenses
Interest expense on capital asset-related debt 3.75% 2,632,982 0.56% 327,044
(Gain) Loss on disposal of assets 0.01% (1,500) 0.01% 5,793
(Gain) Loss on acquisition of assets 13.89% 9,762,020 0.00% 0
Total other expenses 17.64% $12,393,502 0.57% $332,837
Total expenses 100.00% $70,294,416 100.00% $58,316,110
Increase/(Decrease) in Net Assets ($14,264,361) ($7,194,382)

(9)
FUTURE ECONOMIC FACTORS After experiencing significant cash flow declines
over the last few years, the University’s combined E&G and Auxiliary cash and investments stabilized in 2016/2017. In fiscal year 2016/17, E&G balances increased by $0.5 million over fiscal year 2015/16 and Auxiliary balances increased by $1.4 million over fiscal year 2015/16. The cash flow increases in fiscal year 2016/17 can be attributed to efforts to reduce personnel and other operating costs, as well as instituting a per-credit tuition program. However, the University continues to face fiscal challenges as a result of continuing enrollment declines. The fall 2017 FTE enrollment of 1725 is 291 fewer (-14.4%) than fall 2016. Contributing factors include regional demographics, public perception regarding the long-term viability of the University and student financial aid gap. Negotiated salary and benefit increases will also impact the fiscal 2017/18 outlook.
Undergraduate tuition moved to a new pilot program in fall 2016. Under this program tuition is charged on a per-credit basis and the tuition rate is frozen for up to eight semesters. The per-credit rate will continue for the 2017/2018 academic year as the University continues to assess the pilot program.
Changes to the state allocation formula in
2014/15 resulted in a decreased allocation for Mansfield University. As a result of these changes, the University received transition funds over a three year period to help offset the loss in appropriation. FY 2016/2017 was the final year Mansfield University received the PASSHE approved Transition Assistance Funds; the total loss of funding of $885,428 will be reflected in 2017/2018.
The University continues to improve efficiency of our administrative operations and has entered into a partnership with Bloomsburg University to consolidate support for Payroll and Human Resources functions. In an effort to continue to align revenue and expenses, the University reduced department operating budgets by 50% in 2017/2018 and continues to evaluate and realign programs and resources to maintain quality academic programs and fiscal sustainability.
The University was awarded $4.5 Million from Commonwealth capital project funds for
renovation/remodel of several University buildings. The University will select an architectural/engineering firm in fall 2017 with a projected completion in early 2020.
In an effort to expand our outreach in
international recruitment, the University recently partnered with Keystone Academic Solutions. The partnership has generated a significant increase in inquiries from international students; impact on enrollment will be reflected in the 18/19 academic year.
The University acquired the ownership of the residence halls previously owned by Mansfield Auxiliary Corporation (MAC) during fiscal year 2016/17. After a careful analysis, Mansfield’s Council of Trustees approved the freezing of room rates for current and incoming students; this practice will continue for the 2017/2018 academic year as the University continues to assess the fee structure of the University.
During fiscal year 2016/17 PASSHE underwent a
strategic review by the National Center for Higher Education Management Systems (NCHEMS). The final recommendations report was delivered to the Board of Governors in July 2017. The strategic review process involved more than 120 meetings across the state and included sessions held on each of the PASSHE University campuses with students, faculty, staff, alumni, business and community leaders, and elected officials. The final recommendations highlighted the State System’s mission to serve students and communities in every region within the Commonwealth with high-quality, affordable postsecondary opportunities for working-class families. It also emphasized the need to adopt a strategic financing model that fits the varied circumstances of the universities and incentivizes collaboration over competition.
Review of the University’s mission and vision will be
a priority in 2017/2018. Developing a clear vision and mission statement is crucial to the success of the University as we move forward and will provide a basis for assessment of the University Strategic Plan.

MANSFIELD UNIVERSITY OF PENNSYLVANIA OF THE STATE SYSTEM OF HIGHER EDUCATION
BALANCE SHEETS – PRIMARY INSTITUTION JUNE 30, 2017 AND 2016
See accompanying Notes to Financial Statements. (10)
2017 2016
ASSETS AND DEFERRED OUTFLOWS OF RESOURCES
CURRENT ASSETSCash and Cash Equivalents 18,894,117$ 16,662,782$ Accounts Receivable:
Governmental Grants and Contracts 167,924 110,947 Students, Net of Allowance for Doubtful Accounts of Accounts of $880,847 in 2017 and $626,921 in 2016 1,211,821 1,246,674 Gifts and Other 63,162 546,398
Interest Income Receivable 49,098 34,650 Inventories 80,933 76,729 Prepaid Expenses and Other Current Assets 350,721 259,292 Due from Component Unit - 1,113,515 Loans Receivable 326,940 328,306
Total Current Assets 21,144,716 20,379,293
NONCURRENT ASSETSInvestments 993,247 930,144 Loans Receivable, Net 1,572,483 1,554,467 Capital Assets, Net 101,518,982 29,434,330 Other Assets 10,734 42,883
Total Noncurrent Assets 104,095,446 31,961,824
Total Assets 125,240,162 52,341,117
DEFERRED OUTFLOWS OF RESOURCESDeferred Loss on Refunding 28,248 35,221Pension Related 5,064,250 4,253,976
Total Deferred Outflows of Resources 5,092,498 4,289,197
Total Assets and Deferred Outflows of Resources 130,332,660$ 56,630,314$

MANSFIELD UNIVERSITY OF PENNSYLVANIA OF THE STATE SYSTEM OF HIGHER EDUCATION
BALANCE SHEETS – PRIMARY INSTITUTION (CONTINUED) JUNE 30, 2017 AND 2016
See accompanying Notes to Financial Statements. (11)
2017 2016
LIABILITIES, DEFERRED INFLOWS OF RESOURCES, AND NET POSITION
CURRENT LIABILITIESAccounts Payable and Accrued Expenses 4,551,696$ 4,301,308$ Unearned Revenue 742,893 644,803 Students' Deposits 32,165 58,477 Workers' Compensation 126,656 104,375 Compensated Absences 266,507 372,355 Current Portion of Bonds Payable 3,609,752 1,503,934 Due to Component Units - 218,847 Due to System, Academic Facilities Renovation Bond Program (AFRP) 186,204 190,367 Other Current Liabilities 473,805 621,319
Total Current Liabilities 9,989,678 8,015,785
NONCURRENT LIABILITIESWorkers' Compensation 111,286 86,464 Compensated Absences 2,933,026 2,785,373 Postretirement Benefit Obligations 43,486,048 41,807,591Net Pension Liability 22,675,556 22,117,525 Bonds Payable 94,137,877 10,697,283 Due to System, AFRP 596,109 782,313 Unearned Revenue 52,641 59,731 Other Noncurrent Liabilities 1,528,263 1,526,558
Total Noncurrent Liabilities 165,520,806 79,862,838
Total Liabilities 175,510,484 87,878,623
DEFERRED INFLOWS OF RESOURCESDeferred Gain on Refunding 21,897 25,418Pension Related 1,039,558 701,191
Total Deferred Inflows of Resources 1,061,455 726,609
Total Liabilities and Deferred Inflows of Resources 176,571,939 88,605,232
NET POSITIONNet Investment in Capital Assets 3,704,377 16,301,893 Restricted for:
Nonexpendable:Scholarships and Fellowships 539,452 524,900 Other 397,227 392,811
Expendable:Scholarships and Fellowships 472,921 398,322 Capital Projects 1,320,054 1,038,212 Other 324,040 575,837
Unrestricted Net Position (52,997,350) (51,206,893) Total Net Position (46,239,279) (31,974,918) Total Liabilities, Deferred Inflows of Resources, and Net Position 130,332,660$ 56,630,314$

MANSFIELD UNIVERSITY OF PENNSYLVANIA OF THE STATE SYSTEM OF HIGHER EDUCATION STATEMENTS OF REVENUES, EXPENSES, AND
CHANGES IN NET POSITION – PRIMARY INSTITUTION YEARS ENDED JUNE 30, 2017 AND 2016
See accompanying Notes to Financial Statements. (12)
2017 2016
OPERATING REVENUESTuition and Fees 22,816,883$ 21,408,281$ Less: Scholarship Discounts and Allowances 7,551,500 6,706,502
Net Tuition and Fees 15,265,383 14,701,779 Governmental Grants and Contracts:
Federal 509,202 514,867 State 3,158,689 2,948,953 Local 42,557 130,765
Nongovernmental Grants and Contracts 75,249 13,900 Sales and Services of Educational Departments 548,354 491,200 Auxiliary Enterprises 13,186,025 8,403,540 Other Revenues 785,576 420,472
Total Operating Revenues 33,571,035 27,625,476
OPERATING EXPENSESInstruction 18,611,260 18,590,941 Public Service 264,959 213,493 Academic Support 3,957,068 4,357,775 Student Services 7,053,597 7,228,061 Institutional Support 6,508,712 9,014,909 Operations and Maintenance of Plant 4,263,815 4,491,805 Depreciation 5,744,939 3,574,414 Student Aid 1,498,272 1,390,378 Auxiliary Enterprises 9,998,292 9,121,497
Total Operating Expenses 57,900,914 57,983,273
NET OPERATING LOSS (24,329,879) (30,357,797)
NONOPERATING REVENUES (EXPENSES)State Appropriations, General and Restricted 16,322,594 16,828,136 Commonwealth on-behalf contributions to PSERS 182,103 129,900 Pell Grants 4,116,927 4,199,717 Investment Income, Net of Related Investment Expense of $4,291 in 2017 and $3,636 in 2016 345,319 252,963 Unrealized Gain on Investments 26,615 5,692 Gifts and Contributions for Other than Capital Purposes 730,644 955,617 Interest Expense on Capital Asset-Related Debt (2,632,982) (327,044) Gain (Loss) on Disposal of Assets 1,500 (5,793) Loss on Acquisition of Assets (9,762,020) - Other Nonoperating Revenue 30,896 31,844
Nonoperating Revenues, Net 9,361,596 22,071,032
LOSS BEFORE OTHER REVENUES (14,968,283) (8,286,765)
OTHER REVENUESState Appropriations, Capital 655,069 1,032,721 Capital Gifts and Grants 28,331 34,248 Additional Permanent Endowments 20,522 25,414
Total Other Revenues 703,922 1,092,383
DECREASE IN NET POSITION (14,264,361) (7,194,382)
Net Position - Beginning of Year (31,974,918) (24,780,536)
NET POSITION - END OF YEAR (46,239,279)$ (31,974,918)$

MANSFIELD UNIVERSITY OF PENNSYLVANIA OF THE STATE SYSTEM OF HIGHER EDUCATION
STATEMENTS OF CASH FLOWS – PRIMARY INSTITUTION YEARS ENDED JUNE 30, 2017 AND 2016
See accompanying Notes to Financial Statements. (13)
2017 2016
CASH FLOWS FROM OPERATING ACTIVITIESNet Tuition and Fees 15,610,877$ 14,845,908$ Grants and Contracts 3,728,720 3,618,450 Payments to Suppliers for Goods and Services (12,558,143) (13,316,734) Payments to Employees (36,750,018) (38,791,164) Loans Issued to Students (292,345) (316,520) Loans Collected from Students 275,695 262,048 Student Aid (1,528,263) (1,413,873) Auxiliary Enterprise Charges 13,399,364 8,461,753 Sales and Services of Educational Departments 542,157 481,154 Other Receipts, Net 1,919,946 917,012
Net Cash Used by Operating Activities (15,652,010) (25,251,966)
CASH FLOWS FROM NONCAPITAL FINANCING ACTIVITIESState Appropriations 16,322,594 16,828,136 Gifts and Nonoperating Grants for Other than Capital Purposes 5,419,542 4,937,953 PLUS, Stafford, and Other Loans Receipts (Non-Perkins) 22,286,236 21,952,608 PLUS, Stafford, and Other Loans Disbursements (Non-Perkins) (22,286,236) (21,952,608) Agency Transactions, Net (135,030) (95,124) Other 30,894 31,844
Net Cash Provided by Noncapital Financing Activities 21,638,000 21,702,809
CASH FLOWS FROM CAPITAL FINANCING ACTIVITIESProceeds from Capital Debt and Leases 1,360,716 - Capital Appropriations 655,069 1,032,721 Capital Grants and Gifts Received 28,331 34,248 Proceeds from Sales of Capital Assets 1,500 2,700 Purchases of Capital Assets (745,983) (1,293,288) Principal Paid on Capital Debt and Leases (2,249,867) (1,922,781) Interest Paid on Capital Debt and Leases (3,098,804) (535,148)
Net Cash Used by Capital Financing Activities (4,049,038) (2,681,548)
CASH FLOWS FROM INVESTING ACTIVITIESProceeds from Sales and Maturities of Investments 28,296 44,645 Interest on Investments, Net of Fees 330,871 251,310 Purchases of Investments (64,784) (155,547)
Net Cash Provided by Investing Activities 294,383 140,408
NET INCREASE IN CASH AND CASH EQUIVALENTS 2,231,335 (6,090,297)
Cash and Cash Equivalents - Beginning of Year 16,662,782 22,753,079
CASH AND CASH EQUIVALENTS - END OF YEAR 18,894,117$ 16,662,782$

MANSFIELD UNIVERSITY OF PENNSYLVANIA OF THE STATE SYSTEM OF HIGHER EDUCATION
STATEMENTS OF CASH FLOWS – PRIMARY INSTITUTION (CONTINUED) YEARS ENDED JUNE 30, 2017 AND 2016
See accompanying Notes to Financial Statements. (14)
2017 2016
RECONCILIATION OF OPERATING LOSS TO NET CASH USED BY OPERATING ACTIVITIES
Net Operating Loss (24,329,879)$ (30,357,797)$ Adjustments to Reconcile Net Operating Loss to Net Cash Used by Operating Activities:
Depreciation Expense 5,744,939 3,574,414 Expenses Paid by Commonwealth or Donor (570,887) (760,791) Effect of Net Changes in Assets and Liabilities:
Receivables, Net 551,983 244,951 Inventories (4,204) (2,951) Other Assets 1,166,105 260,554 Accounts Payable 119,231 (229,261) Unearned Revenue 89,800 (69,042) Student Deposits (26,312) (5,700) Compensated Absences 41,805 (163,732) Loans to Students and Employees (16,650) (54,472) Postretirement Benefits Liability (OPEB) 1,678,457 2,076,386 Defined Benefit Pensions 558,031 2,409,919 Other Liabilities (182,521) 189,156 Deferred Outflows of Resources Related to Pensions (810,276) (2,738,391) Deferred Inflows of Resources Related to Pensions 338,368 374,791
Net Cash Used by Operating Activities (15,652,010)$ (25,251,966)$
SUPPLEMENTAL DISCLOSURE OF NONCASH ITEMSDonated Capital Assets -$ 473,985$ Commonwealth On-behalf Contributions to PSERS 182,103$ 129,900$ Capital Assets Acquired by Debt Assumption 77,083,607$ -$ Debt Assumed to Acquire Capital Assets 86,845,628$ -$

MANSFIELD UNIVERSITY OF PENNSYLVANIA OF THE STATE SYSTEM OF HIGHER EDUCATION
COMBINED STATEMENTS OF FINANCIAL POSITION – COMPONENT UNITS JUNE 30, 2017 AND 2016
See accompanying Notes to Financial Statements. (15)
2017 2016
ASSETS
CURRENT ASSETSCash and Cash Equivalents 1,273,852$ 8,928,959$ Accounts Receivable 5,186 2,619 Due from University - 218,847 Investments 2,050,618 - Inventories 580,442 605,983
Total Current Assets 3,910,098 9,756,408 NONCURRENT ASSETS
Capital Assets, Net 45,086 77,172,248 Other Assets 4,206 2,204,514
Total Noncurrent Assets 49,292 79,376,762
Total Assets 3,959,390$ 89,133,170$
LIABILITIES AND NET ASSETS
CURRENT LIABILITIESAccounts Payable and Accrued Expenses 159,766$ 1,170,256$ Funds Held in Trust - 256,386 Other Liabilities 251,240 220,000 Due to University - 1,113,515
Total Current Liabilities 411,006 2,760,157
NONCURRENT LIABILITIESLong-Term Debt 7,988 89,407,809
Total Liabilities 418,994 92,167,966
NET ASSETS (DEFICIT)Unrestricted 3,540,396 (3,034,796)
Total Net Assets (Deficit) 3,540,396 (3,034,796)
Total Liabilities and Net Assets (Deficit) 3,959,390$ 89,133,170$

MANSFIELD UNIVERSITY OF PENNSYLVANIA OF THE STATE SYSTEM OF HIGHER EDUCATION
COMBINED STATEMENTS OF ACTIVITIES – COMPONENT UNITS YEARS ENDED JUNE 30, 2017 AND 2016
See accompanying Notes to Financial Statements. (16)
2017 2016
CHANGES IN UNRESTRICTED NET ASSETSREVENUES AND OTHER ADDITIONS
Student Activity Fees 1,675,357$ 1,800,469$ Rental Income 784,926 8,942,129 University Store and Services 667,914 776,001 Investment Income 17,650 6,876 Other Revenues 10,796,058 42,842 Realized and Unrealized Gains on Investments, Net 45,002 140,950
Total Revenues and Other Additions 13,986,907 11,709,267
EXPENSES AND OTHER DEDUCTIONS Housing 4,958,237 10,197,098 Student Activities and Programs 1,590,336 1,652,809 University Stores 723,010 820,605 Management and General 138,132 147,671 Other University Support 2,000 368,000
Total Expenses and Other Deductions 7,411,715 13,186,183
CHANGE IN NET ASSETS 6,575,192 (1,476,916)
Net Deficit - Beginning of Year (3,034,796) (1,557,880)
NET ASSETS (DEFICIT) - END OF YEAR 3,540,396$ (3,034,796)$
MANSFIELD UNIVERSITY OF PENNSYLVANIA OF THE STATE SYSTEM OF HIGHER EDUCATION
NOTES TO FINANCIAL STATEMENTS JUNE 30, 2017 AND 2016
(17)
NOTE 1 NATURE OF OPERATIONS AND SUMMARY OF SIGNIFICANT ACCOUNTING POLICIES
Organization
Mansfield University of Pennsylvania of the State System of Higher Education (the University), a public four year institution located in Mansfield, Pennsylvania, was founded in 1857. The University is one of fourteen universities of Pennsylvania’s State System of Higher Education (State System). The State System was created by the State System of Higher Education Act of November 12, 1982, P.L. 660, No. 188, as amended (Act 188). The State System is a component unit of the Commonwealth of Pennsylvania (the Commonwealth). The Commonwealth determines the State appropriation allocated to the State System. The State System determines the allocation to each University from the state appropriated amount. Tuition rates are set by the Board of Governors of the State System, for all fourteen member universities. Labor agreements are negotiated at either the State System level or Commonwealth level. Reporting Entity
The University functions as a business-type activity, as defined by the Governmental Accounting Standards Board (GASB). College Community Services, Inc. (CCSI), and Mansfield Auxiliary Corporation (MAC) are included in the University’s financial statements as discretely presented component units. A component unit is a legally separate organization for which the primary institution is financially accountable or closely related. MAC and CCSI are private nonprofit organizations reported in accordance with Financial Accounting Standards Board (FASB) requirements, including FASB Codification Section 958-205, Presentation of Financial Statements. As such, certain revenue recognition criteria and presentation features are different from GASB revenue recognition criteria and presentation features. No modifications have been made to the component units financial information in the University’s financial reporting entity for these differences. Complete financial statements for the CCSI and MAC may be obtained at the University Controller’s Office. CCSI is a legally separate tax-exempt entity that provides bookstore services to students and accounting services for student activity organizations including the Student Government Association. Because the economic resources received and held by CCSI are for the direct benefit of the University and the influence of the University over CCSI, CCSI is considered a component unit of the University and is included within the University’s financial reporting entity. The financial activity of CCSI is presented as of and for the years ended May 31, 2017 and 2016.

MANSFIELD UNIVERSITY OF PENNSYLVANIA OF THE STATE SYSTEM OF HIGHER EDUCATION
NOTES TO FINANCIAL STATEMENTS JUNE 30, 2017 AND 2016
(18)
NOTE 1 NATURE OF OPERATIONS AND SUMMARY OF SIGNIFICANT ACCOUNTING POLICIES
(CONTINUED)
Reporting Entity (Continued)
During the years ended June 30, 2017 and 2016, CCSI paid either directly to the University or on behalf of the University, scholarships, salaries and other administrative expenses, and capital additions totaling $588,459 and $684,453, respectively. These expenditures to or on behalf of the University were for both restricted and unrestricted purposes. MAC is a legally separate tax-exempt entity that provides construction, operation, and management of student housing facilities or other projects for the benefit of the students of the University. Because the economic resources received and held by MAC are for the direct benefit of the University, MAC is considered a component unit of the University and is included within the University’s financial reporting entity. The financial activity of MAC is presented as of and for the years ended June 30, 2017 and 2016. The University and MAC entered into ground lease agreements and a facilities management agreement to provide on campus privatized housing. During the fiscal year ending June 30, 2016, the ground lease fees of $53,840 and facilities management fees of approximately $3,113,129 were paid or payable to the University, including reimbursement of direct and administrative privatized housing expenses. The ground lease agreement was terminated during fiscal year 2017 with the housing acquisition transaction.
Measurement Focus, Basis of Accounting, and Basis of Presentation
The accompanying financial statements have been prepared using the economic resources measurement focus and the accrual basis of accounting in accordance with accounting principles generally accepted in the United States of America, as prescribed by GASB. The economic resources measurement focus reports all inflows, outflows, and balances that affect an entity’s net position. Under the accrual basis of accounting, revenues are recorded when earned and expenses are recorded when a liability is incurred, regardless of the timing of related cash flows. Grants and similar items are recognized as revenue as soon as all eligibility requirements have been met. Operating Revenues and Expenses
The University records tuition; all academic, instructional, and other student fees; auxiliary activity; and corporate partnership revenues as operating revenues. In addition, governmental and private grants and contracts in which the grantor receives equal value for the funds given to the University are recorded as operating revenue. All expenses, with the exception of interest expense, loss on investments, loss on the disposal of assets, and extraordinary expenses are recorded as operating expenses. Appropriations, gifts, investment income, capital grants, gains on the disposal of assets, parking and library fines, and governmental and private research grants and contracts in which the grantor does not receive equal value for the funds given to the University are reported as nonoperating revenue.
MANSFIELD UNIVERSITY OF PENNSYLVANIA OF THE STATE SYSTEM OF HIGHER EDUCATION
NOTES TO FINANCIAL STATEMENTS JUNE 30, 2017 AND 2016
(19)
NOTE 1 NATURE OF OPERATIONS AND SUMMARY OF SIGNIFICANT ACCOUNTING POLICIES
(CONTINUED)
Scholarship Discounts and Allowances and Waivers
Student tuition and fee revenues, and certain other revenues from students, are reported net of scholarship discounts and allowances in the statement of revenues, expenses and changes in net assets. Scholarship discounts and allowances are the difference between the stated charge for goods and services provided by the University and the amount that is paid by students and/or third parties making payments on students’ behalf. To the extent that revenues from such programs are used to satisfy tuition and fees and other student services, the University has recorded a scholarship discount and allowance. In accordance with a formula prescribed by the National Association of College and University Business Officers (NACUBO), the University allocates the cost of scholarships, waivers, and other student financial aid between scholarship discounts and allowances (netted against tuition and fees) and student aid expense. Scholarships and waivers of room and board fees are reported in auxiliary enterprises. The cost of tuition waivers granted to employees is reported as employees’ benefits expense.
Net Position
Net position is the residual of assets, plus deferred outflows of resources, less liabilities, less deferred inflows of resources. The State System maintains the following classifications of net position.
Net Investment in Capital Assets: Capital assets, net of accumulated depreciation and outstanding principal balances of debt attributable to the acquisition, construction, repair or improvement of those assets.
Restricted – Expendable: Net position whose use is subject to externally imposed conditions that can be fulfilled by the actions of the University or by the passage of time. Unrestricted: All other categories of net position. Unrestricted net position may be designated for specific purposes by the University’s Council of Trustees.
When both restricted and unrestricted funds are available for expenditure, the decision as to which assets are used first is left to the discretion of the University. Cash Equivalents and Investments
The University considers all demand and time deposits, money market funds and overnight repurchase agreements to be cash equivalents. Investments purchased are stated at fair value. Investments received as gifts are recorded at their fair value or appraised value as of the date of the gift.

MANSFIELD UNIVERSITY OF PENNSYLVANIA OF THE STATE SYSTEM OF HIGHER EDUCATION
NOTES TO FINANCIAL STATEMENTS JUNE 30, 2017 AND 2016
(20)
NOTE 1 NATURE OF OPERATIONS AND SUMMARY OF SIGNIFICANT ACCOUNTING POLICIES
(CONTINUED)
Accounts and Loans Receivable
Accounts and loans receivable consist of tuition and fees charged to current and former students and amounts due from federal and state governments in connection with reimbursements of allowable expenditures made pursuant to grants, contracts, and other miscellaneous sources. Accounts and loans receivable are reported at net realizable value. Accounts are written off when they are determined to be uncollectible based upon management’s assessment of individual accounts. The allowance for doubtful accounts is estimated based upon the University’s historical loss experience and periodic review of individual accounts. Inventories
Inventories consist of supplies and fuel oil and are stated at the lower of cost or market, with cost determined principally on the weighted average method.
Capital Assets
Land and buildings at the University’s campus acquired or constructed prior to the creation of the State System on July 1, 1983, are owned by the Commonwealth and made available to the University. Since the University neither owns such assets nor is responsible to service the associated bond indebtedness, no value is ascribed thereto in the accompanying financial statements. Likewise, no value is ascribed to the portion of any land or buildings acquired or constructed utilizing capital funds appropriated by the Commonwealth after June 30, 1983, and made available to the University. All assets with a purchase cost, or fair value if acquired by gift, in excess of $5,000 with an estimated useful life of two years or greater are capitalized. Buildings, portions of buildings, capital improvements, and equipment and furnishings acquired or constructed by the University after June 30, 1983, through the expenditure of University funds or the incurring of debt, are stated at cost less accumulated depreciation. All library books are capitalized and depreciated. The University provides for depreciation on the straight-line method over the estimated useful lives of the related assets. Normal repair and maintenance expenditures are not capitalized because they neither add to the value of the property nor materially prolong its useful life. The University does not capitalize collections of art, rare books, historical items, etc., as they are held for public exhibition, education, or research rather than financial gain. Impairment of Capital Assets
Management reviews capital assets for impairment whenever events or changes in circumstances indicate that the service utility of an asset has declined significantly and unexpectedly. Any write-downs due to impairment are charged to operations at the time impairment is identified. No write-down of capital assets was required in 2017 or 2016.

MANSFIELD UNIVERSITY OF PENNSYLVANIA OF THE STATE SYSTEM OF HIGHER EDUCATION
NOTES TO FINANCIAL STATEMENTS JUNE 30, 2017 AND 2016
(21)
NOTE 1 NATURE OF OPERATIONS AND SUMMARY OF SIGNIFICANT ACCOUNTING POLICIES
(CONTINUED)
Unearned Revenue
Unearned revenue includes amounts for tuition and fees, grants, corporate sponsorship payments and certain auxiliary activities received prior to the end of the fiscal year but earned in a subsequent accounting period. Compensated Absences
The estimated cost of future payouts of annual leave and sick leave that employees have earned for services rendered, and which the employees may be entitled to receive upon termination or retirement, is recorded as a liability. Pension Plans
Employees of the University enroll in one of three available retirement plans immediately upon employment. The Commonwealth of Pennsylvania State Employees’ Retirement System (SERS) and Public School Employees’ Retirement System (PSERS) are governmental cost-sharing multiple-employer defined benefit plans. The Alternative Retirement Plan (ARP) is a defined contribution plan administered by the State System. Deferred Outflows and Deferred Inflows of Resources
The balance sheet reports separate sections for deferred outflows of resources and deferred inflows of resources. Deferred outflows of resources, reported after total assets, is defined by GASB as a consumption of net position that applies to future periods. The expense is recognized in the applicable future period(s). Deferred inflows of resources, reported after total liabilities, is defined by GASB as an acquisition of net position that applies to future periods. The revenue is recognized in the applicable future period(s). Transactions are classified as deferred outflows of resources or deferred inflows of resources only when specifically prescribed by GASB standards. The University is required to report the following as deferred outflows of resources or deferred inflows of resources.
Deferred gain or loss on bond refunding, which results when the carrying value of a refunded bond is greater or less than its reacquisition price. The difference is deferred and amortized over the remaining life of the old bond or the life of the new bond, whichever is shorter.

MANSFIELD UNIVERSITY OF PENNSYLVANIA OF THE STATE SYSTEM OF HIGHER EDUCATION
NOTES TO FINANCIAL STATEMENTS JUNE 30, 2017 AND 2016
(22)
NOTE 1 NATURE OF OPERATIONS AND SUMMARY OF SIGNIFICANT ACCOUNTING POLICIES
(CONTINUED)
Deferred Outflows and Deferred Inflows of Resources (Continued)
For defined benefit pension plans: the difference between expected (actuarial) and actual experience, changes in actuarial assumptions, net difference between projected (actuarial) and actual earnings on pension plan investments, changes in the University’s proportion of expenses and liabilities to the pension as a whole, differences between the University’s pension contributions and its proportionate share of contributions, and State System pension contributions subsequent to the pension valuation measurement date.
Transactions are classified as deferred outflows of resources or deferred inflows of resources only when specifically prescribed by GASB standards. Income Taxes
The University, as a member of the State System, is tax-exempt; accordingly, no provision for income taxes has been made in the accompanying financial statements. Use of Estimates
The preparation of financial statements in conformity with accounting principles generally accepted in the United States of America requires management to make estimates and assumptions that affect the reported amounts of assets and liabilities and disclosures of contingent assets and liabilities at the date of the financial statements, and the reported amounts of revenues and expenses during the reporting period. Actual results could differ from those estimates. Reclassifications
Certain amounts in the prior period presented have been reclassified to conform to the current period financial statement presentation. These reclassifications have no effect on previously reported net position or changes thereon. New Accounting Standards
GASB has issued several accounting standards that are required to be adopted by the University in future years. The University is evaluating the impact of the adoption of these standards on its financial statements as discussed below.

MANSFIELD UNIVERSITY OF PENNSYLVANIA OF THE STATE SYSTEM OF HIGHER EDUCATION
NOTES TO FINANCIAL STATEMENTS JUNE 30, 2017 AND 2016
(23)
NOTE 1 NATURE OF OPERATIONS AND SUMMARY OF SIGNIFICANT ACCOUNTING POLICIES
(CONTINUED)
New Accounting Standards (Continued)
In June 2015, GASB issued Statement No. 75, Accounting and Financial Reporting for Postemployment Benefits Other Than Pensions. This statement establishes new accounting and financial reporting requirements for governments whose employees are provided with OPEB (other postemployment benefits), as well as for certain nonemployer governments that have a legal obligation to provide financial support for OPEB provided to the employees of other entities. This statement will require the University to record its postretirement healthcare liability in the amount equal to the actuarially accrued liability: in its most recent actuarial valuation dated July 1, 2016, the University’s accrued postretirement healthcare liability, as calculated by the actuaries, was $41,925,452, but under current GASB requirements, the amount recorded on the balance sheet as a liability at June 30, 2017, was the Net OPEB obligation of $43,486,048. The University expects that the amount recorded on the balance sheet as a postretirement healthcare liability will increase when Statement No. 75 is implemented, but the amount will not be known until the calculation is performed under the new standards. Furthermore, Statement No. 75 will require that the University record the liability for its employees who participate in the Commonwealth’s Retired Employees Health Plan (REHP). Under current GASB standards, the University does not report a share of the REHP’s unfunded liability since the REHP is a multiple-employer cost-sharing plan administered by the Pennsylvania Employee Benefits Trust Fund (PEBTF). The amount that the University will have to record as its share of the liability when Statement No. 75 becomes effective is unknown; however, it is expected to have a material negative effect on the University’s balance sheet. The provisions in Statement No. 75 are effective for fiscal years beginning after June 15, 2017. In June 2016, GASB issued Statement No. 80, Blending Requirements for Certain Component Units—an amendment of GASB Statement No. 14. Statement No. 80 requires blending of a component unit incorporated as a nonprofit corporation in which the primary government (university) is the sole corporate member. The University has determined that Statement No. 80 does not apply to its component units and has no effect on its financial statements. In March 2016, GASB issued Statement No. 81, Irrevocable Split-Interest Agreements. Statement No. 81 provides recognition and measurement guidance for gifts received from donors who have transferred the gifts to an intermediary to hold and administer for the government (university) and at least one other beneficiary. An example of a split-interest agreement is a charitable remainder trust. The University has determined that Statement No. 81 applies to a small number of certain local University investments and will have an immaterial effect on its financial statements. The provisions in Statement No. 81 are effective for reporting periods beginning after December 15, 2016.

MANSFIELD UNIVERSITY OF PENNSYLVANIA OF THE STATE SYSTEM OF HIGHER EDUCATION
NOTES TO FINANCIAL STATEMENTS JUNE 30, 2017 AND 2016
(24)
NOTE 1 NATURE OF OPERATIONS AND SUMMARY OF SIGNIFICANT ACCOUNTING POLICIES
(CONTINUED)
New Accounting Standards (Continued)
In March 2016, GASB issued Statement No. 82, Pension Issues—an amendment of GASB Statements No. 67, No. 68, and No. 73. Statement No. 82 addresses technical issues related to previous GASB guidance on pensions. The University has determined that Statement No. 82 will have no effect on its financial statements. In November 2016, GASB issued Statement No. 83, Certain Asset Retirement Obligations. Statement No. 83 establishes criteria for determining the timing and pattern of recognition of a liability and a corresponding deferred outflow of resources for legally enforceable liabilities associated with the retirement of tangible capital assets. Examples of asset retirements covered under this standard are the decommissioning of a nuclear reactor or the dismantling and removal of sewage treatment plants as required by law. The University has determined that, based on current regulations, facts, and circumstances, Statement No. 83 will have no effect on its financial statements. In January 2017, GASB issued Statement No. 84, Fiduciary Activities. Statement No. 84 establishes criteria for identifying fiduciary activities of all state and local governments to determine whether an activity should be reported in a fiduciary fund in the financial statements. The University has determined that Statement No. 84 will have no effect on its financial statements. In March 2017, GASB issued Statement No. 85, Omnibus 2017. Statement No. 85 addresses practice issues that have been identified during implementation of certain GASB statements. The University has determined that Statement No. 85 will have no effect on its financial statements. In May 2017, GASB issued Statement No. 86, Certain Debt Extinguishment Issues. Statement No. 86 provides guidance for transactions in which cash and other monetary assets acquired with existing resources are placed in an irrevocable trust for the sole purpose of extinguishing debt. The University has determined that Statement No. 86 will have no effect on its financial statements. In June 2017, GASB issued Statement No. 87, Leases. Statement No. 87 establishes a single model for lease accounting based on the foundational principle that leases are financings of the right to use an underlying asset. In other words, most leases currently classified as operating leases will be accounted for and reported in the same manner as capital leases. The University has determined that, although Statement No. 87 will change the way it accounts for its operating leases, it will have little, if any, effect on its net position or results of operations. The provisions in Statement No. 87 are effective for reporting periods beginning after December 15, 2019.

MANSFIELD UNIVERSITY OF PENNSYLVANIA OF THE STATE SYSTEM OF HIGHER EDUCATION
NOTES TO FINANCIAL STATEMENTS JUNE 30, 2017 AND 2016
(25)
NOTE 2 CONDENSED COMPONENT UNIT INFORMATION
The following represents combining condensed statements of financial position information for the component units as of June 30, 2017 and 2016, respectively:
CCSI MAC TotalCapital Assets, Net 45,086$ -$ 45,086$ Cash and Cash Equivalents 520,966 752,886 1,273,852 Inventories 580,442 - 580,442 Other Assets 9,392 2,050,618 2,060,010
Total Assets 1,155,886$ 2,803,504$ 3,959,390$
Long-Term Debt 7,988$ -$ 7,988$ Other Liabilities 411,006 - 411,006
Total Liabilities 418,994 - 418,994
Net Assets:Unrestricted 736,892 2,803,504 3,540,396
Total Net Assets 736,892 2,803,504 3,540,396
Total $ 1,155,886 $ 2,803,504 $ 3,959,390
2017
CCSI MAC TotalCapital Assets, Net 87,854$ 77,084,394$ 77,172,248$ Cash and Cash Equivalents 643,687 8,285,272 8,928,959 Inventories 605,983 - 605,983 Due from University - 218,847 218,847 Other Assets 23,282 2,183,851 2,207,133
Total Assets 1,360,806$ 87,772,364$ 89,133,170$
Long-Term Debt 14,757$ 89,393,052$ 89,407,809$ Due to University - 1,113,515 1,113,515 Other Liabilities 562,143 1,084,499 1,646,642
Total Liabilities 576,900 91,591,066 92,167,966
Net Assets:Unrestricted 783,906 (3,818,702) (3,034,796)
Total Net Assets 783,906 (3,818,702) (3,034,796)
Total $ 1,360,806 $ 87,772,364 $ 89,133,170
2016

MANSFIELD UNIVERSITY OF PENNSYLVANIA OF THE STATE SYSTEM OF HIGHER EDUCATION
NOTES TO FINANCIAL STATEMENTS JUNE 30, 2017 AND 2016
(26)
NOTE 2 CONDENSED COMPONENT UNIT INFORMATION (CONTINUED)
The following represents combining statement of activities for the component units for the year ended June 30, 2017:
CCSI MAC TotalChanges in Unrestricted Net Assets
Revenues and Other Additions:Student Activity Fees 1,675,357$ -$ 1,675,357$ Rental Income - 784,926 784,926 University Stores and Services 667,914 - 667,914 Investment Income 5,278 12,372 17,650 Other Revenues 57,915 10,738,143 10,796,058 Realized and Unrealized Gains on Investments, Net - 45,002 45,002
Total Revenues and Other Additions 2,406,464 11,580,443 13,986,907
Expenses and Other Deductions:Housing - 4,958,237 4,958,237 Student Activities and Programs 1,590,336 - 1,590,336 University Stores 723,010 - 723,010 Management and General 138,132 - 138,132 Other University Support 2,000 - 2,000
Total Expenses and Other Deductions 2,453,478 4,958,237 7,411,715
CHANGE IN NET ASSETS (47,014) 6,622,206 6,575,192
Net Assets - Beginning of Year 783,906 (3,818,702) (3,034,796)
NET ASSETS - END OF YEAR 736,892$ 2,803,504$ 3,540,396$
MANSFIELD UNIVERSITY OF PENNSYLVANIA OF THE STATE SYSTEM OF HIGHER EDUCATION
NOTES TO FINANCIAL STATEMENTS JUNE 30, 2017 AND 2016
(27)
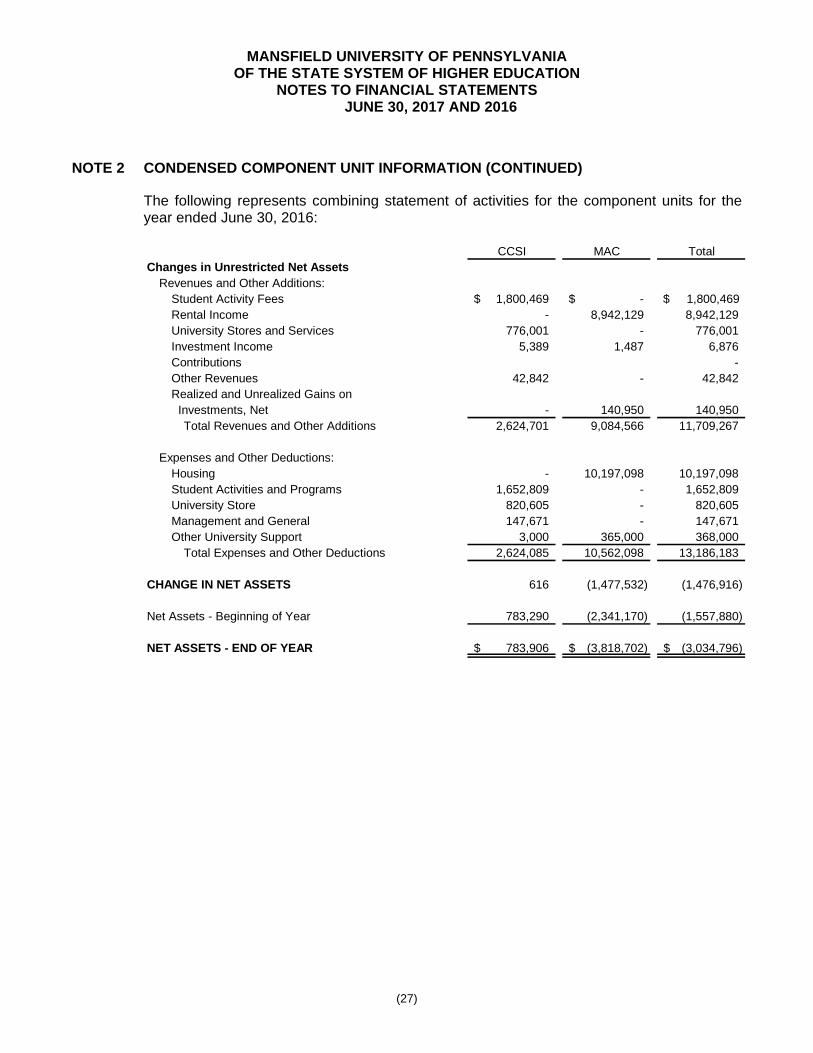
NOTE 2 CONDENSED COMPONENT UNIT INFORMATION (CONTINUED)
The following represents combining statement of activities for the component units for the year ended June 30, 2016:
CCSI MAC TotalChanges in Unrestricted Net Assets
Revenues and Other Additions:Student Activity Fees 1,800,469$ -$ $ 1,800,469 Rental Income - 8,942,129 8,942,129 University Stores and Services 776,001 - 776,001 Investment Income 5,389 1,487 6,876 Contributions - Other Revenues 42,842 - 42,842 Realized and Unrealized Gains on Investments, Net - 140,950 140,950
Total Revenues and Other Additions 2,624,701 9,084,566 11,709,267
Expenses and Other Deductions:Housing - 10,197,098 10,197,098 Student Activities and Programs 1,652,809 - 1,652,809 University Store 820,605 - 820,605 Management and General 147,671 - 147,671 Other University Support 3,000 365,000 368,000
Total Expenses and Other Deductions 2,624,085 10,562,098 13,186,183
CHANGE IN NET ASSETS 616 (1,477,532) (1,476,916)
Net Assets - Beginning of Year 783,290 (2,341,170) (1,557,880)
NET ASSETS - END OF YEAR 783,906$ (3,818,702)$ (3,034,796)$

MANSFIELD UNIVERSITY OF PENNSYLVANIA OF THE STATE SYSTEM OF HIGHER EDUCATION
NOTES TO FINANCIAL STATEMENTS JUNE 30, 2017 AND 2016
(28)
NOTE 3 DEPOSITS AND INVESTMENTS
The University predominantly maintains its cash balances on deposit with the State System. The State System maintains these and other State System funds on a pooled basis. Although the State System pools its funds in a manner similar to an internal investment pool, individual State System entities do not hold title to any assets in the fund. The State System as a whole owns title to all assets. The University does not participate in the unrealized gains or losses on the investment pool; instead, the University holds shares equal to its cash balance. Each share has a constant value of $1, and income is allocated based on the number of shares owned. Revenue realized at the State System level is calculated on a daily basis and posted monthly to each entity’s account as interest income. The University’s portion of pooled funds totaled $18,842,551 and $16,610,275 at June 30, 2017 and 2016, respectively. For purposes of convenience and expedience, the University uses local financial institutions for activities such as cash deposits. The State System invests its funds in accordance with Board of Governors’ Policy 1986- 02-A, Investment which authorizes the State System to invest in obligations of the U.S. Treasury, repurchase agreements, commercial paper, certificates of deposit, bankers’ acceptances, U.S. money market funds, municipal bonds, corporate bonds, collateralized mortgage obligations (CMOs), asset-backed securities, and internal loan funds. Restricted nonexpendable funds and amounts designated by the board may be invested in the investments described above, as well as in corporate equities and approved pooled common funds. In addition, the University may accept gifts of investments from donors as long as risk is limited to the investment itself. Restricted gifts of investments fall outside the scope of the investment policy. In keeping with its legal status as a system of public universities, the State System recognizes a fiduciary responsibility to invest all funds prudently in accordance with ethical and prevailing legal standards. Investment decisions are intended to minimize risk while maximizing asset value. Adequate liquidity is maintained so that assets can be held to maturity. High quality investments are preferred. Reasonable portfolio diversification is pursued to ensure that no single security or investment or class of securities or investments will have a disproportionate or significant impact on the total portfolio. Investments may be made in U.S. dollar-denominated debt of high quality U.S. and non-U.S. corporations. Investment performance is monitored on a frequent and regular basis to ensure that objectives are attained and guidelines are followed. Safety of principal and liquidity are the top priorities for the investment of the State System’s operating funds. Within those guidelines, income optimization is pursued. Speculative investment activity is not allowed; this includes investing in asset classes such as commodities, futures, short-sales, equities, real or personal property, options, venture capital investments, private placements, letter stocks, and unlisted securities.

MANSFIELD UNIVERSITY OF PENNSYLVANIA OF THE STATE SYSTEM OF HIGHER EDUCATION
NOTES TO FINANCIAL STATEMENTS JUNE 30, 2017 AND 2016
(29)
NOTE 3 DEPOSITS AND INVESTMENTS (CONTINUED)
The State System’s operating funds are invested and reinvested in the following types of instruments with qualifications as provided. (See Board Policy 1986-02-A, Investment, for a complete list of and more details on permissible investments and associated qualifications.)
Investment Categories Qualifications/Moody’s Ratings RequirementsTogether with repurchase agreements must comprise atleast 20% of the market value of the fund.Underlying collateral must be direct obligations of the
Repurchase Agreements United States Treasury and be in the State System'sor its agent's custody.P-1 and P-2 notes only, with no more than 5% and 3%,respectively, of the market value of the fund invested inany single issuer. Total may not exceed 20% of themarket value of the fund.Bonds must carry long-term debt rating of A or better.Total may not exceed 20% of the market value of the fund.15% must carry long-term debt rating of A or better; 5%
Corporate Bonds may be rated Baa2 or better. Total may not exceed 20%of the market value of the fund.
Collateralized Mortgage Obligations Must be rated Aaa and guaranteed by U.S. government.(CMOs) Total may not exceed 20% of the market value of the fund.
Must be Aaa rated. Total may not exceed 20% of theAsset-Backed Securities market value of the fund, with no more than 5% invested
in any single issuer.System Investment Fund Loans Total may not exceed 20% of the market value of the(University Loans and Bridge Notes) fund, and loan terms may not exceed 5 years.
Commercial Paper
United States Government Securities
Municipal Bonds
CMO Risk: CMOs are sometimes based on cash flows from interest-only (IO) payments or principal-only (PO) payments and are sensitive to prepayment risks. The CMOs in the State System’s portfolio do not have IO or PO structures; however, they are subject to extension or contraction risk based on movements in interest rates. Moody’s Rating: The State System uses ratings from Moody’s Investors Service, Inc., to indicate the credit risk of investments, i.e., the risk that an issuer or other counterparty to an investment will not fulfill its obligations. An Aaa rating indicates the highest quality obligations with minimal credit risk. Ratings that begin with Aa indicate high quality obligations subject to very low credit risk; ratings that begin with A indicate upper-medium-grade obligations subject to low credit risk; and ratings that begin with Baa indicate medium-grade obligations, subject to moderate credit risk, that may possess certain speculative characteristics. Moody’s appends the ratings with numerical modifiers 1, 2, and 3, with 1 indicating a higher ranking and 3 indicating a lower ranking within the category. For short-term obligations, a rating of P-1 indicates that issuers have a superior ability to repay short-term debt obligations, and a rating of P-2 indicates that issuers have a strong ability to repay short-term debt obligations.

MANSFIELD UNIVERSITY OF PENNSYLVANIA OF THE STATE SYSTEM OF HIGHER EDUCATION
NOTES TO FINANCIAL STATEMENTS JUNE 30, 2017 AND 2016
(30)
NOTE 3 DEPOSITS AND INVESTMENTS (CONTINUED)
Modified Duration: The State System denotes interest rate risk, or the risk that changes in interest rates will affect the fair value of an investment, using modified duration. Duration is a measurement in years of how long it takes for the price of a bond to be repaid by its internal cash flows. Modified duration takes into account changing interest rates. The State System maintains a portfolio duration target of 1.8 years with an upper limit of 2.5 years for the intermediate-term component of the operating portion of the investment portfolio. The State System’s duration targets are not applicable to its long-term investments. Fair Value Hierarchy: GASB Statement No. 72, Fair Value Measurement and Application, requires that investments be classified according to a “fair value hierarchy.” With respect to Statement No. 72’s fair value hierarchy, GASB defines “inputs” as “the assumptions that market participants would use when pricing an asset or liability, including assumptions about risk.” Statement No. 72 further categorizes inputs as observable or unobservable: Observable inputs are “inputs that are developed using market data, such as publicly available information about actual events or transactions, and which reflect the assumptions that market participants would use when pricing an asset or liability;” Unobservable inputs are “inputs for which market data are not available and that are developed using the best information available about the assumptions that market participants would use when pricing an asset or liability.” Statement No. 72’s fair value hierarchy categorizes the inputs to valuation techniques used to measure fair value into three “levels:” Level 1 – Investments whose values are based on unadjusted quoted prices for identical assets or liabilities in an active market, such as stocks listed in the S&P 500 or NASDAQ. If an up-to-date price of the investment can be found on a major exchange, it is a Level 1 investment. Level 2 – Investments whose values are based on their quoted prices in inactive markets or whose values are based on models, and the inputs to those models are observable either directly or indirectly for substantially the full term of the asset or liability. Level 3 – Investments that trade infrequently, and as a result do not have many reliable market prices. Valuations of Level 3 investments typically are based on management assumptions or expectations. For example, a private equity investment or complex derivative would likely be a Level 3 investment. In addition, the fair value of certain investments that do not have a readily determinable fair value is classified as NAV, meaning Net Asset Value per share, when the fair value is calculated in a manner consistent with the Financial Accounting Standards Board’s measurement principles for investment companies. Debt and equity securities classified in Level 1 of the fair value hierarchy are valued using prices quoted in active markets for those securities. Debt and equity securities classified in Level 2 of the fair value hierarchy are valued using a matrix pricing technique. Matrix pricing is used to value securities based on the securities’ relationship to benchmark quoted prices.
MANSFIELD UNIVERSITY OF PENNSYLVANIA OF THE STATE SYSTEM OF HIGHER EDUCATION
NOTES TO FINANCIAL STATEMENTS JUNE 30, 2017 AND 2016
(31)
NOTE 3 DEPOSITS AND INVESTMENTS (CONTINUED)
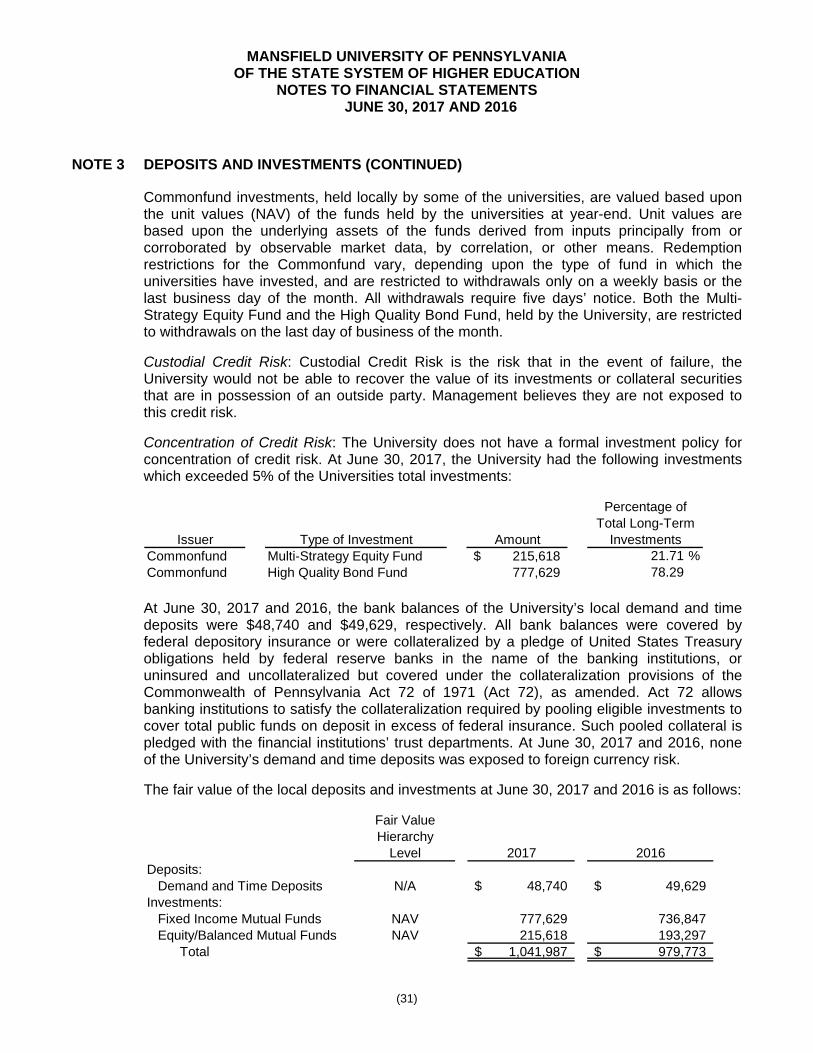
Commonfund investments, held locally by some of the universities, are valued based upon the unit values (NAV) of the funds held by the universities at year-end. Unit values are based upon the underlying assets of the funds derived from inputs principally from or corroborated by observable market data, by correlation, or other means. Redemption restrictions for the Commonfund vary, depending upon the type of fund in which the universities have invested, and are restricted to withdrawals only on a weekly basis or the last business day of the month. All withdrawals require five days’ notice. Both the Multi-Strategy Equity Fund and the High Quality Bond Fund, held by the University, are restricted to withdrawals on the last day of business of the month. Custodial Credit Risk: Custodial Credit Risk is the risk that in the event of failure, the University would not be able to recover the value of its investments or collateral securities that are in possession of an outside party. Management believes they are not exposed to this credit risk. Concentration of Credit Risk: The University does not have a formal investment policy for concentration of credit risk. At June 30, 2017, the University had the following investments which exceeded 5% of the Universities total investments:
Percentage ofTotal Long-Term
Issuer Type of Investment Amount InvestmentsCommonfund Multi-Strategy Equity Fund 215,618$ 21.71 %Commonfund High Quality Bond Fund 777,629 78.29
At June 30, 2017 and 2016, the bank balances of the University’s local demand and time deposits were $48,740 and $49,629, respectively. All bank balances were covered by federal depository insurance or were collateralized by a pledge of United States Treasury obligations held by federal reserve banks in the name of the banking institutions, or uninsured and uncollateralized but covered under the collateralization provisions of the Commonwealth of Pennsylvania Act 72 of 1971 (Act 72), as amended. Act 72 allows banking institutions to satisfy the collateralization required by pooling eligible investments to cover total public funds on deposit in excess of federal insurance. Such pooled collateral is pledged with the financial institutions’ trust departments. At June 30, 2017 and 2016, none of the University’s demand and time deposits was exposed to foreign currency risk. The fair value of the local deposits and investments at June 30, 2017 and 2016 is as follows:
Fair ValueHierarchy
Level 2017 2016Deposits:
Demand and Time Deposits N/A 48,740$ 49,629$ Investments:
Fixed Income Mutual Funds NAV 777,629 736,847 Equity/Balanced Mutual Funds NAV 215,618 193,297
Total 1,041,987$ 979,773$

MANSFIELD UNIVERSITY OF PENNSYLVANIA OF THE STATE SYSTEM OF HIGHER EDUCATION
NOTES TO FINANCIAL STATEMENTS JUNE 30, 2017 AND 2016
(32)
NOTE 4 CAPITAL ASSETS
Capital assets acquired or constructed by the University through the expenditure of University funds or the incurrence of debt consist of the following:
Estimated Beginning EndingLives Balance Balance
(in Years) July 1, 2016 Additions Retirements Reclassifications June 30, 2017Capital Assets Not Being Depreciated:
Land 840,936$ -$ -$ -$ 840,936$ Construction in Progress 410,576 234,083 - (314,016) 330,643
Total Capital Assets Not Being Depreciated 1,251,512 234,083 - (314,016) 1,171,579
Capital Assets Being Depreciated:
Buildings, including Improvements 10-40 54,355,000 73,901,089 - 194,794 128,450,883 Other Improvements 20 11,881,017 540,825 - 119,222 12,541,064 Furnishings and Equipment (including Cost of Capital Leases) 3-10 11,538,531 3,128,478 (72,659) - 14,594,350 Library Books 10 2,909,768 25,116 (4,466) - 2,930,418
Total Capital Assets Being Depreciated 80,684,316 77,595,508 (77,125) 314,016 158,516,715
Less Accumulated Depreciation:
Buildings, including Improvements (34,384,772) (4,081,037) - - (38,465,809) Other Improvements (6,341,053) (490,548) - - (6,831,601) Furnishings and Equipment (9,044,333) (1,130,531) 72,659 - (10,102,205) Library Books (2,731,340) (42,823) 4,466 - (2,769,697)
Total Accumulated Depreciation (52,501,498) (5,744,939) 77,125 - (58,169,312) Total Capital Assets Being Depreciated, Net 28,182,818 71,850,569 - 314,016 100,347,403
Capital Assets, Net 29,434,330$ 72,084,652$ -$ -$ 101,518,982$

MANSFIELD UNIVERSITY OF PENNSYLVANIA OF THE STATE SYSTEM OF HIGHER EDUCATION
NOTES TO FINANCIAL STATEMENTS JUNE 30, 2017 AND 2016
(33)
NOTE 4 CAPITAL ASSETS (CONTINUED)
Estimated Beginning EndingLives Balance Balance
(in Years) July 1, 2015 Additions Retirements Reclassifications June 30, 2016Capital Assets Not Being Depreciated:
Land 840,936$ -$ -$ -$ 840,936$ Construction in Progress 678,954 674,037 - (942,415) 410,576
Total Capital Assets Not Being Depreciated 1,519,890 674,037 - (942,415) 1,251,512
Capital Assets Being Depreciated:
Buildings, including Improvements 10-40 53,708,540 80,000 - 566,460 54,355,000 Other Improvements 20 11,324,900 180,162 - 375,955 11,881,017 Furnishings and Equipment (including Cost of Capital Leases) 3-10 11,104,668 786,303 (352,440) - 11,538,531 Library Books 10 2,871,726 46,771 (8,729) - 2,909,768
Total Capital Assets Being Depreciated 79,009,834 1,093,236 (361,169) 942,415 80,684,316
Less Accumulated Depreciation:
Buildings, including Improvements (32,216,250) (2,168,523) - - (34,384,773) Other Improvements (5,885,191) (455,861) - - (6,341,052) Furnishings and Equipment (8,485,598) (902,682) 343,947 - (9,044,333) Library Books (2,692,721) (47,348) 8,729 - (2,731,340)
Total Accumulated Depreciation (49,279,760) (3,574,414) 352,676 - (52,501,498) Total Capital Assets Being Depreciated, Net 29,730,074 (2,481,178) (8,493) 942,415 28,182,818
Capital Assets, Net 31,249,964$ (1,807,141)$ (8,493)$ -$ 29,434,330$
NOTE 5 ACCOUNTS PAYABLE AND ACCRUED EXPENSES
Accounts payable and accrued expenses consisted of the following at June 30:
2017 2016 Employees 3,273,945$ 3,209,440$ Suppliers and Services 793,509 725,431 Other 331,245 344,597 Interest 152,997 21,840
Total 4,551,696$ 4,301,308$

MANSFIELD UNIVERSITY OF PENNSYLVANIA OF THE STATE SYSTEM OF HIGHER EDUCATION
NOTES TO FINANCIAL STATEMENTS JUNE 30, 2017 AND 2016
(34)
NOTE 6 UNEARNED REVENUE
Unearned revenue consisted of the following at June 30:
2017 2016Current:
Student Tuition and Fees-Summer Sessions 492,941$ 515,863$ Other 248,752 128,940 Grants and Gifts 1,200 -
Unearned Revenue, Current 742,893 644,803
Noncurrent:Other 52,641 59,731
Total Unearned Revenue 795,534$ 704,534$
NOTE 7 BONDS PAYABLE
Bonds payable consist of tax-exempt revenue bonds issued by the State System through the Pennsylvania Higher Educational Facilities Authority (PHEFA). In connection with the bond issuances, the State System entered into loan agreements with PHEFA under which the State System has pledged its full faith and credit for the repayment of the bonds. The loans constitute an unsecured general obligation of the State System. The State System’s Board of Governors has allocated portions of certain bond issuances to the University to undertake various capital projects or to advance refund certain previously issued bonds. The University is responsible for the repayment of principal and interest on its applicable portion of each obligation. To decrease operational expenses and lower the cost of debt service, the University purchased student residence halls that were constructed by the MAC by issuing tax-exempt bonds through State System bond financing and paying off the MAC debt. Since the transactions are between related parties, GAAP requires that the University record the assets (the buildings) at the depreciated value that was recorded on the MAC’s books at the time of acquisition by the University. Consequently, the debt being assumed by the University significantly exceeds the value of the asset recorded, because not only did the funds that were originally borrowed by the MAC include noncapitalized items such as furnishings and debt service fees, but also because the annual depreciation on the housing recorded by the MAC exceeded the annual payments that were made to reduce debt principal. In fiscal year 2017, the University acquired all four of the student residence halls on campus property that had been constructed by their affiliate, Mansfield Auxiliary Corporation. The book value of the housing at the time of acquisition was $77.0 million, but the debt assumed was $86.8 million, resulting in a loss on acquisition of $9.8 million. Despite the negative effect on its balance sheet, over the 38-year debt term the University expects to reduce debt service payments by about $16 million and avoid an estimated $18 million in operating costs such as ground lease payments, management fees, insurance, and payments in lieu of taxes.

MANSFIELD UNIVERSITY OF PENNSYLVANIA OF THE STATE SYSTEM OF HIGHER EDUCATION
NOTES TO FINANCIAL STATEMENTS JUNE 30, 2017 AND 2016
(35)
NOTE 7 BONDS PAYABLE (CONTINUED)
The various bond series allocated to the University for the year ended June 30, 2017 are as follows:
Weighted
Average
Interest Balance Bonds Bonds Balance
Rate July 1, 2016 Issued Redeemed June 30, 2017
Series AI Issued in 2009 for Note Financing 4.24% 346,991$ -$ 43,888$ 303,103$
Series AJ Issued in 2009 for Building Renovations 4.87% 5,000,000 - 410,000 4,590,000
Series AK Issued in 2009 for Building Renovations 4.00% 598,169 - 192,852 405,317
Series AL Issued in 2010 for Capital Project 5.00% 1,130,710 - 120,539 1,010,171
Series AN Issued in 2012 for Building Renovations 5.00% 2,112,087 - 297,788 1,814,299
Series AO Issued in 2013 for Capital Project 4.39% 700,000 - 90,000 610,000
Series AP Issued in 2014 for Note Financing 4.55% 1,545,887 - 169,432 1,376,455
Series AT Issued in 2016 for Housing Acquisition 3.41% - 79,235,000 735,000 78,500,000
Total Bonds Payable 11,433,844$ 79,235,000$ 2,059,499$ 88,609,345
Plus: Unamortized Bond Premiums, Net 9,138,284
Outstanding - End of Year 97,747,629$
The various bond series allocated to the University for the year ended June 30, 2016 are as follows:
Weighted
Average
Interest Balance Bonds Bonds Balance
Rate July 1, 2015 Issued Redeemed June 30, 2016
Series AI Issued in 2009 for Note Financing 4.21% 389,165$ -$ 42,174$ 346,991$
Series AJ Issued in 2009 for Building Renovations 4.88% 5,360,000 - 360,000 5,000,000
Series AK Issued in 2009 for Building Renovations 4.00% 782,033 - 183,864 598,169
Series AL Issued in 2010 for Capital Project 5.00% 1,245,352 - 114,642 1,130,710
Series AN Issued in 2012 for Building Renovations 5.00% 2,396,749 - 284,662 2,112,087
Series AO Issued in 2013 for Capital Project 4.32% 785,000 - 85,000 700,000
Series AP Issued in 2014 for Note Financing 4.51% 2,122,203 - 576,316 1,545,887
Total Bonds Payable 13,080,502$ -$ 1,646,658$ 11,433,844
Plus: Unamortized Bond Premiums, Net 767,373
Outstanding - End of Year 12,201,217$

MANSFIELD UNIVERSITY OF PENNSYLVANIA OF THE STATE SYSTEM OF HIGHER EDUCATION
NOTES TO FINANCIAL STATEMENTS JUNE 30, 2017 AND 2016
(36)
NOTE 7 BONDS PAYABLE (CONTINUED)
Principal and interest maturities for each of the next five years and in subsequent five-year periods ending June 30 are as follows:
Series 2018 2019 2020 2021 2022 2023-2027 2028-2032 2033-2037 2038-2042 2043-2047 2048-2052 2053-2055 Total
AI Principal 45,603$ 47,317$ 49,374$ 51,431$ 109,378$ -$ -$ -$ -$ -$ -$ -$ 303,103$
Interest 12,725 10,900 9,008 6,971 7,230 - - - - - - - 46,834
Total 58,328 58,217 58,382 58,402 116,608 - - - - - - - 349,937
AJ Principal 460,000 515,000 580,000 645,000 2,390,000 - - - - - - - 4,590,000
Interest 229,500 206,500 180,750 151,750 247,250 - - - - - - - 1,015,750
Total 689,500 721,500 760,750 796,750 2,637,250 - - - - - - - 5,605,750
AK Principal 198,573 206,744 - - - - - - - - - - 405,317
Interest 16,213 8,270 - - - - - - - - - - 24,483
Total 214,786 215,014 - - - - - - - - - - 429,800
- -
AL Principal 125,883 132,584 139,126 145,996 42,317 245,490 178,775 - - - - - 1,010,171
Interest 50,509 44,214 37,585 30,629 23,329 82,712 18,168 - - - - - 287,146
Total 176,392 176,798 176,711 176,625 65,646 328,202 196,943 - - - - - 1,297,317
AN Principal 307,798 321,272 334,979 353,247 369,150 127,852 - - - - - - 1,814,298
Interest 76,905 60,841 43,764 25,676 6,193 635 - - - - - - 214,014
Total 384,703 382,113 378,743 378,923 375,343 128,487 - - - - - - 2,028,312
AO Principal 90,000 95,000 100,000 100,000 110,000 115,000 - - - - - - 610,000
Interest 27,725 24,575 21,250 16,250 11,250 5,750 - - - - - - 106,800
Total 117,725 119,575 121,250 116,250 121,250 120,750 - - - - - - 716,800
AP Principal 175,225 180,293 187,534 194,775 202,739 435,890 - - - - - - 1,376,456
Interest 59,692 54,436 47,224 39,722 31,931 32,945 - - - - - - 265,950
Total 234,917 234,729 234,758 234,497 234,670 468,835 - - - - - - 1,642,406
AT Principal 1,550,000 1,625,000 1,710,000 1,800,000 1,885,000 10,930,000 13,970,000 17,320,000 14,970,000 7,340,000 3,340,000 2,060,000 78,500,000
Interest 3,259,850 3,182,350 3,101,100 3,015,600 2,925,600 13,117,000 10,096,000 6,753,900 3,926,350 1,894,800 1,032,250 191,500 52,496,300
Total 4,809,850 4,807,350 4,811,100 4,815,600 4,810,600 24,047,000 24,066,000 24,073,900 18,896,350 9,234,800 4,372,250 2,251,500 96,241,400
Total Principal 2,953,082 3,123,210 3,101,013 3,290,449 5,108,584 11,854,232 14,148,775 17,320,000 14,970,000 7,340,000 3,340,000 2,060,000 88,609,345
Interest 3,733,119 3,592,086 3,440,681 3,286,598 3,252,783 13,239,042 10,114,168 6,753,900 3,926,350 1,894,800 1,032,250 191,500 54,457,277
Total 6,686,201$ 6,715,296$ 6,541,694$ 6,577,047$ 8,361,367$ 25,093,274$ 24,262,943$ 24,073,900$ 18,896,350$ 9,234,800$ 4,372,250$ 2,251,500$ 143,066,622$
In addition, the University participates in the State System’s Academic Facilities Renovation Bond Program (AFRP), which was established for the purpose of renovating the academic facilities across the State System. This program provided $100,000,000 in funding over the next several years. The State System issued bonds to provide a pool for funding for AFRP ($17,539,964 and $21,918,513 was outstanding as of June 30, 2017 and 2016, respectively). Universities requested funds for AFRP projects in accordance with their pre-approved amount of funding from the pool. Repayments to the pool are made annually based on the University’s proportionate share of the total allocation of funds under the program.

MANSFIELD UNIVERSITY OF PENNSYLVANIA OF THE STATE SYSTEM OF HIGHER EDUCATION
NOTES TO FINANCIAL STATEMENTS JUNE 30, 2017 AND 2016
(37)
NOTE 7 BONDS PAYABLE (CONTINUED)
Changes in the balance under the AFRP pool of funding were as follows:
2017 2016 Balance - July 1 972,680$ 1,248,802$ Repayments (190,367) (276,122) Balance - June 30 782,313$ 972,680$
The following is a summary of the MAC’s bonds payable as of June 30: Description 2017 2016
Series of 2014A Bonds in the amount of $35,163,000issued by the Corporation in December 2014 for the purpose of providing permanent financing of the student housing facility for the University. Payments of principal and interest are payable through December 2044 at 4.59%. The bonds are secured by property, equipment, and housing revenues as defined in the Indenture and guaranteed by the USDA. -$ 34,055,728$
Series of 2014B Bonds in the amount of $3,907,000issued by the Corporation in December 2014 for the purpose of providing permanent financing of the student housing facility for the University. Payments of principal and interest are payable through December 2044 at 5.00%. The bonds are secured by property, equipment, and housing revenues as defined in the Indenture. - 3,788,426
Series of 2012A Bonds in the amount of $13,350,000 -Tioga County Industrial Development Authority issued by MAC in August 2012 for the purpose of funding the construction of the student housing facility for the University. These bonds are secured by an irrevocable letter of credit with a bank pursuant to a reimbursement agreement between the Corporation and the bank. Payments of principal and interest are payable through July 2042. - 12,936,000
Balance Forward - 50,780,154

MANSFIELD UNIVERSITY OF PENNSYLVANIA OF THE STATE SYSTEM OF HIGHER EDUCATION
NOTES TO FINANCIAL STATEMENTS JUNE 30, 2017 AND 2016
(38)
NOTE 7 BONDS PAYABLE (CONTINUED)
Description 2017 2016
Balance Forward -$ 50,780,154$
Series of 2012B Bonds in the amount of $1,483,400 -Tioga County Industrial Development Authority issuedby the Corporation in August 2012 for the purpose offunding the construction of the student housing facilityfor the University. Payments of principal and interestare payable through July 2042. - 1,443,400
Notes payable to the USDA in monthly installments of $79,366 including interest at 3.50% per annumthrough March 2055. The notes are secured byproperty, equipment, and housing revenues asdefined by the security agreement. - 20,153,305
Series of 2012D Bonds in the amount of $18,223,000 -Tioga County Industrial Development Authorityissued by the Corporation in August 2012 for thepurpose of funding the construction of the studenthousing facility for the University. Payments ofprincipal and interest through July 2037 at the2012D Index Rate (2.82% at June 30, 2015). - 17,016,193
Total -$ 89,393,052$
The MAC’s bonds were secured by an interest in the rental payments received from students. All MAC bonds were advance refunded as a result of the University’s acquisition of the MAC housing facilities.
NOTE 8 COMPENSATED ABSENCES
Changes in compensated absences are as follows:
2017 2016 Balance - July 1 3,157,728$ 3,321,460$ Current Changes in Estimate 439,277 237,557 Payouts (397,472) (401,289) Balance - June 30 3,199,533$ 3,157,728$

MANSFIELD UNIVERSITY OF PENNSYLVANIA OF THE STATE SYSTEM OF HIGHER EDUCATION
NOTES TO FINANCIAL STATEMENTS JUNE 30, 2017 AND 2016
(39)
NOTE 9 POSTRETIREMENT BENEFITS
University employees who retire after meeting specified service and age requirements become eligible for participation in one of two defined healthcare benefits plans referred to here as the “System Plan” and the “Retired Employees Health Program.” These plans include hospital, medical/surgical, and major medical coverage, and provide a Medicare supplement for individuals over age 65. System Plan
Plan Description
Employee members of the Association of Pennsylvania State College and University Faculties (APSCUF), the State College and University Professional Association (SCUPA), Security Police and Fire Professionals of America (SPFPA), Office and Professional Employees International Union (OPEIU) and nonrepresented employees participate in a single-employer defined benefits healthcare plan administered by the State System (System Plan). The System Plan provides eligible retirees and their eligible dependents with healthcare benefits, as well as tuition waivers at any of the State System Universities. Act 188 empowers the Board to establish and amend benefit provisions. The System Plan has no plan assets, and no financial report is prepared. Funding Policy
The contribution requirements of plan members and the State System are established and may be amended by the board. The System Plan is funded on a pay-as-you-go basis; i.e., premiums are paid to an insurance company and various health maintenance organizations to fund the healthcare benefits provided to current retirees. Tuition waivers are provided by the retiree’s sponsoring University as they are granted. The State System paid premiums of $39,241,000 and $40,060,000 for the fiscal years ended June 30, 2017 and 2016, respectively. Plan members receiving benefits contribute at various rates, depending upon when they retire, whether they are eligible for Medicare, the contribution rate in effect on the date of their retirement, the contribution rate for active employees, and applicable collective bargaining agreements. Following are the contribution rates of plan members as of June 30, 2017:
Eligible plan members receiving benefits who retired prior to July 1, 2005, are not required to make contributions.
Nonfaculty coaches who retired July 1, 2005 or after pay a percentage of their final annual gross salary at the time of retirement.
Other eligible annuitants who retired on or after July 1, 2005, and prior to July 1, 2008, and who are under age 65 pay the same dollar amount they paid as active employees on the day of retirement. When these annuitants become eligible for Medicare, they pay 18% of the current cost of their Medicare coverage and current cost of coverage for covered dependents. The rate changes annually and future adjustments will apply if contributions increase for active employees.

MANSFIELD UNIVERSITY OF PENNSYLVANIA OF THE STATE SYSTEM OF HIGHER EDUCATION
NOTES TO FINANCIAL STATEMENTS JUNE 30, 2017 AND 2016
(40)
NOTE 9 POSTRETIREMENT BENEFITS (CONTINUED)
System Plan (Continued)
Funding Policy (Continued)
Other eligible annuitants who retire on or after July 1, 2008 pay 18% of the plan premium in effect for active employees on their retirement date. Future adjustments will apply if contributions increase for active employees.
Employee members of SPFPA, OPEIU, and SCUPA, and nonrepresented
employees, hired after January 15, 2016, receive no postretirement benefits. Total contributions made by plan members were $5,558,000 and $4,866,000, or approximately 12.4% and 10.8% of the total premiums, for the fiscal years ended June 30, 2017 and 2016, respectively. Annual OPEB Cost and Net OPEB Obligation
The University’s annual other postemployment benefit (OPEB) cost is calculated based on the annual required contribution (ARC) of the employer, an amount actuarially determined in accordance with GASB Statement 45, Accounting and Financial Reporting by Employers for Postemployment Benefits Other Than Pensions. The ARC represents a level of funding that, if paid annually, is projected to cover normal cost plus the annual portion of the unfunded actuarial liability amortized over 30 years. The following shows the components of the University’s annual OPEB cost for the year, the amount actually contributed to the Plan, and changes in the University’s net OPEB obligation for June 30:
2017 2016 Annual Required Contribution $ 3,418,094 $ 3,751,328 Interest on Net OPEB Obligation 1,586,929 1,533,157 Adjustment to Annual Required Contribution (2,260,613) (2,015,054)
Annual OPEB Cost 2,744,410 3,269,431
Contributions Made (1,065,953) (1,193,045)
Increase in Net OPEB Obligation 1,678,457 2,076,386
Net OPEB Obligation - Beginning of Year 41,807,591 39,731,205
Net OPEB Obligation - End of Year $ 43,486,048 $ 41,807,591

MANSFIELD UNIVERSITY OF PENNSYLVANIA OF THE STATE SYSTEM OF HIGHER EDUCATION
NOTES TO FINANCIAL STATEMENTS JUNE 30, 2017 AND 2016
(41)
NOTE 9 POSTRETIREMENT BENEFITS (CONTINUED)
System Plan (Continued)
Annual OPEB Cost and Net OPEB Obligation (Continued)
The University’s annual OPEB cost, the percentage of annual OPEB cost contributed to the Plan, and the net OPEB obligation for June 30, 2017, and the two preceding years were as follows:
PercentageAnnual of AnnualOPEB OPEB Cost Net OPEB
Year Ended Cost Contributed Obligation June 30, 2017 $ 2,744,410 38.8 % $ 43,486,048 June 30, 2016 3,269,431 36.5 41,807,591 June 30, 2015 3,288,179 37.3 39,731,205
Funded Status and Funding Progress
The funded status of the University’s portion of the System Plan as of July 1, 2016, the most recent actuarial valuation date, was as follows:
Actuarial Accrued Liability (AAL) 41,925,452$ Actuarial Value of Plan Assets -
Unfunded Actuarial Accrued Liability (UAAL) 41,925,452$
Funded Ratio (Actuarial Value of Plan Assets/AAL) 0%
Covered Payroll (Active Plan Members) 16,193,802$
UAAL as a Percentage of Covered Payroll 258.9%
Actuarial valuations of an ongoing plan involve estimates of the value of reported amounts and assumptions about the probability of occurrence of events far into the future. Examples include assumptions about future employment, mortality, and the healthcare cost trend. Amounts determined regarding the funded status of the plan and the annual required contributions of the employer are subject to continual revision as actual results are compared with past expectations and new estimates are made about the future. The schedule of funding progress, presented as required supplementary information following the notes to the financial statements, presents multi-year trend information about whether the actuarial values of plan assets is increasing or decreasing over time relative to the actuarial accrued liabilities for benefits.

MANSFIELD UNIVERSITY OF PENNSYLVANIA OF THE STATE SYSTEM OF HIGHER EDUCATION
NOTES TO FINANCIAL STATEMENTS JUNE 30, 2017 AND 2016
(42)
NOTE 9 POSTRETIREMENT BENEFITS (CONTINUED)
System Plan (Continued)
Actuarial Methods and Assumptions
Projections of benefits for financial reporting purposes are based on the substantive plan (the plan as understood by the employer and the plan members) and include the types of benefits provided at the time of each valuation and the historical pattern of sharing of benefit costs between the employer and plan members to that point. The actuarial methods and assumptions used include techniques that are designed to reduce the effects of short-term volatility in actuarial accrued liabilities and the actuarial value of assets, consistent with the long-term perspective of the calculations. In the July 1, 2016 actuarial valuation, the projected unit credit method was used. The actuarial assumptions included a 4.25% investment rate of return, which is the expected rate to be earned on the State System’s operating portfolio. The healthcare cost trend rate used was 6.5% in 2016, 6.0% in 2017, and 5.5% in 2018 through 2020, with rates gradually decreasing from 5.4% in 2021 to 3.8% in 2075 and later based on the Society of Actuaries Long-Run Medical Cost Trend Model. The UAAL is being amortized as a level percentage of payroll on a closed basis. The remaining amortization period at July 1, 2016, was 19 years.
Retired Employees Health Program
Plan Description
Employee members of the American Federation of State, County, and Municipal Employees; Pennsylvania Doctors Alliance; and Pennsylvania Social Services Union participate in the Retired Employees Health Program (REHP), which is sponsored by the Commonwealth and administered by the Pennsylvania Employee Benefits Trust Fund (PEBTF). The REHP provides eligible retirees and their eligible dependents with health care benefits. Benefits provisions are established and may be amended under pertinent statutory authority. The REHP neither issues a stand-alone financial report nor is it included in the report of a public employee retirement system or other entity.
MANSFIELD UNIVERSITY OF PENNSYLVANIA OF THE STATE SYSTEM OF HIGHER EDUCATION
NOTES TO FINANCIAL STATEMENTS JUNE 30, 2017 AND 2016
(43)
NOTE 9 POSTRETIREMENT BENEFITS (CONTINUED)
Retired Employees Health Program (Continued)
Funding Policy
The contribution requirements of plan members covered under collective bargaining agreements are established by the collective bargaining agreements. The contribution requirements of nonrepresented plan members and contributing entities are established and may be amended by the Commonwealth’s Office of Administration and the Governor’s Budget Office. Plan members who enrolled prior to July 1, 2005, are not required to make contributions. Plan members who enrolled after July 1, 2005, contribute a percentage of their final salary, the rate of which varies based on the plan member’s enrollment date. Agency member (employer) contributions are established primarily on a pay-as-you-go basis. In fiscal year 2016/17, the State System contributed $362 for each current active employee per biweekly pay period. The State System made contributions of $31,875,000, $37,026,000, and $30,765,000 for the fiscal years ended June 30, 2017, 2016, and 2015, respectively, which equaled the required contributions for the year. The schedule of funding progress, presented as required supplementary information following the notes to the financial statements, presents multi-year trend information about whether the actuarial value of plan assets is increasing or decreasing over time relative to the actuarial accrued liabilities for benefits.
NOTE 10 PENSION BENEFITS
The University’s employees enroll in one of three available retirement plans upon employment. The Public School Employees’ Retirement System (PSERS) and the Commonwealth of Pennsylvania State Employees’ Retirement System (SERS) are governmental cost-sharing multiple-employer defined benefit plans. The Alternative Retirement Plan (ARP) is a defined contribution plan administered by the State System. Following is the total of the University’s pension liabilities, deferred outflows and deferred inflows of resources related to pensions, and the pension expense for the fiscal year ended June 30, 2017 and 2016.

MANSFIELD UNIVERSITY OF PENNSYLVANIA OF THE STATE SYSTEM OF HIGHER EDUCATION
NOTES TO FINANCIAL STATEMENTS JUNE 30, 2017 AND 2016
(44)
NOTE 10 PENSION BENEFITS (CONTINUED)
2017 2016 2017 2016 2017 2016
Net Pension Liabilities 21,025,003$ 20,807,094$ 1,650,553$ 1,310,431$ 22,675,556$ 22,117,525$
Deferred Outflows of Resources: Difference Between Expected and Actual Experience 303,492$ 421,304$ -$ -$ 303,492$ 421,304$
Net Difference Between Projected and Actual Investment Earnings and Pension Plan Investments 1,766,939 2,118,550 91,996 - 1,858,935 2,118,550
Changes in Assumptions 1,284,250 618,173 59,580 - 1,343,830 618,173
Difference Between Employer Contributions and Proportionate Share of Contributions - - 9,819 10,000 9,819 10,000
Changes in Proportion 326,750 - 46,807 57,991 373,557 57,991
Contributions After the Measurement Date 1,056,602 918,720 118,015 109,237 1,174,617 1,027,957 Total Deferred Outflows of Resources 4,738,033$ 4,076,747$ 326,217$ 177,228$ 5,064,250$ 4,253,975$
Deferred Inflows of Resources Difference Between Expected and Actual Experience 470,412$ -$ 13,755$ 5,407$ 484,167$ 5,407$
Net Difference Between Projected and Actual Investment Earnings and Pension Plan Investments - - - 2,646 - 2,646
Difference Between Employer Contributions and Proportionate Share of Contributions 97,557 57,919 - - 97,557 57,919
Changes in Proportion 445,805 635,219 12,029 - 457,834 635,219 Total Deferred Inflows of Resources 1,013,774$ 693,138$ 25,784$ 8,053$ 1,039,558$ 701,191$
Contributions Recognized by Pension Plans 1,735,926$ 1,557,682$ 118,015$ 109,237$ 1,853,941$ 1,666,919$
Pension Expense SERS and PSERS 1,613,187$ 1,817,003$ 508,982$ 26,136$ 2,122,169$ 1,843,139$ ARP 1,472,667 1,505,321Total Pension Expense 3,594,836$ 3,348,460$
SERS PSERS Total
The University will recognize the $1,056,602 reported as 2017 SERS deferred outflows of resources resulting from pension contributions after the measurement date, and the $118,015 reported as 2017 PSERS deferred outflows of resources resulting from pension contributions after the measurement date, as reductions of the respective net pension liabilities in the year ended June 30, 2018. Other amounts reported as deferred outflows of resources and deferred inflows of resources related to pensions will be recognized in pension expense as follows:

MANSFIELD UNIVERSITY OF PENNSYLVANIA OF THE STATE SYSTEM OF HIGHER EDUCATION
NOTES TO FINANCIAL STATEMENTS JUNE 30, 2017 AND 2016
(45)
NOTE 10 PENSION BENEFITS (CONTINUED)
Year Ending June 30, SERS PSERS2018 $ 834,284 $ 44,677 2019 834,284 44,677 2020 727,233 60,795 2021 241,700 32,269 2022 30,156 - Total $ 2,667,657 $ 182,418
Amortization
SERS
Plan Description
SERS is the administrator of a cost-sharing multiple-employer defined benefit plan established by the Commonwealth to provide pension benefits for employees of state government and certain independent agencies. SERS is a component unit of the Commonwealth and is included in the Commonwealth’s financial report as a pension trust fund. Membership in SERS is mandatory for most state employees. Members and employees of the General Assembly, certain elected or appointed officials in the executive branch, department heads, and certain employees in the field of education are not required, but are given the option, to participate. SERS issues a publicly available annual financial report that includes financial statements and required supplementary information for the plan. A copy of the report may be obtained from the SERS website at www.sers.state.pa.us. Benefits Provided
SERS provides retirement, death, and disability benefits. Article II of the Commonwealth’s Constitution assigns the authority to establish and amend the benefit provision of the plan to the General Assembly. Cost of Living Adjustments (COLA) are provided ad hoc at the discretion of the General Assembly. Employees who were hired prior to January 1, 2011, and retire at age 60 with three years of service, or with 35 years of service if under age 60, are entitled to a normal annual retirement benefit; members of the General Assembly and certain employees classified in hazardous duty positions can retire with full benefits at age 50 with at least three years of service. Act 120 of 2010 (Act 120) preserved all benefits in place for members, but mandated a number of benefit reductions for new members effective January 1, 2011. The benefit reduction included a new class of membership that accrues benefits at 2% of members’ final average salary instead of the previous 2.5%. The new vesting period changed from 5 to 10 years of credited service, and the option to withdraw lump-sum accumulated deductions was eliminated. The new normal retirement age is 65 for most employees and 55 for members of the General Assembly and certain employees classified in hazardous duty positions. According to the State Employees’ Retirement Code (SERC), all obligations of SERS will be assumed by the Commonwealth should SERS terminate.

MANSFIELD UNIVERSITY OF PENNSYLVANIA OF THE STATE SYSTEM OF HIGHER EDUCATION
NOTES TO FINANCIAL STATEMENTS JUNE 30, 2017 AND 2016
(46)
NOTE 10 PENSION BENEFITS (CONTINUED)
SERS (Continued)
Contributions
The contribution rate for both active members and the State System depends upon when the active member was hired and what benefits class was selected. Section 5507 of the SERC (71 Pa. C.S. §5507) requires the Commonwealth and other employers whose employees are SERS members to make contributions to the fund on behalf of all active members and annuitants necessary to fund the liabilities and provide the annuity reserves required to pay benefits. SERS funding policy, as set by the SERS Board, provides for periodic active member contributions at statutory rates. The SERS funding policy also provides for periodic employer contributions at actuarially determined rates based on SERS’ funding valuation, expressed as a percentage of annual retirement covered payroll, such that the employer contributions, along with employee contributions and an actuarially determined rate of investment return, are adequate to accumulate assets to pay benefits when due. Act 120, however, imposed rate increase collars (limits on annual rate increases) on employer contributions. The collar for fiscal year 2015/16 was 4.5% and will no longer apply effective July 1, 2017. The University contributed at actuarially determined rates of between 20.70% and 29.95% of active members’ annual covered payroll at June 30, 2017. The University’s contributions to SERS for the years ended June 30, 2017, 2016, and 2015, were $1,735,926, $1,557,682, and $1,387,280, respectively, equal to the required contractual contribution. Contribution rates for most active members is 6.25% of gross salary. The contribution rate for other members ranges between 5% and 9.3% of salary depending upon when the member was hired and what class of membership was elected. Assumptions
The total SERS pension liabilities used to calculate the net pension liabilities were determined by actuarial valuations as of December 31, 2016, using the following actuarial assumptions, applied to all periods included in the measurement:
Entry age actuarial cost method.
Straight-line amortization of investments over five years and amortization of assumption changes and noninvestment gains/losses over the average expected remaining service lives of all employees that are provided benefits.
Inflation of 2.60%.
Investment return of 7.25%, net of expenses and including inflation.
Salary increases based on an effective average of 5.60%, with a range of 3.70% to 8.90%, including inflation.
Asset valuation using fair (market) value.
Mortality rates based on the projected RP-2000 Mortality Tables, adjusted for actual plan experience and future improvement.
Ad hoc cost of living adjustments (COLAs).

MANSFIELD UNIVERSITY OF PENNSYLVANIA OF THE STATE SYSTEM OF HIGHER EDUCATION
NOTES TO FINANCIAL STATEMENTS JUNE 30, 2017 AND 2016
(47)
NOTE 10 PENSION BENEFITS (CONTINUED)
SERS (Continued)
Assumptions (Continued)
Some of the methods and assumptions mentioned above are based on the 18th Investigation of Actuarial Experience, an actuarial experience study conducted by SERS to determine whether the assumptions used in its annual actuarial valuations remain accurate based on current and anticipated demographic trends and economic conditions. Published in March 2016, it analyzed experience from 2011 through 2015. The actuary, under oversight of the SERS Board, reviewed economic assumptions (such as the assumed future investment returns and salary increases) as well as demographic assumptions (such as employee turnover, retirement, disability, and death rates). Some assumption adjustments increased projected cost and some decreased projected cost, but the overall result was a slight increase in the net pension liability. The long-term expected real rate of return on pension plan investments was determined using a building-block method in which best-estimate ranges of expected future real rates of return (expected returns, net of pension plan investment expense and inflation) are developed for each major asset class. These ranges are combined to produce the long-term expected rate of return by weighting the expected future real rates of return by the target asset allocation percentage and by adding expected inflation. Best estimates of arithmetic real rates of return for each major asset class included in SERS’ current and target asset allocation as of December 31, 2016 and 2015 are summarized below:
Long-TermTarget Expected Real
Asset Class Allocation Rate of ReturnPrivate Equity 16.0 % 8.00 %Global Public Equity 43.0 5.30Real Assets 12.0 5.44Hedge Funds 12.0 4.75Fixed Income 14.0 1.63
Cash 3.0 (0.25)Total 100.0 %
Long-TermTarget Expected Real
Asset Class Allocation Rate of ReturnAlternative Investments 15.0 % 8.50 %Global Public Equity 40.0 5.40
Real Assets 17.0 4.95Diversifying Assets 10.0 5.00Fixed Income 15.0 1.50Liquidity Reserve 3.0 -
Total 100.0 %
December 31, 2016
December 31, 2015

MANSFIELD UNIVERSITY OF PENNSYLVANIA OF THE STATE SYSTEM OF HIGHER EDUCATION
NOTES TO FINANCIAL STATEMENTS JUNE 30, 2017 AND 2016
(48)
NOTE 10 PENSION BENEFITS (CONTINUED)
SERS (Continued)
Assumptions (Continued)
The discount rate used to measure the total SERS pension liability was 7.25% as of December 31, 2016, and 7.50% as of December 31, 2015. The projection of cash flows used to determine the discount rate assumed that employee contributions will be made at the rates applicable for each member and that employer contributions will be made based on rates determined by the actuary. Based on those assumptions, SERS’ fiduciary net position was projected to be available to make all projected future benefit payments of current and nonactive SERS members. Therefore, the long-term expected rate of return on SERS’ investments was applied to all periods of projected benefit payments to determine the total pension liability.
The following presents the OC’s proportionate share of the SERS net pension liability calculated using the discount rate of 7.25% as of December 31, 2016 and 7.50% as of December 31, 2015, as well as what the SERS net pension liability would be if it were calculated using a discount rate that is one percentage point lower (6.25% in 2016 and 6.50% in 2015) or one percentage point higher (8.25% in 2016 and 8.50% in 2015) than the current rate:
1% Decrease Current Rate 1% Increase6.25% 7.25% 8.25%
2016 26,019$ 21,025$ 16,748$
6.50% 7.50% 8.50%2015 25,846$ 20,807$ 16,486$
Sensitivity of the University's Proportionate Share of the SERS Net Pension Liability to Changes in the Discount Rate (in thousands)
Fiduciary Net Position
The fiduciary net positions of SERS, as well as additions to and deductions from SERS fiduciary net positions, have been determined on the same basis as they are reported in the SERS financial statements, which can be found at www.sers.state.pa.us. The plan schedules of SERS are prepared using the accrual basis of accounting and economic resources measurement focus in accordance with U.S. GAAP as prescribed by GASB. Plan member contributions are recognized in the period in which the contributions are due. Employer contributions are recognized when due and the employer has a legal requirement to provide the contributions. Benefits and refunds are recognized when due and payable in accordance with the terms of the plan. Investment purchases and sales are recorded on a trade-date basis. Detailed information on investment valuation can be found in the SERS financial statements. Management of SERS has made certain estimates and assumptions relating to employer allocation schedules, and actual results could differ.

MANSFIELD UNIVERSITY OF PENNSYLVANIA OF THE STATE SYSTEM OF HIGHER EDUCATION
NOTES TO FINANCIAL STATEMENTS JUNE 30, 2017 AND 2016
(49)
NOTE 10 PENSION BENEFITS (CONTINUED)
SERS (Continued)
Pension Liabilities, Pension Expense, and Deferred Outflows of Resources and Deferred Inflows of Resources Related to Pensions
At June 30, 2017, the amount recognized as the University’s proportionate share of the SERS net pension liability, measured at December 31, 2016 was $21,025,003. At June 30, 2016, the amount recognized as the University’s proportionate share of the SERS net pension liability, measured at December 31, 2015 was $20,807,094. The allocation percentage assigned to each participating employer is based on a projected-contribution method. For the allocation of the 2016 amounts, this methodology applies the most recently calculated contribution rates for fiscal year 2017/18 from the December 31, 2016 funding valuation to the expected funding payroll. For the allocation of the 2015 amounts this methodology applies the most recently calculated contribution rates for fiscal year 2016/17 from the December 31, 2015 funding valuation to the expected funding payroll. At December 31, 2016, the State System’s proportion was 4.837% a decrease of 0.12% from its proportion calculated as of December 31, 2015, measurement date.
PSERS
Plan Description
PSERS is a governmental cost-sharing multiple-employer defined benefit pension plan that provides retirement, disability, and death benefits to public University employees of the Commonwealth. The members eligible to participate in PSERS include all full-time public University employees, part-time hourly public University employees who render at least 500 hours of service in the University year, and part-time per diem public University employees who render at least 80 days of service in the University year in any of the reporting entities in Pennsylvania. The Public University Employees’ Retirement Code (Act No. 96 of October 2, 1975, as amended) (24 Pa. C.S. §§8101–9102) (the Code) is the authority by which PSERS benefits provisions and contribution requirements are established and may be amended. The Code requires contributions by active members, the employer (State System), and the Commonwealth of Pennsylvania. PSERS is a component unit of the Commonwealth and is included in the Commonwealth’s financial report as a pension trust fund. PSERS issues a comprehensive annual financial report that includes financial statements and required supplementary information for the plan. A copy of the report may be obtained from the PSERS website at www.psers.state.pa.us.

MANSFIELD UNIVERSITY OF PENNSYLVANIA OF THE STATE SYSTEM OF HIGHER EDUCATION
NOTES TO FINANCIAL STATEMENTS JUNE 30, 2017 AND 2016
(50)
NOTE 10 PENSION BENEFITS (CONTINUED)
PSERS (Continued)
Benefits Provided
Members who joined prior to July 1, 2011, are eligible for monthly retirement benefits upon reaching age 62 with at least one year of credited service, age 60 with 30 or more years of credited service, or any age with 35 or more years of service. Act 120 preserved the benefits of members who joined prior to July 1, 2011, and introduced benefit reductions for individuals who become new members on or after July 1, 2011, by creating two new membership classes: Class T-E and Class T-F. To qualify for normal retirement, Class T-E and Class T-F members must complete a minimum of 35 years of service with a combination of age and service that totals 92 or greater, or they must work until age 65 with a minimum of three years of service. Depending upon membership class, benefits are generally 2% or 2.5% of the member’s final average salary (as defined in the Code) multiplied by the number of years of credited service. Members who joined prior to July 1, 2011, vest after completion of five years of service and may elect early retirement benefits. Class T-E and Class T-F members vest after completion of 10 years of service. Participants are eligible for disability retirement benefits after completion of five years of credited service. Such benefits are generally equal to 2% or 2.5%, depending upon membership class, of the member’s final average salary (as defined in the Code) multiplied by the number of years of credited service, but not less than one-third of such salary nor greater than the benefit the member would have had at normal retirement age. Members over normal retirement age may apply for disability benefits. Death benefits are payable upon the death of an active member who has reached age 62 with at least one year of credited service (age 65 with at least three years of credited service for Class T-E and Class T-F members) or has at least five years of credited service (10 years for Class T-E and Class T-F members). Such benefits are actuarially equivalent to the benefit that would have been effective if the member had retired on the day before death. Member Contributions
Active members who joined PSERS prior to July 22, 1983, contribute at 5.25% (Class T-C members) or at 6.50% (Class T-D members) of the member’s qualifying compensation. Members who joined PSERS on or after July 22, 1983, and who were active or inactive as of July 1, 2001, contribute at 6.25% (Class T-C) or at 7.5% (Class T-D) of the member’s qualifying compensation. Members who joined PSERS after June 30, 2001, and before July 1, 2011, contribute at 7.5% (Class T-D). For these hires and for members who elected Class T-D, the 7.5% contribution rate began with service rendered on or after January 1, 2002. Members who joined PSERS after June 30, 2011, contribute at the rate of 7.5% (Class T-E) or 10.3% (Class T-F) of their qualifying compensation. Class T-E and Class T-F members are subject to a “shared risk” provision in Act 120 that could cause the rate in future years to fluctuate between 7.5% and 9.5% for Class T-E and 10.3% and 12.3% for Class T-F.

MANSFIELD UNIVERSITY OF PENNSYLVANIA OF THE STATE SYSTEM OF HIGHER EDUCATION
NOTES TO FINANCIAL STATEMENTS JUNE 30, 2017 AND 2016
(51)
NOTE 10 PENSION BENEFITS (CONTINUED)
PSERS (Continued)
Employer Contributions
The University’s contractually required contribution rate for PSERS for fiscal year ended June 30, 2017, was 29.2% of covered payroll, actuarially determined as an amount that, when combined with employee contributions, is expected to finance the costs of benefits earned by employees during the year, with an additional amount to finance any unfunded accrued liability. Per §8327 of the Code, the Commonwealth is required to contribute 50% of the contribution rate directly to PSERS on behalf of the State System, meaning that the amount that the State System actually contributed was 14.6% of covered payroll. The University’s contributions to PSERS for the year ending June 30, 2017, June 30, 2016, and June 30, 2015 was $118,015, $109,237 and $76,933, respectively, equal to the required contractual contribution. Actuarial Assumptions
The total PSERS pension liability as of June 30, 2016, was determined by rolling forward PSERS’ total pension liability as of the June 30, 2015, actuarial valuation to June 30, 2016, using the following actuarial assumptions, applied to all periods included in the measurement:
Actuarial cost method is entry age normal, level percent of pay.
Inflation of 2.75%.
Investment return of 7.25%, including inflation.
Salary increases based on an effective average of 5.0%, which reflects a 2.75% allowance for inflation, and 2.25% for real wage growth and merit or seniority increases.
Mortality rates based on the RP-2000 Combined Healthy Annuitant Tables (male and female) with age set back three years for both males and females; for disabled annuitants, the RP-2000 Combined Disabled Tables (male and female) with age set back seven years for males and three years for females.
The actuarial assumptions used in the June 30, 2016, valuation were based on the experience study that was performed for the five-year period ending June 30, 2015. The recommended assumption changes based on this experience study were adopted by the PSERS board of trustees at its June 10, 2016 meeting and were effective beginning with the June 30, 2016, actuarial valuation. The long-term expected rate of return on pension plan investments was determined using a building-block method in which best-estimate ranges of expected future real rates of return (expected returns, net of pension plan investment expense and inflation) are developed for each major asset class. These ranges are combined to produce the long-term expected rate of return by weighting the expected future real rates of return by the target asset allocation percentage and by adding expected inflation.

MANSFIELD UNIVERSITY OF PENNSYLVANIA OF THE STATE SYSTEM OF HIGHER EDUCATION
NOTES TO FINANCIAL STATEMENTS JUNE 30, 2017 AND 2016
(52)
NOTE 10 PENSION BENEFITS (CONTINUED)
PSERS (Continued)
Actuarial Assumptions (Continued)
PSERS’ policy in regard to the allocation of invested plan assets is established and may be amended by the PSERS board of trustees. Plan assets are managed with a long-term objective of achieving and maintaining a fully funded status for the benefits provided through the pension. Following is the PSERS board of trustees’ adopted asset allocation policy and best estimates of geometric real rates of return for each major asset class as of June 30, 2016 and 2015, respectively:
Long-TermTarget Expected Real
Asset Class Allocation Rate of ReturnGlobal Public Equity 22.50 % 5.3 %
Fixed Income 28.5 2.1Commodities 8.0 2.5Absolute Return 10.0 3.3Risk Parity 10.0 3.9Infrastructure/MLPs 5.0 4.8Real Estate 12.0 4.0Alternative Investments 15.0 6.6Cash 3.0 0.2Financing (LIBOR) (14.0) 0.5
Total 100.00 %
Long-TermTarget Expected Real
Asset Class Allocation Rate of ReturnPublic Markets Global Equity 22.50 % 4.80 %Private Markets (Equity) 15.0 6.60Private Real Estate 12.0 4.50Global Fixed Income 7.5 2.40
U.S. Long Treasuries 3.0 1.40TIPS 12.0 1.10High-Yield Bonds 6.0 3.30Cash 3.0 0.70Absolute Return 10.0 4.90
Risk Parity 10.0 3.70MLPs/Infrastructure 5.0 5.20Commodities 8.0 3.10Financing (LIBOR) (14.0) 1.10
Total 100.00 %
June 30, 2016
June 30, 2015

MANSFIELD UNIVERSITY OF PENNSYLVANIA OF THE STATE SYSTEM OF HIGHER EDUCATION
NOTES TO FINANCIAL STATEMENTS JUNE 30, 2017 AND 2016
(53)
NOTE 10 PENSION BENEFITS (CONTINUED)
PSERS (Continued) Actuarial Assumptions (Continued)
The discount rate used to measure the total PSERS pension liability was 7.25% as of June 30, 2016 and 7.50% as of June 30, 2015. The projection of cash flows used to determine the discount rate assumed that contributions from plan members will be made at the current contribution rate and that contributions from employers will be made at contractually required rates, actuarially determined.
Based on those assumptions, PSERS’ fiduciary net position was projected to be available to make all projected future benefit payments of current plan members. Therefore, the long-term expected rate of return on PSERS’ investments was applied to all periods of projected benefit payments to determine the total pension liability. The following presents the University’s proportionate share of the PSERS net pension liability calculated using the discount rate of 7.25%, as well as what the PSERS net pension liability would be if it were calculated using a discount rate that is one percentage point lower (6.25%) or one percentage point higher (8.25%) than the current rate:
1% Decrease Current Rate 1% Increase6.25% 7.25% 8.25%
2016 2,019$ 1,651$ 1,341$
6.50% 7.50% 8.50%
2015 1,615$ 1,310$ 1,054$
PSERS Net Pension Liability to Changes in the Discount Rate (in thousands)Sensitivity of the University's Proportionate Share of the
Fiduciary Net Position
For purposes of measuring the net pension liability, deferred outflows of resources, and deferred inflows of resources related to pensions and pension expense, the fiduciary net position of PSERS and additions to or deductions from PSERS’s fiduciary net position have been determined on the same basis as they are reported in the PSERS’s financial statements. For this purpose, benefit payments, including refunds of employee contributions, are recognized when due and payable in accordance with the benefit terms. Investments are reported at fair value. Detailed information about PSERS’ fiduciary net position is available in the PSERS Comprehensive Annual Financial Report, which can be found at www.psers.state.pa.us.

MANSFIELD UNIVERSITY OF PENNSYLVANIA OF THE STATE SYSTEM OF HIGHER EDUCATION
NOTES TO FINANCIAL STATEMENTS JUNE 30, 2017 AND 2016
(54)
NOTE 10 PENSION BENEFITS (CONTINUED)
PSERS (Continued) Pension Liabilities, Pension Expense, and Deferred Outflows of Resources and Deferred Inflows of Resources Related to Pensions
At June 30, 2017 and 2016, the amount recognized as the University’s proportionate share of the PSERS net pension liability, plus the related PSERS pension support provided by the Commonwealth, is as follows:
2017 2016
Total PSERS Net Pension Liability Associated with the University 3,301,106$ 2,620,862$
Commonwealth's Proportionate Share of the PSERS Net Pension Liability Pension Liability (1,650,553) (1,310,431)
University's Proportionate Share of the PSERS Net Pension Liability 1,650,553$ 1,310,431$
At June 30, 2017 and 2016, PSERS measured the net pension liability as of June 30, 2016 and June 30, 2015, respectively. At June 30, 2017 and 2016, the total PSERS pension liability used to calculate the net pension liability was determined by rolling forward the total pension liability calculated as of June 30, 2015, to June 30, 2016 and June 30, 2014, to June 30, 2015, respectively. PSERS calculated the employer’s proportion of the net pension liability using the employer’s one-year reported covered payroll in relation to all participating employers’ one-year reported covered payroll. At June 30, 2016, the State System’s proportion was 0.1833% an increase of 0.0019% from its proportion calculated as of June 30, 2015.
ARP
The ARP is a defined contribution plan administered by the State System. Benefits equal amounts contributed to the plan plus investment earnings. Act 188 empowers the board to establish and amend benefits provisions. The State Employees’ Retirement Code establishes the employer contribution rate for the ARP, while the board establishes the employee contribution rates. Active members contribute at a rate of 5% of their qualifying compensation. The State System recognizes annual pension expenditures equal to its contractually required contributions to the plan. The State System’s contribution rate on June 30, 2017 and 2016 was 9.29% of qualifying compensation. The contributions to the ARP for the years ended June 30, 2017 and 2016, were $1,472,667 and $1,505,321, respectively, from the University; and $720,000 and $726,000, respectively, from active members. No liability is recognized for the ARP.

MANSFIELD UNIVERSITY OF PENNSYLVANIA OF THE STATE SYSTEM OF HIGHER EDUCATION
NOTES TO FINANCIAL STATEMENTS JUNE 30, 2017 AND 2016
(55)
NOTE 11 WORKERS’ COMPENSATION
The University participates in the State System’s self-insured workers’ compensation plan. For claims occurring prior to July 1, 1995 the University must pay up to $100,000; for claims occurring on or after July 1, 1995 the University must pay up to $200,000. Claims in excess of the self-insurance limits are funded through the Workers’ Compensation Collective Reserve Fund (Reserve Fund), to which the University contributes an amount determined by an independent actuarial study. Based on updated actuarial studies, the University was given a refund of $2,565 from the Reserve Fund during the year ended June 30, 2017, and contributed $47,856, and $12,053 to the Reserve Fund during the years ended June 30, 2017 and 2016, respectively. Changes in the aggregate liability for claims under the self-insurance limit were as follows:
2017 2016 2015Balance - July 1 190,839$ 212,287$ 269,313$ Current Year Claims and Changes in Estimates 47,103 - 39,778 Payments - (21,448) (96,804) Balance - June 30 237,942$ 190,839$ 212,287$
NOTE 12 COMMITMENTS AND CONTINGENCIES
General
The nature of the education industry is such that, from time-to-time, the University is exposed to various risks of loss related to torts; alleged negligence; acts of discrimination; breach of contract; labor disputes; disagreements arising from the interpretation of laws or regulations; theft of, damage to and destruction of assets; errors and omissions; injuries to employees and natural disasters. While some of these claims may be for substantial amounts, they are not unusual in the ordinary course of providing educational services in a higher education system. The University is self-insured for workers' compensation up to stated limits (Note 11). For all other risks of loss, the University pays annual premiums to the Commonwealth to participate in its Risk Management Program. The University does not participate in any public entity risk pools, and does not retain risk related to any aforementioned exposure, except for those amounts incurred relative to policy deductibles that are not significant. The University has not reduced significantly any of its insurance coverage from the prior year. Settled claims have not significantly exceeded the University’s commercial coverage in any of the past three years. It is not expected that the resolution of any outstanding claims and litigation will have a material adverse effect on the accompanying financial statements. The University receives support from federal and Commonwealth grant programs. Entitlement to the resources requires compliance with terms of the grant agreements and applicable regulations, including the expenditure of the resources for eligible purposes. Substantially all grants are subject to financial and compliance audits by the grantors. Such audits could lead to reimbursement to the grantor agencies. The University’s management believes disallowances, if any, will be immaterial.
MANSFIELD UNIVERSITY OF PENNSYLVANIA OF THE STATE SYSTEM OF HIGHER EDUCATION
NOTES TO FINANCIAL STATEMENTS JUNE 30, 2017 AND 2016
(56)
NOTE 12 COMMITMENTS AND CONTINGENCIES (CONTINUED)
Construction Commitments
Authorized expenditures for construction projects unexpended as of June 30, 2017 and 2016 were approximately $37,000 and $-0-, respectively.
NOTE 13 RATINGS ACTIONS
The State System’s outstanding bonds are assigned an Aa3 rating from Moody’s Investors Service, Inc. and an AA- rating from Fitch Ratings. In August 2017, both Moody’s and Fitch revised the outlook for the rating from stable to negative.
NOTE 14 GOING CONCERN CONSIDERATIONS
As shown in the accompanying financial statements, the University has suffered recurring net losses of $4.5M and $7.2M, respectively, and positive cash flow of $2.2M and negative cash flow of $6.1M, respectively, during the years ended June 30, 2017 and 2016. The fiscal year 2016/17 total net loss includes a nonrecurring loss of $9.7M related to the acquisition of student housing facilities. The University also has a negative unrestricted net position of $53.0M and a negative total net position of $46.2M as of June 30, 2017. Although there was slight improvement in cash flow during fiscal year 2016/17, over the last five years, the University’s Education & General (E&G) cash has decreased by $9.6 million, or nearly 55%, from $17.5 million at June 30, 2013, to $7.9 million at June 30, 2017. Auxiliary cash has decreased by $1.0 million, or more than 10%, from $9.8 million at June 30, 2013, to $8.8 million at June 30, 2017. In fiscal year 2016/17, E&G unrestricted operating and plant expenditures were $1.4 million more than revenue, an improvement from $5.8M in fiscal year 2015/16, while Auxiliary unrestricted operating and plant expenditures were $0.4 million more than revenue, an improvement from $1.9M in fiscal year 2015/16. The decline in cash, as well as the deficits in current year operations, can be primarily attributed to Mansfield’s steadily declining enrollment. As cash flow weaknesses can seriously threaten financial viability, the Office of the Chancellor has been working with Mansfield University to closely monitor its cash flows. The declining enrollment, as well as the impact of the new labor contract terms, could cause further financial erosion creating uncertainty about the University’s ability to continue as a going concern. Currently, the ability of the University to continue as a going concern is dependent on management’s plans to reverse or slow the trends of declining enrollment, negative cash flow, and annual deficits. The financial statements do not include any adjustments that might be necessary if the University is unable to continue as a going concern.

MANSFIELD UNIVERSITY OF PENNSYLVANIA OF THE STATE SYSTEM OF HIGHER EDUCATION
NOTES TO FINANCIAL STATEMENTS JUNE 30, 2017 AND 2016
(57)
NOTE 14 GOING CONCERN CONSIDERATIONS (CONTINUED)
Management’s Plans - Management noted that Mansfield University has recently slowed the pace of the negative financial trend that the University has experienced over the last several fiscal years. The priority of the current administration is to continue to focus on student success. As such, the administration remains committed to continuing to reverse the negative financial trend and the declining enrollment to ensure the University remains financially viable. The Administration plans to take the following steps to address the decline in enrollment and stabilize the financial position of the University:
Review the current per credit tuition pilot program and its impact on revenue, enrollment, student debt, University receivables, and marketability within the region and to all prospective students.
Review the current tuition pilots and their impact on revenue, enrollment,
retention, financial aid priorities, and marketability within the region and to all prospective students. Examine the impact of moving to a simplified rate structure.
Develop a strategic enrollment management plan that is designed to allow the
University to make evidence-based decisions about where and how we intend to experience growth.
The University will continue to review the organizational structure, examine all
open positions, delay hiring when feasible, and eliminate all unnecessary operating expenses.
The University will continue to look for innovative ways to increase our
marketability and highlight our program offerings to meet the demands of our ever changing environment.
The University has implemented a partnership with Bloomsburg University to
provide its Human Resources and Payroll services; we will continue to evaluate the opportunity for shared services arrangements with other PASSHE institutions as we continue to make progress toward further fiscal sustainability.

MANSFIELD UNIVERSITY OF PENNSYLVANIA OF THE STATE SYSTEM OF HIGHER EDUCATION
NOTES TO FINANCIAL STATEMENTS JUNE 30, 2017 AND 2016
(58)
NOTE 15 SUBSEQUENT EVENTS
Cheyney University Loan Forgiveness
On August 22, 2017, the Board of Governors approved a motion to forgive $34.4 million in loans made to Cheyney University of Pennsylvania (Cheyney University or Cheyney) from the 13 other State System universities and the Office of the Chancellor, provided that Cheyney meets certain conditions that hold Cheyney accountable for operating within the available financial resources. One-third will be forgiven if Cheyney reduces $7.5 million of annual expenses from its fiscal year 2017/18 current operations and maintains a balanced budget of revenues greater than or equal to annual expenses in fiscal year 2018/19. One-third will be forgiven when Cheyney maintains a balanced budget of revenues greater than or equal to annual expenses in fiscal year 2019/20, and the remaining third will be forgiven when Cheyney maintains a balanced budget of revenues greater than or equal to annual expenses in fiscal year 2020/21.
Cheyney University has been borrowing the funds under a line-of-credit arrangement from the State System’s pooled investment account since fiscal year 2013/14. The loans have been shown only at the consolidated State System financial statements level, as a reduction of the pooled investment account, since the expectation has been that Cheyney would repay the loans and the individual universities would not be affected. Mansfield University will record its share of the expense and reduction of the pooled investments account only as the loan forgiveness conditions are met. An allocation of the loan forgiveness to each of the universities has not been finalized, and Mansfield University’s share of the liability is unknown.
Information regarding Cheyney’s financial condition and other factors that may affect Cheyney’s ability to meet the loan forgiveness conditions are described in the State System’s consolidated financial statements, which are available at the State System’s website, http://www.passhe.edu/inside/anf/accounting/Pages/Financial-Statements.aspx, and in Cheyney University’s financial statements, which are available by contacting the University at 1837 University Circle, Cheyney, PA, 19319.
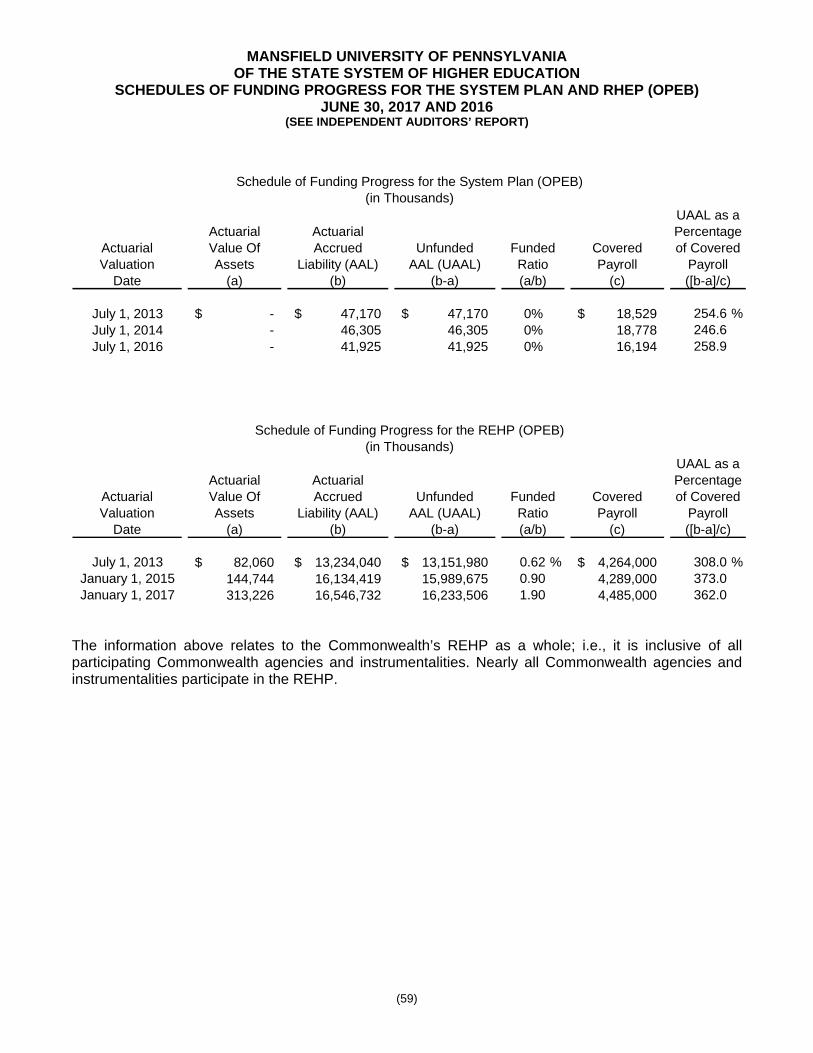
MANSFIELD UNIVERSITY OF PENNSYLVANIA OF THE STATE SYSTEM OF HIGHER EDUCATION
SCHEDULES OF FUNDING PROGRESS FOR THE SYSTEM PLAN AND RHEP (OPEB) JUNE 30, 2017 AND 2016
(SEE INDEPENDENT AUDITORS’ REPORT)
(59)
UAAL as aActuarial Actuarial Percentage
Actuarial Value Of Accrued Unfunded Funded Covered of CoveredValuation Assets Liability (AAL) AAL (UAAL) Ratio Payroll Payroll
Date (a) (b) (b-a) (a/b) (c) ([b-a]/c)
July 1, 2013 -$ 47,170$ 47,170$ 0% 18,529$ 254.6 %July 1, 2014 - 46,305 46,305 0% 18,778 246.6July 1, 2016 - 41,925 41,925 0% 16,194 258.9
Schedule of Funding Progress for the System Plan (OPEB)(in Thousands)
UAAL as aActuarial Actuarial Percentage
Actuarial Value Of Accrued Unfunded Funded Covered of CoveredValuation Assets Liability (AAL) AAL (UAAL) Ratio Payroll Payroll
Date (a) (b) (b-a) (a/b) (c) ([b-a]/c)
July 1, 2013 82,060$ 13,234,040$ 13,151,980$ 0.62 % 4,264,000$ 308.0 %January 1, 2015 144,744 16,134,419 15,989,675 0.90 4,289,000 373.0January 1, 2017 313,226 16,546,732 16,233,506 1.90 4,485,000 362.0
Schedule of Funding Progress for the REHP (OPEB)(in Thousands)
The information above relates to the Commonwealth’s REHP as a whole; i.e., it is inclusive of all participating Commonwealth agencies and instrumentalities. Nearly all Commonwealth agencies and instrumentalities participate in the REHP.
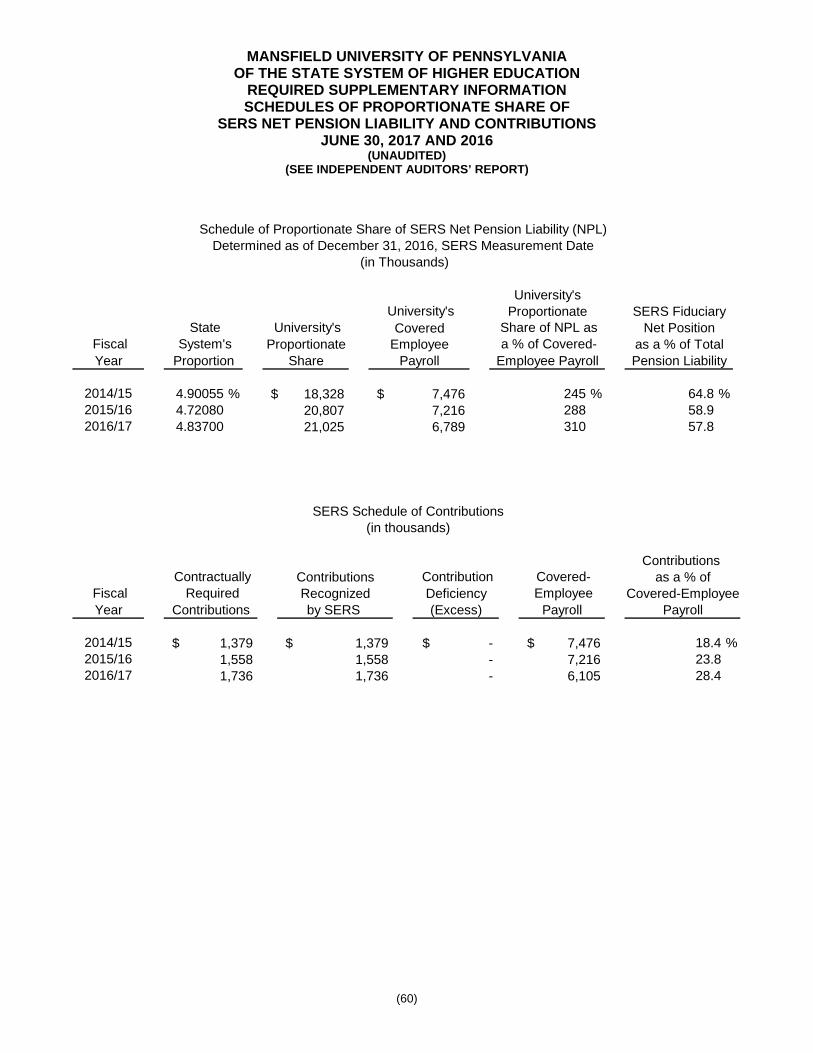
MANSFIELD UNIVERSITY OF PENNSYLVANIA OF THE STATE SYSTEM OF HIGHER EDUCATION
REQUIRED SUPPLEMENTARY INFORMATION SCHEDULES OF PROPORTIONATE SHARE OF
SERS NET PENSION LIABILITY AND CONTRIBUTIONS JUNE 30, 2017 AND 2016
(UNAUDITED) (SEE INDEPENDENT AUDITORS’ REPORT)
(60)
University'sUniversity's Proportionate SERS Fiduciary
State University's Covered Share of NPL as Net Position Fiscal System's Proportionate Employee a % of Covered- as a % of TotalYear Proportion Share Payroll Employee Payroll Pension Liability
2014/15 4.90055 % $ 18,328 $ 7,476 245 % 64.8 %2015/16 4.72080 20,807 7,216 288 58.92016/17 4.83700 21,025 6,789 310 57.8
Schedule of Proportionate Share of SERS Net Pension Liability (NPL)Determined as of December 31, 2016, SERS Measurement Date
(in Thousands)
Contributions Contractually Contributions Contribution Covered- as a % of
Fiscal Required Recognized Deficiency Employee Covered-EmployeeYear Contributions by SERS (Excess) Payroll Payroll
2014/15 $ 1,379 $ 1,379 $ - $ 7,476 18.4 %2015/16 1,558 1,558 - 7,216 23.82016/17 1,736 1,736 - 6,105 28.4
SERS Schedule of Contributions (in thousands)
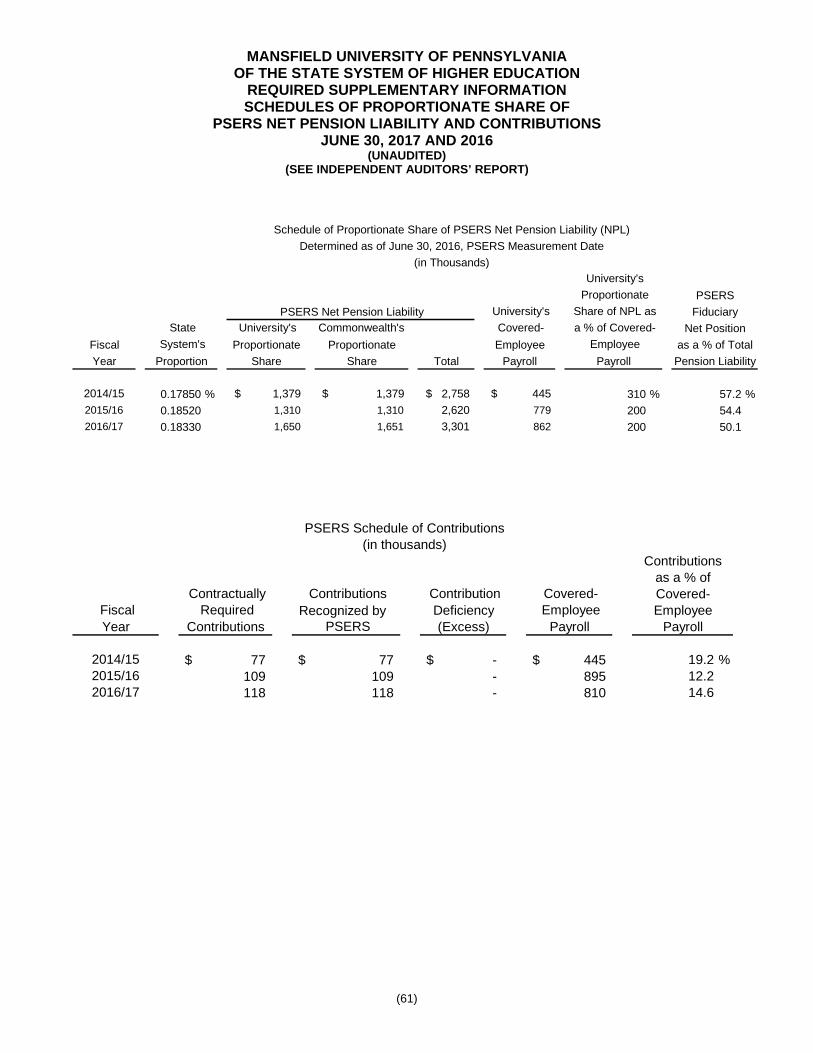
MANSFIELD UNIVERSITY OF PENNSYLVANIA OF THE STATE SYSTEM OF HIGHER EDUCATION
REQUIRED SUPPLEMENTARY INFORMATION SCHEDULES OF PROPORTIONATE SHARE OF
PSERS NET PENSION LIABILITY AND CONTRIBUTIONS JUNE 30, 2017 AND 2016
(UNAUDITED) (SEE INDEPENDENT AUDITORS’ REPORT)
(61)
University's
Proportionate PSERS University's Share of NPL as Fiduciary
State University's Commonwealth's Covered- a % of Covered- Net Position
Fiscal System's Proportionate Proportionate Employee Employee as a % of Total
Year Proportion Share Share Total Payroll Payroll Pension Liability
2014/15 0.17850 % $ 1,379 $ 1,379 $ 2,758 $ 445 310 % 57.2 %2015/16 0.18520 1,310 1,310 2,620 779 200 54.42016/17 0.18330 1,650 1,651 3,301 862 200 50.1
Schedule of Proportionate Share of PSERS Net Pension Liability (NPL)
Determined as of June 30, 2016, PSERS Measurement Date
(in Thousands)
PSERS Net Pension Liability
Contributionsas a % of
Contractually Contributions Contribution Covered- Covered- Fiscal Required Recognized by Deficiency Employee EmployeeYear Contributions PSERS (Excess) Payroll Payroll
2014/15 $ 77 $ 77 $ - $ 445 19.2 %2015/16 109 109 - 895 12.22016/17 118 118 - 810 14.6
PSERS Schedule of Contributions (in thousands)

Investment advisory services are offered through CliftonLarsonAllen Wealth Advisors, LLC, an SEC‐registered investment advisor.