manual pro 44
TRANSCRIPT

Interactive Voting System
ww
w.iv
syst
em.n
l
IVS-BasicIVS-Professional 4.4


Manual
IVS-Basic 4.4
IVS-Professional 4.4
1213

4
Interactive Voting System
The Interactive Voting System (IVS®) is an interactive means of making presentations and improving communication in all types of groups. It facilitates contact between speakers and listeners. The listener is able to react to the speaker and the speaker is able to respond in turn, thus creating an interaction. In this way, the passive listener becomes an active participant, which allows him to take greater part in the speaker’s presentation.
IVS® consists of a network of keypads that pass on information to the cluster. This cluster collects the data and sends it to the software. The IVS software saves the information and presents the data in charts.
The IVS® knows many applications. Besides support for congresses and seminars where the opinion of the entire group is measured, IVS® offers several other possibilities:
Evaluation of a meeting By evaluating a meeting with IVS® the data is immediately availa-ble. Therefore the processing and reporting can be done much faster. Giving feedback to the audience is, in this case, not always wanted or needed. With IVS® you can decide whether you want to show the results immediately in a chart or evaluate the results af-terwards.
Measuring consensus If you want to know whether there is a basis for a decision within the company or within a group, you can use a rating question. Besides the results for the given ratings, this question also displays the mean value and the deviation. By first asking a reference question, e.g. “In which sector are you employed”, you can determine if there is a basis for the decision within a certain group.
Knowledge check Within IVS® you can set up a correct answer. Per question you can set up multiple correct answers. This way it is possible to measure the knowledge level of the audience. This methodology is used in education and training situations. It is also possi-ble to measure whether a group of people is informed about the changes within a com-pany or within a specialty.
Research IVS® stores the results of every keypad individually. This means that the system is anonymous but that it is possible to tell which participant voted what on a question. The results can be exported to a spreadsheet application (like Microsoft Excel) or to a statistical application (like SPSS Statistics). This way it is possible to easily gain lots of in-formation.

5
Introduction
There are several software packages available to make use of the interactive voting sys-tem. These packages are used to make a presentation, that is also known as a script. A script contains a series of slides, that allow you to ask the questions. It is also possible to add text, images or videos to the slides, for instance to clarify a question.
IVS-Professional is the most used software package of the available IVS software. With IVS-Professional it is possible to ask both anonymous and identified questions. By voting anonymously, you can, for example, ask opinion questions, that only display the results of the total group. With an identified voting, you can ask knowledge questions, or even play a quiz, that can display the results per individual participant, or per group of partic-ipants.
When you have an identified voting, IVS-Professional also offers the possibility of assign-ing vote weights to the participants. This makes the software extremely suitable for sup-porting shareholders meetings.
The basic features, such as crossing the results with a reference question, and comparing the results of different questions, are also available in IVS-Professional.
IVS-Basic is the software package that only allows for an anonymous voting. It is not pos-sible to display the results of the individual participants.
The basic features include, among other things, comparing questions, and crossing a question with a reference question. By comparing questions, the results of two or more questions are displayed next to each other in the same chart. But is it also possible to show the results of different questions in multiple charts, displayed next to each other. By crossing a question, the total results of a question are split up in separate references, that were previously determined by asking a reference question.
IVS-PowerPoint is a software package that can be used as a plug-in in Microsoft Power-Point. This allows you to easily add slides to a PowerPoint presentation, that show a question and allow you to vote. Naturally, all options of PowerPoint are at your disposal. The IVS-plug-in allows you to vote, cross results and compare results.
This manual describes how to use IVS-Professional to make a script. However, you can also use this manual for IVS-Basic, because to a large extend, both packages have the same functionality. For IVS-PowerPoint, a separate manual is available.
When a certain option is only applicable to IVS-Professional, this will be indicated by the IVS-Professional icon. The section explaining this option will be indented. When an entire chapter is only applicable to IVS-Professional, the IVS-

6
Professional icon will be displayed only next to the first section.
You can use this manual as a textbook. You start with the first chapter, which explains how you can easily create a script with a question and answers. The following chapters describe how to extend the script, so that it can be used in a variety of application. Next, the manual explains how to connect the network and how you can vote with your script. Finally, with the aid of an example script, you will learn how to display the results of the various participants, and how to show the score of the individual participants or of groups of participants.
Every chapter contains a number of steps, for example:
Select the template “Default” and click “OK” to create a new script.
You can perform these steps to create an example script, as described in this manual. By means of this example script you learn the various possibilities of IVS® and the IVS soft-ware.

7
Table of contents
Interactive Voting System ...................................................................................... 4
Introduction ......................................................................................................... 5
Table of contents .................................................................................................. 7
Making a script .................................................................................................. 12 Starting with a template ...................................................................................................... 12 Making a question ............................................................................................................. 13 Adding answers ................................................................................................................. 14 Adding a result diagram ..................................................................................................... 16 Saving the script ................................................................................................................. 17
Using background slides ..................................................................................... 19 Go to the background slide ................................................................................................. 19 Inserting an image ............................................................................................................. 20 Selecting objects ................................................................................................................. 22 Moving objects ................................................................................................................... 22 To the normal slides ........................................................................................................... 24
Working with results ........................................................................................... 25 Importing example results ................................................................................................... 25 Making up the result diagram ............................................................................................. 26 Setting up the chart ............................................................................................................ 30 Settings for crossing and comparing .................................................................................... 33 Setting up the font .............................................................................................................. 35
Changing the layout of the slide ......................................................................... 37 Enlarging and reducing objects ........................................................................................... 37 Positioning answers ............................................................................................................ 39 Selecting more than one object ........................................................................................... 40 Aligning objects ................................................................................................................. 40 Deselecting objects ............................................................................................................. 43 Distributing objects ............................................................................................................. 43 Customizing the slide ......................................................................................................... 44 Setting up the background .................................................................................................. 45 Changing texts ................................................................................................................... 49 Making a new slide ............................................................................................................ 50
The template ...................................................................................................... 52 Go to the template ............................................................................................................. 52 Customizing the slide ......................................................................................................... 53 Customizing the result diagram ........................................................................................... 55 Changing the bar colors ..................................................................................................... 55 Moving answers ................................................................................................................. 56

8
Using the grid .................................................................................................................... 56 Customizing the texts .......................................................................................................... 58 To the standard slides ......................................................................................................... 58 Reapplying the template ..................................................................................................... 59 Aligning answers ................................................................................................................ 61 Saving the template ............................................................................................................ 62 Saving the script ................................................................................................................. 63
Asking a reference question ................................................................................ 64 Inserting a reference question ............................................................................................. 64 The properties of a question ................................................................................................ 65 A second reference question ............................................................................................... 69
Asking a rating question ..................................................................................... 71 A rating question with answers ............................................................................................ 71 Inserting a fixed set of answers ............................................................................................ 71 The mean and deviation ..................................................................................................... 72 A rating question without answers ........................................................................................ 73
Crossing results .................................................................................................. 76 Crossing with a simple reference question ............................................................................ 76 Crossing with a more comprehensive reference question ....................................................... 80 Splitting a crossed question ................................................................................................. 81 Undoing a split .................................................................................................................. 82 Displaying a crossing differently .......................................................................................... 82 Back to the normal results ................................................................................................... 83 Crossing with multiple reference questions ........................................................................... 84
Comparing results .............................................................................................. 87 Inserting a question to compare .......................................................................................... 87 Setting the correct answer ................................................................................................... 88 Copying a slide .................................................................................................................. 88 Comparing questions ......................................................................................................... 89 Comparing in percentages.................................................................................................. 91 Switching between absolute numbers and percentages .......................................................... 92 Showing the correct answer ................................................................................................. 93 Back to the standard results ................................................................................................ 94 Two result diagrams on one slide ........................................................................................ 94
Voting a question more than once....................................................................... 98 A question with multiple votes ............................................................................................. 98 Answers outside the slide .................................................................................................... 98 Result diagram on the next slide .......................................................................................... 99 Changing the legend text ...................................................................................................100 Adding a text ....................................................................................................................101 Showing the different choices .............................................................................................102 Undoing a split .................................................................................................................103 Calculating answers next in rank ........................................................................................103 Displaying answers next in rank .........................................................................................104

9
Printing the script ............................................................................................. 106 Removing example results ................................................................................................. 106 Printer settings ................................................................................................................. 107 Printing a script overview .................................................................................................. 107 Printing a handout ............................................................................................................ 109 Printing to file .................................................................................................................. 110
Creating a list of participants ............................................................................ 112 A simple list of participants with chip cards ......................................................................... 112 A simple list of participants with keypads ............................................................................ 114 A list of participants based on names ................................................................................. 116 Importing an existing name list .......................................................................................... 117 A list of automatically numbered participants ...................................................................... 118
Connecting the network ................................................................................... 119 The keylock ...................................................................................................................... 119 Charging the keypads ...................................................................................................... 120 Connecting the Base Station .............................................................................................. 121 Communication with the Base Station ................................................................................ 121 Initializing the keypads ..................................................................................................... 129 Saving a list with initialized keypads ................................................................................... 131 Testing the network .......................................................................................................... 132
Voting ............................................................................................................. 133 Starting a presentation ...................................................................................................... 133 Starting a session ............................................................................................................. 134 The presentation screen .................................................................................................... 135 Showing the presentation screen on a different monitor ....................................................... 136 Locking the presentation screen ......................................................................................... 136 Opening the voting .......................................................................................................... 137 Closing the voting ............................................................................................................ 138 Voting on a question more than once ................................................................................ 138
Crossing and comparing in the presentation screen ........................................... 140 Crossing with a reference question .................................................................................... 140 Crossing with a normal question ....................................................................................... 141 Splitting a crossing ........................................................................................................... 141 Comparing questions ....................................................................................................... 141 Showing different choices .................................................................................................. 141
Ending the presentation .................................................................................... 143 Back to the edit screen ...................................................................................................... 143 Printing a script layout with results ..................................................................................... 143 Printing a handout with results ........................................................................................... 144 Exporting individual results ................................................................................................ 145 Opening individual results in Microsoft® Excel™ .................................................................. 147 Closing the network .......................................................................................................... 147
Using a script again ......................................................................................... 149

10
Opening a script ...............................................................................................................149 Initializing the Base Station .................................................................................................150 Initializing keypads ............................................................................................................151 Starting the presentation ....................................................................................................151 Using a session again........................................................................................................151
Modifying an existing script ............................................................................... 153 Inserting a new slide ..........................................................................................................153 Adding a text ....................................................................................................................155 Using another background ................................................................................................156 Inserting an image ............................................................................................................157 Changing the order of objects ............................................................................................158 Simulating a shadow effect ................................................................................................158 Duplicating objects ............................................................................................................159 Zooming in on the slide .....................................................................................................161 Moving objects with the cursor keys ....................................................................................162 Saving the script under another name .................................................................................163
The slide sorter ................................................................................................. 164 Starting the slide sorter ......................................................................................................164 Copying slides ..................................................................................................................164 Pasting copied slides .........................................................................................................165 Moving slides ....................................................................................................................166 Deleting one or more slides ...............................................................................................167 Back to the normal slides ...................................................................................................168 Deleting slides ..................................................................................................................168 Moving slides in the edit screen ..........................................................................................169
Voting automatically with a timebar .................................................................. 170 Go to another slide ...........................................................................................................170 Inserting a timebar ............................................................................................................171 Setting up the timebar .......................................................................................................171 Copying objects ................................................................................................................173 Starting the timebar ...........................................................................................................174 Controlling the timebar manually .......................................................................................175
Working with multimedia .................................................................................. 176 Inserting a multimedia object .............................................................................................176 Starting the multimedia object ............................................................................................177 Starting automatically when voting .....................................................................................177
Advanced text objects ....................................................................................... 180 Displaying a text for a certain status ....................................................................................180 Performing an action when clicked .....................................................................................181 Switching from PowerPoint to IVS ........................................................................................182
Automatically displaying text with fields ............................................................. 184 A text file as a basis ...........................................................................................................185 Inserting a field .................................................................................................................186
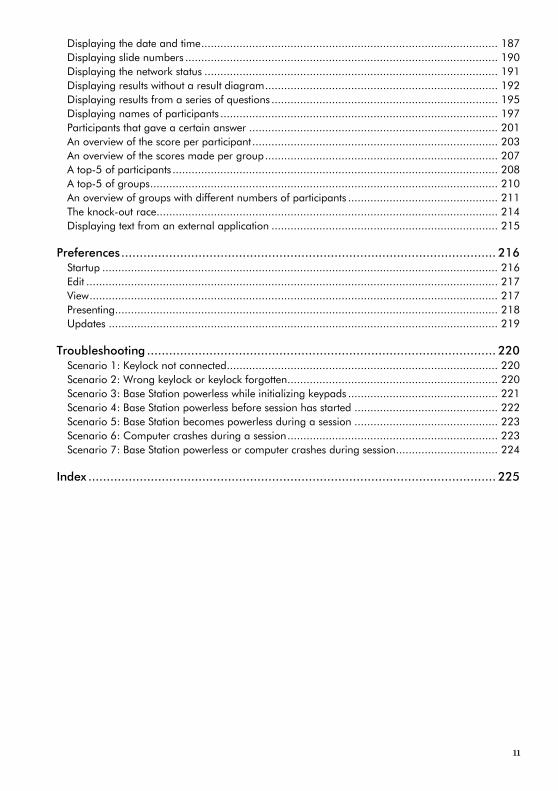
11
Displaying the date and time ............................................................................................. 187 Displaying slide numbers .................................................................................................. 190 Displaying the network status ............................................................................................ 191 Displaying results without a result diagram ......................................................................... 192 Displaying results from a series of questions ....................................................................... 195 Displaying names of participants ....................................................................................... 197 Participants that gave a certain answer .............................................................................. 201 An overview of the score per participant ............................................................................. 203 An overview of the scores made per group ......................................................................... 207 A top-5 of participants ...................................................................................................... 208 A top-5 of groups ............................................................................................................. 210 An overview of groups with different numbers of participants ............................................... 211 The knock-out race ........................................................................................................... 214 Displaying text from an external application ....................................................................... 215
Preferences ...................................................................................................... 216 Startup ............................................................................................................................ 216 Edit ................................................................................................................................. 217 View ................................................................................................................................ 217 Presenting........................................................................................................................ 218 Updates .......................................................................................................................... 219
Troubleshooting ............................................................................................... 220 Scenario 1: Keylock not connected..................................................................................... 220 Scenario 2: Wrong keylock or keylock forgotten .................................................................. 220 Scenario 3: Base Station powerless while initializing keypads ............................................... 221 Scenario 4: Base Station powerless before session has started ............................................. 222 Scenario 5: Base Station becomes powerless during a session ............................................. 223 Scenario 6: Computer crashes during a session .................................................................. 223 Scenario 7: Base Station powerless or computer crashes during session ................................ 224
Index ............................................................................................................... 225

12
Making a script
Before you can support a meeting with IVS® you have to create a script. This script con-tains a number of slides. These slides can be presented during the meeting.
You can place one or more images on a slide. Or you can place texts on a slide. However, the most important objects that can be placed on a slide are a question and the accom-panying answers. The question determines what you want to know from your audience, while the answers indicate the choices your audience can make. You can also place a re-sult diagram on a slide, in which the results of a voting are displayed, immediately after the audience has voted.
Starting with a template After starting up the IVS software, the startup dialog appears. In this dialog, you choose whether you want to open an existing script, or create a new script.
If you start the IVS software for the first time, there are no existing scripts you can open. Therefore you start with a new script.
The start-up dia-log with a couple of templates
To create a new script, you can choose from a number of templates. These templates de-termine what your script is going to look like. The template defines, among other things, which fonts and colors are used for questions and answers.
Select a template with which you want to start your script and click on “OK” to create a new script.
Select the template “Default” and click “OK” to create a new script.

13
A new script has been created with one empty slide.
A new script with one empty slide
Making a question A question is an object that you can place on a slide. With this object you present the question you want to ask the audience. Together with the accompanying answers, you can have your audience vote to this question.
Choose the op-tion Question from the Insert menu to create a question
To insert a question, choose the option Question from the Insert menu. Alternatively, you can click the Question button ( ) in the toolbar or press the on your keyboard.
Choose the option Question from the Insert menu.
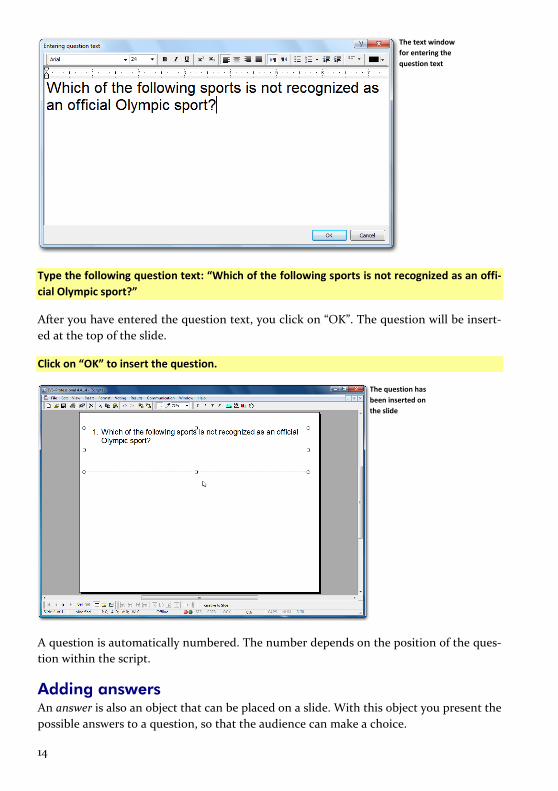
A text window appears in which you can enter the text for the question.
14
The text window for entering the question text
Type the following question text: “Which of the following sports is not recognized as an offi-cial Olympic sport?”
After you have entered the question text, you click on “OK”. The question will be insert-ed at the top of the slide.
Click on “OK” to insert the question.
The question has been inserted on the slide
A question is automatically numbered. The number depends on the position of the ques-tion within the script.
Adding answers An answer is also an object that can be placed on a slide. With this object you present the possible answers to a question, so that the audience can make a choice.
15
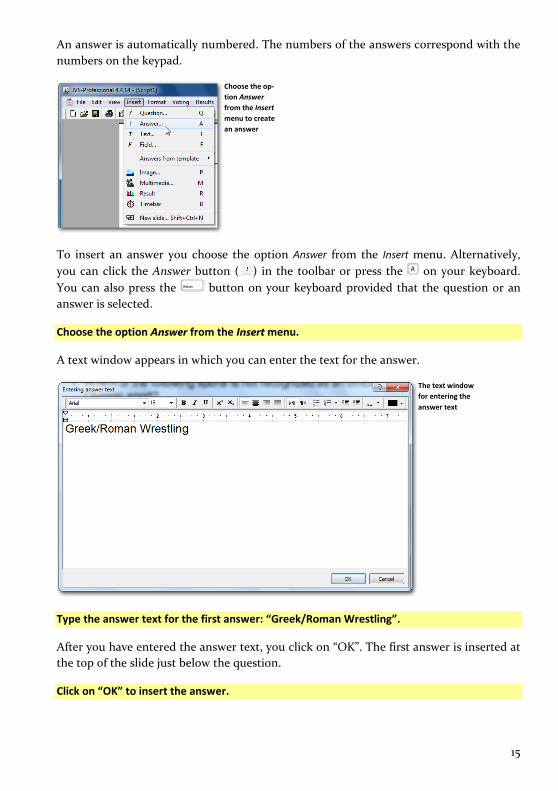
An answer is automatically numbered. The numbers of the answers correspond with the numbers on the keypad.
Choose the op-tion Answer from the Insert menu to create an answer
To insert an answer you choose the option Answer from the Insert menu. Alternatively, you can click the Answer button ( ) in the toolbar or press the on your keyboard. You can also press the button on your keyboard provided that the question or an answer is selected.
Choose the option Answer from the Insert menu.
A text window appears in which you can enter the text for the answer.
The text window for entering the answer text
Type the answer text for the first answer: “Greek/Roman Wrestling”.
After you have entered the answer text, you click on “OK”. The first answer is inserted at the top of the slide just below the question.
Click on “OK” to insert the answer.
16
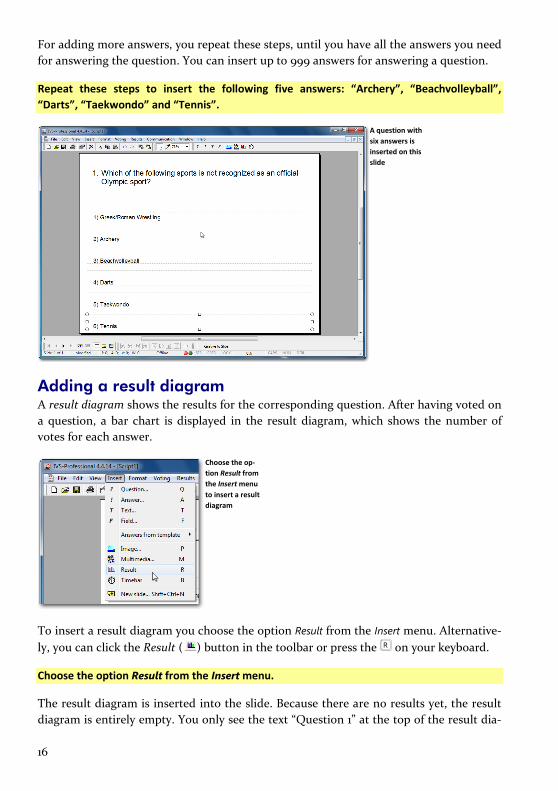
For adding more answers, you repeat these steps, until you have all the answers you need for answering the question. You can insert up to 999 answers for answering a question.
Repeat these steps to insert the following five answers: “Archery”, “Beachvolleyball”, “Darts”, “Taekwondo” and “Tennis”.
A question with six answers is inserted on this slide
Adding a result diagram A result diagram shows the results for the corresponding question. After having voted on a question, a bar chart is displayed in the result diagram, which shows the number of votes for each answer.
Choose the op-tion Result from the Insert menu to insert a result diagram
To insert a result diagram you choose the option Result from the Insert menu. Alternative-ly, you can click the Result ( ) button in the toolbar or press the on your keyboard.
Choose the option Result from the Insert menu.
The result diagram is inserted into the slide. Because there are no results yet, the result diagram is entirely empty. You only see the text “Question 1” at the top of the result dia-
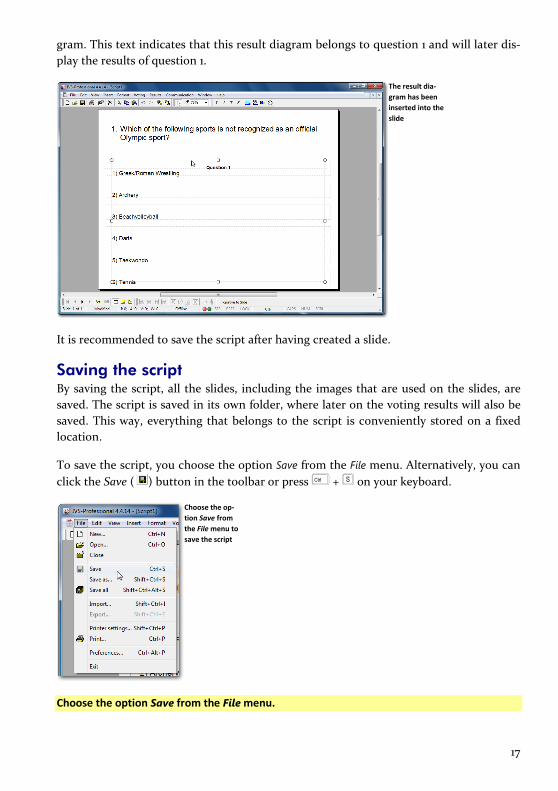
17
gram. This text indicates that this result diagram belongs to question 1 and will later dis-play the results of question 1.
The result dia-gram has been inserted into the slide
It is recommended to save the script after having created a slide.
Saving the script By saving the script, all the slides, including the images that are used on the slides, are saved. The script is saved in its own folder, where later on the voting results will also be saved. This way, everything that belongs to the script is conveniently stored on a fixed location.
To save the script, you choose the option Save from the File menu. Alternatively, you can click the Save ( ) button in the toolbar or press + on your keyboard.
Choose the op-tion Save from the File menu to save the script
Choose the option Save from the File menu.

18
The standard dialog box for saving files appears. Here you enter the name of the script.
The standard dialog box for saving files
After having entered a name, you click on the “Save” button to save the script.
Enter the name of the script: “Starting with IVS-Professional” and click on “Save” to save the script.
The name of the script is displayed in the title bar of the IVS software.
The name of the script is display-ed in the title bar
It is recommended to save the script regularly.
19
Using background slides
A script consists of a number of slides on which you can place questions and answers, re-sult diagrams, images and texts. Apart from the standard slides, a script consists of at least one background slide. On a background slide you can only place texts and images.
A background slide is displayed behind a standard slide. The advantage is that objects, that you want to repeat on every slide, do not need to be inserted on each single slide again. You only have to insert them once on the background slide. Any object that is in-serted on the first background slide, is automatically displayed on each normal slide.
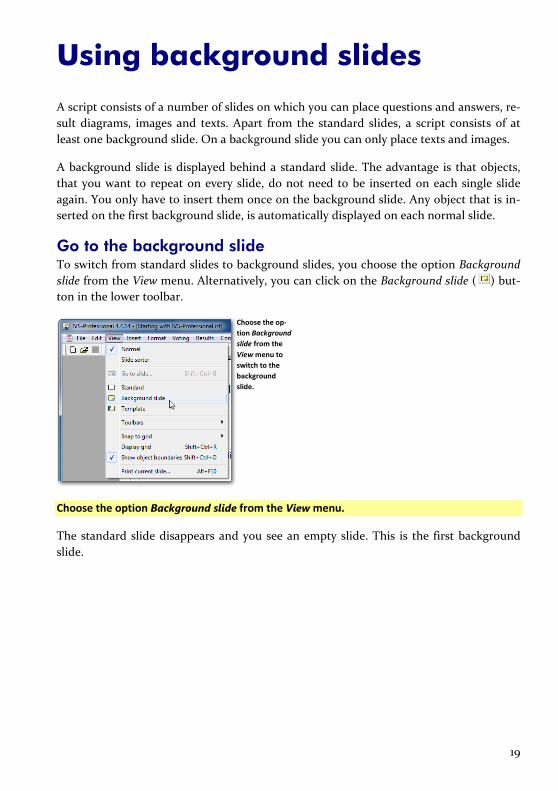
Go to the background slide To switch from standard slides to background slides, you choose the option Background slide from the View menu. Alternatively, you can click on the Background slide ( ) but-ton in the lower toolbar.
Choose the op-tion Background slide from the View menu to switch to the background slide.
Choose the option Background slide from the View menu.
The standard slide disappears and you see an empty slide. This is the first background slide.

20
The still empty background slide
Inserting an image When you want to show an image on each slide in the script, you place it on the first background slide. This way, you can show for instance a company logo in the corner of each slide.
To insert an image, you choose the option Image from the Insert menu. Alternatively, you can click on the Image ( ) button in the toolbar or press on your keyboard.
Choose the op-tion Image from the Insert menu to insert an im-age
Click Image from the Insert menu.
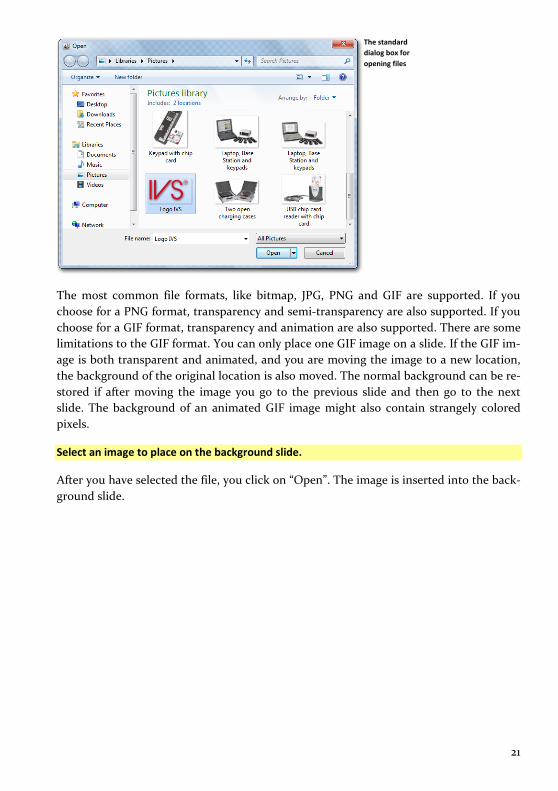
A standard dialog box for opening files appears. Here you choose the location and select the name of the file you want to open.
21
The standard dialog box for opening files
The most common file formats, like bitmap, JPG, PNG and GIF are supported. If you choose for a PNG format, transparency and semi-transparency are also supported. If you choose for a GIF format, transparency and animation are also supported. There are some limitations to the GIF format. You can only place one GIF image on a slide. If the GIF im-age is both transparent and animated, and you are moving the image to a new location, the background of the original location is also moved. The normal background can be re-stored if after moving the image you go to the previous slide and then go to the next slide. The background of an animated GIF image might also contain strangely colored pixels.
Select an image to place on the background slide.
After you have selected the file, you click on “Open”. The image is inserted into the back-ground slide.
22
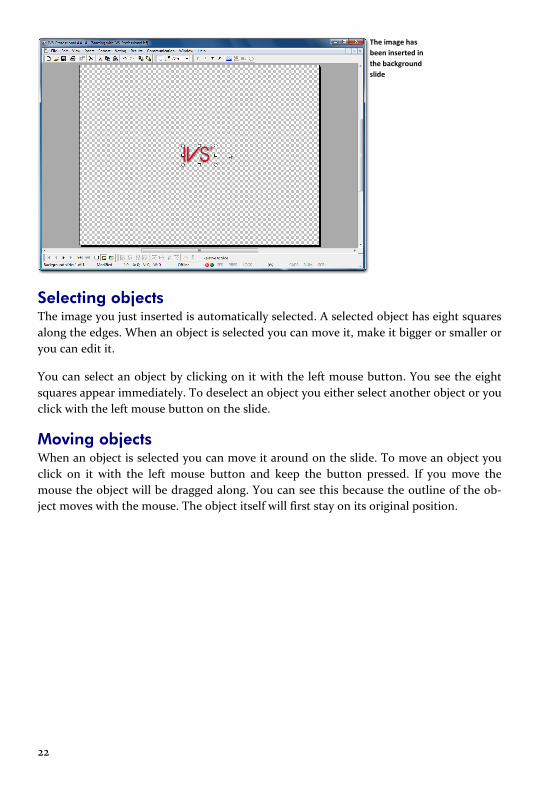
The image has been inserted in the background slide
Selecting objects The image you just inserted is automatically selected. A selected object has eight squares along the edges. When an object is selected you can move it, make it bigger or smaller or you can edit it.
You can select an object by clicking on it with the left mouse button. You see the eight squares appear immediately. To deselect an object you either select another object or you click with the left mouse button on the slide.
Moving objects When an object is selected you can move it around on the slide. To move an object you click on it with the left mouse button and keep the button pressed. If you move the mouse the object will be dragged along. You can see this because the outline of the ob-ject moves with the mouse. The object itself will first stay on its original position.
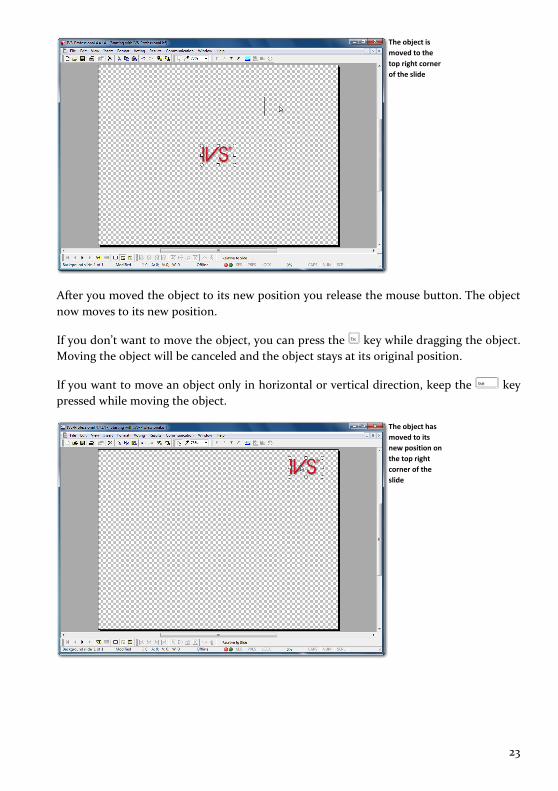
23
The object is moved to the top right corner of the slide
After you moved the object to its new position you release the mouse button. The object now moves to its new position.
If you don’t want to move the object, you can press the key while dragging the object. Moving the object will be canceled and the object stays at its original position.
If you want to move an object only in horizontal or vertical direction, keep the key pressed while moving the object.
The object has moved to its new position on the top right corner of the slide

24
To the normal slides After you have inserted an image on the background slide, you return to the normal slides. You do this by choosing the option Standard from the View menu. Alternatively, you can click on the Standard slide button ( ) in the lower toolbar.
Choose the option Standard from the View menu.
Choose the op-tion Standard from the View menu to return to the standard slides
You are now back at the standard slides where you see your first slide with the question and six answers. Behind this slide you see the image that you put on the first background slide.
The background slide is displayed behind the standard slide
25
Working with results
A result diagram is used to show the results of the voting. However, when you are mak-ing a script, no results are available yet. Therefore nothing is shown in the result dia-grams.
For a correct layout of your script, it would be handy when results would be displayed. This way, you can see for instance whether the bars are on the correct position and have the correct color or not. To display results when you are creating a script you can make use of example results.
By using example results, it looks as if every question is voted. With every answer a ran-dom number of votes is displayed. With example results you can do almost everything you would when you had real results. However, you cannot export or print example re-sults. And keep in mind: these are only random example results.
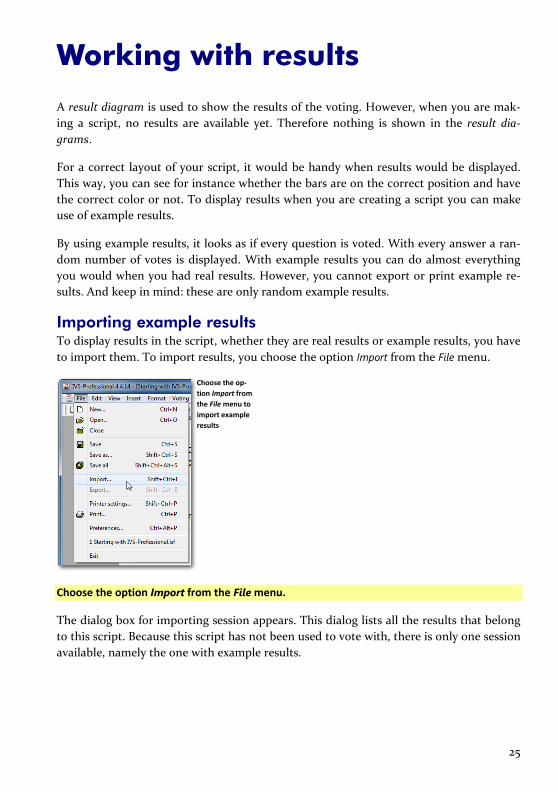
Importing example results To display results in the script, whether they are real results or example results, you have to import them. To import results, you choose the option Import from the File menu.
Choose the op-tion Import from the File menu to import example results
Choose the option Import from the File menu.
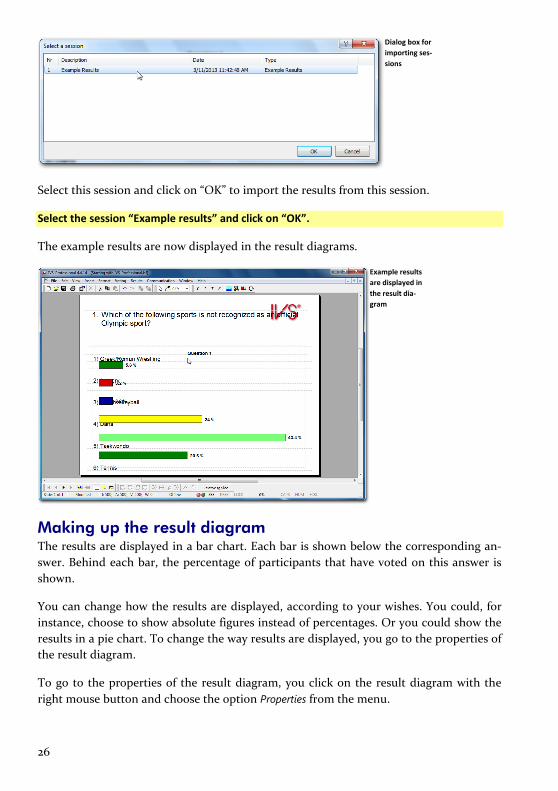
The dialog box for importing session appears. This dialog lists all the results that belong to this script. Because this script has not been used to vote with, there is only one session available, namely the one with example results.
26
Dialog box for importing ses-sions
Select this session and click on “OK” to import the results from this session.
Select the session “Example results” and click on “OK”.
The example results are now displayed in the result diagrams.
Example results are displayed in the result dia-gram
Making up the result diagram The results are displayed in a bar chart. Each bar is shown below the corresponding an-swer. Behind each bar, the percentage of participants that have voted on this answer is shown.
You can change how the results are displayed, according to your wishes. You could, for instance, choose to show absolute figures instead of percentages. Or you could show the results in a pie chart. To change the way results are displayed, you go to the properties of the result diagram.
To go to the properties of the result diagram, you click on the result diagram with the right mouse button and choose the option Properties from the menu.

27
Click on the result diagram with the right mouse button and choose the option Properties from the menu.
The dialog box Properties of result appears, in which you can change the properties of the result diagram.
Dialog box with the properties of the result dia-gram
Results of question This shows the question of which the results are shown in this result diagram. When you insert a question, answers and a result diagram on a slide, the result diagram will auto-matically be linked to that question. Should you want to show more result diagrams for this question, this link would not be automatically made. You would have to manually link this result diagram to a question.
Display The options under Display determine how the result diagram is displayed.
Interactive When results are shown interactively, you can see the bars grow during vot-ing. When results are not shown interactively, the diagram remains empty until the vot-ing is closed.
Show axes With this option axes are shown at the left and at the bottom of the chart. The text that is shown along these axes is determined by the options Values on axis, Leg-end text on axis and Use answer numbers as legend.

28
Values on axis Along the bottom axis values are shown that give an indication of the ab-solute value of each bar. The exact value is shown with each bar. Depending on the avail-able space, the values are shown in steps of 5 or 10 or even greater. This option is only available when Show axes is also enabled.
Normalize to 100% The largest bar in the chart will be displayed using all available space in the chart. When the largest bar represents 43.4% it will be displayed from the bottom to the top of the chart. With the option Normalize to 100% enabled only a bar that repre-sents 100% is displayed using all available space. A bar representing 43.4% will use about half the available space.
Cross/Compare to 100% When crossing or comparing two or more questions, the total number of votes for all questions are taken to the same level. When this option is not checked, the bars in the chart are based on the absolute number of votes. A bar with four votes is therefore smaller than a bar with six votes. When displaying the results in per-centages, the bar with four votes is still smaller than the bar with six votes. However, the bar with four votes can have a result of 25%, while the bar with six votes can have a result of 20%. This will make 25% look less than 20%. When this option is checked, the bars in the chart are based on the percentage of votes. A bar with 25% of the votes is bigger than a bar with 20% of the votes.
3D chart The chart is displayed three-dimensionally. Disable this option if you want a flat chart.
Walls transparent The left wall and the bottom wall of the chart can be made transparent with this option. If they are not transparent, they will use the color set at Primary color. This option is only available if the 3D chart option is also enabled.
Full frame in chart By default, only the left and bottom wall are visible. With this option you can also show the right and top wall. These two walls are only represented by a line.
Always show correct answer With this option the correct answer is shown immediately upon closing the voting. This means that all bars belonging to a correct answer will be shown in green, and all bars belonging to a wrong answer will be shown in red. See also “Showing the correct answer” on page 93.
From right to left This option allows you to display a mirrored result diagram. The bars are shown from the right to the left instead of from the left to the right and the legend is on the left side of the chart instead of on the right side. This option is only available if your computer is set up to use from-right-to-left languages, like for example Arabic.
Legend Apart from the answer text, each answer also has a legend text. In most cases the legend text is the same as the answer text. Only when the answer text is too long, the legend text will be a shortened version of the answer text.

29
In the result diagrams, the legend texts of the answers can be displayed in various ways.
Legend text on axis This option shows the legend text of the answers along the bottom axis of the result diagram. When the text of one of the answers it too long, it could hap-pen that the legend text of the adjacent answers is not shown. You can solve this either by selecting Use answer numbers as legend or by shortening the legend text. The option Legend text on axis is only available when the option Show axes is also enabled.
Use answer numbers as legend Instead of the legend text, you can also show only the numbers of the answers. This option is only available when both the options Show axis and Legend text on axis are enabled or when Always display legend is enabled.
Rotate legend text 45° When the legend text is displayed along the axis, you can use this option to rotate the text 45°. This option is especially useful when the legend texts are too long, which causes that not all of the texts are shown. When the legend text is rotat-ed, it can always be displayed. This option is only available when the options Show axes and Legend text on axis are also enabled.
Always display legend Besides showing the legend texts along the axis, it is also possible to show a separate legend. This can be done by enabling the option Always display legend. The legend will be displayed on the right side of the result diagram.
Only with pie chart Because it is not possible to show a legend along the axis of a pie chart, this option offers the possibility to show a legend with a pie chart. The legend is not shown with a bar chart, a line chart or a 3D area chart because these charts have the legend along the axis. This option is not available when the option Always display legend is enabled.
Only with crossing or comparison This option only shows a legend when the results are crossed or compared. In that case, the legend shows what the crossing or comparison represents. This option is not available when the option Always display legend is enabled.
Background The background of the result diagram can be changed. You can choose from one single color, a gradient from one color to the other color, or an image as the background, or you can leave the background transparent. These different options are almost the same as those of the slide. For a more comprehensive description, see “Background” on page 46.
Single color The background is displayed as one single color. The desired color can be chosen by clicking the Color button behind Primary color. The walls of the chart are also displayed in a darker and lighter tone of this primary color, unless the option Walls transparent is enabled.
Gradient The background is displayed as a gradient from one color to another. The de-sired colors can be chosen by clicking the Color button behind Primary color and behind
30
Secondary color. From the list under Gradient direction, you can choose the direction of the gradient. The direction is always given from the primary color to the secondary color. If you choose the option From bottom to top, the primary color is displayed at the bottom and the secondary color at the top.
Image With this option you can display an image as the background. By clicking the “Browse” button ( ) under File name, you can select a file that you want to use as an im-age on the background. The image will always be stretched, to fit in the available space of the result diagram.
Transparent This option makes the background transparent, so that you can see the slide through the result diagram. The walls of the chart are not automatically made transpar-ent. Use the option Walls transparent to do this.
Select the options Show Axes and 3D chart from the Display options and Transparent from the Background options with white as the Primary color.
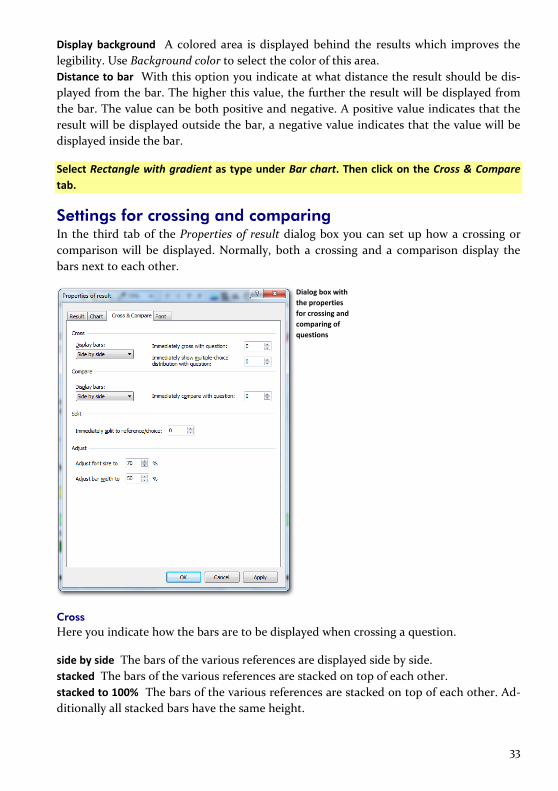
Setting up the chart The dialog box Properties of result consists of four tabs. The first, Result, contains the op-tions that relate to displaying the result diagram. The second, Chart, contains the options that relate to displaying the chart in the result diagram. The third, Cross & Compare, contains options for displaying a crossing or comparison. And the last one, Font, contains options for setting up the font for all texts used in the diagram.
Click on the Chart tab at the top of the dialog box.

31
Dialog box with the properties of the chart
Chart type You can choose from a variety of charts to display the results. The most used chart types are the bar chart and column chart. But you can also choose a pie chart, a line chart or a 3D area chart. The 4-quadrant chart is a special chart type. In this chart, the results of two consecutive questions are displayed. The results of the first question are displayed along the X-axis, while the results of the second question are displayed along the Y-axis. If you choose for this chart type, you will be notified of the fact that this is a special chart type, that cannot be used just like the other chart types to display the results of a voting.
Bar chart If you display your results in a bar chart or column chart, you can also choose how the bars or columns should be displayed. You can choose from thirteen different types. Fur-thermore you can select the width of the bars or columns. This width can vary from 5% up to 100% of the available space. The width is adjustable in 5% steps. The default width is 50%.
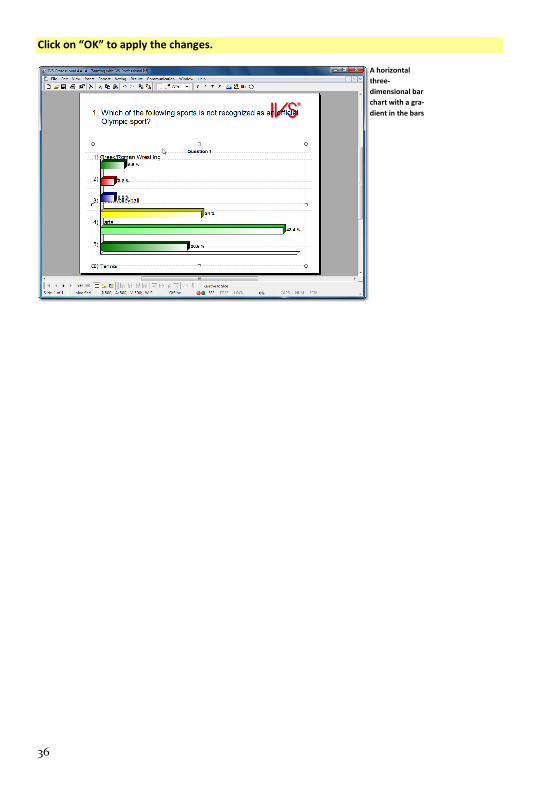
If you choose the type ‘Rectangle with gradient’ you can have the bar color gradually fade from a starting color at the beginning, if necessary through a second color in the middle, to a final color at the end. Under Start color you choose the color with which all bars should start. The bars all end in a color that you have set in the properties of each corre-sponding answer. If necessary, you can choose a third color that is used in the middle of the bar. Besides, you can also indicate the direction of this gradient. The direction is giv-en from the selected starting color to the final bar color.

32
The option Frame around bar determines whether or not the thin black line is displayed around each bar.
Results The results that are displayed with each bar, can both be displayed in percentages and absolute values.
Absolute The results are displayed in absolute values. Percentages The results are displayed in percentages of the total number of votes. Absolute/Percentages The results are displayed both in absolute values and in percent-ages of the total number of votes. Percentage of total The results are displayed in percentages of the total number of votes. Besides that, the total number of votes is also displayed. Percentage relative to first vote This option is only applicable when this question can be voted more than once. The results are displayed in percentages relative to the total num-ber of participants that voted at least once. Because there can be more votes than there are participants – each participant can vote more than once –, this percentage can be more than 100%. Legend This option displays the legend texts instead of the number of votes.
If you choose to display the results in percentages, you can enter the number of digits behind the decimal point under Number of digits. This can vary from 0 to a maximum of 5 digits behind the decimal point.
With the option Maximum number of bars you determine how many bars you would like to display at most in this diagram. The default value is 0, which will display all bars. If you want to show less bars than the number of answers, for example to show the ten most important answers from a series of 25, you can indicate that here.
The option First displayed bar determines which bar will be the first one to be displayed in the diagram. All bars preceding this bar will not be displayed. You can combine this option with the Maximum number of bars option to determine which range of bars you want to display. This allows you to divide a series of 20 answers across two diagrams. For both diagram, you set the Maximum number of bars to 10. For one diagram, you set First displayed bar to 1. For the other, you set this to 11. One diagram will now show the first ten bars and the other will show the second ten.
Values with bar Together with each bar, the total number of votes of the corresponding answer is dis-played. You can indicate whether these values are to be displayed or not, and if so, where they should be displayed. You can also adjust the text color and the background color of these values.
Display values The results of each answer are displayed along with the bar. Use Text color to choose the text color in which these results are displayed.
33
Display background A colored area is displayed behind the results which improves the legibility. Use Background color to select the color of this area. Distance to bar With this option you indicate at what distance the result should be dis-played from the bar. The higher this value, the further the result will be displayed from the bar. The value can be both positive and negative. A positive value indicates that the result will be displayed outside the bar, a negative value indicates that the value will be displayed inside the bar.
Select Rectangle with gradient as type under Bar chart. Then click on the Cross & Compare tab.
Settings for crossing and comparing In the third tab of the Properties of result dialog box you can set up how a crossing or comparison will be displayed. Normally, both a crossing and a comparison display the bars next to each other.
Dialog box with the properties for crossing and comparing of questions
Cross Here you indicate how the bars are to be displayed when crossing a question.
side by side The bars of the various references are displayed side by side. stacked The bars of the various references are stacked on top of each other. stacked to 100% The bars of the various references are stacked on top of each other. Ad-ditionally all stacked bars have the same height.

34
front-to-back The bars of the various references are displayed behind each other. If you want to use this option, make sure that the option 3D chart is also enabled.
With the option Immediately cross with question you can indicate that the results in this chart should immediately be crossed with another question. In that case, you don’t have to cross the results manually. Enter the number of the question with which you want to cross the results in this chart. If you want to cross the results manually, leave this value set to 0. For more information about crossing, see “Crossing results” on page 76.
With the option Immediately show multiple-choice distribution with question you can indi-cate that you immediately want to show a multiple-choice distribution of the results in this chart. In that case, you don’t have to display a multiple-choice distribution manually. Enter the number of the question with which you want to show the multiple-choice dis-tribution. A multiple-choice distribution can be useful for questions that can be voted more than once. The multiple-choice distribution shows how many participants chose a particular range of answers, for example, four participants chose answer 1, 2 and 3, two participants chose answer 1, 2 and 5, etc.
Compare Here you indicate how the bars are to be displayed when comparing a question. The op-tions are the same as for a crossing.
With the option Immediately compare with question you can indicate that the results in this chart should immediately be compared with another question. In that case, you don’t have to compare the results manually. Enter the number of the question with which you want to compare the results in this chart. If you want to compare the results manually, leave this value set to 0. For more information about comparing, see “Comparing results” on page 87.
Split With the option Immediately split to reference/choice you want indicate that the results in this chart should immediately be split. This option is only applicable to results that are crossed, or to results of a question that can be voted more than once. To split crossed re-sults, you enter the number of the reference that you want to show in this chart. To dis-play a certain choice from a question that could be voted more than once, you enter the number of the choice. For more information about splitting, see “Splitting a crossed question” on page 81. For more information about displaying a certain choice, see “Showing the different choices” on page 102.
Adjust When you cross or compare a question and display the bars next to each other, they will become a lot smaller. The font used to display the values along with the bars can then become too big compared to the bars. These options allow you to automatically reduce or enlarge both the font size and the bar size when you cross or compare the question.

35
Adjust font size to Here you choose a percentage of the original font size. For example, if you choose 70%, the font size used for a crossing or comparison will be reduced to 70% of the original font size.
You can set up a percentage in steps of 1%, with a minimum of 5% and a maximum of 200%.
Adjust bar width to Here you choose a percentage of the original bar width. For example, if you choose 50%, the bars will be displayed at half the original size during a crossing or a comparison.
You can set up a percentage in steps of 1%, with a minimum of 5% and a maximum of 100%.
Click on the Font tab.
Setting up the font In the last tab of the Properties of result dialog box you can set up the font that is used by the result diagram.
Dialog box with the properties for crossing and comparing of questions
In this dialog you can set up the font used for all texts in the result diagram. You can also set up the font style, the size and the color of the font used. The font color will only be used by texts displayed along the axes. The text color for texts displayed with the bars can be set up separately on the Chart tab.
36
Click on “OK” to apply the changes.
A horizontal three-dimensional bar chart with a gra-dient in the bars
37
Changing the layout of the slide
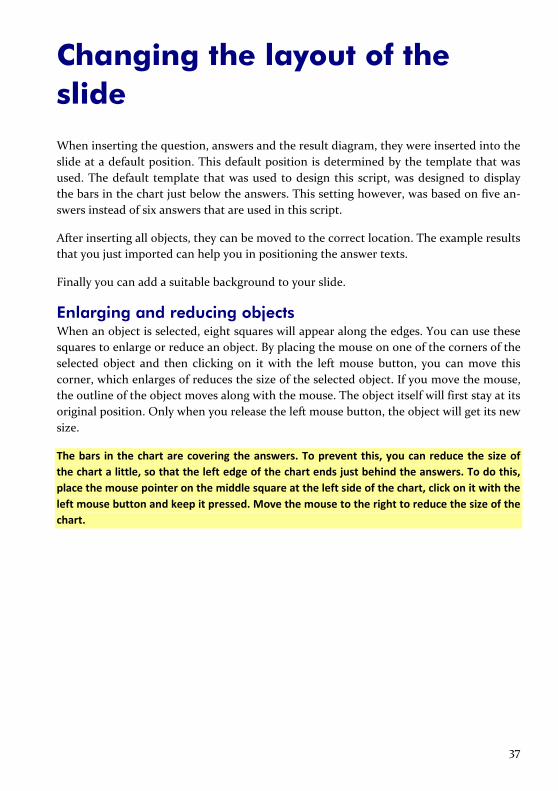
When inserting the question, answers and the result diagram, they were inserted into the slide at a default position. This default position is determined by the template that was used. The default template that was used to design this script, was designed to display the bars in the chart just below the answers. This setting however, was based on five an-swers instead of six answers that are used in this script.
After inserting all objects, they can be moved to the correct location. The example results that you just imported can help you in positioning the answer texts.
Finally you can add a suitable background to your slide.
Enlarging and reducing objects When an object is selected, eight squares will appear along the edges. You can use these squares to enlarge or reduce an object. By placing the mouse on one of the corners of the selected object and then clicking on it with the left mouse button, you can move this corner, which enlarges of reduces the size of the selected object. If you move the mouse, the outline of the object moves along with the mouse. The object itself will first stay at its original position. Only when you release the left mouse button, the object will get its new size.
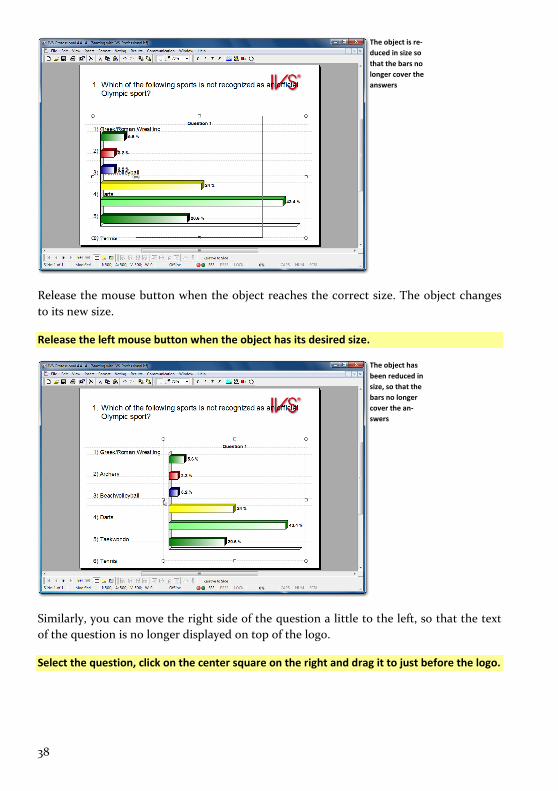
The bars in the chart are covering the answers. To prevent this, you can reduce the size of the chart a little, so that the left edge of the chart ends just behind the answers. To do this, place the mouse pointer on the middle square at the left side of the chart, click on it with the left mouse button and keep it pressed. Move the mouse to the right to reduce the size of the chart.
38
The object is re-duced in size so that the bars no longer cover the answers
Release the mouse button when the object reaches the correct size. The object changes to its new size.
Release the left mouse button when the object has its desired size.
The object has been reduced in size, so that the bars no longer cover the an-swers
Similarly, you can move the right side of the question a little to the left, so that the text of the question is no longer displayed on top of the logo.
Select the question, click on the center square on the right and drag it to just before the logo.

39
The question is made a little smaller so that it is no longer on top of the logo
Positioning answers The answers are all perfectly aligned, but the in-between distance is fairly large. By mov-ing the answers closer to each other, they can be aligned with the bars in the bar chart.
First, select the lower answer and move it upwards until it is in a horizontal line with the lower bar of the chart. Make sure the answer is moved a little to the right compared to the other answers.
Select answer 6 and drag it upwards until it is in line with the lower bar of the chart.
The last answer is moved until it is in line with the lower bar
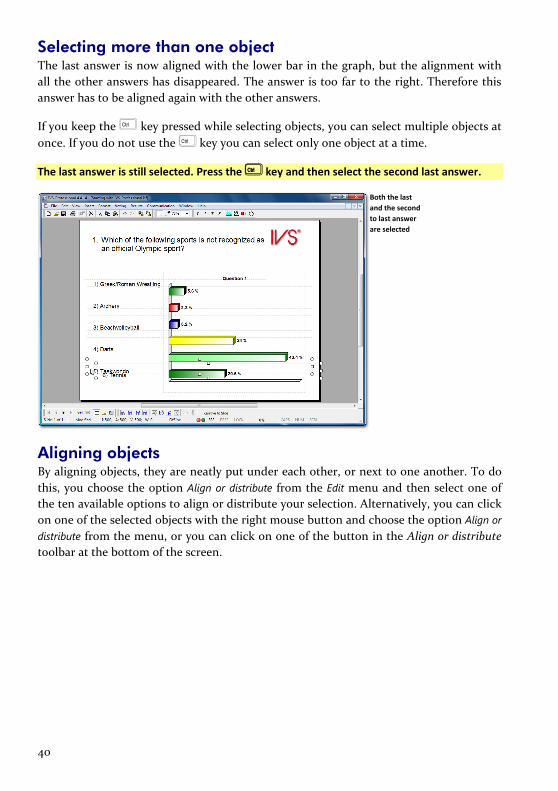
40
Selecting more than one object The last answer is now aligned with the lower bar in the graph, but the alignment with all the other answers has disappeared. The answer is too far to the right. Therefore this answer has to be aligned again with the other answers.
If you keep the key pressed while selecting objects, you can select multiple objects at once. If you do not use the key you can select only one object at a time.
The last answer is still selected. Press the key and then select the second last answer.
Both the last and the second to last answer are selected
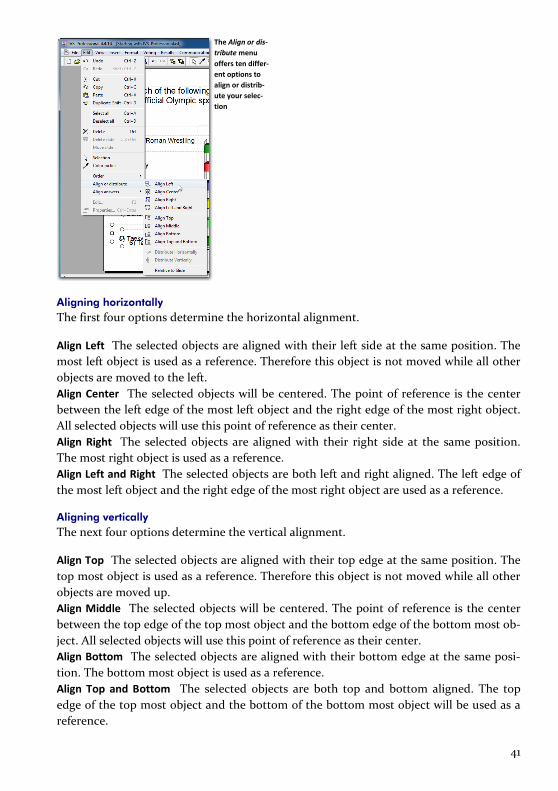
Aligning objects By aligning objects, they are neatly put under each other, or next to one another. To do this, you choose the option Align or distribute from the Edit menu and then select one of the ten available options to align or distribute your selection. Alternatively, you can click on one of the selected objects with the right mouse button and choose the option Align or distribute from the menu, or you can click on one of the button in the Align or distribute toolbar at the bottom of the screen.
41
The Align or dis-tribute menu offers ten differ-ent options to align or distrib-ute your selec-tion
Aligning horizontally The first four options determine the horizontal alignment.
Align Left The selected objects are aligned with their left side at the same position. The most left object is used as a reference. Therefore this object is not moved while all other objects are moved to the left. Align Center The selected objects will be centered. The point of reference is the center between the left edge of the most left object and the right edge of the most right object. All selected objects will use this point of reference as their center. Align Right The selected objects are aligned with their right side at the same position. The most right object is used as a reference. Align Left and Right The selected objects are both left and right aligned. The left edge of the most left object and the right edge of the most right object are used as a reference.
Aligning vertically The next four options determine the vertical alignment.
Align Top The selected objects are aligned with their top edge at the same position. The top most object is used as a reference. Therefore this object is not moved while all other objects are moved up. Align Middle The selected objects will be centered. The point of reference is the center between the top edge of the top most object and the bottom edge of the bottom most ob-ject. All selected objects will use this point of reference as their center. Align Bottom The selected objects are aligned with their bottom edge at the same posi-tion. The bottom most object is used as a reference. Align Top and Bottom The selected objects are both top and bottom aligned. The top edge of the top most object and the bottom of the bottom most object will be used as a reference.

42
The options for aligning objects are only active when two or more objects are selected at the same time. If you use the option Relative to Slide, the options for aligning objects are active when one or more objects are selected at the same time.
Distribute The last two options determine how the selected objects are distributed.
Distribute Horizontally The selected objects are equally distributed between the most left and the least left object. These two remain at the same place while all other objects are equally distributed between those two objects. Distribute Vertically The selected objects are equally distributed between the top most and the bottom most object. These two remain at the same place while all other objects are equally distributed between those two objects.
The options for distributing objects are only active when three of more objects are select-ed at the same time.
Relative to Slide When aligning objects, one of the objects is always used as a reference. If you select the option Relative to Slide it is not one of the objects that is used as a reference but the slide itself. For instance, if you choose the option Align Left, all selected objects will be aligned to the left edge of the slide.
Choose the option Align or distribute from the Edit menu and then the option Align Left.
Both selected objects are aligned with their left edge
Now that the last answer is at the correct position, all the other answers can be correctly positioned the same way.
43
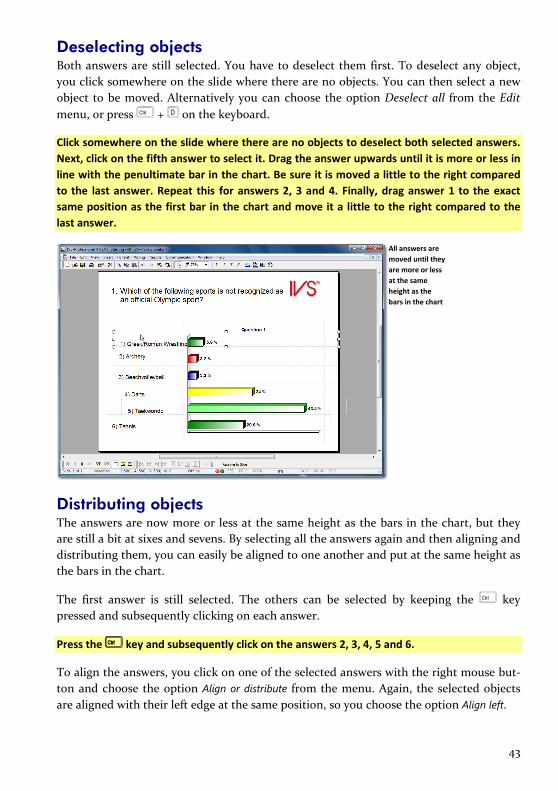
Deselecting objects Both answers are still selected. You have to deselect them first. To deselect any object, you click somewhere on the slide where there are no objects. You can then select a new object to be moved. Alternatively you can choose the option Deselect all from the Edit menu, or press + on the keyboard.
Click somewhere on the slide where there are no objects to deselect both selected answers. Next, click on the fifth answer to select it. Drag the answer upwards until it is more or less in line with the penultimate bar in the chart. Be sure it is moved a little to the right compared to the last answer. Repeat this for answers 2, 3 and 4. Finally, drag answer 1 to the exact same position as the first bar in the chart and move it a little to the right compared to the last answer.
All answers are moved until they are more or less at the same height as the bars in the chart
Distributing objects The answers are now more or less at the same height as the bars in the chart, but they are still a bit at sixes and sevens. By selecting all the answers again and then aligning and distributing them, you can easily be aligned to one another and put at the same height as the bars in the chart.
The first answer is still selected. The others can be selected by keeping the key pressed and subsequently clicking on each answer.
Press the key and subsequently click on the answers 2, 3, 4, 5 and 6.
To align the answers, you click on one of the selected answers with the right mouse but-ton and choose the option Align or distribute from the menu. Again, the selected objects are aligned with their left edge at the same position, so you choose the option Align left.
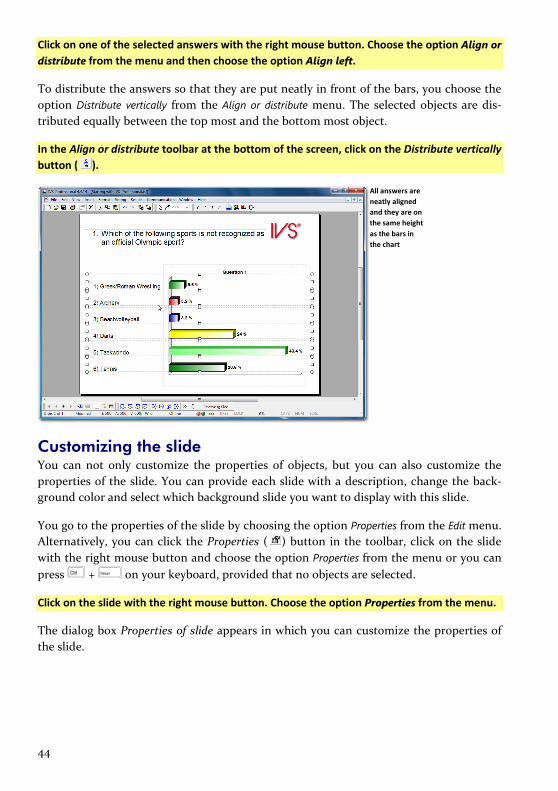
44
Click on one of the selected answers with the right mouse button. Choose the option Align or distribute from the menu and then choose the option Align left.
To distribute the answers so that they are put neatly in front of the bars, you choose the option Distribute vertically from the Align or distribute menu. The selected objects are dis-tributed equally between the top most and the bottom most object.
In the Align or distribute toolbar at the bottom of the screen, click on the Distribute vertically button ( ).
All answers are neatly aligned and they are on the same height as the bars in the chart
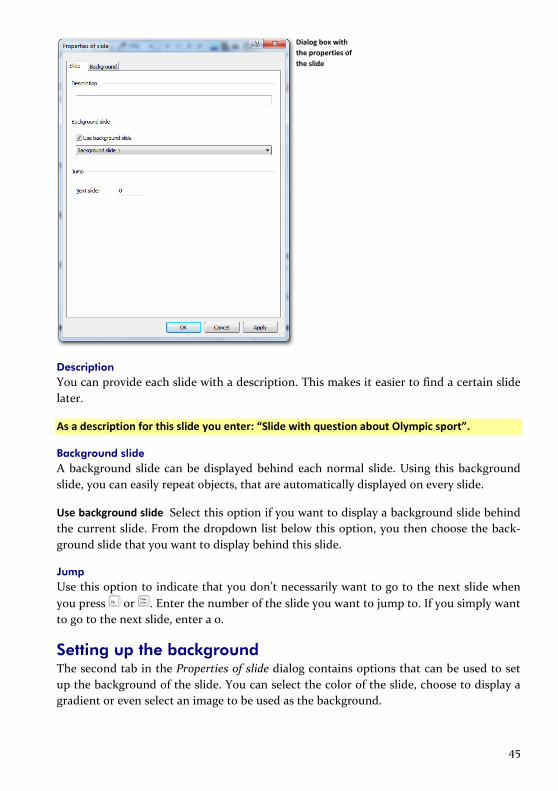
Customizing the slide You can not only customize the properties of objects, but you can also customize the properties of the slide. You can provide each slide with a description, change the back-ground color and select which background slide you want to display with this slide.
You go to the properties of the slide by choosing the option Properties from the Edit menu. Alternatively, you can click the Properties ( ) button in the toolbar, click on the slide with the right mouse button and choose the option Properties from the menu or you can press + on your keyboard, provided that no objects are selected.
Click on the slide with the right mouse button. Choose the option Properties from the menu.
The dialog box Properties of slide appears in which you can customize the properties of the slide.
45
Dialog box with the properties of the slide
Description You can provide each slide with a description. This makes it easier to find a certain slide later.
As a description for this slide you enter: “Slide with question about Olympic sport”.
Background slide A background slide can be displayed behind each normal slide. Using this background slide, you can easily repeat objects, that are automatically displayed on every slide.
Use background slide Select this option if you want to display a background slide behind the current slide. From the dropdown list below this option, you then choose the back-ground slide that you want to display behind this slide.
Jump Use this option to indicate that you don’t necessarily want to go to the next slide when you press or . Enter the number of the slide you want to jump to. If you simply want to go to the next slide, enter a 0.
Setting up the background The second tab in the Properties of slide dialog contains options that can be used to set up the background of the slide. You can select the color of the slide, choose to display a gradient or even select an image to be used as the background.

46
Click on the Background tab, at the top of the dialog.
Dialog box with the properties of the background of the slide
Background The background of a slide can be customized. You can choose from one single color for the entire slide, a gradient from one color to another color, or you can use an image as the background.
Single color If you want your background to be one single color, you select the option Single color. Next, you click the Color ( ) button behind Primary color to select the desired back-ground color.
If you click on the color area of the Color button, the standard Windows color dialog box appears. You can choose a color from this dialog box or define a custom color.

47
Standard color dialog box with custom colors
If you want to use a specific color from your script, but you don’t know exactly which color this is, you can pick up the color using the color picker ( ). When you click on the color picker, the mouse cursor changes in a color picker. You then click on the color you want to use. The selected color can be found in the Custom colors section of the standard color dialog box.
If you click on the small arrow of the Color button, a menu appears from which you can select various colors.
Color menu with a number of col-ors
Here too you can define a custom color by clicking on the More colors button.
Color menu with a number of col-ors and the op-tion to define a custom color
Gradient If you want to make a more dynamic slide, you can use a gradient. Select the option Gra-dient. Next, you click on the Color button behind Primary color to select the primary col-or. This color is used at the top of the slide. Then you click on the Color button behind Secondary color to select the secondary color. This color is used at the bottom of the slide. The background of the slide will show a gradient from the primary color at the top
48
of the slide to the secondary color at the bottom of the slide. From the dropdown list Gradient direction you can choose another direction for the gradient. Directions are indi-cated from the primary color to the secondary color.
Image To completely customize the slide, you can use an image as background. Select the Image option. You can now select a file that is going to be used as a background image, by click-ing on the Browse ( ) button. A standard dialog box to open files appears. Select a loca-tion and the name of the file you want to open.
From the dropdown list Image position you can choose how the image is displayed on the slide.
Fill The image is scaled so that the smallest edge fits along the smallest edge of the slide. A part of the image might be cut off the make the image fit. Fit The image is scaled so that the largest edge fits along the largest edge of the slide. Part of the background color of the slide might stay visible. Stretch The image is scaled so that it fills the entire slide. The original image ratio is not taken into account, which might lead to the image being stretched. Tile The image is placed in the top left corner of the slide and is repeated both horizon-tally and vertically until it fills the entire slide. Center The image is displayed in the center of the slide. Part of the image might be cut off if the image is larger than the slide, or part of the background color of the slide might stay visible when the image is smaller than the slide.
If you want the image to fill the entire slide, use an image of 1024 x 768 pixels for a nor-mal slide, or of 1280 x 800 pixels for a widescreen slide.
Select the Image option. Then, click on the Browse button and select an image. Click on “Open” to use it as a background. Select Center for the Image position.
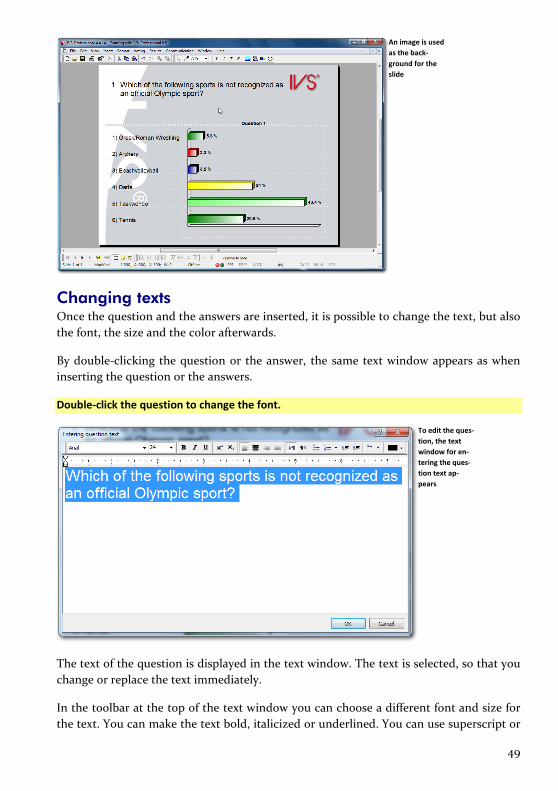
49
An image is used as the back-ground for the slide
Changing texts Once the question and the answers are inserted, it is possible to change the text, but also the font, the size and the color afterwards.
By double-clicking the question or the answer, the same text window appears as when inserting the question or the answers.
Double-click the question to change the font.
To edit the ques-tion, the text window for en-tering the ques-tion text ap-pears
The text of the question is displayed in the text window. The text is selected, so that you change or replace the text immediately.
In the toolbar at the top of the text window you can choose a different font and size for the text. You can make the text bold, italicized or underlined. You can use superscript or

50
subscript. You can left align a paragraph, center it, right align it or justify it, display the text from-left-to-right or from-right-to-left, display bullets in front of each paragraph, use paragraph numbering, indent the paragraph less or more and change the text color.
Change the font to Myriad Pro, 28 points, bold and the color to dark gray. If you don’t have Myriad Pro, you can also use Tahoma, 24 points, bold. Click on “OK” to apply the changes. Do the same to change the font of the answers to Myriad Pro, 20 points, bold and the color to dark red.
The font and color of the question text and answer texts have been changed
Making a new slide Your first slide is now entirely ready. You have inserted a question with some answers and a result diagram to show the results. You put a logo on the background slide and changed the background of the slide, so that it shows an image. You aligned the answers to the bars in the chart and finally you changed the font and color of the question text. Now you are ready to create the next slide.
To create a new slide, you simply go to the next slide. Press the key on your keyboard. Alternatively, you can press or click on the Next slide ( ) button in the lower toolbar.
Because you have only made one slide and there is no next slide, you will be asked if you want to add a new slide. Click “OK” to add a new slide. The new, empty, slide is shown. In the top right corner you will see the logo that you inserted on the background slide.
Press to go to the next slide. Click on “OK” to insert a new slide.

51
A new, empty slide has been inserted
The new slide looks exactly like the first slide you started with. To prevent you from cus-tomizing the background, adjusting the text and positioning the question and answers over and over again, each time you create a new slide, you can adjust these default prop-erties once so that every next slide you create will look the same. These default proper-ties can be adjusted in the template.

52
The template
Besides standard slides and background slides, there is a third type of slide in a script. This slide, of which each script has only one, is the template. On the template slide you will find a question, two answers, a result diagram, a text and a timebar. You can only change the properties of these objects. Adding or removing objects is not possible.
All the object properties you change in the template are automatically applied to all ob-jects on the standard slides and on the background slides of the script. For example, you can change the font and the text color of the question in the template. These changes will be applied to all questions in your script, with the exception of those questions that you manually change the font or text color of.
You could change the properties in the template before you start making a script. This way, all the slides in your script will look the same. But you could also make changes in the template afterwards. And you can save the template separately, so that you can later use it in another script.
Go to the template To switch from the standard slide to the template, you select the option Template from the View menu. Alternatively, you can click on the Template ( ) button in the lower toolbar.
Choose the op-tion Template from the View menu to switch to the template
Choose the option Template from the View menu.
The standard slide disappears and the slide of the template is shown.
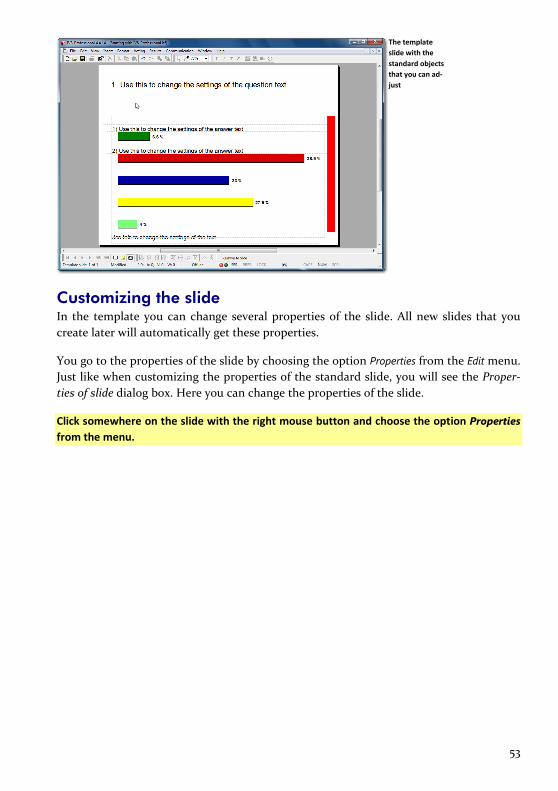
53
The template slide with the standard objects that you can ad-just
Customizing the slide In the template you can change several properties of the slide. All new slides that you create later will automatically get these properties.
You go to the properties of the slide by choosing the option Properties from the Edit menu. Just like when customizing the properties of the standard slide, you will see the Proper-ties of slide dialog box. Here you can change the properties of the slide.
Click somewhere on the slide with the right mouse button and choose the option Properties from the menu.
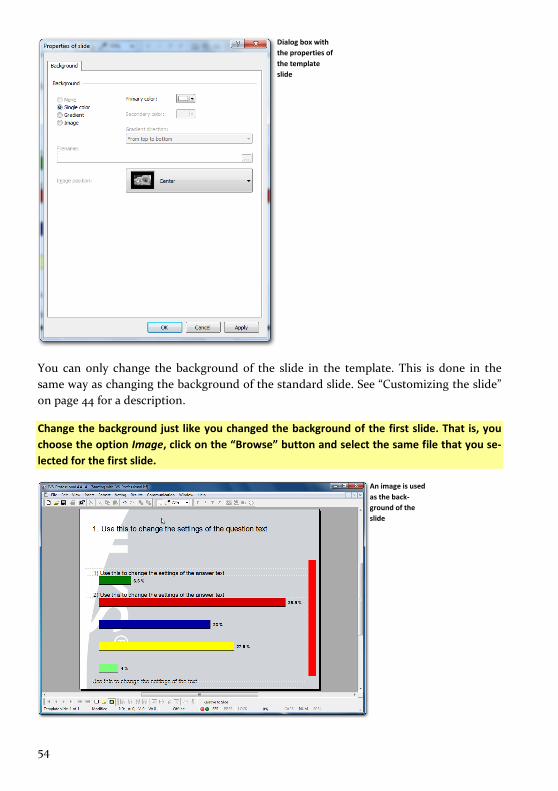
54
Dialog box with the properties of the template slide
You can only change the background of the slide in the template. This is done in the same way as changing the background of the standard slide. See “Customizing the slide” on page 44 for a description.
Change the background just like you changed the background of the first slide. That is, you choose the option Image, click on the “Browse” button and select the same file that you se-lected for the first slide.
An image is used as the back-ground of the slide
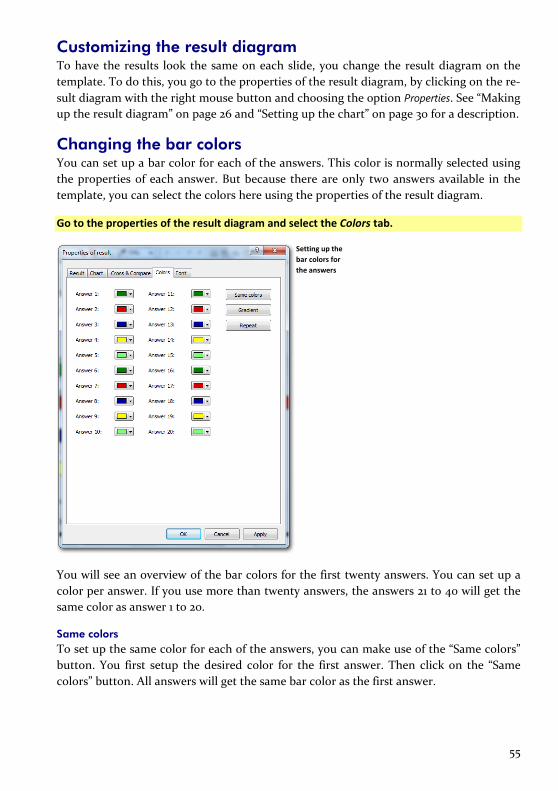
55
Customizing the result diagram To have the results look the same on each slide, you change the result diagram on the template. To do this, you go to the properties of the result diagram, by clicking on the re-sult diagram with the right mouse button and choosing the option Properties. See “Making up the result diagram” on page 26 and “Setting up the chart” on page 30 for a description.
Changing the bar colors You can set up a bar color for each of the answers. This color is normally selected using the properties of each answer. But because there are only two answers available in the template, you can select the colors here using the properties of the result diagram.
Go to the properties of the result diagram and select the Colors tab.
Setting up the bar colors for the answers
You will see an overview of the bar colors for the first twenty answers. You can set up a color per answer. If you use more than twenty answers, the answers 21 to 40 will get the same color as answer 1 to 20.
Same colors To set up the same color for each of the answers, you can make use of the “Same colors” button. You first setup the desired color for the first answer. Then click on the “Same colors” button. All answers will get the same bar color as the first answer.

56
Gradient With the “Gradient” button you can have the bar colors gradually change from one color into the other color. First set up the desired starting color for the first answer. Then you set up the desired ending color for one of the other answers. When you now click on the “Gradient” button the colors will gradually change from the starting color of the first an-swer to the ending color of the answer you set up last.
Repeat After having set up the colors for the first view answers, you can have these colors re-peated for the remaining answers by clicking on the “Repeat” button. For example, if the last color you set was the sixth answer, and you then click the “Repeat” button, answer 7 to 12 will get the same colors as answer 1 to 6, as will answer 13 to 18. And finally answer 19 and 20 will get the same color as answer 1 and 2.
Set the color of the first answer to white. Then click on the “Same colors” button to also set the color of all the other answers to white.
Moving answers The position of the two answers on the template slide determines the position of new an-swers on the standard slides. The position of the first answer determines where the first new answer will be positioned. The position of the second answer determines where the second new answer will be positioned. The third new answer will automatically be posi-tioned on the same distance from answer two, as answer two is positioned in relation to answer one. The distance between both answers on the template therefore determines the distance between all subsequent answers.
Using the grid When moving answers, you can freely move them around the slide. To align the answers, so that each answer has its left side on the same position, you use the option Align or dis-tribute from the Edit menu. See also “Aligning objects” on page 40.
Another method to left-align the answers is by using the grid. When you activate the grid, you will see a grid of dots displayed on the slide. You can have all objects automati-cally align to these dots. You can activate the grid, by selecting the option Display grid from the View menu. Alternatively you can press + + on the keyboard.
From the View menu, choose the option Display grid.
A grid of dots is now displayed on the slide.

57
The grid has been activated which allows for automatic object alignment
After activating the grid, you have to set up how you want the objects to automatically align to the grid. You can choose to have an object automatically align horizontally only, or vertically only, or both horizontally and vertically.
To do this, you select the option Snap to grid from the View menu, and then you select the option Horizontal or Vertical.
Select the option Snap to grid from the View menu and subsequently select the option Hori-zontal. Make sure the option Vertical is switched off.
When moving an object around, you can place it very precisely vertically, but horizontal-ly it will always be placed on a grid marker. This allows you to easily align the objects.
Alternatively, you can move objects in a horizontal or vertical direction only by keeping the key pressed while moving the object. As long as you keep the key pressed, you can move the object only in a horizontal direction, or only in a vertical direction. If you release the key, you can move the object in any direction again.
Move the result diagram somewhat to the left, so that the left side is placed exactly on a grid marker.
For the remainder of this manual, the grid is no longer used. You can deactivate the grid by selecting the option Display grid from the View menu again. You also have to deactivate the option Snap to grid from the View menu, to prevent objects from still being aligned to the grid.
Select the option Display grid from the View menu to deactivate it. Select the option Snap to grid and then Horizontal from the View menu to deactivate this.
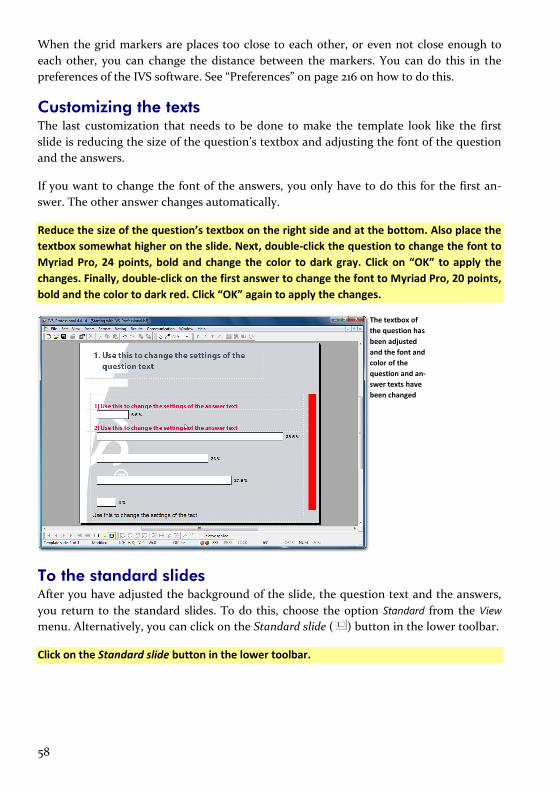
58
When the grid markers are places too close to each other, or even not close enough to each other, you can change the distance between the markers. You can do this in the preferences of the IVS software. See “Preferences” on page 216 on how to do this.
Customizing the texts The last customization that needs to be done to make the template look like the first slide is reducing the size of the question’s textbox and adjusting the font of the question and the answers.
If you want to change the font of the answers, you only have to do this for the first an-swer. The other answer changes automatically.
Reduce the size of the question’s textbox on the right side and at the bottom. Also place the textbox somewhat higher on the slide. Next, double-click the question to change the font to Myriad Pro, 24 points, bold and change the color to dark gray. Click on “OK” to apply the changes. Finally, double-click on the first answer to change the font to Myriad Pro, 20 points, bold and the color to dark red. Click “OK” again to apply the changes.
The textbox of the question has been adjusted and the font and color of the question and an-swer texts have been changed
To the standard slides After you have adjusted the background of the slide, the question text and the answers, you return to the standard slides. To do this, choose the option Standard from the View menu. Alternatively, you can click on the Standard slide ( ) button in the lower toolbar.
Click on the Standard slide button in the lower toolbar.

59
The standard slide has changed to fol-low the settings in the template
You can see that the slide has changed to follow the settings in the template.
Reapplying the template The changes you made in the template do not entirely match the changes you made be-fore on the first slide of your script. The first slide still differs from the template.
If you go back to the previous slide you can see that some of the settings from the tem-plate are applied to this slide, and some are not. You can go back one slide by clicking on the Previous slide button ( ) in the lower toolbar. Alternatively you can press or on the keyboard.
Go back to the previous slide by pressing on the keyboard.
Normally, all setting are taken from the template. If you make changes to the template and then return to the normal slides, all these changes are immediately followed by the normal slides. However, if you make changes to a normal slide so that it differs from the template, then this slide will always keep its own settings, regardless of whether you make any more changes to the template.
On the first slide for example, you changed the position of the result diagram. Even though you also did this on the template, the result diagram still kept its own position. The same is true for the position of the question.
If you want this slide to look exactly like the slide you set up in the template, you can re-apply the template to this slide. To do this, you choose the option Reapply template from the Format menu.
Choose the Reapply template option from the Format menu.
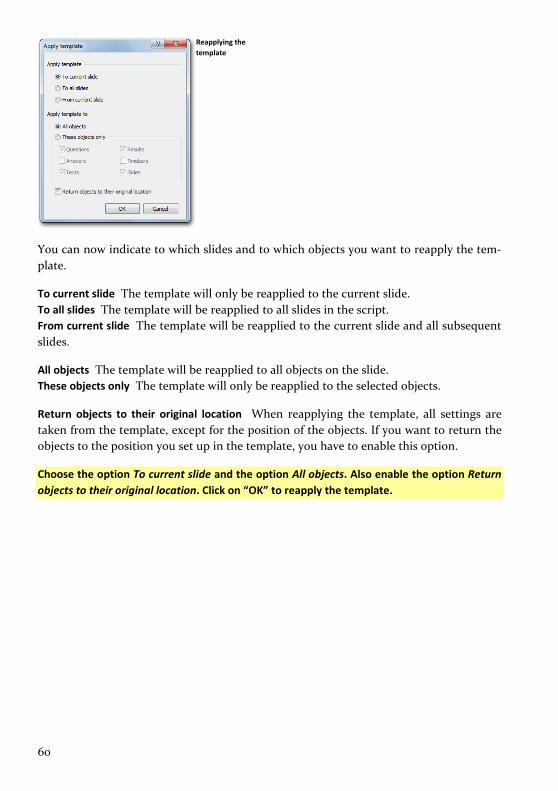
60
Reapplying the template
You can now indicate to which slides and to which objects you want to reapply the tem-plate.
To current slide The template will only be reapplied to the current slide. To all slides The template will be reapplied to all slides in the script. From current slide The template will be reapplied to the current slide and all subsequent slides.
All objects The template will be reapplied to all objects on the slide. These objects only The template will only be reapplied to the selected objects.
Return objects to their original location When reapplying the template, all settings are taken from the template, except for the position of the objects. If you want to return the objects to the position you set up in the template, you have to enable this option.
Choose the option To current slide and the option All objects. Also enable the option Return objects to their original location. Click on “OK” to reapply the template.

61
The template has been reap-plied to the first slide
Aligning answers By reapplying the template, the answers are no longer aligned in front of the bars. Before, the answers were placed neatly in front of the bars by moving the first and last answer manually. Then, the other answers were aligned by using the Align left and Distribute verti-cally options. This way of aligning always works and works for all types of objects.
The option Align answers from the Edit menu also allows you to align the answers. This op-tion only distributes the answers vertically, just like the Distribute vertically option, and places the answers exactly in front of, exactly on top of, or exactly below the bars in the chart. This option only works for answers, and not for other types of objects. And this op-tion only works when there is a result diagram with results in it on the slide.
To align the answers in front of or on top of the bars, this option takes into account the height of the textbox of the answer. When aligning in front of the bars, the center of the textbox is aligned with the center of the bar. When aligning on top of the bars, the text-box is placed with the bottom edge exactly on top of the bar. When aligning below the bars, the textbox is placed with the top edge exactly on the bottom of the bar.
Choose the option Align answers from the Edit menu and then the option On top of the bars.

62
The answers are neatly aligned on top of the bars
Go back to the next slide by pressing .
Saving the template After you have adjusted the template to your wishes, you can save it for later use. You can save the template by choosing Save template from the Format menu.
Choose the option Save template from the Format menu.
The standard dialog box for saving files appears, in which you enter the name of the template. Always save your template in the Templates folder, that is automatically select-ed. This will make it appear in the start-up screen when you start the IVS software.
The standard dialog box for saving files

63
Enter the name of this template: “IVS” and click on the “Save” button to save the template.
Saving the script After having saved the template, it is recommended to also save the script. Click on the Save ( ) button in the toolbar to save your script.
While making your script, do not forget to save it regularly.
64
Asking a reference question
The first question in a script is often a practice question. With this question, the audi-ence can become acquainted with the voting system. The audience can practice with giv-ing an answer, and, when necessary, correcting an already given answer. The results are immediately and interactively displayed on screen, so that the audience can see that something really happens when they push a button on their keypad. A practice question is often a question based on current affairs. Most of the times, one of the answers given is the correct answer, while one of the other answers is obviously the wrong one.
The second question in a script is often a reference question. Using a reference question, you can divide the audience into certain groups. With all the other questions, you can then show how these are answered by the different groups.
A simple reference question could be: “Are you:”, with possible answers being: “Man” and “Woman”. With all the other questions, you can show what both the men and the wom-en answered to this question. Viewing the results, divided into the groups of a reference question, is called crossing.
You can make multiple reference questions in one script.
Inserting a reference question Insert a new question into the still empty second slide. Add two answers and insert a re-sult diagram. See also “Making a question” on page 13, “Adding answers” on page 14 and “Adding a result diagram” on page 16.
Create a question with the following text: “Are you:”, two answers with the text: “Man” and “Woman” and add a result diagram.
You see the question immediately appear in the font and the color that you set up in the template. The two answers appear at the same position as where you placed them in the template and the result diagram shows horizontal bars. But, the result diagram now shows two bars for the two answers, and not five bars like in the template. That is why the answers are not at the same height as the bars. You will have to realign the answers on top of the bars.
Choose the option Align answers from the Edit menu and then the option On top of the bars.

65
A simple refer-ence question has been insert-ed as the second question in the script
The properties of a question After inserting a question, it still is a normal question. In the properties of the question, you have to indicate that this is a reference question.
You go to the properties of the question by clicking on it with the right mouse button and choosing the option Properties from the menu.
Click on the question with the right mouse button and choose Properties from the menu.
The dialog box Properties of question appears, in which you can change the properties of the question.

66
Dialog box with the properties of the question
Numbering Each question is automatically numbered. Therefore you cannot change the number of a question. You can select the style of the number though. If you want display your ques-tion without a number, you select “None” as a style.
Question options In the question options you determine the type of question you want to ask. This primar-ily relates to the way results are displayed.
Display mean If you enable this option, the mean value (x) of the results will be displayed just below the result diagram. Although you can enable this option for every kind of question, it is only useful for rating questions. These are questions where you ask your audience to give a rating from, for instance, 1 to 5.
Display deviation If you enable this option, the standard deviation (d) of the results will be displayed just below the result diagram. Like with the mean value, this option can be enabled for every kind of question, but it is only useful for rating questions.
Display answers next in rank If you choose to display your answers next in rank, the an-swer that received most of the votes will be displayed at the top or on the left of the chart and the answer that received the least number of votes will be displayed at the bottom or on the right of the chart. Please note that when using this option, you also need to use the option Legend text on axis or the option Display legend (see also “Legend” on page 28), otherwise you don’t know which bar belongs to which answer.
67
Calculate answers next in rank If a question can be voted more than once, the given an-swers can be calculated next in rank. For example, if you allow a question to be voted three times, the first answer given will get three votes, the second answer two votes, and the last answer one vote. If the answers are not calculated next in rank, each answer giv-en will only get one vote.
Last answer does not belong to total With this option the results of the last answer are not counted when determining the total number of votes. This last answer will always show an absolute number of votes, while all the other answers together represent 100% of the votes. This option is especially useful when the answers are yes / no / abstain, and the abstentions will not be counted when determining the total.
Answers from high to low This option can be used to show the answers the other way around in the chart. Normally, answer 1 is at the top or on the left side of the chart. By enabling this option, answer 1 will be at the bottom or at the right side of the chart.
Reference question This option indicates that this question is a reference question. This allows the audience to be divided into groups.
Group question With a group question you can have your audience divide them-selves into different groups. The answers of a group question determine the groups. When the audience votes on a group question, the choice they make is stored in the participants list. This will overwrite an existing grouping, that you had programmed before in a participants list. Someone who does not vote, will stay in the group he was originally assigned to. This option is only available when the option Identified voting is also enabled. For more information about pro-gramming groups in a participants list, see “A list of participants based on names” on page 114.
Use voting time When this option is enabled, the program can keep track of the amount of time that goes by before a participant makes a choice. If this option is not enabled, the voting time for this question is not recorded and each participant will get a time of 0.00 seconds. For more information, see “An overview of the score per participant” on page 203.
Identified voting This option indicates whether this question should be voted with or without identification. If the question has to be voted with identification, each participant has to put his chip card into the keypad to be able to vote. This option is only available in IVS-Professional. If you use IVS-Basic, you can only vote anon-ymously.
Use vote weight By enabling this option, the voting weight of the individual par-ticipant is taken into account. This option is only available if you also enabled the Identified voting option.

68
Knock-out race This option indicates that the current question is part of a knock-out race. Only participants that are still in the race can vote on this question. This option is only available if you have also enabled the Identified voting option. For more information, see “The knock-out race” on page 214.
Number of answers If you had already added answers to this question, the number of an-swers you added will be displayed here. If you don’t add any answers, then you determine here how many answer options you want for this question. See also “A rating question without answers” on page 73.
Identification group If you use identified voting, you can indicate which identifica-tion group will be used for this question. An identification group determines which group the participants are in and what their voting weight is.
Default score If you want to calculate a total score based on the given answers, you can assign points to each answer. Additionally, you can assign a default score to the question. All participants that answer this question will get the points as-signed to the answer they give added to their total score. Participants that do not vote, will get the default score added to their total score.
Legend & Colors You can set up the legend text of this question and the colors for the correct and wrong answers.
Legend text Here you can enter the legend text for this question. The legend text will be displayed in the legend when you are comparing questions. By default, the legend text is equal to the question text, with a maximum of 32 characters. When the question text is too long, you can enter a shorter version here. Also see “Comparing questions” on page 89.
Correct answer Here you can set up a color that the bars, belonging to the correct an-swer, will get when you show the correct answer. See also “Showing the correct answer” on page 93.
Wrong answer Here you can set up a color that the bars, belonging to the wrong answer, will get when you show the correct answer.
Voting options Using the voting options, you can set up extra options of the keypad while you are voting this question.
Use enter key This option determines that your audience not only has press the key of their choice, but also has to confirm the choice by pressing the Enter key on the keypad. If you ask a question with more than ten answers, your audience always has to confirm

69
their choice using the Enter key, regardless of this option. This option only applies when you use RF-I or RF-II keypads.
Use correction key This option determines whether an already cast vote can be corrected by pressing the Correction key on the keypad. After casting a vote, the correction key can be used to withdraw the vote and a new choice can be made. When you use RF-I key-pads, this option cannot be combined with the option Use enter key.
Use scroll keys This option determines whether or not the scroll keys on the keypad can be used. These keys allow your audience to scroll through the earlier given answers, when more than one answer can be given. This option can only be used when the option Times to vote is set to more than one and when you use RF-II keypads.
Allow double votes When this option is enabled, a question that allows more than one answer to be given, accepts the same answer more than once. This option can only be used when the option Times to vote is set to more than one. If you use RF-I or Lite key-pads, it will still be possible to vote for the same answer more than once, but these dou-ble votes will be ignored by the software. If you use RF-II keypads, the keypad will not accept a double vote. In that case, the choice made will blink in the LCD screen.
Maximum times to vote This option determines how many answers can be given. This can be used when you need your audience to choose three answers from a list of ten pos-sibilities. See also “Voting a question more than once” on page 98.
Minimum times to vote This option is only available when a question can be voted more than once. The minimum times to vote determines how many times a participant has to vote before his votes are counted.
Automatically close after receiving this many votes With this option you can have the vot-ing automatically close after a fixed number of votes are received. This option can be used when you have a small audience in which everyone is forced to vote. The voting will be automatically closed after the last person has cast his vote. If you enter 0, the voting will not be closed automatically.
Select the option Reference question and click on “OK”.
A second reference question Following on the first reference question, you can ask another reference question, with which you divide your audience into other groups, for instance, the sector in which one is employed.
First create a new slide, insert a question with five answers and a result diagram. Because this question has five answers, the answers are perfectly aligned on top of the bars of the chart, just as you had set up the answers in the template. In the properties of the question you indicate that this is a reference question.
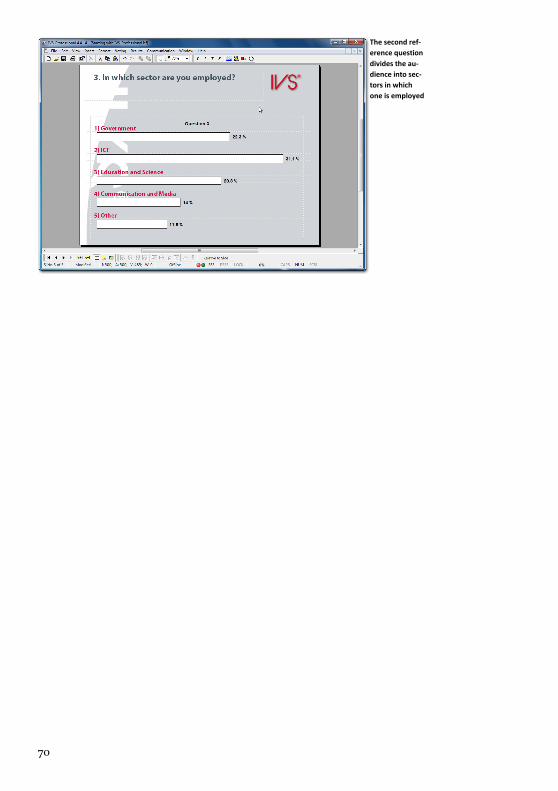
70
The second ref-erence question divides the au-dience into sec-tors in which one is employed

71
Asking a rating question
With a rating question, your audience does not make a choice from a number of answers, but instead gives a rating on a certain subject. For example, people can rate a subject on a 5-point scale or a 10-point scale. If you use a rating question like this, you do not have to add any answers.
You can also use a rating question with more descriptive answers, like from “very bad” to “very good” or from “fully agree” up “fully disagree”. Of course, if you use a rating ques-tion like this, you have to add the answers.
Using a rating question, you can also show the mean (x) and standard deviation (d) of the results. This allows you to see what your audience on average thinks about the sub-ject, and how the results are scattered around this average.
A rating question with answers To ask a rating question with a descriptive rating, you have to insert a question with a couple of answers.
Create a new slide. Insert a question with the following text: “To take greater pleasure in working, better coffee is needed. Do you agree with this proposition?”. Also add a result dia-gram.
A rating ques-tion allows your audience to ex-press their opin-ion about a cer-tain proposition
Inserting a fixed set of answers When asking a rating question with a descriptive rating, you mostly insert a number of fixed answers. For each rating question you insert for example two answers, ‘I agree’ and

72
‘I disagree’. Or you have a rating question with five answers, varying from ‘I fully disa-gree’ to ‘I fully agree’.
For these types of questions you can very easily insert the same set of answers. From the Insert menu, you choose the option Answers from template and then you choose one of the predefined sets of answers.
The Answers from template option allows you to easily in-sert a fixed set of answers
Choose the Answers from template option from the Insert menu and then the option I com-pletely disagree..I completely agree. The five answers are automatically inserted.
The five answers from the fixed set are automat-ically inserted
The mean and deviation To show both the mean and deviation for this rating question, you go to the properties of the question and check the options Display mean and Display deviation. The mean and the standard deviation are shown at the bottom of the result diagram.
Click on the question with the right mouse button and choose the option Properties. In Prop-erties of question the dialog box you check the options Display mean and Display deviation.

73
Click on “OK” to apply the settings and close the dialog box. Because the result diagram now displays the mean and standard deviation, the bars are moved up a little. Realign the an-swers so that they are on top of the bars again.
Both mean and deviation are displayed with this rating ques-tion
A rating question without answers If you ask a rating question where your audience has to give a mark, you do not have to insert answers. Instead, in the properties of the question, you set the number of answer options you want to allow for this question.
Create a new slide. Insert a question with the following text: “A number of people have complained about the poor quality of the coffee. On a scale of 1 to 10, how would you rate the quality of the coffee?” and insert a result diagram. Enlarge the text box of the question a little, so that the entire text fits into the box.

74
A rating ques-tion where the audience has to give a mark to a certain subject
In the properties of the question you have to set that you want to use ten answers.
Go to the properties of the question and set the Number of answers to 10. Also check the op-tions Display mean and Display deviation. Click on “OK” to apply the settings.
A rating ques-tion with 10 possible answers
This horizontal chart barely leaves room for the bars. You can better turn this horizontal chart into a vertical chart. And because the lack of answer options, there is no direct rela-tion between the answers and the bars. To reestablish this relation, you can display the legend text along the axis. Both options are set in the properties of the result diagram.
Go to the properties of the result diagram. Check the option Legend text on axis. Next, go to the Chart page and select Column chart from the Chart type options.
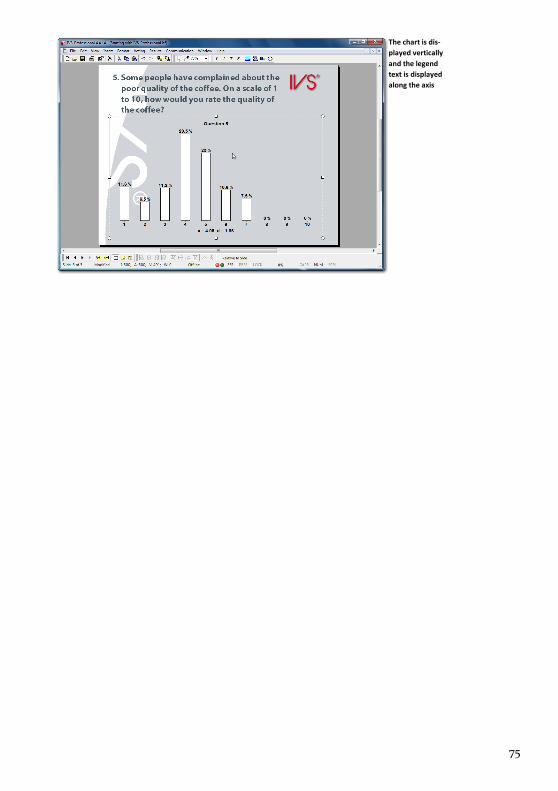
75
The chart is dis-played vertically and the legend text is displayed along the axis
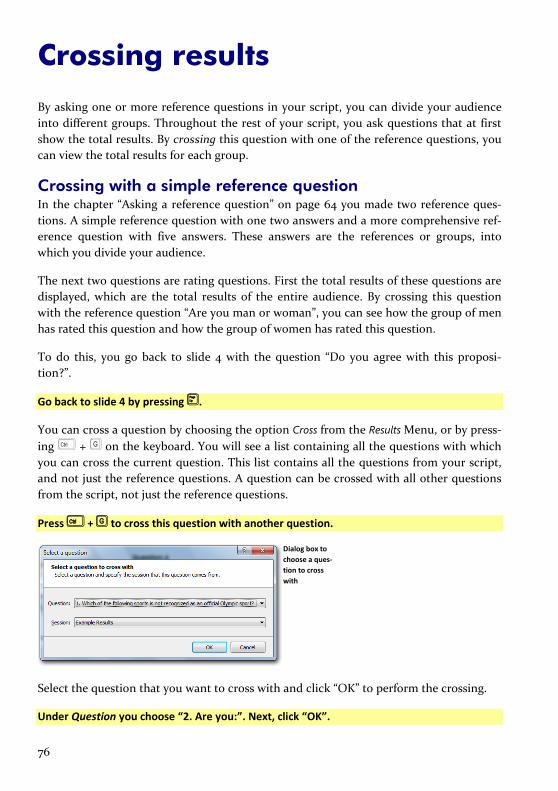
76
Crossing results
By asking one or more reference questions in your script, you can divide your audience into different groups. Throughout the rest of your script, you ask questions that at first show the total results. By crossing this question with one of the reference questions, you can view the total results for each group.
Crossing with a simple reference question In the chapter “Asking a reference question” on page 64 you made two reference ques-tions. A simple reference question with one two answers and a more comprehensive ref-erence question with five answers. These answers are the references or groups, into which you divide your audience.
The next two questions are rating questions. First the total results of these questions are displayed, which are the total results of the entire audience. By crossing this question with the reference question “Are you man or woman”, you can see how the group of men has rated this question and how the group of women has rated this question.
To do this, you go back to slide 4 with the question “Do you agree with this proposi-tion?”.
Go back to slide 4 by pressing .
You can cross a question by choosing the option Cross from the Results Menu, or by press-ing + on the keyboard. You will see a list containing all the questions with which you can cross the current question. This list contains all the questions from your script, and not just the reference questions. A question can be crossed with all other questions from the script, not just the reference questions.
Press + to cross this question with another question.
Dialog box to choose a ques-tion to cross with
Select the question that you want to cross with and click “OK” to perform the crossing.
Under Question you choose “2. Are you:”. Next, click “OK”.
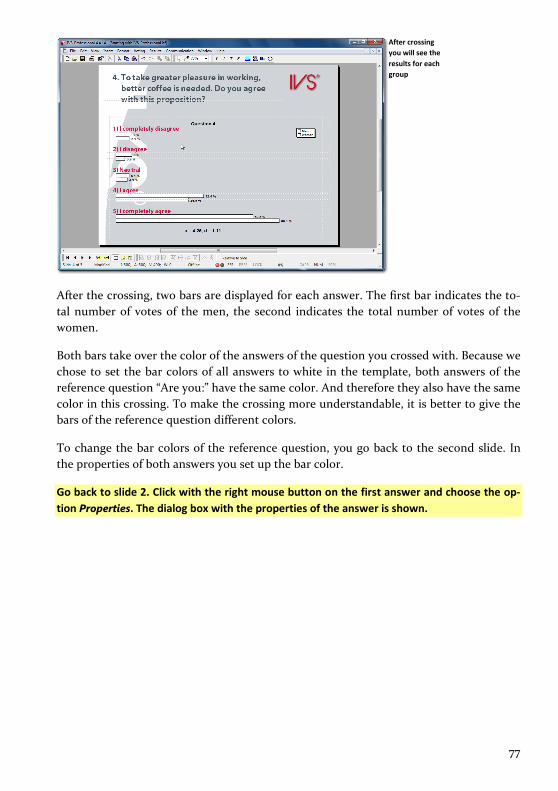
77
After crossing you will see the results for each group
After the crossing, two bars are displayed for each answer. The first bar indicates the to-tal number of votes of the men, the second indicates the total number of votes of the women.
Both bars take over the color of the answers of the question you crossed with. Because we chose to set the bar colors of all answers to white in the template, both answers of the reference question “Are you:” have the same color. And therefore they also have the same color in this crossing. To make the crossing more understandable, it is better to give the bars of the reference question different colors.
To change the bar colors of the reference question, you go back to the second slide. In the properties of both answers you set up the bar color.
Go back to slide 2. Click with the right mouse button on the first answer and choose the op-tion Properties. The dialog box with the properties of the answer is shown.
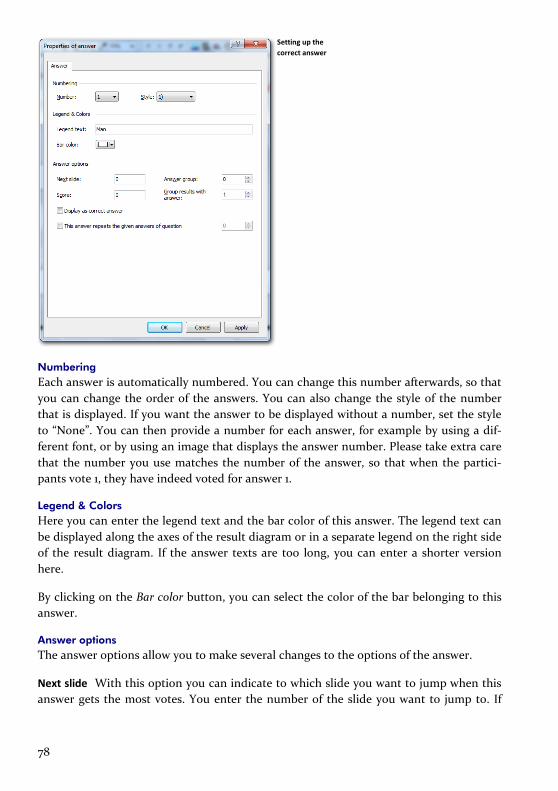
78
Setting up the correct answer
Numbering Each answer is automatically numbered. You can change this number afterwards, so that you can change the order of the answers. You can also change the style of the number that is displayed. If you want the answer to be displayed without a number, set the style to “None”. You can then provide a number for each answer, for example by using a dif-ferent font, or by using an image that displays the answer number. Please take extra care that the number you use matches the number of the answer, so that when the partici-pants vote 1, they have indeed voted for answer 1.
Legend & Colors Here you can enter the legend text and the bar color of this answer. The legend text can be displayed along the axes of the result diagram or in a separate legend on the right side of the result diagram. If the answer texts are too long, you can enter a shorter version here.
By clicking on the Bar color button, you can select the color of the bar belonging to this answer.
Answer options The answer options allow you to make several changes to the options of the answer.
Next slide With this option you can indicate to which slide you want to jump when this answer gets the most votes. You enter the number of the slide you want to jump to. If

79
you only want to go to the next slide, enter a 0. After closing the voting, you can press or to go to the slide you indicated.
Answer group You can group several answers together in a certain group. If you allow a question to be voted on more than once, it will only be possible to choose answers that are in the same answer group. When an answer from a different answer group is chosen, all other given answers will be discarded. For example, if you can vote three times on a certain question, and someone first votes for an answer from answer group 1, next for an-other answers from answer group 1 and finally for an answer from answer group 2. In this case, only the last answer from answer group 2 will be counted. The first two given an-swers are not canceled, so it’s not possible to still choose three answers from answer group 2.
Score If you want to make use of a total score for your participants, you can assign a cer-tain score to each answer. All participants that choose this answer, will get the score that is assigned to this answer added to their total score.
Group results with answer With this option you can have the votes, that were originally meant for this answer, added to a different answer. For this answer, no results will be displayed. For instance, if you want to group the results of answers 2, 3 and 4 together, you go to the properties of answer 3 and 4, and indicate that the results have to be grouped with answer 2. All the votes that came in for answer 2, 3 and 4 are now all added together and displayed with answer 2. Answer 3 and 4 will not display any results.
Display as correct answer With this option you indicate that you want this answer to be displayed as a correct answer. When displaying the correct answer, all answers that you indicated to be displayed as correct, will have their bar displayed in green, while all other answers will have their bar displayed in red.
This answer repeats the given answers of question This option turns this answer into a special case. If this option is enabled, it is no longer possible to vote for this answer itself. Instead, votes given to a previous question will automatically be repeated for this ques-tion. Behind this option you enter the question number from which you want to repeat the votes. This option can be combined with the option to allow a question to be voted more than once. In that case, all the votes given for the previous question will be repeat-ed for this question by only selecting this single answer.
Set the bar color to blue and click on “OK” to apply it. Next, click with the right mouse button on the second answer and choose the option Properties. Set the bar color to pink and click on “OK” to apply it. Go back to slide 4 and cross this question again by pressing + , select-ing question 2 and clicking “OK”.
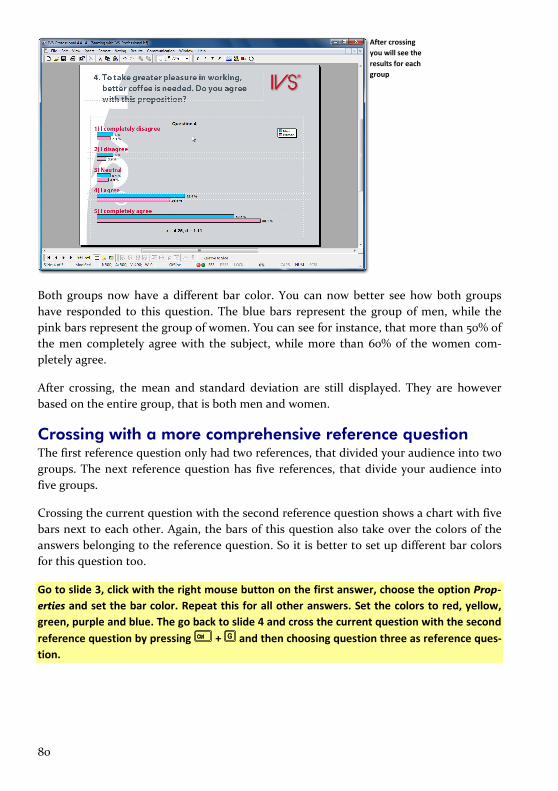
80
After crossing you will see the results for each group
Both groups now have a different bar color. You can now better see how both groups have responded to this question. The blue bars represent the group of men, while the pink bars represent the group of women. You can see for instance, that more than 50% of the men completely agree with the subject, while more than 60% of the women com-pletely agree.
After crossing, the mean and standard deviation are still displayed. They are however based on the entire group, that is both men and women.
Crossing with a more comprehensive reference question The first reference question only had two references, that divided your audience into two groups. The next reference question has five references, that divide your audience into five groups.
Crossing the current question with the second reference question shows a chart with five bars next to each other. Again, the bars of this question also take over the colors of the answers belonging to the reference question. So it is better to set up different bar colors for this question too.
Go to slide 3, click with the right mouse button on the first answer, choose the option Prop-erties and set the bar color. Repeat this for all other answers. Set the colors to red, yellow, green, purple and blue. The go back to slide 4 and cross the current question with the second reference question by pressing + and then choosing question three as reference ques-tion.
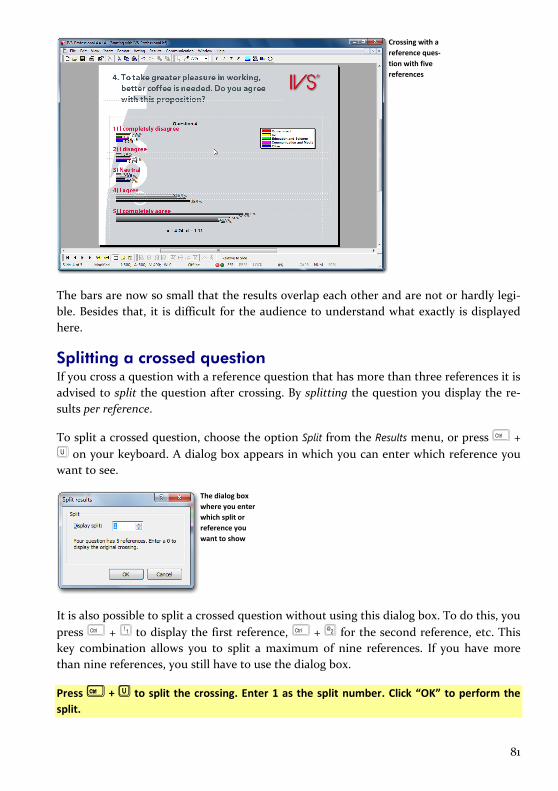
81
Crossing with a reference ques-tion with five references
The bars are now so small that the results overlap each other and are not or hardly legi-ble. Besides that, it is difficult for the audience to understand what exactly is displayed here.
Splitting a crossed question If you cross a question with a reference question that has more than three references it is advised to split the question after crossing. By splitting the question you display the re-sults per reference.
To split a crossed question, choose the option Split from the Results menu, or press + on your keyboard. A dialog box appears in which you can enter which reference you want to see.
The dialog box where you enter which split or reference you want to show
It is also possible to split a crossed question without using this dialog box. To do this, you press + to display the first reference, + for the second reference, etc. This key combination allows you to split a maximum of nine references. If you have more than nine references, you still have to use the dialog box.
Press + to split the crossing. Enter 1 as the split number. Click “OK” to perform the split.
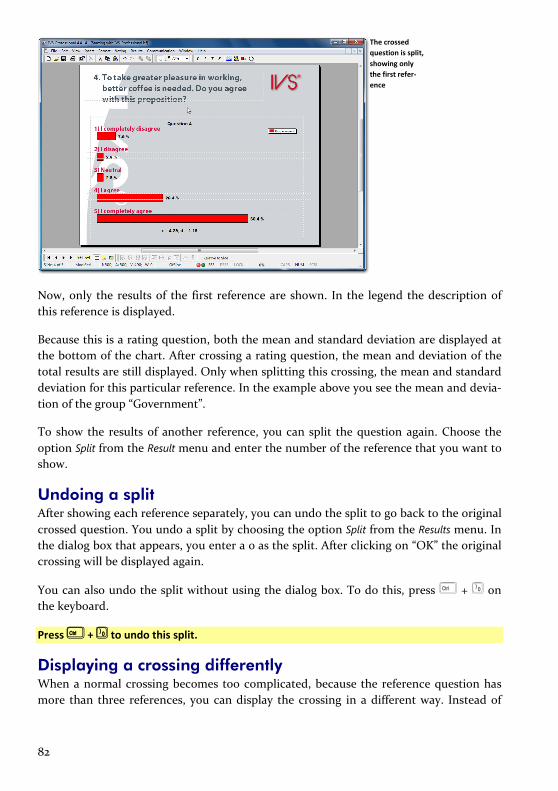
82
The crossed question is split, showing only the first refer-ence
Now, only the results of the first reference are shown. In the legend the description of this reference is displayed.
Because this is a rating question, both the mean and standard deviation are displayed at the bottom of the chart. After crossing a rating question, the mean and deviation of the total results are still displayed. Only when splitting this crossing, the mean and standard deviation for this particular reference. In the example above you see the mean and devia-tion of the group “Government”.
To show the results of another reference, you can split the question again. Choose the option Split from the Result menu and enter the number of the reference that you want to show.
Undoing a split After showing each reference separately, you can undo the split to go back to the original crossed question. You undo a split by choosing the option Split from the Results menu. In the dialog box that appears, you enter a 0 as the split. After clicking on “OK” the original crossing will be displayed again.
You can also undo the split without using the dialog box. To do this, press + on the keyboard.
Press + to undo this split.
Displaying a crossing differently When a normal crossing becomes too complicated, because the reference question has more than three references, you can display the crossing in a different way. Instead of

83
placing the bars side by side in the bar chart, it is also possible to stack them on top of each other.
To do this, you go to the properties of the result diagram. Open the tab Cross & Compare and choose the option stacked under Cross. The bars of the various references are now stacked on top of each other instead of side by side. This makes it easier to see the rela-tionship between the various groups and also the relationship between the various an-swers. The percentages that are displayed while stacking the bars on top of each other are hardly visible. It is better to leave them out.
Go to the properties of the result diagram. Open the tab Chart and disable the option Display values. Next, open the tab Cross & Compare and choose the option stacked under Cross. Fi-nally, click on “OK”.
A crossing which displays the bars stacked on top of each other instead of side by side
Back to the normal results To return to the normal, uncrossed results of this question, you choose the option Normal from the Results menu. You can also press + on your keyboard.
Press + to show the normal results again.

84
The normal, to-tal results are displayed again
The results are still displayed without percentages. In the following examples these per-centages are used again, so you can now enable them again in the properties of the re-sults diagram.
Click with the right mouse button on the result diagram and choose the option Properties. Open the Chart tab and enable the option Display values.
Crossing with multiple reference questions In IVS-Professional you can cross a question with up to five reference questions. By first crossing a question with the reference question “Are you man or woman” and then with the reference question “In which sector are you employed”, you can see what the men that are employed in the sector “Government” have answered, or what the women that are employed in the sector “Communication and Media” have answered.
To cross a question with two reference questions, you first cross the question with the first reference question. Then you split this question to the reference you are interested in. Finally, you cross this question again with the second reference question. This cross-ing can also be split into the separate references.
Press + to cross this question with another question. Under Question you choose question 2 “Are you:”. Next, click on “OK”. Press + to split this crossing. You now only see the results of the men.

85
The first crossing is split into the reference “Man”
Press + again to cross this question with another question. Under Question choose question 3 “In which sector are you employed?”. Next, click on “OK”. You now see an over-view of all men, in which sector they are employed and what they have answered to this question.
The reference “Man” has been crossed again with a second reference ques-tion
Here you can see what all the men, divided into different sectors, have answered. At the top of the result diagram, you see the first reference.
This crossing can also be split again, to display the results per reference.
Press on + to split this crossing. You now only see the results of the men that are em-ployed in the sector “Education and Science”.

86
The second crossing is split into the refer-ence “Education and Science”, so that only the re-sults of the ref-erences “Man” and “Education and Science” are displayed
When necessary, you can cross this split again. In that case, you can see both previous references “Man, Education and Science” displayed at the top of the result diagram.
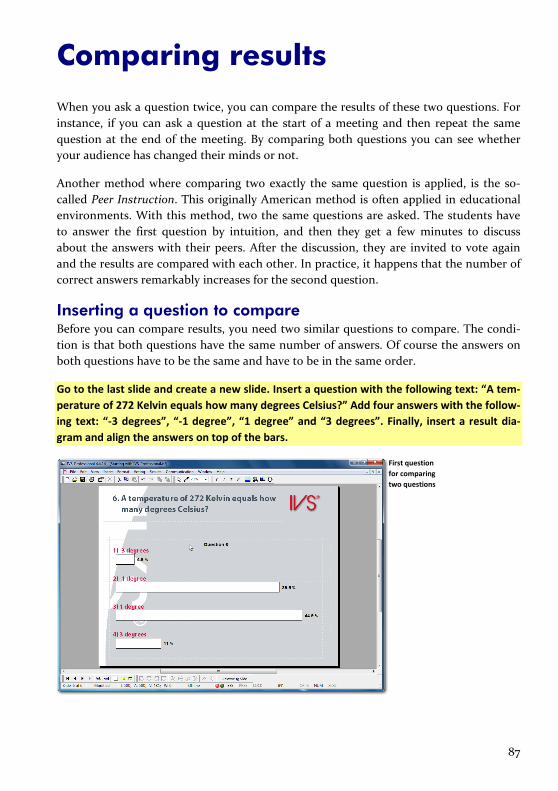
87
Comparing results
When you ask a question twice, you can compare the results of these two questions. For instance, if you can ask a question at the start of a meeting and then repeat the same question at the end of the meeting. By comparing both questions you can see whether your audience has changed their minds or not.
Another method where comparing two exactly the same question is applied, is the so-called Peer Instruction. This originally American method is often applied in educational environments. With this method, two the same questions are asked. The students have to answer the first question by intuition, and then they get a few minutes to discuss about the answers with their peers. After the discussion, they are invited to vote again and the results are compared with each other. In practice, it happens that the number of correct answers remarkably increases for the second question.
Inserting a question to compare Before you can compare results, you need two similar questions to compare. The condi-tion is that both questions have the same number of answers. Of course the answers on both questions have to be the same and have to be in the same order.
Go to the last slide and create a new slide. Insert a question with the following text: “A tem-perature of 272 Kelvin equals how many degrees Celsius?” Add four answers with the follow-ing text: “-3 degrees”, “-1 degree”, “1 degree” and “3 degrees”. Finally, insert a result dia-gram and align the answers on top of the bars.
First question for comparing two questions

88
Setting the correct answer The question that is asked is a knowledge question. After asking this question and show-ing the results, you can see how many people in the audience knew the correct answer. If desired you can also show the correct answer. The bar that belongs to the correct answer will turn green while all the others will turn red.
To show the correct answer you have to set up one or more of the answers to be the cor-rect one. Setting the correct answer is done in the properties of the corresponding an-swer. It is possible to set up more than one correct answer.
Click on the second answer with the right mouse button and choose the option Properties. Enable the option Display as correct answer. Click on “OK” to apply the settings.
Copying a slide To compare two questions with each other, both questions need to be identical. The eas-iest way to achieve this is to copy the entire slide with the first question.
You can copy an entire slide by choosing the option Copy from the Edit menu, provided that no objects are selected. Alternatively, you can click on the Copy ( ) button or press the + keys on the keyboard. To insert the copied slide as a new slide, you choose the option Paste from the Edit menu. Alternatively, you can click on the Paste ( ) button or press the + keys on the keyboard.
Click anywhere on the slide to be sure that no objects are selected. Next, click on the Copy button in the toolbar and then on the Paste button.
A new slide has been inserted that is identical to the copied slide. The only exception is the question that automatically got a new number. All objects on the newly inserted slide are automatically selected.
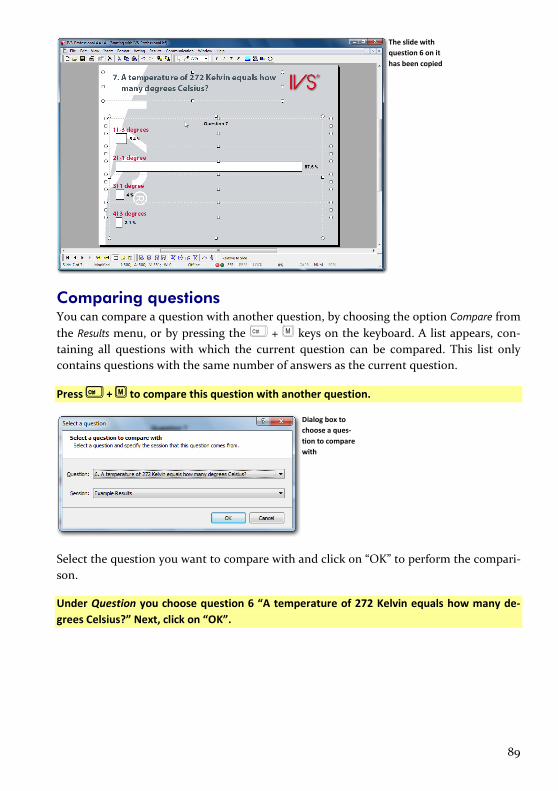
89
The slide with question 6 on it has been copied
Comparing questions You can compare a question with another question, by choosing the option Compare from the Results menu, or by pressing the + keys on the keyboard. A list appears, con-taining all questions with which the current question can be compared. This list only contains questions with the same number of answers as the current question.
Press + to compare this question with another question.
Dialog box to choose a ques-tion to compare with
Select the question you want to compare with and click on “OK” to perform the compari-son.
Under Question you choose question 6 “A temperature of 272 Kelvin equals how many de-grees Celsius?” Next, click on “OK”.

90
Questions are compared to one another
In the chart you see the results of both questions next to each other. The lower bars rep-resent the results of the current question, while the upper bars represent the results of the question that you compared with.
The color of the bars can be changed in the properties of the result diagram on the tem-plate slide. On the Cross & Compare tab, you can set up the colors for a maximum of ten bars.
The legend shows the legend text of both questions. By default, this legend text is equal to the question text, with a maximum of 32 characters.
To modify the legend text, you go to the properties of the question. Under Legend & Col-ors you enter the text that you want to be displayed in the legend as Legend text.
Go to the previous slide. Click on the question with the right mouse button and choose the option Properties. Enter “Result current knowledge” as the Legend text. Click on “OK” and go to the next slide. Here you also go to the properties of the question. Enter “Result after ex-planation” as the Legend text. Click on “OK” and compare the question again by pressing + , selecting question 6 and clicking on “OK”.

91
Both questions now have a more sensible legend text
Comparing in percentages When you compare two questions and display the results in percentages, it sometimes seems as though the results do not match the bars that are displayed. This mainly hap-pens when more people voted on one question than on the other question.
To prevent this from happening, the results are normalized to 100% when you compare two or more questions. This means that all questions are treated as if the same number of people had voted on them. The length of the bars is then based on the percentage of votes. Normalizing only happens when the results are displayed in percentages. When you change to one of the other display modes, the results are no longer normalized and the length of the bars is based on the actual number of votes.
Click on the result diagram with the right mouse button and choose the option Properties. Deselect the option Cross/compare to 100% and click on “OK” to apply the settings.

92
The lengths of the bars do not match with the percentages any more
In the comparison above, you can see that when this question was voted for the first time, 4.6% of the participants voted for answer 1, while the second time 5.4% voted for answer 1. Still, the bar belonging to 4.6% is longer than the one belonging to 5.4%. This is because the length of the bars is now based on the absolute number of votes. The 4.6% of the first question corresponds to 22 participants, while the 5.6% of the second question corresponds to 19 participants. The difference in percentages is caused by the fact that a different number of participants have voted on both questions. On the first question, a total of 481 participants have voted, while on the second question, only 351 participants have voted.
When you use example results, it will not happen very often that one question receives more votes than the other question. The results in the example above are manipulated to explain the difference. In practice, however, it might occur, for instance, when you are comparing a question from a morning session with one from an afternoon session, where less people attended the afternoon session.
Go back to the properties of the result diagram and enable the option Cross/Compare to 100% again. Click on “OK” to apply the settings.
Switching between absolute numbers and percentages Results are mostly presented in percentages in the diagrams. Every once in a while a pre-senter or the audience asks for the number of people that chose one of the answers. In this case you can switch to absolute numbers, even during the presentation.
You do this by choosing Absolute/Percentages from the Results menu or by pressing + + on the keyboard.
Press the + + keys on the keyboard to show the result in absolute numbers.
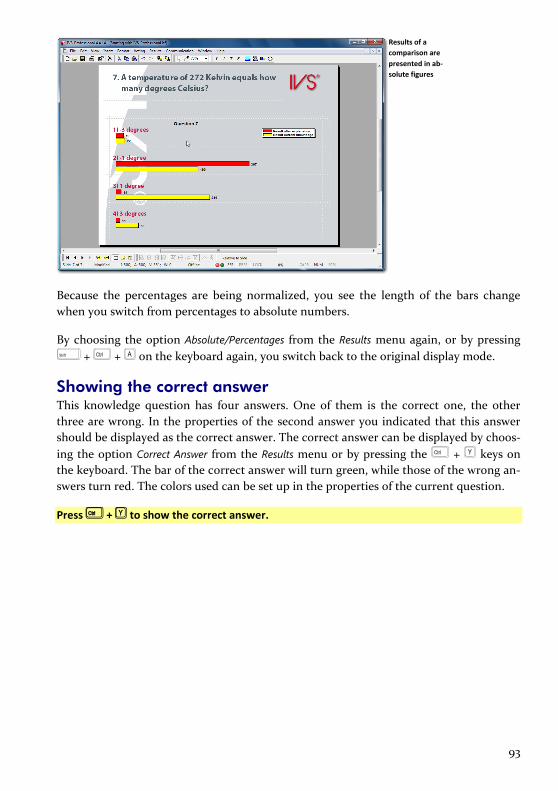
93
Results of a comparison are presented in ab-solute figures
Because the percentages are being normalized, you see the length of the bars change when you switch from percentages to absolute numbers.
By choosing the option Absolute/Percentages from the Results menu again, or by pressing + + on the keyboard again, you switch back to the original display mode.
Showing the correct answer This knowledge question has four answers. One of them is the correct one, the other three are wrong. In the properties of the second answer you indicated that this answer should be displayed as the correct answer. The correct answer can be displayed by choos-ing the option Correct Answer from the Results menu or by pressing the + keys on the keyboard. The bar of the correct answer will turn green, while those of the wrong an-swers turn red. The colors used can be set up in the properties of the current question.
Press + to show the correct answer.
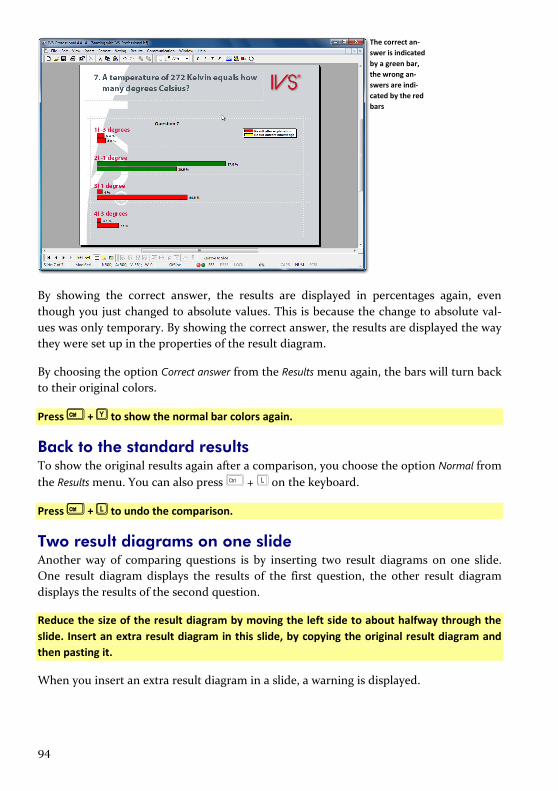
94
The correct an-swer is indicated by a green bar, the wrong an-swers are indi-cated by the red bars
By showing the correct answer, the results are displayed in percentages again, even though you just changed to absolute values. This is because the change to absolute val-ues was only temporary. By showing the correct answer, the results are displayed the way they were set up in the properties of the result diagram.
By choosing the option Correct answer from the Results menu again, the bars will turn back to their original colors.
Press + to show the normal bar colors again.
Back to the standard results To show the original results again after a comparison, you choose the option Normal from the Results menu. You can also press + on the keyboard.
Press + to undo the comparison.
Two result diagrams on one slide Another way of comparing questions is by inserting two result diagrams on one slide. One result diagram displays the results of the first question, the other result diagram displays the results of the second question.
Reduce the size of the result diagram by moving the left side to about halfway through the slide. Insert an extra result diagram in this slide, by copying the original result diagram and then pasting it.
When you insert an extra result diagram in a slide, a warning is displayed.
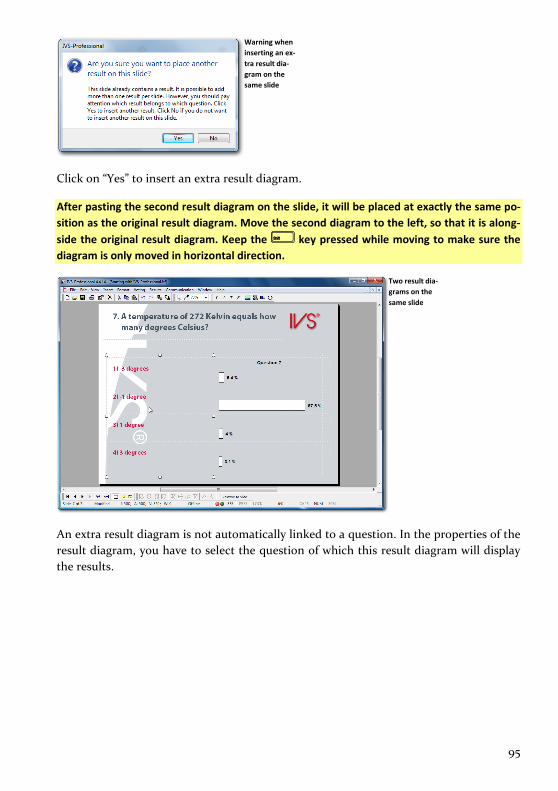
95
Warning when inserting an ex-tra result dia-gram on the same slide
Click on “Yes” to insert an extra result diagram.
After pasting the second result diagram on the slide, it will be placed at exactly the same po-sition as the original result diagram. Move the second diagram to the left, so that it is along-side the original result diagram. Keep the key pressed while moving to make sure the diagram is only moved in horizontal direction.
Two result dia-grams on the same slide
An extra result diagram is not automatically linked to a question. In the properties of the result diagram, you have to select the question of which this result diagram will display the results.
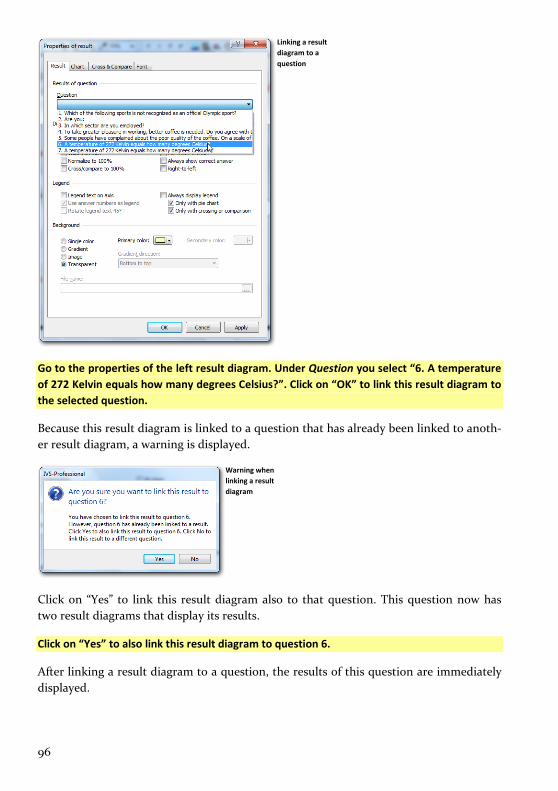
96
Linking a result diagram to a question
Go to the properties of the left result diagram. Under Question you select “6. A temperature of 272 Kelvin equals how many degrees Celsius?”. Click on “OK” to link this result diagram to the selected question.
Because this result diagram is linked to a question that has already been linked to anoth-er result diagram, a warning is displayed.
Warning when linking a result diagram
Click on “Yes” to link this result diagram also to that question. This question now has two result diagrams that display its results.
Click on “Yes” to also link this result diagram to question 6.
After linking a result diagram to a question, the results of this question are immediately displayed.

97
Both diagrams now display the results of two different ques-tions
A disadvantage of this method is that when you are going to vote this script, the results of question 6 are already visible in the first result diagram, while question 7 still has to be voted. The voting behavior of your participants could be influenced be these results. Those participants that still don’t know what to vote, can go for the results as they are al-ready visible for question 6.
To prevent this from happening, it is better to show the results of question 6 only with question 6, the results of question 7 only with question 7, and make another slide follow-ing question 7 that shows both result diagrams side by side. To leave no doubt, you could repeat the question and answer texts by inserting them as normal texts.
98
Voting a question more than once
A standard multiple choice question offers the audience the possibility to choose one of the available answers. With some multiple choice questions is desirable to have the audi-ence choose more than one answer.
An example is a question with ten answers out of which the three most appealing have to be chosen. The most appealing should be selected first followed by the answer that is ap-peals second, etc.
Another example is choosing a certain amount of people from a list. Someone could for example choose the ten best equipped candidates for a certain position out of a list of 30 people.
A question with multiple votes To ask a question that can be voted on more than once, you first have to add a question with a number of answers.
Create a new slide. Insert a question with the following text: “What are the most important benefits of the Interactive Voting System?”. Next, insert six answers with the following text: “Anonymity of the participants / honesty”, “Continuous attention”, “Statistical data immedi-ately available”, “Controlling and directing the communication process”, “Creating together-ness” and “Improving the quality of the presentation”.
To be able to vote this question more than once, you go to the properties of the question and choose how many times you want to vote for this question with the option Maximum times to vote.
Click on the question with the right mouse button and choose the option Properties. In the Properties of question dialog box, set the option Times to vote to 3. Click “OK” to apply the settings and close the dialog box.
Answers outside the slide The distance between the two answers in the template was set up in such a way, that when using five answers, they would be exactly in line with the bars in the result dia-gram. This results in the sixth answer barely fitting on the slide, and the seventh answer falling outside the slide.

99
With every next answer you are inserting, a dialog box will pop up stating that the an-swer would fall outside the slide. You will have to manually move the answer to the cor-rect position.
The new answer is about to be placed outside the slide
Insert another two answers with the following text: “Brainstorming and prioritizing themes” and “Immediate evaluation and documentation possible”. When the dialog box pops up, you click “OK”. Use the scroll bar on the right side of the screen to scroll both answers into view. Manually move all answers closer together so that they all fit on the slide. Use the option Align or distribute to neatly align all answers. See also “Positioning answers” on page 37.
The answers are manually moved to make them all fit on the slide
Result diagram on the next slide If the answers to your question are short, you will have plenty of space left to put a result diagram on the slide. However, when you have a larger amount of answers, and the an-swer texts are also getting a bit longer, the available space to put your result diagram in will become more and more limited. In those cases you could place the result diagram on the next slide. In that case you can use all available space of the entire slide for your re-sult diagram.
Create a new slide. Insert a result diagram and resize it until it almost fits on the entire slide. Leave a free space at the top of the slide.

100
The result dia-gram is placed on the next page
Because there are no answers in front of the bars you cannot see the relation between the bars and the answers. This can easily been solved by showing the legend texts on the ax-is.
Go to the properties of the result diagram and select the option Legend text on axis. Deselect the option Use answer numbers as legend to have the entire legend text displayed.
The legend text is displayed on the axis but texts that are too long are truncated
Changing the legend text When you insert an answer and enter the text for it, the legend text of the answer is au-tomatically entered. In most cases, the legend text equals the answer text. Only when the answer text is too long, the legend text will be truncated. The maximum number of char-acters for the legend text is 32.

101
You can manually change the legend text to prevent half sentences. You can change the legend texts in the properties of the accompanying answer.
Go back to the previous slide. Click on the first answer with the right mouse button and choose the option Properties. Change the legend text to “Anonymity” and click “OK”. Repeat this for all the other answers entering the following texts: “Continuous attention”, ”Statisti-cal data”, ”Controlling process”, “Creating togetherness”, “Improving the quality”, “Brain-storming” and “Immediate evaluation”. Go to the next slide. The legend texts have been ad-justed.
The legend texts are adjusted to a shortened ver-sion of the an-swer texts
Adding a text By showing the legend text on the axis, the relation between the answers and the bars in the result diagram is restored. However, because there is no question on this slide there is no relation anymore between the answers and the question. This can be solved by re-peating the question text on this slide, not as a new question, but as a plain text.
To insert a text, you choose the option Text from the Insert menu. Alternatively, you can click the Text ( ) button in the toolbar or press the on your keyboard.
To save you from re-typing the entire question text, you could copy the text. To do this, you go back to the slide with the question, double-click the question and copy the ques-tion text. When inserting the text, you can simply paste the question text.
Go back to the previous slide. Double-click the question. The question dialog box appears with the question text already selected. Copy this text by pressing + . Click “Cancel” to close the dialog box without making any changes. Go back again to the next slide. Press to insert a text. The dialog box for entering text appears. Press + to paste the copied

102
text. Click on “OK” to close the text dialog box and insert the text. Then, move the text up-wards and adjust the size of the text box, so that the entire text fits inside the text box.
The question text is repeated by inserting it as a text
Showing the different choices The results of a question where more than one answer can be given, show a total over-view of all votes. You could also show the results of the first choice, the second choice, etc. You do this by splitting the results the same way you did with crossing questions.
To split the question, you choose the option Split from the Results menu or press + on the keyboard. A dialog box appears in which you can enter which of the available choices should be displayed. You can also press + up until + to immediate-ly display the first choice till the ninth choice.
Press + to split this question so that the first choice is shown.

103
Only the results of the first choice are dis-played
At the top of the result diagram you can see which choice is currently displayed.
You can show the results of the second and third choice by following the same proce-dure.
Undoing a split After displaying each choice separately, you can undo the split to show the total results again. You undo a split by choosing the option Split from the Results menu. In the dialog box that appears, you enter a 0 as the split number. After clicking on “OK”, the total re-sults are displayed again. Alternatively, you could choose the option Normal from the Re-sults menu to undo the split, or press + on the keyboard.
Calculating answers next in rank The total overview of the results of a question that can be voted more than once, does not take into account the preference of the votes. When someone first chooses answer 1, then answer 3 and finally answer 2, he indicates that he thinks answer 1 is the most im-portant answer, answer 3 is less important, and answer 2 is the least important. Another participant first chooses answer 3, then answer 2, and finally answer 1. In the total over-view, both answer 1 and answer 2 and 3 all have 2 voted.
Using the option Calculate answers next in rank you can have to preference of the votes taken into account when calculating the total overview. When it is possible to vote three times on a question, the first answer given gets three votes, the second answer gets two votes and the last answer gets one vote. In the example above, the first participant gives three votes to answer 1, two votes to answer 3 and one vote to answer 2. The second par-ticipant gives three votes to answer 3, two votes to answer 2 and one vote to answer 1. It follows that answer three was deemed most important, with a total of five votes. Next comes answer 1 with four votes, and the third place if for answer 2 with three votes.

104
The option Calculate answers next in rank can be switched on in the properties of the question.
Go back to the previous slide. Click on the question with the right mouse button and choose the option Properties. In the Properties of question dialog box you select the option Calculate answers next in rank. Click on “OK” to apply these settings and close the dialog box. Go to the next slide.
Displaying answers next in rank When you display the separate choices it can be useful to show the results next in rank. When showing results next in rank, the answer that received most votes is displayed at the top of the result diagram. The answer that received the least votes is displayed at the bottom. You can see at a single glance which answer received the most votes.
To display the answers next in rank, you go to the properties of the question and enable the Display answers next in rank option.
Go back to the previous slide. Click on the question with the right mouse button and choose the options Properties. In the Properties of question dialog box, you enable the Display an-swers next in rank option. Click on “OK” to apply the changes and close the dialog box. Then go to the next slide.
The total results are now displayed next in rank. When you split these results into the first choice, you immediately see which answer most people voted for first. When you split them into the second choice, you see which answer most people voted for second, etc.
Split these results into the first choice by pressing + .
You see at a sin-gle glance which answer most people voted for as their first choice

105
Answers that received the same number of votes are displayed underneath each other. The exact order in which this happens however is undetermined.
106
Printing the script
When you are going to use your script during a session, it could be helpful to have a printed overview of your script. With this overview, you can see which question is going to be the next and which slide contains this question. Besides, you can make notes about which question needs to be crossed or compared with which other question.
There are several ways in which you can print the script. You can make a print-out that only contains the questions and answers. But you could also make a print-out of the en-tire slide, so that you can see which question has its result on the next slide, or where the slides without questions are.
When printing a script, any result, if available, will also be printed. This can be done in a text-only format, together with the question and results, or in a slide overview, in which the entire charts are printed.
The results that are printed are the results that are displayed in the script when you are printing it. Until now you have been working on your script using example results. These are the only type of results that cannot be printed to prevent you from accidentally print-ing example results instead of real results after a session. As long as there are example re-sults in your script, you cannot print it.
Removing example results There are two ways to remove the results from the charts, showing empty charts again. Choose the option Clear charts from the Results menu. All results are now removed from the charts.
When you imported the example results (see “Importing example results” on page 25) you actually opened an existing session (see also “Using a session again” on page 151). By closing the session, the results will be removed from the charts, too. You can close the session by choosing the option Stop session from the Voting menu.
Choose the option Clear charts from the Results menu.

107
The example re-sults have been removed from the charts
Printer settings The default printer as defined in Windows is used to print a script. Should you want to select another printer, check whether the correct printer is selected or change the set-tings of the printer, you can choose the option Printer settings from the File menu.
Choose Printer settings from the File menu.
The standard Print setup dialog box appears. In this box you can select a printer or change the printer settings.
The standard Print setup dia-log box
When necessary, select the correct printer and click “OK” to apply the settings.
Printing a script overview To print a script, you choose the option Print from the File menu. Alternatively, you can click the Print ( ) button in the toolbar or press + on the keyboard.
Click the Print button in the toolbar.

108
A dialog box appears where you can indicate what you want to print and how you want it to be printed.
Dialog box for printing a script
Slides Instead of printing the entire script, you could also choose to print a certain number of slides.
From slide This box shows the slide number and a description of the slide, if available. This is the first slide to be printed.
To slide This box shows the slide number and a description of the slide, if available. This is the last slide to be printed.
Cross While printing the script, you can have the results automatically crossed with a certain question.
Cross all slides with question Select this option if you want to cross all questions in your script with one of the other questions, before they are printed. From the list under this option, you choose the question with which you want the other questions to be crossed. This option is only available when a session has been started or when results have been imported. This option does not apply to all print types.
Print Questions, answers and results can be printed in various ways. You could for example, choose to only print a text overview, but it is also possible to print a complete slide over-view.
Print as type Here you choose how you want to print the selected slides.
Settings By clicking on the “Settings” button, the standard Print setup dialog box appears, in which you could select a different printer or change the settings of the printer.

109
Select, as far as it hasn’t been done yet, slide number 1 in the box From slide and slide num-ber 9 in the box To slide. Select “Script layout” in the Print as type box.
Printing a handout When printing a handout not only the questions and answers are printed, but instead an image of the entire slide is printed. This results in an overview of the slides as they will be presented on the screen.
To print a handout, you choose the option Print from the File menu. In the dialog box, you select the option “Handout” from the Print as type box.
Choose the option Print from the File menu. From the Print as type box, you choose the op-tion “Handout”.
A dialog box appears where you select how many slides you want to be printed on one page.
The dialog box where you can choose how many slides should be print-ed on one slide
If you choose one slide per page, each slide will be printed full page. If you choose two slides per page, two slides will be printed under each other, et cetera.
Additionally you can set a number of options that control whether the slide number or question number should also be printed, or whether slide should be printed within a frame.
Include slide number When this option is checked, the slide number will be printed at the top-left, next to the slide.
Include question number When this option is checked, and a question is available on the slide, the question number will be printed at the bottom-right, below the slide.
Print slides in frame When this option is checked, the slide is printed within a frame. A black rectangle will be printed surrounding the slide. This is especially useful when you have a lot of slides with a white or other light colored background.
Choose the option 4 slides and check the option Include slide number. Next, click on “OK” to print the handout.

110
Printing to file In the dialog box for printing a script you can choose several options from the Print as type box, that don’t send the results to a printer, but to a file instead. This allows you to also save the script overview to a file. This file contains the same information that would normally be printed on paper. Other options are printing a complete slide to an image. This allows you to make images of all your slides, for example for inserting them in a Word document.
For printing to a file you choose the Print option from the File menu. In the dialog box that is shown you choose the option “Script overview (to file)” from the Print as type box. When you click on “OK”, the standard dialog box for saving files appears. You enter the name of the file and choose the location where you want to save this file. Click on the “Save” button to actually save the file.
Choose the Print option from the File menu. From the Print as type box, choose the “Script overview (to file)” option. Click on “OK”. In the dialog box you enter the name of the file and choose a location. Click on “Save” to save the file.
To save the slides as images, you also choose the Print option from the File menu. If you don’t want to save all slides as images, you can choose from which slide and to which slide you want to save to an image from the From slide and To slide boxes. From the Print as type box you select the “Print to file (Bitmap)”, “Print to file (JPEG)” or “Print to file (PNG)” option, depending on which image format you want to save. After you click on “OK”, the dialog box for selecting a folder appears.
Choose the Print option from the File menu. From the Print as type box, choose the “Print to file (PNG)” option. Next, click on “OK”.
The dialog box where you select a folder to save the images in

111
In this dialog box you select the folder where you want to save the images. After you have selected a folder you click on “Select Folder” to save the images in the selected folder. Saving the images can take some time, depending on how many slides you want to save.

112
Creating a list of participants
In IVS-Basic, voting is always anonymous. In IVS-Professional, you can indicate which of the questions should be voted anonymously and which should be identi-fied.
When you use RF-I or RF-II keypads, each participant gets a chip card to participate in an identified voting. This chip card has to be inserted into the keypad during the voting. Without a chip card it is not possible to vote.
If you use Lite keypads, the keypad itself is the identification. There is no need to insert a chip card.
Before you can use your script to vote, you first have to make a list of participants. This is a list that contains all the chip cards or keypads that may take part in the voting. Alt-hough it is possible to vote with chip cards that do not appear in this list, the votes are discarded by the software. It is not possible to vote with keypads that are not in this list.
It is also possible to link the name of a participant to a chip card or keypad. Later, when you are going to print or export the results, you can see what each individual participant has voted. The participant can also be categorized into a group, which makes it possible to review the results per group.
Finally, it is possible to link a vote weight to a chip card or keypad. This allows a partici-pant with a higher vote weight to exercise more influence on the voting than a partici-pant with a lower vote weight.
When using RF-I or RF-II keypads, you can create a list of participants with the IVS-Card Link application. If you use Lite keypads, you can create this list with the IVS-Lite Link application.
A simple list of participants with chip cards The IVS-Card Link program allows you to make a list of participants with chip cards. By inserting the chip cards into the chip card reader one at the time, you can link a name, a group and a vote weight to it.
Close the IVS software and then start IVS-Card Link. You can find IVS-Card Link in the Start Menu under IVS and then under IVS-Tools.

113
IVS-Card Link for making a list of participants with chip cards
The chip cards that are going to be used can be read with the chip card reader that comes with the system. The chip card reader is connected to a USB port of the computer. When you connect the chip card reader for the first time, you have to install the driver only once. This driver is installed automatically by Windows.
After having connected the chip card reader, it has to be initialized. You do this by choosing the appropriate card reader from the Readers menu. If your card reader is not listed, check whether the driver has been installed correctly.
Select the cor-rect chip card reader
Connect the chip card reader to a USB port. Install the drivers when necessary. Then choose the OMNIKEY CardMan 3x21 0 option from the Readers menu. The chip card reader will now be initialized.
By creating a simple list of participants, you just place the chip cards that are going to be used in a list. During a voting, only those participants, that own a chip card that was placed in this list, can vote. Although it is possible to vote with a chip card that is not listed in the list of participants, the votes are discarded by the software.

114
To create a simple list of participants, you enter the number of chip cards that you want to place into this list under Number of cards. Next, you click on the “Start” button. You then insert the chip cards one by one into the chip card reader. Each time you insert a chip card into the chip card reader, you will hear a signal and the unique ID of this chip card is displayed. In the status bar below you can see how many chip cards have been placed in the list already.
Under Number of cards you enter 25 and then click the “Start” button. Next, insert some chip cards one by one into the chip card reader.
After inserting a chip card into the chip card reader, the ID of the chip card is displayed
After having inserted all the chip cards into the chip card reader, IVS-Card Link automat-ically stops accepting chip cards. If you want to stop earlier, you click on the “Stop” but-ton.
After having inserted some chip cards into the chip card reader, click on the “Stop” button.
You can now save the list of participants you created by choosing the option Save from the File menu.
Choose the option Save from the File menu.
The standard dialog box for saving files appears. Here you enter the name of the file and choose a location to save the file. Preferably save the file in the Participant Lists folder as indicated by IVS-Card Link. IVS-Professional will automatically display this folder when you have to select a participants list.
Enter the name of the participants list: “Participants test script” and click on the “Save” but-ton to save the participants list.
A simple list of participants with keypads The IVS-Lite Link application allows you to make a list of participants with keypads. To make this list, you have to enter the unique ID of each keypad, so that a name, a group

115
and a vote weight can be linked to it. This unique ID can also be scanned by a barcode scanner, or you can import a list of previously initialized keypads.
Close the IVS software and then start IVS-Lite Link. You can find IVS-Lite Link in the Start Menu under IVS and then under IVS-Tools.
IVS-Card Link for making a list of participants with chip cards
By creating a simple list of participants, you place only those keypads that are going to be used in a list. During a voting, only those participants, whose keypad was placed in this list, can vote. Participants with a keypad that is not in this list, cannot vote.
To create a simple list of participants, you enter the number of keypads that you want to place into this list under Number of cards. Next, you click on the “Start” button. You then one by one enter the unique IDs of the keypads you want to use. You can find this ID on a label on the back of the keypad. After entering this ID, you click on the “Program” but-ton. In the status bar below you can see how many chip cards have been placed in the list already.
Instead of entering this unique ID manually, you can also scan it by using a barcode scanner. The barcode on the label on the back of the keypad contains the unique ID. Make sure that the cursor is placed in the “ID” edit box before you start scanning. If the barcode scanner automatically sends an “Enter” after scanning, you don’t have to click on the “Program” button each time. This is done automatically by the barcode scanner.
Under Number of cards you enter 25 and then click the “Start” button. Next, one by one en-ter the unique IDs of some keypads. Click on the “Program” button each time to put the key-pad into the list.

116
The unique ID of the keypad was entered to place it into the list of participants
After having entered the unique IDs of all the keypads, IVS-Lite Link automatically stops accepting IDs. If you want to stop earlier, you click on the “Stop” button.
After having entered the IDs of some keypads, click on the “Stop” button.
You can now save the list of participants you created by choosing the option Save from the File menu.
Choose the option Save from the File menu.
The standard dialog box for saving files appears. Here you enter the name of the file and choose a location to save the file. Preferably save the file in the Participant Lists folder as indicated by IVS-Card Link. IVS-Professional will automatically display this folder when you have to select a participants list.
Enter the name of the participants list: “Participants test script” and click on the “Save” but-ton to save the participants list.
A list of participants based on names Instead of making a simple list of participants, you can also make a list of participants based on the participants’ names. By doing so, you link a chip card to an individual par-ticipant by entering the name of the participant. It is also possible to link a voting weight to each participant.
To make a list of participants based on names, you enter the number of keypads that you want to place into this list under Number of cards. Under Weight you enter the voting weight you want to link to this participant. If you don’t want to use a voting weight, you enter the default voting weight of 1 for each participant. Under Name you enter the name of the participant.

117
It is also possible to divide the participants in a group. When playing a quiz you can show both the group scores as well as the individual scores. To place a participant in a certain group, you just enter the name of the group under Group.
Next, you click on the “Start” button and insert a chip card into the chip card reader. Af-ter the chip card has been read, you take it out of the chip card reader. You now enter the name, voting weight and group of the next participant and insert the next chip card into the chip card reader. You repeat these steps for all the participants you want to place in the list.
After having inserted all the chip cards into the chip card reader, you can save the list of participants. You do this by choosing the option Save from the File menu.
The standard dialog box for saving files appears. Here you enter the name of the file and choose a location to save the file. Preferably save the file in the Participant Lists folder as indicated by IVS-Card Link. IVS-Professional will automatically display this folder when you have to select a participants list.
Importing an existing name list If you already have a list with the names of all participants, you can make a list of partici-pants based on this list of names. You then don’t have to enter the name of the partici-pant each time you insert a chip card into the chip card reader.
You can import a list of names by choosing the option Import from the File menu. The standard dialog box for opening files appears. Here you select the file that contains the list of names of all the participants. This is a standard text file, where each single line contains one name of a participant. When necessary, this name may be followed by the voting weight of this participant. The name and the voting weight should be tab delim-ited.
After having imported a list of names, the number of names contained in this list is au-tomatically filled in under Number of cards. Under Name, the name of the first partici-pant is filled in, and, when necessary, this participant’s voting weight is filled in under Weight. Next, you click on the “Start” button. Insert the first chip card into the chip card reader. You will hear a signal and the unique ID of this chip card is displayed. If you re-move the chip card from the chip card reader, the name and, when necessary, the voting weight of the next participant are filled in. You can now insert the next chip card into the chip card reader.
After having inserted all the chip cards into the chip card reader, you can save the list of participants. You do this by choosing the option Save from the File menu.
The standard dialog box for saving files appears. Here you enter the name of the file and choose a location to save the file. Preferably save the file in the Participant Lists folder as

118
indicated by IVS-Card Link. IVS-Professional will automatically display this folder when you have to select a participants list.
A list of automatically numbered participants If you don’t have a list of names and you still want to provide each participant with a name, you can choose to automatically number the participants. Each participant is au-tomatically assigned a name and a serial number, for example Participant 1, Participant 2, etc.
To make a list of automatically numbered participants, you enter the number of chip cards you want to place into the list under Number of cards. Under Name, you enter the name that you want to give each participant. The part that you want to have automatical-ly numbered has to be placed between square brackets. The number you place between the square brackets is the number that is going to be used for the first participant. For each subsequent participant, this number is automatically incremented by 1.
To have each participant automatically numbered Participant 1, Participant 2, etc, you fill in Participant [1] under Name. If you want the serial number to exist of three figures, you enter a starting number that also exists of three figures. If you enter Participant [001] un-der Name, each participant will automatically be numbered Participant 001, Participant 002, Participant 010, Participant 099, Participant 100, etc.
Next, you click on the “Start” button. Insert the first chip card into the chip card reader. You will hear a signal and the unique ID of this chip card is displayed. If you remove the chip card from the chip card reader, the participant number is automatically increment-ed by 1. You can now insert the next chip card into the chip card reader.
After having inserted all the chip cards into the chip card reader, you can save the list of participants. You do this by choosing the option Save from the File menu.
The standard dialog box for saving files appears. Here you enter the name of the file and choose a location to save the file. Preferably save the file in the Participant Lists folder as indicated by IVS-Card Link. IVS-Professional will automatically display this folder when you have to select a participants list.
Close IVS-Card Link and start the IVS software. In the startup dialog you choose the last used script “Starting with IVS-Professional” and click on “OK” to reopen the script.
119
Connecting the network
Now that you created a script with a number of slides and questions you can let your au-dience vote on these questions. To do so, you use the Base Station, that has to be con-nected to your computer, and a number of keypads, that have to be initialized by the Base Station. Keypads and Base Station together make up the voting network.
The keypad is used to have the audience cast their votes. Each participant receives one keypad to do so. There are 10 or 11 keys on the keypad that allow the audience to make a choice. The LCD screen displays the choice that is made. To correct the choice made, the keypad has a correction key. On RF-I and Lite keypads this is the red key. On RF-II key-pads it is the red C-key. On both RF-I and RF-II keypads you find this key on the left side of the keypad. On Lite keypads you find this key to the left of the LCD screen.
On the RF-II keypad, there are two scroll keys and an enter key just below the LCD screen. Whether these keys are used or not depends on the settings of each question in the script.
All keypads have a built-in wireless transmitter and receiver that are used to communi-cate with the Base Station. The Base Station controls the keypads to open and close a vot-ing and to activate only those keys that are relevant for the voting. Furthermore, the Base Station receives the information from the keypads during a voting. These are processed and transferred to the IVS software, so that it can show the results in a chart. A RF-I or RF-II Base Station can control up to 1,000 keypads and a Lite Base Station can control up to 250 keypads.
The keylock You need a license for the IVS software to be able to use the voting network. This license determines how many keypads you can use. One license you get free of charge with the software. This license allows you to use a maximum of 30 keypads. For all other licenses, you need to connect a so-called keylock to the computer. Depending on the keylock you use, you get a license for a maximum of 250 keypads or 4,000 keypads.
Keylock for con-necting to the USB port
The keylock should be connected to a USB port of the computer.

120
Charging the keypads To be able to operate completely wireless, the keypads are equipped with a battery. De-pending on the type of keypad, this is either a rechargeable NiMH-battery, or two normal AA-type batteries.
The RF-I and RF-II keypads are equipped with a rechargeable battery. These keypads come in a charging case, that cannot only be used to transport the keypads, but also to charge the battery. To charge the keypads, you place them in the charging case with the charging contacts facing down and then switch on the case by connecting it to the AC power.
RF-I keypads When the case is switched on, the battery status of the keypad is indicated by a LED. When charging the battery the LED blinks red. When the battery is fully charged the LED lights continuously red.
It takes about two hours to fully charge the battery. After that, the keypad can be used for about eight hours.
The moment the keypad is taken from the case, it switches itself on. A keypad stays switched on until it is put back into the case to be charged, or until the battery runs emp-ty.
RF-II keypads When the case is switched on, the battery capacity of the keypad is indicated by the LED.
When the battery is charged for less than 40% the LED lights continuously red. When it is charged between 40% and 70% the LED will blink red. When charged over 70% the LED will blink green. When fully charged, the LED lights continuously green.
It takes about five hours to fully charge the battery. After that, the RF-II keypad can be used for approximately 20 hours.
The moment the keypad is taken from the case, it switches itself on. A keypad stays switched on until it is put back into the case to be charged, or until the battery runs emp-ty.
Lite keypads When the keypad is equipped with a set of fully charged batteries, it can be used for ap-proximately one year. If the batteries are empty, they must be replaced with a new set of batteries.
A Lite keypad is normally switched off and is only switched on when a key is pressed.
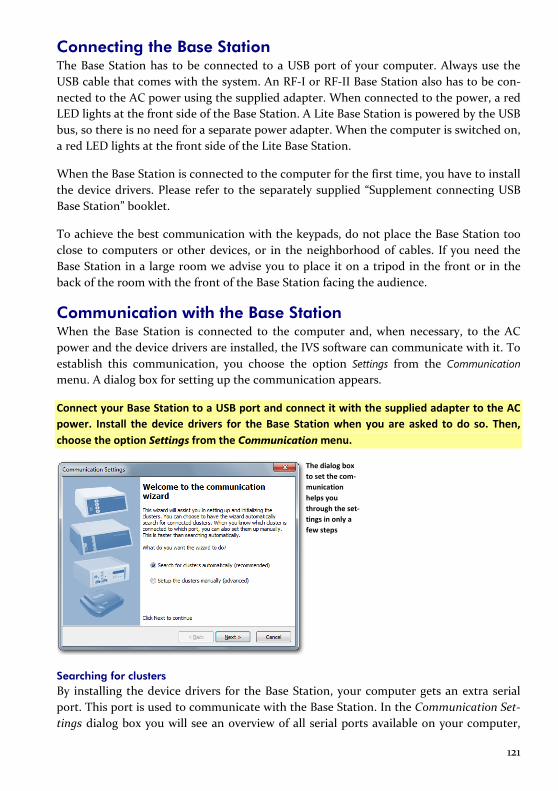
121
Connecting the Base Station The Base Station has to be connected to a USB port of your computer. Always use the USB cable that comes with the system. An RF-I or RF-II Base Station also has to be con-nected to the AC power using the supplied adapter. When connected to the power, a red LED lights at the front side of the Base Station. A Lite Base Station is powered by the USB bus, so there is no need for a separate power adapter. When the computer is switched on, a red LED lights at the front side of the Lite Base Station.
When the Base Station is connected to the computer for the first time, you have to install the device drivers. Please refer to the separately supplied “Supplement connecting USB Base Station” booklet.
To achieve the best communication with the keypads, do not place the Base Station too close to computers or other devices, or in the neighborhood of cables. If you need the Base Station in a large room we advise you to place it on a tripod in the front or in the back of the room with the front of the Base Station facing the audience.
Communication with the Base Station When the Base Station is connected to the computer and, when necessary, to the AC power and the device drivers are installed, the IVS software can communicate with it. To establish this communication, you choose the option Settings from the Communication menu. A dialog box for setting up the communication appears.
Connect your Base Station to a USB port and connect it with the supplied adapter to the AC power. Install the device drivers for the Base Station when you are asked to do so. Then, choose the option Settings from the Communication menu.
The dialog box to set the com-munication helps you through the set-tings in only a few steps
Searching for clusters By installing the device drivers for the Base Station, your computer gets an extra serial port. This port is used to communicate with the Base Station. In the Communication Set-tings dialog box you will see an overview of all serial ports available on your computer,

122
up to a maximum of sixteen ports. For each of these ports you can indicate if a Base Sta-tion is connected to it or not.
You can manually indicate on which ports a Base Station has been connected, but you can also have the wizard automatically detect which ports have a Base Station connected and what type of Base Station this is.
If you choose the Search for clusters automatically (recommended) option, the next step is that the wizard will check each port to see which cluster is connected to it. If you choose for the Setup the clusters manually (advanced) option, automatic searching is skipped.
Click “Next” to start the automatic searching of the clusters, or to manually select the clusters.
Choose the Search for clusters automatically (recommended) option and click on “Next” to continue. The wizard will now automatically check all ports.
De clusters wor-den automatisch gedetecteerd
Selecting the clusters For each of the available serial ports, you have to indicate whether a cluster is connected to this port, and if yes, which type of cluster. If you had the clusters detect automatically, the correct clusters are already filled in for the appropriate serial ports.
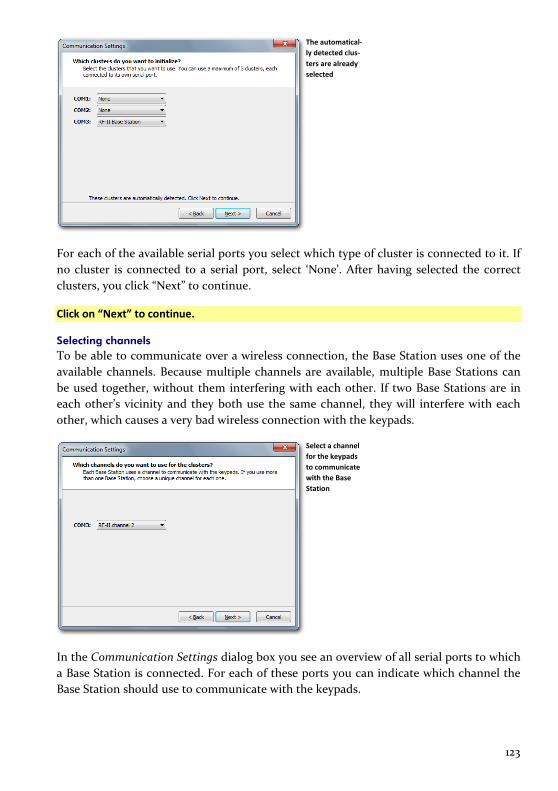
123
The automatical-ly detected clus-ters are already selected
For each of the available serial ports you select which type of cluster is connected to it. If no cluster is connected to a serial port, select ‘None’. After having selected the correct clusters, you click “Next” to continue.
Click on “Next” to continue.
Selecting channels To be able to communicate over a wireless connection, the Base Station uses one of the available channels. Because multiple channels are available, multiple Base Stations can be used together, without them interfering with each other. If two Base Stations are in each other’s vicinity and they both use the same channel, they will interfere with each other, which causes a very bad wireless connection with the keypads.
Select a channel for the keypads to communicate with the Base Station
In the Communication Settings dialog box you see an overview of all serial ports to which a Base Station is connected. For each of these ports you can indicate which channel the Base Station should use to communicate with the keypads.

124
If you use only one Base Station it does not matter which channel you choose for com-munication. However, if you use multiple Base Stations, or if there is an active Base Sta-tion in a room nearby, you have to select a unique channel for each Base Station.
If you use an RF-I or RF-II Base Station, you can choose from four different channels. You can therefore also use a maximum of four Base Station at the same time. If you use a Lite Base Station, you can choose from 51 different channels. Although it is theoretically pos-sible to use a maximum of 51 Base Stations, in practice you cannot use more than sixteen Base Stations, because the software cannot select more than sixteen ports.
After you have set the channel, click the “Next” button to continue.
Select “RF-II Channel 2” and click “Next” to continue.
Initializing the clusters After selecting the correct serial port and setting the channel, the Base Station can be ini-tialized. During initialization, the IVS software checks whether it can communicate with the Base Station on the selected serial port. If communication succeeds, the Base Station is set to the selected channel.
The connected Base Station can be initialized
In the Communication Settings dialog box you see an overview of all serial ports to which a Base Station is connected. The status of the Base Station is indicated by means of a LED. A red LED indicates that the Base Station hasn’t been initialized yet. A dark red LED indicates communication with the Base Station. A green LED indicates that the Base Station has been successfully initialized. A yellow LED indicates that the selected serial port could not be used for communication. If that is the case, check to see whether other software that is running on your computer, might keep the serial port busy. If that is the case, close this software, or select a different serial port to connect the Base Station to. Please refer to the separately supplied booklet “Supplement connecting USB Base Sta-tion”.

125
To initialize the Base Station click the “Initialize” button. When the Base Station has been initialized, this is indicated by a bright green LED. If the LED stays red, click the “Previous” button to check the settings. Also check whether the Base Station is connect-ed to the AC power, whether it is correctly connected to a USB port of the computer and whether the device drivers have been installed.
After the Base Station has been successfully initialized, you could if necessary check the version of the Base Station. To do this, move the mouse over the text behind the green LED. A little window appears showing the version number of the Base Station. This ver-sion number consists of two parts. The first part indicates the version of that part of the Base Station that communicates with the computer. The second part indicates the ver-sion of that part that communicates with the keypads.
Click on Initialize to initialize the Base Station.
The connected Base Station has been initialized and the version number is show-ing
After initializing the Base Station, click the “Next” button to continue.
Click “Next” to continue.
Keypad functionality There are three types of Base Station: the RF-I Base Station, the RF-II Base Station and the Lite Base Station. There are also three types of keypad: the RF-I keypad, the RF-II keypad and the Lite keypad. The RF-I keypad and the RF-II keypad can be used by both the RF-I Base Station and the RF-II Base Station. The Lite keypad can only be used by the Lite Base Station.
If you use an RF-I Base Station, there is no need to choose the keypad functionality. RF-I functionality is automatically selected. You can use both RF-I and RF-II keypads, but you cannot use the extra features of the RF-II keypad.
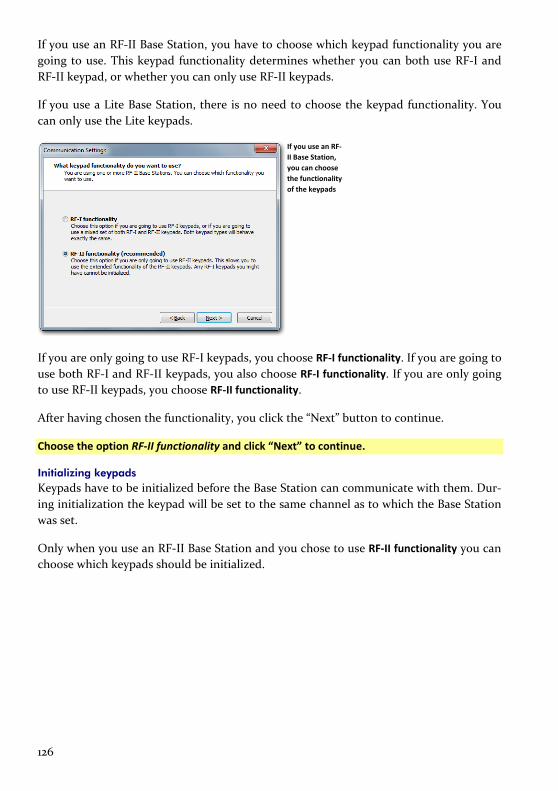
126
If you use an RF-II Base Station, you have to choose which keypad functionality you are going to use. This keypad functionality determines whether you can both use RF-I and RF-II keypad, or whether you can only use RF-II keypads.
If you use a Lite Base Station, there is no need to choose the keypad functionality. You can only use the Lite keypads.
If you use an RF-II Base Station, you can choose the functionality of the keypads
If you are only going to use RF-I keypads, you choose RF-I functionality. If you are going to use both RF-I and RF-II keypads, you also choose RF-I functionality. If you are only going to use RF-II keypads, you choose RF-II functionality.
After having chosen the functionality, you click the “Next” button to continue.
Choose the option RF-II functionality and click “Next” to continue.
Initializing keypads Keypads have to be initialized before the Base Station can communicate with them. Dur-ing initialization the keypad will be set to the same channel as to which the Base Station was set.
Only when you use an RF-II Base Station and you chose to use RF-II functionality you can choose which keypads should be initialized.
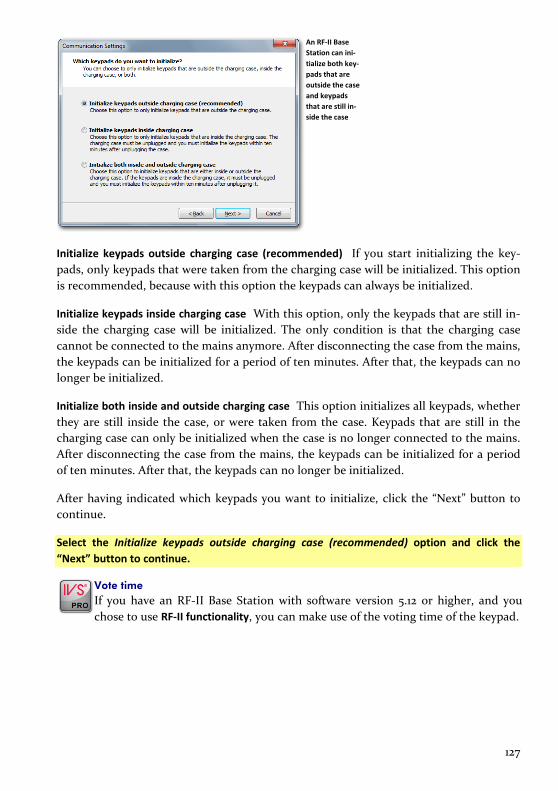
127
An RF-II Base Station can ini-tialize both key-pads that are outside the case and keypads that are still in-side the case
Initialize keypads outside charging case (recommended) If you start initializing the key-pads, only keypads that were taken from the charging case will be initialized. This option is recommended, because with this option the keypads can always be initialized.
Initialize keypads inside charging case With this option, only the keypads that are still in-side the charging case will be initialized. The only condition is that the charging case cannot be connected to the mains anymore. After disconnecting the case from the mains, the keypads can be initialized for a period of ten minutes. After that, the keypads can no longer be initialized.
Initialize both inside and outside charging case This option initializes all keypads, whether they are still inside the case, or were taken from the case. Keypads that are still in the charging case can only be initialized when the case is no longer connected to the mains. After disconnecting the case from the mains, the keypads can be initialized for a period of ten minutes. After that, the keypads can no longer be initialized.
After having indicated which keypads you want to initialize, click the “Next” button to continue.
Select the Initialize keypads outside charging case (recommended) option and click the “Next” button to continue.
Vote time If you have an RF-II Base Station with software version 5.12 or higher, and you chose to use RF-II functionality, you can make use of the voting time of the keypad.

128
If your Base Sta-tion supports it, you can make use of the voting time of the key-pad
Keypad vote time (recommended) Select this option to use the vote time of the keypad. During the voting, the keypad keeps track of the time from the moment the voting is opened, until the moment a key is pressed. This vote time is very accurate. However, the keypads have to support the vote time. If you choose this option while your keypads do not support the vote time, they will not open when you open the voting. Keypads with a software version 3.25 or higher support the vote time. You can check the version number by testing the network (see also “Testing the network” on page 132). Keypads with soft-ware version 3.25 or higher will show their version in the display. Keypads that do not show a version in the display have a software version that is at least lower than 3.25.
Base Station vote time Select this option if you don’t want to use the vote time of the keypads, but instead want to use the vote time of the Base Station. This vote time is less accurate than that of the keypad. Only choose this option if you are using keypads that do not support the vote time.
If your Base Station has a software version lower than 5.12, this step is automatically skipped. You can still make use of the vote time. In that case the vote time of the Base Station will be used.
Select the option Keypad vote time (recommended) and click on “Next” to continue.
Storing the configuration Now that the Base Station has been set up and initialized, you can store this configura-tion. Every time you start the IVS software, it will try to initialize the Base Station with these same settings.

129
You can have the IVS software automatically initialize the Base Station when starting the program
Yes, store this configuration If you start the IVS software, it tries to initialize the Base Sta-tion on the same serial port and with the same channel you just configured.
No, I want to select a different configuration next time When you select this option, the IVS software does not try to initialize the cluster during startup. Select this option if you often use the IVS software without any Base Stations connected, for example, when you are only preparing scripts.
After having selected the desired option, click the “Finish” button to finish the setup of the Base Station.
Choose the option Yes, store this configuration and click “Finish” to finish the set up.
Initializing the keypads After the Base Station has been set up and initialized, you have to initialize the keypads. During initialization, all available keypads will report themselves to the Base Station. The Base Station numbers the keypads and sets them to the same channel the Base Station was set.
If you are using RF-II keypads, you can see when a keypad is initialized. In that case, you can see the IVS® logo in the LCD screen. When using RF-I keypads or Lite keypads you cannot see whether a keypad is initialized or not.
To initialize the keypads select Initialize all keypads from the Communication menu.
Choose the option Initialize all keypads from the Communication menu.

130
The operating mode and the number of ini-tialized keypads is displayed in the initialization dialog
During initialization of the keypads the Initialization dialog is shown. It shows in which mode the Base Station is currently operating and the number of keypads already initial-ized by the Base Station. When the number of keypads changes, it will be displayed in red. If it stays the same for more than a second, it is displayed in blue. When the number of keypads has reached the maximum license, it is displayed in purple.
If you use RF-I keypads, you have to take them out of the charging case before they can be initialized. As soon as a keypad has been initialized, you will see that the counter in the initialization window is increased by one.
If you use RF-II keypads, you have to take them out of the charging case before they can be initialized. As soon as a keypad has been initialized, you will see that the IVS®-logo appears in the LCD screen. In the initialization window you will see that the counter is increased by one.
When using Lite keypads, you first have to switch them on before they can be initialized. You can switch on a Lite keypad by pressing a random key. The key you pressed appears in the LCD screen. The keypad will then try to find a Base Station. If it finds a Base Sta-tion, the red LED lights. The keypad then waits until the Base Station confirms that it has found a keypad. When the keypad receives this confirmation, the green LED lights short-ly and the number disappears from the LCD screen. The keypad has now been success-fully initialized and the counter in the initialization window is increased by one.
If you are initializing keypads and the number stops at 30, even though you took more keypads from of the case, check whether you connected your keylock. Also see “The key-lock” on page 119.
Take all keypads that you want to initialize out of the charging case. Wait until all keypads show the IVS®-logo on the LCD screen. Also check the initialization dialog to see if the num-ber of initialized keypads matches the number of keypads that you took out of the charging cases.
When all keypads are initialized, you can click on the “Stop” button in the initialization dialog to stop the initialization of the keypads.
Click on “Stop” to stop initializing the keypads.

131
Saving a list with initialized keypads When all keypads have been initialized, the Base Station maintains a list of the keypads it initialized. This list can also be stored on the computer. In the unlikely event that the Base Station would get disconnected from the mains, this list can be put back in the Base Station. This prevents you from having to put all keypads back in the charging cases and having to initialize them again.
After having stopped the initialization of the keypads, you are asked whether you want to save the list with initialized keypads. ALWAYS respond to this question with “Yes”.
After initializing, you can save a list with initial-ized keypads
Click on “Yes” to save the list with initialized keypads.
The standard dialog box for saving files appears. You can enter the name of the list in here.
The standard dialog box for saving files
After you have entered a name, you click on “Save” to save the list.
Enter the name of the list: “Test session IVS-Professional” and click on the “Save” button to save the list.

132
Testing the network After initializing the keypads and saving the list of initialized keypads, you can test the RF-I and RF-II keypads. During this test the Base Station continuously sends messages to the keypads. The keypads show that they receive the messages by alternately lighting their red and green LED respectively. Because Lite keypads are switched off by default, and are only switched on when a key is pressed, they cannot be tested.
After saving the list with initialized keypads, you are asked whether you want to test the network. If you only use Lite keypads, this question is skipped, because Lite keypads cannot be tested.
After saving the list, you can test the keypads
Always respond “Yes” to this question to see if the keypads function correctly.
Click on “Yes” to test the network of keypad.
In the Test net-work dialog you can see how many keypads are active
While testing the keypads, the Test network dialog is displayed. It shows the mode the Base Station is currently operating in, how many keypads have been initialized by the Base Station and how many keypads do not respond to messages from the Base Station.
Click on the “Stop” button in the Test network dialog to stop testing the network.
Click on the “Stop” button to end testing the network.
The keypads are now ready to vote.
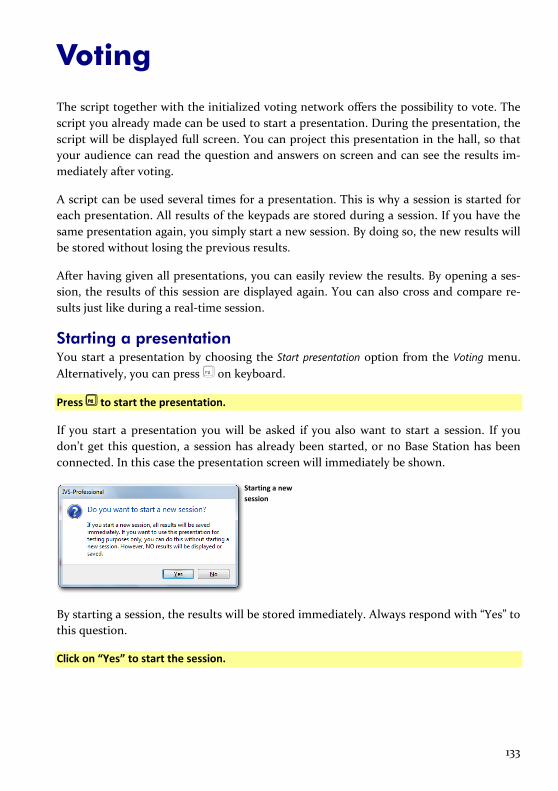
133
Voting
The script together with the initialized voting network offers the possibility to vote. The script you already made can be used to start a presentation. During the presentation, the script will be displayed full screen. You can project this presentation in the hall, so that your audience can read the question and answers on screen and can see the results im-mediately after voting.
A script can be used several times for a presentation. This is why a session is started for each presentation. All results of the keypads are stored during a session. If you have the same presentation again, you simply start a new session. By doing so, the new results will be stored without losing the previous results.
After having given all presentations, you can easily review the results. By opening a ses-sion, the results of this session are displayed again. You can also cross and compare re-sults just like during a real-time session.
Starting a presentation You start a presentation by choosing the Start presentation option from the Voting menu. Alternatively, you can press on keyboard.
Press to start the presentation.
If you start a presentation you will be asked if you also want to start a session. If you don’t get this question, a session has already been started, or no Base Station has been connected. In this case the presentation screen will immediately be shown.
Starting a new session
By starting a session, the results will be stored immediately. Always respond with “Yes” to this question.
Click on “Yes” to start the session.

134
Starting a session You can give a name to each session you start. If you want to reopen a session, for exam-ple to have a look at the results again, or print the results, this helps you to find the ses-sion you want to open.
When you start a session, a dialog box appears where you can enter the description for this session.
If you are using IVS-Basic, you are always voting anonymously. In the dialog box for starting a new session, you can only enter a description for this session.
Dialog box for entering the de-scription
If you are using IVS-Professional, you can indicate per question whether you want to vote anonymously or with identification. In the dialog box for starting a new session you can enter a description for this session. If you have set up at least one question to use identified voting, you will also have to select a list of participants. The session can only be starting after selecting a valid list of participants.
Dialog box for entering the de-scription and se-lecting a list of participants
If you have to select a list of participants, the last one you used is automatically indicat-ed. It is very easy to use this one again. But if you want to use another list of participants, then you can choose one from the list, that displays the ten last used lists of participants. If you want to use a list of participants that is not displayed in the list, you can click on the “Browse” button ( ). The standard dialog box for opening files appears, in which you select the list of participants you want to use.
After having entered a description and, when necessary, after having selected a list of participants, you click on “OK” to start the session.

135
Enter the description for this session: “Test Session 10.30 am” and click on “OK” to start the session.
The presentation screen After starting the session, the script will be displayed in the presentation screen.
The first slide of the script is dis-played in the presentation screen
The slide is displayed full screen. Because there is a toolbar at the bottom of the screen, there is a black bar on each side of the slide. If you don’t want these bars to be displayed, you can enlarge the slide. However, part of the slide will be hidden behind the toolbar.
To enlarge the slide, you press + on the keyboard. Press + again to dis-play the slide full screen again.
Press + to enlarge the slide.

136
By enlarging the slide, the black bars disappear, but the bottom part of the slide is hidden behind the toolbar
To show the part of the slide that disappears behind the toolbar, you can hide the toolbar. But then you won’t be able to see any status information of the voting network.
To hide the toolbar, press . By pressing again, the toolbar will be displayed again.
Showing the presentation screen on a different monitor The presentation screen is normally shown on the same monitor as the edit screen. Dur-ing a presentation, it is not possible to edit the script anymore. When your computer supports the use of multiple monitors, you can show the presentation screen on a differ-ent monitor. When using a laptop, you can for example send the presentation screen to the beamer, while keeping the edit screen on your laptop monitor.
When the presentation screen is shown on a different monitor, there is no need to dis-play the status bar in the presentation screen. You can keep an eye on the progress of the voting by looking at the status bar in the edit screen. In this status bar you can also see that there is an active presentation. This is indicated by the ‘PRES’ indicator.
You can set up on which monitor you want to show the presentation screen in the pref-erences of the IVS software. You open the preferences by selecting the Preferences option from the File menu. For more information, see “Preferences” on page 216.
Locking the presentation screen When the presentation screen is shown on a different monitor, you can still use the edit screen for some last minute changes that become immediately visible in the presentation screen. If you don’t want these changes to be immediately visible, for example if you want to momentarily go to another slide, you can temporarily lock the presentation

137
screen. As long as the presentation screen is locked, it will display the same image even if you use the edit screen to go to a different slide.
You can lock the presentation screen by choosing the Lock presentation screen option from the Voting menu, or by pressing on the keyboard. You can see whether the presenta-tion screen has been locked or not by means of the ‘LOCK’ indicator in the status bar of the edit screen. By pressing again, the presentation screen is unlocked. The slide that is currently displayed in the edit screen will also be displayed in the presentation screen.
Opening the voting You can now vote on this question. To do this, you need to open the voting. By opening the voting, the proper keys on the keypad are activated.
When you are using RF-I or RF-II keypads, after opening the voting the green LED lights. By pressing one of the keys, a vote is given. The red LED lights shortly, after which both LEDs are switched off. When both LEDs are off, the vote has been sent to the Base Sta-tion.
The Lite keypads do not indicate that the voting has been opened. You can always press any key on the keypad, after which the keypad displays this key in the LCD screen. How-ever, if no voting has been opened, the key pressed will almost immediately disappear from the LCD screen.
If the voting has been opened, you can press any key on the keypad. If you press an inva-lid key – you press the 6 while there are only five answers, for example – the key pressed is displayed in the LCD screen and almost immediately disappears again. If you press a valid key, the keypad will try to find a Lite Base Station and the red LED lights when a Base Station was found. The keypad then waits until the vote is accepted by the software. If the vote is accepted, the green LED will light shortly and the vote disappears from the LCD screen. If the vote is not accepted – for example, when this keypad votes for the sec-ond time, while only one vote was allowed – the red LED will be switched off without the green LED lighting shortly.
To open the voting, press or click the Open voting ( ) button in the toolbar. You can see that the voting has been opened, because the status in the toolbar now says “Opened” instead of “Stand-by”. Besides, the green LED in the toolbar is turned on.
The keypad status is also shown in the toolbar. The “I:” indicates the number of initial-ized keypads. The “A:” indicates the number of keypads, that were active at the moment the voting was opened. The “K:” indicates the number of keypads that have voted, while the “V:” indicates the number of votes that were received so far.
138
If the question uses identified voting and you provided your participants with a voting weight, the “W:” indicates the total weight of the votes received so far.
You determine which information is displayed in the status bar. If you right click on the information in the status bar, you can select which information you want to see and which information you don’t want to see. By default, all information is displayed except for the number of voted keypads.
Press on to open the voting. On all initialized keypads, the green LED is turned on. Press a key on each keypad. Only use the keys 1 to 6.
Closing the voting When all votes have been received, you can close the voting. On all RF-I and RF-II key-pads that haven’t voted yet, the green LED is turned off and the keypads do not respond to a key press anymore. After closing the voting, the results are displayed in the result di-agram.
Press or click the Close voting ( ) button on the toolbar. The toolbar now shows “Closing” while the voting is being closed, after which “Stand-by” appears again. The re-sults of the voting are displayed in the result diagram.
Press on to close the voting.
You can vote all the other questions in the same way. Press on or to go to the next slide or click on the Next slide button ( ) in the toolbar. Open the voting by pressing and close it again by pressing .
Press on to go to the next slide. Press on to open the voting. Vote a few times for this question and press to close the voting. Repeat this for each slide until you reach question 8.
Voting on a question more than once With most of the questions it will only be possible to make one choice out of the availa-ble answer options. If the voting has been opened, the green LED on the RF-I and RF-II keypads lights. After giving a vote, the red LED lights shortly, after which both LEDs are switched off. It is not possible to vote anymore.
On the Lite keypads, the red LED lights after giving a vote. After the vote has been con-firmed by the Base Station, the green LED lights shortly, after which both LEDs are switched off. You can still press any key, and the red LED still lights, but the green LED will not light anymore.
On a question that can be voted on more than once, you see that on the RF-I and RF-II keypads the green LED lights again, after the red LED was lit shortly. A second vote can

139
now be given. Again, the red LED lights shortly. Only after the last vote has been given for this question, will both LEDs be switched off.
On the Lite keypads, both LEDs are switched off after the green LED was lit shortly. A second vote can now be given. Again, the red LED lights and after the vote has been con-firmed by the Base Station, the green LED lights shortly. After the last vote has been giv-en for this question, it is still possible to press any key, and the red LED still lights, but the green LED will not light anymore.
Press on to open the voting. Vote three times on each keypad. Then, press to close the voting. Press to go to the next slide, where the results are displayed.
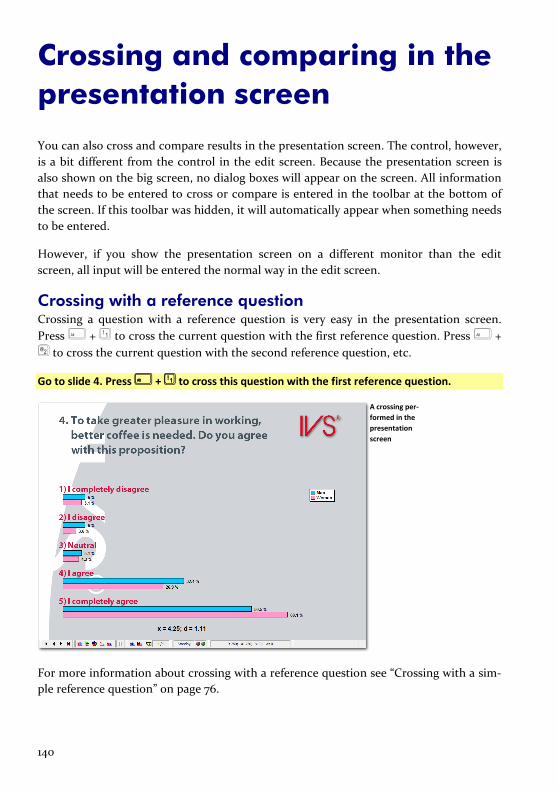
140
Crossing and comparing in the presentation screen
You can also cross and compare results in the presentation screen. The control, however, is a bit different from the control in the edit screen. Because the presentation screen is also shown on the big screen, no dialog boxes will appear on the screen. All information that needs to be entered to cross or compare is entered in the toolbar at the bottom of the screen. If this toolbar was hidden, it will automatically appear when something needs to be entered.
However, if you show the presentation screen on a different monitor than the edit screen, all input will be entered the normal way in the edit screen.
Crossing with a reference question Crossing a question with a reference question is very easy in the presentation screen. Press + to cross the current question with the first reference question. Press + to cross the current question with the second reference question, etc.
Go to slide 4. Press + to cross this question with the first reference question.
A crossing per-formed in the presentation screen
For more information about crossing with a reference question see “Crossing with a sim-ple reference question” on page 76.

141
Crossing with a normal question Even when a question is not set to be a reference question, you can still cross with it. Click on the Cross ( ) button in the toolbar or press + to perform a crossing. An edit box is activated in the toolbar. In the edit box you have to enter the question num-ber with which you want to cross. Enter the question number and press , after which the crossing will be shown.
If you would like to select a question from a list of available questions, press + to perform a crossing. Enter a 0 in the edit box and press . A dialog box appears from which you can choose a question to cross with.
For more information about reference question, see “Asking a reference question” on page 64. For more information about crossing with a reference question, see “Crossing with a simple reference question” on page 76.
Splitting a crossing You can split a crossed question in the presentation screen using the keys + to + . Use + to only show the results of the first reference. Use + to only show the results of the second reference, etc.
When you have more than nine references, use + to split. Next, you enter the number of the reference and press .
You can undo a split, by pressing + . The original crossing will be shown again.
For more information about splitting a crossing, see “Splitting a crossed question” on page 81.
Comparing questions To compare the current question with another question, you click on the Compare ( ) button in the toolbar, or press on + . The edit box in the toolbar is activated. Enter the question number of the question you want to compare with. Next, press to compare the current question with the other question.
By entering a 0 instead of a question number, a list with available question is shown. From this list, you can choose a question to compare with.
For more information about comparing questions, see “Comparing questions” on page 89.
Showing different choices A question that was voted more than once can also be split, so that you can show the re-sults of the first choice, the second choice, etc.

142
To show the results of the first choice, you press + . To show the results of the sec-ond choice, you press + , etc. If you have a question that could be voted more than nine times, then you use + to split that question. In the edit box in the toolbar, you enter the number of the split. Next, you press to show the split.
You can undo the split, by pressing + . The total results of this question are dis-played again.
For more information about questions that can be voted more than once, see “Voting a question more than once” on page 98.

143
Ending the presentation
When all questions are voted, you can end the presentation. Immediately after the presentation you can print the results. You can also export the results to use them in other software applications.
Back to the edit screen After ending the presentation, you return from the presentation screen to the edit screen. In the editing screen, you can print the script or export the results. Press to re-turn from the presentation screen to the edit screen.
Press to return to the edit screen.
Back in the edit screen where the results of the voting are still visible
In the edit screen the results of the voting are visible too. When you return from the presentation screen to the edit screen, the session in which the results are stored, is still open.
Printing a script layout with results In the edit screen, you can print a script overview, including the results that were just voted. To do this, you choose the option Print from the File menu. A dialog box appears in which you select what you want to print and how you want it to be printed.
Choose the option Print from the File menu.
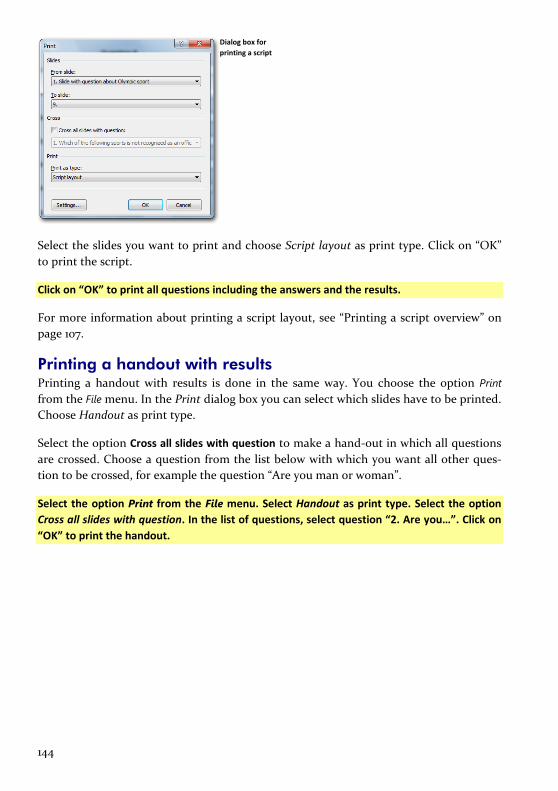
144
Dialog box for printing a script
Select the slides you want to print and choose Script layout as print type. Click on “OK” to print the script.
Click on “OK” to print all questions including the answers and the results.
For more information about printing a script layout, see “Printing a script overview” on page 107.
Printing a handout with results Printing a handout with results is done in the same way. You choose the option Print from the File menu. In the Print dialog box you can select which slides have to be printed. Choose Handout as print type.
Select the option Cross all slides with question to make a hand-out in which all questions are crossed. Choose a question from the list below with which you want all other ques-tion to be crossed, for example the question “Are you man or woman”.
Select the option Print from the File menu. Select Handout as print type. Select the option Cross all slides with question. In the list of questions, select question “2. Are you…”. Click on “OK” to print the handout.

145
In the dialog box for printing a script, you select that you want to print a hand-out and want to have all question crossed
A dialog box appears where you can choose how many slides you want to print on one page.
Choose the option 4 slides and click on “OK” to print the handout.
For more information about printing a handout, see “Printing a handout” on page 109.
Exporting individual results To edit results in other application like Microsoft® Excel™, you can export the results. Choose the option Export from the File menu to export the results.
Choose the option Export from the File menu.
A dialog box for exporting results appears.
The dialog box for exporting re-sults
In this dialog box, you can enter a description for the results that you are about to export. You can also select in which format you want to export the results. The Individual results type only exports the results of each individual keypad.
After having entered a description and selected an export type, you click on “OK” to ex-port the results.
Enter the description “Export individual results”, choose Individual results as export type and click on “OK”.

146
A new dialog box appears in which you can change the export options.
Options for ex-porting individ-ual results
Score options Not only the individual results per keypad, but also a score per participant can be export-ed. This allows you to see which of the participants got the most points.
Minimal and maximal score To only export the participants that have a certain score, or that stayed below a certain maximum score, you can indicate a minimal and/or maximal score. Only the participants below a certain minimum or above a certain maximum or in between a minimum and maximum score are exported.
Export only participants with a total score that is less than x points Choose this option if you want to export only those participants that stayed below a certain maximum score. You fill in a maximum score and only those participants that stay below this score will be exported.
Lies between x and y points Choose this option if you want to export only those partici-pants that stayed between a certain minimum and maximum score. You fill in a mini-mum and maximum score. Only participants that have more points than the minimal score and less points than the maximum score will be exported. For example, if you fill in a minimal score of 20 points and a maximum score of 25 points, then only participants with 21, 22, 23 or 24 points will be exported.
Is more than x points Choose this option if you want to export only those participants that have at least a certain score. You fill in a minimum score and only those participants that got more points than this minimum score will be exported.
Click on “OK” to continue.
The standard dialog box for saving files appears. Enter the name of the file and choose a location to save the file. The description you have entered when exporting the results is automatically suggested as filename.
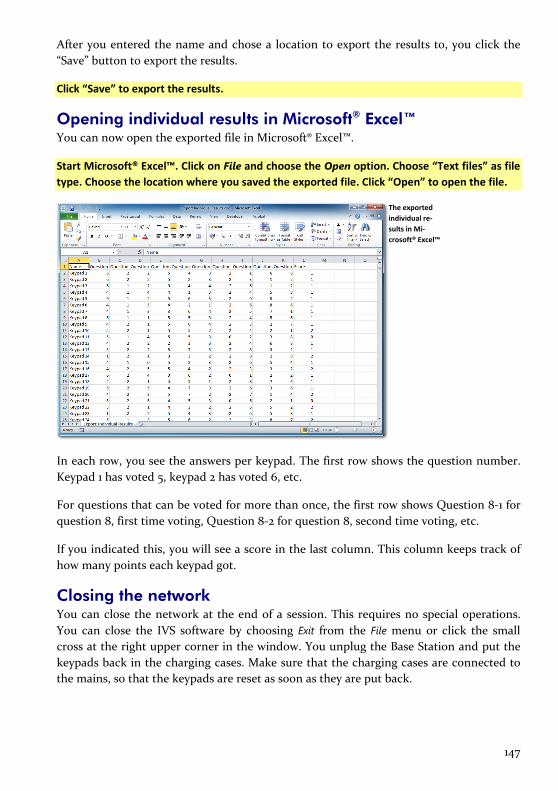
147
After you entered the name and chose a location to export the results to, you click the “Save” button to export the results.
Click “Save” to export the results.
Opening individual results in Microsoft® Excel™ You can now open the exported file in Microsoft® Excel™.
Start Microsoft® Excel™. Click on File and choose the Open option. Choose “Text files” as file type. Choose the location where you saved the exported file. Click “Open” to open the file.
The exported individual re-sults in Mi-crosoft® Excel™
In each row, you see the answers per keypad. The first row shows the question number. Keypad 1 has voted 5, keypad 2 has voted 6, etc.
For questions that can be voted for more than once, the first row shows Question 8-1 for question 8, first time voting, Question 8-2 for question 8, second time voting, etc.
If you indicated this, you will see a score in the last column. This column keeps track of how many points each keypad got.
Closing the network You can close the network at the end of a session. This requires no special operations. You can close the IVS software by choosing Exit from the File menu or click the small cross at the right upper corner in the window. You unplug the Base Station and put the keypads back in the charging cases. Make sure that the charging cases are connected to the mains, so that the keypads are reset as soon as they are put back.

148
However, if you are going to use the system for another session, you can leave the net-work intact. You only have to close this script and open the next one. Now you can con-tinue voting immediately.
Close the IVS software by choosing Exit from the File menu.
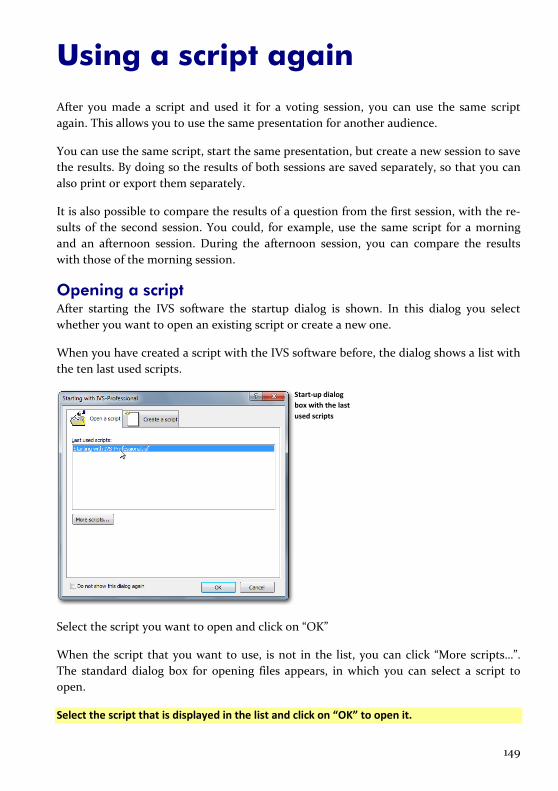
149
Using a script again
After you made a script and used it for a voting session, you can use the same script again. This allows you to use the same presentation for another audience.
You can use the same script, start the same presentation, but create a new session to save the results. By doing so the results of both sessions are saved separately, so that you can also print or export them separately.
It is also possible to compare the results of a question from the first session, with the re-sults of the second session. You could, for example, use the same script for a morning and an afternoon session. During the afternoon session, you can compare the results with those of the morning session.
Opening a script After starting the IVS software the startup dialog is shown. In this dialog you select whether you want to open an existing script or create a new one.
When you have created a script with the IVS software before, the dialog shows a list with the ten last used scripts.
Start-up dialog box with the last used scripts
Select the script you want to open and click on “OK”
When the script that you want to use, is not in the list, you can click “More scripts…”. The standard dialog box for opening files appears, in which you can select a script to open.
Select the script that is displayed in the list and click on “OK” to open it.

150
The script is opened again and the first slide is displayed
Initializing the Base Station When the Base Station is still connected to the computer and to the mains, it will be ini-tialized automatically when you start the IVS software. In the status bar you will see “Stand-by”, indicating that the Base Station is ready for use.
You can check the network by choosing the option Test network from the Communication menu. When all keypads respond to the network test you can close the test by clicking “Stop” in the Test network dialog box. The network is now ready for voting.
When the Base Station is no longer connected to the mains, you have to reconnect it and initialize the Base Station again. Choose the option Initialize cluster from the Communica-tion menu to initialize your Base Station again.
If this is not the case, connect the Base Station to the mains. Choose Initialize cluster from the Communication menu.
The dialog box for setting up the communication appears, in which you can initialize the Base Station.

151
Dialog box for initializing the Base Station
Click the “Initialize” button to initialize the Base Station. After initializing the Base Sta-tion correctly, the green LED in the dialog box is turned on. Click on “Finish” to finish in-itializing the Base Station.
Click “Initialize” to initialize the Base Station. Click “Finish” to finish the initialization of the Base Station.
For more information about initializing the Base Station, see “Communication with the Base Station” on page 121.
Initializing keypads If you did not put the keypads back in the charging cases, you can use the keypads im-mediately again for a second session. If you did put them back in the charging cases, you have to initialize the keypads again.
To initialize the keypads, you choose the option Initialize all keypads from the Communica-tion menu. For more information, see “Initializing keypads” on page 126.
Starting the presentation After you checked the Base Station and the keypads you can start a presentation again. Choose the option Start presentation from the Voting menu. You are asked again if you want to start a new session. Respond with “Yes” to this question and enter a description for the second session. The script is now ready and you can vote with it again.
For more information, see “Voting” on page 133.
Using a session again If you use a script again for another audience, you start a new session.
If your voting session consists of a morning session and an afternoon session, it is possi-ble that you have to close the computer during the break. A part of the questions is an-

152
swered during the morning session. To keep the results from the morning session and the afternoon session together, you have to put the morning session results back into the script to be able to add the results of the afternoon session.
To add results to an existing session, this session must first be imported. You do this by choosing the Import option from the File menu. A dialog box appears in which you select the session you want to import.
Choose the Import option from the File menu.
Dialog box for importing ses-sions
Select the session that you want to continue and click on “OK” to import the session. The results that were already saved in this session will be displayed in the result diagrams. You can press multiple times to go to the slide where you left off. If you happen to know the slide number where you left off, you can also press + + and enter the slide number of the slide where you left off. Finally, you start the presentation by choosing the Start presentation option from the Voting menu, of by pressing .
For the remainder of this manual we will not make use of a previously voted session. There-fore, click on “Cancel” to close this dialog without importing a session.
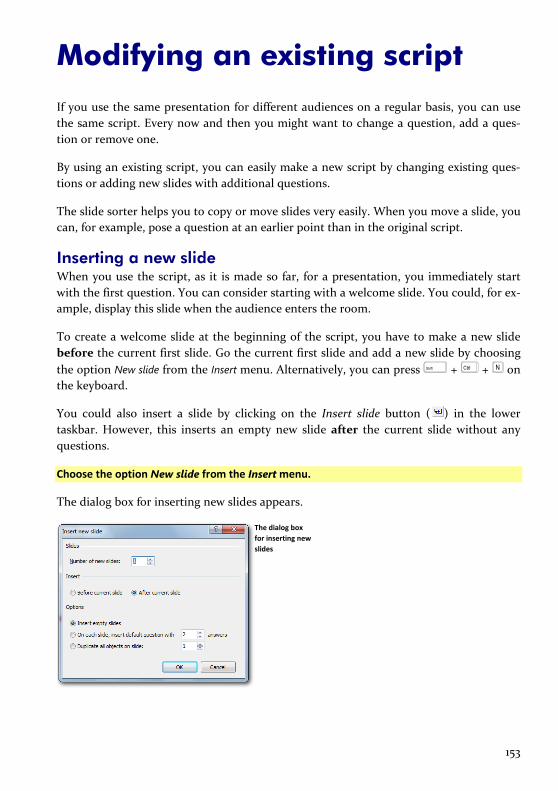
153
Modifying an existing script
If you use the same presentation for different audiences on a regular basis, you can use the same script. Every now and then you might want to change a question, add a ques-tion or remove one.
By using an existing script, you can easily make a new script by changing existing ques-tions or adding new slides with additional questions.
The slide sorter helps you to copy or move slides very easily. When you move a slide, you can, for example, pose a question at an earlier point than in the original script.
Inserting a new slide When you use the script, as it is made so far, for a presentation, you immediately start with the first question. You can consider starting with a welcome slide. You could, for ex-ample, display this slide when the audience enters the room.
To create a welcome slide at the beginning of the script, you have to make a new slide before the current first slide. Go the current first slide and add a new slide by choosing the option New slide from the Insert menu. Alternatively, you can press + + on the keyboard.
You could also insert a slide by clicking on the Insert slide button ( ) in the lower taskbar. However, this inserts an empty new slide after the current slide without any questions.
Choose the option New slide from the Insert menu.
The dialog box for inserting new slides appears.
The dialog box for inserting new slides

154
Slides At Number of new slides you select how many slides you want to insert. This offers the possibility to insert a number of new slides at once.
Insert Here you select whether you want the new slides to be inserted before or after the cur-rent slide.
Before current slide All new slides are inserted before the current slide. This option al-lows you to insert slides before the first slide.
After current slide All new slides are inserted after the current slide. This option allows you to insert slides behind the last slide.
Options When inserting new slides, you can insert standard empty slides. However, it is also pos-sible to insert slides with a question, answers and a result diagram or copy an existing slide.
Insert empty slides This option inserts standard empty slides.
On each slide, insert default question with 2 answers All new slides that you insert contain a question, a number of answers and a result diagram. You select how many answers you want to insert with each question. The maximum number of answers is 20. After insert-ing the slides you have to enter the question texts and answer texts.
Duplicate all objects on slide 1 This option allows you to duplicate an existing slide a number of times. All objects of the selected slide are automatically duplicated on each new slide.
Enter 1 for the Number of slides, select the option Before current slide and the option Insert empty slides. Click on “OK” to insert the new slide.

155
A new, empty slide inserted before the first slide
Adding a text The welcome text for this slide can be inserted as normal text. Choose the option Text from the Insert menu or press the on the keyboard.
The dialog box for entering text appears. Enter your welcome text and change the font when desired. Click on “OK” to insert the text.
Press to insert a text. Enter the text “Welcome to the IVS®” in the dialog box. Choose Arial Black as font with size 48. Center the text. Put the ®-sign in superscript. Click on “OK” to in-sert the text.
The welcome text is inserted at the position that is indicated in the template

156
The text appears at the position that is indicated in the template. Because the text box is too small, the text is displayed outside the text box.
Move the text box to the middle of the slide. Enlarge the bottom of the text box until all of the text fits within the text box.
The welcome text in the mid-dle of the slide
Using another background A background slide is automatically displayed on each slide. You can put a logo on the background slide that will be repeated on each slide.
You can consider not showing a logo on the title slide. In this case, you can disable the background slide of the title slide.
Go to the properties of the slide to disable the background slide. In the Properties of slide dialog, you uncheck the option Use background slide.
Click on the slide with the right mouse button and choose the option Properties. Uncheck the option Use background slide in the Properties of slide dialog box. Click on “OK” to apply the changes.

157
This title slide no longer shows a background slide
Inserting an image You can also insert an image to the title slide, for example an image that is related to the subject. To insert an image, choose the option Image from the Insert menu. In the stand-ard dialog for opening files, you select an image that you want to insert.
Choose the option Image from the Insert menu. Select the image you want to insert and click on “Open” to insert the image.
In the example below an image in PNG-format was used. This format supports the use of a transparent background.
The inserted im-age is placed over the wel-come text

158
Changing the order of objects Objects added to a slide are always inserted on top of the slide. This means that they are placed on top of other objects. The image you just added is therefore placed on top of the existing text.
The order of the objects can be changed. You could move the image that was placed on top of the text and send it further to the back, so that the image is displayed behind the text.
Select the object you want to send to the back and choose the option Order from the Edit menu and then the option Send further. Alternatively, you can click on the object with the right mouse button and select the option Order and then Send further or press + on the keyboard. The selected object will be placed one step further to the back.
Select the image and press + . The image is now behind the text.
The image is placed one step further to the back
You can bring objects closer to the front in the same way. Choose the option Order from the Edit menu and then the option Bring closer. The option Bring to front moves an object immediately to the top of the slide. The option Send to back moves an object immediately to the back of the slide.
Simulating a shadow effect Although the text is now on top of the image, part of the text is not quite readable. This is caused by the fact that the black text disappears against the dark background. You can prevent this by making the text lighter, but then the text might disappear against the mainly light background.

159
You can solve the problem of the disappearing text by placing a shadow behind the text. Using a lighter shadow behind the text prevents it from disappearing against the dark background.
The IVS software does not natively support the possibility to put a shadow behind texts. You can however simulate this shadow effect, by using two texts. You place a second, white text behind the dark text. By moving this text slightly compared to the text on top of it, you create the effect of a shadow behind the text.
Duplicating objects To make sure that the texts are exactly the same, you’d better duplicate the text. By du-plicating an object, you make an exact copy of it. This copy is immediately inserted in the same slide as the original. The same effect can be achieved by first copying the object by choosing the option Copy from the Edit menu, and then pasting the object by choosing the option Paste from the Edit menu.
Duplicating an object offers an extra option that normal copying and pasting does not. The duplicate can be inserted at a certain offset compared to the original. The offset can be set up using the preferences. For more information see “Preferences” on page 216.
Go to the preferences by choosing the Preferences option from the File menu. On the Edit tab, set both the horizontal and vertical placement to 2 pixels.
Select the object you want to duplicate and choose the option Duplicate from the Edit menu. Alternatively, you can press the + + keys on the keyboard. A copy of the selected object is inserted.
Select the text and choose the option Duplicate from the Edit menu.
The text has been duplicated and the dupli-cate has been moved slightly compared to the original
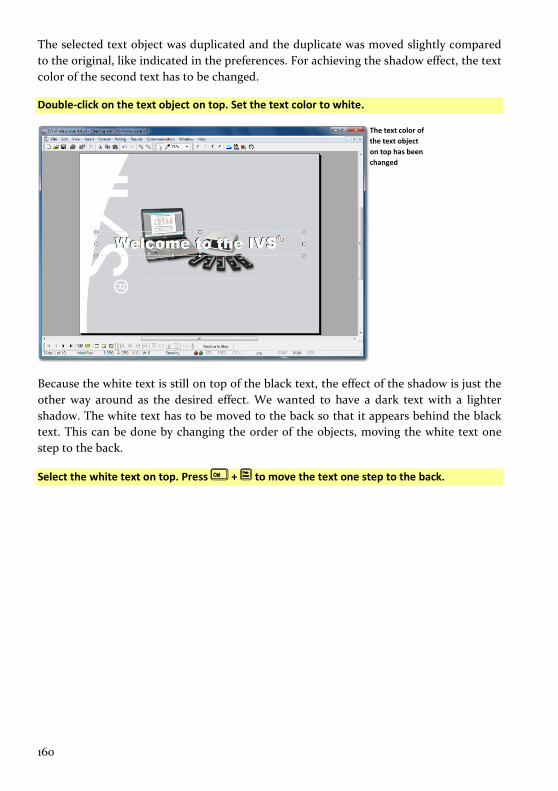
160
The selected text object was duplicated and the duplicate was moved slightly compared to the original, like indicated in the preferences. For achieving the shadow effect, the text color of the second text has to be changed.
Double-click on the text object on top. Set the text color to white.
The text color of the text object on top has been changed
Because the white text is still on top of the black text, the effect of the shadow is just the other way around as the desired effect. We wanted to have a dark text with a lighter shadow. The white text has to be moved to the back so that it appears behind the black text. This can be done by changing the order of the objects, moving the white text one step to the back.
Select the white text on top. Press + to move the text one step to the back.
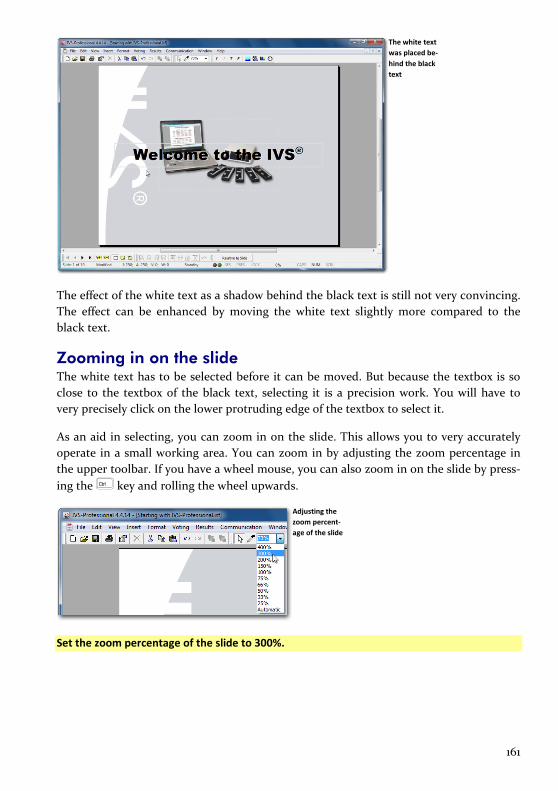
161
The white text was placed be-hind the black text
The effect of the white text as a shadow behind the black text is still not very convincing. The effect can be enhanced by moving the white text slightly more compared to the black text.
Zooming in on the slide The white text has to be selected before it can be moved. But because the textbox is so close to the textbox of the black text, selecting it is a precision work. You will have to very precisely click on the lower protruding edge of the textbox to select it.
As an aid in selecting, you can zoom in on the slide. This allows you to very accurately operate in a small working area. You can zoom in by adjusting the zoom percentage in the upper toolbar. If you have a wheel mouse, you can also zoom in on the slide by press-ing the key and rolling the wheel upwards.
Adjusting the zoom percent-age of the slide
Set the zoom percentage of the slide to 300%.

162
The slide is dis-played 3 times as big as normal
Use the scroll bars on the right and at the bottom of the slide to adjust the position of the slide on the screen, when the wrong part of the slide is displayed. You can also use the wheel of your wheel mouse to scroll the slide up or down. Keep the key depressed while turning the wheel to scroll the slide to the left or to the right.
Select the lower text box containing the white text. You do this by clicking on the lower edge of the two text boxes.
After having selected the textbox, you can display the entire slide again. This allows you to better observe the effect of moving the textbox. You display the entire slide by setting the zoom percentage to ‘Automatic’. The zoom percentage is then automatically adjusted so that the entire slide is visible. The real zoom percentage is displayed in the toolbar.
Set the zoom percentage to ‘Automatic’.
Moving objects with the cursor keys The textbox with the white text has to be moved slightly. You can try to move it very gen-tly with the mouse. Another option to move a selected object is by using the cursor keys.
If you have selected one or more objects, you can use the cursor keys to move these ob-jects on the slide. If you keep the key depressed while using the cursor keys, you can move the objects in bigger steps. If you keep the key depressed, you can move the objects in very small steps.
Keep the key depressed and press the right cursor key twice and the down cursor key once to move the textbox two small steps to the right and one small step downwards.

163
The white text was moved slightly so that it is better visible
Saving the script under another name To save the adjustments you just made to an existing script, you can save the original script again. This results in the original script being lost. To prevent this, you can save the adjusted script under another name.
Choose the option Save as from the File menu to save the script under another name. En-ter a new name for the script in the standard dialog box for saving files. Click the “Save” button to save the script with another name.
Choose the option Save as from the File menu. Enter the new name for the script “Continu-ing with IVS-Professional”. Click “Save” to save the script under the new name.

164
The slide sorter
The slide sorter shows an overview of all slides in the script. The slides are displayed as miniatures, so that a number of slides can be displayed on the screen at the same time. This allows you to find a slide very easily. You can also delete, copy or move slides in the slide sorter.
Starting the slide sorter To start the slide sorter, you choose the option Slide sorter from the View menu. The large slide disappears and the miniatures are built. Building all miniatures may take several minutes, especially when you have a lot of slides in your script or when you use a lot of images. You can cancel building the miniatures by pressing the key.
Choose the option Slide sorter from the View menu. Wait until all miniatures are built.
All slides that are made so far are displayed as miniatures in the slide sorter
Copying slides In the slide sorter you can select and copy several slides at the same time, after which you can paste them to add copies of the originals to your script.
You have to select slides before you can copy them. You select one single slide by clicking on it with the left mouse button. A selected slide is indicated with a blue border. By clicking on another slide with the left mouse button, you select that slide. If you want to select more slides at a time, press the key while clicking the second slide.
Click on the first slide with the left mouse button. This one has now been selected. Press the and click on the second slide. Both slides are now selected.
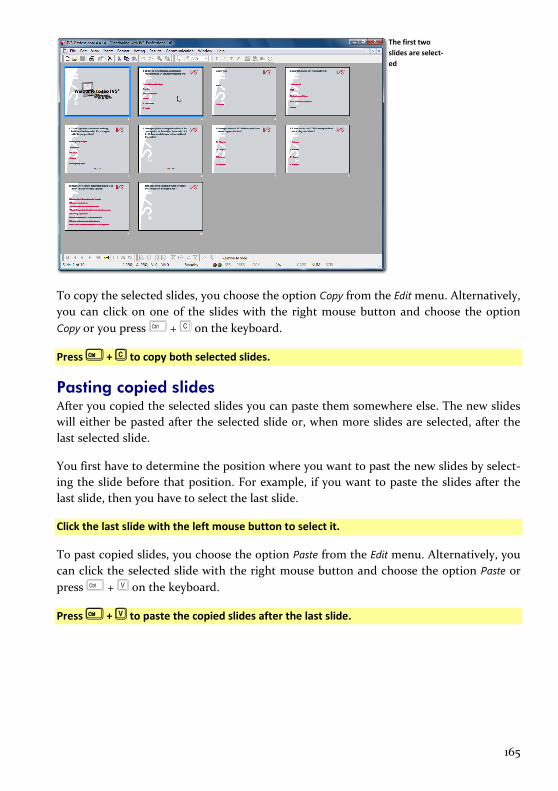
165
The first two slides are select-ed
To copy the selected slides, you choose the option Copy from the Edit menu. Alternatively, you can click on one of the slides with the right mouse button and choose the option Copy or you press + on the keyboard.
Press + to copy both selected slides.
Pasting copied slides After you copied the selected slides you can paste them somewhere else. The new slides will either be pasted after the selected slide or, when more slides are selected, after the last selected slide.
You first have to determine the position where you want to past the new slides by select-ing the slide before that position. For example, if you want to paste the slides after the last slide, then you have to select the last slide.
Click the last slide with the left mouse button to select it.
To past copied slides, you choose the option Paste from the Edit menu. Alternatively, you can click the selected slide with the right mouse button and choose the option Paste or press + on the keyboard.
Press + to paste the copied slides after the last slide.
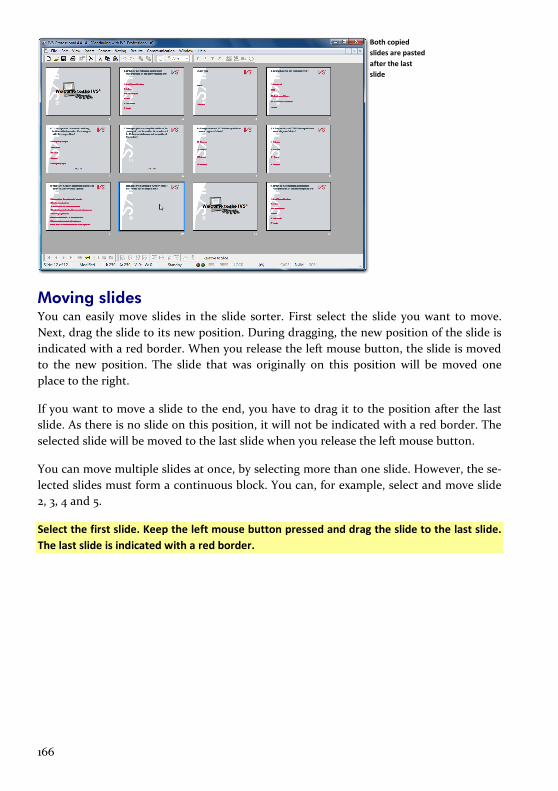
166
Both copied slides are pasted after the last slide
Moving slides You can easily move slides in the slide sorter. First select the slide you want to move. Next, drag the slide to its new position. During dragging, the new position of the slide is indicated with a red border. When you release the left mouse button, the slide is moved to the new position. The slide that was originally on this position will be moved one place to the right.
If you want to move a slide to the end, you have to drag it to the position after the last slide. As there is no slide on this position, it will not be indicated with a red border. The selected slide will be moved to the last slide when you release the left mouse button.
You can move multiple slides at once, by selecting more than one slide. However, the se-lected slides must form a continuous block. You can, for example, select and move slide 2, 3, 4 and 5.
Select the first slide. Keep the left mouse button pressed and drag the slide to the last slide. The last slide is indicated with a red border.
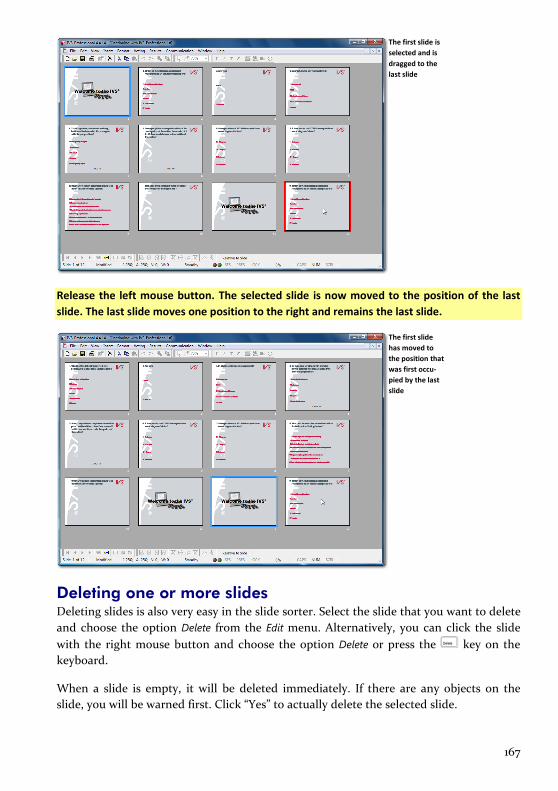
167
The first slide is selected and is dragged to the last slide
Release the left mouse button. The selected slide is now moved to the position of the last slide. The last slide moves one position to the right and remains the last slide.
The first slide has moved to the position that was first occu-pied by the last slide
Deleting one or more slides Deleting slides is also very easy in the slide sorter. Select the slide that you want to delete and choose the option Delete from the Edit menu. Alternatively, you can click the slide with the right mouse button and choose the option Delete or press the key on the keyboard.
When a slide is empty, it will be deleted immediately. If there are any objects on the slide, you will be warned first. Click “Yes” to actually delete the selected slide.

168
You can delete multiple slides at once by selecting more slides.
Select the second last slide and press to delete this slide. Click “Yes” to actually delete the slide.
Back to the normal slides There are two ways to return from the slide sorter to the normal slides. Choose the op-tion Normal from the View menu to return to the normal slides. The slide that was select-ed in the slide sorter will now be displayed.
You can also return to the normal slides by double-clicking one of the miniature slides in the slide sorter. You will now return to the normal slides and the slide you double-clicked will be displayed.
Double-click the last slide to return to the normal slides and to display the last slide.
Double-clicking the last slide closes the slide sorter and dis-plays the last slide
Deleting slides You can delete slides not only in the slide sorter, but also in the normal edit screen. However, here you can only delete one slide at a time. To delete a slide in the edit screen, you go to the slide that you want to delete and you choose the option Delete slide from the Edit menu. Alternatively, you can press the + keys on the keyboard or click the Delete slide ( ) button in the lower task bar.
When a slide is empty, it will be deleted immediately. If there are any objects on the slide, you will be warned first. Click “Yes” to actually delete the selected slide.
Press + to delete slide 11. Click “Yes” to actually delete the slide.
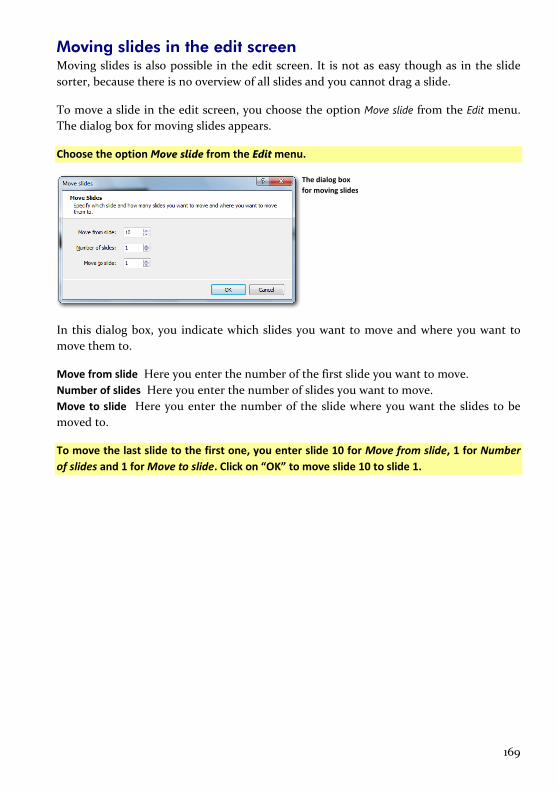
169
Moving slides in the edit screen Moving slides is also possible in the edit screen. It is not as easy though as in the slide sorter, because there is no overview of all slides and you cannot drag a slide.
To move a slide in the edit screen, you choose the option Move slide from the Edit menu. The dialog box for moving slides appears.
Choose the option Move slide from the Edit menu.
The dialog box for moving slides
In this dialog box, you indicate which slides you want to move and where you want to move them to.
Move from slide Here you enter the number of the first slide you want to move. Number of slides Here you enter the number of slides you want to move. Move to slide Here you enter the number of the slide where you want the slides to be moved to.
To move the last slide to the first one, you enter slide 10 for Move from slide, 1 for Number of slides and 1 for Move to slide. Click on “OK” to move slide 10 to slide 1.

170
Voting automatically with a timebar
Usually a script is controlled manually. You control when you want the show the next slide. You also control when the voting is opened and when the voting is closed.
You can also automate your entire script by using a timebar. By adding a timebar on each slide, you can have the voting opened after a few seconds. A few seconds later, you can have the voting closed. And a few seconds after that, you can go to the next slide. The timebar on the next slide will repeat this cycle, until the entire script is finished.
Depending on the settings, a timebar begins automatically when the slide is shown. On three different moments it can perform three different actions: open the voting, close the voting and go to the next slide. When, during the session, the timebar turns out to take too long, each of the actions can also be performed manually. When the timebar turns out to be too fast, it can be paused at any moment.
Go to another slide By using the and keys, you can go to the previous and next slide respectively. It is also possible to go to a certain slide at once. To do this, choose the option Go to slide from the View menu. Alternatively, you can press + + or on your keyboard. The Go to slide dialog box appears.
Press to go to another slide.
The dialog box to go to another slide
In this dialog box, you enter the slide number of the slide you want to go to. Next, click on “OK” to go to that slide.
Instead of immediately going to a certain slide, you can also move relative to the current slide. To move forward, you first enter a +, followed by the number of slides you want to move forward. To move backward, you first enter a –, followed by the number of slides you want to move backward.
Enter -3 and click on “OK” to go three slides backward. This takes you from slide 10 to slide 7.

171
Inserting a timebar To insert a timebar in a slide, choose the option Timebar from the Insert menu. Alterna-tively, you can press the Timebar ( ) button in the toolbar or press on your key-board.
Insert a timebar by choosing the option Timebar from the Insert menu.
A timebar has been inserted into this slide, to control the vot-ing time
Setting up the timebar The default setting for a timebar is that it starts to run when the voting is opened and closes the voting after ten seconds. This default setting can be changed in the template. Of course it is also possible to set up each timebar individually. For some questions the audience simply needs more time than for others.
To set up the timebar, you go to the properties of the timebar.
Click on the timebar with the right mouse button. Next, choose the option Properties.
The Properties of timebar dialog box appears.
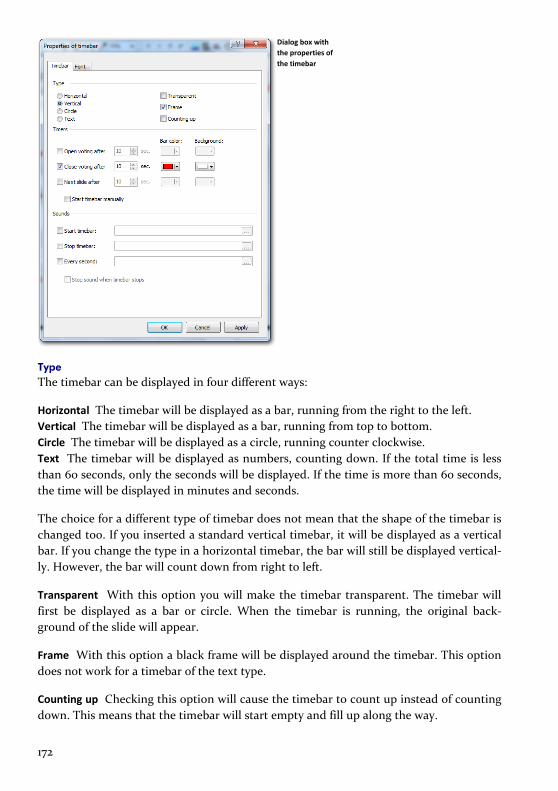
172
Dialog box with the properties of the timebar
Type The timebar can be displayed in four different ways:
Horizontal The timebar will be displayed as a bar, running from the right to the left. Vertical The timebar will be displayed as a bar, running from top to bottom. Circle The timebar will be displayed as a circle, running counter clockwise. Text The timebar will be displayed as numbers, counting down. If the total time is less than 60 seconds, only the seconds will be displayed. If the time is more than 60 seconds, the time will be displayed in minutes and seconds.
The choice for a different type of timebar does not mean that the shape of the timebar is changed too. If you inserted a standard vertical timebar, it will be displayed as a vertical bar. If you change the type in a horizontal timebar, the bar will still be displayed vertical-ly. However, the bar will count down from right to left.
Transparent With this option you will make the timebar transparent. The timebar will first be displayed as a bar or circle. When the timebar is running, the original back-ground of the slide will appear.
Frame With this option a black frame will be displayed around the timebar. This option does not work for a timebar of the text type.
Counting up Checking this option will cause the timebar to count up instead of counting down. This means that the timebar will start empty and fill up along the way.
173
Timers The timebar consists of three different timers, that run automatically after each other. You can turn each of these timers on or off. The time, timebar color and background col-or can be set for each timer individually.
Open voting after This timer starts as soon as the slide is shown. When the timer ends, the voting is opened. Close voting after This timers starts when the voting is opened. When the timer ends, the voting is closed. Next slide after This timer starts when the voting is closed. When the timer ends, the next slide is shown.
Start timebar manually If this option is checked, the timebar will start in a suspended state. You can resume the timebar manually by pressing .
Sounds When the timebar is running, you can have it play several sounds. The timebar supports every file format also supported by Windows. An audio clip will always be played com-pletely, unless some other audio clip needs to be played. In that case, any still playing audio clip is cut off.
Start timebar With this option you can play a sound when the first timer starts to run. Stop timebar With this option you can play a sound when the last timer ends. Every second With this option you can play a sound every second. If the audio clip itself is longer than one second, it will be restarted every second.
Stop sound when timebar stops With this option you can indicate that any playing sound has to be stopped once the timebar stops. If you are playing a sound clip that lasts 15 sec-onds, but the timebar closes the voting after 10 seconds, the sound clip would continue to play for another 5 seconds. By enabling this option, the sound clip will also be stopped after 10 seconds.
Choose a vertical timebar as timebar type, not transparent with frame. Select all three tim-ers. Open the voting after 5 seconds, close the voting after 10 seconds and go to the next slide in 10 seconds.
Copying objects To make the entire script run automatically, you will have to place a timebar on each slide. To make all timebars exactly the same, you first set up the timebar in the template. Next, you add a timebar to each slide.
If you do not want all the timebars to be the same, you will have to edit them manually. But even then, you can make two exactly the same timebars, by copying one timebar and then pasting it on the next slide.
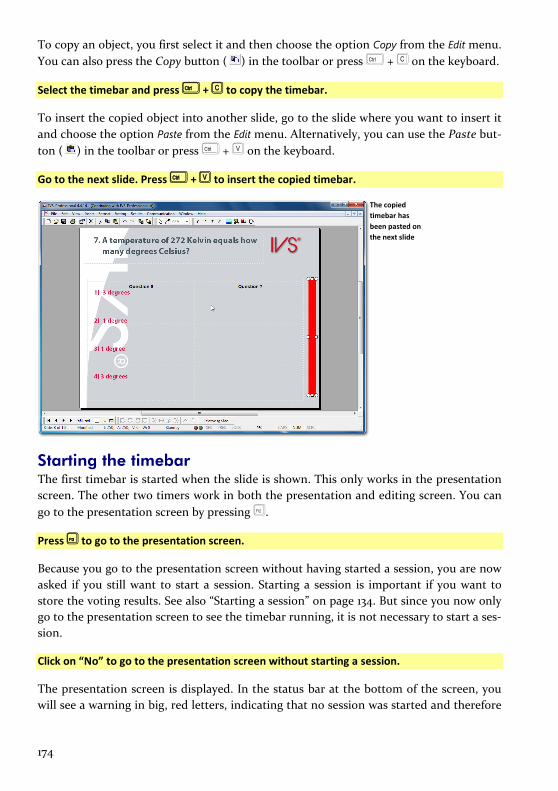
174
To copy an object, you first select it and then choose the option Copy from the Edit menu. You can also press the Copy button ( ) in the toolbar or press + on the keyboard.
Select the timebar and press + to copy the timebar.
To insert the copied object into another slide, go to the slide where you want to insert it and choose the option Paste from the Edit menu. Alternatively, you can use the Paste but-ton ( ) in the toolbar or press + on the keyboard.
Go to the next slide. Press + to insert the copied timebar.
The copied timebar has been pasted on the next slide
Starting the timebar The first timebar is started when the slide is shown. This only works in the presentation screen. The other two timers work in both the presentation and editing screen. You can go to the presentation screen by pressing .
Press to go to the presentation screen.
Because you go to the presentation screen without having started a session, you are now asked if you still want to start a session. Starting a session is important if you want to store the voting results. See also “Starting a session” on page 134. But since you now only go to the presentation screen to see the timebar running, it is not necessary to start a ses-sion.
Click on “No” to go to the presentation screen without starting a session.
The presentation screen is displayed. In the status bar at the bottom of the screen, you will see a warning in big, red letters, indicating that no session was started and therefore

175
no results will be stored. The first timer of the timebar is started, which causes the time-bar to start running down.
The timebar is running in the presentation screen
Controlling the timebar manually When the presentation is started, the first timer automatically starts to run. When this one finishes, the second timer starts. And when this one finishes, the third timer starts. You can also start the next timer manually, by performing the appropriate action.
Starting the next timer As soon as the first timer has finished, the voting is opened. However, if you open the voting while the first timer is still running, the second timer will immediately be started. In the same, way the third timer will immediately be started when the voting is closed while the second timer is still running.
Pausing the timer When the timebar is running, and you discover that the time you set for the timebar is too short, you can pause the timebar. To pause the timebar press . Press again to let the timebar continue running.
Stopping the timebar If you want to stop the timebar completely, you press while the timebar is this run-ning. All timers will be stopped. A timer will only be restarted when the appropriate ac-tion when performed. For example, if the voting is opened, and you stop the then run-ning timer, by pressing , the timebar will be stopped completely. When you manually close the voting, the third timebar will start running again. You can stop this one, by pressing again.
Wait until the three timers have run down. Next, press to return to the edit screen.
176
Working with multimedia
By using the multimedia object it is possible to add audio and/or video clips to your presentation. On each slide, you can place one or more multimedia objects, with which you can play an audio or video clip.
The multimedia object can be linked to the voting, so that the audio or video clip starts playing as soon as the voting is opened and the voting is closed as soon as the audio or video clip has ended.
By linking the multimedia object to the voting, you can have it read out the question, by playing an audio clip. Or you can ask a question based on a video clip you show.
Inserting a multimedia object To insert a multimedia object, you choose the option Multimedia from the Insert menu. Al-ternatively, you can press the Multimedia button ( ) in the toolbar or press on the keyboard.
The standard dialog box for opening files will be displayed. Here you can select the audio or video clip you want to play. The IVS software supports all file types which can be played by the Windows Media Player.
Add a new slide at the end of your script. Choose the option Multimedia in the Insert menu to insert a multimedia object. Select a file and click “Open” to open the file.
After having selected a file, the multimedia object is inserted. If you selected a sound clip, this will be displayed as a small multimedia icon. However, if you selected a video clip, then this will be displayed as a black area.

177
A video clip has been inserted as a multimedia object
Starting the multimedia object A newly added multimedia object is set to start manually by default. You determine when the audio or video clip is being played. To start the multimedia object, press . By pressing again while the multimedia object is still playing, it can be stopped again.
If you press + while the multimedia object is playing, the audio or video clip is paused. To resume the clip you press + again.
While the multimedia object is playing, the voting can be opened and one can vote nor-mally.
If you place multiple multimedia objects on one slide, and you leave them all set to start manually, they will all start playing simultaneously at the moment you press . Alt-hough it is possible to play multiple video clips simultaneously, it is not recommended. The performance of your computer decrease greatly when it has to decode multiple video streams simultaneously, which can result in the video clips stalling or the IVS software becoming unresponsive until all video clips have ended.
A video clip can only be played at one monitor at a time. If you show the presentation screen on a different monitor than the edit screen, the video clip will only be played in the presentation screen.
Starting automatically when voting The multimedia object can also be started automatically as soon as the slide is displayed or when the voting is opened or closed. And, when the multimedia object has finished playing, it can automatically show the next slide, open or close the voting.
To set up the multimedia object, you go to the properties of the multimedia object.

178
Go to the properties of the multimedia object by clicking on it with the right mouse button and choose the option Properties.
Dialog box with the properties of the multimedia object
Start multimedia The multimedia object can be started in five different ways.
Manually The multimedia object has to be started manually by pressing . When slide is shown The multimedia object is started as soon as the slide with the mul-timedia object on it, is shown. This will only function in the presentation screen. When voting is opened The multimedia object is started when the voting is opened. When voting is closed The multimedia object is started when the voting is closed. When the previous multimedia object end The multimedia object is started as soon as the previous multimedia object has ended.
When multimedia stops When the multimedia object has finished playing, it can perform four different actions.
Do nothing When the multimedia object ends, no action will be taken. Go to the next slide When the multimedia object ends, the next slide will be shown. Open the voting When the multimedia object ends, the voting will be opened. Close the voting When the multimedia object ends, the voting will be closed.

179
Color After inserting a video clip, it will be displayed as a black rectangle, as long as it is not playing. By clicking on the Background color window button, you can select a different color for this rectangle.
Select the option When voting is opened from the Start multimedia options and Close voting from the When multimedia stops options. Click on “OK” to set up the multimedia object.
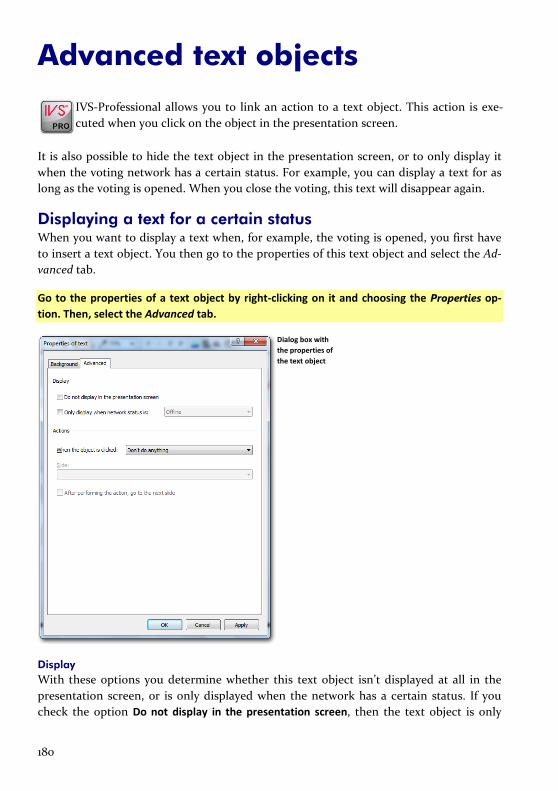
180
Advanced text objects
IVS-Professional allows you to link an action to a text object. This action is exe-cuted when you click on the object in the presentation screen.
It is also possible to hide the text object in the presentation screen, or to only display it when the voting network has a certain status. For example, you can display a text for as long as the voting is opened. When you close the voting, this text will disappear again.
Displaying a text for a certain status When you want to display a text when, for example, the voting is opened, you first have to insert a text object. You then go to the properties of this text object and select the Ad-vanced tab.
Go to the properties of a text object by right-clicking on it and choosing the Properties op-tion. Then, select the Advanced tab.
Dialog box with the properties of the text object
Display With these options you determine whether this text object isn’t displayed at all in the presentation screen, or is only displayed when the network has a certain status. If you check the option Do not display in the presentation screen, then the text object is only
181
displayed in the edit screen. If you check the option Only display when network status is:, then the text object is only displayed when the network has a certain status. You can choose from the following statuses:
Offline The text is displayed when the Base Station is no longer active. Stand-by The text is displayed when the Base Station is active but no performing any ac-tions. Test network The text is displayed when the keypads are being tested. Opening The text is displayed when the voting is being opened. Opened The text is displayed when the voting is open. Closing The text is displayed when the voting is being closed. Initializing The text is displayed when the keypads are being initialized. Resetting The text is displayed when the keypads are being reset. Detecting The text is displayed when the Base Station is being detected.
Performing an action when clicked You can link a certain action to a text object that is executed when you click on the ob-ject. This action is only executed when clicking on the object in the presentation screen. If a text object has an action linked to it, you will see the mouse cursor change into a hand when you move the mouse over the object.
You can set up an action in the properties of the text object. You can choose from the fol-lowing actions:
Don’t do anything No action is performed when clicking on the object Go to the first slide Clicking on the object will take you to the first slide. Go to the previous slide Clicking on the object will take you to the previous slide. Go to the next slide Clicking on the object will take you to the next slide. Go to the last slide Clicking on the object will take you to the last slide. Go to slide Clicking on the object will take you to a certain slide. From the list below Slide you can choose a slide to go to. Open the voting Clicking on the object will open the voting. Close the voting Clicking on the object will close the voting. Go to PowerPoint Clicking on the object will switch to PowerPoint. This requires that PowerPoint has already been started and there is an active slide show in PowerPoint. Go to the next slide in PowerPoint Clicking on the object will switch to PowerPoint and take you to the next slide in PowerPoint. This requires that PowerPoint has already been started and there is an active slide show in PowerPoint. Go to Risk Analysis Clicking on the object will switch to IVS-Risk Analysis. This requires that IVS-Risk Analysis has already been started. Go to Excel Clicking on the object will switch to Excel. This requires that Excel has al-ready been started.
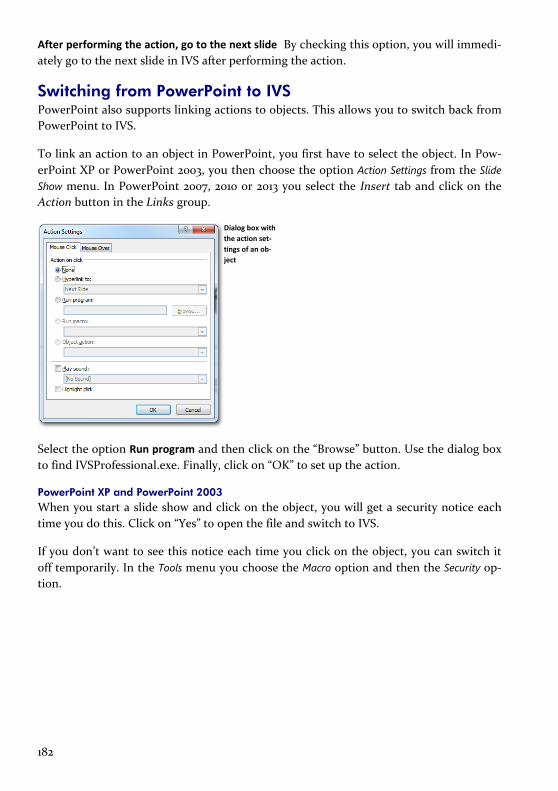
182
After performing the action, go to the next slide By checking this option, you will immedi-ately go to the next slide in IVS after performing the action.
Switching from PowerPoint to IVS PowerPoint also supports linking actions to objects. This allows you to switch back from PowerPoint to IVS.
To link an action to an object in PowerPoint, you first have to select the object. In Pow-erPoint XP or PowerPoint 2003, you then choose the option Action Settings from the Slide Show menu. In PowerPoint 2007, 2010 or 2013 you select the Insert tab and click on the Action button in the Links group.
Dialog box with the action set-tings of an ob-ject
Select the option Run program and then click on the “Browse” button. Use the dialog box to find IVSProfessional.exe. Finally, click on “OK” to set up the action.
PowerPoint XP and PowerPoint 2003 When you start a slide show and click on the object, you will get a security notice each time you do this. Click on “Yes” to open the file and switch to IVS.
If you don’t want to see this notice each time you click on the object, you can switch it off temporarily. In the Tools menu you choose the Macro option and then the Security op-tion.
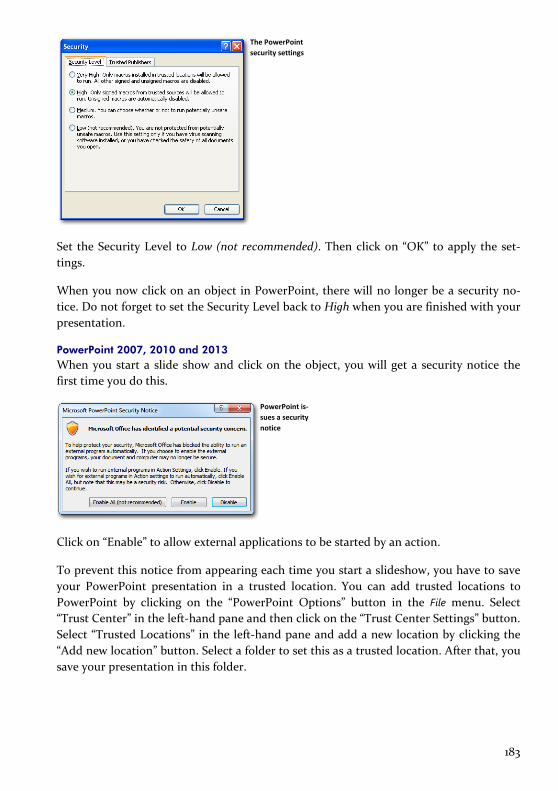
183
The PowerPoint security settings
Set the Security Level to Low (not recommended). Then click on “OK” to apply the set-tings.
When you now click on an object in PowerPoint, there will no longer be a security no-tice. Do not forget to set the Security Level back to High when you are finished with your presentation.
PowerPoint 2007, 2010 and 2013 When you start a slide show and click on the object, you will get a security notice the first time you do this.
PowerPoint is-sues a security notice
Click on “Enable” to allow external applications to be started by an action.
To prevent this notice from appearing each time you start a slideshow, you have to save your PowerPoint presentation in a trusted location. You can add trusted locations to PowerPoint by clicking on the “PowerPoint Options” button in the File menu. Select “Trust Center” in the left-hand pane and then click on the “Trust Center Settings” button. Select “Trusted Locations” in the left-hand pane and add a new location by clicking the “Add new location” button. Select a folder to set this as a trusted location. After that, you save your presentation in this folder.
184
Automatically displaying text with fields
Unlike IVS-Basic, IVS professional has an extra object that you can place on a slide. This object, the field, looks like a standard text object. In a standard text ob-ject, however, you have to enter the text that is displayed. In a field object you do not enter text. The field will show its own text, depending on the type of field that you insert.
There are eight different field types.
Score offers numerous possibilities to play quizzes. You can show the scores of each in-dividual participant but also of groups. You can also show a top-3, top-5 or top-10 of the participants that scored best. Results displays the results of specific answers, just like the result diagram. By using this field you can display the results as text-only instead of in a diagram. Participants this field shows the names of participants. Names are either displayed im-mediately, or only after a participant has voted, or even when a participant has given a certain answer. Cumulatives offers numerous possibilities for calculating totals, averages and other sta-tistical data for a group of questions. Network status displays several values of the voting network, such as the number of ini-tialized keypads, or the total number of received votes. Slide numbering displays the current slide number or the total number of slides. Date & Time displays the current date and/or time. Text displays the literal text as defined in an XML file.
A field can be inserted on the standard slide as well as on the background slide. To dis-tinguish the field from a standard text object, the field has a red boundary instead of a white boundary.
A field itself is not interactive. This means that a field behaves like a non-interactive re-sult diagram. When opening a vote the field is cleared and when voting is closed the re-sults are displayed. If you want to show the results in a field interactively you have to add an interactive result diagram on the slide. This result diagram does not necessarily have to be placed on the slide, it can also be placed just off the slide.
The only exception is a field of the Network status type. This type of field is automatically updated as soon as votes are being received.

185
This chapter shows a number of examples of how to use fields. A simple script is used with a number of questions and fields. No attention is paid to the lay-out of the script. And unlike the other chapters in this manual, this chapter does not mention the specific steps to create the script. The attention is focused on the settings of the fields.
Every question in this script is set to identified voting and to using the voting time. A participant list with 200 participants is used. These participants are divided in four groups with the names ‘RED’, ‘GREEN’, ‘BLUE’ and ‘YELLOW’. In each group there are 50 participants, that are named ‘Participant 1’ to ‘Participant 50’.
A text file as a basis To demonstrate the usage of fields, a script is made in this chapter, that can be used to play a quiz. The quiz contains seven questions with four answers each. Each question has one correct answer and three wrong answers, with the exception of the first question, that has two correct answers.
To be able to quickly and simply enter the quiz questions into IVS-Professional, the questions and the accompanying answers are first entered into a text file. This text file will then be imported into IVS-Professional, so that is can serve as a basis for the script that’s going to be made. The main advantage is that you don’t have to retype the ques-tion and answer texts, or have to copy and paste them. And you can also indicate the cor-rect answer in this text file.
The text file that is going to be imported into IVS-Professional only contains the question and answer texts. It is not possible to format the text in any way. This is done later by us-ing the template. It is also not possible to put any object other than a question, answers or a normal text into the text file
To allow IVS-Professional to recognize the text file, it has to start with two fixed lines. These are followed by an empty line, after which the text of the first question follows. On every line directly following the question text are the texts of the accompanying answers. After the last answer follows an empty line, after which the text of the next question may start.

186
Example of a text file with questions and answers
The first line of the text file contains the text ‘IVS-Basic Text Script’. This is the literal text, with ‘IVS-Basic’ even though you are using IVS-Professional, and without any extra spaces before, between or after the text. The second line contains the version number of this file, which is currently always 4.4. Here, too, there may be no extra space before or after the text.
When you import this text file into IVS-Professional, one slide will be created for each question. When necessary, you can have extra empty slides created by adding extra emp-ty lines between an answer text and the following question text.
A question text may be preceded by an asterisk (*) to indicate that this is a reference question, or by a number sign (#) to indicate that this is a rating question. A combination is also possible, by putting both signs in front of the question text.
An answer text may be preceded by an asterisk (*) to indicate that this is the correct an-swer.
Except question and answer texts, you can also enter normal texts in the text file, by pre-ceding them with an ampersand (&).
A text file can be imported by choosing the Open option from the File menu. The stand-ard dialog box for opening files appears. At the bottom right you select the ‘IVS-Professional text files’ file type. Next, select the text file that you want to import and click on the “Open” button.
Inserting a field To insert a field you choose the option Field from the Insert menu. Alternatively, you can click the Field ( ) button in the toolbar or press on the keyboard.
Before a field is inserted, the Properties of field dialog box appears in which you have to indicate what type of field you want to insert.

187
Dialog box with the properties of the field
Under Field type in this dialog box you select the type of field that you want to insert. Under Field options you can set the properties for this field, depending on the type of field you choose.
Displaying the date and time The field type Date & Time allows you to display the current date and/or time. Under Field options you can set how you want to display the date and how you want to display the time. You can choose from seventeen predefined date/time settings, but you can also set up your own settings.

188
The field options for the field type Date & Time
In the Date/Time notation text box you can fill in your own notation for showing the date and/or the time. You can also choose one of the predefined options from the list below. If you choose one of the options from this list, the notation is automatically inserted in the Date/Time notation text box.
You can use several combinations of characters for the notation. For example, ‘dd’ stands for the day of the month, ‘MM’ for the month as a number with a leading zero, and ‘yyyy’ stands for the current year as a four-digit number. The following combinations can be used:
c Displays the date using the format given by the Short Date Format in Region and Language of Windows, followed by the time set in hours, minutes and seconds.
d Displays the day as a number without a leading zero (1-31). dd Displays the day as a number with a leading zero (01-31). ddd Displays the day as an abbreviation (Sun-Sat). dddd Displays the day as a full name (Sunday-Saturday). ddddd Displays the date using the format given by the Short Date Format as set by
Region and Language. dddddd Displays the date using the format given by the Long Date Format as set by
Region and Language. m Displays the month as a number without a leading zero (1-12). If the ‘m’ speci-
fier immediately follows an ‘h’ or ‘hh’ specifier, the minute rather than the

189
month is displayed. mm Displays the month as a number with a leading zero (01-12). If the ‘mm’ speci-
fier immediately follows an ‘h’ or ‘hh’ specifier, the minute rather than the month is displayed.
mmm Displays the month as an abbreviation (Jan-Dec). mmmm Displays the month as a full name (January-December). yy Displays the year as a two-digit number (00-99). yyyy Displays the year as a four-digit number (0000-9999). h Displays the hour without a leading zero (0-23). hh Displays the hour with a leading zero (00-23). n Displays the minute without a leading zero (0-59). nn Displays the minute with a leading zero (00-59). s Displays the second without a leading zero (0-59). ss Displays the second with a leading zero (00-59). z Displays the millisecond without a leading zero (0-999). zzz Displays the millisecond with a leading zero (000-999). t Displays the time in hours and minutes. tt Displays the time in hours, minutes and seconds. am/pm Uses the 12-hour clock for the preceding ‘h’ or ‘hh’ specifier, and displays ‘am’
for any hour before noon, and ‘pm’ for any hour after noon. The ‘am/pm’ specifier can use lower, upper, or mixed case, and the result is displayed ac-cordingly.
a/p Uses the 12-hour clock for the preceding ‘h’ or ‘hh’ specifier, and displays ‘a’ for any hour before noon, and ‘p’ for any hour after noon. The ‘a/p’ specifier can use lower, upper, or mixed case, and the result is displayed accordingly.
ampm Uses the 12-hour clock for the preceding ‘h’ or ‘hh’ specifier, and displays ‘am’ or ‘pm’ as set by Region and Language.
/ Displays the date separator character set by Region and Language. : Displays the time separator character set by Region and Language. ‘xx’/“xx” Characters enclosed in single or double quotes are displayed as-is. “mm” is
therefore displayed as “mm” and not as the month as a number with leading zero.
Once you have chosen a notation or entered a notation yourself you click “OK” to accept the settings. The selected date and/or time are now displayed in the field.
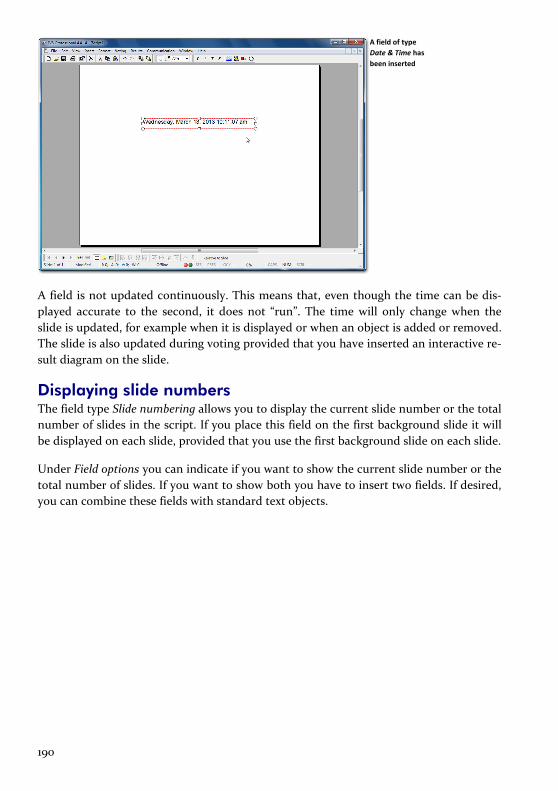
190
A field of type Date & Time has been inserted
A field is not updated continuously. This means that, even though the time can be dis-played accurate to the second, it does not “run”. The time will only change when the slide is updated, for example when it is displayed or when an object is added or removed. The slide is also updated during voting provided that you have inserted an interactive re-sult diagram on the slide.
Displaying slide numbers The field type Slide numbering allows you to display the current slide number or the total number of slides in the script. If you place this field on the first background slide it will be displayed on each slide, provided that you use the first background slide on each slide.
Under Field options you can indicate if you want to show the current slide number or the total number of slides. If you want to show both you have to insert two fields. If desired, you can combine these fields with standard text objects.

191
A field of type Slide numbering has been insert-ed
In the example above two standard text objects and two fields are inserted. The first field shows the current slide number, while the second field shows the total number of slides.
Displaying the network status With the field type Network status it is possible to display different values of the voting network.
You can display one of the following eleven statuses:
Number of initialized keypads Displays the total number of keypads initialized on all con-nected Base Stations. Number of active keypads Displays the number of keypads that were active at the mo-ment the last voting was opened. Number of voted keypads Displays the number of keypads that voted at least once. Total number of votes Displays the total number of votes. Total voting weight Displays the total voting weight given by all keypads that have voted. Total number of validly voted keypads Displays the total number of keypads that gave a valid vote. A vote is valid if this keypad voted at least the minimum number of times. Total number of invalidly voted keypads Displays the total number of keypads that gave an invalid vote. A vote is invalid if this keypad did not vote at least the minimum number of times. Simple majority of total number of validly voted keypads Displays the simple majority (50% + 1) of the total number of keypads that gave a valid vote. Total number of valid votes Displays the total number of valid votes. A vote is valid if this keypad voted at least the minimum number of times. Total number of invalid votes Displays the total number of invalid votes. A vote is invalid if this keypad did not vote at least the minimum number of times.

192
Simple majority of total number of valid votes Displays the simple majority (50% + 1) of the total number of valid votes.
Displaying results without a result diagram By using the field type Results you can show the results of a question in numbers instead of in a result diagram. In the field options you can indicate from which question and from which answer you want to show the results. You can display the results as absolute figures or as percentages. Furthermore, you can cross results with participant groups so that you can see the results of each participating group.
The field options for the field of type Results
Field options In the field options you indicate which results should be displayed in this field. In Results of question you indicate from which question the results should be displayed. You choose a question from the list containing all questions in your script. You can also choose Cur-rent question. This is the question that is on the same slide as this field. If there is no question on this slide, then the last question from the preceding slides is used.
Answers In the answer options you indicate what type of result you want to see. You can choose from the following fifteen types:
Result of answer Displays the results of a certain answer. You can select from which an-swer you want to see the results. In the list below Answer all answers from the question you chose under Results of question are listed.
193
Total result Displays the total result of all answers. Half of the total result Displays the half of the total result. This option can be used to see if a certain answer received at least half of the total votes. This is the actual half, so in case of an odd number of votes, half a vote will be shown. Total result of negative answers Displays the total result of all answers that are consid-ered negative. Negative answers are answers with the lowest answer number. For an even number of answers, the first half is considered negative, the last half is considered posi-tive. For an odd number of answers, the middle answer is considered neutral. It will nei-ther be counted to the negative answers, nor to the positive answers. Total result of positive answers Displays the total result of all answers that are considered positive. Positive answers are answers with the highest answer number. Total result minus last answer Displays the total result of all answers with the exception of the last answer. Simple majority of the number of votes Displays the simple majority (sometimes called “Half plus 0ne”) of the total number of votes. For an even number of votes, this is the half of the number of votes plus one. For an odd number of votes, this is the half of the num-ber of votes rounded upwards. Simple majority of the number of participants Displays the simple majority of the total number of participants. A participant is a keypad that voted at least once. Supermajority of the number of votes (2/3) Displays the supermajority (in this case ²⁄₃) of the total number of votes. For a number of votes that is a multiple of three, this is two thirds of the number of votes plus one. In both other cases, this is two thirds of the num-ber of votes rounded upwards. Supermajority of the number of participants (2/3) Displays the supermajority of the num-ber of participants. A participant is a keypad that voted at least once. Simple majority of the number of votes (rounded) Displays the simple majority of the total number of votes, first rounding the result. For an even number of votes, this is the half of the number of votes plus one. For an odd number of votes, this is the half of the number of votes rounded upwards, plus one. Simple majority of the number of participants (rounded) Displays the simple majority of the total number of participants, first rounding the result. A participant is a keypad that voted at least once. Supermajority of the number of votes (rounded) Displays the supermajority (in this case ²⁄₃) of the total number of votes, first rounding the result. For a number of votes that is a multiple of three, this is two thirds of the number of votes plus one. In both other cases, this is two thirds of the number of votes rounded upwards, plus one. Supermajority of the number of participants (rounded) Displays the supermajority of the total number of participants, first rounding the result. A participant is a keypad that vot-ed at least once. Total result of non-voters Displays the total number of keypads that didn’t vote, or, in case of an identified question, the total voting weight of the participants that didn’t vote. It is not possible to distinguish between keypads that have been handed out but didn’t vote, or keypads that have been initialized but not been handed out. If you initialized

194
more keypads than your final number of participants, these extra keypads will also be counted as non-voters.
Options Using the options you can indicate whether you want to show the results in absolute numbers or in percentages. You can have the percentage calculated based on the total number of votes as well as the total number of participants. In this case a participant is a keypad that voted at least once.
Absolute values The results are displayed in absolute numbers. Relative to number of votes The results are displayed in a percentage of the total number of votes. Relative to number of participants The results are displayed in a percentage of the total number of participants.
If you choose the Relative to number of votes or the Relative to number of participants op-tion, you can also indicate how many decimal digits you want to display using the Num-ber of digits option.
With the Only count participants from this group option you can enter a group name of which you want to see the results. When counting the results, only the results from par-ticipants in this group are counted. This allows you to make a crossing with several groups.
The name of the group is case-sensitive. This means that the groups ‘RED’ and ‘Red’ are two different groups. You can also enter multiple group names by separating the group name with a semicolon.
Various fields of type Results have been in-serted

195
In the example above the results of the four groups that answered this question are dis-played. The first field after the answer “Italy” is set to show the results of the current question and the answer “Italy”. Additionally, the results should be displayed as percent-ages with one digit behind the decimal point. Only the participants from the group ‘RED’ are counted. The following three fields have the same settings, except that they show the results of the groups ‘GREEN’, ‘BLUE’ and ‘YELLOW’ respectively. The last field is set to show the results of the current question and the answer “Italy”. The results are not dis-played as percentages and no group is selected to count the results from. Therefore the absolute number of votes for the first answer is displayed.
The other fields are set up the same, with the only exception that they show the results of a different answer. The last row with totals is set to display the total result stead of the result of a specific answer. The first four are set up to only show the results of a specific group. The last field shows the total result without counting participants from a certain group.
Displaying results from a series of questions It is not only possible to display the results of a certain question, you can also display all kinds of cumulatives. These are results calculated over a series of question. You can choose from a number of simple calculations, such as the total number of votes or the average number of votes, but there are also several statistical calculations available, such as the standard deviation and the variation coefficient.
The field options for the field of type Cumu-latives

196
In the field options you select the questions over which you want to calculate the cumu-latives. You can also calculate the cumulatives over just one question. You can also select whether you want to calculate the cumulatives over all answers or over just a single an-swer. The meaning of the calculation might differ depending on whether you choose all answers or just a single answer. The result calculated over all answers is also an answer, while the result calculated over a single answer is a number of participants.
For example, if you calculate the mean value of all answers, this will results in an average answer. If you calculate it for only a single answer, the average number of participants that voted for this answer is displayed.
You have to take care that the calculations you make return useful information. It has no use to calculate the total number of votes for answer 4 over ten questions, while not all questions really have four answers.
Display You can display various sorts of calculations.
Total number of votes Displays the total number of votes for the indicated questions. You can both display the total number of votes for a certain answer and the entire total of all answers. Relative number of votes Displays the relative number of votes for the indicated ques-tions. This is the percentage of voters for a certain answer compared to the total number of voters. The relative number of votes can only be displayed for a single answer. If you would display it for all answers, the result would always be 100%. Mean value Displays the mean value for the indicated questions. Variance Displays the variance for the indicated questions. The variance indicates the ex-tent to which the values differ, and thus how far they are from the average. Standard deviation Displays the standard deviation for the indicated questions. The standard deviation is approximately the average deviation from the average. Coefficient of variation Displays the coefficient of variation for the indicated questions again. The coefficient of variation is a measure of the relative distribution of values. Median Displays the median for the indicated questions. The median is the middle value of a series. Mode Displays the mode for the indicated questions. The mode is the value that occurs most often. 3rd Moment Displays the 3rd moment for the indicated questions. The 3rd moment is used to determine the skew. 4th Moment Displays the 4th moment for the indicated questions. The 4th moment is used to determine the kurtosis or flatness. Skew Displays the skew for the indicated questions. The skew indicates whether the dis-tribution differs to the left or to the right compared to a normal distribution. Kurtosis Displays the kurtosis for the indicated questions. The kurtosis indicates the flat-ness of a distribution, whether the distribution is high and narrow, or low and wide.
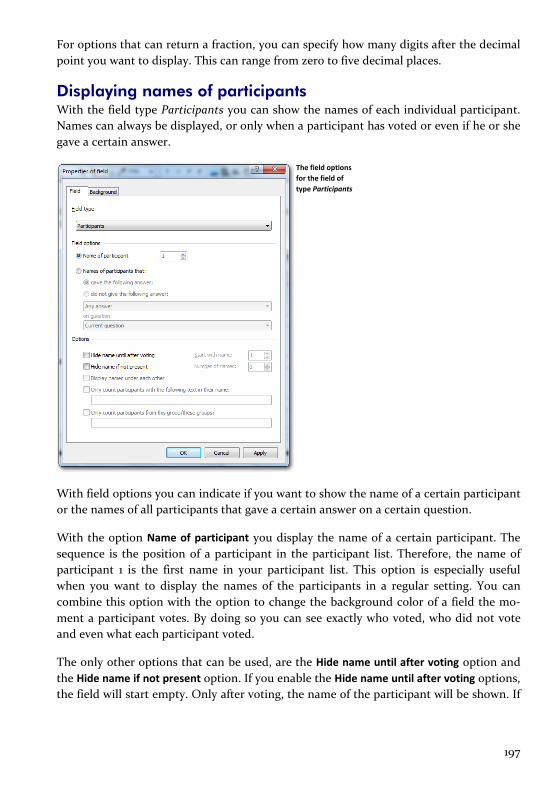
197
For options that can return a fraction, you can specify how many digits after the decimal point you want to display. This can range from zero to five decimal places.
Displaying names of participants With the field type Participants you can show the names of each individual participant. Names can always be displayed, or only when a participant has voted or even if he or she gave a certain answer.
The field options for the field of type Participants
With field options you can indicate if you want to show the name of a certain participant or the names of all participants that gave a certain answer on a certain question.
With the option Name of participant you display the name of a certain participant. The sequence is the position of a participant in the participant list. Therefore, the name of participant 1 is the first name in your participant list. This option is especially useful when you want to display the names of the participants in a regular setting. You can combine this option with the option to change the background color of a field the mo-ment a participant votes. By doing so you can see exactly who voted, who did not vote and even what each participant voted.
The only other options that can be used, are the Hide name until after voting option and the Hide name if not present option. If you enable the Hide name until after voting options, the field will start empty. Only after voting, the name of the participant will be shown. If

198
you enable the Hide name if not present option, the name of the participant will not be shown if the participant list indicates that this participant is not present (any more).
For each field type you can set a background just like for a standard text object. See also “Setting up the background” on page 45. When selecting Participants as a field type you can not only set up a background for it but you can even make is change according to what a participant votes.
In the tab Background you can indicate the background color for this field. You can choose between a transparent background, a single color, a gradient or an image. The group color option is only available when this question is a group question. In that case the background will get the color of the chosen group.
A field of type Participants al-lows its back-ground to be changed at the moment the participants have voted
Under Options you can indicate what should happen with the background when the par-ticipant has voted. If the option During voting, change the background to is enabled, then, as long as the voting is open, the background will be changed in the selected color as soon as this participant has voted. If the option After voting, change the background to is enabled, then, as soon as the voting is closed, the background will be changed in the se-lected color.
You can have the background color change with one of the following options:
transparent The background of the field will become transparent.

199
a single color The background of the field changes to a single color as indicate by the Primary color. the single color of the given answer The background changes into the single color that was set up as the bar color for the answer given by this participant. the single color of the correct or wrong answer The background changes into solid red when the participant gave the wrong answer or into solid green when the participant gave the correct answer.
Various fields of type Participants have been in-serted
In the example above hundred fields of the Participant type are inserted. The first field is set up to display the name of participant 1 only when the participant has voted on the current question. First, the background is set to None. After that, the option After voting, change the background to is enabled and after voting the background must change to a single color. Finally, the background color was set to orange. The other fields are set up the same for participant 2 to 100.
You see that after the participants have voted, their name appears and the background of the field turns orange. For the participants that have not voted yet the name does not appear and the background stays transparent.
By setting the background to change the color after voting to the color of the given an-swer, you can also see what these participants have voted. In the next example, the op-tion After voting, change the background to is set to the single color of the given answer.
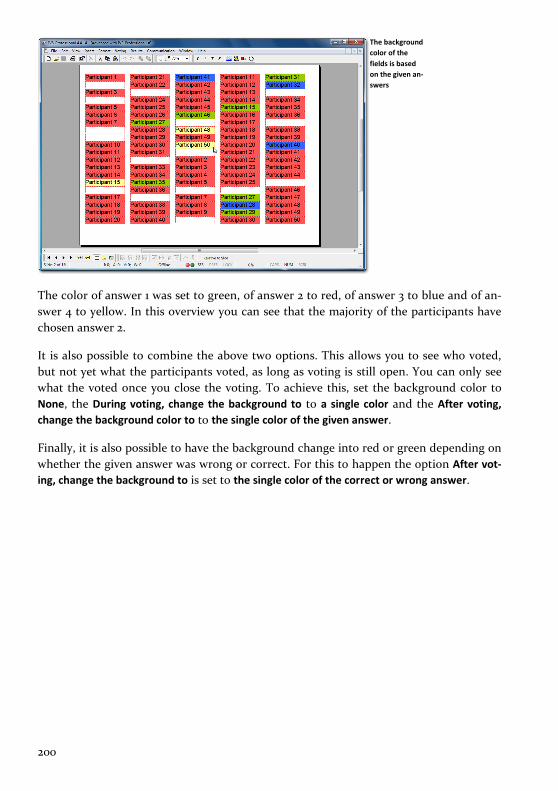
200
The background color of the fields is based on the given an-swers
The color of answer 1 was set to green, of answer 2 to red, of answer 3 to blue and of an-swer 4 to yellow. In this overview you can see that the majority of the participants have chosen answer 2.
It is also possible to combine the above two options. This allows you to see who voted, but not yet what the participants voted, as long as voting is still open. You can only see what the voted once you close the voting. To achieve this, set the background color to None, the During voting, change the background to to a single color and the After voting, change the background color to to the single color of the given answer.
Finally, it is also possible to have the background change into red or green depending on whether the given answer was wrong or correct. For this to happen the option After vot-ing, change the background to is set to the single color of the correct or wrong answer.

201
The background color is now based on the correct or wrong answer
When a participant has given the correct answer the background color of his field turns green. Did he or she give the wrong answer the background will turn red. The colors red and green are not fixed. You can change them in the properties of the corresponding question. See also “The properties of a question” on page 65.
Participants that gave a certain answer In the previous examples the name of one participant is displayed in one field. It is also possible to display several names in one field. This allows you to display the names of all participants that voted on answer 1. Or of all participants that did not vote on answer 1.
One field with participants that gave the correct answer to the previous ques-tion and one field with partic-ipants that gave the wrong an-swer
In the example above, two fields were inserted. The first field has a permanent green background color. In this field all participants are displayed that voted for answer 2 on

202
the current question. The second field has a permanent red background color. In this field all participants are displayed that did not vote for answer 2 on the current question.
The properties of field set up to display names of participants that have given a cer-tain answer
The properties of the first field are set to show the names of participants that gave the following answer. Answer 2 was selected as the answer, and the current question as the question.
The following options can also be set:
Display names under each other When this option is enabled the names are displayed under each other instead of side by side. Only count participants with the following text in their name If you only want to display participants that have a certain text in their name you enable this option. In the text box below you can enter the text that must be part of the name in order for this name to be displayed. This text must appear in the name exactly as entered, which means that it is case-sensitive. Only count participants from this group/these groups You enable this option when you on-ly want to display participants from a certain group. You can enter the name of the group in the text box below. A group name is also case-sensitive. You can also enter multiple group names by separating the names from each other with a semicolon. Start with name Here you specify the first name that may be displayed in this field. If you enter a 7 for example, the first six names that meet the specified conditions will not be shown. If you combine this option with the Number of names option, you can make dif-

203
ferent panels which show the names of the participants. To show the first 20 participants in the first panel, you set the Start with name option to 1, and the Number of names op-tion to 20. For the second panel, you set the Start with name option to 21 and the Number of names option to 20, etc. Number of names Here you specify the maximum number of names you want to display in this field.
The second field is set up like the first one. Only this time the option to show the names of participants that did not give the following answer was selected. And here too, answer 2 was selected as the answer and the current question as the question.
This way of displaying participants is especially useful if you want to play a knock-out race. For each question you can see which participants are still in the race and which ones were “knocked out”. For more information see “The knock-out race” on page 214.
The question used in this example is not very suitable for a knockout race. In a knockout race there can only be one correct answer per question. The question in this example has two correct answers. Both answer 2 and answer 4 are correct. A participant gets 10 points for both answers.
An overview of the score per participant With the field type Score you can display the score for each participant. You can display the score of each participant so that you can see exactly which participant got how many points. You can sort the participants based on their scores and put the best scoring par-ticipant at the top of the list. You can do the same per group, when participants do not play individually but in groups.
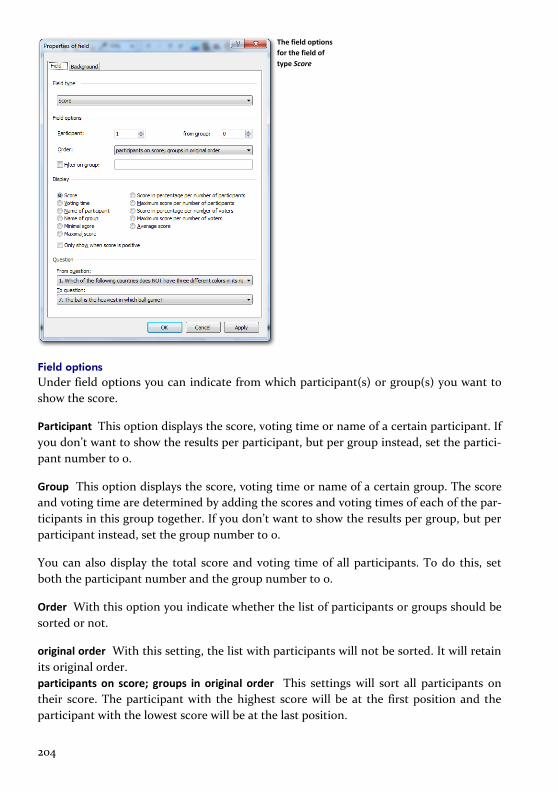
204
The field options for the field of type Score
Field options Under field options you can indicate from which participant(s) or group(s) you want to show the score.
Participant This option displays the score, voting time or name of a certain participant. If you don’t want to show the results per participant, but per group instead, set the partici-pant number to 0.
Group This option displays the score, voting time or name of a certain group. The score and voting time are determined by adding the scores and voting times of each of the par-ticipants in this group together. If you don’t want to show the results per group, but per participant instead, set the group number to 0.
You can also display the total score and voting time of all participants. To do this, set both the participant number and the group number to 0.
Order With this option you indicate whether the list of participants or groups should be sorted or not.
original order With this setting, the list with participants will not be sorted. It will retain its original order. participants on score; groups in original order This settings will sort all participants on their score. The participant with the highest score will be at the first position and the participant with the lowest score will be at the last position.

205
participants on score; groups on score This setting will first combine all participants from the same group. Then, a group score is determined for each of the groups, by adding to-gether the scores of each of the participants within this group. The groups are sorted on score, so that the group with the highest score will be at the first position. The partici-pants within each group are also sorted, so that the participant with the highest score is at the first position within this group. participants on score; groups on relative score per participants This setting is quite similar to the previous setting. However, the groups are not sorted on a total score, but on a rel-ative score instead. This is percentage of the total group score versus the score the group could have obtained if all participants had chosen the answer with the highest score. participants on score; groups on relative score per voters This setting also sorts the groups on a relative score. In this case, the relative score is a percentage of the total group score versus the score the group could have obtained if everyone who voted had chosen the answer with the highest score. Participants that did not vote are not taken into account.
If multiple participants or groups have the same score while sorting the list, the partici-pant or group with the lowest voting time will be on top.
A position can also be negative. In that case you won’t be displaying the best participant, but instead the worst participant. The participant at position -1 is the participant with the lowest score.
Filter on group This option allows you to filter a specific group or specific groups from the total group. To do this, you have to fill in the entire group name. A group name is case sensitive. You can also enter multiple group names by separating them from each other with a semicolon.
Display The options under Display determine what you want to show from the selected partici-pant(s) or group(s). Depending on the participants or groups you selected, instead of “participant”, you could also read “participants”, “group” or “groups”.
Score The total score of the selected participant. Voting time The total time that the selected participant needed to give his vote. Name of participant The name of the selected participant. Name of group The name of the group of the selected participant. Minimal score This option displays the lowest score of one of the participants. This is not a total score. If you calculate the minimal score over a series of questions, then this will display the lowest score a participant got for one of those questions. If you display the minimal score for a group, then this is the lowest score that one of the participants got for one of the questions. Maximal score This option displays the highest score of one of the participants. This is not a total score. If you calculate the maximal score over a series of questions, then this will display the highest score a participant got for one of those questions. If you display
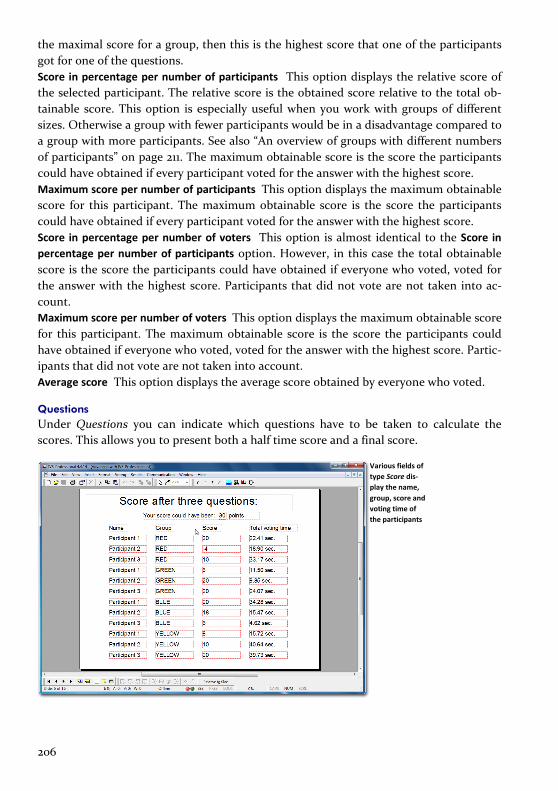
206
the maximal score for a group, then this is the highest score that one of the participants got for one of the questions. Score in percentage per number of participants This option displays the relative score of the selected participant. The relative score is the obtained score relative to the total ob-tainable score. This option is especially useful when you work with groups of different sizes. Otherwise a group with fewer participants would be in a disadvantage compared to a group with more participants. See also “An overview of groups with different numbers of participants” on page 211. The maximum obtainable score is the score the participants could have obtained if every participant voted for the answer with the highest score. Maximum score per number of participants This option displays the maximum obtainable score for this participant. The maximum obtainable score is the score the participants could have obtained if every participant voted for the answer with the highest score. Score in percentage per number of voters This option is almost identical to the Score in percentage per number of participants option. However, in this case the total obtainable score is the score the participants could have obtained if everyone who voted, voted for the answer with the highest score. Participants that did not vote are not taken into ac-count. Maximum score per number of voters This option displays the maximum obtainable score for this participant. The maximum obtainable score is the score the participants could have obtained if everyone who voted, voted for the answer with the highest score. Partic-ipants that did not vote are not taken into account. Average score This option displays the average score obtained by everyone who voted.
Questions Under Questions you can indicate which questions have to be taken to calculate the scores. This allows you to present both a half time score and a final score.
Various fields of type Score dis-play the name, group, score and voting time of the participants
207
In the example above, two more questions were inserted. The first question in this script has two correct answers. When a participant chooses either of them he gets 10 points. The other two questions each have one correct answer. And for these answers too, a par-ticipant can get 10 points. The standard score for these questions is set to -2 points, so that every participant that does not vote will get 2 penalty points.
On this slide an overview is displayed showing the half time score after the first three questions. The first column displays the names of the first three participants of each of the four groups. A field is inserted with its Field options set to display Participant 1, 2, 3, 51, 52, 53, 101, 102, 103, 151, 152 and 153. Because the participants are divided into groups of fifty participants each, it is not necessary to select a certain group. The option from group is set to 0.
The Display is set to Name of participant. Under Questions, question 1 was selected as the first question and question 3 as the last question.
The second column displays the group each participant is in. Here too the Field options are set to Participant and the from group option is set to 0. The Display is now set to Name of group. And finally, for column 3 and 4, the Display is set to Score and Voting time re-spectively.
At the top of the slide a text is inserted showing the maximum score for these three ques-tions. A standard text object is inserted with, on top of it, a field of type Score. The Field options are set to Participant 1 from group 0 and the Display is set to Maximum score per number of participants. It does not matter if you select Participant 1 or Participant 200. All 200 participants can obtain the same maximum score.
If you display the group name of a participant in a score overview, you can also have it display a background color. In the properties of a field that displays a group name, you can set the background color to Group color. This group color can only be used when you had your audience divide themselves into groups by using a group question. The answers of a group question determine the group names and the bar colors of these answers de-termine the group color.
An overview of the scores made per group The quiz in this example has 200 participants. It is impossible to show the results of all 200 participants on one slide in a decent way. Therefore, in the example, the results of only 12 participants were displayed. The 200 participants are divided into four groups. The first three participants of each group are displayed. It is also possible to make an overview of the four groups so that you can see the results of each group.
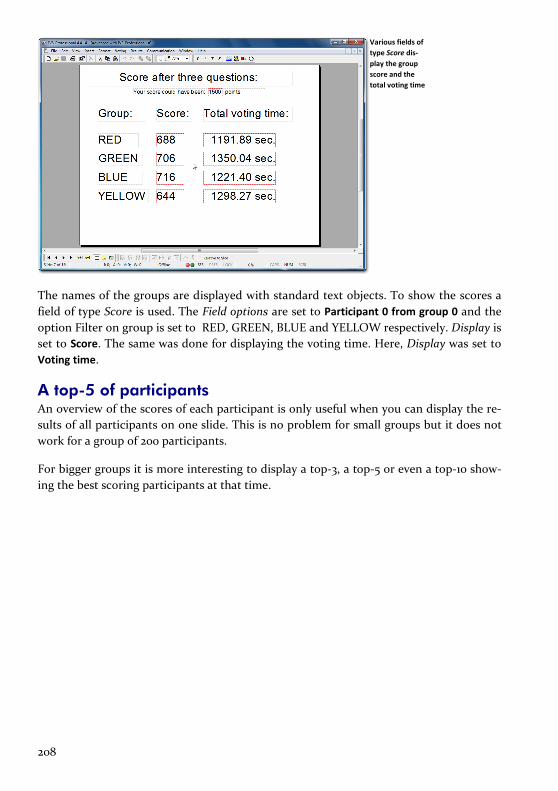
208
Various fields of type Score dis-play the group score and the total voting time
The names of the groups are displayed with standard text objects. To show the scores a field of type Score is used. The Field options are set to Participant 0 from group 0 and the option Filter on group is set to RED, GREEN, BLUE and YELLOW respectively. Display is set to Score. The same was done for displaying the voting time. Here, Display was set to Voting time.
A top-5 of participants An overview of the scores of each participant is only useful when you can display the re-sults of all participants on one slide. This is no problem for small groups but it does not work for a group of 200 participants.
For bigger groups it is more interesting to display a top-3, a top-5 or even a top-10 show-ing the best scoring participants at that time.
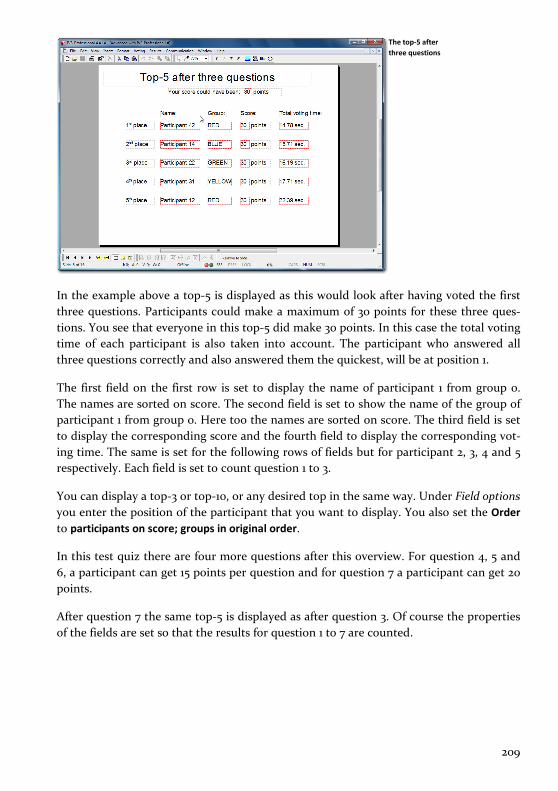
209
The top-5 after three questions
In the example above a top-5 is displayed as this would look after having voted the first three questions. Participants could make a maximum of 30 points for these three ques-tions. You see that everyone in this top-5 did make 30 points. In this case the total voting time of each participant is also taken into account. The participant who answered all three questions correctly and also answered them the quickest, will be at position 1.
The first field on the first row is set to display the name of participant 1 from group 0. The names are sorted on score. The second field is set to show the name of the group of participant 1 from group 0. Here too the names are sorted on score. The third field is set to display the corresponding score and the fourth field to display the corresponding vot-ing time. The same is set for the following rows of fields but for participant 2, 3, 4 and 5 respectively. Each field is set to count question 1 to 3.
You can display a top-3 or top-10, or any desired top in the same way. Under Field options you enter the position of the participant that you want to display. You also set the Order to participants on score; groups in original order.
In this test quiz there are four more questions after this overview. For question 4, 5 and 6, a participant can get 15 points per question and for question 7 a participant can get 20 points.
After question 7 the same top-5 is displayed as after question 3. Of course the properties of the fields are set so that the results for question 1 to 7 are counted.

210
The top-5 and bottom-3 after seven questions
Additionally, a bottom-3 is displayed on this slide as well. This gives an overview of the three worst scoring participants. The same fields as for the top-5 are used here. Only the participants at position -3, -2 and -1 are displayed respectively.
Should you want to show a top-5 on a slide that also contains a question, you have to be aware of the fact that the results are displayed the moment you open the voting. If this would be the first question, everyone will have 0 points. The top-5 does not mean any-thing then. The participant on the first position has exactly the same number of points as the one on the fifth position. Only when the voting is closed the correct overview of re-sults will be displayed. It is therefore advisable to always show a top-5 on a separate slide and not on a slide that is also used for voting.
A top-5 of groups You can display a top-5 of groups the same way you display a top-5 of participants. In this example it is a top-5, because there are four groups that participate in this quiz, but you can just as easily create a top-5 or a top-10.
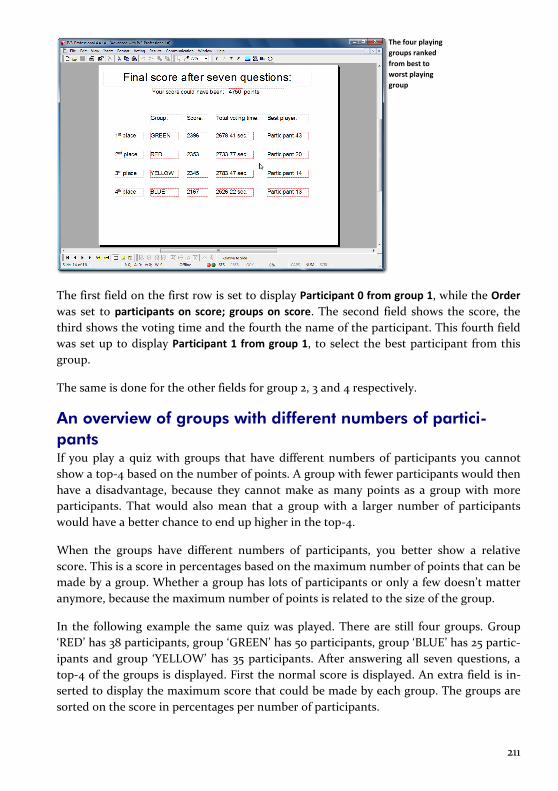
211
The four playing groups ranked from best to worst playing group
The first field on the first row is set to display Participant 0 from group 1, while the Order was set to participants on score; groups on score. The second field shows the score, the third shows the voting time and the fourth the name of the participant. This fourth field was set up to display Participant 1 from group 1, to select the best participant from this group.
The same is done for the other fields for group 2, 3 and 4 respectively.
An overview of groups with different numbers of partici-pants If you play a quiz with groups that have different numbers of participants you cannot show a top-4 based on the number of points. A group with fewer participants would then have a disadvantage, because they cannot make as many points as a group with more participants. That would also mean that a group with a larger number of participants would have a better chance to end up higher in the top-4.
When the groups have different numbers of participants, you better show a relative score. This is a score in percentages based on the maximum number of points that can be made by a group. Whether a group has lots of participants or only a few doesn’t matter anymore, because the maximum number of points is related to the size of the group.
In the following example the same quiz was played. There are still four groups. Group ‘RED’ has 38 participants, group ‘GREEN’ has 50 participants, group ‘BLUE’ has 25 partic-ipants and group ‘YELLOW’ has 35 participants. After answering all seven questions, a top-4 of the groups is displayed. First the normal score is displayed. An extra field is in-serted to display the maximum score that could be made by each group. The groups are sorted on the score in percentages per number of participants.

212
The four playing groups of differ-ent sizes ranked from best to worst playing group
You see that when calculating the 1st, 2nd, 3rd and 4th position, the different sizes of the group are already taken into account. Even though the ‘GREEN’ group has scored most points, they are still at position three. This group has the largest number of participants and therefore could have made a much higher score. By showing the relative score in-stead of the standard score the overview gets clearer.
The score of the groups displayed in percentages
Group ‘RED’ has scored a little over 45% of the total score that this group could make. This makes group ‘RED’ the winner. Even though group ‘GREEN’ has scored the most points in absolute figures, this was only 38% of what they could have scored. And that makes group ‘GREEN’ a worse playing group than group ‘RED’.

213
Still, the overview above isn’t that fair. In calculating the maximum score it is assumed that all participants in the group have voted. And when making a participants list, you have to decide how many participants there are going to be in each group. Even though in the example above it was taken into account that group ‘BLUE’ would have 21 partici-pants, it turned out that the real number of participants in this group was a little lower. This would make group ‘BLUE’ to be at a disadvantage.
You could say that this was tough luck for group ‘BLUE’. They should all have come to play the quiz. But it could also be that you didn’t know in advance how many partici-pants would be in group ‘BLUE’, and so you made a list of 21 participants. If the group turns out to have only 17 participants, you would put group ‘BLUE’ at a disadvantage.
If the group size isn’t known in advance, you can choose to have the relative score calcu-lated based on the maximum score per the number of voters. If only 17 participants in group ‘BLUE’ vote, the maximum score is calculated for these 17 participants instead of the 21 that were originally in the participants list.
The score of the groups displayed in percentages based on the number of vot-ers
You see that now that the score is calculated based on the number of participants that actually voted, the group ‘BLUE’ scored better than group ‘GREEN’.
A disadvantage of this method however, is that it is now more favorable for a participant that doesn’t know the correct answer to not vote at all instead of voting for the wrong answer. If he does vote, but gives the wrong answers, his score will not increase, but his maximum score does. If he doesn’t vote at all, his score will not increase, but neither will his maximum score. Relatively seen, the latter is more favorable.

214
The knock-out race In a knock-out race you also play a quiz. Unlike a standard quiz, a knock-out race only allows one correct answer for each question. Furthermore, a knock-out race is always played individually and never in groups.
After each question in the knock-out race, participants that gave a wrong answer are “knocked out” of the race. They are not allowed to vote for the next questions anymore. Their keypad still opens and they can vote with. However, their vote is no longer regis-tered. Only votes from participants that are still in the race are registered.
You play a knock-out race by enabling the Knock-out race option in the properties of each question. At the start of a session all participants take part in the race. When someone gives a wrong answer to a question he is out of the race. You play the race until only the winner is left. Should it happen that, at a certain question, the only remaining partici-pants all give a wrong answer and there is no winner, these remaining candidates will not be excluded from the race and can therefore still answer the next question. This means that even though all remaining participants are “knocked out”, you can still continue playing until there is only one winner left.
A knock-out race is active during one session. It is not possible to have participants that were already out of the race, take part in the race again, when you are still in the middle of your question. Only when you start a new session can all participants join again.
During a knock-out race you can ask questions that can be answered by all participants. Those questions are not part of the knock-out race. In the properties of these questions you disable the option Knock-out race.
For example, you play a knock-out race with 50 participants. After three questions there are 32 participants left. You then ask a question that is not part of the knock-out race. All 50 participants can answer this question. The next question is part of the knock-out race so only the 32 participants left can answer this question. After ten questions there are 5 participants left. Again you ask a question that does not belong to the knock-out race. All 50 participants can answer this question. The next question is part of the knock-out race again, so only the remaining 5 participants can answer this question. After this question there are three participants left. You ask one more question and all three of them give the wrong answer. But they can all try again when you ask the next question. In the end only one participant is left.
After each question in a knock-out race you can display a slide with two fields of type Participants. The first field is set to Names of participants that gave the following answer. You select the correct answer here as the answer. The other field is set to Names of partic-ipants that did not give the following answer. Here too you select the correct answer as the answer. After each question you can see which participants are still in the race and which

215
were “knocked-out”. See also the example in “Participants that gave a certain answer” on page 201.
Displaying text from an external application With a field of the Text type you can display any arbitrary text from an XML file. If you have this XML file written by another application, you can display information from an-other application in a field.
The field options for the field of type Text
An XML file is divided into a number of blocks, and each block is divided into a number of texts. The field options allow you to indicate from which block and from which text you want to display the information is this field. If you set the block index to 0, an index will be used that corresponds to the question number of the current question.
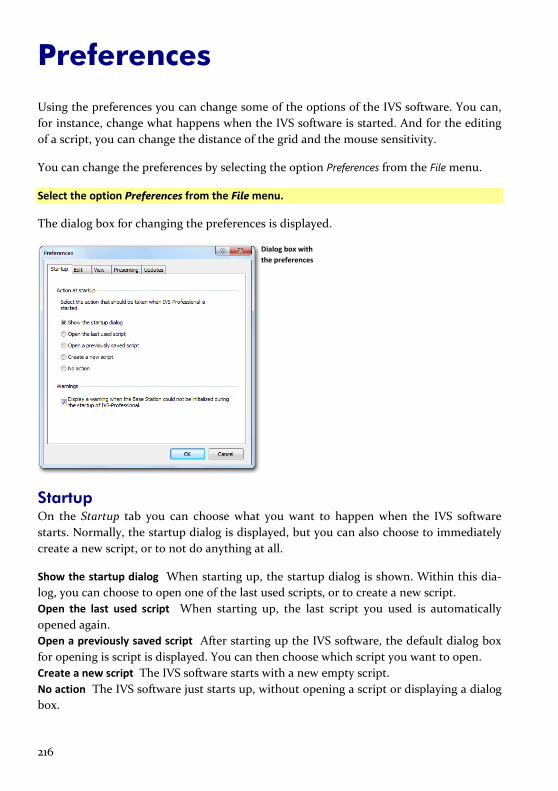
216
Preferences
Using the preferences you can change some of the options of the IVS software. You can, for instance, change what happens when the IVS software is started. And for the editing of a script, you can change the distance of the grid and the mouse sensitivity.
You can change the preferences by selecting the option Preferences from the File menu.
Select the option Preferences from the File menu.
The dialog box for changing the preferences is displayed.
Dialog box with the preferences
Startup On the Startup tab you can choose what you want to happen when the IVS software starts. Normally, the startup dialog is displayed, but you can also choose to immediately create a new script, or to not do anything at all.
Show the startup dialog When starting up, the startup dialog is shown. Within this dia-log, you can choose to open one of the last used scripts, or to create a new script. Open the last used script When starting up, the last script you used is automatically opened again. Open a previously saved script After starting up the IVS software, the default dialog box for opening is script is displayed. You can then choose which script you want to open. Create a new script The IVS software starts with a new empty script. No action The IVS software just starts up, without opening a script or displaying a dialog box.

217
Display a warning when the Base Station could not be initialized during the startup of IVS-Professional When this option is checked, a warning is displayed upon startup of the IVS software if the Base Station could not be initialized, while the IVS software was set up to automatically initialize the Base Station. If this option is not checked, no warning will be displayed when initializing fails.
Edit On the Edit tab you can set up how far a duplicate should be moved with regard to the original object, what the grid size is and what the mouse sensitivity is.
Duplicate placement When duplicating an object, you can have the object moved compared to the original at the same time. You can set the horizontal as well as the vertical displacement. The dis-placement can both be positive – the duplicate will be moved down or to the right – and negative – the duplicate will be moved up or to the left. The maximum horizontal dis-placement is 512 points, the maximum vertical displacement is 384 points. This is true for both positive and negative displacement.
Grid size If you use the grid to easily align objects, you can change the distance between the grid markers here. The minimum distance between two grid markers is 8 points, the maxi-mum distance is 384 points.
Horizontal Use this option to set up the size of the horizontal grid markers. Vertical Use this option to set up the size of the vertical grid markers.
Keep horizontal and vertical the same When this option is checked, the vertical distance automatically changes when the horizontal distance is changed and vice versa.
Mouse sensitivity The mouse sensitivity determines how far you have to move the mouse before an object is moved. The default sensitivity is 10, which means that only when you move the mouse 10 points, the object moves along with it. The higher the number of the mouse sensitivi-ty, the further you have to move the mouse before an object moves along with it. The minimum sensitivity is 1, the maximum sensitivity is 10.
View On the View tab you can indicate on which monitor you want to show the presentation screen and the screen’s aspect ratio.
Multiple monitors When your computer or laptop has multi-monitor support and you set up the second monitor to use the extended desktop, you can select on which of the monitors you want the presentation screen to be displayed. This allows you to display the presentation screen through a beamer connected to your laptop, while the edit screen is displayed on

218
the laptop’s internal display. There is no need to display the toolbar in the presentation screen. You can follow the progress of the voting through the edit screen.
Aspect ratio Using the aspect ratio you determine the ratio between the height and width of a slide. If this ratio corresponds to the ratio of your monitor, the slide will be displayed full screen in the presentation screen. If the ratio of the slide differs from the ratio of your monitor, black bars might be visible both on the left and on the right of the slide or at the bottom and the top of the slide.
The most used aspect ratio is 4 : 3. This means that the width of the screen is 133% of the height. Other often used aspect ratios are 5 : 4 for LCD screens and 16 : 10 for widescreen LCD screens.
Before you start making your script, set the ratio to match the ratio of your screen. The IVS software supports most occurring aspect ratios and some less occurring aspect ratios.
If you change the aspect ratio while you have one or more scripts opened, some of the objects might not or not entirely fit on the slide. If you open a script that was made with a different aspect ratio, the software temporarily switches to this new ratio.
Presenting On the Presenting tab you can set up whether you are using a Wireless Presenter to open and close the voting.
Use a Wireless Presenter to open/close the voting Enable this option if you are using a Wireless Presenter and want to be able to open and close the voting with it.
The Presenter alternately sends F5/Esc Most Presenters have a button to start and stop the presentation in Microsoft PowerPoint. The first time this button is pressed, it sends an F5 keystroke to the computer, the second time you press it, it sends an Esc keystroke. F5 can be used to open the voting. By selecting this option, the Esc key is set up to close the voting. Please note that you won’t be able to use the key on the keyboard anymore to cancel the voting. The will close the voting normally.
The Presenter sends a certain key, namely B Other Presenters have a button that sends a specific keystroke to the computer. For instance, this could be the B to blank the screen in Microsoft PowerPoint. By selecting this option, the Change voting menu option will be set up to use this key. You can then use this button to change the voting, that is, open and close it.
Please note that when closing the IVS software, the Use a Wireless Presenter to open/close the voting option is automatically disabled. This is to prevent that the key would stay set to close the voting, which would make it impossible to ever cancel the voting.

219
Updates On the Updates tab you can indicate how often you want the software to check for avail-able updates. You can choose from once a day, once a week, once a month, or not at all. You can always manually check whether an update is available by choosing the Check for updates option from the Help menu.

220
Troubleshooting
It is possible that you run into trouble during a session. For example, someone could stumble over the power cord of your Base Station, which leaves the Base Station discon-nected. The following scenarios describe what could happen and what you have to do to bring the session to a successful ending.
Scenario 1: Keylock not connected You have arrived at the location where you are about to give your session, with plenty of time to spare. All keypads are in the charging case and are fully charged. You start the IVS software and start the initialization of the keypads. You take 100 keypads out of the cases. If you take a look at the initialization box, you see that only 30 keypads have been initialized and no more are being initialized.
Initialization stops at 30 key-pads
You check the keylock and discover that you forgot to connect it. To continue the initial-ization, you do the following:
Stop the initialization of the keypads. Connect the keylock to a USB port of the computer. Continue initializing the keypads by choosing the option Initialize all keypads from the
Communication menu.
Scenario 2: Wrong keylock or keylock forgotten Just like in scenario 1 it turns out that you cannot initialize more than 30 keypads. While checking the keylock you discover that you have connected a keylock that it is not suita-ble for this version of the IVS software. On top of that, you forgot to take the correct the keylock. To continue the initialization, you do the following:
Stop the initialization of the keypads. Choose the option Temporary license from the Help menu. With this option you can
purchase a temporary license without having to connect a keylock. The dialog box for the temporary license appears.

221
Dialog box for requesting a temporary li-cense
In the Temporary license dialog box you see a program code, consisting of two blocks of five letters or numbers. You now call one of Interactive Voting Systems employees and tell him or her this program code. In exchange for this code you will receive a temporary license code, consisting of three blocks of five letters or numbers. You enter this in the three edit boxes.
The temporary license code has been entered
If the temporary license code was entered correctly, you see how many keypads can be used with this license and how long this license will remain valid. Click “OK” to acti-vate this license.
Continue initializing the keypads by choosing the option Initialize all keypads from the Communication menu.
Scenario 3: Base Station powerless while initializing keypads While you are initializing the keypads, someone pulls a plug somewhere, resulting in your Base Station becoming powerless. Of course, the initialization stops, but not all keypads have been initialized. To continue initializing, you do the following:
If it has not been done yet, reconnect the power to the Base Station. Initialize the Base Station by choosing the option Initialize cluster from the Communi-
cation menu.
222
Click the “Initialize” button in the Communication Settings dialog box. When the Base Station has been reinitialized, click on the “Finish” button.
All keypads have to be reset. This is done by placing them in the charging cases, while the charging cases are connected to the power supply. If you are using RF-I keypads, these keypads have to stay in the charging case for at least 5 minutes. If you are using RF-II keypads, they are reset immediately when they are placed in the charging case. If you are using Lite keypads, then they don’t need to be reset.
Restart the initialization of the keypads by choosing the option Initialize all keypads from the Communication menu.
Take all keypads you want to use out of the charging cases.
Scenario 4: Base Station powerless before session has start-ed Just like in scenario 3, your Base Station becomes powerless. However, all keypads are al-ready initialized. You had not yet started your session.
When the keypads are being initialized, the Base Station keeps a list of all initialized key-pads. After initializing the keypad, you save this list. When the Base Station becomes powerless, it will lose the list of keypads, so that it doesn’t know which keypads are ini-tialized. The keypads themselves are still initialized and therefore it is not necessary to reinitialize them. To continue your session, you do the following:
If it has not been done yet, reconnect the power to the Base Station. Initialize the Base Station by choosing the option Initialize cluster from the Communi-
cation menu. Click the “Initialize” button in the Communication Settings dialog box. When the Base
Station has been reinitialized, click on the “Finish” button. You will have to place the list of initialized keypads back into the Base Station. You do
this by choosing the option Load initialized keypads from the Communication menu . The standard dialog box for opening files appears. Select the list of keypads that you
have saved before and click “Open”. A dialog box appears in which you can see how many keypads have already been load-
ed into the Base Station and how many have to be loaded in total.
The list of key-pads is placed back into the Base Station

223
After the list has been reloaded, you will be asked if you want to test the network. This allows you to see if the communication with the keypads has been restored correctly. Click “Yes” to test the network. The dialog box for testing the network will appear.
After having checked that all keypads function correctly, click “Stop” to end the testing of the network.
Scenario 5: Base Station becomes powerless during a ses-sion Just like in scenario 3 and 4 the Base Station becomes powerless. You already started the session and have voted on some of the questions. In the presentation screen, no dialog boxes are displayed on screen. You notice that the Base Station became powerless, be-cause in the toolbar at the bottom of the screen “Offline” is displayed, instead of “Stand-by”. It could be that “Offline” will appear at the moment you open the voting. To contin-ue your session, you do the following:
If your projector has a pause mode, use this, so the audience doesn’t see what you are doing.
Go back to the edit screen by pressing . Follow the steps as described in scenario 4. Restart the presentation by pressing . Take the projector out of the pause mode.
Scenario 6: Computer crashes during a session While you are doing a session, your computer crashes for whatever reason. You have to restart the computer to be able to work with it again. To continue the session, you do the following:
If it has not been done yet, restart your computer. Start the IVS software. When you start the IVS software, the Base Station will be ini-
tialized automatically. In the start-up dialog of the IVS software, you select the script you were working with.
If the script is not displayed, you click on the “More scripts…” button. In the standard dialog for opening files, you open the desired script.
You open the same session you were working with. You do this by choosing the option Import from the File menu.
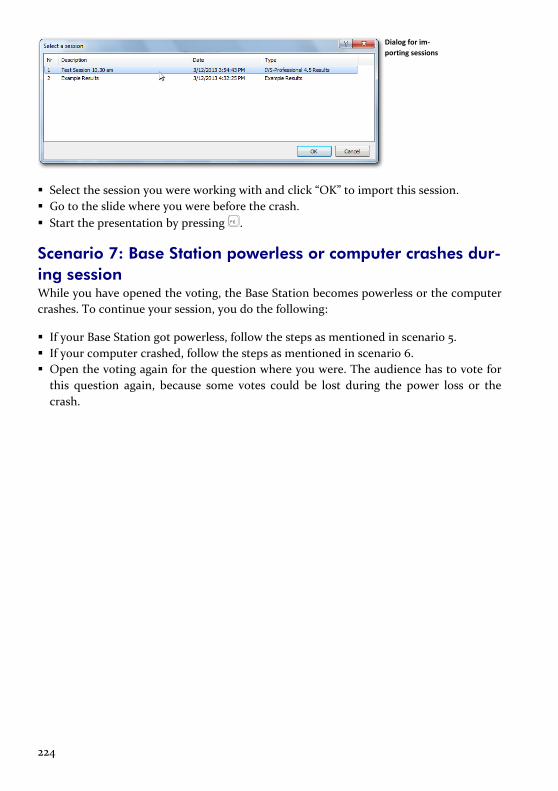
224
Dialog for im-porting sessions
Select the session you were working with and click “OK” to import this session. Go to the slide where you were before the crash. Start the presentation by pressing .
Scenario 7: Base Station powerless or computer crashes dur-ing session While you have opened the voting, the Base Station becomes powerless or the computer crashes. To continue your session, you do the following:
If your Base Station got powerless, follow the steps as mentioned in scenario 5. If your computer crashed, follow the steps as mentioned in scenario 6. Open the voting again for the question where you were. The audience has to vote for
this question again, because some votes could be lost during the power loss or the crash.
225
Index
A
absolute values · 32
aligning answers · 61 object · 40 relative to slide · 42 to grid · 57
answer aligning · 61 calculate ranking · 67, 103 correct answer · 79 display ranking · 66, 104 from template · 71 importing · 185 inserting · 15 jumping · 78 last one does not belong to
total · 67 moving · 39, 56 numbering · 15 outside slide · 98 properties · 88 score · 79
aspect ratio · 218
audio clip · 176
axes displaying · 27 displaying values · 28 normalizing · 28
B
background gradient · 47 image · 48 of field · 198 result diagram · 29 single color · 46 slide · 46
background slide disabling · 156 displaying · 19
bar chart · 26, 31, 74
Base Station automatically initialize · 128 connecting · 121 initializing · 124, 150 keypad functionality · 125 loading initialized keypads ·
222 powerless · 221 saving initialized keypads ·
131 selecting channels · 123 setting up · 121 time vote · 128
bullets · 50
C
chart type · 31
column chart · 31, 74
company logo · 20
comparing in percentages · 91 in the presentation screen ·
141 questions · 89 results · 87 settings · 34 to 100% · 28 undoing · 94
computer crash · 223
connecting Base Station · 121 keylock · 119
copying object · 173 question text · 101 slide · 88, 164
correct answer displaying · 93 setting up · 88
correction key · 69
crossing in the presentation screen ·
140 settings · 33 splitting · 81, 141 with multiple reference
questions · 84 with normal question · 141 with reference question · 76
D
date/time notation · 188
deleting in slide sorter · 167 slide · 168
distributing objects · 43
double votes · 69
duplicating objects · 159 offset · 217
E
edit screen · 143
enter key · 68
example results importing · 25 removing · 106
exporting individual results · 145 options · 146 score · 146
F
field inserting · 186
field type cumulatives · 195 date & time · 187 network status · 191

226
participants · 197 results · 192 score · 203 slide numbering · 190 text · 215
file type · 176
font of question · 49
G
go to slide · 170
grid activating · 56 aligning objects to · 57 setting up · 217
H
hiding toolbar · 136
horizontal chart · 74
I
identification · 67
image inserting · 20, 157 on the background · 48
importing example results · 25 results · 25 session · 25 text file · 185
initialization dialog · 130
initializing Base Station · 124, 150 keypad · 151
inserting answer · 15 answer from template · 71 field · 186 image · 20, 157 multimedia · 176 question · 13 result diagram · 16 slide · 153 text · 101, 155 timebar · 171
interactive · 27
IVS-Card Link automatic numbering · 118 importing list of names ·
117 list of participants based on
names · 116 simple list of participants ·
113, 115 starting · 112
IVS-Lite Link starting · 114
J
jumping from answer · 78 from slide · 45
K
keylock connecting · 119 forgotten · 220 not connected · 220 wrong keylock · 220
keypad functionality · 125 initializing · 129, 151 loading initialized keypads ·
222 saving initialized keypads ·
131 status · 137 time vote · 128
knock-out race · 68, 214
L
legend displaying · 29 with crossing or comparison
· 29 with pie chart · 29
legend text changing · 101 on axis · 29 rotating 45° · 29 using answer numbering ·
29
list of participants creating · 112
loading initialized keypads · 222
logo · 20
M
mean · 66, 72, 82
meeting · 12
miniatures · 164
mouse sensitivity · 217
moving answer · 39, 56 objects · 22 slide · 166, 169 with cursor keys · 162
multimedia action · 178 inserting · 176 pausing · 177 properties · 177 starting · 177 starting automatically · 177
N
network closing · 147 initializing · 124 testing · 132
nudging · 162
O
object aligning · 40 aligning to grid · 57 changing order · 158 copying · 173 deselecting · 22, 43 distributing · 43 duplicating · 154, 159 enlarging · 37 moving · 22 nudging · 162 pasting · 174 reducing · 37
227
selected · 22 selecting · 22
order · 158
P
pasting object · 174 slide · 88, 165
Peer Instruction · 87
percentages displaying · 32 number of digits · 32
preferences · 216
presentation ending · 143 enlarging screen · 135 hiding toolbar · 136
presentation screen · 135
printer settings · 107
printing hand-out · 109 hand-out with results · 144 script overview · 107 script overview with results ·
143 to file · 110
program code · 221
properties answer · 88 field · 186 multimedia · 177 question · 65 result diagram · 26, 55 slide · 44 slide in template · 53 timebar · 171
Q
question adjusting textbox · 58 changing font · 49 changing text · 49 copying text · 101 default score · 68
importing · 185 inserting · 13 number of answers · 68 numbering · 14, 66 properties · 65 times to vote · 69 voting time · 67 voting weight · 67 with identification · 67
question type knock-out race · 68 knowledge question · 88 ranking · 66, 104 rating question · 71, 73 reference question · 64, 67 voting more than once · 98,
138
R
ranking calculating · 67, 103 displaying · 66, 104
rating question with answer options · 71 without answer options · 73
reference question comprehensive · 80 inserting · 64 setting up · 67 simple · 76
result diagram background · 29 bars · 31 chart type · 31 columns · 31 correct answer · 28 frame · 28 inserting · 16 linking with question · 27 on next slide · 99 properties · 26, 55 values with bar · 32 walls transparent · 28
results absolute values · 32 comparing · 87 crossing · 76 example · 26 exporting · 145 importing · 25
in numbers · 192 percentages · 32 switching
absolute/percentages · 92
values with bar · 32
S
saving script · 17, 63 template · 62
score answer · 79 default · 68 different group sizes · 211 per group · 207 per participant · 203 top-4 of groups · 210 top-5 of participants · 209
script changing · 153 new · 12 opening · 149 printing hand-out · 109 printing overview · 107 saving · 17, 63 saving under another name
· 163
scroll keys · 69
selecting multiple objects · 40 object · 22
selecting channels · 123
session description · 134 importing · 25, 152 starting · 134 stopping · 106
setting up aspect ratio · 218 Base Station · 121 correct answer · 88 timebar · 171
slide background · 46 background slide · 19 copying · 88, 164

228
deleting · 167, 168 description · 45 go to other slide · 170 inserting · 153 jumping · 45 moving · 166, 169 new · 50 normal · 24, 58, 168 pasting · 88, 165 properties · 44 template · 53 zooming in · 161
slide sorter · 164
sounds in multimedia · 176 in timebar · 173
splitting crossing · 81, 141 multiple choices · 102, 141 undoing · 82
standard deviation · 66, 72, 82
start up settings · 216
start-up dialog · 12, 149
T
template
displaying · 52 saving · 62
temporary license · 220
temporary license code · 221
test network · 132
text importing · 186 inserting · 101, 155 with shadow · 159
text file · 185
text window · 13, 15, 49
three-dimensional · 28
time vote enabling · 67 of Base Station · 128 of keypad · 128
timebar controlling manually · 175 inserting · 171 properties · 171 setting up · 171 sounds · 173 starting · 174 stopping · 175 type · 172
timer pausing · 175 starting · 175
timers · 173
times to vote maximum · 69 minimum · 69
title bar · 18
troubleshooting · 220
V
vertical chart · 74
video clip · 176
voting automatically closing · 69 closing · 138 opening · 137
voting weight · 67
Z
zooming · 161

229

230


ww
w.iv
syst
em.n
l
Copyright © 1994-2002, 2002-2013Interactive Voting System bvPO Box 1438250 AC DrontenThe NetherlandsTel. +31 (0)321 33 99 99Email: [email protected]: http://www.ivsystem.nl