manuela ekowo and iris palmer the promise and peril … · the promise and peril of predictive...
TRANSCRIPT

MANUELA EKOWO AND IRIS PALMER
THE PROMISE AND PERIL OF PREDICTIVE ANALYTICS IN HIGHER EDUCATIONA Landscape Analysis
OCTOBER 2016

About the Authors
Manuela Ekowo is a policy analyst with the Education Policy program at New America. She provides research and analysis on policies related to higher education including innovations in higher
education delivery, the use of technology, and ensuring equitable outcomes for underrepresented students. Her writing has been featured in such media outlets as EdSurge, Pacific Standard, the EvoLLLution, and the American Youth Policy Forum.
Iris Palmer is a senior policy analyst with the Education Policy program at New America. She is a member of the higher education team, where she provides research and analysis on state policies
related to higher education including performance based funding, state student financial aid, and state data systems. Palmer previously worked at the National Governors Association on postsecondary issues. There she helped states strengthen the connection between higher education and the workforce, support competency based systems, use data from effectiveness and efficiency metrics and improve licensure for veterans. Prior to joining NGA, she worked at HCM Strategists on the Lumina Foundation’s initiative to develop innovative higher education models, including new technologies and competency-based approaches. Before joining HCM Strategists, Palmer worked at the U.S. Department of Education in all of the offices related to higher education: the Office of Vocational and Adult Education, the Office of Postsecondary Education, the Policy Office and the Office of the Undersecretary.
Acknowledgments
We would like to thank the Kresge Foundation, Lumina Foundation, and the Bill & Melinda Gates Foundation for their generous support of this work. The views expressed in this report are those of its authors and do not necessarily represent the views of the foundations, their officers, or employees.
About New America
New America is committed to renewing American politics, prosperity, and purpose in the Digital Age. We generate big ideas, bridge the gap between technology and policy, and curate broad public conversation. We combine the best of a policy research institute, technology laboratory, public forum, media platform, and a venture capital fund for ideas. We are a distinctive community of thinkers, writers, researchers, technologists, and community activists who believe deeply in the possibility of American renewal.
Find out more at newamerica.org/our-story.
About the Education Policy Program
New America’s Education Policy program uses original research and policy analysis to solve the nation’s critical education problems, serving as a trusted source of objective analysis and innovative ideas for policymakers, educators, and the public at large. We combine a steadfast concern for low-income and historically disadvantaged people with a belief that better information about education can vastly improve both the policies that govern educational institutions and the quality of learning itself. Our work encompasses the full range of educational opportunities, from early learning to primary and secondary education, college, and the workforce.
Our work is made possible through generous grants from the Alliance for Early Success; the Buffett Early Childhood Fund; the Foundation for Child Development; the Bill and Melinda Gates Foundation; the Evelyn and Walter Haas, Jr. Fund; the Heising-Simons Foundation; the William and Flora Hewlett Foundation; the Joyce Foundation; the George Kaiser Family Foundation; the W.K. Kellogg Foundation; the Kresge Foundation; Lumina Foundation; the McKnight Foundation; the Charles Stewart Mott Foundation; the David and Lucile Packard Foundation; the J.B. & M.K. Pritzker Family Foundation; the Smith Richardson Foundation; the W. Clement and Jessie V. Stone Foundation; and the Berkshire Taconic Community Foundation.
Find out more at newamerica.org/education-policy.

Contents
A Tale of Two Colleges Using Student Data 2
The Extent of Predictive Analytics Use in Higher Education 4
Reasons for Using Predictive Analytics in Higher Education 5
Predictive Analytic Tools 7
Challenges of Using Predictive Analytics 13
Appendix A: Predictive Analytics in Other Social Services 18
Appendix B: Interview List 21
Notes 23

EDUCATION POLICY2
Mount Saint Mary’s University, a small, private Catholic college in Emmitsburg, Maryland, made the news in 2016 when its president, Simon Newman, reportedly said about its freshmen, “You just have to drown the bunnies … put a Glock to their heads.”1 Newman was referring to a plan he had come up with to artificially improve the school’s retention rate. 2 He wanted to achieve this by requiring new students to take a survey, and then use their answers to identify those who were likely to drop out.3 Those students would then be encouraged to leave before they were included in the retention data the institution reports to the federal government.4,5 In an email sent to staff, Newman wrote that he wanted “20-25 people to leave by the 25th of September to boost retention by 4-5 percent,” according to the school’s newspaper, The Mountain Echo. 6
When the national press picked up on The Mountain Echo’s article, Newman’s plan (and his surprisingly violent language) came under fire. Instead of supporting the students Mount St. Mary’s had chosen to enroll, Newman was trying to weed out those who might hurt the college’s standing in national rankings. Worse yet, students were not told that the survey would be used to pressure some to leave.7 Defending himself, Newman argued that he was trying to help struggling students. He said he
intended to refund the students’ tuition, helping them avoid accumulating debt for a degree they might not have any chance of earning.8 His plan, he argued, could give these students a fresh start, allowing them to enroll somewhere they might be more successful.9 But even if we take Newman at his word, transferring to another institution is not as easy as he makes it sound. This process takes time, and gaps in enrollment can delay students in completing their degrees.
Mark Becker, the president of Georgia State University, has taken a very different approach to using information about students: he uses it to help them succeed. The four-year public university in Atlanta has become a national model for the approach it takes in helping underserved students—low-income, first-generation, and students of color alike—thrive in college.10 At Georgia State, non-white students make up 60 percent of the student body.11 More than half of the university’s students are eligible for the federal grant program, and about a third are the first in their families to go to college.12
Becker began working on raising Georgia State’s graduation rate in 2011.13 As a part of his effort, the university revised its advising system, created a central advising office on campus, and hired 42 new advisors.14 The institution also hired
A TALE OF TWO COLLEGES USING STUDENT DATA

EDUCATION POLICY The Promise and Peril of Predictive Analytics in Higher Education: A Landscape Analysis 3
EAB (formerly the Education Advisory Board), a consulting firm that uses predictive analytics to help identify students who might not graduate.15 Educause, a nonprofit focused on the advancement of information technology in higher education, defines predictive analytics as “statistical analysis that deals with extracting information using various technologies to uncover relationships and patterns within large volumes of data that can be used to predict behavior and events.”16 In other words, predictive analytics uses past information to uncover relationships that can help predict future events.
To carry out Becker’s plan, Georgia State analyzed two and a half million grades earned by students over ten years to create a list of factors that predict which students are less likely to graduate.17 The university’s Graduation and Progression Success system (GPS) includes more than 800 alerts aimed at helping advisors keep students on track to graduation.18 For example, an advisor gets an alert when a student does not receive a satisfactory grade in a course that is essential to success in his or her major.19 An alert also goes out if a student—based on his or her degree pathway—does not take a required course within the recommended timeframe.20 Finally, an advisor is notified if a student signs up for a class not relevant to that individual’s major.21 The GPS Advising system also uses past student performance data to predict how well each current student will do in all majors and most courses offered at Georgia State.22
In one year alone, the system led to over 43,000 in-person meetings between students and advisors.23 But the most impressive feat is how successful this system has been in contributing to the improved academic performance of low-income and minority students. According to Timothy Renick, Georgia State’s vice president for enrollment management
and student success, as well as vice provost, Georgia State is now the “only public university of its size that has closed the achievement gap—graduating our first-generation, Pell-eligible, black, and Latino students at rates at or above the rates for the student body overall.”24 The university’s six-year graduation rate is 52 percent, above the national average of 43 percent.25
The leaders at both Georgia State and Mount Saint Mary’s tried to use predictive analytics to achieve their goals. The different ways they went about it, however, show both the great promise and tremendous peril that this approach holds for higher education, and educational opportunity in general, in the U.S. As these examples show, predictive analytics can be used to help low-income and minority students overcome the odds and succeed in college, or it can be used to shut them out altogether.
We talked with college administrators, experts in the field, and vendors (over 30 people; see Appendix B for full list of interviews), performed an extensive review of existing literature, and conducted a site visit to Georgia State University in order to provide a landscape analysis of the predictive analytics field in higher education and lay out some of the important ethical questions that colleges need to consider before putting it to use.
Georgia State is now the only public university of its size that has closed the achievement gap—graduating our first-generation, Pell-eligible, black, and Latino students at rates at or above the rates for the student body overall.

EDUCATION POLICY4
THE EXTENT OF PREDICTIVE ANALYTICS USE IN
HIGHER EDUCATION
Predictive analytics in higher education is a hot-button topic among educators and administrators as institutions strive to better serve students by becoming more data-informed.26 But in two recent surveys that asked colleges how they use data in their decision making, less than half of responding schools said they were engaging in predictive analytics. A recent KPMG survey found that only 41 percent of colleges surveyed use data for this purpose.27
An Educause survey in 2015 found only 47 percent of respondents said institutional analytics was a major priority and only half as many described learning analytics as a priority.28,29,30 Respondents identified a host of challenges in implementing analytics that could account for it not being more widely used, including cost, inadequate data quality, institutional culture, and potential over-reliance on products offered by private companies.31
While adoption is not easy, some colleges are using predictive analytics for multiple purposes and for various phases of a student’s academic career. Georgia State, for example, describes its GPS system as being both an early-alert system and a major matcher, which informs students of their chances of succeeding in each major.32 The university is also using adaptive learning software in its hybrid introductory math courses.33 Adaptive learning courseware are digital tools that are responsive to students’ individual learning needs. Similarly, the historically black Delaware State University in Dover, Delaware uses predictive analytics to meet enrollment goals,34 identify struggling students, and streamline its advising practices.35

EDUCATION POLICY The Promise and Peril of Predictive Analytics in Higher Education: A Landscape Analysis 5
REASONS FOR USING PREDICTIVE ANALYTICS IN HIGHER EDUCATION
Higher education, like other social service sectors, uses predictive analytics to respond to many business and operational challenges. (See Appendix A for more information on how predictive analytics is being used in other social service sectors.) The three main reasons that colleges are employing this tool are:
• to identify students most in need of advising services;
• to develop adaptive learning courseware that personalizes learning; and
• to manage enrollment.
These tools are also being used in a myriad of other ways.36 For example, predictive analytics has helped colleges determine which alumni are likely to donate to the institution.37 And institutions have partnered with USA Funds, a non-profit that formerly insured federal student loans against default, to use predictive analytics to find student borrowers who are at risk of defaulting on their loans.38,39
Targeted Student Advising
Few colleges employ an adequate number of undergraduate advisers. A recent National Academic Advising Association (NACADA) survey found that the “median caseload of advisees per full-time professional academic advisor nationally was 296:1.”40 This figure jumps to 441:1 at community colleges.41 As a result, it is impossible for most colleges to give individual students the personalized attention they need and deserve. However, early-alert (helping identify students at risk of struggling academically) and program recommender (helping identify courses or programs for students) systems can help pinpoint students most in need of institutional support and allow staff and faculty to intervene to support student success.
Adaptive Learning
Colleges use predictive analytics to develop adaptive learning courseware, which modifies a student’s learning route based on the interactions of the student with the technology. These systems rely on student data to help mimic decisions an instructor would normally make to determine the type of content, assessment, and the sequence of content and assessments that will optimize learning.

EDUCATION POLICY6
Using predictive analytics in adaptive learning platforms can help instructors more precisely pinpoint students’ learning deficits and customize the academic experience so they are aligned with how they learn best. This tool can help students accelerate their learning by allowing them to move quickly through content they already know and provide them with additional support in areas they have not mastered.
Enrollment Management
Colleges do not only use predictive analytics to help students on their campuses succeed. For years, colleges have made predictive analytics a key element of their enrollment management plans.42 Schools use this information to help forecast the size of incoming and returning classes. They also use it to narrow their recruitment and marketing efforts to target those students most likely to apply, enroll, and succeed at the institution.43 Predictive analytics has also helped colleges anticipate the financial need of incoming and returning classes,44 and determine whether or not a student will accept the financial aid award offered.45
Recruitment can be costly. A 2013 survey conducted by enrollment management firm Noel Levitz found that four-year private colleges spent a median of $2,433 recruiting each new freshman they enrolled.46 Four-year public institutions spent $457 per new student and two-year public institutions spent $123 per new student.47 Because of the costs involved, institutions aim to be as strategic as possible with the limited resources they have. Using predictive analytics, college admissions teams are able to individually score, usually on a scale between 0–10, each prospective student’s likelihood of becoming an applicant, being admitted, and deciding to enroll.48 To come up with these scores, colleges typically take into consideration a prospective student’s race and ethnicity, zip code, high school, anticipated major, and level of interest, as shown through
either a campus tour or a request for promotional materials.49 With these scores, admissions teams can use their time and resources to aggressively recruit promising leads.50
Other Reasons for Using Predictive Analytics
Beyond reaching students in a more personalized way and making strategic use of limited financial resources, there are a host of other reasons why colleges make use of predictive analytics. These include:
• Performance-based funding, which has increased the pressure on colleges to ensure student success, as state aid is tied to the institution’s performance, rather than its enrollment data. According to the National Conference of State Legislatures, a non-profit organization that supports the efforts of state legislators, 32 states reward colleges with more money if they help more students complete courses and graduate on time, particularly if these students are minorities and/or come from low-income families.51 These rewards aim to persuade colleges to spend more money and energy on ensuring every student succeeds while enrolled.52
• Minimizing loss in revenue from tuition and fees by successfully retaining students.53 It costs less for a college to retain a student than to recruit a new one. Losing students means losing hundreds of thousands of dollars in tuition and fees.
• Shifting institutional culture. Colleges are now using data to analyze past events, as well as to support action in the present.54 Predictive analytics can play an important role in supporting a data-informed culture at an institution.

EDUCATION POLICY
Targeted Student Advising
Early-Alert Systems
Early-alert systems use predictive models that identify at-risk students. Predictive models can include factors like demographic data, standardized test scores, high school and college GPA, class attendance, student behavior (i.e., whether or not students take advantage of tutoring services), and course taking patterns in college and high school.
However, early-alert systems are not all the same. Not only can they use different types and combinations of student data, they are updated at different frequencies. Some are updated in real time, like Georgia State’s GPS system, which has identified over 800 kinds of alerts. Others may only identify at-risk students once per semester.55
Recommender Systems
Course and major recommender systems use predictive analytics to identify how students are likely to perform in courses and majors based on their previous academic performance. Like early-alert systems, no two course or major recommender systems are the same. However, recommender systems usually share common features. For example, most recommender systems use enrollment and demographic data, academic
performance data of current and past students, and learning analytics to develop predictive models.
Adaptive Learning
Adaptive technology, adaptive learning, or adaptive courseware uses technology to enhance and accelerate learning. Because adaptive learning systems are relatively new, there is no universal definition. However, some experts in this area have offered their own definitions. For example, Tyton Partners, a consulting firm, has defined adaptive learning as “solutions that take a sophisticated, data-driven, and in some cases, nonlinear approach to instruction and remediation, adjusting to each learner’s interactions and demonstrated performance level and subsequently anticipating what types of content and resources meet the learner’s needs at a specific point in time.”81
Pearson and EdSurge, two education technology companies, wrote that tools are not adaptive in nature if they:
• only check for the accuracy of an answer; • have only one learning sequence as the default;
or• do not collect real-time data or only collect data
on a student once.82
The Promise and Peril of Predictive Analytics in Higher Education: A Landscape Analysis 7
PREDICTIVE ANALYTIC TOOLS
EDUCATION POLICY8
Finding At-Risk Students at Temple University
Temple University, a public research university in Philadelphia, Pennsylvania, created its own early-alert system by using statistics to help predict which students are in danger of dropping out.57 Peter R. Jones, the university’s senior vice provost for undergraduate studies, helped build the system.58 This was not the first time Jones had used large amounts of data to create predictive models.59 In his former job as a criminologist, he used such models to determine which ex-offenders would be likely to reoffend.60 When the university’s early-alert system identifies at-risk students, Temple provides students with more support, or as Jones called it, “intrusive, or even aggressive, advising.”61
Temple’s use of predictive analytics looks a lot like Georgia State’s GPS system. Through predictive modeling, Temple officials learned things about their students they did not expect to find.62 For example, they found that students who receive the maximum Pell Grant—federal grants that go to low-income students—were less likely to drop out than those who received a smaller Pell award.63 Predictive analytics also helped Temple officials discover that the highest level of education a student’s mother received is far more
predictive of that individual’s chances of academic success than the level of education his or her father received.64 Additionally, they found that students who did not take four years of foreign language in high school were far more likely to drop out than students who did.65
Since the introduction of Temple’s early-alert system in 2008, retention and graduation rates at Temple have soared.66 Between 2001 and 2014:
• the share of students who returned for sophomore year increased by 12 percent;
• the university’s four-year graduation rate increased by 24 percent; and
• the institution’s six-year graduation rate increased by 11 percent.67
Although such systems are expensive, increased retention can generate new funds that cover the cost of implementing the early-alert system, as it did at Temple.68
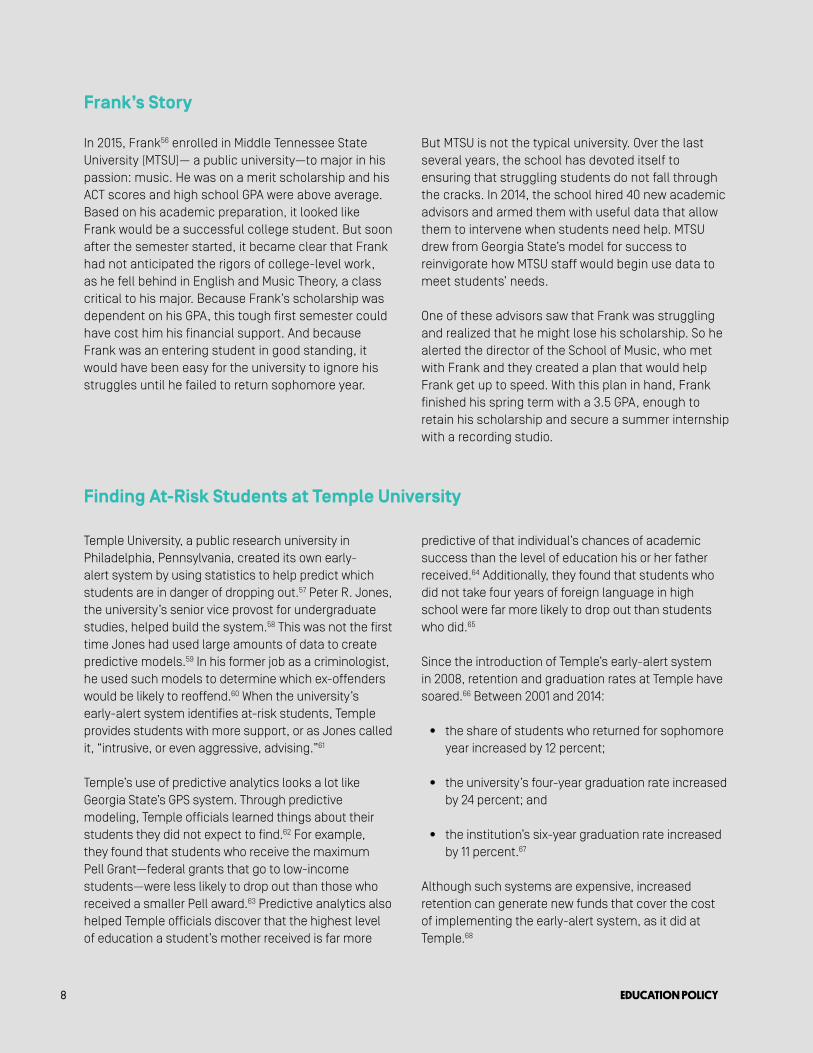
Frank’s Story
In 2015, Frank56 enrolled in Middle Tennessee State University (MTSU)— a public university—to major in his passion: music. He was on a merit scholarship and his ACT scores and high school GPA were above average. Based on his academic preparation, it looked like Frank would be a successful college student. But soon after the semester started, it became clear that Frank had not anticipated the rigors of college-level work, as he fell behind in English and Music Theory, a class critical to his major. Because Frank’s scholarship was dependent on his GPA, this tough first semester could have cost him his financial support. And because Frank was an entering student in good standing, it would have been easy for the university to ignore his struggles until he failed to return sophomore year.
But MTSU is not the typical university. Over the last several years, the school has devoted itself to ensuring that struggling students do not fall through the cracks. In 2014, the school hired 40 new academic advisors and armed them with useful data that allow them to intervene when students need help. MTSU drew from Georgia State’s model for success to reinvigorate how MTSU staff would begin use data to meet students’ needs.
One of these advisors saw that Frank was struggling and realized that he might lose his scholarship. So he alerted the director of the School of Music, who met with Frank and they created a plan that would help Frank get up to speed. With this plan in hand, Frank finished his spring term with a 3.5 GPA, enough to retain his scholarship and secure a summer internship with a recording studio.

Helping Students Select Courses at Austin Peay State University
Austin Peay State University (APSU), a four-year public university in Clarksville, Tennessee, uses a course recommendation system called Degree Compass. Modeled after Netflix, Amazon, and Pandora, Degree Compass matches current students with courses and majors that best fit their abilities.69 According to the university’s website, the model compares past students’ grades (over 100,000 of them) to current students’ transcripts to make customized recommendations.70
The system uses grade and enrollment data to rank how well each course will help a student progress through his or her program.71 The system selects courses that fit best with:
• the recommended sequence for each class in the degree pathway;
• their importance to the university curriculum as a whole, meaning the course could fulfill a requirement across many programs of study or majors, and not just a single major; and
• the likelihood the student will earn good grades.72
Degree Compass is able to predict a student’s probability of achieving a certain grade in a class, helping guide students to classes where they are most likely to succeed.73 APSU reports that the proportion of students passing their classes has increased by five deviations with Degree Compass.74 Pell Grant recipients have particularly benefitted, increasing their chances of earning a passing grade by four percent.75
In fall 2012, APSU introduced My Future, which further helps students choose a degree program.76 My Future mines student data to find courses that are central to success in each of Austin Peay’s majors and then uses Degree Compass’ predictive analytics to find the majors where students will be the most successful.77
For students who have already declared a major, My Future offers information about which areas to concentrate in and what their job prospects look like.78 For students who are undecided or undeclared, My Future gives them a list of majors in which they are most likely to succeed.79
Since debuting at Austin Peay in 2011, Degree Compass is now being used at three other universities in Tennessee, reaching more than 40,000 students.80
The Promise and Peril of Predictive Analytics in Higher Education: A Landscape Analysis 9

EDUCATION POLICY10
Adaptive Learning at Colorado Technical University
Colorado Technical University (CTU) is a for-profit university owned by the publicly-traded Career Education Corporation. It offers undergraduate, graduate, and doctoral degrees in business, nursing, and information technology, primarily online. CTU began piloting general education courses in science and math with adaptive learning in 2012.89,90 The university reports its adaptive learning technology, intellipath, assesses what students know, anticipates what they do not, and presents information that will help them meet course learning goals as quickly as they can.91
CTU partnered with Realizeit, an adaptive learning company, to develop intellipath.92 Intellipath uses custom content created by CTU faculty and Realizeit’s Adaptive Intelligence Engine that aims to adapt to the needs of each learner.93 Realizeit’s Adaptive Intelligence Engine, relies on machine learning to understand the unique abilities of students and how they process information based on how they use the tool.94
According to university officials, intellipath improved student grades, engagement, and retention.95 They say that after implementing intellipath, 81 percent of students passed Accounting I, a 27 percent increase;96 95 percent of students who signed up for the course completed it;97 and the average grade students received rose from 69 percent to 79 percent (a very high C).98 Accounting II and III also experienced higher pass and retention rates.99
In 2015, CTU had 63 courses and over 34,000 unique student users of intellipath. Through August of 2016, over 30,000 students used the technology, over 28,000 of whom were online students. 100This process did not happen overnight. It took about “four years to reach 15 percent of [its] total course offerings” according to Connie Johnson, chief academic officer and provost, at CTU. 101 CTU trained students, staff, and almost all faculty on intellipath.102
EDUCATION POLICY10

The Promise and Peril of Predictive Analytics in Higher Education: A Landscape Analysis 11
Pearson and EdSurge also state that there are three places in a product where adaptive learning can occur: in the content that is being taught, in the way students demonstrate what they have learned (assessments), and the point at which students are taught things or asked to demonstrate what they learned (sequence).83 A tool can have adaptive content, meaning the lessons presented to students can vary. A tool can have adaptive assessments, or different ways to measure what students have learned by allowing them to demonstrate what they know. Finally, a tool can have adaptive sequences, meaning the order in which lessons or assessments are given to students can vary. It is not unusual for tools to have adaptivity in more than one of these areas.84
Adaptive learning technologies make use of predictive analytics to help determine when the tool should adapt to meet the specific needs of a learner. Vendors and colleges develop adaptive courseware using a combination of historical student data, cognitive science, machine learning, education psychology, and human-computer interaction research to create models that determine how students best learn particular concepts.85 Machine learning is when algorithms learn from data and do not have to be programmed by a human.86 Algorithms, or the set of instructions fed to the tool, can then be created to steer the tool’s adaptation—either its content, assessment, or sequence—to personalize the learning experience.
Adaptive learning tools also provide information to instructors they may not have previously had. Instructor dashboards, for example, enable faculty to closely monitor whether students are progressing, and identify areas where they are struggling.87 Faculty can then use class time to address these areas for all students or for particular students based on their needs.88
The ability to customize the content and assessments can also vary. For example, either the institution or the vendor—like Pearson—can have a say over what lessons and tests or quiz questions are included. Additionally, adaptive tools can be used for the entire
course, or only as supplemental tools in a course. The degree to which the adaptive tools are customizable can also depend on how they are packaged: as an entire course or as supplemental tools. While they are typically used in online courses, adaptive learning technologies can be used in all modalities including online, blended, or face-to-face classes.
Enrollment Management
Increasing Enrollment Yield
Using characteristics of students who have enrolled in the past, predictive models can help institutions determine the chances that a student will enroll.103 An institution’s historical enrollment
Predicting Enrollment at Wichita State University
Wichita State University is a four-year public research university in Kansas. David Wright, the university’s chief data officer, is committed to increasing the number of admitted students who actually enroll with the fewest possible resources.107 He does this by assigning prospective students a probability score from 0–100 to predict whether they will enroll.108 The scores are based on factors such as gender, race, ethnicity, standardized test scores, grades from high school, and whether parents went to college.109 With this score assigned to each student, Wichita State then focuses its resources to recruit those most likely to attend.110 Colleges have long streamlined their recruitment efforts by purchasing student names and their scores for relatively little from third-party organizations.

EDUCATION POLICY12
data help admissions officers identify factors that impact enrollment and they are able to use this information to see how closely prospective students match the profile of previously enrolled students.104 They score students based on these profile matches; a high score is correlated to a close match and a low score is correlated to a less close match or a mismatch.105
Enrollment managers can then use these scores to increase the quantity and quality of their enrollment yield by targeting communications to ensure those with high scores receive the most outreach.106 However, like predictive models for early alerts, recommender systems, and adaptive technologies, no model for enrollment management is exactly the same.
How Names Are Scored
College Board, ACT (American College Test), and the National Research Center for College and University Admissions (NRCCUA) are a few of the major organizations that help colleges score potential applicants.111 NRCCUA conducts annual national
surveys to high school students about their attitudes and educational plans, and provides information to students about colleges and programs that match their interests.112 NRCCUA also helps institutions find students that may be a good fit based on this survey information.113
For less than 50 cents apiece, colleges can receive student names from these organizations that they will then prioritize in their enrollment outreach.114 Colleges can also purchase predictive models from College Board, ACT, and NRCCUA that are developed using the information each organization collects on students, like demographic data and how well students performed in high school.115 The surveys these groups conduct enable them to collect around 300 different data points on students.116
Consider NRCCUA’s SMART Approach tool. According to the organization’s website, this predictive tool allows colleges to score each student record based on their unique institutional
Predicting Future Enrollment at Howard Community College
Consulting firm ASR Analytics partnered with Howard Community College (HCC) in Columbia, Maryland with the goal of anticipating enrollment trends up to seven years in the future.120 ASR takes into consideration HCC’s past enrollment data, unemployment data from the Bureau of Labor Statistics (BLS), and the number of projected high school graduates in the state.121 HCC then uses this information to plan and budget better.122
Keeping Students Enrolled at Jacksonville State University
Jacksonville State University (JSU), a public university in Alabama, partnered with Civitas Learning, a data science company, to use predictive analytics in real time to make strategic decisions.125 Using Civitas Learning’s Illume platform, JSU discovered that many of the students that it accepted and gave scholarships to, based on the students’ standardized testing scores, were transferring to other schools before completing their programs.126 JSU decided to revise its admissions and financial aid policy to attract students more likely to remain at the institution to complete their studies.127

EDUCATION POLICY The Promise and Peril of Predictive Analytics in Higher Education: A Landscape Analysis 13
characteristics.117 Enrollment officers then can view the records of students with high chances of enrolling at their institution to ensure they are making wise purchases.118 This gives colleges a list of names of students to prioritize for outreach and marketing materials.119
Predictive analytics can also be used at a macro level, forecasting the size of an incoming class. Many community colleges, which are highly vulnerable to changes in the economy and the local college-going age population, build predictive models to determine how many students they can expect to enroll from year to year. These models can differ from other models that predict the likelihood
of individual students enrolling and persisting because they do not rely heavily on student characteristics such as demographic data and past academic performance.
Shaping and Anticipating Financial Aid
Predictive analytics can also be used to help colleges tailor financial aid packages that maximize the chances that students will enroll without allocating more than they need to.123 By analyzing the financial aid offers that similar students have accepted in the past, these predictive models can give colleges a better idea of how their financial aid packages should be structured.124
CHALLENGES OF USING PREDICTIVE ANALYTICS
With all of the promise of these predictive tools, dangers remain. The president of Mount Saint Mary’s was willing to use a survey to weed out students who could hurt the college’s retention rate in order to make the school look better. This was clearly unethical. But many of the dangers lurking in the use of data and algorithms may not be as clear cut. We live in a world of structural inequality. Low-income, first-generation, and students of color tend to graduate with college degrees at
much lower rates than affluent white students.128 When institutions use race, ethnicity, age, gender, or socioeconomic status to target students for enrollment or intervention, they can intentionally, or not, reinforce that inequality. For colleges that are just learning to use analytics to make decisions, guarding against these possibilities can be a struggle. But the stakes are too high to postpone asking these hard questions.

EDUCATION POLICY14
Discrimination, Labeling, and Stigma
Predictive models can discriminate against historically underserved groups because demographic data, such as age, race, gender, and socioeconomic status are often central to their analyses. Predictive tools can also produce discriminatory results because they include demographic data that can mirror past discrimination included in historical data. For example, it is possible that the algorithms used in enrollment management always favor recruiting wealthier students over their less affluent peers simply because those are the students the college has always enrolled?
Discrimination, labeling, and stigma can manifest in different ways depending on how colleges use these algorithms. For instance, colleges that use predictive analytics in the enrollment management process run a serious risk of disfavoring low-income and minority students, no matter how qualified these individuals are for enrollment. Predictive models that rely on demographic data like race, class, and gender or do not take into account disparate outcomes based on demographics may entrench disparities in college access among these groups.
Enrollment managers say they are constantly trying to balance competing priorities such as increasing the quality of each incoming class, enrolling students with an ability to pay, and increasing the diversity of the student body.129 Unfortunately, nearly all incentives in higher education push schools to focus on increasing tuition revenue and pursuing
greater prestige. The influential U.S. News & World Report college rankings, for instance, reward schools for being wealthy and exclusive. However, because of strong leadership at Georgia State, this university doesn’t pride itself on how many students it excludes, but how many it graduates.130
While colleges can be encouraged to focus on social mobility and helping to end institutional racism, until the types of incentives change, it will be hard to make these changes systemic.
In the meantime, enrollment managers could start to use predictive analytics to allocate their limited resources where they will do the most good. Currently, most managers use their algorithms to target resources towards students most likely to enroll. They could reverse that. If a predictive model showed a student had a 90 percent chance of enrolling, a school could take the resources it would normally spend on recruiting that student and focus instead on pursuing low-income and minority students who may not have considered the institution otherwise. Enrollment mangers would no longer see high-scoring or high-probability applicants as low-hanging fruit. Predictive analytics could be used to mitigate rather than reinforce inequity.
Predictive models that rely on demographic data or that do not take into account disparate outcomes based on demographics may also unintentionally entrench disparities in college achievement among groups. Early-alert and program recommender
When institutions use race, ethnicity, age, gender, or socioeconomic status to target students for enrollment or intervention, they can intentionally, or not, reinforce that inequality.
Enrollment managers could start to use predictive analytics to allocate their limited resources where they will do the most good. Currently, most managers use their algorithms to target resources towards students most likely to enroll. They could reverse that.

EDUCATION POLICY The Promise and Peril of Predictive Analytics in Higher Education: A Landscape Analysis 15
systems that disproportionally flag low-income or students of color for poor achievement or steer them away from more challenging and/or economically lucrative majors send the message that they do not have what it takes.
Without intending to, schools can use algorithms that in the end only pinpoint students who are traditionally “at-risk”: underserved populations. If the algorithm used to target at-risk student groups is a product of race or socioeconomic status, some students could be unfairly directed to certain types of majors, adding to the unequal opportunity in society. If poor students are told they cannot succeed in STEM majors, for instance, they will be deprived of pursuing some of the most lucrative careers. Moreover, if staff members know a student has been labeled as “more likely to fail,” their interactions might communicate to the student that they are expected to fail, which could demoralize that student and become a self-fulfilling prophecy. In other words, students who might have otherwise been successful may not be if administrators reinforce doubts they may have about their own abilities.
Colleges should train those with access to predictive results to understand that these data only illuminate probabilities and do not predict the future. When college officials understand this, they can then be trained to only intervene in ways that support student success rather than even unintentionally undermining it.
Choosing and deploying interventions with students who are identified as needing additional help may be one of the most delicate tasks for preventing discrimination and labeling. For example, if the
algorithm shows that a student should see an adviser because she is off track, the message to the student should be carefully crafted so that she is not discouraged or alarmed.
Transparency
Mount Saint Mary’s fell far short on transparency when it did not disclose to students that survey responses might be used to encourage them to leave. Transparency should be at the heart of using student and institutional data to make predictions that will help reach institutional goals. What is being done, why it is being done, and what data are being used to do it should be clear to everyone involved—students, advisors, administration, and faculty.
Transparency with stakeholders about a college’s use of data can help ensure high-quality analysis and minimize discrimination, allowing information to be scrutinized for accuracy and comprehensiveness. The goals of enrollment management processes, predictive tools for early-alerts, recommender systems, and adaptive technologies should be clear for everyone. Colleges should also be open and communicative about the quality of their data and models, and the potential for their models to be biased.
Enrollment managers should be transparent about principles that guide their practices. For example, they should be explicit on how they manage the delicate balance of institutional prestige, financial sustainability, and equity in access for underserved groups. Colleges should also share the types of
Institutions cannot be transparent about what may not even be transparent to them.

EDUCATION POLICY16
data and analysis used in algorithms for early-alert systems with key stakeholders such as students, advisors, and faculty. With adaptive learning tools, faculty need to know how the programs are making decisions about what skills students need to practice. Finally, when predictive results are visually represented, they should be accurate and easy to interpret.
Colleges should be open with stakeholders about their data collection processes and how their algorithms and predictive models are created and by whom. But the use of outside vendors can make this more difficult because oftentimes, their models and algorithms are proprietary. Vendors often will not tell colleges how their products work because they fear competitors will copy them. Institutions cannot be transparent about what may not even be transparent to them. Many of the college personnel we interviewed were using vended products and served only a minimal role in developing those predictive models. Depending on the vendor, institutions using these tools may or may not have control of the algorithms or even their own data.
When choosing vendors to work with, colleges should consider whether these companies will support their efforts to disclose how their models and algorithms work. Transparency works only if colleges are knowledgeable about how predictive models and algorithms are developed; can share this information with students, advisors, and faculty; and adequately train staff to make the best use of these tools.
Privacy and Security
Colleges also need to have strong policies in place to ensure the privacy and security of both institutional data and any resulting analysis. Well-articulated policies on privacy and security will also allow colleges to control the flow of these data in a way that can minimize the risk for discrimination and labeling.
The Family Educational Rights and Privacy Act (FERPA) is a federal law that protects students’ privacy, particularly their education records.131 It allows all students to review and correct their education records, and requires that they provide their consent before a school can disclose information in their records.132 Any school or college that receives support from the U.S. Department of Education must comply with this law.133
FERPA, which Congress created in 1974, has not been significantly updated since 2001,134 despite the fact that the technology and education fields have changed dramatically since then. Colleges today are collecting and using new kinds of student data, which may fall under a student’s educational record that is protected by FERPA. For example, many colleges consider advising records to be an educational record.135 Early-alert systems often rely on records from advisors that help determine the appropriate next steps for a student after each visit. Sharing these records without the student’s consent or with parties without a legitimate educational interest may be a violation of FERPA. 136
Likewise, the common red, yellow, and green labels in early-alert systems used by advisors denoting whether or not a student is at-risk may themselves be considered advising records and therefore protected by FERPA. Colleges should continue to ensure that students know they have the right to review and correct their records, as well get permission from the student before sharing these with parties without a legitimate educational interest. Colleges may also want to ensure that parties with a legitimate educational interest only use student and institutional data for educational purposes.
Beyond FERPA, colleges must deal with getting informed consent from students and, at times, faculty to collect and use their data for predictive modelling. For example, students going through the financial aid application process may not be aware that the information they agree to share with institutions is being used to prioritize how the college will target their recruitment and institutional aid.

EDUCATION POLICY The Promise and Peril of Predictive Analytics in Higher Education: A Landscape Analysis 17
Once in college, students may benefit from early-alert and recommender systems that rely on predictive modelling. However, students should at least be made aware that their data are being used for these purposes, if not required to give informed consent before such tools are used.
Oftentimes, data about students are shared within the institution and with outside vendors to create predictive models for early-alert and recommender systems. When this happens, students and faculty should remain anonymous, or at the very least be de-identified to the fullest extent possible. This may, however, be harder to do with the large data sets that predictive modelling often requires.137 As the amount of data in a single dataset that can be linked back together increases, the potential to re-identify student and faculty records increases.138
Information security is also a major concern for all kinds of institutions, including colleges.139 The use of big data only heightens these concerns because it has increased the amount, speed, and complexity of information that can be collected, stored, and shared within an institution and with vendors.140 Student and institutional data should be secured wherever it is located. Colleges must be certain that this information is properly secured, not only on campus but also when handed over to vendors.
Institutions are beginning to tackle evolving data privacy concerns. The University of California system has, for example, hired a chief privacy officer (CPO) at each of its campuses.141,142 But this position is still new and rare across higher education.143 The relatively new CPO at the University of California at Los Angeles has worked with the school’s Data Governance Task Force to produce a report on how data governance should be conducted at the university.144 The report outlines principles for how data about faculty, students, and staff should be used. The report also proposes a governance structure that facilitates the ethical and appropriate use of these data, and day-to-day practices that will support these goals.145
Data privacy and security need to be addressed across higher education. But the increasing use of big data in algorithms that guide more and more tools on campus makes this work even more urgent. Colleges need to put in place policies and procedures to address these concerns as they increase their use of student data. A failure to do so may not be as vivid as Newman’s remarks—which made national news and cost him his job—but such a failure could impact many more people.

EDUCATION POLICY18
Appendix A: Predictive Analytics in Other Social Services
Higher education is not alone in using predictive analytics to drive institutional or sector goals.146 In fact, it is a relatively late entrant.147 Other sectors, especially retail and business, have started earlier,148 using predictive analytics to improve sales and provide better customer satisfaction. Crime and public safety and child welfare are other social service sectors using predictive analytics in interesting ways. Their use of predictive analytics parallel its use in higher education, most notably in identifying individuals who may be in harm’s way and intervene before it is too late.
Crime and Safety: Predictive Policing
Police departments across the country have turned to predictive policing to target crime before it occurs. According to the National Institute of Justice (NIJ), the research wing of the U.S. Department of Justice, predictive policing tries to use information, GPS data, and effective strategies to reduce crime and maximize public safety.149
One example is the St. Louis County Police Department’s use of HunchLab, a tool that crunches data to predict where a crime will occur so that the area can be patrolled.150 HunchLab, created by Philadelphia-based startup Azavea, and implemented by the department in December 2015, is fueled mostly by past crime data.151 However, the software also uses “population density; census data; the locations of bars, churches, schools, and transportation hubs; schedules for home games—even moon phases” according to The Marshall Project, a nonprofit media outlet reporting about criminal justice.152
While research on the impact of predictive policing programs is limited, one study found that sending officers to several areas of Los Angeles identified by an algorithm reduced crime in those areas more effectively than if the department relied solely on human judgment.153 The study estimated that this program’s success in preventing crimes from occurring could save Los Angeles $9 million a year.154
Predictive policing techniques can predict who might be perpetrators of crimes as well as where crime might occur. For example, in 2009, the Chicago Police Department (CPD) received a $2 million grant from the NIJ to test its experimental predictive analytic program, later named the Strategic Subject List.155,156 CPD’s algorithm, developed in partnership with the Illinois Institute of Technology, relies on data from the city’s crime database, which keeps track of anyone in Chicago who has ever been arrested for or convicted of a crime.157 The algorithm is quickly able to identify people who are likely to be violent.158 The algorithm can even identify those who are likely to be involved in a shooting or homicide.159 However, many question whether these systems predict crime accurately and have found that they disproportionately target racial and ethnic minorities.160
For example, if a city’s crime data reflect the historical policing and surveillance in minority and low-income communities, as opposed to other communities, predictive models that identify residents who have interacted with the justice system may overwhelmingly identify minorities. A recent evaluation of CPD’s use of the algorithm by the RAND Corporation appears to back up these concerns. CPD said it was using predictive analytics to achieve two goals: prevent violent crime from occurring and administer social services to people in danger of being involved in a violent crime.161 The RAND Corporation found that CPD did not use the algorithm to administer social services so much as to create a short list of people it would target to arrest next.162
Many question whether these systems predict crime accurately and have found that they disproportionately target racial and ethnic minorities.

EDUCATION POLICY The Promise and Peril of Predictive Analytics in Higher Education: A Landscape Analysis 19
Predictive analytics can also be used to help predict when police will behave unprofessionally. To set this up, in 2015, in response to the outcry over multiple incidents of police officers killing unarmed black men, the Obama Administration moved to strengthen the relationships between local police and the communities they serve.163 As a part of this effort, President Obama launched the White House Police Data Initiative comprised of 21 communities across the country.164 The police department in Charlotte-Mecklenburg, one of the 21 participating communities, agreed to work with University of Chicago researchers to develop a system for predicting when officers may have inappropriate interactions with citizens, from hostile traffic stops to fatal shootings.165 Researchers looked at over 10 years of Charlotte’s data to find patterns of abuses.166 They found that the most significant predictor of inappropriate interactions were the officers themselves.167 Those who had several troubling incidents in one year were the most likely to have them in the following year.168 By using this and other indicators, the researchers’ algorithm was better able to predict problems than Charlotte’s existing early warning system.169
Child Welfare: Predicting Abuse and Abusers
Just as police departments across the country are starting to use predictive analytics to try to prevent crimes before they occur, child welfare agencies employ it as a tool to prevent child abuse.
In 2012, after nine children died in Florida’s Hillsborough County in the span of four years, the county introduced predictive analytics to prioritize cases where child abuse might be imminent.170
The way the tool, called Rapid Safety Feedback, worked was each suspected child abuse case was given a risk level based on information closely related with a child being abused.171 The risk level can change in real time as data in the system are updated.172 Data could include things like reports from a child’s school or state data (i.e., is the parent
receiving public benefits, has s/he committed a crime, has s/he been recently married or divorced).173
Predictive analytics, along with more investigators and social workers, produced positive results in Hillsborough County.174 For example, caseworkers did a more thorough job of reviewing cases and, most important, there have been no more child homicides in the county since implementing predictive analytics.175 However, it is unclear if this is a result of solely using predictive analytics.
Because of the success in Hillsborough County, Eckerd Kids, a private youth services organization which owns the predictive Rapid Safety Feedback system, donated it to Connecticut’s Department of Children and Families.176 In addition, other states such as Alaska, Oklahoma, Illinois, and Maine sought out Eckerd to help them improve how they helped prevent abuse for children in situations under investigation.177
Despite the potential promise of using predictive analytics to prevent child abuse, those working with these systems acknowledge a number of challenges with using modelling to determine which children will be maltreated in the near or long term. 178 These concerns include issues related to the accuracy of the predictive models, privacy, confirmation bias, and the place for human judgment.179
For example, there is concern that predictive models can result in high percentages of false positives and false negatives, leading to over-identifying abuse and maltreatment or under-identifying children likely to experience maltreatment.180 State privacy guidelines make getting access to state agencies’ historical data about children in the system much easier than getting a daily, updated feed about current children in the system.181 These limits affect the quality of the predictive model. In terms of concerns about confirmation bias, experts note that if a caseworker already believes a family will maltreat children, predictive data may only serve to “prove” this as a certainty rather than a possibility.182 Finally, how to ensure caseworkers

EDUCATION POLICY20
do not use predictive data as a be-all and end-all are echoed by many as the essential threat posed if we replaced, rather than supplemented human judgment with predictive analytics.183
Rapid Safety Feedback is not the only system trying to predict which children are most at risk of abuse. In 2013, Congress created the Commission to Eliminate Child Abuse and Neglect Fatalities (CECANF), and selected 12 commissioners to come up with a “national strategy to end child maltreatment fatalities” in the country.184 CECANF’s final report, this year, outlined a proactive approach to creating a child welfare system for the 21st century. One of three components in this new system is a call for “decisions that are grounded in better data and research.”185 To do this, the Commission recommended finding ways to
• count the number of fatalities due to maltreatment;
• share real-time data with all appropriate parties; and
• use predictive analytics to spot children most at-risk of fatalities and factors contributing to their risk.186
Congress made a clear call to end child maltreatment fatalities, but some child welfare agencies may be the real pioneers. These organizations not only predict which children will be victims of crime, but which will actually commit crimes. Consider, for instance, the Los Angeles County Delinquency Prevention Pilot (DPP), a Department of Children and Family Services (DCFS) experiment that ran from 2012–2014. The pilot studied children in the child welfare system, looking at data about their family life (i.e., were any children ever arrested, had they used drugs, did they succeed in school, had they been abused).187 These data were used to determine which children might end up in jail.188 DCFS then used a service called SafeMeasures, a tool that sent out alerts to caseworkers, whenever it appeared a child (ages 10–17) might be at risk of committing a juvenile crime.189 Caseworkers would then step in to reduce the child’s risk either by taking him to after-school activities, or figuring out if he was having a particularly difficult time.190 The idea was that if children were engaged in constructive extracurricular activities or had a caring adult who could discourage them from doing harm to themselves or to others, their odds of entering into the juvenile justice system would be reduced.
Children in the experimental group received services special to the pilot in addition to their regular DCFS services, and had their data tracked to flag when they might be at risk of committing a crime.191 Results showed that the members of the experimental group were arrested less than children in the other groups192 who received DCFS services and possibly additional services but did not have their data tracked.193 However, the study was inconclusive about whether the pilot program was responsible for the outcome or if other factors played a significant role.194
Despite the potential promise of using predictive analytics to prevent child abuse, those working with these systems acknowledge a number of challenges with using modelling to determine which children will be maltreated in the near or long term.

EDUCATION POLICY The Promise and Peril of Predictive Analytics in Higher Education: A Landscape Analysis 21
Appendix B: Interview List
Institutions
Michael Beck, Dean of Student Learning, Central Carolina Community College, Carolina Works (First in the World grantee) April 14, 2016
Jay Goff, Vice President of Enrollment Management, Saint Louis University June 23, 2016
Sarah A. Hoffarth, Project Activity Director, Carolina Works (First in the World grantee) April 14, 2016
Donald Hossler, Emeritus Professor of Educational Leadership and Policy Studies, Indiana University, Senior Scholar, Center for Enrollment Research, Policy, and Practice, University of Southern California June 1, 2016
Connie Johnson, Chief Academic Officer/ Provost, Colorado Technical University April 29, 2016
Jerry Lucido, Professor of Research and Associate Dean of Strategic Enrollment Services, USC Rossier School of Education, Executive Director of the USC Center for Enrollment Research, Policy, and Practic June 1, 2016
Tiffany Mfume, Director of Student Success and Retention, Morgan State University May 13, 2016
Denise Nadasen, Associate Vice Provost for Institutional Research, Univeristy of Maryland University College April 20, 2016
Rick Sluder, Vice Provost for Student Success, Middle Tennessee State University May 3, 2016
Mitchell Stevens, Associate Professor and Director, Center for Advanced Research Through Online Learning, Stanford University July 14, 2016
Candace Thille, Assistant Professor of Education, Stanford University’s Graduate School of Education, founding director of the Open Learning Initiative at Carnegie Mellon University March 14, 2016
National organizations
Ana Borray, Director of iPASS Implementation Services and Support, Educause April 20, 2016
Gates Bryant, Partner, Tyton Partners July 27, 2016
Bridget Burns, Executive Director, University Innovation Alliance (UIA) June 2, 2016
Melanie Gottlieb, Deputy Director, American Association of Collegiate Registrars and Admissions Officers (AACRAO) April 1, 2016
Tom Green, Associate Executive Director, American Association of Collegiate Registrars and Admissions Officers (AACRAO) May 10, 2016
Martin Kurzweli, Director, Educational Transformation Program, Ithaka S+R July 14, 2016
Adam Newman, Founder and Managing Partner, Tyton Partners July 27, 2016
Rahim Rajan, Senior Program Officer, Bill & Melinda Gates Foundation May 25, 2016

EDUCATION POLICY22
Greg Ratlif, Senior Program Officer, Bill & Melinda Gates Foundation July 5, 2016
Vendors
Dror Ben-Namin, Founder and CEO, Smart Sparrow June 10, 2016
Brian Co, Vice President, Product and Platform Development, InsideTrack May 12, 2016
Dave Jarrat, Vice President, Marketing, InsideTrack May 12, 2016
Sherly Kovalik, Director of Client Services, Rapid Insight March 22, 2016
Jon MacMillan, Senior Analyst, Rapid Insight March 22, 2016
Laura Malcolm, Vice President of Product, Civitas Learning April 12, 2016
Mark Milliron, Co-Founder and Chief Learning Officer, Civitas Learning April 8, 2016
John Plunkett, Vice President, Policy & Advocacy, Hobsons March 18, 2016
Ellen Wagner, Co-Founder Predictive Analytics Reporting (PAR) Framework, Vice President Research, Hobsons March 18, 2016
Rob Weaver, Regional Vice President, Strategic Partnerships, Civitas Learning March 23, 2016
Charles Thornburgh, Founder and CEO, Civitas Learning August 2, 2016
Ed Venit, Senior Director, Strategic Research, EAB April 12, 2016

EDUCATION POLICY The Promise and Peril of Predictive Analytics in Higher Education: A Landscape Analysis 23
Notes
1 Susan Svrluga, “University president allegedly says struggling freshmen are bunnies that should be drowned,” Washington Post, January 19, 2016, https://www.washingtonpost.com/news/grade-point/wp/2016/01/19/university-president-allegedly-says-struggling-freshmen-are-bunnies-that-should-be-drowned-that-a-glock-should-be-put-to-their-heads/.
2 Ibid.
3 Ibid. President Newman presumably believed that first year students were seen as “cuddle bunnies” by faculty. President Newman resigned shortly after his insensitive comments were made public.
4 Ibid.
5 The U.S. Department of Education defines retention as percentage of a school’s first-time, first-year undergraduate students who continue at that school the next year. See https://fafsa.ed.gov/help/fotw91n.htm.
6 Svrluga, “University president says struggling freshmen are bunnies.”
7 Scott Jaschik, “The Questions Developed to Cull Students,” Inside Higher Ed, February 12, 2016, https://www.insidehighered.com/news/2016/02/12/questions-raised-about-survey-mount-st-marys-gave-freshmen-identify-possible-risk.
8 Simon Newman, “Mount St. Mary’s University president defends his efforts to retain students,” Washington Post, January 20, 2016, https://www.washingtonpost.com/news/grade-point/wp/2016/01/20/mount-st-marys-university-president-defends-his-efforts-to-retain-students/.
9 Ibid.
10 David L. Kirp, “What Can Stop Kids From
Dropping Out,” New York Times, April 30, 2016, http://www.nytimes.com/2016/05/01/opinion/sunday/what-can-stop-kids-from-dropping-out.html?_r=0.
11 “GPS Advising at Georgia State University,” http://oie.gsu.edu/files/2014/04/Advisement-GPS.pdf, 1.
12 Ibid., 1.
13 Information presented at site visit to Georgia State University on February 22, 2016.
14 Ibid.
15 Ibid.
16 “Predictive Analytics in Higher Education: Data-Driven Decision-Making for the Student Life Cycle,” (Boston, MA: Eduventures, January 2013), http://www.eduventures.com/wp-content/uploads/2013/02/Eduventures_Predictive_Analytics_White_Paper1.pdf, 3.
17 “GPS Advising at Georgia State University,” http://oie.gsu.edu/files/2014/04/Advisement-GPS.pdf, 1.
18 Ibid., 1.
19 Ibid., 3.
20 Ibid., 3.
21 Ibid., 3.
22 Ibid., 1.
23 Timothy Renick, “Data Fueling Scale and Change in Higher Education,” Impatient Optimists, January 27, 2016, http://www.impatientoptimists.org/Home/Posts/2016/01/Data-Fueling-Scale-and-Change-in-Higher-Education#.V2_ZApMrKu7.
24 Ibid.

EDUCATION POLICY24
25 See U.S. Department of Education’s College Scorecard data: https://collegescorecard.ed.gov/school/?139940-Georgia-State-University.
26 Manuela Ekowo, “The Gift that Keeps on Giving: Why Predictive Analytics are Probably on Colleges’ Wish Lists this Year,” EdCentral, December 14, 2015, https://www.newamerica.org/education-policy/edcentral/gift-keeps-giving-predictive-analytics-probably-colleges-wish-lists-year/.
27 Amy Burroughs, “Survey: Data and Analytics in Higher Ed Can Be a One-Two Punch,” Ed Tech Magazine, April 8, 2016, http://www.edtechmagazine.com/higher/article/2016/04/survey-data-and-analytics-higher-ed-can-be-one-two-punch.
28 Ronald Yanosky with Pam Arroway, The Analytics Landscape in Higher Education, 2015 (Louisville, CO: ECAR, October 2015), https://library.educause.edu/~/media/files/library/2015/5/ers1504cl.pdf, 7.
29 Educause defines analytics as “the use of data, statistical analysis, and explanatory and predictive models to gain insight and act on complex issues.” Educause defines institutional analytics as analytics “intended to improve services and business practices across the institutions” and learning analytics as analytics as those “intended to enhance or improve student success.” Ibid., 6.
30 A more widely adopted definition of learning analytics was developed at the 1st International Conference on Learning Analytics and Knowledge in 2011. This group defined learning analytics as the “measurement, collection, analysis and reporting of data about learners and their contexts, for purposes of understanding and optimising learning and the environments in which it occurs.” (1st International Conference on Learning Analytics and Knowledge, Banff, Alberta, February 27 – March 1, 2011), https://tekri.athabascau.ca/analytics/.
31 Yanosky, with Arroway. The Analytics Landscape, 23-24.
32 “GPS Advising at Georgia State University,” http://oie.gsu.edu/files/2014/04/Advisement-GPS.pdf, 3.
33 Tanya Roscorla, “Using Predictive Analytics, Adaptive Learning to Transform Higher Education,” Government Technology, July 29, 2015, http://www.govtech.com/education/Using-Predictive-Analytics-Adaptive-Learning-to-Transform-Higher-Education.html.
34 Delaware State University case study prepared by Ruffalo Noel-Levitz: https://www.ruffalonl.com/case-studies/delaware-state-university.
35 Teresa Hardee, “Better by the Numbers,” Impatient Optimists, February 4, 2016, http://www.impatientoptimists.org/home/posts/2016/01/better-by-the-numbers#/h.
36 Yanosky, with Arroway. The Analytics Landscape, 17
37 IBM, “7 Ways Smart Universities Use Data and Analytics: Higher education institutions should school themselves on the best ways to use their data,” Center for Digital Education, January 12, 2016, http://www.centerdigitaled.com/7-Ways-Smart-Universities-Use-Data-and-Analytics.html.
38 Putting ‘Big Data’ to Work to Prevent Student Loan Default, https://defaultpreventionforum.org/2015/11/11/putting-big-data-to-work-to-prevent-student-loan-default/.
39 For a list of guarantee agencies, see: http://www.finaid.org/loans/guaranteeagencies.phtml.
40 Rich Robbins, “Advisor Load” on National Academic Advising Association Resources page: http://www.nacada.ksu.edu/Resources/Clearinghouse/View-Articles/Advisor-Load.aspx.
41 Ibid.
42 Tom Green (Associate Executive Director, Consulting and SEM, American Association of Collegiate Registrars and Admissions Officers),
EDUCATION POLICY The Promise and Peril of Predictive Analytics in Higher Education: A Landscape Analysis 25
interview with New America, May 10, 2016.
43 IBM, “7 Ways Smart Universities Use Data and Analytics.”
44 Sandra Beckwith, “Data analytics rising in higher education: A look at four campus ‘data czars’ and how they’re promoting predictive analytics,” University Business, June 2016, http://www.universitybusiness.com/article/data-analytics-rising-higher-education.
45 “Predictive Models Give Recruiting Edge: Colleges seek to optimize marketing,” Worcester Business Journal Online, April 25, 2011, http://www.wbjournal.com/article/20110425/PRINTEDITION/304259966/predictive-models-give-recruiting-edge—colleges-seek-to-optimize-marketing.
46 “2013 Cost of Recruiting an Undergraduate Student Report,” Ruffalo Noel-Levitz, https://www.ruffalonl.com/papers-research-higher-education-fundraising/2013/2013-cost-of-recruiting-an-undergraduate-student-report.
47 Ibid.
48 “Predictive Analytics in Higher Education: Data-Driven Decision-Making for the Student Life Cycle,” (Boston, MA: Eduventures, January 2013), http://www.eduventures.com/wp-content/uploads/2013/02/Eduventures_Predictive_Analytics_White_Paper1.pdf, 8
49 Ibid., 8.
50 Ibid., 8.
51 “Performance-based Funding for Higher Education,” National Conference of State Legisltures, July 31, 2015, http://www.ncsl.org/research/education/performance-funding.aspx.
52 Ibid.
53 “Predictive Analytics in Higher Education:
Data-Driven Decision-Making for the Student Life Cycle,” (Boston, MA: Eduventures, January 2013), http://www.eduventures.com/wp-content/uploads/2013/02/Eduventures_Predictive_Analytics_White_Paper1.pdf, 9.
54 Katherine Mangan, “Mark Milliron Arms Students With Data,” Chronicle of Higher Education, April 10, 2016, http://chronicle.com/article/Mark-Milliron-Arms-Students/236006.
55 Rob Weaver (Regional Vice President, Strategic Partnerships, Civitas Learning), interview with New America, March 23, 2016.
56 Student’s real name has been changed.
57 Emmanuel Felton, “Temple University is spending millions to get more students through college, but is there a cheaper way?” Hechinger Report, May 18, 2016, http://hechingerreport.org/temple-university-spending-millions-get-students-college-cheaper-way/.
58 Ibid.
59 Ibid.
60 Ibid.
61 Ibid.
62 Ibid.
63 Ibid.
64 Ibid.
65 Ibid.
66 Ibid.
67 Ibid.
68 Ibid.
69 “Degree Compass and My Future” Austin Peay

EDUCATION POLICY26
State University, Office of Academic Affairs, http://www.apsu.edu/academic-affairs/degree-compass-and-my-future.
70 Ibid.
71 Ibid.
72 Ibid.
73 Ibid.
74 Ibid.
75 Ibid.
76 Ibid.
77 Ibid.
78 Ibid.
79 Ibid.
80 Video: “Improving College Completion with Degree Compass,” Austin Peay State University, https://dl.dropbox.com/u/32572581/Degree-Compass-APSU.mov, at 4:30 mark.
81 Gates Bryant, “Learning to Adapt 2.0: The Evolution of Adaptive Learning in Higher Education,” April 18, 2016, http://tytonpartners.com/library/learning-to-adapt-2-0-the-evolution-of-adaptive-learning-in-higher-education/, 3.
82 EdSurge, Decoding Adaptive (London: Pearson, 2016), http://d3e7x39d4i7wbe.cloudfront.net/static_assets/PearsonDecodingAdaptiveWeb.pdf, 16
83 Ibid., 21.
84 Ibid., 21.
85 Jessie Brown, Personalizing Post-Secondary Education: An Overview of Adaptive Learning Solutions for Higher Education (New York, NY:
Ithaka S+R, March 18, 2015), http://www.sr.ithaka.org/publications/personalizing-post-secondary-education/, 2
86 SAS defines machine learning as “a method of data analysis that automates analytical model building. Using algorithms that iteratively learn from data, machine learning allows computers to find hidden insights without being explicitly programmed where to look.” See SAS, “Machine Learning: What it is and why it matters,” http://www.sas.com/en_us/insights/analytics/machine-learning.html.
87 Brown, Personalizing Post-Secondary Education, 2.
88 Ibid., 2.
89 Adaptive Learning Platforms: Creating a Path for Success, Connie Johnson, Educause Review, 2016, http://er.educause.edu/articles/2016/3/adaptive-learning-platforms-creating-a-path-for-success.
90 Connie Johnson, “Adaptive Learning Platforms: Creating a Path for Success,” Educause Review, March 7, 2016, http://er.educause.edu/articles/2016/3/adaptive-learning-platforms-creating-a-path-for-success; Career Education Corporation schools have come under scrutiny by the U.S. Department of Education because of concerns about their financial health or adherence to federal requirements. Michael Stratford, “Cash Monitoring List Unveiled,” Inside Higher Ed, March 31, 2015, https://www.insidehighered.com/news/2015/03/31/education-department-names-most-colleges-facing-heightened-scrutiny-federal
91 CTU Learning Approach, from: http://www.coloradotech.edu/online-degree-programs/intellipath?dheader=new.
92 Connie Johnson (Chief Academic Officer/ Provost, Colorado Technical University), interview with New America, April 29, 2016.
93 Ibid.

EDUCATION POLICY The Promise and Peril of Predictive Analytics in Higher Education: A Landscape Analysis 27
94 Colm P. Howlin, “The Realize It System,” RealizeIt Learning, 2015, http://realizeitlearning.com/papers/The%20RealizeIt%20System.pdf, 7.
95 Johnson, “Adaptive Learning Platforms.”
96 Ibid.
97 Ibid.
98 Ibid.
99 Ibid.
100 Connie Johnson (Chief Academic Officer/ Provost, Colorado Technical University), email correspondence with New America, September 12, 2016.
101 Johnson, “Adaptive Learning Platforms.”
102 Johnson, “Adaptive Learning Platforms.”
103 Charles Ramos, with Brian Jansen, “How predictive modeling benefits enrollment managers,” Ruffalo Noel-Levitz, April 9, 2013, http://blogem.ruffalonl.com/2013/04/09/predictive-modeling-benefits-enrollment-managers/.
104 Ibid.
105 Ibid.
106 Ibid.
107 Emmanuel Felton, “Colleges shift to using ‘big data’ — including from social media — in admissions decisions,” Hechinger Report, August 21, 2015, http://hechingerreport.org/colleges-shift-to-using-big-data-including-from-social-media-in-admissions-decisions/?utm_source=Sailthru&utm_medium=email&utm_campaign=Issue:%202016-03-02%20Higher%20Ed%20Education%20Dive%20Newsletter%20%5Bissue:5106%5D&utm_term=Education%20Dive:%20Higher%20Ed.
108 Ibid.
109 Ibid.
110 Ibid.
111 Ry Rivard, “Predicting Where Students Go: Colleges use data to predict who they should target as they hunt for students,” Inside Higher Ed, September 19, 2014, https://www.insidehighered.com/news/2014/09/19/colleges-now-often-rely-data-rather-gut-hunt-students.
112 “About NRCCUA” https://www.nrccua.org/cms/About-Us/About-Us.aspx.
113 Ibid.
114 Rivard, “Predicting Where Students Go.”
115 Ibid.
116 Ibid.
117 “SMART Approach® with Talent Identification Program®,” National Research Center for College & University Admissions, https://www.nrccua.org/cms/college-professionals/constituents/4-year-schools/lists/smart-approach.
118 Ibid.
119 Ibid.
120 “ASR Demonstrates Student Enrollment Forecasting with Howard Community College,” ASR Analytics, 2014, http://www.asranalytics.com/news/asr-demonstrates-student-enrollment-forecasting-howard-commu.
121 Ibid.
122 Ibid.
123 “How Predictive Modeling can Benefit Student Recruitment Efforts,” Rapid Insight, http://www.rapidinsightinc.com/predictive-modeling-can-

EDUCATION POLICY28
benefit-student-recruitment-efforts/.
124 Ibid.
125 Jennifer Rees, “Jacksonville State University Dives Deep into Data for Change Management,” Civitas Learning Space, December 15, 2015, https://www.civitaslearningspace.com/jacksonville-state-university-dives-deep-into-data-for-change-management/.
126 Ibid.
127 Ibid.
128 “Educational Attainment of Young Adults,” National Center for Education Statistics, May 2016, http://nces.ed.gov/programs/coe/indicator_caa.asp; Mikhail Zinshteyn, “The Growing College-Degree Wealth Gap: A new report demonstrates a stubborn chasm between rich and poor students earning bachelor’s degrees,” The Atlantic, April 25, 2016, http://www.theatlantic.com/education/archive/2016/04/the-growing-wealth-gap-in-who-earns-college-degrees/479688/.
129 Donald Hossler (Senior Scholar, USC Center for Enrollment Research Policy, and Practice) and Jerry Luicdo (Executive Director, Center for Enrollment Research, Policy, and Practice), interview with New America, June 1, 2016.
130 Information presented at site visit to Georgia State University on February 22, 2016.
131 “Family Educational Rights and Privacy Act (FERPA),” U.S. Department of Education, http://www2.ed.gov/policy/gen/guid/fpco/ferpa/index.html.
132 Ibid.
133 Ibid.
134 “Legislative History of Major FERPA Provisions,” U.S. Department of Education, February 11, 2004, http://www2.ed.gov/policy/gen/guid/fpco/ferpa/
leg-history.html.
135 “What is an educational record?” Bates College Registrar and Academic Systems, http://www.bates.edu/registrar/ferpa/what-is-an-educational-record/.
136 While vendors under contract with a university are typically defined as parties with legitimate educational interests, it’s important to remember than FERPA permits but doesn’t require that institutions disclosure students’ educational records to these parties. (See FERPA General Guidance for Students, http://www2.ed.gov/policy/gen/guid/fpco/ferpa/students.html.). Additionally, as higher education increasingly relies on third-parties to administer or facilitate the teaching and learning aspects of the college experience, there is concern over whether all vendors have legitimate educational interests all the time (See Andrew Ujifusa, “House Hearing Weighs Student-Data Privacy Concerns,” Education Week, March 29, 2016, http://www.edweek.org/ew/articles/2016/03/30/house-hearing-weighs-student-data-privacy-concerns.html.). Could a third-party vendor under contract with an institution later use student and institutional data for non-educational purposes or to serve their own interests (“K-12 School Service Provider Pledge to Safeguard Student Privacy,” Future of Privacy Forum and The Software & Information Industry Association, https://studentprivacypledge.org/privacy-pledge/)? What safeguards can an institution enforce to ensure this doesn’t happen?
137 Niall Sclater, Code of practice for learning analytics: A literature review of the ethical and legal issues (Bristol: Jisc, November 2014), http://repository.jisc.ac.uk/5661/1/Learning_Analytics_A-_Literature_Review.pdf, 43.
138 Ibid., 43.
139 Manuela Ekowo, “The Big Three for IT: College IT Leaders Name their Top Priorities for 2016,” EdCentral, January 14, 2016, https://www.newamerica.org/education-policy/edcentral/big-

EDUCATION POLICY The Promise and Peril of Predictive Analytics in Higher Education: A Landscape Analysis 29
three-college-leaders-name-top-priorities-2016/.
140 SAS, a statistical analysis software and company, defines big data as “a large volume of data – both structured and unstructured – that inundates a business on a day-to-day basis”(see SAS, “What is Big Data,” http://www.sas.com/en_us/insights/big-data/what-is-big-data.html). Doug Laney, a top official at IT research and advisory firm Gartner (http://www.gartner.com/technology/about.jsp), defined datasets in terms of three V’s. “The first V, volume, describes the size of the dataset. This is the characteristic that frequently comes to mind when discussing big data because of how much data is involved. The second V, variety, describes the complexity of the data.” Variety refers to the “different types of structured and unstructured data that can be collected, such as transaction data, video, and audio, or text and log files. Big data can contain all these types.” (See University Alliance, “What is big data?” http://www.villanovau.com/resources/bi/what-is-big-data/#.V2_hA5MrKu5). The final V, velocity, describes the “rate at which the data is changing.” “Streaming, or real-time processing, is a large amount of data that arrives continuously over time.” Big data is the result of large amounts of data processed or streamed at a fast speed. See Jeff Heaton, “What Big Data is, and How to Deal with It,” Forecasting and Futurism 11 (July 2015), https://www.soa.org/library/newsletters/forecasting-futurism/2015/july/ffn-2015-iss10-heaton.aspx.
141 Valerie M. Vogel, “The Chief Privacy Officer in Higher Education,” Educause Review, May 11, 2015, http://er.educause.edu/articles/2015/5/the-chief-privacy-officer-in-higher-education.
142 “Office of the UCLA Chief Privacy Officer,” University of California, Los Angeles, https://privacy.ucla.edu/office-of-the-ucla-chief-privacy-officer/.
143 Information presented by UCLA Chief Privacy Officer Kent Wada at Future of Privacy Forum working group call, April 22, 2016.
144 “Final Report and Recommendations,” UCLA Data Governance Task Force, May 2016, http://evc.ucla.edu/reports/DGTF-report.pdf, 1 (letter).
145 Ibid., 1 (letter) and 18 (report), Recommendation 5.
146 SAS, “Predictive Analytics: What it is and why it matters,” http://www.sas.com/en_us/insights/analytics/predictive-analytics.html.
147 “Predictive Analytics in Higher Education: Data-Driven Decision-Making for the Student Life Cycle,” (Boston, MA: Eduventures, January 2013), http://www.eduventures.com/wp-content/uploads/2013/02/Eduventures_Predictive_Analytics_White_Paper1.pdf, 3.
148 SAS, “Predictive Analytics.”
149 National Institute of Justice, “Predictive Policing,” June 9, 2014, http://www.nij.gov/topics/law-enforcement/strategies/predictive-policing/Pages/welcome.aspx.
150 Maurice Chammah, with Mark Hansen, “Policing the Future: In the aftermath of Michael Brown’s death, St. Louis cops embrace crime-predicting software,” The Marshall Project, February 3, 2016, https://www.themarshallproject.org/2016/02/03/policing-the-future#/h.
151 Ibid.
152 Ibid.
153 Ibid.
154 Ibid.
155 Matt Stroud, “The minority report: Chicago’s new police computer predicts crimes, but is it racist?” The Verge, February 19, 2014, http://www.theverge.com/2014/2/19/5419854/the-minority-report-this-computer-predicts-crime-but-is-it-racist.
156 Matt Stroud, “Chicago’s predictive policing

EDUCATION POLICY30
tool just failed a major test: A RAND report shows that the ‘Strategic Subject List’ doesn’t reduce homicides,” The Verge, August 19, 2016, http://www.theverge.com/2016/8/19/12552384/chicago-heat-list-tool-failed-rand-test.
157 Stroud, “The minority report.”
158 Ibid.
159 Ibid.
160 Julia Angwin, Jeff Larson, Surya Mattu and Lauren Kirchner, “Machine Bias: There’s software used across the country to predict future criminals. And it’s biased against blacks,” ProPublica, May 23, 2016, https://www.propublica.org/article/machine-bias-risk-assessments-in-criminal-sentencing.
161 Stroud, “Chicago’s predictive policing tool.”
162 Ibid.
163 White House Office of the Press Secretary, “Fact Sheet: Strengthening Community Policing,” December 1, 2014, https://www.whitehouse.gov/the-press-office/2014/12/01/fact-sheet-strengthening-community-policing.
164 Megan Smith and Roy L. Austin, Jr., “Launching the Police Data Initiative,” White House Blog, May 18, 2015, https://www.whitehouse.gov/blog/2015/05/18/launching-police-data-initiative.
165 Rob Arthur, “We Now Have Algorithms To Predict Police Misconduct,” FiveThirtyEight, March 9, 2016, http://fivethirtyeight.com/features/we-now-have-algorithms-to-predict-police-misconduct/.
166 Ibid.
167 Ibid.
168 Ibid.
169 Ibid.
170 Darian Woods, “Who Will Seize the Child Abuse Prediction Market?” The Chronicle of Social Change, May 28, 2015, https://chronicleofsocialchange.org/featured/who-will-seize-the-child-abuse-prediction-market/10861.
171 Ibid.
172 Ibid.
173 Ibid. Families receiving public benefits are low-income. Unfortunately, low-income households are often characterized by unsafe environments, especially for young children. Parents who have recently married or divorced may signal a new non-biological adult in the home, raising the risk for abuse.
174 Ibid.
175 Ibid.
176 Ibid.
177 “Preventing harm to children through predictive analytics,” (panel discussion, American Enterprise Institute, May 17, 2016), https://www.aei.org/events/preventing-harm-to-children-through-predictive-analytics-2/. See transcript, 14: https://www.aei.org/wp-content/uploads/2016/02/160517-AEI-Preventing-Harm-to-Children.pdf.
178 Ibid., see transcript, 28-50.
179 Ibid., see transcript, 28-29.
180 Ibid., see transcript, 28 and 30.
181 Ibid., see transcript, 21.
182 Ibid., see transcript, 30-31.
183 Ibid., see transcript, 12 and 29.
184 Commission to Eliminate Child Abuse and Neglect Fatalities, “Within Our Reach: A National

EDUCATION POLICY The Promise and Peril of Predictive Analytics in Higher Education: A Landscape Analysis 31
Strategy to Eliminate Child Abuse and Neglect Fatalities,” Final report, 2016, http://calio.org/images/within-our-reach.pdf, 9.
185 Ibid., 13.
186 Ibid., 29.
187 Matt Stroud, “Should Los Angeles County Predict Which Children Will Become Criminals?” Pacific Standard, January 21, 2016, https://psmag.com/should-los-angeles-county-predict-which-children-will-become-criminals-ad67f1d217de#.9xetdwnk1.
188 Ibid.
189 Ibid.
190 Ibid.
191 National Council on Crime & Delinquency, “A Profile of Youth in the Los Angeles County Delinquency Prevention Pilot,” December 2015, http://www.nccdglobal.org/sites/default/files/publication_pdf/la_dpp_evaluation_report.pdf, 12
192 Stroud, “Should Los Angeles Predict Which Children Will Become Criminals?”
193 NCCD, “Los Angeles County Delinquency Prevention Pilot,” 12.
194 Stroud, “Should Los Angeles Predict Which Children Will Become Criminals?
This report carries a Creative Commons Attribution 4.0 International license, which permits re-use of New America content when proper attribution is provided. This means you are free to share and adapt New America’s work, or include our content in derivative works, under the following conditions:
• Attribution. You must give appropriate credit, provide a link to the license, and indicate if changes were made. You may do so in any reasonable manner, but not in any way that suggests the licensor endorses you or your use.
For the full legal code of this Creative Commons license, please visit creativecommons.org.
If you have any questions about citing or reusing New America content, please visit www.newamerica.org.
All photos in this report are supplied by, and licensed to, shutterstock.com unless otherwise stated. Photos from federal government sources are used under section 105 of the Copyright Act.

