manure irrigation: airborne pathogen transport and assessment of technology use in wisconsin
TRANSCRIPT

Manure Irrigation: Airborne Pathogen Transport
and Assessment of Technology Use in Wisconsin
Waste to Worth
March 31, 2015
Seattle, WA
Becky Larson, Ph.D.Assistant Professor & Extension Specialist, UW – Madison
Mark Borchardt, Ph.D. Research Microbiologist, USDA-ARS
Dr. Susan Spencer, Dr. Tucker Burch, Dr. Chris Choi, Zach Zopp, Yifan Liang

2
Why Study Manure Irrigation?

3
Workgroup Outline
• Led by Dr. Ken Genskow, University of Wisconsin-
Madison
• Workgroup consists of many different stakeholders
18 members
• Assess application benefits and concerns in comparison
to other practices
• Examine impacts related to human health, water quality,
air quality, drift, etc.
• http://fyi.uwex.edu/manureirrigation/
• Workgroup report to be completed in the Spring of 2015

4
Benefits
• Reduced hauling costs
• Reduced road traffic and the issues
associated (when pumped)
• Multiple crop applications
• Potential to reduce irrigation water demand
• Reduced soil compaction
• Use when storage may overtop
• Water quality
5
Challenges
• Odor
• Drift
• Water quality
• Air quality
• Operational issues
• Human health concerns from pathogens and other additives
• Lack of data

6
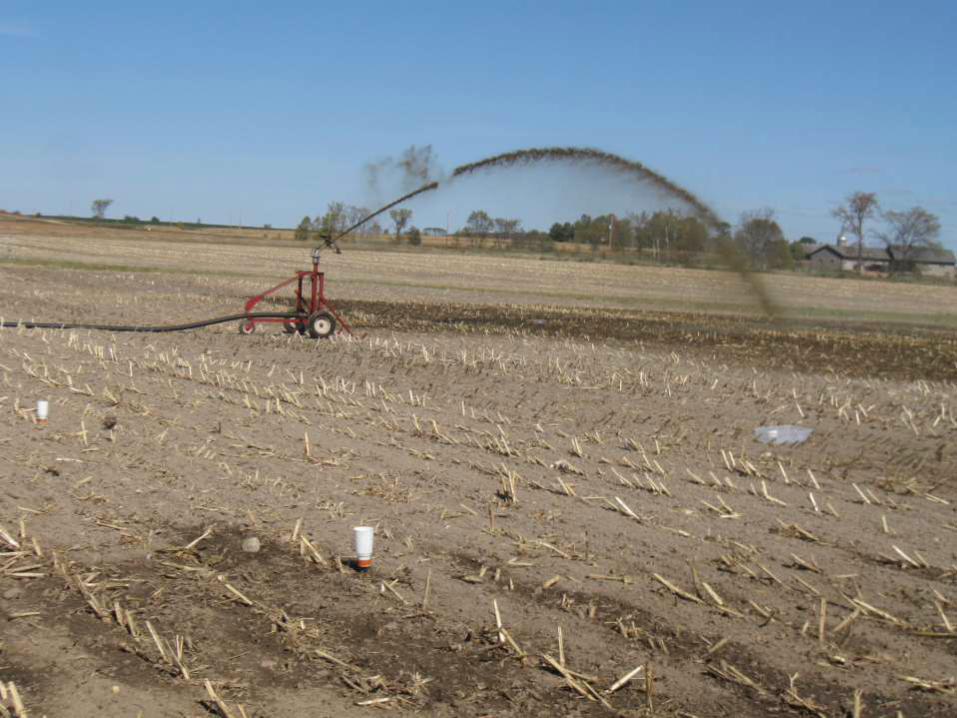
Traveling Gun
7

8
Center Pivot

9

10

11

12

13

14
Field Measurements
Portable Weather Station
• wind direction and speed
• air temperature
• solar radiation
• relative humidity
Commensal Microbes and Pathogens
• qPCR
• conventional culture

15
Field Sampler Configuration
Wind direction
Gun tow path
100 Ft 200 Ft 350 Ft 500 Ft 700 Ft
0 Ft
Upwind
controls
Button sampler
Note: Paired samplers were
located 50 Ft apart.
0 Ft
200 Ft wide spray path
400+ Ft

16
Summary of Experimental Trials
• 3 farms
• 25 trials conducted 2012 - 2014
8 center pivot trials
15 traveling gun trials
2 tanker trials
3 nighttime trials
15 trials with bacterial culture data
25 trials with qPCR (i.e., genetic marker) data
• Two trials omitted because wind direction shifted
90°during irrigation

17
Mean
temperature
(°F)
Max wind
speed
(MPH)
Mean wind
speed (MPH)
Mean solar
irradiance
(W/m2)
Mean relative
humidity (%)
Weather Conditions

18
Microbe Manure Detections %
(# trials measured)
Downwind Air Detections
%
(# air samples measured)
Bovine Bacteroides
by qPCR
100%
(18)
82%
(185)
Gram negative bacteria
by culture
100%
(10)
54%
(127)
E. coli (commensal)
by culture
100%
(8)
11%
(92)
Enterococci spp.
by culture
100%
(10)
56%
(98)
Campylobacter jejuni
by qPCR
89%
(18)
17%
(176)
Campylobacter jejuni
by culture
70%
(10)
6%
(112)
E. coli O157:H7
by qPCR
0%
(17)
Not measured
Salmonella spp.
by qPCR
0%
(17)
Not measured
Salmonella spp.
by culture
0%
(10)
0.8%
(126)
19
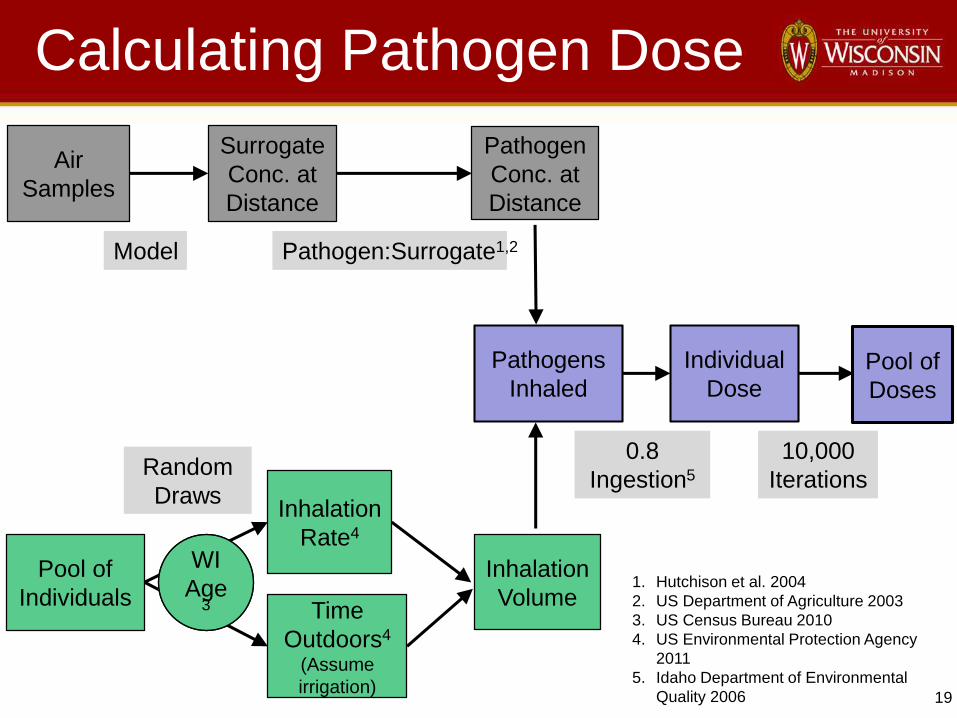
Pathogens
InhaledPool of
Doses
10,000
Iterations
Individual
Dose
0.8
Ingestion5
1. Hutchison et al. 2004
2. US Department of Agriculture 2003
3. US Census Bureau 2010
4. US Environmental Protection Agency
2011
5. Idaho Department of Environmental
Quality 2006
Pool of
Individuals
Inhalation
Rate4
Time
Outdoors4
(Assume
irrigation)
Inhalation
Volume
WI
Age3
Random
Draws
Air
Samples
Surrogate
Conc. at
Distance
Pathogen
Conc. at
Distance
Model Pathogen:Surrogate1,2
Calculating Pathogen Dose

20
Assumptions of Basic E. coli O157:H7
Scenario
1. E. coli O157:H7 prevalence = 38.5%
2. E. coli O157:H7 concentration in
manure = 2.6×10⁵ CFU/L manure
3. E. coli O157:H7 is aerosolized like
bovine Bacteroides
4. E. coli O157:H7 survival characteristics
are the same as bovine Bacteroides
Pathogen: E. coli O157:H7Surrogate: bovine BacteroidesOutcome: risk of illness at 500 feet from irrigation

Pathogen: E. coli O157:H7Surrogate: bovine BacteroidesOutcome: risk of illness as function of distance

Pathogen: E. coli O157:H7Surrogate: bovine BacteroidesOutcome: worst-case (100% prevalence) risk of illness at 500 feet from irrigation
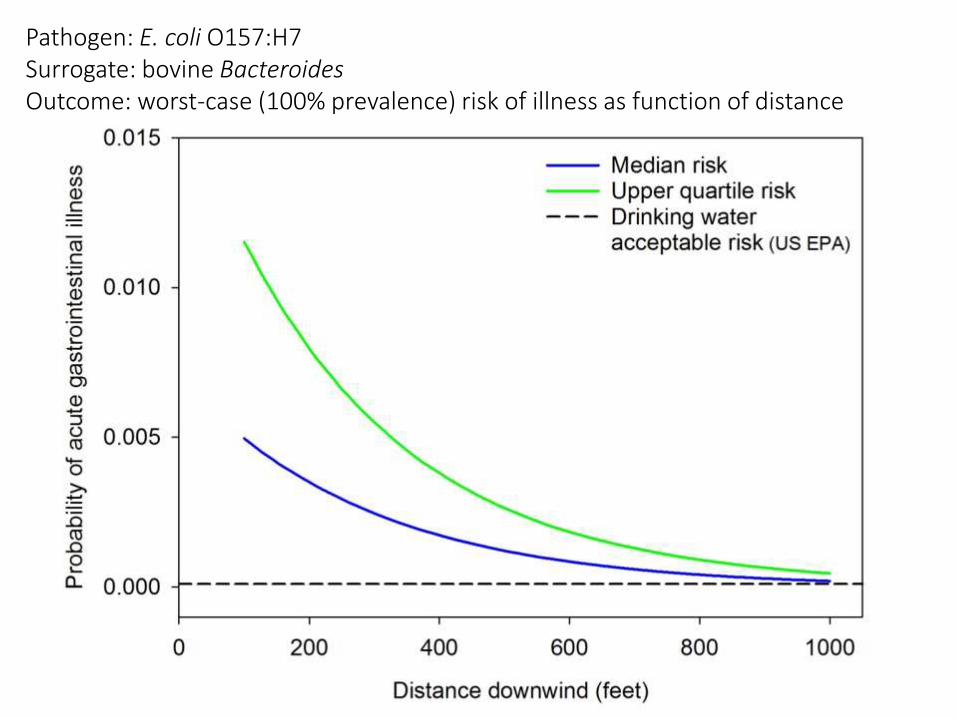
Pathogen: E. coli O157:H7Surrogate: bovine BacteroidesOutcome: worst-case (100% prevalence) risk of illness as function of distance

Pathogen: E. coli O157:H7Surrogate: culturable gram negative microorganismsOutcome: risk of illness at 500 feet from irrigation

Pathogen: E. coli O157:H7Surrogate: culturable gram negative microorganismsOutcome: risk of illness as function of distance

29
Risk estimates are conservative
towards protecting public health
because…• Bovine Bacteroides as a surrogate exhibits high
resistance to environmental inactivation
• qPCR measurements overestimate the number of live
bacteria
• In worst-case scenario, E. coli O157:H7 prevalence is
assumed to be 100%
• Dose-response model derived from outbreak data, likely
represents:
the most virulent pathogen strains
the most vulnerable human populations

30
Results
Distance
Ris
k
Estimate from this
study
Acceptable level

31
Basic Models
• Gaussian Dispersion Model
•(Pasquill, 1961); (Peterson and Lighthart, 1977); (Teltsch et al., 1980);
(Lighthart and Mohr, 1987); (Down et al., 2000); (Dungan, 2010)
𝑄 : Microorganism release rate [copies/s]
𝑢 : Wind speed [m/s]
𝜎𝑦 : Horizontal dispersion coefficient [m]
𝜎𝑧 : Vertical dispersion coefficient [m]
𝑦 : Receptor distance from centerline [m]
𝑧 : Receptor height from ground [m]
𝜆 : Microbial decay constant [s-1
]
𝑡 : Time [s]
𝐸 : Aerosolization efficiency factor [-]
𝑄 = 𝑊𝐹𝐼
𝑊 : Microorganism concentration in the source [CFU/L]
𝐹 : Application rate [L/s]
𝐼 : Impact factor [-]
32
Field Sampling Data

33
Model vs Field Data
• Travelling gun #3

34
Thank you