manuscript 4959 – revision 1 anhydrite stability and the effect of … · 2015-12-22 ·...
TRANSCRIPT
Manuscript 4959 – Revision 1
Anhydrite stability and the effect of Ca on the behavior of
sulfur in felsic magmas
RUIFANG HUANG1,2 AND HANS KEPPLER1*
1Bayerisches Geoinstitut, 95440 Bayreuth, Germany 2State Key Laboratory of Isotope Geochemistry, Guangzhou Institute of
Geochemistry, Chinese Academy of Sciences, 510640 Guangzhou, PR China
* E-mail: [email protected]
ABSTRACT
The distribution of sulfur in the system Na2O-K2O-CaO-Al2O3-SiO2-H2O-S was
investigated at 2 kbar, 750-950 °C, and oxygen fugacities ranging from the Co-CoO
to the Re-ReO2 buffer. Anhydrite (CaSO4) crystallized in all the experiments
conducted at oxidizing conditions (Ni-NiO + 0.5 to 1 and above). Under otherwise
equal conditions, an inverse relationship between sulfur and CaO concentration was
observed in melts coexisting with anhydrite, with the solubility product
K=[CaO][SO3] being constant, where [CaO] and [SO3] are the molar fraction of CaO
and SO3 in the quenched glasses. This suggests that anhydrite dissociates upon
dissolution in the melt according to CaSO4 anhydrite = Ca2+melt + SO4
2-melt. The solubility
product strongly depends on temperature, with lnK = - (28573±917)/T +
(11.26±0.80). This corresponds to an enthalpy of dissolution of ∆HR = 237.5 ± 7.6
kJ/mol. Under reducing conditions (Co-CoO and Ni-NiO buffer), CaO has no effect
on the fluid/melt partition coefficient of sulfur Dsfluid/melt. At 850 ˚C, 2 kbar partition
coefficients were 519 ± 30 at the Ni-NiO buffer and 516 ± 11 at the Co-CoO buffer,
for CaO contents in the melt up to 1 wt. %. These data are virtually identical to those
measured in the CaO-free haplogranite system under reducing conditions. However,
under more oxidizing conditions, the fluid/melt partition coefficient of sulfur
appeared to have increased somewhat in the presence of CaO. This increase may,
however, also be related to the fact that the final melt compositions in these runs were
distinctly peraluminous. Our data show that calcium has no effect on the degassing of
sulfur at reducing conditions, but it greatly reduces the amount of sulfur available for
rapid degassing under oxidizing conditions by stabilizing anhydrite.
2
Keywords: Anhydrite, sulfur, haplogranite, solubility, partitioning, oxygen fugacity
INTRODUCTION
The behavior of sulfur in magmatic-hydrothermal systems has received considerable
attention in recent years. Explosive volcanic eruptions may inject large amounts of
SO2 and other sulfur compounds into the atmosphere, where they are photochemically
oxidized to sulfate aerosols (McCormick et al. 1995; Robock 2000). These aerosols
are believed to be responsible for the global cooling of the atmosphere, which was
observed after several recent and historical eruptions (Briffa 1998). Sulfur release
from giant flood basalt eruptions may be linked to mass extinction events through the
production of acid rain, ocean acidification and resulting anoxia (Black et al. 2014).
Measurements of sulfur emissions from active volcanoes are routinely used for the
assessment of volcanic hazards (e.g. Duffel et al. 2003; Aiuppa et al. 2007;
Oppenheimer et al. 2011). Finally, the formation of some hydrothermal ore deposits is
likely closely linked to the behavior of sulfur (e.g. Wilkinson 2013), which may under
some circumstances precipitate insoluble sulfides, but which may also facilitate metal
transport, e.g. by the formation of hydrosulfide complexes.
Under reducing conditions, the precipitation of pyrrhotite (FeS) often limits the
amount of sulfur that may remain in the silicate melt (Baker and Moretti 2011, Parat
et al. 2011). At more oxidizing conditions, anhydrite (CaSO4) may crystallize (e.g.
Luhr 1984; Bernard et al. 1991), yet the stability of anhydrite has been much less
studied than for pyrrhotite (e.g. Carroll and Rutherford 1987; Luhr 1990, 2008; Li and
Ripley 2009; Beermann et al. 2011; Parat et al. 2011; Baker and Moretti 2011). Sulfur
generally partitions strongly into a hydrous fluid phase coexisting with silicate melts,
but fluid/melt partition coefficients reported in the literature vary by orders of
magnitude (Scaillet et al. 1998; Keppler 1999, 2010; Botcharnikov et al. 2004;
Webster et al. 2009, 2011; Webster and Botcharnikov 2011; Lesne et al. 2011; Zajacz
et al. 2012). Most studies now agree that redox state is a prime variable controlling
sulfur partitioning and that the fluid/melt partition coefficient increases about one
order of magnitude with decreasing oxygen fugacity. Yet, even at the same oxygen
fugacity, partition coefficients vary significantly between different studies and it is
3
not clear whether this variation is real or an experimental artifact and what parameters
may control this variation.
The generally strong partitioning of sulfur into a hydrous fluid phase is likely
responsible for the “sulfur excess” commonly observed in large explosive volcanic
eruptions, i.e. the observation that more sulfur is released in volcanic gases than can
be attributed to the degasing of the erupted magma. The most plausible explanation
for this phenomenon is that before the eruption, a hydrous fluid coexisted with the
silicate melt in the magma chamber and therefore extracted sulfur from a much larger
magma reservoir (Wallace and Gerlach 1994; Westrich and Gerlach 1992; Wallace
2001; Keppler 1999, 2010).
As noted above, the behavior of sulfur in magmatic systems is very sensitive to redox
conditions, which control the stability of different sulfur species. In silicate melts,
sulfur is believed to occur either as sulfide S2- under reducing conditions or as S6+
under oxidizing conditions, with the boundary between these two regimes being close
to the Ni-NiO buffer (Carroll and Rutherford 1988). H2S and SO2 are widely believed
to be the most important sulfur species in high-temperature, hydrothermal fluids
coexisting with silicate melts, with SO2 usually being the most important sulfur
species in volcanic gases (Fischer 2008). However, recent studies suggest that S6+
may become an important sulfur species in hydrous fluids already at moderately
oxidizing conditions near the Re-ReO2 buffer (Binder and Keppler 2011; Ni and
Keppler 2012).
In this study, we investigate the behavior of sulfur in a haplogranitic system to which
variable amounts of CaO have been added, in order (1) to better understand the
factors controlling anhydrite stability and (2) to study the effect of CaO on the
partitioning of sulfur between fluid and melt. The haplogranite-CaO system is
particularly well suited for these studies, as it is probably the simplest system in
which anhydrite stability can be thoroughly studied and the fluid/melt partitioning of
sulfur in the CaO-free system is well documented. Keppler (1999) and Keppler (2010)
reported fluid/melt partition coefficients of sulfur in this system ranging from 47
under oxidizing to 468 under reducing conditions at 0.5 to 3 kbar and 750 to 850 ˚C.
4
Very similar partition coefficients, ranging from 50 to 359 were reported by Webster
et al. (2011) at 2 kbar and 900 ˚C.
EXPERIMENTAL METHODS
Starting materials and preparation of sample capsules
Starting materials in all experiments were aqueous solutions of H2SO4 (0.5 mol/L to
2.5 mol/L) and synthetic haplogranitic glasses with a base composition of 40 wt.%
NaAlSi3O8, 35 wt.% SiO2, and 25 wt.% KAlSi3O8, to which up to about 5 wt. % of
CaO were added. The solutions were prepared by diluting commercially available
standard solutions (Titrisol, Merck). The glasses were prepared from mixtures of
high-purity SiO2, K2CO3, Na2CO3, Al2O3 and CaCO3. The mixtures were
decarbonated by heating in an electrical box furnace from ambient temperature to
1100 ºC in 12 hours and annealing at 1100 ºC for 12 hours. The resulting glasses were
then re-melted in a high-temperature furnace at 1600 ºC and ambient pressure for two
hours. After quenching in distilled water, the glasses were finely ground and
homogenized. Glass compositions are given in Table 1.
10 mg H2SO4 solution and 10 mg glass powder were sealed into 20 mm long gold
capsules with 2.5 mm outer diameter and 0.2 mm wall thickness by arc welding. The
amount of H2SO4 solution and glass powder added to each charge is listed in Table 2.
Capsules were checked for leaks before and after the experiments by heating in an
oven at 150 °C for several hours. Capsules that showed any signs of leakage were
discarded. A double-capsule technique was used for samples buffered with Re and
ReO2 powder. Around 420 mg buffer mixture (2:1 weight ratio of Re and ReO2) and
60 mg distilled water were loaded together with the inner capsule into an outer gold
capsule with 5.0 mm outer diameter, 0.2 mm wall thickness and 4 cm length.
High-pressure experiments
High-pressure experiments were conducted in vertical rapid-quench cold seal pressure
vessels made of the Ni-based super-alloy IN713LC, using water as pressure medium.
Sample capsules were mounted on top of a filler rod, which was held in the hot spot
of the bomb by means of an external magnet. Run durations were mostly around 7
5
days. For quenching, the external magnet was dropped, which caused the sample to
fall into a water-cooled zone within 1 – 2 s. Temperatures were measured by a Ni-
NiCr (type K) thermocouple in an outer drill hole of the autoclave close to the sample
position. The accuracy of temperatures is believed to be better than ± 10 °C, including
the effects of thermal gradients, as calibrated by internal thermocouples. Pressure was
measured with a pressure gauge and is accurate to ± 50 bar or less. The oxygen
fugacity inside the vessel was buffered by the reaction of water with the autoclave
material, and is 0.5-1 log unit above Ni-NiO. Some experiments were carried out
without buffer at the intrinsic oxygen fugacity of the autoclave. For experiments at the
Re-ReO2 buffer, a conventional double capsule technique was used, as described
above. For experiments at the Ni-NiO buffer, two sample capsules were placed into
an unsealed gold capsule with 5.0 mm outer diameter, 0.2 mm wall thickness and 40
mm length, together with about 0.7 g Ni powder and a trace of NiO. A small gold
piece was used to separate the gold capsules from the buffer mixture. For experiments
at the Co-CoO buffer, about 0.5 g Co powder was loaded into an unsealed gold
capsule with 5.0 mm outer diameter, 0.2 mm wall thickness and ~2 cm length, which
was placed below another unsealed gold capsule containing the two sample capsules.
These techniques were used to avoid diffusion of Ni or Co into the sample capsule,
which does occur if the sample capsules are in direct contact with Ni or Co powder. A
few unbuffered experiments at 950 ˚C were carried out in rapid-quench TZM
(titanium and zirconium reinforced molybdenum) bombs with argon as pressure
medium. The intrinsic oxygen fugacity of these bombs is about 2 log units above Ni-
NiO.
Analytical methods
Quenched glasses were analyzed with a JEOL JXA-8900 electron microprobe at 20
kV accelerating voltage, 50 nA beam current, using a defocused beam (20 µm). The
peak counting time was 10 s for Na, K and Si, 20 s for Ca and Al and 60 s for S.
Albite, orthoclase, enstatite, diopside, and spinel standards were used for analyses of
Na, K, Si, Ca and Al, respectively. Due to the use of a defocussed beam, alkali loss
during measurement was minimal. Since the position of the SKα line is dependent on
the oxidation state of sulfur (Carroll and Rutherford, 1988), both barium sulfate
(BaSO4) and zinc sulfide (ZnS) standards were used for S analyses. The SKα position
of the samples in this study was located between that of BaSO4 and ZnS. The
6
difference of the sulfur contents measured using these two standards and their
respective peak positions did not exceed the statistical uncertainty.
The valence state of sulfur in the quenched glasses was determined from the
wavelength shift of the SKα line as observed by the electron microprobe (Carroll &
Rutherford 1988). As suggested by Klimm et al. (2012), measurements were carried
out with different exposure times (100 ms, 200 ms, and 300 ms per step) and the
observed peak positions were extrapolated to zero exposure time, in order to
compensate for changes in oxidation state induced by beam damage. Operating
conditions for these measurements were 15 kV, 50 nA, 20 µm defocussed beam,
PETH monochromator, scan from 2318 to 2295 eV in 860 steps.
The sulfur content of the fluid phase was calculated by mass balance. In experiments
that did not crystallize anhydrite (CaSO4), the sulfur concentration in the fluid was
essentially the same as in the starting solution, as only traces of sulfur were found in
the quenched glasses and any loss of sulfur to the gold capsule is negligible (Keppler
2010). In experiments that crystallized anhydrite, the amount of sulfur locked up in
anhydrite was calculated from the difference in the CaO contents of the quenched
glass and the starting glass composition. An implicit assumption in this calculation is
that the amount of anhydrite dissolving into the aqueous fluid is negligible. Indeed,
Newton and Manning (2005) found a solubility of anhydrite in pure water of 0.03
mol/kg at 10 kbar and 800 ˚C. This would translate into 0.1 wt. % of S in the solution,
very small compared to the sulfur contents used in the starting solutions (up to 7 wt.
%). For lower pressures and temperatures (500 ˚C and 1 kbar), Moorey and
Hesselgesser (1951) reported even lower anhydrite solubilities, equivalent to about 5 .
10-4 wt. % S in solution.
RESULTS
Run products
The run products of all experiments (Table 2, Fig. 1) contained a quenched glass
phase, a quenched fluid phase and usually one crystalline phase, which was anhydrite
7
CaSO4 at oxidizing conditions (in the unbuffered runs and runs at the Re-ReO2 buffer)
or wollastonite (CaSiO3) at more reducing conditions (Ni-NiO and Co-CoO buffers).
The identity of anhydrite and wollastonite was confirmed both by electron microprobe
analyses and by Raman spectroscopy. Quenched glasses often contained numerous
two-phase fluid inclusions. Raman spectra (Fig. 2) of these fluid inclusions showed
that under oxidizing conditions (as defined above), sulfur was mostly present as
sulfate SO42- in the liquid phase, while for experiments at reducing conditions, H2S
was detected both in the liquid and the gas phase. This is consistent with the strong
smell of H2S that was often noticed when opening capsules from reduced
experiments; a slight odor of SO2 was sometimes noticed for the experiments that had
been run without buffer (i.e. 0.5 to 1 log unit above Ni-NiO). The pH of the quenched
fluid, as measured by a pH indicator paper, was 0.5 for the oxidized runs and 10 for
the reduced runs. The compositions of quenched silicate glasses are compiled in Table
3. Glass compositions were always found to be homogeneous, indicating attainment
of equilibrium. Due to the crystallization of anhydrite and wollastonite, measured
CaO contents were lower than in the starting materials, 0.05 to 1.19 wt.% for runs
with anhydrite and 0.88 – 1.28 wt.% for runs with wollastonite. Due to the
partitioning of alkalis into the fluid, the glasses from experiments at oxygen fugacities
above Ni-NiO became distinctly peraluminous, with molar Al2O3/(CaO + Na2O +
K2O) ratios usually ranging between 1.1 and 1.2. For the run products from
experiments at the Ni-NiO and the Co-CoO buffer, this ratio was usually slightly
below 1. For unbuffered runs 0.5 to 1 log unit above the Ni-NiO buffer, a S6+/Stotal
ratio of 0.83 was observed in the quenched glasses, while for the runs conducted in
TZM bombs about 2 log units above Ni-NiO, the ratio was 0.90.
Stability of anhydrite
In principle, anhydrite could dissolve in the silicate melt in two different ways. If
there were some strong association between SO3 and CaO in the melt, forming some
kind of molecule-like unit, the dissolution may be described by the equation
CaSO4 (crystal) = CaSO4 (melt)
However, if calcium and sulfur dissociate in the melt, the dissolution could be
described by
8
CaSO4 (crystal) = Ca2+ (melt) + SO42- (melt)
or
CaSO4 (crystal) = CaO (melt) + SO3 (melt)
For the first case, the solubility of anhydrite is independent on the CaO content of the
melt, while it is dependent on the CaO content of the melt if dissociation occurs. The
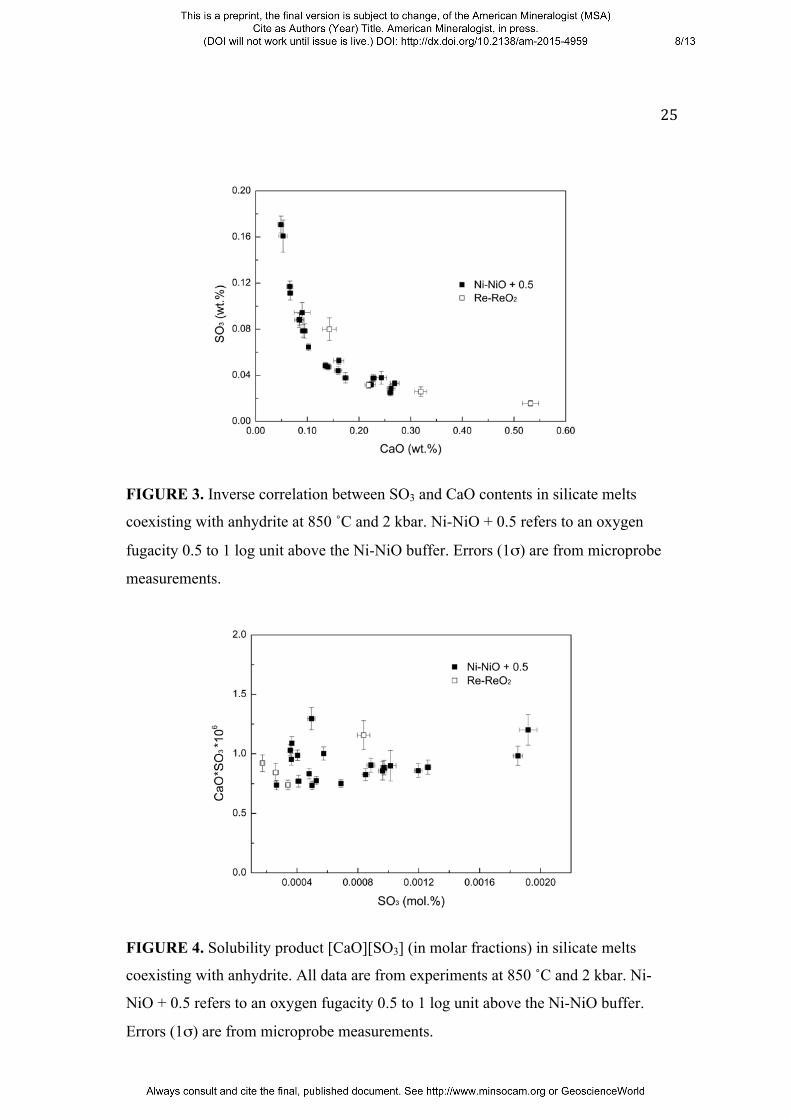
SO3 content of the quenched glasses correlates negatively with the CaO content (Fig.
3), while the solubility product of anhydrite in the melt is constant for experiments
conducted at the same temperature and pressure (Fig. 4). The solubility product of
anhydrite can be expressed as
K = [CaO][SO3]
where [CaO] and [SO3] are molar fractions of CaO and SO3 in the quenched glasses,
respectively. Molar fractions were calculated on an anhydrous base, from converting
analyses of quenched glasses into oxide components of SiO2, Al2O3,CaO, Na2O, K2O
and SO3. The concentration of SO3 in the melt was calculated from the bulk sulfur
contents of the glasses in Table 3 and the S6+/Stotal ratio (see above). Thus, anhydrite
dissolves in the melt by dissociating into Ca2+ and SO42- or into CaO and SO3; the
latter two cases cannot be distinguished from a thermodynamic point of view. Figure
5 shows the temperature dependence of anhydrite solubility in the melt as a plot of
lnK versus inverse temperature. All data can be described by one single regression
line
lnK = (11.26±0.80) - (28573±917)/T
(R2 = 0.92), where T is temperature in Kelvin. According to dlnK/d(1/T) = -ΔH/R, his
corresponds to a reaction enthalpy of ∆HR = 237.5 ± 7.6 kJ/mol. If the solubility
product is expressed in wt. % CaO and SO3 of the hydrous glasses, linear regression
of the data yields
lnK(wt.%) = (19.5±1.4) – (27372 ±1635)/T
9
Only the data at 750 ˚C plot somewhat above these regression lines, which could
imply incomplete crystallization of anhydrite at these relatively low temperatures.
The observation of a constant solubility product of anhydrite at high oxygen
fugacities and constant pressure and temperature reported here is similar to the
solubility behavior of fluorite CaF2 in haplogranitic melts, as observed by Dolejs and
Baker (2006).
Fluid/melt partitioning of sulfur under reduced conditions
Data on the partitioning of sulfur between silicate melt and aqueous fluid at 850 ˚C
and 2 kbar are compiled in Table 4. At reducing conditions (i.e. at the Co-CoO and
the Ni-NiO buffer), wollastonite crystallized. This caused the CaO content in the
glasses to be nearly constant around 1 wt. % (Table 2), independent of the bulk CaO
content in the starting material, as all runs were carried out at the same pressure and
temperature (2 kbar and 850 ˚C). As no sulfur-bearing phase crystallized in these runs
and as the sulfur contents in the glasses are very low, the equilibrium sulfur
concentration in the fluid is essentially the same as for the starting solution. Figure 6
shows a plot of the sulfur content in the melt versus the sulfur content in the fluid for
all experiments at the Co-CoO buffer. All data points follow a straight line through
the origin of the diagram, implying that the fluid/melt partition coefficient is
independent of sulfur concentration; linear regression yielded Dsfluid/melt = 509 ± 20.
Figure 7 shows similar data for Ni-NiO buffer conditions. Again, the fluid/melt
partitioning of sulfur can be described by one single partition coefficient Dsfluid/melt =
505 ± 19. The close agreement between the partition coefficients found for Ni-NiO
and Co-CoO buffer conditions implies that sulfur speciation in melt and fluid does not
change in this range of oxygen fugacity. Indeed, Raman measurements of quenched
aqueous fluids (Binder and Keppler 2011) and the sulfur Kα shift of quenched glasses
(Carroll and Rutherford 1988) suggest the prevalence of S2- at these conditions.
Moreover, the data obtained here for melts containing about 1 wt. % of CaO in
equilibrium with wollasonite are within the combined errors indistinguishable from
the partition coefficients of sulfur (Dsfluid/melt = 468 ± 32) in the Ca-free haplogranite
system at the Co-CoO buffer under otherwise equal conditions (Keppler 1999, 2010).
This suggests that CaO has no effect on the fluid/melt partitioning of sulfur under
10
reducing conditions and S2- or H2S do not form any close association with Ca in either
the fluid or the silicate melt.
Fluid/melt partitioning of sulfur under oxidizing conditions
In unbuffered runs (0.5 to 1 log unit above the Ni-NiO buffer), the crystallization of
anhydrite reduced the initial CaO content in the melt. The resulting quenched glasses
mostly have CaO contents between 0.05 and 0.3 wt.%. In order to better separate out
the effect of CaO on the behavior of sulfur, the data were divided into two groups,
one with a CaO content in the quenched melt below 0.2 wt. % and one with CaO
above 0.2 wt. %. Figure 8 shows the sulfur partitioning for experiments with melt
CaO contents below 0.2 wt. %. Although there clearly is some scatter, possibly
related to variations in CaO content, the data can still be reasonably described by a
constant partition coefficient of Dsfluid/melt = 104 ± 13. This value is, however, already
significantly higher than the partition coefficient of 47 ± 4 found by Keppler (2010)
for the CaO-free haplogranite system under otherwise equal conditions. A further
increase of partition coefficients is obvious in the data for melts with a CaO content of
more than 0.2 wt. % (Fig. 9), with Dsfluid/melt exceeding 200 for high sulfur
concentrations in the fluid. However, the data also suggest that that the partition
coefficient is not constant, but increases with the sulfur content in the fluid. The data
from four experiments at the Re-ReO2 buffer (Fig. 10) can be described by a constant
partition coefficient of Dsfluid/melt = 157 ± 15, similar to the values measured in the
unbuffered experiments. Figure 11 shows a comparison of the sulfur partition
coefficients measured in this study and of those in the CaO-free haplogranite system
(Keppler 2010).
A conceivable explanation for the effect of Ca on the partitioning of sulfur could be
the formation of ion pairs between Ca2+ and the sulfur species in the fluid. However,
the very low solubility of anhydrite in water (Morey and Hesselgesser 1951, Newton
and Manning 2005) makes it questionable, whether the Ca2+ concentration in the fluid
is high enough for such an effect. Indirect effects, such as changes in the pH of the
fluid upon addition of excess CaO to the system, or changes in the partitioning of Na
and K upon addition of Ca, could also be involved. Moreover, the data shown in
Figure 9 may imply that at high Ca concentrations, there is significant non-ideality in
the sulfur-rich aqueous fluids coexisting with the silicate melts, as the sulfur content
11
in the melt increases only slightly with the sulfur content in the fluid. The apparent
increase of the fluid/melt partition coefficient of sulfur in the presence of CaO cannot
be a caused by errors in the mass balance calculation. The main assumption here is
that the solubility of anhydrite in the fluid is negligible, in line with experimental
studies by Moorey and Hesselgesser (1951) and Newton and Manning (2005).
However, if one allowed some solubility of anhydrite in the fluid, this would only
increase the sulfur concentration in the fluid and therefore further increase the
fluid/melt partition coefficient. It is conceivable, however, that the fluid/melt partition
coefficient is influenced by the distinctly peraluminous composition of the melts in
these experiments. Indeed, Binder (2007) found that in the CaO-free haplogranite
system, the fluid melt partition coefficient of sulfur increases from 74 ± 5 to 246 ± 9
when Al2O3/(Na2O+K2O) rises from 0.93 to 1.18 (at 2 kbar, 850 ˚C and the Re-ReO2
buffer). A similar effect could be responsible for the apparent increase of the
fluid/melt partition coefficient with CaO content observed here.
THE EFFECT OF CA ON THE DEGASSING OF SULFUR
Our study clearly shows that the presence of calcium does not affect the behavior of
sulfur at all if oxygen fugacity is low (Ni-NiO or below). No sulfur-bearing phases are
being stabilized and the fluid/melt partition coefficient of sulfur remains unaffected.
However, already small amounts of calcium have a major effect on sulfur under more
oxidizing conditions, because on one hand, part of the sulfur is locked up by the
crystallization of anhydrite, while on the other hand, the fluid/melt partition
coefficient of the remaining sulfur possibly increases. Obviously, these two effects
would tend to act in the opposite direction on the sulfur yield in volcanic eruptions.
Increasing the fluid/melt partition coefficient should increase the amount of sulfur
entering the fluid phase, while locking up sulfur in anhydrite should reduce it. Here,
we will argue that the second effect is much more important and that the main effect
of calcium is to reduce the sulfur yield of explosive eruptions. This conclusion
depends very much on the stability of anhydrite during an eruption.
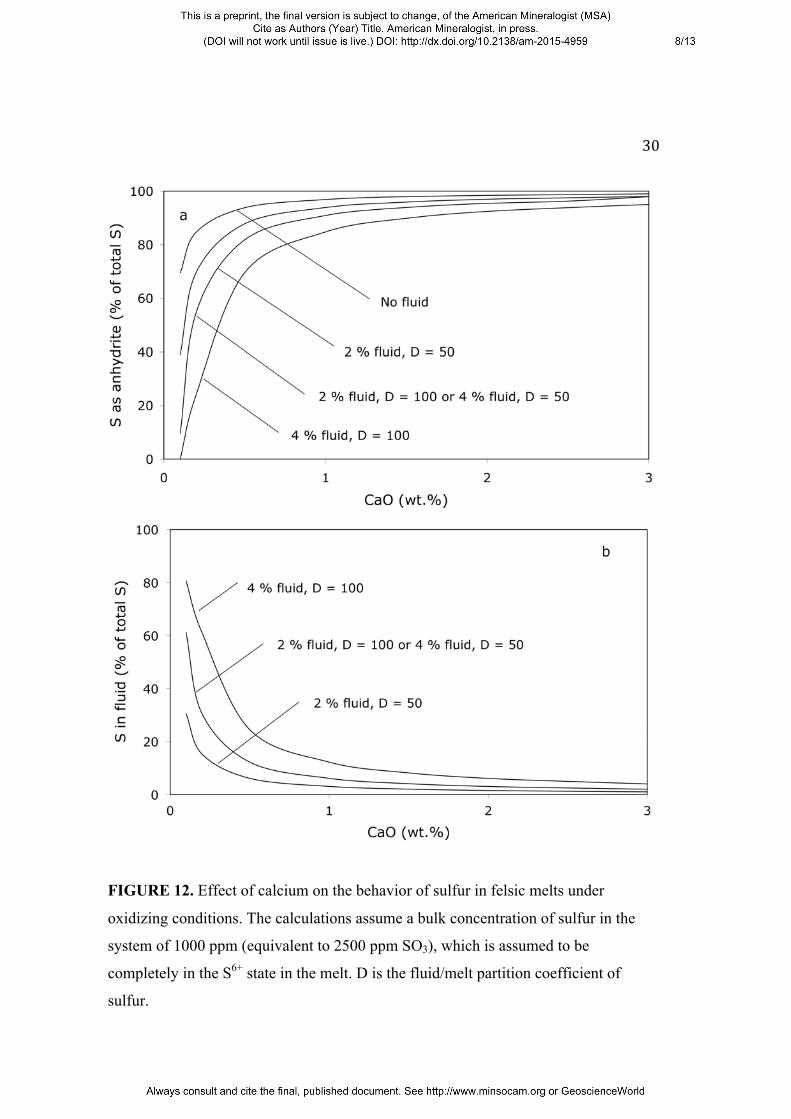
Kinetic data on the decomposition of anhydrite (Hanic et al. 1985) suggest that during
the short timescales of explosive eruptions, very little sulfur may be released by
decomposition of anhydrite. At 1310 ˚C, far above the expected eruption temperature,
12
10 % decomposition requires more than 3 hours. This is consistent with the fresh
appearance of anhydrite phenocrysts in Mt. Pinatubo pumices (Bernard et al. 1991;
see also Wallace and Gerlach 1994 for further discussion). With the assumption that
sulfur in anhydrite is not available for release into the gas phase during an eruption,
the sulfur yield can readily be calculated. Figure 12 shows such model calculations
for a magmatic system with rhyolitic composition under oxidizing conditions and a
bulk sulfur content of 1000 ppm S, equivalent to 0.25 wt. % of SO3. This value is
comparable to the SO3 content in whole-rock pumices from the 1991 Mt. Pinatubo
eruption (0.37 – 0.48 wt. %; Bernard et al. 1991), but smaller than for El Chicón (1.2
wt. %, Luhr et al. 1984). In the calculations, it was assumed that all sulfur in the melt
is in the S6+ state and that the sulfur concentration in the melt is controlled by the
solubility product of anhydrite. Figure 12 shows clearly that the main effect of CaO is
to precipitate anhydrite and thereby to greatly reduce the fraction of the total sulfur
that enters the fluid phase. Increasing the fluid/melt partition coefficient would only
slightly reduce this effect.
Our data therefore show that CaO is a main factor in controlling the sulfur yield of
explosive eruptions under oxidizing conditions. For rhyolitic compositions, the data
on anhydrite solubility presented here can be directly applied. However, for dacitic
and andesitic compositions, independent calibrations are required as the solubility
product likely also depends on the bulk composition of the melt. Indeed, the data of
Luhr et al. (1990) suggest that for more depolymerized melts, the solubility of
anhydrite increases. Empirical models for anhydrite solubility have been proposed by
Li and Ripley (2009) and by Baker and Moretti (2011). The latter model does include
a term with the molar fraction of CaO. However, the exponent of this CaO term in the
equation of sulfur solubility of Baker and Moretti (2001) is only –0.21, not –1, as one
would expect from the constancy of the solubility product. Very likely, two effects are
mixed here: On one hand, CaO reduces the solubility of S in the melt according to the
solubility product, which should remain constant at given bulk composition, pressure
and temperature, as shown in this study. However, CaO may also act as a network
modifier that depolymerizes the melt, an effect that likely increases the solubility
product. We therefore suggest that models of anhydrite solubility may require some
recalibration, which fit the solubility product as a function of pressure, temperature
13
and some compositional parameter, such as NBO/T (non-bridging oxygen per
tetrahedron).
ACKNOWLEDGEMENTS
We would like to thank Roman Botcharnikov and an anonymous referee for
constructive reviews and Nicole Métrich for the editorial handling of the manuscript.
REFERENCES CITED
Aiuppa, A., Moretti, R., Federico, C., Giudice, G., Gurrieri, S., Liuzzo, M., Papale, P.,
Shinohara, H., and Valenza, M. (2007) Forecasting Etna eruptions by real-time
observation of volcanic gas composition. Geology, 35, 1115-1118.
Baker, D.R., and Moretti, R. (2011) Modeling the solubility of sulfur in magmas: A
50-year old geochemical challenge. Reviews in Mineralogy and Geochemistry, 73,
167-213.
Beermann, O., Botcharnikov, R.E., Holtz, F., Diedrich, O., and Nowak, M. (2011)
Temperature dependence of sulfide and sulfate solubility in olivine-saturated
basaltic magmas. Geochimica et Cosmochimica Acta, 75, 7612-7631,
Bernard, A., Demaiffe, D., Mattielli, N., and Punongbayan, R. S. (1991) Anhydrite-
bearing pumices from Mount Pinatubo: further evidence for the existence of
sulfur-rich silicic magmas. Nature, 354, 139-140.
Binder, B. (2007) Experimentelle Untersuchungen zum Verhalten von Schwefel in
magmatisch-hydrothermalen Systemen. Ph. D. dissertation, University of
Tübingen.
Binder, B., and Keppler, H. (2011) The oxidation state of sulfur in magmatic fluids.
Earth and Planetary Science Letters, 301, 190-198.
Black, B.A., Lamarque, J.F., Shields, C.A., Elkins-Tanton, L.T., and Kiehl, J.T.
(2014) Acid rain and ozone depletion from pulsed Siberian Traps magmatism.
Geology, 42, 67-70.
Botcharnikov, R. E., Behrens, H., Holtz, F., Koepke, J., and Sato, H. (2004) Sulfur
and chlorine solubility in Mt. Unzen rhyodacitic melt at 850 °C and 200 MPa.
Chemical Geology, 213, 207-225.
14
Briffa, K. R., Jones, P. D., and Schweingruber, F. H. (1998) Influence of volcanic
eruptions on Northern Hemisphere summer temperature over the past 600 years.
Nature, 393, 450-455.
Carroll, M. R., and Rutherford, M. J. (1987) The stability of igneous anhydrite:
Experimental results and implications for sulfur behavior in the 1982 El Chichon
trachyandesite and other evolved magmas. Journal of Petrology, 28, 781-801.
Carroll, M. R., and Rutherford, M. J. (1988) Sulfur speciation in hydrous
experimental glasses of varying oxidation state: Results from measured
wavelength shifts of sulfur X-rays. American Mineralogist, 73, 845-849.
Dolejs, D., and Baker, D.R .(2006) Fluorite solubility in hydrous haplogranitic melts
at 100 MPa. Chemical Geology, 225, 40-60.
Duffell, H. J., Oppenheimer, C., Pyle, D. M., Galle, B., McGonigle, A. J. S., and
Burton, M. R. (2003) Changes in gas composition prior to a minor explosive
eruption at Masays volcano, Nicaragua. Journal of Volcanology and Geothermal
Research, 126, 327-339.
Fischer, T. P. (2008) Fluxes of volatiles (H2O, CO2, N2, Cl, F) from arc volcanoes.
Geochemical Journal, 42, 21-38.
Hanic, F., Galikova, L., Havlica, J., Kapralik, I., and Ambruz, V. (1985) Kinetics of
the thermal decomposition of CaSO4 in air. British Ceramics Transactions and
Journal, 84, 22-25.
Keppler, H. (1999) Experimental evidence for the source of excess sulfur in explosive
volcanic eruptions. Science, 284, 1652-1654.
Keppler, H. (2010) The distribution of sulfur between haplogranitic melts and
aqueous fluids. Geochimica et Cosmochimica Acta, 74, 645-660.
Klimm, K., Kohn, S.C., O'Dell L.A., Botcharnikov, R.E., and Smith, M.E. (2012) The
dissolution mechanism of sulphur in hydrous silicate melts. I: Assessment of
analytical techniques in determining the sulphur speciation in iron-free to iron-poor
glasses. Chemical Geology, 322-323, 237-249.
Lesne, P., Kohn, S. C., Blundy, J., Witham, F., Botcharnikov, R. E., and Behrens, H.
(2011) Experimental simulation of closed-system degassing in the system basalt-
H2O-CO2-S-Cl. Journal of Petrology, 52, 1737-1762.
Li, C.S., and Ripley, E.M (2009) Sulfur contents at sulfide-liquid or anhydrite
saturation in silicate melts: Empirical equations and example applications.
Economic Geology, 104, 405-412.
15
Luhr, J. F., Carmichael, I. S. E., and Varekamp, J. C. (1984) The 1982 eruptions of El
Chichón volcano, Chiapas, Mexico: Mineralogy and petrology of the anhydrite-
bearing pumices. Journal of Volcanology and Geothermal Research, 23, 69-108.
Luhr, J. F. (1990) Experimental phase relations of water- and sulfur-saturated arc
magmas and the 1982 eruptions of El Chichon volcano. Journal of Petrology, 31,
1071-1114.
Luhr, J. F. (2008) Primary igneous anhydrite: Progress since its recognition in the
1982 El Chichon trachyandesite. Journal of Volcanology and Geothermal
Research, 175, 394-407.
McCormick, M. P., Thomason, L. M., and Trepte, C. R. (1995) Atmospheric effects
of the Mt Pinatubo eruption. Nature, 373, 399-404.
Moorey, G.W., and Hesselgesser, J.M. (1951) The solubility of some minerals in
superheated steam at high pressures. Economic Geology, 46, 821-835.
Newton, R.C., and Manning, C.E. (2005) Solubility of anhydrite, CaSO4, in NaCl-
H2O solutions at high pressures and temperatures: Applications to fluid-rock
interaction. Journal of Petrology, 46, 701-716.
Ni, H. W., and Keppler, H. (2012) In-situ Raman spectroscopic study of sulfur
speciation in oxidized magmatic-hydrothermal fluids. American Mineralogist, 97,
1348-1353.
Oppenheimer, C., Scaillet, B. and Martin, R. S. (2011) Sulfur degassing from
volcanoes: Source conditions, surveillance, plume chemistry and earth system
impacts. Reviews in Mineralogy and Geochemistry, 73, 363-421.
Parat, F., Holtz, F., Streck, M.J. (2011) Sulfur-bearing magmatic accessory minerals.
Reviews in Mineralogy and Geochemistry, 73, 285-314.
Robock, A. (2000) Volcanic eruptions and climate. Reviews of Geophysics, 38, 191-
219.
Scaillet, B., Clemente, B., Evans, B. W., and Pichavant, M. (1998) Redox control of
sulfur degassing in silicic magmas. Journal of Geophysical Research, 103, 23937-
23949.
Wallace, P. J. (2001) Volcanic SO2 emissions and the abundance and distribution of
exsolved gas in magma bodies. Journal of Volcanology and Geothermal Research,
108, 85-106.
16
Wallace, P. J., and Gerlach, T. M. (1994) Magmatic vapor source for sulfur dioxide
released during volcanic eruptions: Evidence from Mount Pinatubo. Science, 265,
497-499.
Webster, J.D., and Botcharnikov, R.E. (2011) Distribution of sulfur between melt and
fluid in S-O-H-C-Cl-bearing magmatic systems at shallow crustal pressures and
temperatures. Reviews in Mineralogy and Geochemistry, 73, 247-283.
Webster, J. D., Sintoni, M. F., and de Vivo B. (2009) The partitioning behavior of Cl,
S, and H2O in aqueous vapor- ±saline-liquid saturated phonolitic and trachytic
melts at 200 MPa. Chemical Geology, 263, 19-36.
Webster, J. D., Goldoff, B., and Shimizu, N. (2011) C-O-H-S fluids and granitic
magma: How S partitions and modifies CO2 concentrations of fluid-saturated felsic
melt at 200 MPa. Contributions to Mineralogy and Petrology, 162, 849-865.
Westrich, H. R., and Gerlach, T. M. (1992) Magmatic gas source for the stratospheric
SO2 cloud from the June 15, 1991, eruption of Mount Pinatubo. Geology, 20, 867-
870.
Wilkinson, J.T. (2013) Triggers for the formation of porphyry ore deposits in
magmatic arcs. Nature Geoscience, 6, 917-925.
Zajacz, Z., Candela, P. A., Piccoli, P. M., and Sanchez-Valle, C. (2012) The
partitioning of sulfur and chlorine between andesite melts and magmatic volatiles
and the exchange coefficients of major cations. Geochimica et Cosmochimica
Acta, 89, 81-101.
17
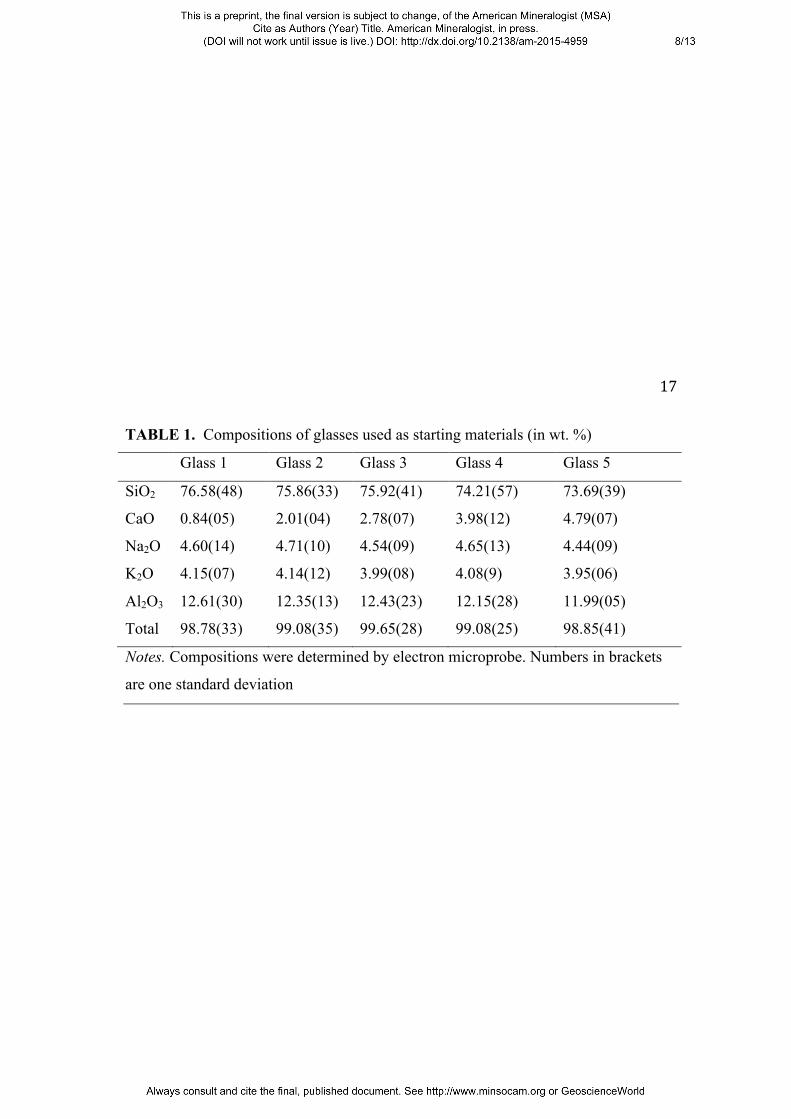
TABLE 1. Compositions of glasses used as starting materials (in wt. %)
Glass 1 Glass 2 Glass 3 Glass 4 Glass 5
SiO2 76.58(48) 75.86(33) 75.92(41) 74.21(57) 73.69(39)
CaO 0.84(05) 2.01(04) 2.78(07) 3.98(12) 4.79(07)
Na2O 4.60(14) 4.71(10) 4.54(09) 4.65(13) 4.44(09)
K2O 4.15(07) 4.14(12) 3.99(08) 4.08(9) 3.95(06)
Al2O3 12.61(30) 12.35(13) 12.43(23) 12.15(28) 11.99(05)
Total 98.78(33) 99.08(35) 99.65(28) 99.08(25) 98.85(41)
Notes. Compositions were determined by electron microprobe. Numbers in brackets
are one standard deviation
18
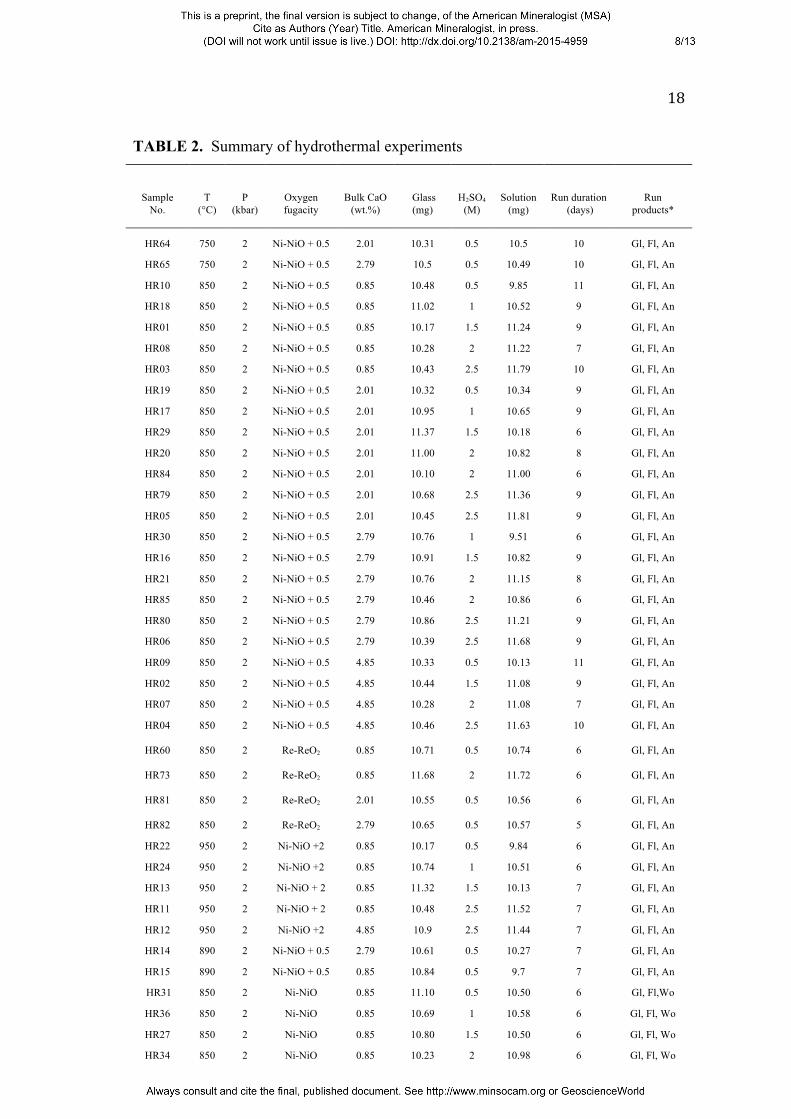
TABLE 2. Summary of hydrothermal experiments
Sample No.
T (°C)
P (kbar)
Oxygen fugacity
Bulk CaO (wt.%)
Glass (mg)
H2SO4 (M)
Solution (mg)
Run duration (days)
Run products*
HR64 750 2 Ni-NiO + 0.5 2.01 10.31 0.5 10.5 10 Gl, Fl, An
HR65 750 2 Ni-NiO + 0.5 2.79 10.5 0.5 10.49 10 Gl, Fl, An
HR10 850 2 Ni-NiO + 0.5 0.85 10.48 0.5 9.85 11 Gl, Fl, An
HR18 850 2 Ni-NiO + 0.5 0.85 11.02 1 10.52 9 Gl, Fl, An
HR01 850 2 Ni-NiO + 0.5 0.85 10.17 1.5 11.24 9 Gl, Fl, An
HR08 850 2 Ni-NiO + 0.5 0.85 10.28 2 11.22 7 Gl, Fl, An
HR03 850 2 Ni-NiO + 0.5 0.85 10.43 2.5 11.79 10 Gl, Fl, An
HR19 850 2 Ni-NiO + 0.5 2.01 10.32 0.5 10.34 9 Gl, Fl, An
HR17 850 2 Ni-NiO + 0.5 2.01 10.95 1 10.65 9 Gl, Fl, An
HR29 850 2 Ni-NiO + 0.5 2.01 11.37 1.5 10.18 6 Gl, Fl, An
HR20 850 2 Ni-NiO + 0.5 2.01 11.00 2 10.82 8 Gl, Fl, An
HR84 850 2 Ni-NiO + 0.5 2.01 10.10 2 11.00 6 Gl, Fl, An
HR79 850 2 Ni-NiO + 0.5 2.01 10.68 2.5 11.36 9 Gl, Fl, An
HR05 850 2 Ni-NiO + 0.5 2.01 10.45 2.5 11.81 9 Gl, Fl, An
HR30 850 2 Ni-NiO + 0.5 2.79 10.76 1 9.51 6 Gl, Fl, An
HR16 850 2 Ni-NiO + 0.5 2.79 10.91 1.5 10.82 9 Gl, Fl, An
HR21 850 2 Ni-NiO + 0.5 2.79 10.76 2 11.15 8 Gl, Fl, An
HR85 850 2 Ni-NiO + 0.5 2.79 10.46 2 10.86 6 Gl, Fl, An
HR80 850 2 Ni-NiO + 0.5 2.79 10.86 2.5 11.21 9 Gl, Fl, An
HR06 850 2 Ni-NiO + 0.5 2.79 10.39 2.5 11.68 9 Gl, Fl, An
HR09 850 2 Ni-NiO + 0.5 4.85 10.33 0.5 10.13 11 Gl, Fl, An
HR02 850 2 Ni-NiO + 0.5 4.85 10.44 1.5 11.08 9 Gl, Fl, An
HR07 850 2 Ni-NiO + 0.5 4.85 10.28 2 11.08 7 Gl, Fl, An
HR04 850 2 Ni-NiO + 0.5 4.85 10.46 2.5 11.63 10 Gl, Fl, An
HR60 850 2 Re-ReO2 0.85 10.71 0.5 10.74 6 Gl, Fl, An
HR73 850 2 Re-ReO2 0.85 11.68 2 11.72 6 Gl, Fl, An
HR81 850 2 Re-ReO2 2.01 10.55 0.5 10.56 6 Gl, Fl, An
HR82 850 2 Re-ReO2 2.79 10.65 0.5 10.57 5 Gl, Fl, An
HR22 950 2 Ni-NiO +2 0.85 10.17 0.5 9.84 6 Gl, Fl, An
HR24 950 2 Ni-NiO +2 0.85 10.74 1 10.51 6 Gl, Fl, An
HR13 950 2 Ni-NiO + 2 0.85 11.32 1.5 10.13 7 Gl, Fl, An
HR11 950 2 Ni-NiO + 2 0.85 10.48 2.5 11.52 7 Gl, Fl, An
HR12 950 2 Ni-NiO +2 4.85 10.9 2.5 11.44 7 Gl, Fl, An
HR14 890 2 Ni-NiO + 0.5 2.79 10.61 0.5 10.27 7 Gl, Fl, An
HR15 890 2 Ni-NiO + 0.5 0.85 10.84 0.5 9.7 7 Gl, Fl, An
HR31 850 2 Ni-NiO 0.85 11.10 0.5 10.50 6 Gl, Fl,Wo
HR36 850 2 Ni-NiO 0.85 10.69 1 10.58 6 Gl, Fl, Wo
HR27 850 2 Ni-NiO 0.85 10.80 1.5 10.50 6 Gl, Fl, Wo
HR34 850 2 Ni-NiO 0.85 10.23 2 10.98 6 Gl, Fl, Wo
19
HR66 850 2 Ni-NiO 0.85 11.06 2.5 11.45 6 Gl, Fl, Wo
HR32 850 2 Ni-NiO 2.01 10.87 0.5 10.41 6 Gl, Fl, Wo
HR83 850 2 Ni-NiO 2.01 10.32 0.5 10.00 7 Gl, Fl, Wo
HR25 850 2 Ni-NiO 2.01 11.2 1 10.7 6 Gl, Fl, Wo
HR54 850 2 Ni-NiO 2.01 10.57 1 10.42 6 Gl, Fl, Wo
HR28 850 2 Ni-NiO 2.01 10.29 1.5 10.90 6 Gl, Fl, Wo
HR35 850 2 Ni-NiO 2.01 10.43 2 11.15 6 Gl, Fl, Wo
HR67 850 2 Ni-NiO 2.01 10.56 2.5 11.46 6 Gl, Fl, Wo
HR33 850 2 Ni-NiO 2.79 10.49 0.5 10.31 6 Gl, Fl, Wo
HR26 850 2 Ni-NiO 2.79 10.59 1 10.42 6 Gl, Fl, Wo
HR55 850 2 Ni-NiO 2.79 10.65 1 10.53 6 Gl, Fl, Wo
HR39 850 2 Ni-NiO 2.79 10.49 1.5 10.97 6 Gl, Fl, Wo
HR68 850 2 Ni-NiO 2.79 11.45 2.5 11.37 6 Gl, Fl, Wo
HR37 850 2 Ni-NiO 4.02 10.04 1 9.61 6 Gl, Fl, Wo
HR40 850 2 Ni-NiO 4.02 11.50 1.5 11.04 6 Gl, Fl, Wo
HR43 850 2 Ni-NiO 4.02 11.29 2 11.61 7 Gl, Fl, Wo
HR69 850 2 Ni-NiO 4.02 10.75 2.5 11.27 6 Gl, Fl, Wo
HR38 850 2 Ni-NiO 4.85 10.28 1 10.36 6 Gl, Fl, Wo
HR41 850 2 Ni-NiO 4.85 10.22 1.5 10.70 7 Gl, Fl, Wo
HR44 850 2 Ni-NiO 4.85 10.60 2 11.11 7 Gl, Fl, Wo
HR62 850 2 Co-CoO 0.85 10.1 1 10.89 6 Gl, Fl, Wo
HR70 850 2 Co-CoO 0.85 10.74 1.5 11.39 6 Gl, Fl, Wo
HR75 850 2 Co-CoO 0.85 10.28 2 11.14 6 Gl, Fl, Wo
HR77 850 2 Co-CoO 0.85 10.17 2.5 11.36 6 Gl, Fl, Wo
HR61 850 2 Co-CoO 2.01 10.73 0.5 10.47 6 Gl, Fl, Wo
HR71 850 2 Co-CoO 2.01 10.25 1.5 11.44 6 Gl, Fl, Wo
HR76 850 2 Co-CoO 2.01 10.06 2 11.55 6 Gl, Fl, Wo
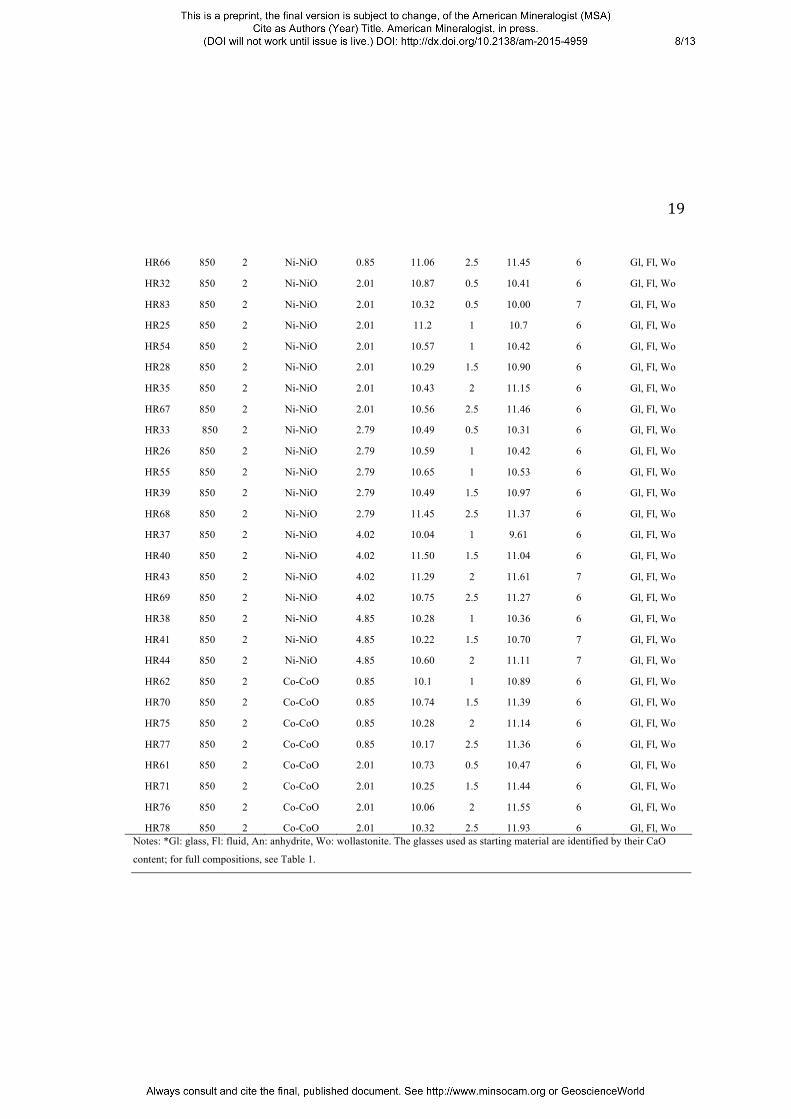
HR78 850 2 Co-CoO 2.01 10.32 2.5 11.93 6 Gl, Fl, Wo Notes: *Gl: glass, Fl: fluid, An: anhydrite, Wo: wollastonite. The glasses used as starting material are identified by their CaO
content; for full compositions, see Table 1.
20
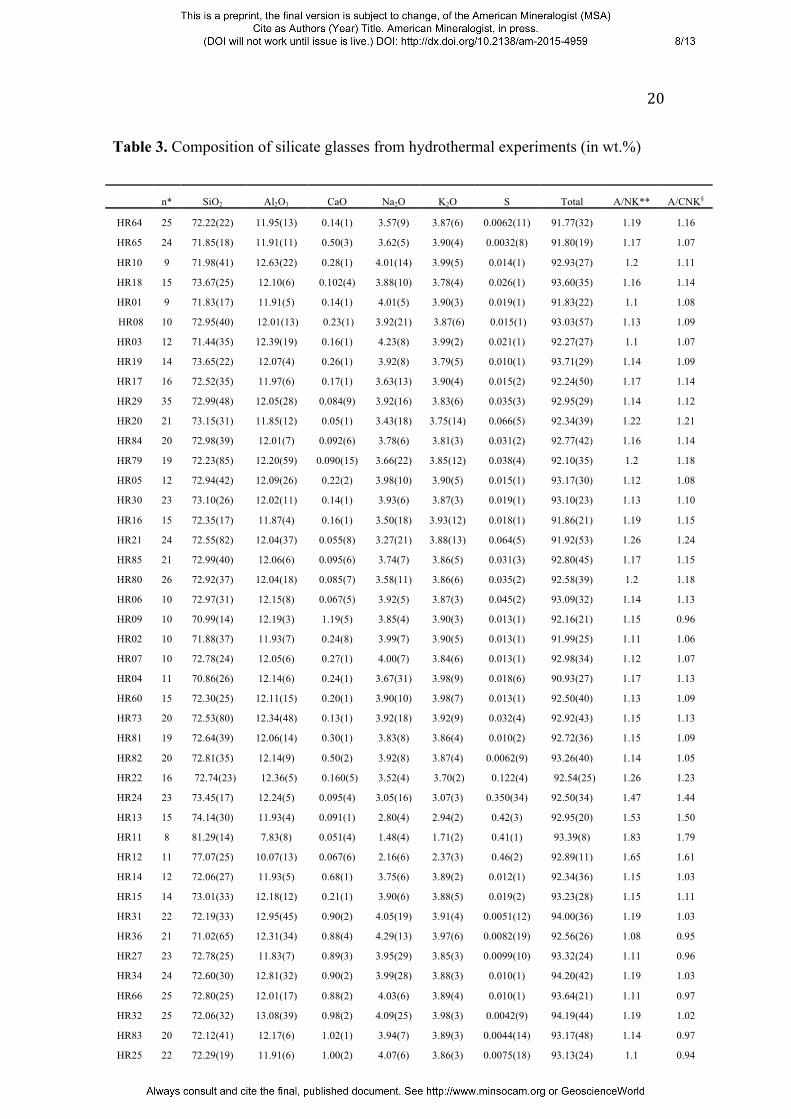
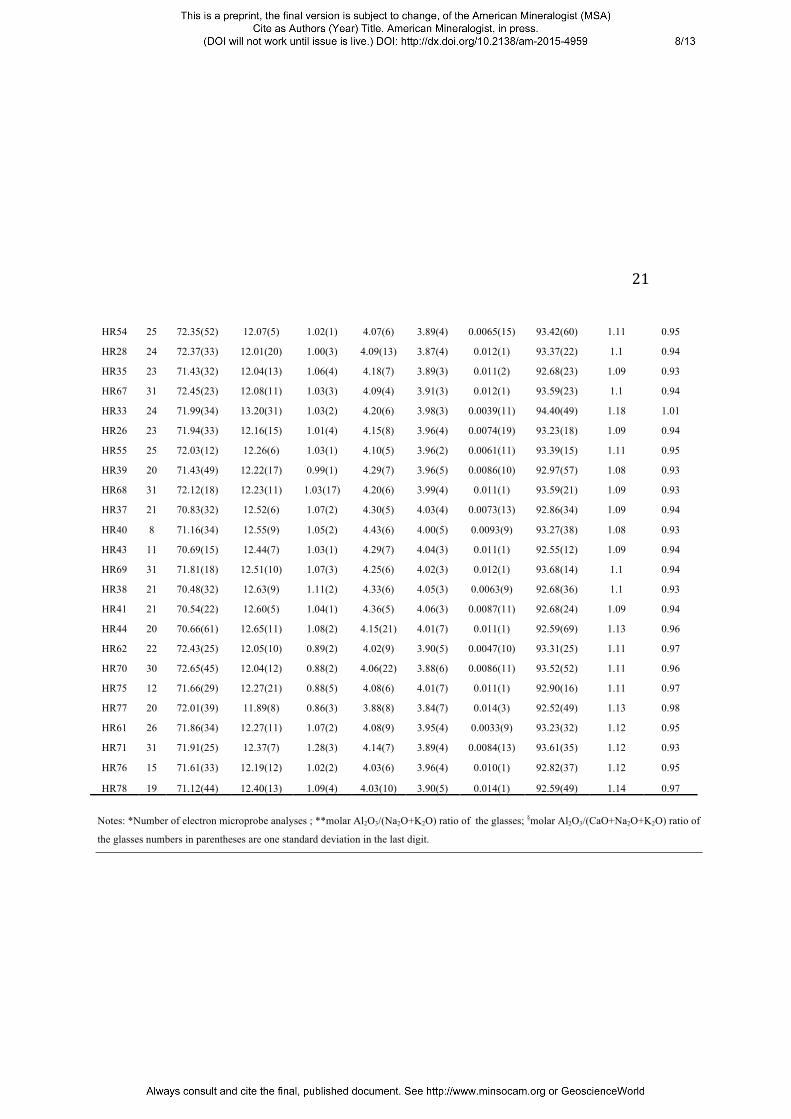
Table 3. Composition of silicate glasses from hydrothermal experiments (in wt.%)
n* SiO2 Al2O3 CaO Na2O K2O S Total A/NK** A/CNK§
HR64 25 72.22(22) 11.95(13) 0.14(1) 3.57(9) 3.87(6) 0.0062(11) 91.77(32) 1.19 1.16
HR65 24 71.85(18) 11.91(11) 0.50(3) 3.62(5) 3.90(4) 0.0032(8) 91.80(19) 1.17 1.07
HR10 9 71.98(41) 12.63(22) 0.28(1) 4.01(14) 3.99(5) 0.014(1) 92.93(27) 1.2 1.11
HR18 15 73.67(25) 12.10(6) 0.102(4) 3.88(10) 3.78(4) 0.026(1) 93.60(35) 1.16 1.14
HR01 9 71.83(17) 11.91(5) 0.14(1) 4.01(5) 3.90(3) 0.019(1) 91.83(22) 1.1 1.08
HR08 10 72.95(40) 12.01(13) 0.23(1) 3.92(21) 3.87(6) 0.015(1) 93.03(57) 1.13 1.09
HR03 12 71.44(35) 12.39(19) 0.16(1) 4.23(8) 3.99(2) 0.021(1) 92.27(27) 1.1 1.07
HR19 14 73.65(22) 12.07(4) 0.26(1) 3.92(8) 3.79(5) 0.010(1) 93.71(29) 1.14 1.09
HR17 16 72.52(35) 11.97(6) 0.17(1) 3.63(13) 3.90(4) 0.015(2) 92.24(50) 1.17 1.14
HR29 35 72.99(48) 12.05(28) 0.084(9) 3.92(16) 3.83(6) 0.035(3) 92.95(29) 1.14 1.12
HR20 21 73.15(31) 11.85(12) 0.05(1) 3.43(18) 3.75(14) 0.066(5) 92.34(39) 1.22 1.21
HR84 20 72.98(39) 12.01(7) 0.092(6) 3.78(6) 3.81(3) 0.031(2) 92.77(42) 1.16 1.14
HR79 19 72.23(85) 12.20(59) 0.090(15) 3.66(22) 3.85(12) 0.038(4) 92.10(35) 1.2 1.18
HR05 12 72.94(42) 12.09(26) 0.22(2) 3.98(10) 3.90(5) 0.015(1) 93.17(30) 1.12 1.08
HR30 23 73.10(26) 12.02(11) 0.14(1) 3.93(6) 3.87(3) 0.019(1) 93.10(23) 1.13 1.10
HR16 15 72.35(17) 11.87(4) 0.16(1) 3.50(18) 3.93(12) 0.018(1) 91.86(21) 1.19 1.15
HR21 24 72.55(82) 12.04(37) 0.055(8) 3.27(21) 3.88(13) 0.064(5) 91.92(53) 1.26 1.24
HR85 21 72.99(40) 12.06(6) 0.095(6) 3.74(7) 3.86(5) 0.031(3) 92.80(45) 1.17 1.15
HR80 26 72.92(37) 12.04(18) 0.085(7) 3.58(11) 3.86(6) 0.035(2) 92.58(39) 1.2 1.18
HR06 10 72.97(31) 12.15(8) 0.067(5) 3.92(5) 3.87(3) 0.045(2) 93.09(32) 1.14 1.13
HR09 10 70.99(14) 12.19(3) 1.19(5) 3.85(4) 3.90(3) 0.013(1) 92.16(21) 1.15 0.96
HR02 10 71.88(37) 11.93(7) 0.24(8) 3.99(7) 3.90(5) 0.013(1) 91.99(25) 1.11 1.06
HR07 10 72.78(24) 12.05(6) 0.27(1) 4.00(7) 3.84(6) 0.013(1) 92.98(34) 1.12 1.07
HR04 11 70.86(26) 12.14(6) 0.24(1) 3.67(31) 3.98(9) 0.018(6) 90.93(27) 1.17 1.13
HR60 15 72.30(25) 12.11(15) 0.20(1) 3.90(10) 3.98(7) 0.013(1) 92.50(40) 1.13 1.09
HR73 20 72.53(80) 12.34(48) 0.13(1) 3.92(18) 3.92(9) 0.032(4) 92.92(43) 1.15 1.13
HR81 19 72.64(39) 12.06(14) 0.30(1) 3.83(8) 3.86(4) 0.010(2) 92.72(36) 1.15 1.09
HR82 20 72.81(35) 12.14(9) 0.50(2) 3.92(8) 3.87(4) 0.0062(9) 93.26(40) 1.14 1.05
HR22 16 72.74(23) 12.36(5) 0.160(5) 3.52(4) 3.70(2) 0.122(4) 92.54(25) 1.26 1.23
HR24 23 73.45(17) 12.24(5) 0.095(4) 3.05(16) 3.07(3) 0.350(34) 92.50(34) 1.47 1.44
HR13 15 74.14(30) 11.93(4) 0.091(1) 2.80(4) 2.94(2) 0.42(3) 92.95(20) 1.53 1.50
HR11 8 81.29(14) 7.83(8) 0.051(4) 1.48(4) 1.71(2) 0.41(1) 93.39(8) 1.83 1.79
HR12 11 77.07(25) 10.07(13) 0.067(6) 2.16(6) 2.37(3) 0.46(2) 92.89(11) 1.65 1.61
HR14 12 72.06(27) 11.93(5) 0.68(1) 3.75(6) 3.89(2) 0.012(1) 92.34(36) 1.15 1.03
HR15 14 73.01(33) 12.18(12) 0.21(1) 3.90(6) 3.88(5) 0.019(2) 93.23(28) 1.15 1.11
HR31 22 72.19(33) 12.95(45) 0.90(2) 4.05(19) 3.91(4) 0.0051(12) 94.00(36) 1.19 1.03
HR36 21 71.02(65) 12.31(34) 0.88(4) 4.29(13) 3.97(6) 0.0082(19) 92.56(26) 1.08 0.95
HR27 23 72.78(25) 11.83(7) 0.89(3) 3.95(29) 3.85(3) 0.0099(10) 93.32(24) 1.11 0.96
HR34 24 72.60(30) 12.81(32) 0.90(2) 3.99(28) 3.88(3) 0.010(1) 94.20(42) 1.19 1.03
HR66 25 72.80(25) 12.01(17) 0.88(2) 4.03(6) 3.89(4) 0.010(1) 93.64(21) 1.11 0.97
HR32 25 72.06(32) 13.08(39) 0.98(2) 4.09(25) 3.98(3) 0.0042(9) 94.19(44) 1.19 1.02
HR83 20 72.12(41) 12.17(6) 1.02(1) 3.94(7) 3.89(3) 0.0044(14) 93.17(48) 1.14 0.97
HR25 22 72.29(19) 11.91(6) 1.00(2) 4.07(6) 3.86(3) 0.0075(18) 93.13(24) 1.1 0.94
21
Notes: *Number of electron microprobe analyses ; **molar Al2O3/(Na2O+K2O) ratio of the glasses; §molar Al2O3/(CaO+Na2O+K2O) ratio of
the glasses numbers in parentheses are one standard deviation in the last digit.
HR54 25 72.35(52) 12.07(5) 1.02(1) 4.07(6) 3.89(4) 0.0065(15) 93.42(60) 1.11 0.95
HR28 24 72.37(33) 12.01(20) 1.00(3) 4.09(13) 3.87(4) 0.012(1) 93.37(22) 1.1 0.94
HR35 23 71.43(32) 12.04(13) 1.06(4) 4.18(7) 3.89(3) 0.011(2) 92.68(23) 1.09 0.93
HR67 31 72.45(23) 12.08(11) 1.03(3) 4.09(4) 3.91(3) 0.012(1) 93.59(23) 1.1 0.94
HR33 24 71.99(34) 13.20(31) 1.03(2) 4.20(6) 3.98(3) 0.0039(11) 94.40(49) 1.18 1.01
HR26 23 71.94(33) 12.16(15) 1.01(4) 4.15(8) 3.96(4) 0.0074(19) 93.23(18) 1.09 0.94
HR55 25 72.03(12) 12.26(6) 1.03(1) 4.10(5) 3.96(2) 0.0061(11) 93.39(15) 1.11 0.95
HR39 20 71.43(49) 12.22(17) 0.99(1) 4.29(7) 3.96(5) 0.0086(10) 92.97(57) 1.08 0.93
HR68 31 72.12(18) 12.23(11) 1.03(17) 4.20(6) 3.99(4) 0.011(1) 93.59(21) 1.09 0.93
HR37 21 70.83(32) 12.52(6) 1.07(2) 4.30(5) 4.03(4) 0.0073(13) 92.86(34) 1.09 0.94
HR40 8 71.16(34) 12.55(9) 1.05(2) 4.43(6) 4.00(5) 0.0093(9) 93.27(38) 1.08 0.93
HR43 11 70.69(15) 12.44(7) 1.03(1) 4.29(7) 4.04(3) 0.011(1) 92.55(12) 1.09 0.94
HR69 31 71.81(18) 12.51(10) 1.07(3) 4.25(6) 4.02(3) 0.012(1) 93.68(14) 1.1 0.94
HR38 21 70.48(32) 12.63(9) 1.11(2) 4.33(6) 4.05(3) 0.0063(9) 92.68(36) 1.1 0.93
HR41 21 70.54(22) 12.60(5) 1.04(1) 4.36(5) 4.06(3) 0.0087(11) 92.68(24) 1.09 0.94
HR44 20 70.66(61) 12.65(11) 1.08(2) 4.15(21) 4.01(7) 0.011(1) 92.59(69) 1.13 0.96
HR62 22 72.43(25) 12.05(10) 0.89(2) 4.02(9) 3.90(5) 0.0047(10) 93.31(25) 1.11 0.97
HR70 30 72.65(45) 12.04(12) 0.88(2) 4.06(22) 3.88(6) 0.0086(11) 93.52(52) 1.11 0.96
HR75 12 71.66(29) 12.27(21) 0.88(5) 4.08(6) 4.01(7) 0.011(1) 92.90(16) 1.11 0.97
HR77 20 72.01(39) 11.89(8) 0.86(3) 3.88(8) 3.84(7) 0.014(3) 92.52(49) 1.13 0.98
HR61 26 71.86(34) 12.27(11) 1.07(2) 4.08(9) 3.95(4) 0.0033(9) 93.23(32) 1.12 0.95
HR71 31 71.91(25) 12.37(7) 1.28(3) 4.14(7) 3.89(4) 0.0084(13) 93.61(35) 1.12 0.93
HR76 15 71.61(33) 12.19(12) 1.02(2) 4.03(6) 3.96(4) 0.010(1) 92.82(37) 1.12 0.95
HR78 19 71.12(44) 12.40(13) 1.09(4) 4.03(10) 3.90(5) 0.014(1) 92.59(49) 1.14 0.97
22
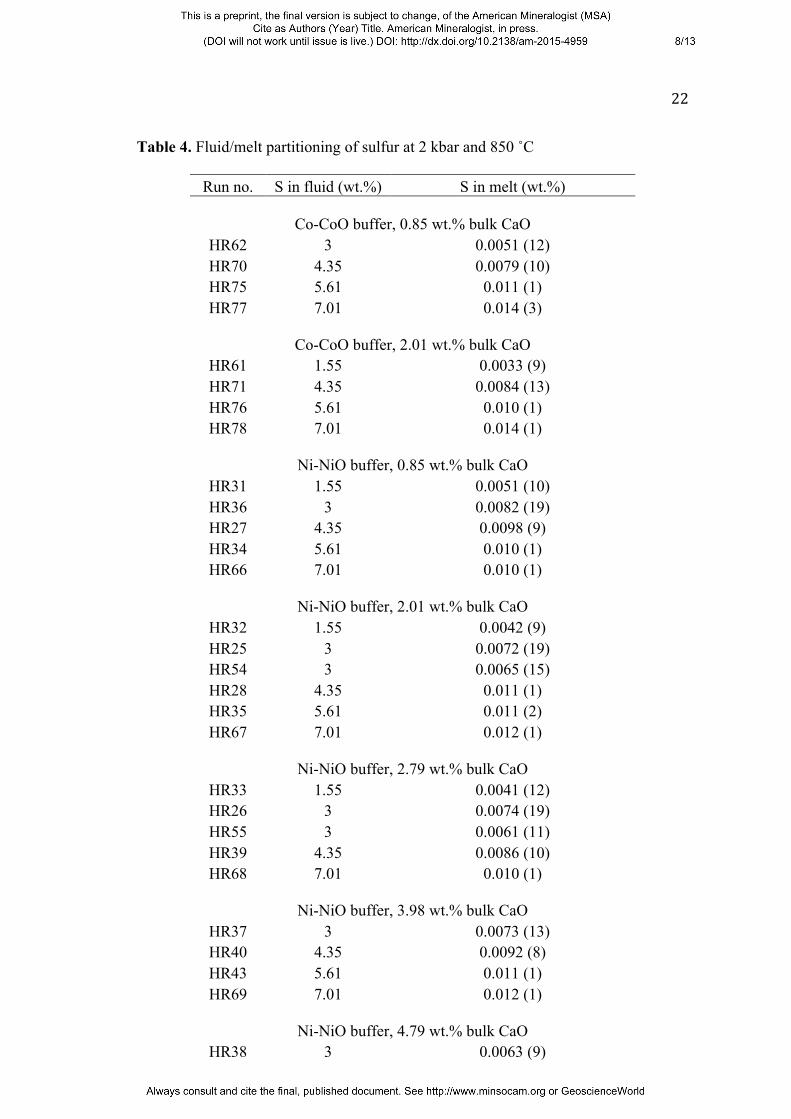
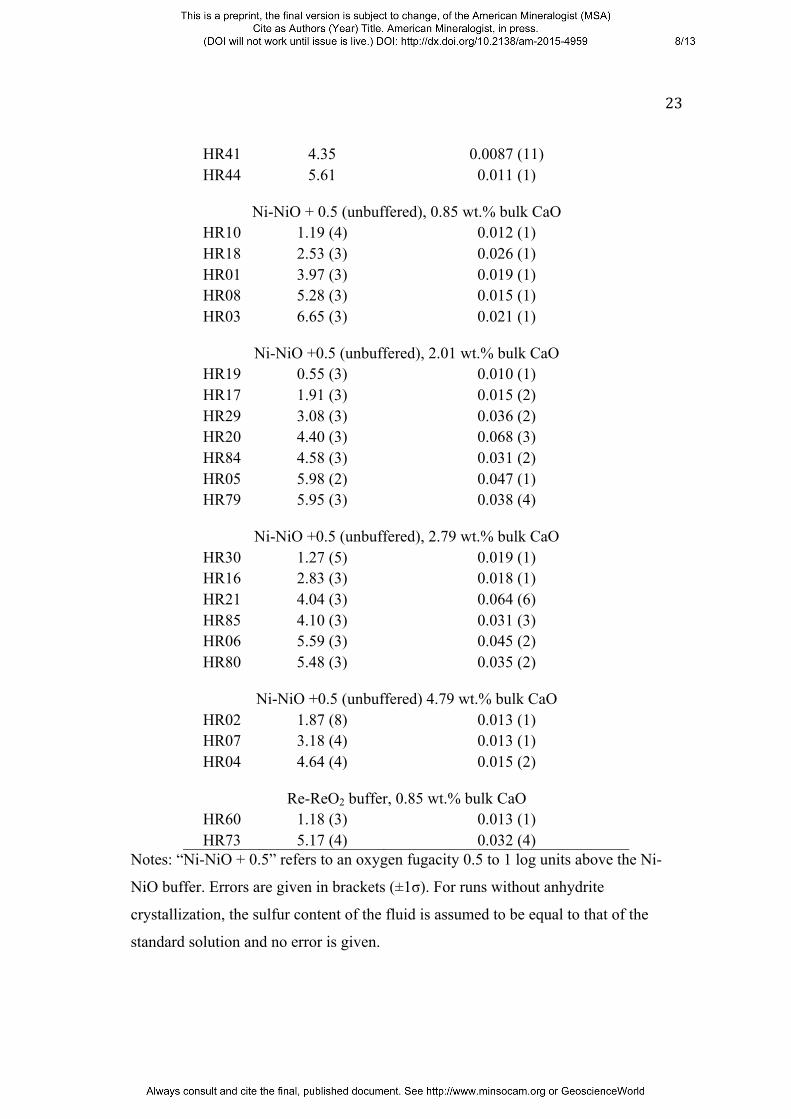
Table 4. Fluid/melt partitioning of sulfur at 2 kbar and 850 ˚C
Run no. S in fluid (wt.%) S in melt (wt.%)
Co-CoO buffer, 0.85 wt.% bulk CaO HR62 3 0.0051 (12) HR70 4.35 0.0079 (10) HR75 5.61 0.011 (1) HR77 7.01 0.014 (3)
Co-CoO buffer, 2.01 wt.% bulk CaO
HR61 1.55 0.0033 (9) HR71 4.35 0.0084 (13) HR76 5.61 0.010 (1) HR78 7.01 0.014 (1)
Ni-NiO buffer, 0.85 wt.% bulk CaO
HR31 1.55 0.0051 (10) HR36 3 0.0082 (19) HR27 4.35 0.0098 (9) HR34 5.61 0.010 (1) HR66 7.01 0.010 (1)
Ni-NiO buffer, 2.01 wt.% bulk CaO
HR32 1.55 0.0042 (9) HR25 3 0.0072 (19) HR54 3 0.0065 (15) HR28 4.35 0.011 (1) HR35 5.61 0.011 (2) HR67 7.01 0.012 (1)
Ni-NiO buffer, 2.79 wt.% bulk CaO
HR33 1.55 0.0041 (12) HR26 3 0.0074 (19) HR55 3 0.0061 (11) HR39 4.35 0.0086 (10) HR68 7.01 0.010 (1)
Ni-NiO buffer, 3.98 wt.% bulk CaO
HR37 3 0.0073 (13) HR40 4.35 0.0092 (8) HR43 5.61 0.011 (1) HR69 7.01 0.012 (1)
Ni-NiO buffer, 4.79 wt.% bulk CaO
HR38 3 0.0063 (9)
23
HR41 4.35 0.0087 (11) HR44 5.61 0.011 (1)
Ni-NiO + 0.5 (unbuffered), 0.85 wt.% bulk CaO
HR10 1.19 (4) 0.012 (1) HR18 2.53 (3) 0.026 (1) HR01 3.97 (3) 0.019 (1) HR08 5.28 (3) 0.015 (1) HR03 6.65 (3) 0.021 (1)
Ni-NiO +0.5 (unbuffered), 2.01 wt.% bulk CaO
HR19 0.55 (3) 0.010 (1) HR17 1.91 (3) 0.015 (2) HR29 3.08 (3) 0.036 (2) HR20 4.40 (3) 0.068 (3) HR84 4.58 (3) 0.031 (2) HR05 5.98 (2) 0.047 (1) HR79 5.95 (3) 0.038 (4)
Ni-NiO +0.5 (unbuffered), 2.79 wt.% bulk CaO
HR30 1.27 (5) 0.019 (1) HR16 2.83 (3) 0.018 (1) HR21 4.04 (3) 0.064 (6) HR85 4.10 (3) 0.031 (3) HR06 5.59 (3) 0.045 (2) HR80 5.48 (3) 0.035 (2)
Ni-NiO +0.5 (unbuffered) 4.79 wt.% bulk CaO
HR02 1.87 (8) 0.013 (1) HR07 3.18 (4) 0.013 (1) HR04 4.64 (4) 0.015 (2)
Re-ReO2 buffer, 0.85 wt.% bulk CaO
HR60 1.18 (3) 0.013 (1) HR73 5.17 (4) 0.032 (4)
Notes: “Ni-NiO + 0.5” refers to an oxygen fugacity 0.5 to 1 log units above the Ni-
NiO buffer. Errors are given in brackets (±1σ). For runs without anhydrite
crystallization, the sulfur content of the fluid is assumed to be equal to that of the
standard solution and no error is given.

24
FIGURE 1. Images of run products as seen in transmitted light under a microscope.
(a) Unbuffered experiment HR 29, showing blocky crystals of anhydrite together with
dark fluid inclusions in a glass matrix; (b) experiment HR61 at the Co-CoO buffer,
showing needles of wollastonite together with two-phase fluid inclusions in a glass
matrix.
FIGURE 2. Raman spectra of the liquid phase of fluid inclusions in quenched glasses
(a) unbuffered experiment HR08, (b) experiment HR27, buffered at Ni-NiO.
25
FIGURE 3. Inverse correlation between SO3 and CaO contents in silicate melts
coexisting with anhydrite at 850 ˚C and 2 kbar. Ni-NiO + 0.5 refers to an oxygen
fugacity 0.5 to 1 log unit above the Ni-NiO buffer. Errors (1σ) are from microprobe
measurements.
FIGURE 4. Solubility product [CaO][SO3] (in molar fractions) in silicate melts
coexisting with anhydrite. All data are from experiments at 850 ˚C and 2 kbar. Ni-
NiO + 0.5 refers to an oxygen fugacity 0.5 to 1 log unit above the Ni-NiO buffer.
Errors (1σ) are from microprobe measurements.
26
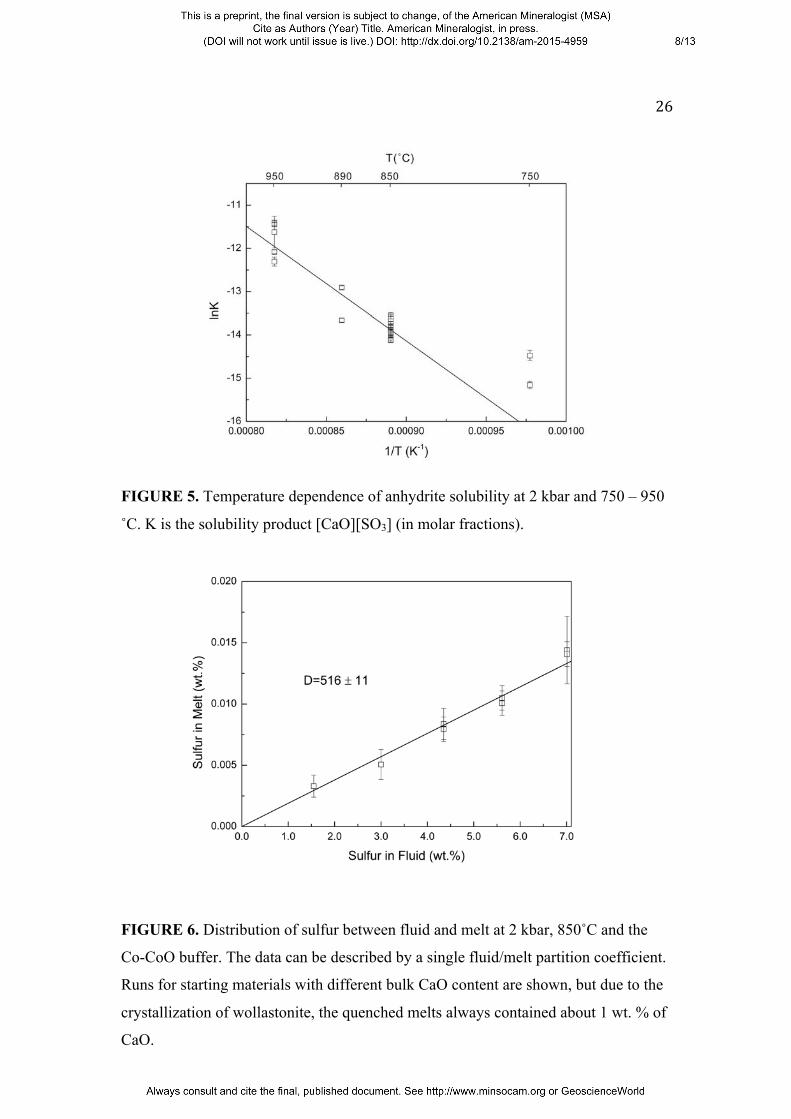
FIGURE 5. Temperature dependence of anhydrite solubility at 2 kbar and 750 – 950
˚C. K is the solubility product [CaO][SO3] (in molar fractions).
FIGURE 6. Distribution of sulfur between fluid and melt at 2 kbar, 850˚C and the
Co-CoO buffer. The data can be described by a single fluid/melt partition coefficient.
Runs for starting materials with different bulk CaO content are shown, but due to the
crystallization of wollastonite, the quenched melts always contained about 1 wt. % of
CaO.
27
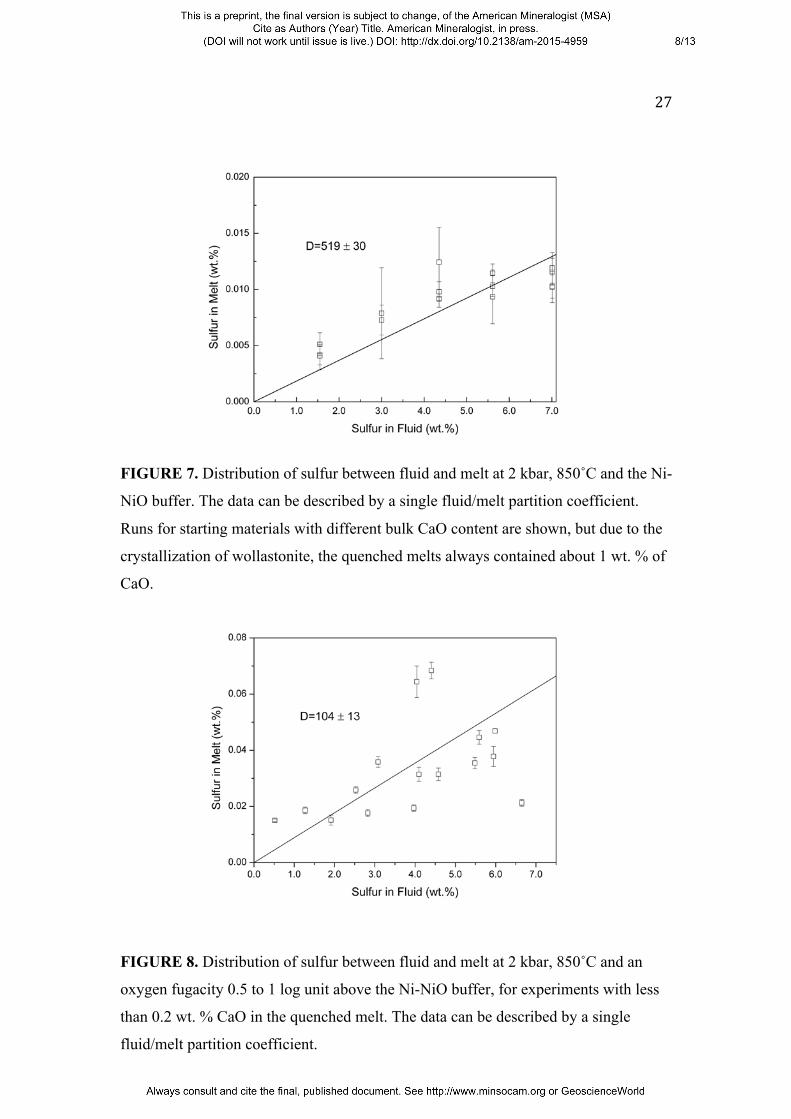
FIGURE 7. Distribution of sulfur between fluid and melt at 2 kbar, 850˚C and the Ni-
NiO buffer. The data can be described by a single fluid/melt partition coefficient.
Runs for starting materials with different bulk CaO content are shown, but due to the
crystallization of wollastonite, the quenched melts always contained about 1 wt. % of
CaO.
FIGURE 8. Distribution of sulfur between fluid and melt at 2 kbar, 850˚C and an
oxygen fugacity 0.5 to 1 log unit above the Ni-NiO buffer, for experiments with less
than 0.2 wt. % CaO in the quenched melt. The data can be described by a single
fluid/melt partition coefficient.
28
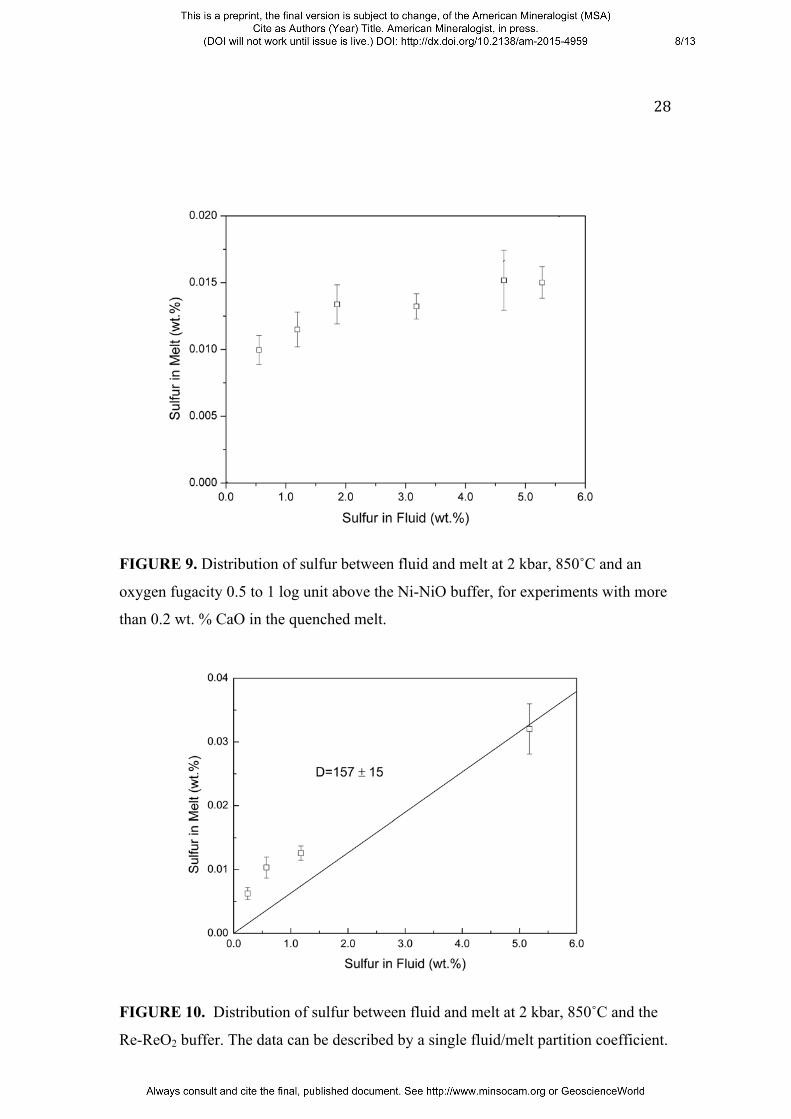
FIGURE 9. Distribution of sulfur between fluid and melt at 2 kbar, 850˚C and an
oxygen fugacity 0.5 to 1 log unit above the Ni-NiO buffer, for experiments with more
than 0.2 wt. % CaO in the quenched melt.
FIGURE 10. Distribution of sulfur between fluid and melt at 2 kbar, 850˚C and the
Re-ReO2 buffer. The data can be described by a single fluid/melt partition coefficient.
29
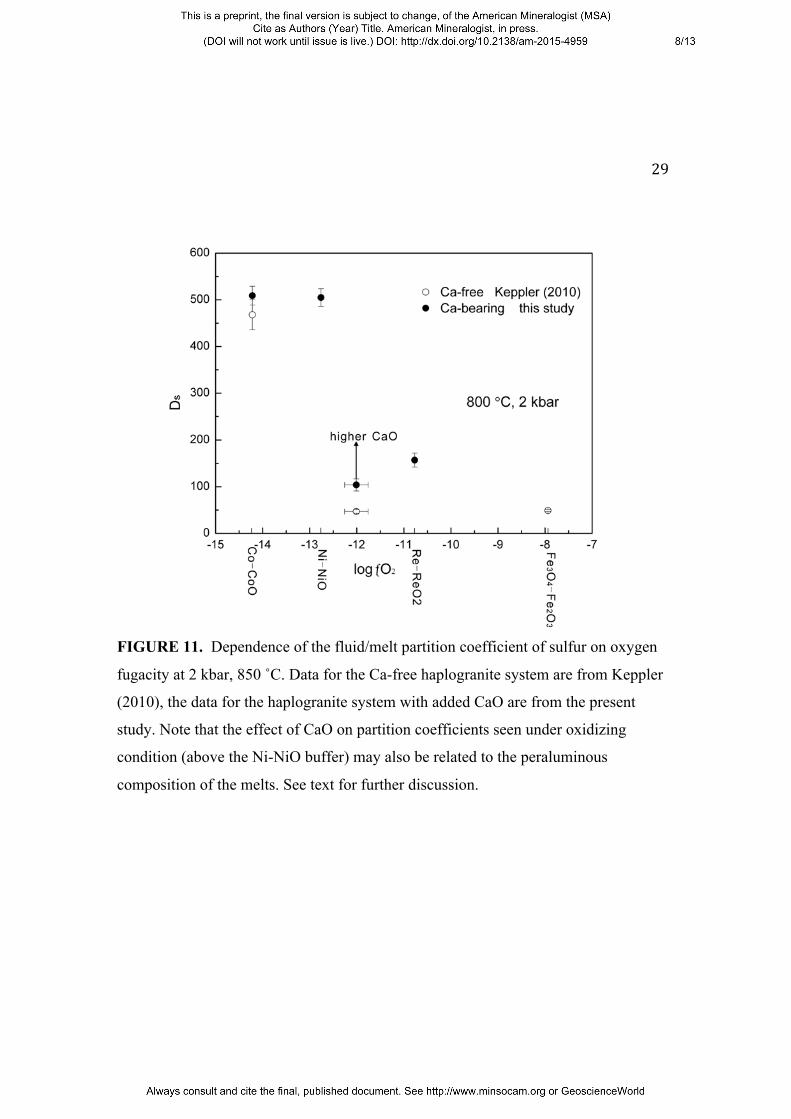
FIGURE 11. Dependence of the fluid/melt partition coefficient of sulfur on oxygen
fugacity at 2 kbar, 850 ˚C. Data for the Ca-free haplogranite system are from Keppler
(2010), the data for the haplogranite system with added CaO are from the present
study. Note that the effect of CaO on partition coefficients seen under oxidizing
condition (above the Ni-NiO buffer) may also be related to the peraluminous
composition of the melts. See text for further discussion.
30
FIGURE 12. Effect of calcium on the behavior of sulfur in felsic melts under
oxidizing conditions. The calculations assume a bulk concentration of sulfur in the
system of 1000 ppm (equivalent to 2500 ppm SO3), which is assumed to be
completely in the S6+ state in the melt. D is the fluid/melt partition coefficient of
sulfur.