manuscript - ghent university · international comparisons 2 8department of psychology,...
TRANSCRIPT

International Comparisons 1
Running head: International Comparisons
International Comparisons of Behavioral and Emotional Problems in Preschool Children:
Parents’ Reports from 24 Societies
Leslie A. Rescorla1, Thomas M. Achenbach
2, Masha Y. Ivanova
2, Valerie S. Harder
2, Laura
Otten1, Niels Bilenberg
3, Gudrun Bjarnadottir
4, Christiane Capron
5, Sarah S.W. De Pauw
6, Pedro
Dias7, Anca Dobrean
8, Manfred Döpfner
9, Michel Duyme
10, Valsamma Eapen
11, Nese Erol
12,
Elaheh Mohammad Esmaeili13
, Lourdes Ezpeleta14
, Alessandra Frigerio15
, Daniel S.S. Fung16
,
Miguel Gonçalves17
, Halldór Guðmundsson18
, Suh-Fang Jeng19
, Roma Jusiene20
, Young Ah
Kim21
, Solvejg Kristensen3, Jianghong Liu
22, Felipe Lecannelier
23, Patrick W.L. Leung
24,
Bárbara César Machado7, Rosario Montirosso
15, Kyung Ja Oh
25, Yoon Phaik Ooi
16, Julia Plück
9,
Rolando Pomalima26
, Jetishi Pranvera27
, Mimoza Shahini28
, Jaime R. Silva29
, Zeynep Simsek30
,
Andre Sourander31
, José Valverde26
, Jan van der Ende32
, Karla G. Van Leeuwen33
, Yen-Tzu
Wu34
, Sema Yurdusen35
Stephen R. Zubrick36
, and Frank C. Verhulst32
1 Department of Psychology, Bryn Mawr College,
2Department of Psychiatry, University of
Vermont, 3Department of Child and Adolescent Psychiatry, University of Southern Denmark,
4Glaesibaer Health Clinic,
5Department of Psychology, University of Montpellier 3, 6Department
of Developmental, Personality, and Social Psychology, Ghent University, 7Faculty of Education
and Psychology, Center for Studies in Human Development, Catholic University of Portugal,
Manuscript

International Comparisons 2
8Department of Psychology, Babes-Bolyai University,
9Department of Child and Adolescent
Psychiatry and Psychotherapy, University of Cologne, 10
Department of Epidemiology, University
of Montpellier 1, CNRS, 11
Academic Unit of Child Psychiatry South West Sydney (AUCS),
University of New South Wales, 12Department of Child and Adolescent Psychiatry, Ankara
University, 13
Tehran Institute for Exceptional Children, 14
Department of Clinical and Health
Psychology, Universitat Autònoma de Barcelona, 15
Scientific Institute "E. Medea," Bosisio
Parini (LC), 16
Department of Child and Adolescent Psychiatry, Institute of Mental Health,
Singapore, 17
Department of Psychology, University of Minho, 18
Faculty of Social Work,
University of Iceland, 19
School and Graduate Institute of Physical Therapy, National Taiwan
University College of Medicine; Physical Therapy Center, National Taiwan University Hospital,
20Department of General Psychology, Vilnius University,
21Huno Consulting,
22School of
Nursing, University of Pennsylvania, 23
Faculty of Psychology, Center for Developmental Studies
and Intervention of the Child, University of Desarrollo, 24
Department of Psychology, Chinese
University of Hong Kong, 25
Department of Psychology, Yonsei University, 26
Peruvian National
Institute of Mental Health, 27
Faculty of Psychology, University of Dardania, 28
University
Clinical Center of Kosovo, 29
Faculty of Medicine, Universidad de la Frontera, 30
Department of
Public Health, Harran University, 31
Department of Child Psychiatry, Turku University and Turku
University Hospital, 32
Department of Child and Adolescent Psychiatry, Erasmus University
Medical Center-Sophia Children’s Hospital, 33
Faculty of Psychology and Educational Sciences,
Leuven University, 34
School and Graduate Institute of Physical Therapy, National Taiwan
University College of Medicine, 35Department of Child and Adolescent Psychiatry, Hacettepe
University, 36
Centre for Child Health Research, University of Western Australia

International Comparisons 3
Abstract
International comparisons were conducted of preschool children’s behavioral and
emotional problems as reported on the CBCL/1½-5 by parents in 24 societies (N = 19,850). Item
ratings were aggregated into scores on syndromes, DSM-oriented scales, a Stress Problems scale,
and Internalizing, Externalizing, and Total Problems scales. Effect sizes for scale score
differences among the 24 societies ranged from small to medium (3%-12%). Although societies
differed greatly in language, culture, and other characteristics, Total Problems scores for 18 of
the 24 societies were within 7.1 points of the omnicultural mean of 33.3 (on a scale of 0 to 198).
Gender and age differences, as well as gender and age interactions with society, were all very
small (effect sizes <1%). Across all pairs of societies, correlations between mean item ratings
averaged .78, and correlations between internal consistency alphas for the scales averaged .92,
indicating that the rank orders of mean item ratings and of internal consistencies of scales were
very similar across diverse societies.
Keywords: preschoolers, international comparisons, behavioral/emotional problems,
CBCL, parents’ reports
International Comparisons 4
International Comparisons of Behavioral and Emotional Problems in Preschool Children:
Parents’ Reports from 24 Societies
Preschool children’s behavioral and emotional problems have received much less
research attention than older children’s behavioral and emotional problems (Campbell, 2002;
Egger & Angold, 2006). Egger and Angold’s (2006) review of epidemiological research on
diagnoses in preschoolers identified only four studies, all done in the USA. Two studies (Earls,
1982; Keenan, Shaw, Walsh, Delliquadri, & Giovannelli, 1997) included fewer than 150
children, while two had larger samples (Egger et al., 2006; Lavigne et al., 1993). Across these
four studies, prevalence for “any disorder” ranged from 14% to 26%. Lavigne, Le Bailly,
Hopkins, Gouze, and Binns (2009) subsequently published a fifth study from the USA. In their
sample of 796 4-year-olds in metropolitan Chicago, prevalence rates for various disorders ranged
from <0.1% to 13%, depending on the disorder as well as on the impairment criterion used.
One reason for widely varying prevalence rates is that troubling behaviors displayed by
most preschoolers with diagnosable disorders (except perhaps autism) differ mainly in degree
from behaviors manifested by typical preschoolers. That is, preschoolers generally come to
clinical attention because they are overly aggressive, hyperactive, defiant, anxious, volatile,
disruptive, stubborn, or distractible, but these behaviors are quite common in typically
developing preschoolers (Campbell, 2002, Wakschlag et al., 2007).
To distinguish levels of problems that are typical for preschoolers from levels that are
extreme enough to warrant clinical attention, data from general population samples are needed to
establish the prevalence of problems. Furthermore, multicultural data are required to identify
possible differences in the prevalence of particular kinds of problems across different cultural
groups. Instruments such as the Child Behavior Checklist for Ages 1½-5 (CBCL/1½-5;

International Comparisons 5
Achenbach & Rescorla, 2000) and the Strengths and Difficulties Questionnaire (SDQ; Goodman,
1997) are well-suited to large-scale investigations of children’s problems because they are
inexpensive, do not require training to administer, can be self-administered, and yield
quantitative scores.
Findings for the CBCL/2-3, the predecessor of the CBCL/ 1½-5, were presented by
Achenbach (1992), who reported a mean Total Problems score of 34.4 for 368 preschoolers from
a USA general population sample. Mean Total Problems scores of 27.5 were reported for 109
Icelandic children (Hannesdóttir & Einarsdóttir, 1995) and of 30.4 for 374 Finnish children
(Sourander, 2001). Erol, Simsek, Oner, and Munir (2005) reported a mean CBCL/2-3 Total
Problems score of 39.5 for a nationally representative sample of 638 Turkish children. For a
sample of 684 3-year-olds in the United Arab Emirates (UAE), Eapen, Yunis, Zoubeidi, and
Sabri (2004) reported a mean CBCL/2-3 Total Problems score of 34.6 for boys and 30.8 for girls.
In the Netherlands, Van den Oord, Koot, Boomsma, Verhulst, and Orlebeke (1995) obtained
mean CBCL/2-3 Total Problems scores of 34.4 for boys and 32.3 for girls (N = 420).
When the CBCL/2-3 was revised to span ages 1½-5 (Achenbach & Rescorla, 2000), two
items were changed, new normative and clinical samples were obtained, and new factor analyses
yielded a 7-syndrome model. To norm the CBCL/1½-5, a national probability sample of 744 18-
to 71- month-olds, which closely matched the demographics of the USA population according to
census data, was obtained by sampling households from 40 states. Data were obtained via home
interviews (completion rate = 94%). Consistent with the procedures used to norm other versions
of the CBCL (Achenbach & Rescorla, 2000), the children who had received mental health or
special education services in the preceding 12 months (5% of the sample) were excluded when
deriving norms, to yield what epidemiologists term a “healthy sample.” Mean Total Problems
International Comparisons 6
score was 33.3, with minimal age and gender differences (Achenbach & Rescorla, 2000). Four
international studies have also reported Total Problems scores for the CBCL/1½-5. Kristensen,
Henriksen, and Bilenberg (2010) reported a mean Total Problems score of only 17.3 for 850
Danish children, whereas Total Problems scores of 30.5 have been reported for 672 Dutch
children (Tick, van der Ende, Koot, & Verhulst, 2007), of 33.4 for 466 Italian children (Frigerio
et al., 2006), and of 33.6 for 1,385 Chinese children (Liu et al., 2010).
To our knowledge, multicultural comparisons of preschoolers’ problem scores have not
been conducted to date. However, multicultural comparisons of problems among 6- to 16-year-
olds (N = 55,508) have indicated considerable similarity in findings across 31 societies (Rescorla
et al., 2007). Although societal groups had an 8% effect size (ES) on Total Problems scores, 19
of 31 societies had a mean Total Problems score within 5.7 points of the omnicultural mean of
22.5 on a scale that could range from 0 to 224. Correlations between societies for mean item
ratings averaged .74, and internal consistency alpha coefficients were very similar across
societies. Age and gender effects, all small, were also quite consistent across societies.
The Rescorla et al. (2007) study was etic in orientation, meaning that the same instrument
was used to measure behavioral and emotional problems in many different societies. This
contrasts with emic research, whereby the meanings of items are explored in different societies.
When etic research reveals important differences between societies, emic research may
illuminate possible reasons for those differences. Because, to our knowledge, no rigorous
comparisons of preschoolers’ behavioral and emotional problems across many societies have
been published, etic studies are needed.
Purpose of the Present Study
The present study conducted multicultural comparisons of parent-reported CBCL scores

International Comparisons 7
for 19,850 1½- to 5-year-olds from 24 societies. In a related study, Ivanova et al. (2010)
conducted confirmatory factor analyses (CFAs) of data from the 23 non-USA societies. The CFA
procedure applied was the “weighted least squares with standard errors and mean- and variance-
adjusted chi-square estimator” (WLSMV) on tetrachoric correlations of 0 vs. 1 and 2 item
ratings. This was the same procedure Achenbach and Rescorla (2000) applied to the 7-syndrome
model in the USA. Although the Ivanova et al. (2010) findings supported the USA CBCL 7-
syndrome model in all 23 samples, this does not mean that scores on the syndromes or on other
scales would be similar in all the societies. An important purpose of our study was therefore to
determine the magnitude of differences between societies on each scale and to identify societies
that had particularly low or high scale scores. Whether or not societies differed much in scale
scores, societal differences in gender roles and in customs related to children’s age argued for
testing interactions between gender, age, and society in our analyses. Because societies might
also differ in the kinds of problems that parents rated high versus low, we tested these
differences by computing correlations between the mean ratings of the 99 items in each society
versus each other society. Finally, to measure societal variations in internal consistencies of scale
scores, we computed correlations between Cronbach’s alpha coefficients on all scales for each
society versus every other society.
Method
Samples
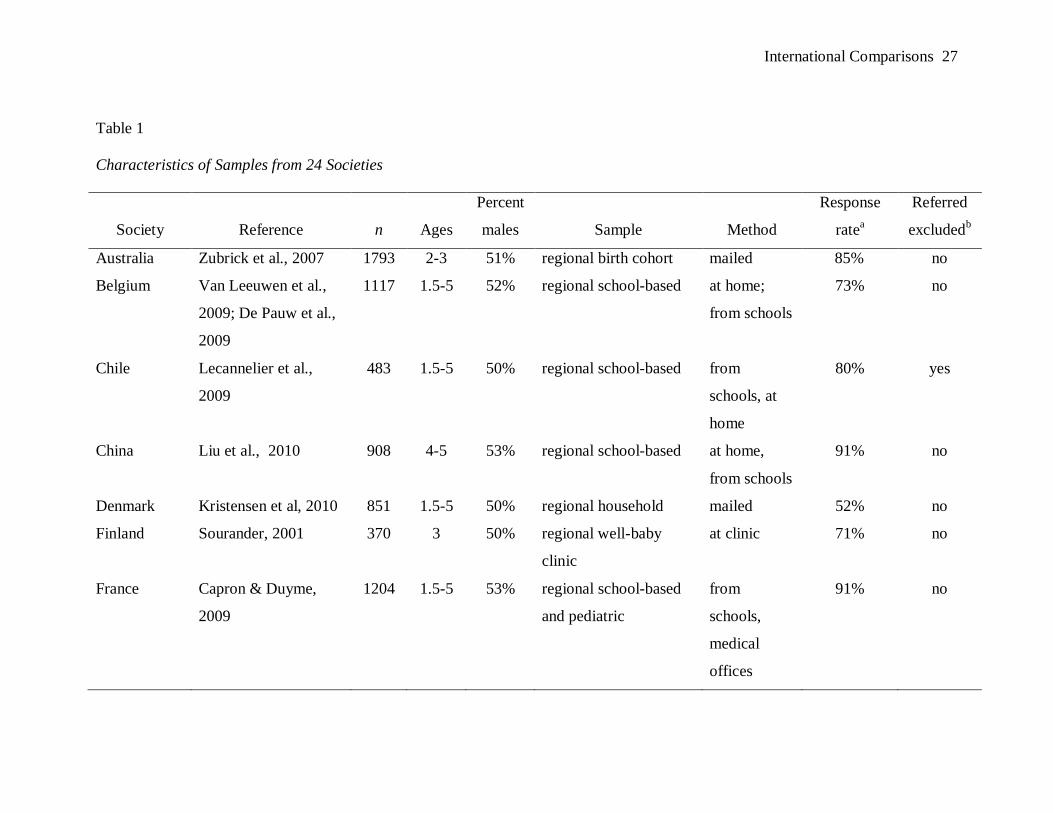
As presented in Table 1, samples were obtained from 24 societies, with Ns ranging from
301 for Singapore to 2,327 for Korea. Following the recommendation of Nunnally and Bernstein
(1994), we required a minimum N of 300 per society. The total sample comprised 19,850
children ages 1½ to 5, but the full age range was not represented in eight societies. Boys
International Comparisons 8
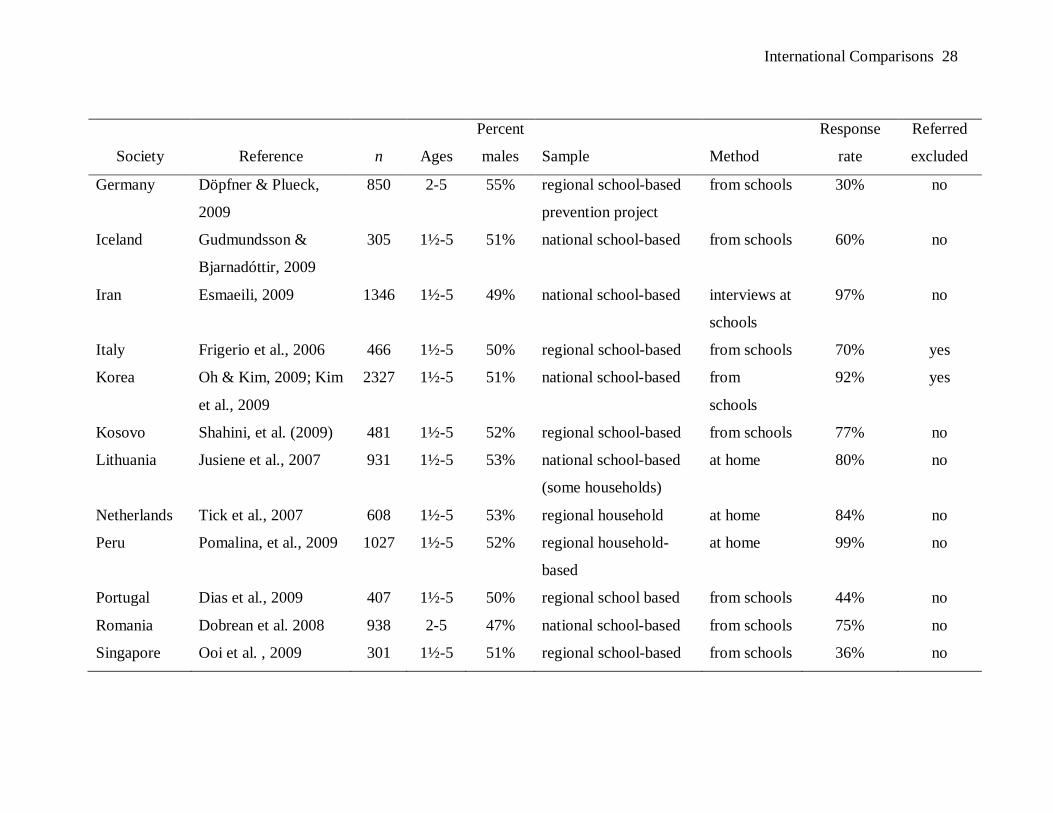
comprised from 47% to 55% of the samples. The sampling frame was national in eight societies
and regional in 16 societies. CBCLs were either mailed to parents, sent home from schools,
completed at school, or completed at home in the presence of a research assistant or during an
interview. Response rates varied widely, ranging from 30% in Germany to 99% in Peru. In most
of the data sets sent to us for analysis, children referred for mental health or special education
services had not been excluded or counted. In a few data sets, they were included and coded as
such, and in four samples they had been explicitly excluded. In each society, conventions for
obtaining informed consent required by the investigator’s research institution were followed.
Cases were identified only by numerical codes. Based on procedures used in norming the CBCL
(Achenbach & Rescorla, 2000), children were excluded if ratings were missing for > 8 problem
items, with < 1% of cases excluded for 22 societies and 2-3%% excluded for two societies.
Measure
The CBCL/1½-5 was used for all children in 21 societies. The CBCL/2-3 was used in the
UAE, Finland, and for 625 children in the Turkish sample, as these data were collected prior to
2000. The Turkish sample included 200 additional children assessed with the CBCL/1½-5 at a
later date. When the CBCL/2-3 was revised, items 51 and 79 were replaced by new items 51.
Shows panic for no good reason and 79. Rapid shifts between sadness and excitement. For
samples in which the CBCL/2-3 was used, scores for items 51 and 79 were replaced with
imputed scores, as described later.
Foreign language versions were created by translators fluent in both English and the
foreign language in question. To verify that translations captured the original meanings,
independent back-translations into English were done, which then guided additional fine-tuning
of the translation in an iterative process.

International Comparisons 9
Each of the 99 CBCL/1½-5 problem items was rated 0 = not true (as far as you know), 1
= somewhat or sometimes true, and 2 = very true or often true, based on the preceding 2 months.
Item 100, an open-ended item, was excluded from all analyses. With the exception of items 51
and 79 (for which values were imputed in the samples assessed with the CBCL/2-3), missing
ratings were recoded as 0, after excluding all children with > 8 missing ratings.
Investigators in each society provided raw data for our analyses, namely 0-1-2 ratings on
the 99 problem items for each participant. These item ratings were used to compute scores for
the seven syndromes derived by factor analysis for the CBCL/1½-5 (Emotionally Reactive,
Anxious/Depressed, Somatic Complaints, Withdrawn, Sleep Problems, Attention Problems, and
Aggressive Behavior), for the two second-order factors (Internalizing and Externalizing), and for
Total Problems (the sum of all 99 items). Scores were also computed for five scales identified by
an international group of child psychologists and psychiatrists as being very consistent with
diagnostic categories of the Diagnostic and Statistical Manual – 4th
Edition (DSM-IV; American
Psychiatric Association, 1994). These DSM-oriented scales included Affective Problems,
Anxiety Problems, Pervasive Developmental Problems, Attention Deficit/ Hyperactivity
Problems, and Oppositional Defiant Problems (Achenbach and Rescorla, 2000). Scores were also
computed for a 7-item Stress Problems scale (Achenbach & Rescorla, 2010), derived from
research with preschoolers who varied in their exposure to traumatic events. The Stress Problems
scale includes items such as 5. Can’t concentrate, can’t pay attention for long; 47. Nervous,
highstrung, or tense; and 82. Sudden changes in mood or feelings.
Items 51 and 79 both load on the Emotionally Reactive syndrome and hence are also
included in calculating Internalizing and Total Problems. Item 51 also loads on the DSM-Anxiety
Problems scale. Missing values for items 51 and 79 were imputed for Turkey, Finland, and the

International Comparisons 10
UAE using the Missing Values Multiple Imputation Module of SPSS, Version 17. Ratings
obtained on all nine Emotionally Reactive items in 21 societies, plus ratings on the seven non-
imputed items in the three societies subjected to imputation, were used as predictors in the linear
regression imputation procedure, which was constrained to yield values of 0, 1, or 2. Five
imputed data sets were generated, in which mean scores for the four scales containing the
imputed items were calculated. Mean scores on these scales for the five imputed data sets usually
differed only in the third decimal place.
Data Analysis
Scale scores were positively skewed, as is typical for problem scores in general
population samples where most children have relatively few problems. However, because the
analysis of variance (ANOVA) and multivariate analysis of variance (MANOVA) models used
were very robust with respect to deviations from normality, especially with large samples
manifesting the same skew pattern (Kirk, 1995), we analyzed untransformed raw scores.
MANOVAs tested the differences between scale scores by society, gender, and age group
(18 to 47 months vs. 48 to 71 months) when multiple scales with non-overlapping items could be
tested in a single analysis (i.e., the seven syndromes, the five DSM-oriented scales, and
Internalizing/Externalizing). Total Problems and the Stress Problems scale were tested in
separate ANOVAs. Because the large samples used in this study provided such high statistical
power that even very small effects could be statistically significant, we used a stringent p value
of .001. Effect sizes (ESs) were measured by partial Eta squared, which represents the percent of
total variance uniquely accounted for by a given factor with the other factors partialed out. These
ESs were interpreted using Cohen’s (1988) criteria (small = 1 to 5.9%, medium = 6 to 13.9%,
and large ≥ 14%). Correlations between mean item ratings for every pair of societies were
International Comparisons 11
computed, with mean imputed ratings for items 51 and 79 for Finland, Turkey, and UAE.
Cronbach’s alphas were calculated for each scale within each sample, and correlations were
computed between alphas for every pair of societies.
Results
Mean Scale Score Comparisons
For each scale, Table 2 displays the range of mean scores, the omnicultural mean
(derived by averaging the 24 society means) and its standard deviation (SD), as well as the
omnicultural SD (derived by averaging the 24 SDs). The omnicultural mean for Total Problems
was 33.3. Mean Total Problems scores for the 24 societies arrayed in ascending order are
displayed in Figure 1. On a scale that could range from 0 to 198, three societies (Denmark,
Iceland, and Spain) had scores > 7.1 points (1 SD) below the omnicultural mean of 33.3, three
other societies (Taiwan, Lithuania, and Chile) had scores > 7.1 points above the omnicultural
mean, and 18 of the 24 societies had scores within 7.1 points of the omnicultural mean. Student-
Newman-Keuls (S-N-K) post-hoc tests indicated that scores for Denmark, Iceland, and Spain
were significantly lower (p < .001) than those of all other societies, with Denmark’s score
significantly lower than Iceland’s and Spain’s. Korea’s score (the fourth lowest) was not
significantly different from the next seven scores in the ascending array (i.e., Germany through
France). S-N-K post-hoc tests also indicated that Chile’s mean Total Problems score was
significantly higher (p < .001) than those of all other societies. The four next highest mean scores
(Iran, Turkey, Taiwan, and Lithuania) were not significantly different from each other.
Table 2 also indicates that the omnicultural SD (the mean of the 24 SDs) was 19.0, more
than double the SD of 7.1 for the omnicultural mean. This finding indicates that there was much
greater variation within than between societies in Total Problems scores. As shown in Table 3,

International Comparisons 12
the ANOVA for Total Problems yielded a medium ES for society of 9%. Gender, age, and the
society x age interactions yielded ESs < 1%, indicating very small effects. No other effects were
significant. Boys and younger children obtained slightly higher Total Problems scores than girls
and older children.
We used ANOVA to test the effects of response rate on Total Problems scores by
grouping the 24 societies into three response rate categories: low <70% (8 societies, N = 3,220,
mean = 30.6), medium 70-89% (9 societies, N = 7,531, mean = 35.3), and high > 90% (7
societies, N = 8,248, mean = 32.8). The ES for response rate was significant (p < .001) but very
small (< .01), with S-N-K tests indicating significant differences between all three groups
(lowest mean score in the “low” group and highest mean score in the “medium” group). When
the societies were dichotomized into low versus medium/high, the significant ES for response
rate was also very small (< .01), with mean Total Problems scores of 30.6 versus. 34.0. The r of
.19 between response rate and mean Total Problems scores, which falls in the “small” range
according to Cohen (1988), was not significant, perhaps due in part to the small sample size (24
societies). Taken together, these findings suggest that low response rates (< 70%) were
associated with slightly lower problem scores, but that variations in response rates from 70% to
99% were not monotonically related to Total Problems scores.
Internalizing, Externalizing, and the 13 narrow-band scales (seven syndrome scales, five
DSM-oriented scales, and Stress Problems) all showed the same pattern of larger within-society
than between-society variation (i.e., their omnicultural SDs were much larger than the SDs of
their omnicultural means). As can be seen in Table 3, the ESs for society were 10% for
Internalizing and 7% for Externalizing. For Externalizing, boys and younger children scored
higher than girls and older children (both ES < 1%). S-N-K post-hoc tests for Internalizing
International Comparisons 13
indicated that only Denmark’s mean was significantly lower than all other means, with the next
three lowest societies (Iceland, Spain, and Australia) not significantly different from one another.
The six societies with the highest mean Internalizing scores (Singapore, Iran, Romania,
Lithuania, Turkey, and Chile) did not differ significantly from each other. For Externalizing,
Denmark’s mean was significantly lower than those of the next four societies (Spain, Korea,
Iceland, and Kosovo), which did not differ significantly from each other. Chile had a
significantly higher Externalizing mean than the next two societies (Lithuania and Taiwan),
which did not differ significantly from each other.
The MANOVAs for the two sets of narrow-band scales (syndrome scales and DSM-
oriented scales) yielded ESs for society ranging from 3% (Sleep Problems) to 12%
(Anxious/Depressed). For scales with significant gender or age differences, boys and younger
children scored significantly higher scores than girls and older children (all ESs < 1%). The few
significant interactions all had ES < 1%. The ANOVA for Stress Problems yielded an ES for
society of 6%, with all interaction ESs < 1%. Boys scored slightly higher than girls, while older
children scored slightly higher than younger children, with very small but significant variations
across societies.
Denmark obtained the lowest mean on 11 of the 13 narrow-band scales (with Iceland
lowest on DSM-Affective and Korea lowest on DSM-Oppositional Defiant). Denmark’s mean
was significantly lower than those of all other societies on five scales: Anxious/Depressed,
Aggressive Behavior, DSM-Pervasive Developmental Problems, DSM-Attention Deficit/
Hyperactivity, and Stress Problems. Chile’s mean was the highest of all societies on seven
scales, whereas Lithuania scored highest on Emotionally Reactive, Attention Problems, and
DSM-Attention Deficit Hyperactivity. Singapore scored highest on Withdrawn, Taiwan scored

International Comparisons 14
highest on Sleep Problems, and Romania scored highest on Stress Problems. The highest mean
was significantly different from all other means on only four scales: Withdrawn, Sleep Problems,
Aggressive Behavior, and DSM-Oppositional Defiant Problems.
Mean Item Ratings
For each society, within-society mean ratings for each item were calculated by averaging
the 0-1-2 ratings for the entire sample from that society. These 24 sets of 99 mean item ratings
were then correlated with one another, yielding a matrix of bi-society Q correlations (so
designated because they are calculated over items rather than cases). All bi-society Q
correlations between mean item ratings for all pairs of societies were large according to Cohen
(1988), ranging from .63 (UAE with Denmark) to .94 (Chile with Peru). When the 23 bi-society
Q correlations for each society were averaged, the mean bi-society Q for each society ranged
from .70 (UAE) to .84 (USA), with a mean of .78 across all 24 societies. These findings indicate
strong similarity with regard to which items received relatively high versus relatively low mean
ratings.
To further explore multicultural findings at the item level, we identified the 10 items that
had the highest mean ratings for the full sample of 19,850 children (Table 4). Table 4 also lists
the number of societies for which these items made each society’s own “top 10” list. The first
two items (8. Can’t stand waiting; wants everything now and 16. Demands must be met
immediately) were among the “top 10” items for all 24 societies. The third item (96. Wants a lot
of attention) was in the “top 10” list for 21 societies (not China, Taiwan, or the UAE). The fourth
item (59. Quickly shifts from one activity to another) was in the “top 10” list for 19 societies (not
Turkey, Iran, Korea, Iceland, or Germany). The remaining six items were in the “top 10” lists for
15, 9, 12, 14, 12, and 9 societies, respectively. Four additional items made the “top 10” lists for

International Comparisons 15
at least seven societies when societies were analyzed separately: 15. Defiant (10 societies); 81.
Stubborn, sullen, or irritable (8 societies); 10. Clings to adults or too dependent (7 societies),
and 85. Temper tantrums or hot temper (7 societies). These four items fell at positions 11, 13, 12,
and 17 for the full sample.
Also listed in Table 4 is the percentage of children in the full sample (N = 19,850) whose
parents gave ratings of 1 (somewhat or sometimes true) or 2 (very true or often true) to the 10
highest scoring items. All 10 items received ratings of 1 or 2 for > 50% of children in the full
sample, with the most common being 8. Can’t stand waiting; wants everything now (74%). On
average, items were about twice as likely to be rated 1 as 2, with the exception of item 22.
Doesn’t want to sleep alone (29% 1s and 24% 2s) and item 20. Disobedient (57% 1s and 7% 2s).
Although an in-depth analysis of item ratings by age group within each society is beyond the
scope of this report, for the most commonly endorsed item (8. Can’t stand waiting; wants
everything now), we calculated the percentage of children rated 0 in the two age groups by
society. For the 20 societies with children in both age groups, the difference in younger versus
older percentage was 0-2% for five societies, 3-6% for five societies, 7-9% for four societies, 10-
12% for five societies, and 19% for one society (Denmark). In Turkey and Kosovo, younger
children were more likely to be rated 0, whereas in all other societies older children were more
likely to be rated 0, consistent with the age trends for scales, whereby younger children tended to
have higher scores.
Internal Consistency
For each scale, we averaged the alphas across societies to yield a mean alpha (see Table
2). Mean alphas for Total Problems, Internalizing, and Externalizing were .94, .84, and .88
respectively, with the minimum alpha being .91, .80, and .85. As shown in Table 2, three narrow-

International Comparisons 16
band scales had mean alphas < .60, seven had mean alphas from .60 to .69, two had mean alphas
from .70 to .79, and one had a mean alpha > .80. When alphas for each society were correlated
with those for every other society, bi-society correlations ranged from .78 (Italy with China) to
.99 (Denmark with Peru, Germany with France, and Germany with the USA), with a mean bi-
society r of .92. Mean bi-society rs for each society ranged from .89 for China to .95 for the
USA, France, and Germany. These high correlations indicate that the internal consistencies of
the CBCL/1½-5 scales were very consistent across societies, with Total Problems, Internalizing,
Externalizing, and Aggressive Behavior having the largest alphas and most narrow-band scales
having alphas < .70.
Discussion
The current study provided systematic multicultural comparisons of quantitative data on
behavioral and emotional problems for 19,850 preschool children from general population
samples in 24 societies, all with Ns > 300. Our findings revealed small-to-medium differences
between societies in mean scale scores but miniscule differences between societies in gender and
age effects. We also found large correlations between mean item ratings and between internal
consistency alphas across the 24 societies. These results complement Ivanova et al.’s (2010)
CFAs, which supported the 7-syndrome USA model in the 23 non-USA samples analyzed for the
present study.
Our results revealed substantial consistency in CBCL mean scores across many societies,
despite great variation among them in geography, political/economic system, size, population,
ethnicity/race, and religion. Whereas the mean of the 24 SDs for the 24 Total Problems scores
was 19.0, the SD of the Total Problems score omnicultural mean was only 7.1. This indicates
much more variance within than between societies in problems scores. The 18 societies scoring

International Comparisons 17
within 7.1 points of the omnicultural mean on Total Problems score (on a scale ranging from 0 to
198) included, among others, the USA, Iran, China, Peru, the UAE, France, the Netherlands,
Australia, Korea, and Portugal. These societies differ in many ways. It is hard to find features in
common for the 18 middle-scoring societies, the three lowest-scoring societies, or the three
highest-scoring societies, or features that differentiate among the low-, middle-, high-scoring
societies. For example, although Denmark and Iceland had low mean Total Problems scores,
Finland, another Nordic society, did not. Similarly, Lithuania had a high mean Total Problems
score, but Romania and Kosovo, the two other former Eastern Bloc societies in our sample, did
not. Chile had a much higher mean Total Problems score than Peru, and Taiwan had a higher
mean Total Problems score than China.
The eight societies with the lowest response rates (30% to 67%) had significantly lower
Total Problems scores than the rest of the societies, but the ES was very small (< .01). Societies
with response rates ranging from 70% to 89% had significantly higher mean Total Problems
scores than societies with response rates > 90%, indicating a non-monotonic association between
response rate and problem scores. This may have contributed to the small r of .19 between
response rate and Total Problems scores, which was not significant. The societies with the three
lowest response rates (Singapore, Germany, and Portugal) had mean Total Problems scores
within 1 SD of the omnicultural mean.
Effect sizes for differences between societies ranged from 3% (Sleep Problems) to 12%
(Anxious/Depressed), with 12 of the 16 ESs < 10%. Nevertheless, ESs for society were
consistently higher than ESs for gender and age, which never exceeded 1%. No ESs for society
reached Cohen’s (1988) threshold for large effects. S-N-K post-hoc tests indicated that the
highest and lowest scoring societies often differed significantly from all other societies, but most

International Comparisons 18
other societies did not differ significantly from each other.
In interpreting our findings, we focus on major trends in the data supported by
statistically significant differences. Our results suggested that variations among societies were
due more to a tendency to score high or low overall than to a tendency to score high or low on
only a few specific scales. Denmark and Chile were the most extreme cases of this tendency. To
a somewhat lesser extent, Iceland and Spain tended to have low scores and Lithuania and Taiwan
tended to have high scores, regardless of the scale. However, a few within-society differences are
worth mentioning. Because several previous studies have reported elevated scores for Turkish
school-age children on the Anxious/Depressed syndrome (Achenbach & Rescorla, 2007), it is
noteworthy that Turkey was the second highest-scoring society on Anxious/Depressed in this
study and was fourth or fifth highest on the other three Internalizing syndromes. However, it was
only sixth-to-ninth highest on the three Externalizing syndromes. This suggests that Turkish
parents may have a tendency to report more Internalizing than Externalizing problems in their
preschool children. An even more striking example is Korea, which ranked third from the bottom
on Externalizing but eleventh from the bottom on Internalizing. While it is tempting to attribute
this pattern to persons in Asian cultures tending to internalize rather than externalize problems, it
should be noted that Taiwan and Singapore, also Asian societies, ranked third and fourth from
the top on Externalizing.
Despite the fact that an iterative translation and back-translation process was used to
adapt the CBCL, we cannot be certain that CBCL items hold identical meanings for all parents in
every society. Even parents speaking the same language might interpret some items in slightly
different ways. However, the mean bi-society r of .78 suggests that parents’ ratings in 24
societies were quite consistent in terms of which CBCL items tended to receive high, medium, or

International Comparisons 19
low ratings. This finding suggests that the items operated similarly in very different societies.
Furthermore, although variations in translations may have resulted in subtle differences in
meaning across languages, CBCL scale scores from societies with extremely different cultures
and languages were very comparable. For example, as can be seen in Figure 1, the USA, Italy,
the UAE, China, and Peru had mean Total Problems scores that were virtually identical.
Six of the seven syndrome scales and three of the five DSM-oriented scales had mean
alphas < .70. However, in Achenbach and Rescorla’s (2000) USA sample, all nine of these scales
had test-retest reliabilities > .80 and significantly differentiated referred from non-referred
children. Thus, low alphas did not preclude scales from having strong test-retest reliability and
criterion-related validity. Furthermore, the mean bi-society r of .92 for scale alphas in the current
study indicated that the 24 societies were very similar with regard to which scales had the highest
alphas (Total Problems, Internalizing, Externalizing, and Aggressive Behavior) and the lowest
alphas (Withdrawn and DSM-oriented Affective Problems). These internal consistency findings,
in conjunction with Ivanova et al.’s (2010) CFA findings, support the multicultural consistency
of the preschool CBCL’s scales across 24 very different societies.
Limitations
A possible limitation of our study is its etic approach, whereby the same standardized
assessment instrument was used in all 24 societies. However, several of our etic findings provide
a basis for emic studies exploring differences in scale scores. For example, it would be important
to test why Danish scores so low and Chilean scores are so high, compared to those from other
societies in the same region (e.g., Peru vs. Chile)? It would also be important to test why Turkey
had a higher rank order on Internalizing than on Externalizing (second vs. eighth highest) but
Iran, a neighboring Muslim country, did not (fourth vs. fifth highest).

International Comparisons 20
Although the current study only used parents’ ratings, a parallel study (Rescorla et al.,
2010) used ratings on the Caregiver-Teacher Report Form (C-TRF; Achenbach & Rescorla,
2000) for 8,974 children in 11 of the 24 societies studied here. C-TRF results were very similar
to those for the CBCL: ESs for society ranged from 5% to 12%, the overall r when mean item
ratings were correlated between societies was .76; scale alphas were very comparable across
societies; and six of the “top ten” C-TRF items matched those for the CBCL.
The wide range in response rates constitutes a limitation of our study. However, response
rates were not significantly correlated with scale scores, and the association between response
rates and Total Problems scores was not monotonic. Differences in sample sizes could also have
affected our findings. It is possible that societies in which response rate was low and the sample
size was small relative to the overall population (e.g., Singapore, Portugal, and Taiwan) might
have yielded somewhat different scores had the response rate been higher and the sample larger.
Finally, information about children’s referral status was unavailable for most societies.
However, the paucity of services for preschoolers in most societies suggests that few would have
been referred. For example, in the Lavigne et al. (2009) study, only 12 of 796 USA 4-year-olds
(2%) had received any mental health services. To further address the effect of including versus
excluding referred children, we analyzed data for the USA sample both with and without the 5%
of the children who had been referred in the preceding 12 months for mental health or special
education services. Mean Total Problems score differed by only 0.5 points when referred
children were excluded. Inspection of mean scores in the present study suggests that inclusion
versus exclusion of referred children had little effect. For example, the Danish sample included
referred children and had the lowest mean problem scores, whereas the Chilean sample excluded
referred children and had the highest mean scores.

International Comparisons 21
Implications for Research, Policy, and Practice
To our knowledge, ours is the largest and most diverse international data base for
comparing parents’ reports of preschoolers’ behavioral and emotional problems across many
societies. Although 18 of 24 societies had very similar scores, three societies had substantially
lower mean scores and three had substantially higher mean scores according to a commonly
used—albeit arbitrary—1 SD threshold. To take account of these differences in Total Problems
scores, separate multicultural norms for the CBCL/1½-5 have been constructed for societies
whose mean Total Problems scores were lower than 1 SD below the omnicultural mean, between
-1 and +1 SD from the omnicultural mean, and higher than 1 SD above the omnicultural mean
(Achenbach & Rescorla, 2010).
Our findings should prove useful to both researchers and practitioners. Researchers from
societies not represented in this study can collect CBCL/1½-5 data using a general population
sample of at least 300 and then compare the mean scores, mean item ratings, and scale alphas
obtained from these data with those reported here. The mean Total Problems score they obtain
can indicate which CBCL/1½-5 multicultural norm group is appropriate for their society
(Achenbach & Rescorla, 2010). Researchers can also use our etic findings as a basis for emic
studies of why mean scale scores in some societies were significantly lower or higher than in all
other societies or why scores on one scale were lower than those on another scale in certain
societies. For practitioners, parents’ ratings can be scored using norms appropriate for relevant
societies. For example, ratings by a Chinese father can be evaluated in relation to the middle-
scoring norms that include mainland China, while ratings by a Taiwanese mother are evaluated
in relation to the high-scoring norms that include Taiwan. Moreover, combined with the Ivanova
et al. (2010) findings, our findings support use of the CBCL/1½-5 to assess preschool children

International Comparisons 22
from many societies in terms of ratings by their parents. Finally, our findings are very consistent
with findings reported by Rescorla et al. (2007) for 55,508 children ages 6 to 16 from 31
societies, indicating that the patterns of multicultural similarities and differences reported here
for preschoolers resemble those found for older children.

International Comparisons 23
References
Achenbach, T.M. (1992). Manual for the Child Behavior Checklist/2-3 and 1992 Profile.
Burlington, VT: University of Vermont, Department of Psychiatry.
Achenbach, T.M., & Rescorla, L. (2000). Manual for the ASEBA Preschool Forms & Profiles.
Burlington, VT: University of Vermont, Research Center for Children, Youth, and
Families.
Achenbach, T.M., & Rescorla, L. (2007). Multicultural understanding of child and adolescent
psychopathology: Implications for mental health assessment. New York: Guilford.
Achenbach, T. M., & Rescorla, L. (2010). Multicultural supplement to the Manual for the
ASEBA Preschool Forms and Profiles. Burlington, VT: University of Vermont Research
Center for Children, Youth, and Families.
American Psychiatric Association. (1994). Diagnostic and statistical manual of mental disorders
(4th ed.). Washington, DC: Author.
Campbell, S.B. (2002). Behavior problems in preschool children. New York: Guilford.
Cohen, J. (1988). Statistical power analysis for the behavioral sciences (2nd
ed.). New York:
Academic Press.
Eapen, V., Yunis, F., Zoubeidi, T., & Sabri, S. (2004). Problem behaviors in 3-year-old children
in the United Arab Emirates. Journal of Pediatric Health Care, 18, 186-91.
doi:10.1016/j.pedhc.2004.02.005
Earls, F. (1982). Cultural and national differences in the epidemiology of behavior problems of
preschool children. Culture, Medicine and Psychiatry, 6, 45-56.
doi:10.1007/BF00049470
Egger, H.L., & Angold, A. (2006). Common emotional and behavioral disorders in preschool

International Comparisons 24
children: Presentation, nosology, and epidemiology. Journal of Child Psychology and
Psychiatry, 47, 313-337. doi:10.1111/j.1469-7610.2006.01618.x
Egger, H.L., Erkanli, A., Keeler, G., Potts, E., Walter, B., & Angold, A. (2006). The test-retest
reliability of the Preschool Age Psychiatric Assessment. Journal of the American
Academy of Child and Adolescent Psychiatry, 45, 538-549.
doi:10.1097/01.chi.0000205705.71194.b8
Erol, N., Simsek, Z., Oner, O., & Munir, K. (2005). Behavioral and emotional problems among
Turkish children at ages 2 to 3 years. Journal of the American Academy of Child and
Adolescent Psychiatry, 44, 80-87. doi:10.1097/01.chi.0000145234.18056.82
Frigerio, A., Cozzi, P., Pastore, V., Molteni, M., Borgatti, R., & Montirosso, R. (2006). La
valutazione dei problemi emotivo comportamentali in un campione italiano di bambini in
eta prescolare attraverso la Child Behavior Checklist e il Caregiver Teacher Report Form.
Infanzia e Adolescenza, 5, 24-32.
Goodman, R. (1997). The Strengths and Difficulties Questionnaire. Journal of Child Psychology
and Psychiatry, 38, 581-586. doi:10.1111/1469-7610.ep9709033852
Hannesdóttir, H., & Einarsdóttir, S. (1995). The Icelandic Child Mental Health Study, an
epidemiological study of Icelandic children 2-18 years of age using the Child Behavior
Checklist as a screening instrument. European Child and Adolescent Psychiatry, 4, 237-
248. doi:10.1007/BF01980488
Ivanova, M.Y., Achenbach, T.M., Rescorla, L.A., Harder, V., Ang, R.P., Bilenberg, N., et al.
(2010). Preschool psychopathology reported by parents in 23 societies: Testing the
seven-syndrome model of the Child Behavior Checklist for Ages 1.5-5. Journal of the
American Academy of Child & Adolescent Psychiatry, 49, 12, 1215-1224.

International Comparisons 25
Keenan, K., Shaw, D.S., Walsh, B., Delliquadri, E., & Giovannelli, J. (1997). DSM-III-R
disorders in preschool children from low-income families. Journal of the American
Academy of Child & Adolescent Psychiatry, 36, 620-627. doi:10.1097/00004583-
199705000-00012
Kirk, R.E. (1995). Experimental design: Procedures for behavioral sciences (3rd
ed.).
New York: Wadsworth.
Kristensen, S., Henriksen, T.B., & Bilenberg, N. (2010). The Child Behavior Checklist for Ages
1.5-5 (CBCL/1½-5): Assessment and analysis of parent- and caregiver-reported problems
in a population-based sample of Danish preschool children. Nordic Journal of Psychiatry,
64, 203-209. doi:10.3109/08039480903456595
Lavigne, J.V., Binns, H.J., Christoffel, K.K., Rosenbaum, D., Arend, R., Smith, K., et al. (1993).
Behavioral and emotional problems among preschool children in pediatric primary care:
Prevalence and pediatricians’ recognition. Pediatrics, 91, 649-655.
Lavigne, J.V., Le Bailly, S.A., Hopkins, J., Gouze, K.R., & Binns, H.J. (2009). The prevalence
of ADHD, ODD, depression and anxiety in a community sample of 4-year-olds. Journal
of Clinical Child and Adolescent Psychology, 38, 315-328.
doi:10.1080/15374410902851382.
Liu, J., McCauley, L.A., Zhao, Y., Pinto-Martin, J., & Jintan Cohort Study Group (2010). Cohort
Profile: The China Jintan Child Cohort Study. International Journal of Epidemiology, 39,
668-674. doi:10.1093/ije/dyp205
Nunnally, J.C., & Bernstein, I.H. (1994). Psychometric theory (3rd
ed.). New York: McGraw-
Hill.
Rescorla, L., Achenbach, T. M., Ivanova, M. Y., Dumenci, L., Almqvist, F., Bilenberg, N., et al.
International Comparisons 26
(2007). Behavioral and emotional problems reported by parents of children ages 6 to 16
in 31 societies. Journal of Emotional and Behavioral Disorders, 15, 130-142.
doi:10.1177/10634266070150030101
Rescorla, L., Achenbach, T. M., Ivanova, M.Y., Bilenberg, N., Döpfner, M., Dobrian, A., et al.
(2010). Multicultural comparisons of behavioral and emotional problems reported by
teachers/caregivers of preschoolers in 11 societies. (in preparation).
Sourander, A. (2001). Emotional and behavioral problems in a sample of Finnish three-year-
olds. European Child and Adolescent Psychiatry, 10, 98-104.
doi:10.1007/s007870170032
Tick, N.T., van der Ende, J., Koot, H.M., & Verhulst, F.C. (2007). 14-year changes in emotional
and behavioral problems of very young Dutch children. Journal of the American
Academy of Child and Adolescent Psychiatry, 46, 1333-1340.
doi:10.1097/chi.0b013e3181337532
Van den Oord, E.J.C.G., Koot, H.M., Boomsma, D.I., Verhulst, F.C., & Orlebeke, J.F. (1995). A
twin-singleton comparison of problem behavior in 2-3 year-olds. Journal of Child
Psychology and Psychiatry, 36, 449-458. doi:10.1111/1469-7610.ep11520774
Wakschlag, L.S., Briggs-Gowan, M.J., Carter, A.S., Hill, C., Danis, B., Keenan, K., et al. (2007).
A developmental framework for distinguishing disruptive behavior from normative
misbehavior in preschool children. Journal of Child Psychology and Psychiatry, 48, 976-
987. doi:10.1111/j.1469-7610.2007.01786.x
International Comparisons 27
Table 1
Characteristics of Samples from 24 Societies
Society
Reference
n
Ages
Percent
males
Sample
Method
Response
ratea
Referred
excludedb
Australia Zubrick et al., 2007 1793 2-3 51% regional birth cohort mailed 85% no
Belgium Van Leeuwen et al.,
2009; De Pauw et al.,
2009
1117 1.5-5 52% regional school-based at home;
from schools
73% no
Chile Lecannelier et al.,
2009
483 1.5-5 50% regional school-based from
schools, at
home
80% yes
China Liu et al., 2010 908 4-5 53% regional school-based at home,
from schools
91% no
Denmark Kristensen et al, 2010 851 1.5-5 50% regional household mailed 52% no
Finland Sourander, 2001 370 3 50% regional well-baby
clinic
at clinic 71% no
France Capron & Duyme,
2009
1204 1.5-5 53% regional school-based
and pediatric
from
schools,
medical
offices
91% no
International Comparisons 28
Society
Reference
n
Ages
Percent
males
Sample
Method
Response
rate
Referred
excluded
Germany Döpfner & Plueck,
2009
850 2-5 55% regional school-based
prevention project
from schools 30% no
Iceland Gudmundsson &
Bjarnadóttir, 2009
305 1½-5 51% national school-based from schools 60% no
Iran Esmaeili, 2009 1346 1½-5 49% national school-based interviews at
schools
97% no
Italy Frigerio et al., 2006 466 1½-5 50% regional school-based from schools 70% yes
Korea Oh & Kim, 2009; Kim
et al., 2009
2327 1½-5 51% national school-based from
schools
92% yes
Kosovo Shahini, et al. (2009) 481 1½-5 52% regional school-based from schools 77% no
Lithuania Jusiene et al., 2007 931 1½-5 53% national school-based
(some households)
at home 80% no
Netherlands Tick et al., 2007 608 1½-5 53% regional household at home 84% no
Peru Pomalina, et al., 2009 1027 1½-5 52% regional household-
based
at home 99% no
Portugal Dias et al., 2009 407 1½-5 50% regional school based from schools 44% no
Romania Dobrean et al. 2008 938 2-5 47% national school-based from schools 75% no
Singapore Ooi et al. , 2009 301 1½-5 51% regional school-based from schools 36% no

International Comparisons 29
Society
Reference
n
Ages
Percent
males
Sample
Method
Response
rate
Referred
excluded
Spain Ezpeleta et al., 2009 570 3-5 51% regional school-based from schools 58% no
Taiwan Wu et al., 2009 306 1½-5 54% birth cohort; regional
school-based
by mail;
from schools
53% c
(56%; 50%)
no
Turkey Erol et al., 2005;
Erol, et al, 2010
825 2-3;
1½-5
50% national household;
regional school-based
at home/
from schools
86% d
(95%; 60%)
no; yes
UAE Eapen et al., 2006 692 3 50% national household at home 96% no
USA Achenbach &
Rescorla, 2000
744 1½-5 51% national household at home 94% no
Note. Complete references for each sample are available from the first author; aResponse rates, which were calculated by the
investigators who provided the data for each society, represent the ratio of completed forms to the target sample; in some societies,
settings in which data were collected (e.g., different schools) may have varied widely in response rate; bSamples in which the
investigator indicated that referred children had been excluded are coded “yes;” for all other samples, it is assumed that some referred
children may have been included and these samples are coded “no;” cThe overall response rate for Taiwan was the weighted average
of the response rates of the two subsamples; dThe overall response rate for Turkey was the weighted average of the response rates of
the two subsamples.

International Comparisons 30
Table 2
Ranges, Omnicultural Means, Standard Deviations, and Alphas Across 24 Societies
CBCL scale
Range of
scale
scoresa
Omnicultural
M (SD)b
Omnicultural
SDc
Mean
alpha
Total Problems 17.2-47.5 33.3 (7.1) 19.0 .94 (99)d
Internalizing 3.9-13.9 9.6 (2.6) 6.7 .84 (36)
Externalizing 6.7-16.9 12.0 (2.3) 7.3 .88 (25)
Emotionally Reactive 1.1-4.0 2.7 (0.7) 2.4 .69 (9)
Anxious/Depressed 1.1-4.6 3.1 (1.0) 2.3 .65 (8)
Somatic Complaints 1.0-3.3 2.3 (0.6) 2.1 .56 (11)
Withdrawn 0.7-2.9 1.7 (0.6) 1.8 .62 (8)
Sleep Problems 1.8-4.0 2.7 (0.3) 2.4 .67 (7)
Attention Problems 0.9-3.2 2.3 (0.6) 1.8 .60 (5)
Aggressive Behavior 5.8-13.8 9.7 (1.8) 6.1 .87 (19)
DSM-Affective Problems 1.0-3.5 2.3 (0.7) 2.1 .57 (10)
DSM-Anxiety Problems 1.6-6.0 3.8 (1.2) 2.6 .63 (10)
DSM-Pervasive Developmental Problems 1.6-4.8 3.2 (0.9) 2.8 .67 (13)
DSM-Attention-Deficit/Hyperactivity Problems 2.3-6.4 4.7 (1.0) 2.7 .74 (6)
DSM-Oppositional Defiant Problems 2.3-4.9 3.3 (0.6) 2.4 .75 (6)
Stress Problems 0.9-3.0 2.0 (0.5) 1.8 .59 (7)
Note. CBCL = Child Behavior Checklist (Achenbach & Rescorla, 2000); aall analyses utilized
raw data for all participants in each society; b omnicultural mean (SD) obtained by averaging 24

International Comparisons 31
society means; comnicultural SD obtained by averaging 24 society SDs;
dnumber of items per
scale.

International Comparisons 32
Table 3
Significant Effect Sizes (η²) at p < .001 for CBCL Scale Scores
CBCL Scale Society Gender Age S x G S x A
Total Problems 9% < 1% < 1% ns < 1%
Internalizing 10% ns ns ns < 1%
Externalizing 7% < 1% < 1% < 1% < 1%
Emotionally Reactive 7% ns ns ns < 1%
Anxious/Depressed 12% ns ns ns ns
Somatic Complaints 7% ns ns < 1% < 1%
Withdrawn 5% < 1% ns ns < 1%
Sleep Problems 3% ns < 1% ns < 1%
Attention Problems 9% < 1% < 1% ns ns
Aggressive Behavior 6% < 1% < 1% ns < 1%
DSM-Affective Problems 6% ns ns ns < 1%
DSM-Anxiety Problems 11% ns ns ns < 1%
DSM-Pervasive Developmental Problems 6% < 1% < 1% ns < 1%
DSM-Attention Deficit/Hyperactivity Problems 11% < 1% < 1% ns < 1%
DSM -Oppositional Defiant Problems 6% < 1% < 1% ns < 1%
Stress Problems 6% 1% ns 1% 1%
Note. S = Society, G = gender, A = Age, CBCL = Child Behavior Checklist (Achenbach &
Rescorla, 2000); DSM = Diagnostic and Statistical Manual of Mental Disorders – Fourth

International Comparisons 33
Edition (American Psychiatric Association, 1994). No gender x age or society x gender x age
interactions were significant at p < .001.

International Comparisons 34
Table 4
The Ten Highest Scoring Items Across All 24 Societies
Item
Mean
rating
N of
societies a
Percent
rated 1b
Percent
rated 2c
8. Can’t stand waiting; wants everything now 1.00 24 47% 27%
16. Demands must be met immediately .88 24 50% 19%
96. Wants a lot of attention .84 21 45% 20%
59. Quickly shifts from one activity to another .78 19 44% 17%
22. Doesn’t want to sleep alone .76 15 29% 24%
30. Easily jealous .73 9 44% 14%
33. Feelings are easily hurt .71 12 44% 14%
20. Disobedient .71 14 57% 7%
6. Can’t sit still, restless, or hyperactive .71 12 36% 17%
36. Gets into everything .67 9 37% 15%
Note. For all items, 0 = not true, 1 = somewhat or sometimes true, 2 = very true or often
true. aNumber of societies for which item was in its “top 10” list
; bPercentage of children
rated 1 across the full sample of 19,850; c Percentage of children rated 2 across the full
sample of 19,850.

International Comparisons 35
Figure Captions
Figure 1. Mean Total Problems scores from 24 societies (N = 19,850).