map data: growth & proficiency
TRANSCRIPT

MAP Data: Growth & Proficiency What are the Key Reports?
Vicky Billings Sr. Account Manager TEXAS [email protected] 503.347.5370

Context for MAP Growth
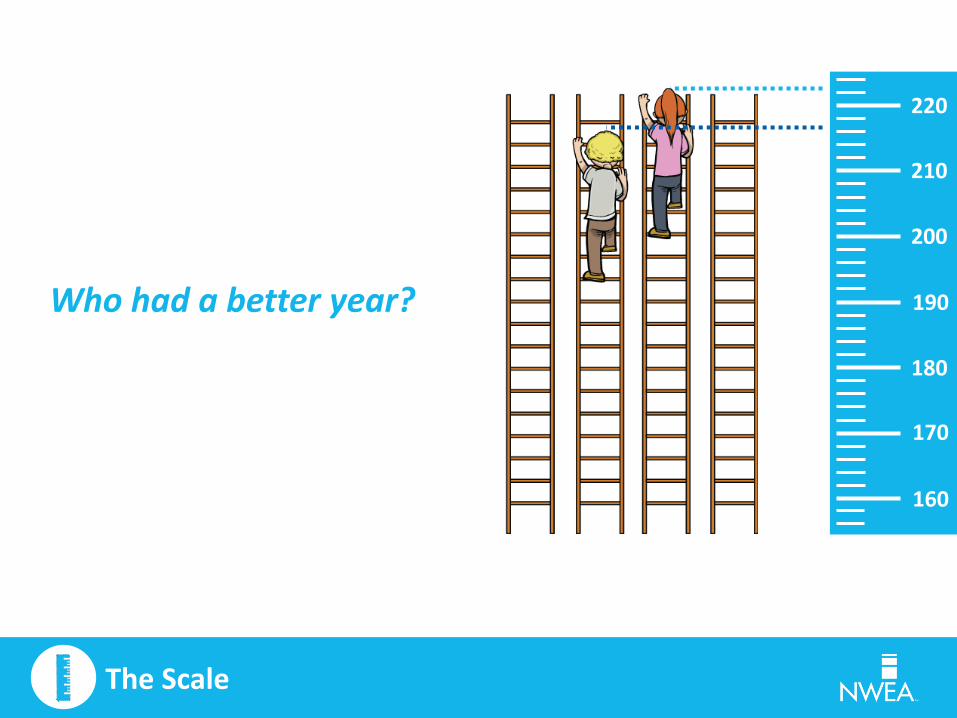
The Scale
220
210
200
190
180
170
160
Who had a better year?

The Scale
220
210
200
190
180
170
160
Where did they start?

The Data

The Data
Student Performance Data
• The RIT score – overall performance by subject area; measures growth over time
• Goal Area RIT Range – Indicates goal specific performance. Ties directly to instructional data
• Lexile® Score – Connects students to appropriately challenging reading material
The Data
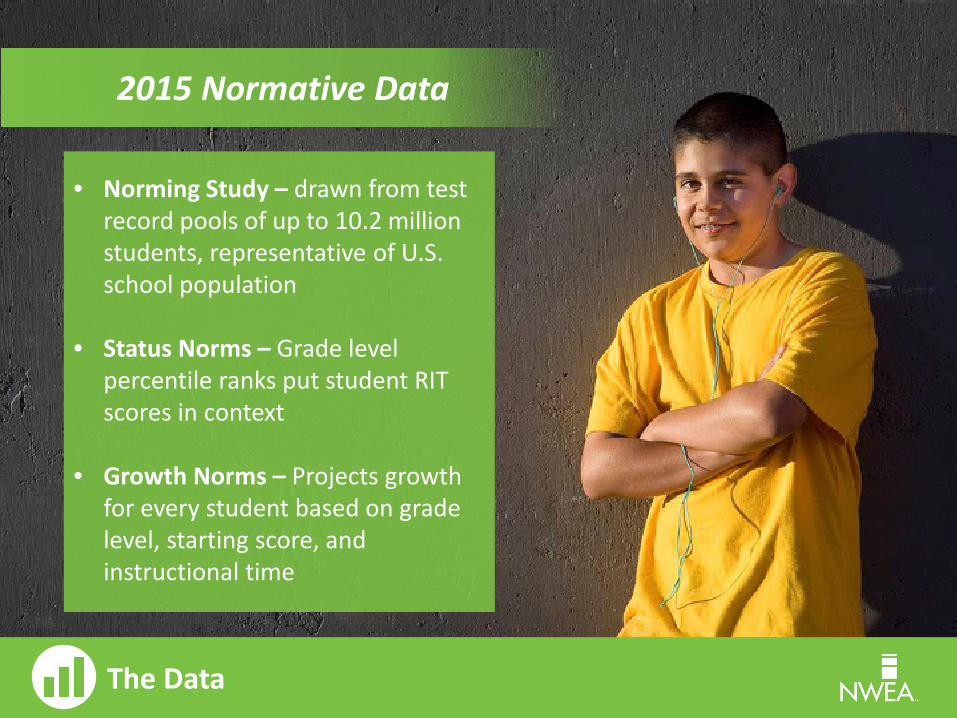
2015 Normative Data
• Norming Study – drawn from test record pools of up to 10.2 million students, representative of U.S. school population
• Status Norms – Grade level percentile ranks put student RIT scores in context
• Growth Norms – Projects growth for every student based on grade level, starting score, and instructional time
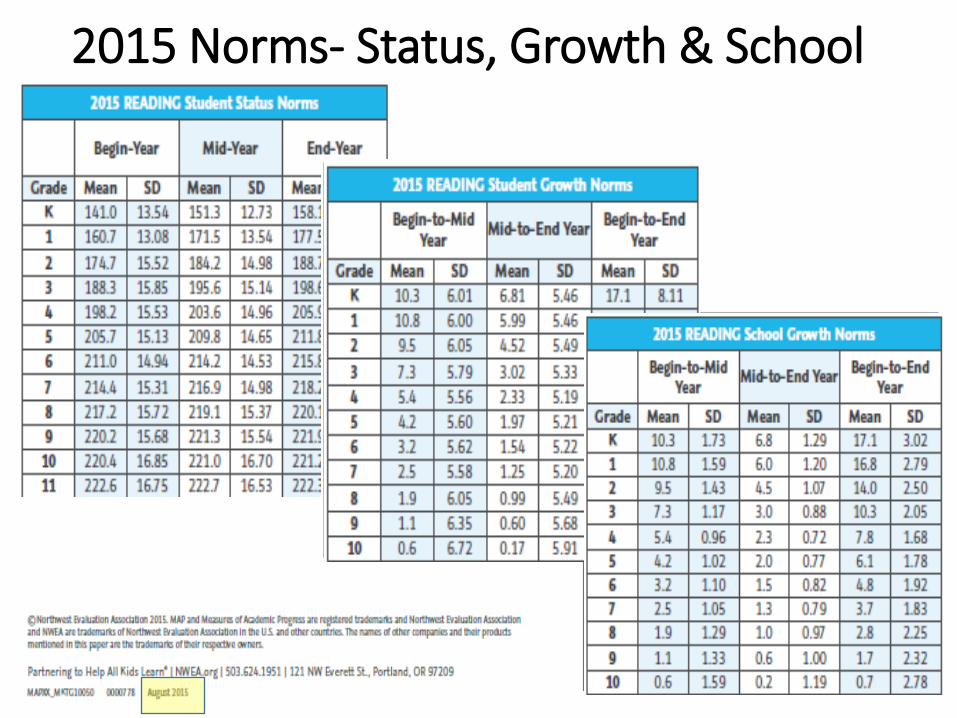
2015 Norms- Status, Growth & School
8

Growth Reports

The Reports

The Reports
NEW! Grade Breakdown – All Class Breakdowns rolled into a spreadsheet
GRADE Breakdown Report

The Reports Class Level Growth – ASG Reports

Achievement Status & Growth Summary with Quadrant Chart

The Reports Class report changes with Percentile Changes
+/-50% of class meeting/exceeding Growth Projection is Typical Considerably higher than 50% meeting growth -- doing quite well. Considerably lower than 50% meeting growth invites exploration.

The Reports
Post BOY Comparison Periods: ~ Fall to Winter Growth PROJECTION ~Fall to Spring Growth PROJECTION ~ Fall to Fall Growth PROJECTION ~ Fall to Fall Growth SUMMARY
Each TERM PAIR has its own Growth Norm. Students may exceed individual Fall to Spring Projected RIT scores in Winter—this WILL NOT CHANGE the Fall to Spring Projections for those students. Use Winter to Spring Growth Projections for updated Goal Setting. If class/school goals are based on F-S Growth, students will still need to perform at or above the Fall to Spring Projected RIT at EOY administration.
ASG Growth Projection

The Reports
Post MOY Comparison Periods: ~ Fall to Winter Growth SUMMARY ~ Winter to Winter SUMMARY ~ Winter to Spring Growth PROJECTION ~ Winter to Winter PROJECTION
+/-50% of group meeting/exceeding Growth Projection is Typical Considerably higher than 50% meeting growth -- doing quite well. Considerably lower than 50% meeting growth invites exploration.
ASG Growth Summary

The Reports ASG Spreadsheet Format

The Reports Download ASG Spreadsheet for Campus or Entire District!

Growth Reports for School and District
Analysis

The Reports
We are rocking Jr. Hi Growth statistics
The percentage of students with 2nd term RIT scores that met or exceeded their GRADE’S GROWTH PROJECTION vs. STUDENT GROWTH PROJECTION on ASG reports
*Standard Fall to Winter Grade Level Norms Grade Fall Status Winter Status Growth
6 217.6 222.1 4.4
7 222.6 226.1 3.5
8 226.3 229.1 2.9
*Default Weeks of Instruction
Student Level MEANS and School (Grade Level) MEANS are the same with much higher SD for individual than grade level
Grade Level Growth: Student Growth SUMMARY

The Reports Student Growth SUMMARY
When can you check district/school performance against school norms?
Fall window closes: • Previous Fall to Current Fall
Winter window closes: • Fall to Winter Current Year • Previous Winter to Current Winter
Spring window closes: • Fall to Spring Current Year • Winter to Spring Current Year • Previous Spring to Current Spring
PROFICIENCY REPORTS Class Breakdown by
Projected Proficiency ~~~
Projected Proficiency Summary


The Reports
ACT Benchmarks of 22 and 24
Latest NWEA Linking Study planned release March 1 – Spring Reporting window

The Reports Projected Proficiency Summary by GRADE
ACT Projections
STAAR Projections
All on ONE Report!

The Reports
*
*STAAR Table is a representative mock-up only.
Projected Proficiency Summary by CAMPUS
ACT Projections
STAAR Projections
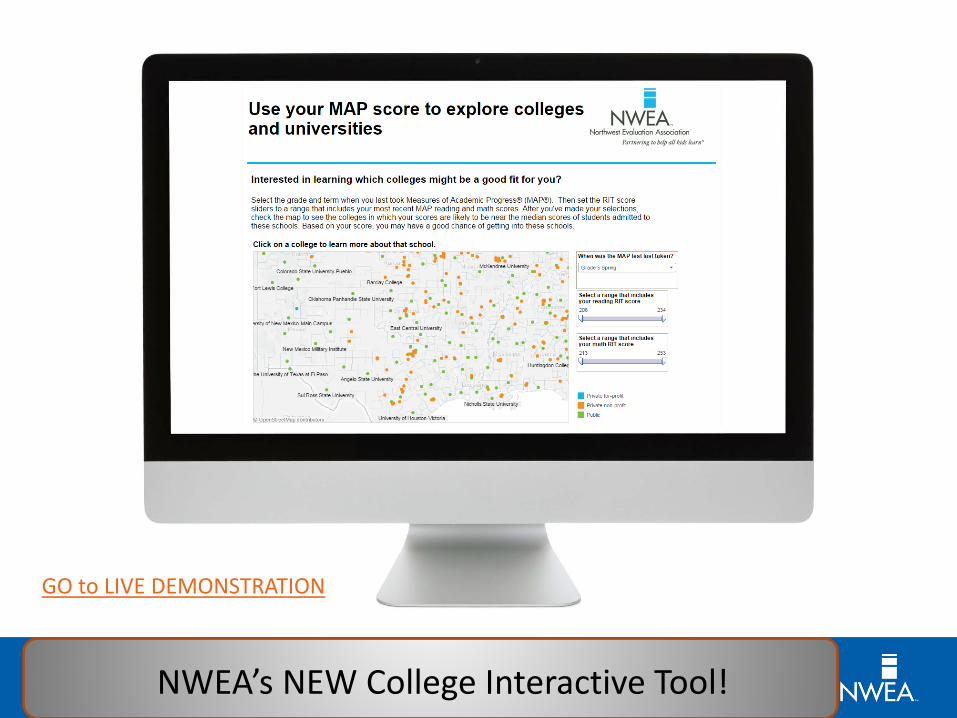
The Test NWEA’s NEW College Interactive Tool!
GO to LIVE DEMONSTRATION

The Reports
TX Learning Continuum – Class View NEW! Sort by TEKS!

NW
EA N
orm
ativ
e Da
ta
Reso
urce
s and
Too
ls

Where does the growth data & proficiency projections lead us?
STUDENT GOAL SETTING GRADE LEVEL GOAL SETTING
RESOURCES Teacher Expertise
Map Learning Continuum Khan Academy RIT to Resource
Student Initiative