mapinfo vertical mapper - pitney · pdf filewith mapinfo vertical mapper, the best of both...
TRANSCRIPT
MapInfo® Vertical MapperTM
for Spatial Visibility and Analysis
DATA SHEET
GAIN DEEPER LOCATION INSIGHT USING GRID-BASED ANALYTICS
OVERVIEW
Grids represent data that vary continuously
from one location to another, such as
elevation, temperature or even demographics,
such as average income. Grids can be used
to condense large numbers of point objects
into a continuous surface representation of
the data that is easy to analyze. By analyzing
data in a grid format, users can easily view
constantly changing data variables in
relation to location by thematically mapping
the data with color or relief shading,
or by layering and comparing the data
mathematically with other grid themes to
determine unique or hidden relationships.
MapInfo Vertical Mapper provides
robust grid generation, display and
analysis capabilities.
Use MapInfo Vertical Mapper to:
• Create 3D topographical maps to better
understand how developments such as
industrial parks or landfills will impact
the surrounding neighbors.
• Determine intervisibility between points
or calculate the total viewable area
(a Viewshed) from a given location while
doing elevation analysis.
Summary
Break free from boundaries!
MapInfo Vertical Mapper
adds comprehensive raster
grid creation, visualization
and analysis capabilities to
MapInfo Professional.
Using continuous surface
grid-based data opens up
MapInfo Professional to
vastly increased power and
flexibility in a wide variety
analytical tasks.
Benefits
• Create continuous surface
and point density map
representations from your data.
• Convert aerial photos or
other images to grid-based
data for analysis.
• Perform grid-based visualization
and analysis tasks including
grid querying, predictive
analysis, and site modelling.
• Tight integration with MapInfo
Professional combines the
best of both raster grid and
vector analysis capabilities.
INTRODUCING VERTICAL MAPPER
Enjoy access from our familiar MapBasic®
programming language to automate repeatable
tasks and processes. Some 66 sample
applications provide a fast, easy start to apply
MapInfo Vertical Mapper functionality in your
everyday work.
With support for our latest native file format
(.tab) enhancements, users will appreciate the
expanded capabilities of the new MapInfo
Vertical Mapper file access library, including:
• Access to very large geographic objects
with tens of millions of nodes
• Time and Date field type support
• Access to all MapInfo Professional®
supported datums and projections
ADDITIONAL NEW FEATURES:
• The ability to convert a raster image picture
into a data grid file for analysis. For example
an aerial photo can be analyzed to determine
the areas impacted by flooding or the total
area of green space.
• The supported raster data formats include
Bitmap, JPEG, GIF, ECW, JPEG 2000, portable
Network Graphics, Geo TIFF/Tagged Image
Format, Multi-resolution Seamless Image
Database.
• Windows® 7 operating system support
• Simplified installation and deployment options
MapInfo® Vertical MapperTM
for Spatial Visibility and Analysis
DATA SHEET
• Compare coverage maps to forecast and
model network capacity, such as channel,
frequency use and bandwidth utilization
for communications firms.
• Generate soil chemistry maps from
samples for natural resource exploration.
• Relate elevation from a terrain model to
a set of households or buildings in an
insurance company to understand portfolio
risks from flooding.
• Correlate and analyze several large data
sets spatially. For example, average
household income and high blood lead
levels or cell phone signal strength and
population density.
Break free from Boundaries
MapInfo Vertical Mapper has a wide range
of analytical tools that allow you to reveal
trends in data that are free of the influence
of arbitrary region boundaries. Grid-based
analysis does not rely on aggregation of
data into existing boundaries which are
often designed for specific administrative
or political purposes and may not be well
suited to data analysis. Another asset is the
software's unique prediction capabilities,
whereby you can specify a test location,
and MapInfo Vertical Mapper will identify
areas with statistically similar attributes.
This means complex tasks such as analyzing a
number of the demographic and geographic
variables used to locate a new retail outlet
are reduced to a few mouse clicks. Derive new
insight by turning your data investment into
compelling, meaningful information to give
your business the upper hand.
Create Grids
Creating grids (a grid is a continuous surface
representation of your data) with MapInfo
Vertical Mapper is easy. The software includes
a full suite of standard methods to build grids
from your data. Easy-to-use wizards help
novice users achieve meaningful answers while
experienced mappers can adjust advanced
settings to obtain more sophisticated results.
MapInfo Vertical Mapper includes six
grid algorithms:
• Triangulated Irregular Network (TIN)
with smoothing
• Inverse weighted distance function
• Natural Neighbor
• Rectangular (Bilinear) interpolation
• Kriging
• Custom Point Estimation (a user
customizable grid creation method)
Also, standard aerial and satellite images can
be converted into grids for analysis.
In addition, MapInfo Vertical Mapper includes
point density and modelling options for:
• Location Profiler—computes and averages
the distance to a series of points from
anywhere within a map area
• Trade Area Analysis—for single or
multiple areas
• Point density calculation—flexible
options for representing a set of points
as a continuous surface for analysis.
Display Grids
Visualize trends in spatial information easily.
MapInfo Vertical Mapper grid color settings
define data variations and dynamic 3D
rendering tools let you bring data to life. View
multiple grids within the same scene, apply
drapes to any open grid, and determine the
degree of transparency for both grids and
drape files. MapInfo Vertical Mapper gives
you a wealth of display options to generate
impressive and intelligent data representations.
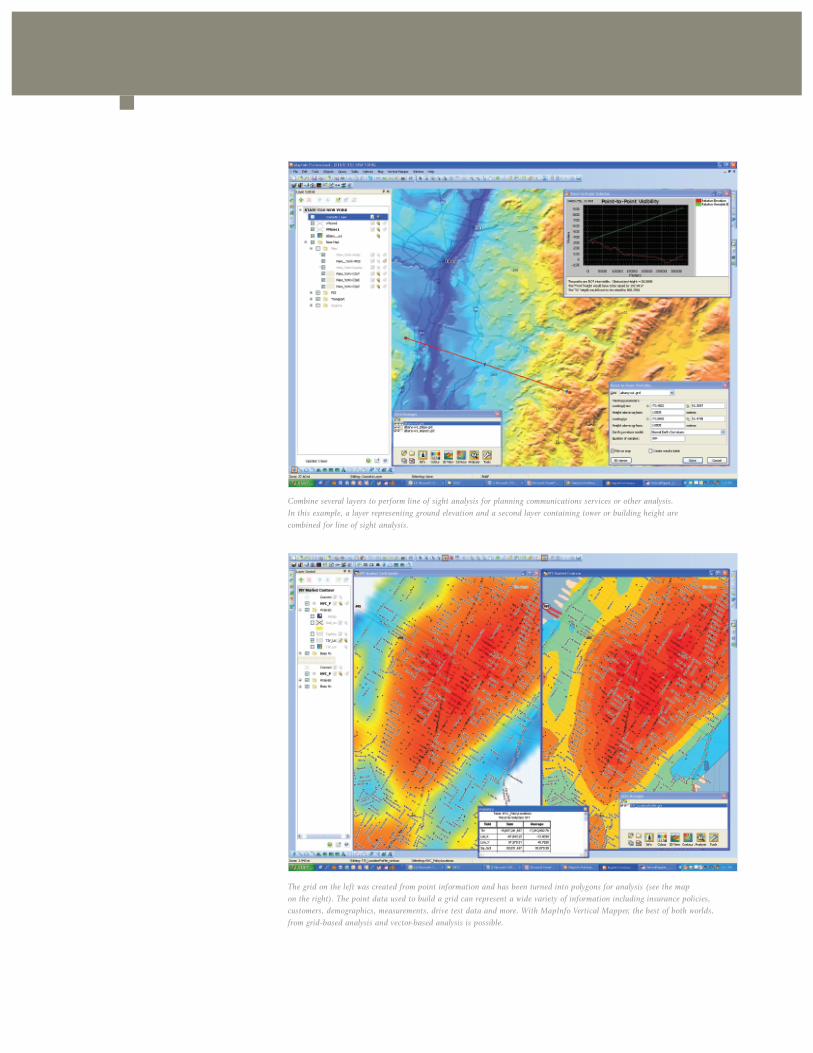
The grid on the left was created from point information and has been turned into polygons for analysis (see the map on the right). The point data used to build a grid can represent a wide variety of information including insurance policies,customers, demographics, measurements, drive test data and more. With MapInfo Vertical Mapper, the best of both worlds,from grid-based analysis and vector-based analysis is possible.
Combine several layers to perform line of sight analysis for planning communications services or other analysis. In this example, a layer representing ground elevation and a second layer containing tower or building height are combined for line of sight analysis.
Analyze Grids
Enter a whole new world of geographic
analysis made possible through grid
technology. Whether you need to query
and compare multiple layers of information,
use mathematical expressions to derive
new information from your existing grids,
or perform terrain related analysis, MapInfo
Vertical Mapper has robust spatial analysis
capabilities that help you gain new insight
from your data.
• Convert grid data to region objects to
perform location analysis.
• Combine several continuous layers to
determine the best line of sight locations
for planning and analysis
Some functions you can apply to your
grid data are:
• Overlaying one grid on another and
applying a mathematical function (e.g.
Subtract one grid with elevations from one
data to a grid of the same area after land has
been removed to calculate the volume of soil
removed)
• Calculate and slope (steepness) and aspect
(directional facing) for terrain for use in a
variety of analytical applications.
• Show cross sections of terrain. For example,
the change in elevation experienced in a
section of a motorway or pipeline
• Gaining a 3D perspective view of the
terrain with optional overlay of imagery
• Performing natural neighbor (Voronoi)
analysis to understand categorical data such
as soil type
• Profiling related data for identifying
groups if customers, health incidents,
traffic accidents or other points.
When you need to calculate point density,
two methods are available:
• Square area—points totalled for each
square of a grid
• Smoothing—density expressed as a
normalized value between zero and one.
MapInfo Vertical Mapper’s custom point
estimation feature allows you to specify
the calculation of points within a radius,
including sum, minimum, maximum,
average and more.
MapInfo Vertical Mapper also supports the
creation and manipulation of classified
grids (GRC data), including the modification
and merging of class structures.
VISIT WWW.PBINSIGHT.COM/VERTICALMAPPER
FOR MORE INFORMATION.
UNITED STATES
One Global View
Troy, NY 12180
1.800.327.8627
www.pbinsight.com
CANADA
26 Wellington Street East
Suite 500
Toronto, ON M5E 1S2
1.800.268.3282
www.pbinsight.ca
EUROPE/UNITED KINGDOM
Minton Place
Victoria Street
Windsor, Berkshire SL4 1EG
+44.1753.848200
www.pbinsight.co.uk
ASIA PACIFIC/AUSTRALIA
Level 7, 1 Elizabeth Plaza
North Sydney NSW 2060
+61.2.9437.6255
www.pbinsight.com.au
MapInfo® Vertical MapperTM
for Spatial Visibility and Analysis
Supported Operating Systems
• Windows® 7
• Windows® Vista
• Windows® XP
• Windows® 2008 Server
• Windows® 2008 Server with Citrix® XenApp
SPEC I F I CAT I ONS
©2010 Pitney Bowes Software Inc. All rights reserved. 92398-AM-1006Pitney Bowes Business Insight is a division of Pitney Bowes Software Inc. Pitney Bowes Business Insight, MapInfo, MapInfo Professional and MapInfo Vertical Mapper are trademarks of Pitney Bowes Software Inc. All other marks and trademarks are the property of their respective holders.