mapping and assessment of ecosystems and their … to this end, a working group on mapping and...
TRANSCRIPT

1
Mapping and Assessment of Ecosystems and their Services:
An analytical framework for ecosystem assessments under Action 5 of
the EU Biodiversity Strategy to 2020
Discussion paper.
Draft version 08 May 2012
Contributions by
Joachim Maes, Camino Liquete, Markus Erhard, Anne Teller, Jennifer Hauck.
1. Introduction
In the EU, many ecosystems and their services have been degraded, largely as a result of
land fragmentation. Nearly 30 % of the EU territory is moderately to very highly
fragmented. Target 2 focuses on maintaining and enhancing ecosystem services and
restoring degraded ecosystems by incorporating green infrastructure in spatial planning.
This will contribute to the EU's sustainable growth objectives and to mitigating and
adapting to climate change, while promoting economic, territorial and social cohesion
and safeguarding the EU's cultural heritage. It will also ensure better functional
connectivity between ecosystems within and between Natura 2000 areas and in the wider
countryside. Target 2 incorporates the global Aichi target 15 agreed by EU Member
States and the EU in Nagoya to restore 15% of degraded ecosystems by 2020. It is also a
direct response to Aichi targets 2 and 14 of the Global Strategic Plan for Biodiversity,
2011-2020 of Convention of Biological Diversity1.
Progress on implementing the actions under Target 2 will be monitored and the results
will feed into the preparation of both the EU mid-term report in 2015, the EU’s fifth
National Report as required under the CBD in 2014. In Action 5, the Commission is
committed to assist Member States (MS) in mapping and assessing the status of
ecosystems and their services in their national territory by 2014, in assessing the
economic value of such services, and in promoting the integration of these values into
accounting and reporting systems at EU and national level by 2020.
1 Global Target 2: By 2020, at the latest, biodiversity values have been integrated into national and local
development and poverty reduction strategies and planning processes and are being incorporated into
national accounting, as appropriate, and reporting systems.
Global Target 14: By 2020, ecosystems that provide essential services, including services related to water,
and contribute to health, livelihoods and well-being, are restored and safeguarded, taking into account the
needs of women, indigenous and local communities, and the poor and vulnerable.
Global Target 15: By 2020, ecosystem resilience and the contribution of biodiversity to carbon stocks has
been enhanced, through conservation and restoration, including restoration of at least 15 per cent of
degraded ecosystems, thereby contributing to climate change mitigation and adaptation and to combating
desertification.

2
To this end, a working group on Mapping and Assessment of Ecosystems and their
Services (WG-MAES) has been established by DG Environment in March 2012. This
group operates under the common implementation framework of the EU Biodiversity
Strategy to 2020. The objective of WG-MAES is to support the Member States in
operationalising Action 5 and in undertaking the first steps of mapping and assessment of
the status of major ecosystems and of defined ecosystem services by 2014.
This discussion paper supports the development of an analytical framework with the aim
to ensure consistency in mapping and assessment approaches across Member States and
at pan-European level. It will serve as a basis for discussion in the working group.
In the short-term, the essential challenge of Action 5 is to make the best use of and
operationalize the current information and scientific knowledge available on ecosystems
and their services in Europe and make it accessible to Member States for mapping and
assessment in their territory. The work to be undertaken under Action 5 will strongly
build on the outcomes of the Millennium Ecosystem Assessment (MA) work and The
Economics of Ecosystems and Biodiversity (TEEB) studies and also capitalise on the
ongoing assessments and TEEB studies currently undertaken by EU and its Member
States. The ecosystem assessment will benefit from the outcomes of the reporting
obligations of the Member States under EU environmental legislation on the status of
biotic components of ecosystems (i.e. ecological status of water bodies, conservation
status of protected species and habitat types and environmental status of marine
environment) and abiotic environmental conditions such as air quality including
greenhouse gas emissions, surface water and groundwater quantity and physico-chemical
quality etc. The analytical framework should therefore be sufficiently flexible to
accommodate the results from ongoing European, national and sub-national assessments
while enabling the inclusion of future assessments.
As follow-up of the preliminary discussions that have taken place at the first meeting of
the working group on 13 March 2012, the present discussion paper has been developed,
which proposes to construct the analytical framework along the lines and columns of an
EU common matrix of ecosystems and services to be used and shared with all for the
mapping and assessment work.
Why mapping and assessment of ecosystems and their services?
By building the knowledge base for ecosystems and their services in Europe, it is clear
that Action 5 of the EU Biodiversity Strategy to 2020 underpins all the actions under
Target 2. This baseline is essential for supporting decision-making on what ecosystems to
restore in priority and where, where and how much to invest in Green Infrastructure
(Action 6) so that ecosystem status improves and the delivery of multiple ecosystem
services is ensured in the long-term. This baseline is dependent on the availability of
spatially explicit information on ecosystems and the flow of their services as benefits to
the society. Furthermore, spatial information on the delivery of and the demand for

3
ecosystem services will provide baseline data to measure net future gains or losses
(Action 7) and will support the development of financial instruments to fund investments
in nature (Action 7).
There are several more benefits from spatially explicit ecosystem assessments. Maps are
useful for prioritization and problem identification, and as communication tool to initiate
discussions with stakeholders, visualizing and explaining the relevance of ecosystem
services to the public. Maps can - and to some extend already do so at sub-national level -
contribute to the planning and management of biodiversity protection areas and implicitly
of their ecosystem services.
At the European level, mapping can assist decision makers in identifying priority areas,
relevant policy measures, including the improvement of the targeting of measures and in
demonstrating/evaluating their benefits in relation to costs (e.g. impact assessment) via
spatially explicit reporting obligations from the Member States.
Figure 1: Interaction between biotic and abiotic environment, services and human
wellbeing (EEA SOER2010, Biodiversity)

4
2. Proposal of work structure
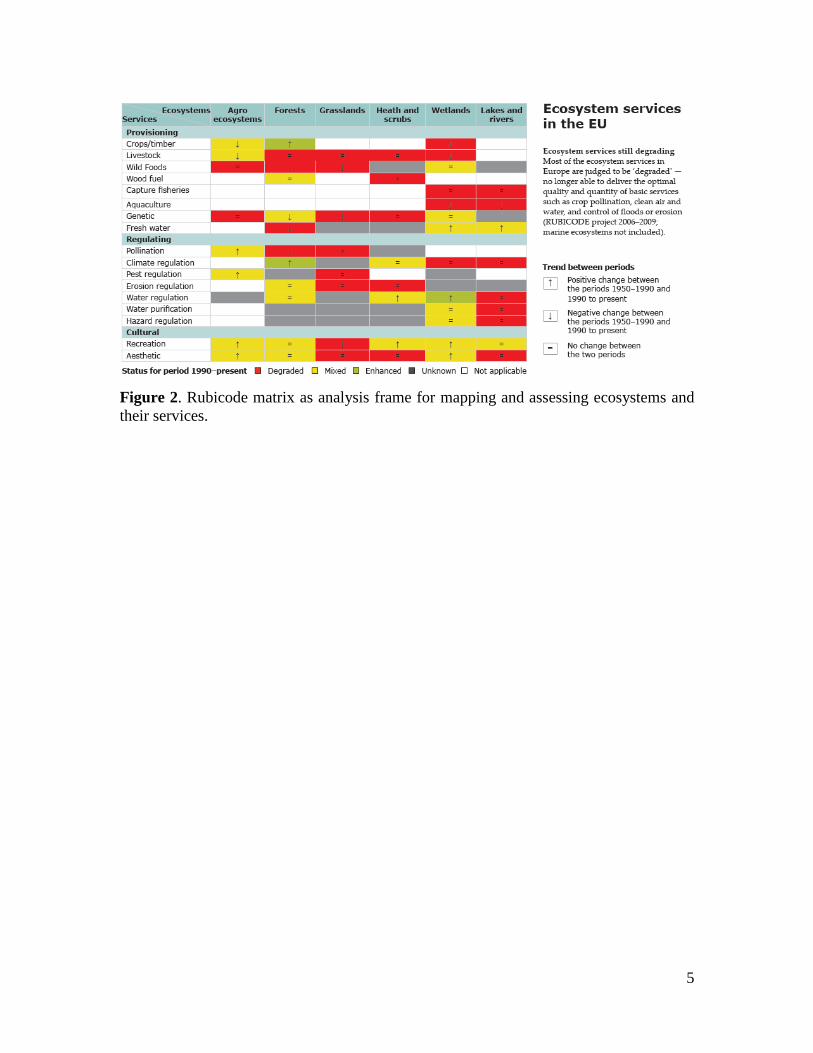
As a first step, it is proposed to build on the current knowledge delivered by projects such
as RUBICODE (FP7 coordination action on trends in ecosystem services)2, TEEB (The
Economics of Ecosystems and Biodiversity)3, CICES (Common International
Classification of Ecosystem Services)4 and PRESS (the JRC led PEER initiative on
mapping ecosystem services)5 in order to develop a methodological framework for
mapping and assessing the status of ecosystems and their services in Europe. There was
consensus among the members of the working group that such a framework should be
structured using a so called “Rubicode matrix” (Figure 2) which cross tabulates
ecosystems with their services for the terrestrial environment. The matrix structure will
help to map present knowledge and knowledge gaps at different spatial scales and allow
for selecting a set of main ecosystems for status assessment and defined services for
mapping by 2014.
The matrix structure is furthermore seen as a logical structure to bring together current
mapping of ecosystem services by JRC, EEA, and FP7 projects with the outcome of
Member States reporting on a number of environmental issues, including the
conservation status of protected habitat types and species, the ecological status of water
bodies and the environmental status of marine waters. The implementation needs to
provide entry points for species, species assemblages/communities, habitat types, forest
types as elements underpinning the delivery of ecosystem services.
In addition, a matrix structure helps identifying what kind of knowledge is already
available and how it can be used for linking the state of ecosystems to the delivery of
services and what are the main gaps in both ecosystem and ecosystem services mapping
and assessment. Such a gap analysis may show opportunities to fill some of these gaps at
the appropriate scale in a cost-effective manner. For instance, experiences and results
obtained in one MS could be used for mapping and assessing in another MS using value
transfer methodologies within areas situated in a similar biogeographical region and/or
socioeconomic context. Another example is that some ecosystems (forests) or some
ecosystem services (carbon sequestration of above ground biomass) can possibly be
mapped at high resolution at global or continental level based on earth observation data
and could be downscaled to national levels.
2 http://www.rubicode.net/rubicode/index.html 3 http://www.teebweb.org/ 4 Common International Classification of Ecosystem Services (CICES) v2 http://cices.eu/ 5 http://www.peer.eu/projects/press/
5
Figure 2. Rubicode matrix as analysis frame for mapping and assessing ecosystems and
their services.

6
3. Filling the Rubicode matrix with columns and rows
The Rubicode matrix can potentially hold 4 types of information: ecosystems (column
headings), services (row headings), the status of ecosystems and their importance in
delivering services (for instance by adding colours that reflect conservation or ecological
status), and trends in the delivery of services by different ecosystems (presented by
arrows or quantified by data of biophysical flow or monetary value).
3.1. Typology of ecosystems
The selection of broad habitat types or ecosystems that can be assessed for their status
and their contribution in delivering ecosystem services needs to be carefully chosen to
ensure both a balanced representation of important European ecosystems and meaningful
aggregation of current continental or national land cover types and marine unit(s) as well
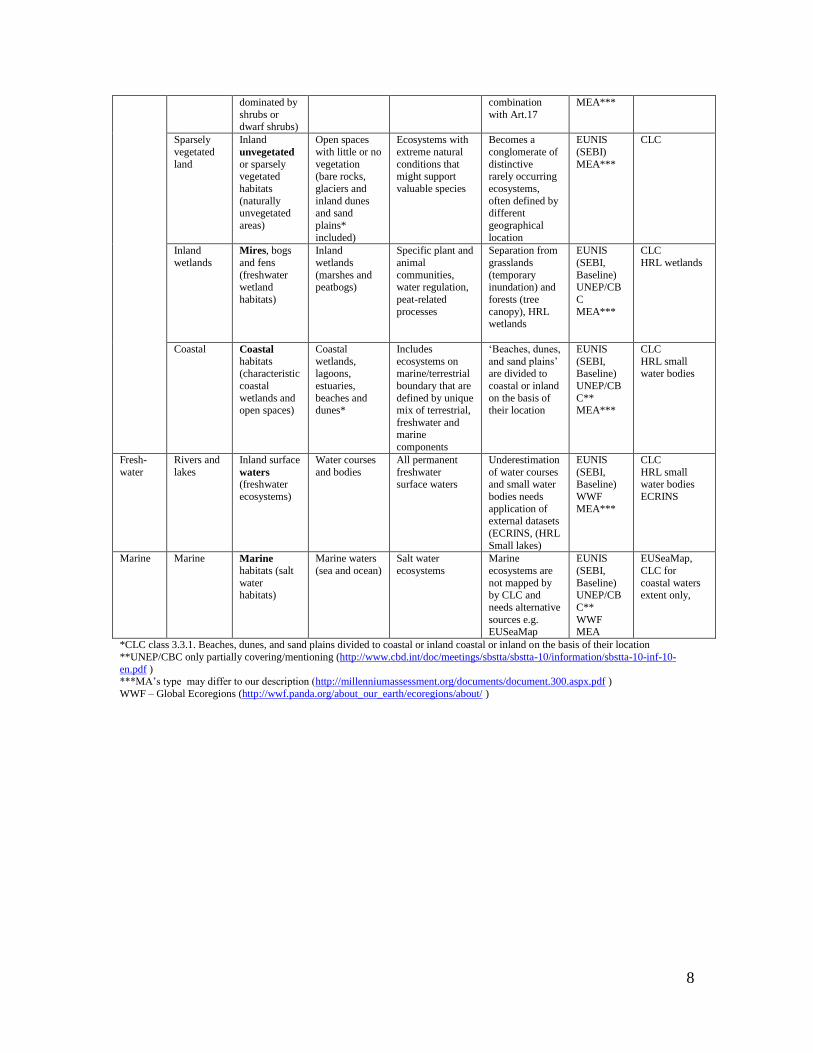
as of habitats that are listed under Annex 1 of the Habitats directive. According to the EU
Biodiversity Baseline 2010, the proposed ecosystem classification shown in table 1 is
based on combination of Corine land cover (CLC) adjusted with EUNIS habitat types
where necessary.
Proposal I for an ecosystem typology
The use of the ecosystem classification in table 1 is proposed as basic units for ecosystem
mapping at European and national scale. The 12 classes should allow for consistent
assessments from local to European scale. Information from more detailed classification
and higher spatial resolution should be compatible with the European-wide classification
and could be aggregated in a consistent manner if needed. If required aggregated sub-
/trans-national classes such as ‘mountainous areas’ or ‘coastal zones’ can be generated
using the proposed ecosystem classes as baseline. The mixed class ‘agricultural mosaics’
is introduced to maintain full coverage at European and national scale without losing the
specific characterization of this class with its high value for biodiversity and other
ecosystem functions and services. Methods to attribute ecosystem functions to mixed
classes will be evaluated.

7
Table 1. Proposal II for ‘ecosystem mapping’ at European level as refinement of the
EU 2010 Biodiversity Baseline (EEA 2012 work in progress).
Major
eco-system
category
(level 1)
Ecosystem
type for mapping
and
assessment (level 2)
Representatio
n of habitats (functional
dimension by
EUNIS)
Representation
of land cover (spatial
dimension)
Benefits of
mapping
Problems of
mapping
Listed as
ecosystems, major
habitat
types or reporting
categories
in
Spatial data
availability
Terre-strial
Urban Constructed, industrial and
other
artificial habitats
Urban, industrial,
commercial
and transport areas, urban
green areas,
mines, dump
and
construction
sites
Urban areas represent mainly
human habitats
but they usually include
significant areas
for synanthropic
species
CLC’s coarse resolution that
needs to be
complemented e.g. by Urban
atlas (ca 300
cities) and HRL
Imperviousness
EUNIS (SEBI)
UNEP/CB
C MEA
CLC Urban Atlas
HRL
Imperviousness
Cropland
Regularly or
recently
cultivated agricultural,
horticultural
and domestic habitats
Annual and
permanent
crops
Main food
production areas,
intensively managed
ecosystems
Habitat
classification
(e.g. EUNIS) includes
permanent crops
into Heathland and scrub
EUNIS
(SEBI,
Baseline) UNEP/CB
C
MEA
CLC
Agricultura
l mosaic
Agro-
ecosystems with
significant
coverage of natural
vegetation
Heterogeneous
agricultural areas that
occur as a
single complex at a given
spatial scale
Multifunctional
area supporting many semi- and
natural species
along with food production (lower
intensity
management)
It is a mixed
class type, but. merging with
any other
ecosystem type would lose either
production or
biodiversity
functions.
EUNIS
(SEBI) UNEP/CB
C***
CLC, HNVF
Grassland Grasslands and land
dominated by forbs, mosses
or lichens
Pastures and
natural
grasslands
Areas dominated
by grassy
vegetation of two kinds – managed
pastures and
natural (extensively
managed)
grasslands
Distinction
between
intensively used and more natural
grasslands
requires additional
datasets (Art.
17)
EUNIS
(SEBI,
Baseline) UNEP/CB
C
WWF MEA***
CLC
HRL
grasslands
Woodland
and forest
Woodland,
forest and
other wooded land
Forests Climax
ecosystem type
on most of the area supporting
many ecosystem
services
Missing
information on
quality and management
requires
additional datasets (Art. 17,
HRL forest)
EUNIS
(SEBI,
Baseline) UNEP/CB
C
WWF MEA
CLC
HRL forests
Transitional woodland
Transitional ecosystems
due to land
abandonment, forest
management
or regeneration
processes
Transitional woodland
shrub
Describes essential dynamic
of ecosystems
transition on forest-nonforest
boundary
(afforestation of open land or
internal forest
management processes)
Need good interpretation of
involved process
type (by location or previous land
cover changes)
EUNIS (SEBI)
CLC HRL forests (?)
Heathland
and shrub
Heathland,
scrub and
tundra (vegetation
Moors,
heathland and
sclerophyllous vegetation
Mostly secondary
ecosystems with
unfavourable natural conditions
Mapping the
condition of
these areas requires
EUNIS
(SEBI,
Baseline) WWF
CLC
8
dominated by
shrubs or dwarf shrubs)
combination
with Art.17
MEA***
Sparsely
vegetated
land
Inland
unvegetated or sparsely vegetated
habitats
(naturally unvegetated
areas)
Open spaces
with little or no
vegetation (bare rocks,
glaciers and
inland dunes and sand
plains*
included)
Ecosystems with
extreme natural
conditions that might support
valuable species
Becomes a
conglomerate of
distinctive rarely occurring
ecosystems,
often defined by different
geographical
location
EUNIS
(SEBI)
MEA***
CLC
Inland
wetlands
Mires, bogs
and fens
(freshwater wetland
habitats)
Inland
wetlands
(marshes and peatbogs)
Specific plant and
animal
communities, water regulation,
peat-related
processes
Separation from
grasslands
(temporary inundation) and
forests (tree
canopy), HRL wetlands
EUNIS
(SEBI,
Baseline) UNEP/CB
C
MEA***
CLC
HRL wetlands
Coastal
Coastal
habitats (characteristic
coastal
wetlands and open spaces)
Coastal
wetlands, lagoons,
estuaries,
beaches and dunes*
Includes
ecosystems on marine/terrestrial
boundary that are
defined by unique mix of terrestrial,
freshwater and marine
components
‘Beaches, dunes,
and sand plains’ are divided to
coastal or inland
on the basis of their location
EUNIS
(SEBI, Baseline)
UNEP/CB
C** MEA***
CLC
HRL small water bodies
Fresh-
water
Rivers and
lakes
Inland surface
waters
(freshwater
ecosystems)
Water courses
and bodies
All permanent
freshwater surface waters
Underestimation
of water courses and small water
bodies needs
application of external datasets
(ECRINS, (HRL
Small lakes)
EUNIS
(SEBI, Baseline)
WWF
MEA***
CLC
HRL small water bodies
ECRINS
Marine Marine
Marine habitats (salt
water habitats)
Marine waters
(sea and ocean)
Salt water
ecosystems
Marine
ecosystems are
not mapped by by CLC and
needs alternative
sources e.g. EUSeaMap
EUNIS
(SEBI,
Baseline) UNEP/CB
C**
WWF MEA
EUSeaMap,
CLC for
coastal waters extent only,
*CLC class 3.3.1. Beaches, dunes, and sand plains divided to coastal or inland coastal or inland on the basis of their location
**UNEP/CBC only partially covering/mentioning (http://www.cbd.int/doc/meetings/sbstta/sbstta-10/information/sbstta-10-inf-10-
en.pdf ) ***MA’s type may differ to our description (http://millenniumassessment.org/documents/document.300.aspx.pdf )
WWF – Global Ecoregions (http://wwf.panda.org/about_our_earth/ecoregions/about/ )

9
3.2. Typology of ecosystem services
Three international classification systems are available to classify ecosystem services:
MA, TEEB and CICES. In essence, they relate to a large extent to each other; all three
include provisioning, regulating and cultural services. The correspondence between these
classifications is illustrated in Table 2. Each classification has its own advantages and
disadvantages.
Table 2. Ecosystem services categories
MA categories TEEB categories CICES class
Food Food
Provisioning
services
Nutrition Fresh water Water
Fibre Raw Materials
Materials Genetic resources Genetic resources
Biochemicals Medicinal resources
Ornamental resources Ornamental resources
Energy
Air quality regulation Air quality regulation
Regulating
services
(MA and
TEEB)
Regulating
and
maintenance
(CICES)
Regulation of wastes
Water purification and
water treatment
Waste treatment (water
purification)
Water regulation Regulation of water flows
Flow regulation Moderation of extreme events
Erosion regulation Erosion prevention
Climate regulation Climate regulation Regulation of biophysical
conditions and biophysical
environment Soil formation
(supporting services) Maintenance of soil fertility
Pollination Pollination
Regulation of biotic
environment
Pest regulation Biological control
Disease regulation
Primary production
Nutrient cycling
Maintenance of life cycles of
migratory species (incl. nursery
service)
Maintenance of genetic
diversity (especially in gene
pool protection)
Spiritual and religious
values
Spiritual experience
Cultural
services
Symbolic
Aesthetic values Aesthetic information
Cultural diversity Inspiration for culture, art and
design
Recreation and
ecotourism
Recreation and tourism
Intellectual and experiential Knowledge systems
and educational values
Information for cognitive
development
MA provides a
classification that is
globally recognised
and used in sub global
assessments.
TEEB provides an updated
classification, based on the
MA, which is used in on-going
national TEEB studies across
Europe
CICES provides a
hierarchical system tailored
to accounting and includes
also abiotic resources and
energy

10
MA
The Millennium Ecosystem Assessment (MA) organises ecosystem services into four
well known groups:
1. provisioning,
2. regulating,
3. cultural and
4. supporting services.
TEEB
TEEB proposes a typology of 22 ecosystem services divided in 4 main categories, mainly
following the MA classification:
1. provisioning,
2. regulating,
3. habitat and
4. cultural & amenity services,.
An important difference TEEB adopted was the omission of supporting services, which
are seen in TEEB as a subset of ecological processes. Instead, habitat services have been
identified as a separate category to highlight the importance of ecosystems to provide
habitat for migratory species (e.g. as nurseries) and gene-pool “protectors” (e.g. natural
habitats allowing natural selection processes to maintain the vitality of the gene pool).
The availability of these services is directly dependent on the status of the habitat (habitat
requirements) providing the service. In case commercial species are involved, such as
fish and shrimp species that spawn in mangrove systems (= nursery service) but of which
the adults are caught far away, this service has an economic (monetary) value in its own
right. Also the importance of the gene-pool protection service of ecosystems is
increasingly recognized, both as “hot spots” for conservation (in which money is
increasingly invested) and to maintain the original gene-pool of commercial species
(which we are increasingly being imitated through the creation of botanic gardens, zoos
and gene banks)..
CICES
The Common International Classification of Ecosystem Services (CICES, draft V1)
offers a structure that links with the framework of the UN System of Environmental-
Economic Accounts (SEEA 2003) currently revised with an update to be published in
2013 and with other standard classifications for activities and products used in the
System of National Accounts, namely: the International Standard Industrial
Classification of All Economic Activities (ISIC V4), the Central Products Classification

11
(CPC V2), and the Classification of Individual Consumption by Purpose (COICOP).
CICES also correlates to the TEEB classification of ecosystem services. The relationships
between CICES/TEEB and the other environmental accounting tables are neither all-
inclusive nor biunivocal (i.e. not all the service classes are found in the different
accounting tables and vice versa, and two matched terms do not necessarily represent the
same). These relationships are especially poor for the regulating services but are under
revision since they were not considered in traditional environmental accounts.
Annex: CICES classification version 4 (Haines-Young, personal communication)
Proposal III for ecosystem services categories
The general framework developed by CICES (in particular the so-called service classes
of CICES V4 shown in Table 2) is proposed to be used so that cross-reference can be
made between ecosystem services and the other instruments for environmental
accounting mentioned above. This very general level of classification is suggested with
the aim of providing a flexible and hierarchical classification that can be adapted to the
specific situation and needs of Member States. Within each of the 9 broad service classes
Table 3 provides a list of examples of specific services that can be assessed. It is
proposed to assess the ecosystem services, which are generated by living ecosystems and
which are dependent on biodiversity or on ecosystem processes. Therefore, abiotic
environmental outputs (e.g. minerals, wind energy), already included in other
environmental accounting frameworks, will not be covered by this assessment
framework.

12
Table 3. Examples of ecosystem services that can be included within each service class
of the CICES classification.
Nutrition
Provision of food crops
Provision of meat
Provision of fish and shellfish
Provision of wild plants or algae for food
Provision of drinking water
Materials
Provision of raw materials like timber, leather, cooling or irrigation water, chemical
compounds…
Provision of ornamental resources, like cut flowers or shells
Provision of genetic resources
Provision of natural medicinal resources or exemplar for synthetic compounds
Energy
Provision of wood fuel
Provision of energy crops or algae
Provision of biogas from manure
Regulation of wastes
Air purification by vegetation, soil or water bodies
Water purification
Regulation against hazards
Floods attenuation
Water storage
Coastal protection
Air flow regulation
Erosion prevention
Regulation of physical environment
Climate regulation
C sequestration
Maintenance of soil fertility
Regulation of biotic environment
Lifecycle maintenance
Gene pool protection
Pollination / Seeds, eggs or gametes dispersal
Biological control
Symbolic
Inspiration for culture, art or design
Aesthetic information
Spiritual experience
Intellectual and Experiential
Recreation and tourism
Information for science or education

13
4. Ecosystem assessment
4.1. Conceptual model(s)
An ecosystem assessment is analysing the interactions between human society and nature
at a certain spatial scale over given geographic and temporal scopes. Figures 3 and 4
present a possible conceptual framework for an EU ecosystem assessment linking the
status of ecosystems to the delivery of multiple ecosystem services.
Figure 3. The ecosystem service cascade embedded in the adaptive DPSIR indicator and
management cycle after Haines-Young and Potschin (2010)6, de Groot et al. (2010)
7,
Kandziora et al. in press8.
Drivers – human activities that cause pressures on the natural environment
Pressures – the manner through which drivers act upon state
State – measure of ecosystem functioning and integrity
Impacts – measures of human welfare (including indirect effects such as the
knowledge that a particular species is endangered)
Responses – effects of impacts on other DPSIR components through policy response
6 Haines-Young, R., Potschin, M., 2010, Proposal for a Common International Classification of Ecosystem
Goods and Services (CICES) for Integrated Environmental and Economic Accounting, Report to the EEA. 7 De Groot, R.S., Alkemade, R., Braat, L., Hein, L., Willemen, L., 2010. Challenges in integrating the
concept of ecosystem services and values in landscape planning, management and decision making. Ecol.
Complex. 7, 260-272 8 Kandziora, M., Burkhard, B., Müller, F. (in press). Interactions of ecosystem properties, ecosystem
integrity and ecosystem services indicators – A theoretical matrix exercise. Ecological Indicators.

14
Figure 4. Conceptual framework for the bio-physical baseline of ecosystems and services
in context of the targets of the EU Biodiversity Strategy to 2020 (EEA 2012). ‘Ecosystem
Services’ represent the use of renewable natural capital for human wellbeing. It is also
the entry point for the valuation exercise foreseen after 2014.
Drivers –activities to make use of ecosystem services for human wellbeing;
Pressures – processes affecting ecosystem functioning triggered by human activities;
State – ecosystem functioning as combination of biotic and abiotic environmental conditions and
pressures;
Impacts – changes in ecosystem functioning;
Response – measures to cope with impacts to maintain ecosystem services for long-term human
well-being.
Both figures are embedding ecosystem services into the DPSIR model. European
environmental assessments are frequently framed based on the DPSIR methodology. The
state (S) is the result of specific drivers (D) and pressures (P), positive or negative, which
impact (I) the environment. The responses (R) represent the solutions (e.g. policies,
15
investments) for what should then be done to improve or maintain that state (EEA, SOER
2010).
The ecosystem services cascade (which is explicitly presented in Figure 3) is a useful
concept to frame spatially explicit, quantitative assessments of ecosystems, ecosystem
services and benefits. This framework is based on the TEEB study and links biodiversity
and ecosystems to human wellbeing through the flow of ecosystem services (Figure 3).
Ecosystems provide the necessary structures and processes that underpin ecosystem
functions which are defined as the capacity or potential to deliver services. Ecosystem
services are derived from ecosystem functions and represent the realized flow of services
in relation to the benefits of people. Importantly, the framework considers natural capital
as the stocks of natural assets which have capacity to deliver services and ES as the flows
of benefits that people receive and which are generated by these assets.
The state of ecosystems connects the DPSIR model to ecosystems under the assumption
that healthy ecosystems in a good state are necessary to provide multiple services. The
impact that an altered supply of services has on our wellbeing provides a second linkage
between the cascade model and the DPSIR cycle. Maintaining the balance between the
different services of each ecosystem for sustainable delivery of its multiple services is the
entry point for decision processes and policy measures.
The framework can integrate different sorts of information which are relevant for
ecosystem assessment: (1) the state of ecosystems in Europe, (2) the flow of ecosystem
services from ecosystems to society and human wellbeing , (3) the value derived from
changes in ecosystem service supply and (4) plausible scenarios and outlooks for social
and economic change across Europe that affect via the DPSIR cycle the supply of and
demand for ecosystem services.
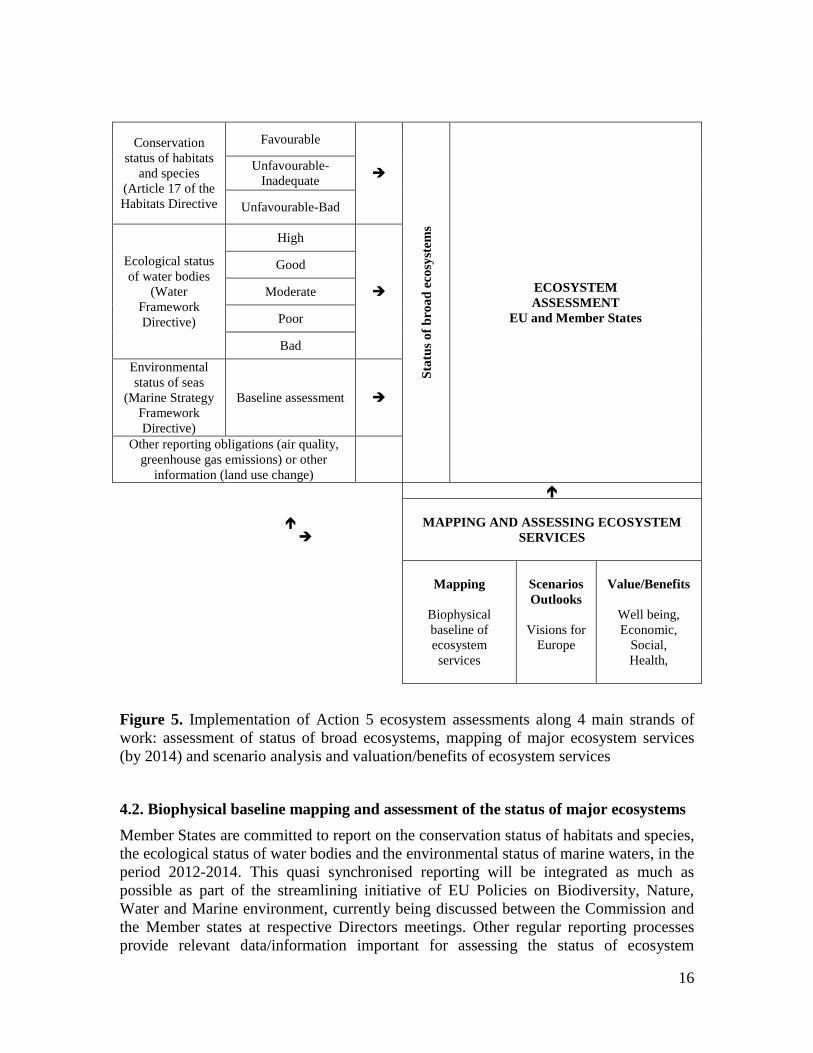
The typology of ecosystems versus services can now be used for an ecosystem
assessment (Figure 5). Such an assessment will follow four strands of work, which link
well to the DPISR-Cascade framework:
1. Biophysical baseline mapping and assessment of the status of major ecosystems
2. Biophysical baseline mapping and assessment of defined ecosystem services
3. Alignment of ecosystem service assessments with scenarios of future changes
(Future outlooks)
4. Valuation of ecosystem services for baseline and contrasting scenarios and
integration into environmental and economic accounting
With the first two tasks to be performed until 2014 and therefore key objectives of this
paper and the third and fourth to be foreseen after 2014.
16
Conservation
status of habitats
and species
(Article 17 of the
Habitats Directive
Favourable
Sta
tus
of
bro
ad
eco
syst
ems
ECOSYSTEM
ASSESSMENT
EU and Member States
Unfavourable-
Inadequate
Unfavourable-Bad
Ecological status
of water bodies
(Water
Framework
Directive)
High
Good
Moderate
Poor
Bad
Environmental
status of seas
(Marine Strategy
Framework
Directive)
Baseline assessment
Other reporting obligations (air quality,
greenhouse gas emissions) or other
information (land use change)
MAPPING AND ASSESSING ECOSYSTEM
SERVICES
Mapping
Biophysical
baseline of
ecosystem
services
Scenarios
Outlooks
Visions for
Europe
Value/Benefits
Well being,
Economic,
Social,
Health,
Figure 5. Implementation of Action 5 ecosystem assessments along 4 main strands of
work: assessment of status of broad ecosystems, mapping of major ecosystem services
(by 2014) and scenario analysis and valuation/benefits of ecosystem services
4.2. Biophysical baseline mapping and assessment of the status of major ecosystems
Member States are committed to report on the conservation status of habitats and species,
the ecological status of water bodies and the environmental status of marine waters, in the
period 2012-2014. This quasi synchronised reporting will be integrated as much as
possible as part of the streamlining initiative of EU Policies on Biodiversity, Nature,
Water and Marine environment, currently being discussed between the Commission and
the Member states at respective Directors meetings. Other regular reporting processes
provide relevant data/information important for assessing the status of ecosystem

17
functioning - such as air quality, statistical data about agricultural yields, timber etc.
including through the reporting to the UN Conventions. Additional information is also
available (but not necessarily accessible) from national and European activities,
especially GMES (Global Monitoring for Environmental Security Programme) and
research projects. At European scale, these data represent a primary data source for
assessing the status of ecosystems. Most environmental data sets from national reporting
are made available by European bodies such as the European Environment Agency
(EEA) in cooperation with the European Topic Centres (ETCs), Eurostat and DG
Environment through the European Data Centres. Environment-relevant data/information
is also available in other EC services and related agencies (e.g. International Council for
the Exploration of the Sea - ICES for marine information).
Proposal IV for mapping and assessing the status of major ecosystems
EEA is currently assessing data availability and methods for ecosystem mapping and
assessment at European scale. As soon as the ecosystem classification and a priority list
for ecosystem services to be assessed up to 2014 are adopted, guidelines and
recommendations will be evaluated and distributed for review and comments.
4.3. Biophysical baseline mapping and assessment of defined ecosystem services
Research on mapping and assessment of ecosystem services is increasing. As a result of
different methodological approaches, different sets of indicators are being used to assess
a single service, resulting in different units in which ecosystem services are expressed.
For example, different proxies are often used to study air quality regulation including
fluxes in atmospheric gasses between vegetation and the air, atmospheric cleansing
capacity of leaves or levels of pollutants in the air. These discrepancies evidently have
implications for estimating monetary values. Thus, the need to standardize definitions for
each service and methods for mapping them is important in comparing results among
different EU Members States and measuring effectiveness of different policy measures.
Consistency in mapping approaches is therefore a major challenge.
Several approaches to map ecosystem services exist and reviews of methodologies are
available.
Deriving information on ecosystem services directly from land-use/cover or
habitat maps. Such approaches may be appropriate at national or European scales,
for areas where the dominant service relates directly to land use (e.g. crop and
timber production) or where data availability or expertise is limited, and where
the focus is on the assumed presence of ecosystem services rather than on
quantification of the supply. This method is often coupled to value transfer.
Ecosystem service values are transferred from existing valuation studies to other

18
areas using land cover data for value transfer. This approach cannot be so easily
applied to the marine environment.
Using primary data to map ecosystem services are used for provisioning services
where statistics are available. Examples include timber, food, or water supply.
Statistical data usually relate to certain administrative units.
Primary data are often not available for regulating, supporting, and cultural
services and we must rely on proxies for mapping these latter services. For
instance, the regulation of urban air quality by trees depends much on the size and
density of the leaves. A dense canopy is able to capture more particulate matter or
pollutants than sparse canopies. The leaf area index is therefore a possible
indicator to map this ecosystem service.
Recent mapping techniques are based on biological data such as functional traits
of plants or ecosystem structure and habitat data. Functional traits, such as
vegetative height, leaf dry matter content, leaf nitrogen and phosphorous
concentration, flowering onset, can be used to map several services. Habitat
classification, such as the European Nature Information System (EUNIS)
classification include detailed data on the associated biodiversity, which makes
their use reasonable in mapping relationships between biodiversity and ecosystem
services.
Models and derived indicators: For instance InVEST or ARIES or any other
biophysical/ecological model that can be adapted to map ecosystem services as
well. The JRC develops European scaled models for mapping ecosystem services
for instance in collaboration with the PEER network (under the PRESS project).
Proposal V for mapping ecosystem services
Once the matrix structure for the ecosystem assessment is adopted, methodological
guidelines on mapping ecosystem services can be drafted (JRC). These guidelines should
include a flexible set of indicators for mapping ecosystem services as well as mapping
tools, methodologies and training options.
4.4. Outlook and valuation
An outlook or scenario analysis showing the implications for biodiversity and ecosystem
services of different possible futures is an essential component of an ecosystem
assessment. Contrasting policy scenarios with baseline changes that arise from policy
measures can be valued in terms of changed in well-being. Valuation and outlook using
scenarios are foreseen to be carried out after 2014. Several activities and research projects
are working on methods and tools to provide the necessary instruments. At EEA,

19
Quickscan9 is currently tested for scenario analysis. JRC and EEA are evaluating
valuation methods to be feasible for national and European assessments.
Annexes
TEEB Glossary:
http://www.google.it/url?sa=t&rct=j&q=&esrc=s&source=web&cd=1&ved=0CHMQFjA
A&url=http%3A%2F%2Fwww.teebweb.org%2FLinkClick.aspx%3Ffileticket%3DSTcE
Gif4A10%253D%26tabid%3D1018%26language%3Den-US&ei=dIGnT82XPMeP-
wbq_IjwAg&usg=AFQjCNHngfV_JCJgP6gApGKLOEP4Fq3ayg&sig2=h84Iw41ECcq2
CXh7FRdU-g
CICES version 4
9 QUICKScan: A pragmatic approach for bridging gaps in the science-policy interface; Manuel Winograd (European Environment
Agency), Marta Perez-Soba (ALTERRA), Peter Verweij (ALTERRA), Rob Knappen (ALTERRA), LIAISE OPEN DAY, Bilbao, Spain, 14 March, 2012.

20
Theme Service Class Service Group Service Type Sub-types
Examples and indicative benefits TEEB Classes
Pro
visi
on
ing
Nutrition Terrestrial plant and animal foodstuffs
Commercial cropping eg. by crops
Cereals, vegetables, vines etc. Food
Subsistence cropping eg. by
crops Cereals, vegetables, vines etc.
Commercial animal
production eg. by animal type
Sheep, cattle for meat and dairy products
Subsistence animal
production eg. by animal type
Sheep, cattle for meat and dairy products
Harvesting wild plants and
animals for food eg. by resource
Berries, fungi etc
Freshwater plant and animal foodstuffs
Commercial fishing (wild populations)
eg. by fishery
Subsistence fishing eg. by
fishery
Aquaculture eg. by
fishery
Harvesting fresh water
plants for food eg. by resource
Water cress
Marine plant and animal foodstuffs
Commercial fishing (wild populations)
eg. by fishery
Includes crustaceans
Subsistence fishing eg. by
fishery Includes crustaceans
Aquaculture eg. by
fishery Includes crustaceans
Harvesting marine plants
for food eg. by resource
Seaweed
Potable water Abstraction of surface
waters eg. by feature
Spring, well water, river, reservoir, lake, supply of domestic and bottled waters
Water

21
Abstraction of ground
waters eg. by habitat
Aquifers
Materials Biotic materials Non-food plant fibres eg. by
resource Timber, straw, flax Raw Materials
Non-food animal fibres eg. by
resource Skin, bone etc., guano
Ornamental resources eg. by resource
Bulbs, cut flowers, shells, bones and feathers etc.
Ornamental resources
Genetic resources eg. by resource
Wild species used in breeding programmes Genetic resources
Medicinal resources eg. by resource
Bio prospecting activities Medicinal resources
Abiotic materials Mineral resources eg. by resource
Salt, aggregates, etc. (include but EXCLUDE subsurface assets)
Energy Renewable biofuels
Plant based resources eg. by resource
Wood fuel, energy crops etc.
Animal based resources eg. by resource
Dung, fat, oils
Renewable abiotic energy sources
Wind eg. by resource
Hydro eg. by resource
Solar eg. by resource
Tidal eg. by resource
Thermal eg. by resource
Re
gula
tio
n a
nd
Mai
nte
nan
ce
Regulation of wastes
Bioremediation Remediation using plants eg. by method
Phytoaccumulation, phytodegredation, phytostabilisation, rhizodegradation, rhizofiltration, vegetation cap
Remediation using micro-organisms
eg. by method
In situ (Bioremediation), ex situ (composting), bioreactors
Dilution and sequestration
Dilution eg. by method
Wastewater treatment

22
Filtration eg. by method
Filtration of particulates and aerosols Air purification
Sequestration and absorption
eg. by method
Sequestration of nutrients in organic sediments, removal of odours
Flow regulation Air flow regulation
Windbreaks, shelter belts eg. by process
Disturbance prevention or moderation
Ventilation eg. by process
Water flow regulation
Attenuation of runoff and discharge rates
eg. by process
Woodlands, wetlands and their impact on discharge rates
Regulation of water flows
Water storage eg. by process
Irrigation water
Sedimentation eg. by process
Navigation
Attenuation of wave energy
eg. by process
Mangroves
Mass flow regulation
Erosion protection eg. by process
Wetlands reducing discharge peak Erosion prevention
Avalanche protection eg. by process
Stabilisation of mudflows, erosion protection [reduction]
Regulation of physical
environment
Atmospheric regulation
Global climate regulation (incl. C-sequestration)
eg. by process
Atmospheric composition, hydrological cycle Climate regulation (incl. C-sequestration)
Local & Regional climate regulation
eg. by process
Modifying temperature, humidity etc.; maintenance of regional precipitation patterns
Water quality regulation
Water purification and oxygenation
eg. by process
Nutrient retention in buffer strips etc. and translocation of nutrients
Cooling water eg. by process
For power production
Pedogenesis and soil quality regulation
Maintenance of soil fertility
eg. by process
Green mulches; n-fixing plants Maintaining soil fertility
Maintenance of soil structure
eg. by process
Soil organism activity

23
Regulation of biotic
environment
Lifecycle maintenance & habitat protection
Pollination eg. by process
By plants and animals Lifecycle maintenance
Seed dispersal eg. by process
By plants and animals Pollination
Pest and disease control
Biological control mechanisms
eg. by process
By plants and animals, control of pathogens Biological control
Gene pool protection
Maintaining nursery populations
eg. by process
Habitat refuges Gene pool protection
Cu
ltu
ral
Symbolic Aesthetic, Heritage
Landscape character eg. by resource
Areas of outstanding natural beauty Inspiration for culture, art and design
Cultural landscapes eg. by resource
Sense of place Aesthetic information
Spiritual Wilderness, naturalness eg. by resource
Tranquillity, isolation Spiritual experience
Sacred places or species eg. by resource
Woodland cemeteries, sky burials
Intellectual and Experiential
Recreation and community activities
Charismatic or iconic wildlife or habitats
eg. by resource
Bird or whale watching, conservation activities, volunteering
Recreation & tourism
Prey for hunting or collecting
eg. by resource
Angling, shooting, membership of environmental groups and organisations
Information & knowledge
Scientific eg. by resource
Pollen record, tree ring record, genetic patterns Information for cognitive development
Educational eg. by resource
Subject matter for wildlife programmes and books etc.