mapping and modelling ecosystem services to explore ... · pdf filemapping and modelling...
TRANSCRIPT

Mapping and M
odelling Ecosystem S
ervices to Explore Characteristics of S
ocio-Ecological Systems
Katrine Grace Turner
The PhD-project studies how humans use the goods and benefits of nature, ecosystem services. Case studies of the socio-ecological systems in Denmark show ecosystem ser-vices have a distinct pattern in the landscape at a regional scale, and form bundles of services. A screening method based on the services’ bundle profiles identify potential wa-tersheds for reconstructing wetlands, based on three sce-narios. A conjoined hotspot analysis show synergistic and potential policy independent hotspots. Lastly, it includes a review of methods, models, and databases used to deter-mine changes in ecosystem service values with land degra-dation, on a global scale.
Brabrand Sø urban wetlands (Katrine Grace Turner), Multi-functional landscape from Ø Bakker (Mette Vestergaard Od-gaard), Scenario map of ecosystem services (Katrine Grace Turner)
ISBN 978-87-93176-94-2
Mapping and Modelling Ecosystem Services to Explore Characteristics of Socio-Ecological Systems
Katrine Grace TurnerPhD Dissertation Department of Agroecology, Science and TechnologySeptember 2015
DEPARTMENT OF AGROECOLOGY
AARHUS UNIVERSITY AU
Mapping and Modelling Ecosystem Services
to Explore Characteristics of Socio-
Ecological Systems
PhD Dissertation
Katrine Grace Turner
Foulum, September 2015

Table of Contents Abstract ........................................................................................................................................ 1
Sammendrag ................................................................................................................................ 2
Acknowledgements ...................................................................................................................... 3
1. Introduction .......................................................................................................................... 5
1.1. Ecosystem Services and Human Well-Being ........................................................... 5
1.2. Spatial Properties of Ecosystem Services ................................................................. 8
1.3. Study Framework ...................................................................................................... 9
1.3.1. Scale .................................................................................................................... 11
1.3.2. Socio-Ecological Systems .................................................................................. 17
1.4. Conclusion ............................................................................................................... 21
2. Research Questions and Aim of Ph.D.-Project .................................................................. 23
2.1. Introduction to Papers ............................................................................................ 24
3. References to Introduction ................................................................................................. 32
4. Papers .................................................................................................................................. 39
4.1. Bundling Ecosystem Services in Denmark:
Synergies and Trade-offs in a Cultural Landscape ............................................... 40
4.2. Reconstructing Wetlands: Catchment Selection by Ecosystem Services –
Present and Future Scenarios for Denmark – Draft ............................................. 56
4.3. The Economics of Land Degradation: A review of methods, data, and models to
assess the changes in value of ecosystem services from land degradation and
restoration ............................................................................................................... 85
5. Concluding Remarks and Perspectives ............................................................................ 103
6. Paper Appendices ................................................................................................................. 107
6.1. Paper III Appendix ............................................................................................... 108
6.2. Additional Papers and Proceedings ..................................................................... 134
6.2.1. Dalgaard et al. In press .................................................................................... 135

6.2.2. König et al. In press .......................................................................................149
6.2.3. IARU Conference Poster ................................................................................ 151
6.2.4. ESP Conference Abstract ............................................................................... 152
Abstract
Ecosystem services are the benefits society gains from nature. Wherever humans live complex
socio-ecological systems are formed. In this PhD project I studied the dynamics and interactions
of ecosystem services in Denmark and globally, to analyze and map these socio-ecological
systems. Socio-ecological systems are spatially specific and Geographic Information Systems
(GIS) is appropriate for the analyses. In general, the ecologic process scale is rooted in the
ecosystem, but benefits can reach far beyond these local settings, and institutional or
administrative boundaries can become a challenge for managing ecosystem services. In
comparison, the social scale of the ecosystem services, which represent the beneficiaries of the
ecosystem services, depends on both direct and indirect stakeholders. If important stakeholders
or ecosystem services are overlooked it can lead to conflicts and mismanagement of the
ecosystems.
The assessment scale should reflect the appropriate ecological scale for aggregation and the
intended audience. In practice, as in any complex models, there is a trade-off between
aggregation scale and specificity of the analyses. To deal with the complexity of the two-sided
socio-ecological system, it could be helpful to approach the issue with post-normal scientific
approaches, where attention is turned to evaluation of the social processes through stakeholder
participation, reflexive analysis and deliberation. Through the process of democratizing
knowledge, society as a whole, made up of its individual parts, can thus decide on what is a
sustainable and desirable common future.
Case studies of the socio-ecological system in Denmark revealed that ecosystem services show a
highly non-random distribution pattern across the country. Rural areas in Western Denmark are
dominated by agroecosystem and wetland services, whereas the more urbanized areas in Eastern
Denmark are dominated by forest-based recreational services. We identified six distinct
ecosystem service bundles that corresponded to other landscape scale studies and characterizes
the underlying socio-ecological system. This indicates a potential to utilize and further develop
on the existing synergies in these bundles, as well as mitigating potential negative trade-offs in
landscape scale management.
The current methods and models are not well-equipped to handle large-scale, finely aggregated,
transdisciplinary analyses and there is a need for further development of these integrated
approaches. We developed a screening method that uses ecosystem services bundle profiles to
identify potential hotspots for establishing constructed wetlands, based on different policy
scenarios, as well as identify synergy hotspots that were potentially policy-independent.
1
Sammendrag
Økosystemtjenester er de goder og services fra naturen der har indflydelse på vores
velbefindende. Hvor end mennesker lever, opstår komplekse socio-økologiske systemer. I dette
ph.d.-projekt undersøgte jeg dynamikken og samspillet mellem økosystemtjenester i Danmark
og globalt for at analysere og kortlægge de socio-økologiske systemer. Socio-økologiske systemer
er rumligt specifikke og dermed er programmet Geografiske Informations Systemer (GIS) et
velegnet værktøj til denne type analyser. Generelt er den økologiske processkala økosystemet,
men services kan nå langt ud over et lokalt plan, og institutionelle og administrative grænser kan
give udfordringer for forvaltningen af økosystemtjenester. Den sociologiske skala er defineret af
modtagerne af tjenesterne, dvs. både direkte og indirekte interessenter. Hvis vigtige
interessenter eller økosystemtjenester bliver overset, kan det føre til konflikter og dårlig
forvaltning af økosystemerne.
Vurderingsskalaen bør afspejle den relevante økologiske skala for sammenlægning af data og
reflektere den tiltænkte målgruppe af interessenter. Praktisk set sker der, som i enhver anden
kompleks model, en afvejning mellem aggregeringens omfang og analysens specificitet. Når man
beskæftiger sig med kompleksiteten af det socio-økologiske system, kan det være nyttigt at tackle
spørgsmålene med post-normale videnskabelige tilgange, hvor fokus ligger i evaluering af de
sociale processer gennem interessentdeltagelse, refleksiv analyse og overvejelse. Gennem
demokratisering af viden, kan samfundet som helhed, bestående af de enkelte dele, således
bedre beslutte, hvad der er en bæredygtig og ønskværdig fælles fremtid.
Udvalgte analyser af det danske socio-økologiske system viste, at økosystemtjenester ikke har en
vilkårlig fordeling på tværs af landskabet. De vestlige egne domineres primært af agroøkosystem-
og vådområde-relaterede tjenester, mens de østlige egne domineres af skovbaserede og
rekreative tjenester. Vi identificerede seks distinkte økosystemtjeneste-bundter, der svarede til
andre lignende landskabsskala-studier og karakteriserer det underliggende socio-økologiske
system. Dette gør os i stand til at udnytte og videreudvikle de eksisterende synergier, samt
formilde hvad potentielle afvejninger i landskabet betyder.
De nuværende metoder og modeller er ikke godt rustede til at håndtere data på stor skala, i fint
aggregerede, og tværfaglige analyser, og der er behov for yderligere udvikling af disse
integrerende tilgange. Vi udviklede et screeningsværktøj og eksemplificerede brugen af
økosystemtjenesters bundtningsprofiler til at identificere potentielle hotspots til etablering af
konstruerede vådområder baseret på forskellige politiske scenarier, og endelig identificerede vi
hotspots for synergieffekter.
2

Acknowledgements
I would first like to thank my supervisors Dr. Tommy Dalgaard, Prof. Jens-Christian Svenning,
Dr. Peder Klith Bøcher, and Dr. Chris Kjeldsen, for all the help and guidance you have offered
me throughout the course of this PhD project. I really appreciate your great expertise and the
effort you have all put into my project. Especially, my main supervisor Tommy, who has been
very supportive of my ideas and believed in me and the project from day one, and at times where
I myself did not believe in it. You gave me the opportunities to see the world, and to work with
the best in the field, thank you so much for that. Also a huge thanks to Peder, who had
confidence in me and helped me to pursue my PhD dreams in the first place. Thank you for your
great spirits, and for being able to be a good friend while still gracefully balancing in the act as a
supervisor.
Another, very deep-felt thanks goes out to Dr. Mette Vestergaard Odgaard. Mette, you have been
a rock for the past five years. I thank you for all the great talks, about both PhD-life and life in
general. You are always ready to offer your support to all of us, every time we need it, regardless
of your own load. You are an inspiration. The same goes for Morten Graversgaard, one of the
most helpful people I have ever met, thank you for that.
I also want to thank Profs. Bob Costanza and Ida Kubiszewski at Crawford School of Public
Policy at Australia National University in Canberra, for having me stay at ANU. It was truly a
life-altering experience, and I am so very grateful for all your guidance, the great company, and
friendship you offered. Also Sue Ogilvy, Saioa Sesé, Prof. Carsten Daugbjerg and Marianne
Lybek Witt, and everybody else at both ANU and in Canberra, thank you for making my stay
such a good experience.
Furthermore, I would like to acknowledge all my colleagues at Agroecology in Foulum and
Ecoinformatics & Biodiversity in Aarhus, who have helped me along the way: Inge T. Kristensen,
Mette Greve, Ranjan Pajuli, Martin Thorsøe, Dan Kristian Kristensen, Michele De Rosa, Mette
Kronborg, Marta Gruca, Jonas Nüchel, Alejandro Ordonez, Naia Morueta Holme. You have
made these last three years a lot more fun and interesting. Thanks for your inputs, wild ideas,
and great company. Another special thanks goes out to Dr. Annika Büchert Lindberg and Jørgen
Baungaard Hansen for inspiration and support.
I am also grateful to people that have collaborated with me along the way, Prof. Mette
Termansen (AU Environmental Sciences, Risø) and the people at DCE in Roskilde, Dr. Christen
Duus Børgesen (AU Foulum), Prof. Henrik Vejre (KU), Dr. Jesper Moeslund (AU Biosciences,
Kalø), everyone at the DNMARK research alliance (www.dnmark.org) and the ELD Workshop in
3

Lincoln, NZ 2014. Furthermore I want to extend my expressed thanks to the participants at the
PECS workshop in Stockholm 2015, whom gave me access to their data while I was finalizing this
project.
And lastly, the biggest thank goes to my family and close friends. To my brother Kristian for
always being available and supportive also when times are tough. To Lene and Pete, for giving
me the opportunities, and for always supporting and urging me to follow my passion, even if it
meant I’m super busy for years and took me far away from home. To Maja, Christina, Lilli, Lars,
Thorbjørn, and Kristian, you kept me sane and focused on the important things in life. I don’t
know what I would have done without all of you – Thank you so much.
4
1. Introduction
“Here be Dragons” first appeared on the Lenox Globe in 1501 and since became a saying, which
denote the unknown, places that lay beyond the knowledge of mankind (Harley and Woodward
1987). Today, it can be used as a metaphor for the uncharted future we have to navigate, a future
filled with very high uncertainties and very high stakes of getting it right. This world map
transitioned from a pre-19th century situation with plenty of natural resources, what some have
termed an “Empty World” (Costanza 2000), to the Anthropocene (Steffen et al. 2007), a place
where humans have become a geophysical force and natural capital a limiting factor on human
development (Costanza 2000, Steffen et al. 2007, Steffen et al. 2015). This leaves mankind with
a considerable task of sustainably managing the co-existence of man and nature in socio-
ecological systems, in this “Full World”. Each management decision comes down to a trade-off
between multiple choices, with potentially critical consequences, (DeFries et al. 2004, Chan et al.
2011, Burton et al. 2013, Paper I, II, III). Often with a hope of creating synergistic relationships
that cancel out the negatives at the most cost-effective manner (Bennett et al. 2009, Clough et al.
2011).
1.1. Ecosystem Services and Human Well-Being
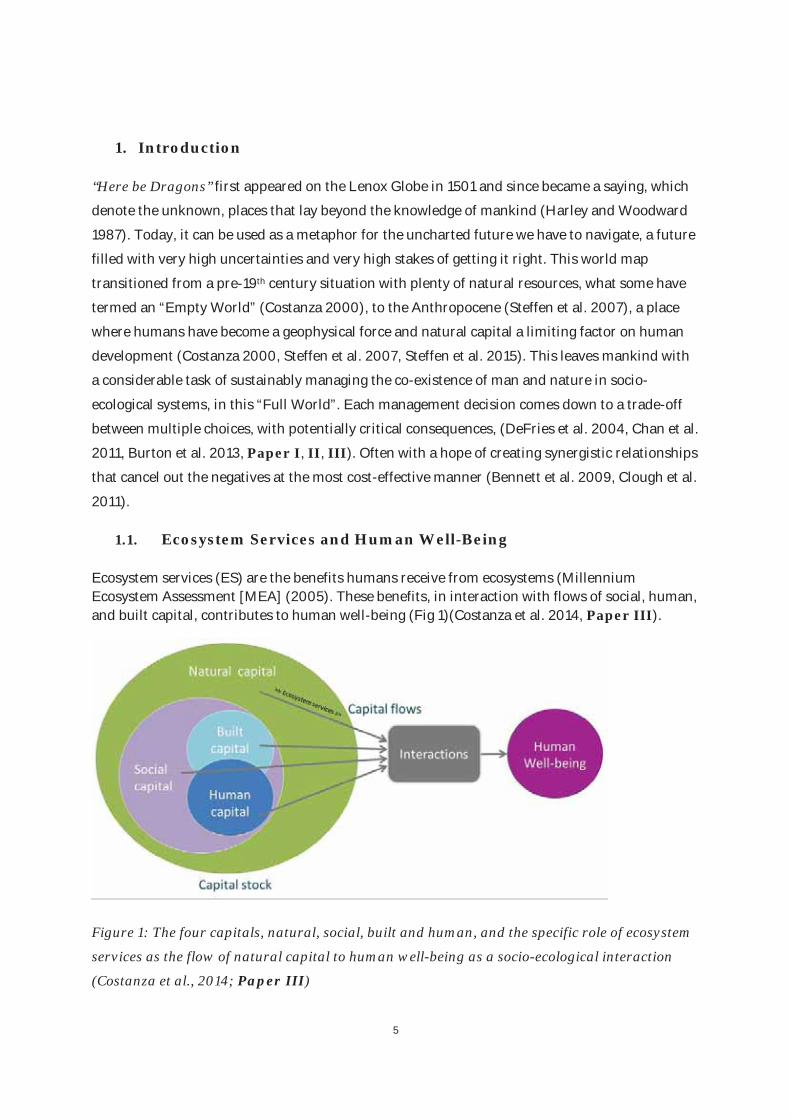
Ecosystem services (ES) are the benefits humans receive from ecosystems (Millennium Ecosystem Assessment [MEA] (2005). These benefits, in interaction with flows of social, human, and built capital, contributes to human well-being (Fig 1)(Costanza et al. 2014, Paper III).
Figure 1: The four capitals, natural, social, built and human, and the specific role of ecosystem
services as the flow of natural capital to human well-being as a socio-ecological interaction
(Costanza et al., 2014; Paper III)
5

The ecosystem service paradigm has changed the way nature conservation and sustainable
agroecological systems are viewed in a policy and management setting (Liu et al. 2010). Instead
of viewing nature conservation as a trade-off for human well-being, it is now also looked upon as
an important contributor (MEA 2005, Carpenter et al. 2009, Liu et al. 2010).
The assessment of nature’s benefits through goods and services is a concise way of disseminating
the importance of natural capital, and is gaining ground because it relates the state of the
ecosystems to human well-being (Norgaard 2010, Chan et al. 2012). Thus the scientific
community looking into ecosystem services are able to address management and policies, to
contribute to the protection of the natural capital stock and ensure the flow of ecosystem services
(Costanza et al. 1997, Costanza et al. 2013).
The MEA (2005) framework (Figure 2) characterizes ecosystem services as provisioning,
regulating, cultural, and supporting services. Provisioning services are physical products such as
food, feed, fiber and fuels. Regulating services are the processes that happen in nature e.g. water
cleansing, nutrient filtration, climate regulation, etc. Cultural services are often intangible
services as aesthetics, sense of place, religious worship, but also direct uses as recreation, eco-
tourism, scientific value, and education. Supporting services are all the underlying, long term
processes in nature: Net primary products, nutrient cycles, soil formation, and climate stability
that secure the provision of the direct services to humans (MEA 2005).
6

Figure 2: The ecosystem services contribution to human well-being, (the flow from natural capital to human well-
being, Figure 1) and society’s potential for socio economic mediation (the Interactions, Figure 1) (MEA 2005).
Assessing ecosystem services is a relatively new field, which is often referred to as the field of
ecological economics. For the purposes of this dissertation, I argue that there is more to this field
than taking an economic approach, which is only one aspect of valuation (see section 1.3.2.1) and
I thus find the name slightly misguiding and will refer to the field as Ecosystem Service
Assessments. It has a large and growing body of analyses into the socio-ecological systems
(Crossman et al. 2013, Andrew et al. 2015), and can be described as a multidisciplinary approach
to environmental management (Fisher et al. 2009, Costanza and Kubiszewski 2012). It is
multidisciplinary because it draws on a wide array of scientific fields within the natural sciences
such as ecology, genetics, computer sciences, mathematics, and geography, among others, and
scientific fields within the social and human sciences, e.g. economy, environmental
management, philosophy, and history (Farber et al. 2006, de Groot et al. 2010, Costanza and
Kubiszewski 2012).
Although the multidisciplinary approach is important to facilitate an integrated management
regime, it also generates some significant complications, as multidisciplinarity necessitates
communication across various scientific fields. The difficulty of streamlining the classification
and terminology of ecosystem services highlights this problem (Wallace 2007, Seppelt et al.
7

2011). It is viewed as a fundamental necessity to be able to compare results and methodology of
different studies, but so far a consensus has not been reached. Since each scientific research area
has its own approach, methodology, terminology, and traditions it becomes very difficult to
navigate (Egoh et al. 2007, Wallace 2007, Costanza 2008, Seppelt et al. 2011). While many
different classification systems have been proposed since the MEA (2005), e.g. The Economics of
Ecosystems and Biodiversity (TEEB) and Common International Classification of Ecosystem
Goods and Services (CICES) (TEEB 2010, Haines-Young and Potschin 2011), the MEA still
remains the broadest consensus (Costanza 2008, Fisher et al. 2009). Hence, in this PhD project
the MEA classification is used.
Historically, it has been straight-forward to market provisioning services, as these have a
recognized economic value (MEA 2005, Nkonya et al. 2011b). Other types of services are less
tangible, and do not figure in the present inventories of collected national assets or gross
domestic products, nor can they easily be integrated in cost benefit analyses (CBA) since the
value of the services are not properly clarified (Costanza 2000, Farber et al. 2006, ELD-Initiative
2013). Therefore, the potential importance of these services in the underlying ecosystem is more
likely to be undervalued and replaced for marketable land uses (Paper I, III). Furthermore,
many of the more intangible services are considered public goods because of either non-
excludability or -rivalness in consumption (Fisher et al. 2009). Unfortunately, this means
decision makers and stakeholders risk making decisions based on limited knowledge (Carpenter
et al. 2009).
1.1. Spatial Properties of Ecosystem Services
Ecosystem services are spatially specific and the distribution depend on both the underlying
biophysical ecosystem supply and the human demand (Paper III, Mäler et al. 2008, Seppelt et
al. 2011) (Figure 3). Geography links the four capitals spatially and, therefore, Geographic
Information Systems (GIS) has proven very useful for analyzing ecosystem services (Nkonya et
al. 2011b). There are currently thousands of studies using GIS for mapping ecosystem services
(Burkhard et al. 2009, Costanza and Kubiszewski 2012, Crossman et al. 2013, Paper III). All
service production is of course dependent on favorable biophysical properties, but broadly
speaking provisioning and most cultural services often have social drivers, whereas regulating
and supporting services are mostly driven by these biophysical processes (Costanza 2000, Zhang
et al. 2007, Bennett et al. 2009). This gathers incentives for policymakers and planners as well as
managers to direct the proportion of services they need to sustain human well-being (Paper III,
8
De Groot et al. 2010, Crossman et al. 2013), on all the different scales that interact in these
complex socio-ecological systems (Borgström et al. 2006).
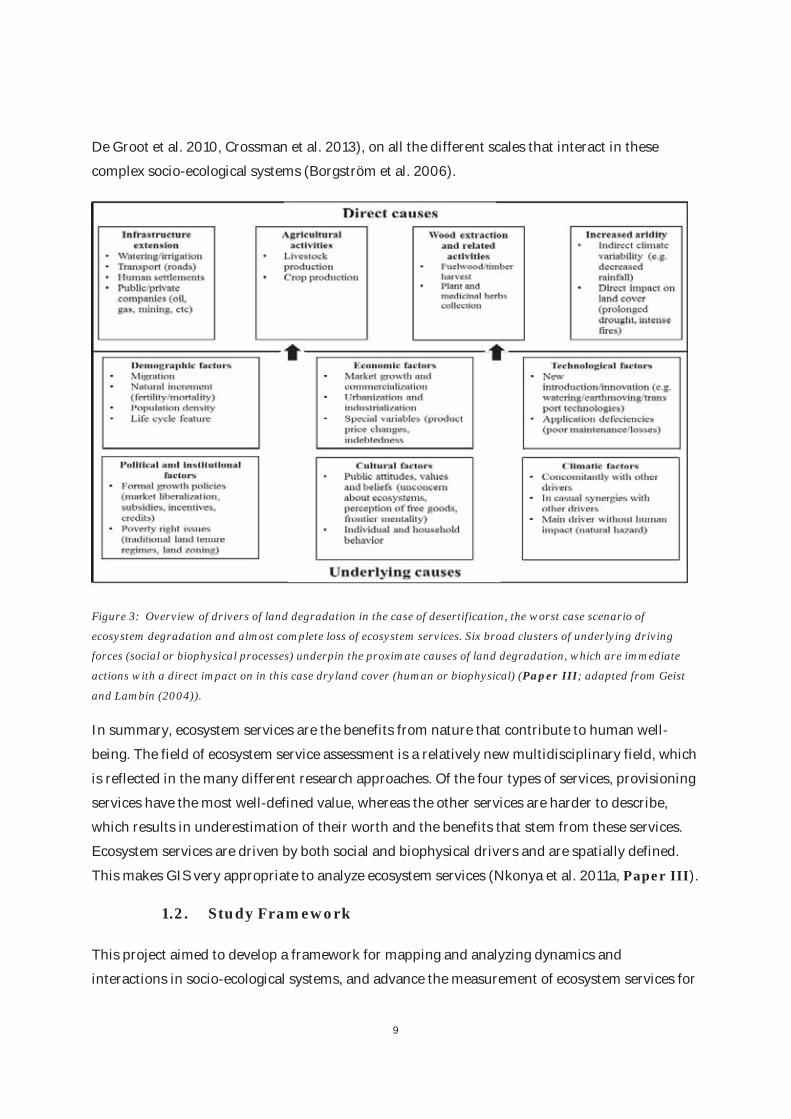
Figure 3: Overview of drivers of land degradation in the case of desertification, the worst case scenario of
ecosystem degradation and almost complete loss of ecosystem services. Six broad clusters of underlying driving
forces (social or biophysical processes) underpin the proximate causes of land degradation, which are immediate
actions with a direct impact on in this case dryland cover (human or biophysical) (Paper III; adapted from Geist
and Lambin (2004)).
In summary, ecosystem services are the benefits from nature that contribute to human well-
being. The field of ecosystem service assessment is a relatively new multidisciplinary field, which
is reflected in the many different research approaches. Of the four types of services, provisioning
services have the most well-defined value, whereas the other services are harder to describe,
which results in underestimation of their worth and the benefits that stem from these services.
Ecosystem services are driven by both social and biophysical drivers and are spatially defined.
This makes GIS very appropriate to analyze ecosystem services (Nkonya et al. 2011a, Paper III).
1.2. Study Framework
This project aimed to develop a framework for mapping and analyzing dynamics and
interactions in socio-ecological systems, and advance the measurement of ecosystem services for
9
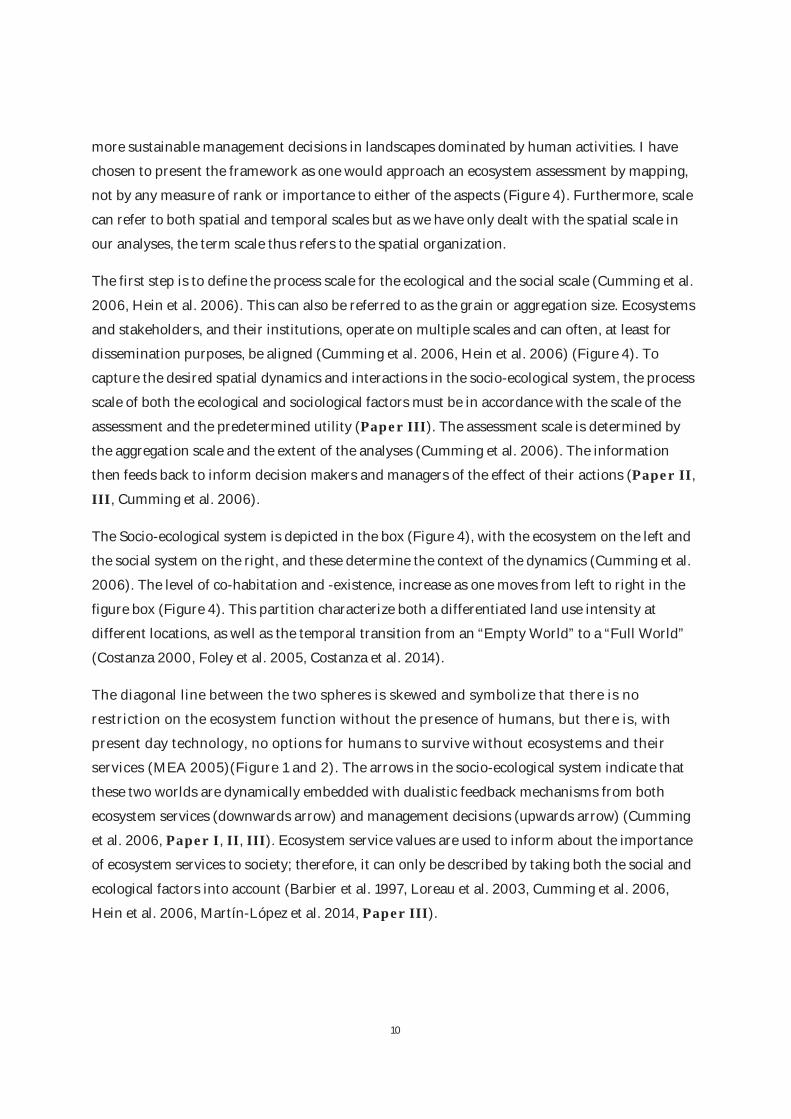
more sustainable management decisions in landscapes dominated by human activities. I have
chosen to present the framework as one would approach an ecosystem assessment by mapping,
not by any measure of rank or importance to either of the aspects (Figure 4). Furthermore, scale
can refer to both spatial and temporal scales but as we have only dealt with the spatial scale in
our analyses, the term scale thus refers to the spatial organization.
The first step is to define the process scale for the ecological and the social scale (Cumming et al.
2006, Hein et al. 2006). This can also be referred to as the grain or aggregation size. Ecosystems
and stakeholders, and their institutions, operate on multiple scales and can often, at least for
dissemination purposes, be aligned (Cumming et al. 2006, Hein et al. 2006) (Figure 4). To
capture the desired spatial dynamics and interactions in the socio-ecological system, the process
scale of both the ecological and sociological factors must be in accordance with the scale of the
assessment and the predetermined utility (Paper III). The assessment scale is determined by
the aggregation scale and the extent of the analyses (Cumming et al. 2006). The information
then feeds back to inform decision makers and managers of the effect of their actions (Paper II,
III, Cumming et al. 2006).
The Socio-ecological system is depicted in the box (Figure 4), with the ecosystem on the left and
the social system on the right, and these determine the context of the dynamics (Cumming et al.
2006). The level of co-habitation and -existence, increase as one moves from left to right in the
figure box (Figure 4). This partition characterize both a differentiated land use intensity at
different locations, as well as the temporal transition from an “Empty World” to a “Full World”
(Costanza 2000, Foley et al. 2005, Costanza et al. 2014).
The diagonal line between the two spheres is skewed and symbolize that there is no
restriction on the ecosystem function without the presence of humans, but there is, with
present day technology, no options for humans to survive without ecosystems and their
services (MEA 2005)(Figure 1 and 2). The arrows in the socio-ecological system indicate that
these two worlds are dynamically embedded with dualistic feedback mechanisms from both
ecosystem services (downwards arrow) and management decisions (upwards arrow) (Cumming
et al. 2006, Paper I, II, III). Ecosystem service values are used to inform about the importance
of ecosystem services to society; therefore, it can only be described by taking both the social and
ecological factors into account (Barbier et al. 1997, Loreau et al. 2003, Cumming et al. 2006,
Hein et al. 2006, Martín-López et al. 2014, Paper III).
10
Figure 4 Conceptual framework developed for mapping and analyzing dynamics and interactions in socio-
ecological systems including the scale considerations that are inherent to such assessments (CBA= Cost Benefit
Analysis) (Costanza 2000, Flyvbjerg 2005, Cumming et al. 2006, de Groot et al. 2010, Willemen et al. 2012, Martín-
López et al. 2014).
In the following two sections the two components, spatial scales of ecosystem services (section
1.3.1.) and values in socio-ecological systems (section 1.3.2.), are discussed in further detail to
situate the three research papers in context for the dissertation.
1.2.1. Scale
1.2.1.1. Process Scale
As mentioned, ecosystem services have a distinct spatial context related to their geography.
Overall, there are two central topics of scale in spatial ecosystem service assessments that we
worked on in this project, the process scale and the assessment scale (Figure 4). It is important
to consider both aspects as they entail assumptions regarding the quality and utility of such
assessments (Paper III). Furthermore, ecosystem services can operate on multiple levels to
11
different stakeholders at the same time, and this scale mismatch between producers and
beneficiaries can potentially cause problems for decision makers (Borgström et al. 2006,
Cumming et al. 2006).
1.3.1.1.1. The Ecological Scale
Ecosystem services are spatially distributed and delimitated by the biophysical properties of the
landscape such as slope, i.e. climate, rainfall patterns, and biotic processes, etc.(Koenig 2002,
Zhang et al. 2007, Dick et al. 2014) (Figure 3). Ecosystems are the foundation of the process
scale and, as mentioned, work on multiple scales. The actual scale of the physical system, for
instance a wetland, can seem to be easy to identify, e.g. where the aquatic meets the terrestrial
habitat. Albeit, the water in the wetlands stem from a larger watershed that can span enormous
areas, and can transcend “arbitrary” administrative boundaries like sovereign national borders.
This water then carry nutrients and detritus from far away and thus influence the socio-ecologic
system (Paper II). Ecosystems are not closed systems and are affected by its surroundings
through climate, geophysical conditions, as well as macro scale geophysical and biological
interactions (Loreau et al. 2003, Steffen et al. 2015). This makes it complex to analyze and
determine the drivers that delimit and influence the ecosystems (Paper III).
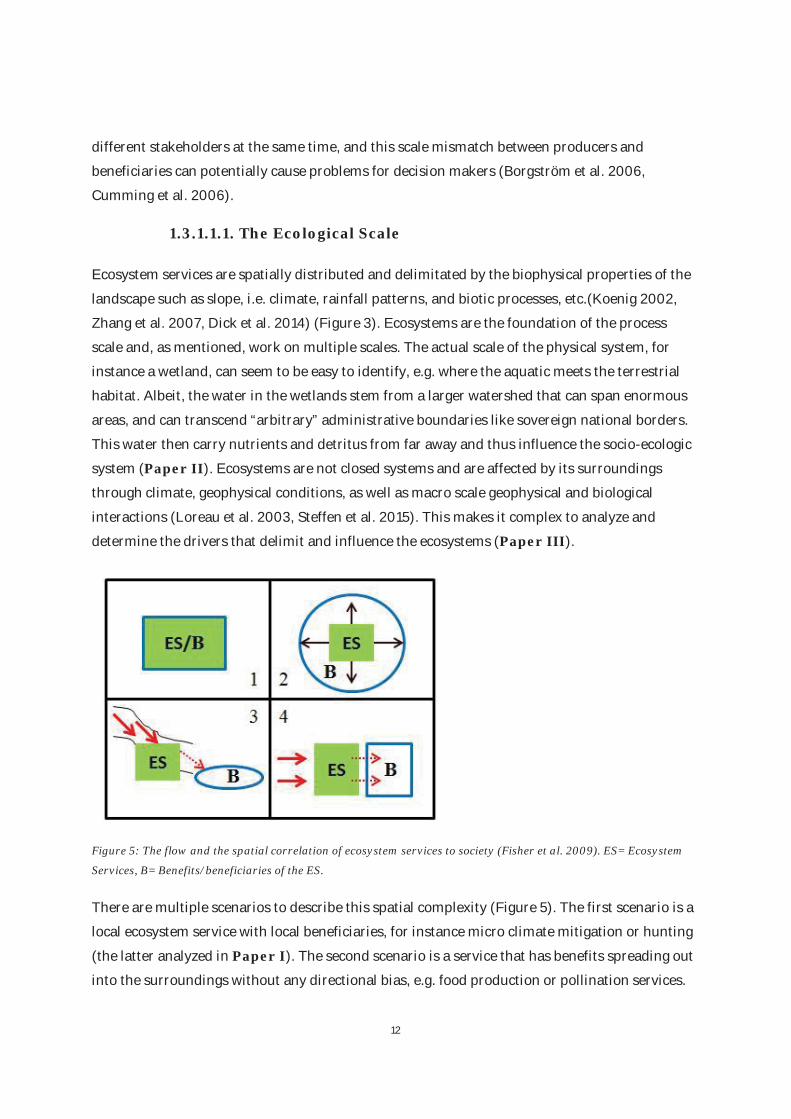
Figure 5: The flow and the spatial correlation of ecosystem services to society (Fisher et al. 2009). ES= Ecosystem
Services, B= Benefits/beneficiaries of the ES.
There are multiple scenarios to describe this spatial complexity (Figure 5). The first scenario is a
local ecosystem service with local beneficiaries, for instance micro climate mitigation or hunting
(the latter analyzed in Paper I). The second scenario is a service that has benefits spreading out
into the surroundings without any directional bias, e.g. food production or pollination services.
12

The third scenario in Figure 5 is a service produced away from the beneficiaries, as e.g. the
abovementioned wetland deposits excess nutrients and thus keeps the downstream watershed
clean (Paper II). The forth scenario is a barrier service, such as a mangrove or a marsh, which
protects against water surges (Paper II, Fisher et al. 2009). To know where the services are
produced and understand the spatial context of services and benefits across the landscape
informs decision makers of where management interventions could be optimized (DeFries et al.
2004, Cumming et al. 2006, Hein et al. 2006, Fisher et al. 2008, Fisher et al. 2009, de Groot et
al. 2010, Costanza et al. 2013).
1.3.1.1.2. The Sociological Scale
The sociological system scales are represented by the structural levels and institutions
(individual, municipal, national, regional, and international) in Figure 4 (Cumming et al. 2006,
Hein et al. 2006). It is spatially distributed and contingent on the socio-cultural properties of the
underlying social system, such as land use, ethics, values, development status, etc. (Tscharntke et
al. 2005, Dick et al. 2010, Raudsepp-Hearne et al. 2010, Bai et al. 2011, Martín-López et al.
2014). Stakeholders on different scales can have overlapping or conflicting interests in the
ecosystem services that stem from a particular ecosystem. Therefore, an ecosystem can be of
high importance to several groups of local stakeholders, as well as have international importance
to the earth system as a whole, in terms of e.g. climate mitigation or biodiversity conservation
(Bennett et al. 2009, Steffen et al. 2015, Dalgaard et al. appendix 6.2.1).
Consequently, it is important to identify the social scale of the services that are to be analyzed.
Hein et al. (2006) define ecosystem service stakeholders as “any group or individual who can
affect or is affected by the ecosystem’s services”¸ which is quite a broad definition, but in line
with the MEA (2005). The sociological scales of ecosystem services span from individual level to
global international institutions (Figure 4) (Hein et al. 2006). In contexts where we encounter
scale discrepancies it can lead to conflicts (Zia et al. 2011). Scale discrepancies can be defined as
a situation where scale is contested by different groups of stakeholders (Brenner 2001, Van
Lieshout et al. in press).
Natural resource and land use conflicts are present all over the world. When ecosystem service
production and its beneficiaries are separated in time and/or space, it can be difficult to
disseminate and understand the importance of the services to human well-being, especially
intangible ones (Fisher et al. 2009). An example of this is a forest, which has effects on both local
and global and on local scale by supplying local people with food, fuel, timber, etc., and on global
level by storing carbon that otherwise would contribute to the global climate change and
13
biodiversity. The scale discrepancy then can give rise to conflicts, because the need of global
society for biodiversity and carbon-conservation, can negate the need of local stakeholders for
life sustaining services, or the other way around (Zia et al. 2011). Often the less considered
groups in such conflicts are those that do not have access to capitals such as markets and natural
resources (Nayak et al. 2014). Environmental degradation affects marginalized stakeholders
disproportionately (Fisher et al. 2008, Fisher et al. 2009). In Denmark these conflicts are often
between farmers, conservationists, and decision makers over environmental restrictions and
excess nutrient control (Dinesen et al. 2011, Sutton et al. 2011).
Many services are considered public goods (non-excludable and -rival) (Perman et al. 2011),
which affect society as a whole (MEA 2005). However, the incentive for sustainable management
to take a broad range of ecosystem services into account is often overshadowed by economic
incentives to produce marketable products and trade off intangible services for economic
development (Bennett et al. 2009), because services provided by private landowners and
managers are not being recognized on the market or they are not compensated for their non-
marketable production of services. In Denmark, this is evident in areas characterized by high
intensity of agricultural land use, which gives rise to problems of e.g. excess nutrients in the
ecosystems, leading to many problems both in nature and society (dNmark.org, Sutton et al.
2011, Dalgaard et al. appendix 6.2.1.). These types of problems are recognized across the globe
where production landscapes are favored over natural landscapes (Nkonya et al. 2011b, Sutton et
al. 2011, Kosmas et al. 2013).
In summary, the scale of the ecosystem service defines the service production, although benefits
can reach far beyond local scale and exceed political and administrative boundaries. The social
scale of ecosystem services contingent on direct and indirect stakeholders, and can likewise
transcend administrative boundaries. If stakeholders or ecosystem services are overlooked it can
lead to conflicts and less informed management decisions with regards to ecosystems.
1.3.1.2. Assessment Scale and Utility
When assessing ecosystem services it is important to define the utility of the assessment early
on. The assessment scale is a combination of the extent and aggregation scale (Paper III;
Figure. 4), which to a large extent relies on the scale of available data, but can also serve to limit
the scope of otherwise very complex analyses (Kienast et al. 2009, Crossman et al. 2013, Dick et
al. 2014, Paper III). Based on the aggregation level there are often limitations to how much
information an assessment can store and how transferable the results are (De Groot et al. 2010).
Therefore, it is usually necessary to have a clear idea of what audience the assessment is aimed
14

for, and thus what extent and resolution to conduct the assessment on (Hein et al. 2006). In this
section I will discuss what assessment types the different aggregation scale, to date, is most
equipped to handle.
On locally aggregated scales, monetary ecosystem services assessments are used with success for
CBA (Nkonya et al. 2011a, Wegner and Pascual 2011). Local and plot scale analyses reduce
complexity by a limiting extent, creating a homogenous socio-ecological system, and therefore
determine the impact on human well-being (Wegner and Pascual 2011). However, these CBAs
rapidly increase their uncertainties and error margins as the aggregation and extent increases,
and encompass a more heterogeneous system, thus it can be difficult to generate reliable CBA
analyses on large extents (Wegner and Pascual 2011, Nkonya et al 2011b).
On a national level, the United Kingdom National Ecosystem Assessment (UKNEA) is today one
of the best examples of this assessment scale (Bateman et al. 2013). As with the MEA, they also
used scenarios to get include the effect of policy choices and thus make the analyses useful for
informed policy making (MEA 2005, Bateman et al. 2013). Paper II is likewise a national
assessment of the ecosystem services of wetlands, although Denmark is considerably smaller
than many other nations. Scenarios were also used in this paper as an approach to highlight
policy effects on a national scale.
The MEA (2005) is to date still the most extensive attempt to estimate the global level of
ecosystem services and the effect of policy choices on human well-being (MEA 2005, Carpenter
et al. 2009). Other global assessments of ecosystem services are often very coarsely aggregated
and rely on simple benefit transfer between ecosystem or biome types (e.g. Costanza et al. 1997,
Costanza et al. 2014), which is appropriate as these assessments are used for awareness-raising,
not specific policies. Paper III is a review of the methodology of making such a global
assessment, and discusses the implications of the aggregation scale on assessment scale.
Because of these differences between the spatial scales of sociological and ecological systems,
and the restrictions between aggregation scale and utility of the assessment scale, it is important
for policy makers that assess ecosystem service dynamics at coarse scales to enable for policies to
be flexible on the local scale (de Groot et al. 2010, Dalgaard et al. appendix 6.2.1). This is a way
to utilize the dynamics of both the stakeholders and possible synergies in ecosystem services
distribution (Hauck et al. 2013, Paper II). In this PhD project we aggregated data on two of the
ecological scales, namely, landscape (Paper I) and sub-watershed scale (Paper II), both on a
social scale that addresses decision makers at municipal and national scales. Therefore, the two
mapping studies do not capture specific ecosystem function or local management issues, because
15

they are too broad to capture such dynamics, but they highlight how services are dispersed and
how they likely interact (Loreau et al. 2003, Borgström et al. 2006).
The final review, Paper III, was aimed at international institutions to increase awareness on a
global scale of the cost of land degradation. The challenge in that latter project was not the lack
of available data and models for such an assessment; rather, it was consolidating and coagulating
the sheer massive amount of information available. Figure 6 depicts a selection of some of the
most used models to determine the effects of land management (Paper III). In this review I
confirmed that there is a practicality trade-off in spatial extent, or at least in aggregation scale,
and complexity of the model, and that the assessment scale should reflect the utility of a study
and thus should govern what models are used (Paper III).
Figure 6: The distribution of models in regards to comprehensiveness and aggregation scale. Color corresponds to
model types Small Scale Models (SSM), Dynamic Global Vegetation Models (DGVM), Integrated Global Model
(IGM), Ecosystem Service Model (ESM) (from Paper III)
In summary, the assessment scale should reflect the intended audience and thus the appropriate
ecological and social aggregation scale. Practically, the larger the extent and aggregation scale,
the less specificity is captured. Therefore, global assessments are for awareness-raising like the
16

MEA (2005) or the ELD-Initiative (2013); national scale assessments like the UKNEA are used
for national inventories or e.g. Green GDPs; on local scales the assessments can readily be used
to assess trade-offs in the landscape or used in CBA.
1.3.2. Socio-Ecological Systems
The study of socio-ecological systems and methods for the valuation of ecosystem services at
various scales is, as displayed in the Figure 4 framework, the core subject of this PhD project.
Socio-ecological systems span globally (Sanderson et al. 2002, Foley et al. 2005, Ellis et al. 2010,
Foley et al. 2011), contributing to human well-being (Costanza et al. 2014).
The box in Figure 4 framework symbolizes the Socio-Ecological System with the ecosystem on
the left and the social system on the right. This socio-ecological system, displayed in the study
framework (Figure 4) is the core subject in this PhD project; the system we analyzed. The system
is depicted with the ecosystem on the left and the social system on the right. The arrows between
the two sub-systems symbolize that these two worlds are spatially imbedded, and thus interact
with each other through ecosystem services and management decisions.
In this PhD project, Denmark was the case study. It is an interesting area to analyze socio-
ecological dynamics in, because it is situated in one of the most heavily human-influenced
regions in the world (Sanderson et al. 2002); FAOSTAT 2013), has a population pressure of 131
pers/km2 (Statistics Denmark 2015; FAOSTAT, 2013), and 87% of the population residing in
urban areas (World Bank 2015). Furthermore, Denmark has a long history of agricultural land
use that spans more than 4000 years (Odgaard and Rasmussen 2000), and today agricultural
land occupies 66% of the terrestrial surface, most of it being conventional intensified agriculture
(Statistics Denmark 2015, Ghaley and Porter 2014). See Paper I and II for more details of the
study site.
The overall findings from the case study revealed that ecosystem services in the Danish
landscape are segregated into distinct bundles that reflect the socio-ecological systems,
according to the findings in Paper I. These sets of bundles is interpreted as Agricultural,
Multifunctional, Coastal, and Forest Recreation bundle types, based on their immediate land
cover and land use. We found that there was a negative correlation between the provisioning
services and both regulating and cultural services in the landscape; and regulating and cultural
services formed possible synergies. This is a somewhat general pattern for a country with intense
farming culture (Raudsepp-Hearne et al. 2010, Queiroz et al. 2015) and similar findings for
Montreal (Raudsepp-Hearne et al. 2010), and Britain (Dick et al. 2010, Dick et al. 2014), but not
17
in the Stockholm area in Sweden, which is less intensely farmed (Queiroz et al. 2015). An
interesting trend in Paper I, and which was also noticed in the Canadian and Swedish cases, is
the fact that peri-urban and urban areas have socio-ecological systems with a seeming high
potential for cultural and regulating ecosystem service synergies (see also e.g. Vejre et al. 2010).
This was also indicated in Paper II, as the catchment hotspots and two of the scenarios, all
showed a preference towards the peri-urban landscapes. This tendency will have to be examined
in greater detail, to see if that is actually the case.
1.3.2.1. Ecosystem Service Values
It is futile to discuss ecosystem service assessments without discussing valuation of ecosystem
services and how we measure it. It is a contested issue, and there has been a lot of debate of
valuation of nature and its services (see e.g. McCauley 2006 or Barbier 2011). This debate is
primarily concerning monetary valuation, which is a contested technique (Norton and Noonan
2007, Wegner and Pascual 2011). It has been described as an uncertain and simplistic metric
with regards to determine of the contribution of ecosystem services to human well-being (Fisher
et al. 2009, Chan et al. 2012). Some values are incommensurate, for instance religious or
ideological values, or values which are situational and experience-based (Chan et al. 2012), not
to mention inherent values held by stakeholders (McCauley 2006, Chan et al. 2012). Others
argue that contingent valuation techniques and neo-classical definitions of value cannot be used
as direct measures of human well-being (Costanza et al. 2013), and they are inherently
individually biased and context based, i.e. dependent on ecological knowledge and moral values,
and thus is problematic to scale up (Liu and Stern 2008, Fisher et al. 2009).
Value, however, is a general term that means both ideals, held values, and importance, assigned
values (Norton 2008). Values shape the development of socio-ecological systems and have
profound influence on how natural and social systems co-evolve and -exist (Norgaard 1988,
Norgaard 1994). It can thus be argued, that valuation, and value judgments, is an inherent
element of being-in-the-world and as such is unavoidable. The actual methods of valuation and
the different models used to assess both value and effect of management decisions are described
in detail in Paper III. This section is therefore assigned to discuss the differences in values of
social and ecological systems and how they are measured. There are some challenges which
valuation of ecosystem services must seek to address. I will consider two challenges in further
detail, 1) the pars pro toto fallacy (Flyvbjerg 2005) and 2) the issue of balancing held values and
assigned values (Funtowicz and Ravetz 1994b, Funtowicz and Ravetz 2003, Hauck et al. 2013,
Laurans et al. 2013).
18

1.3.2.2. The Pars Pro Toto Fallacy
The Pars pro toto fallacy concerns the dissection of a whole system into individual components,
and linearly summarizes the value of each component, to represent the value of the whole
(Flyvbjerg 2005). It literally means parts before the whole. The problem of overestimating the
independence between parts is commonly encountered in accounting, where it adds to the
uncertainty of service valuations because it inflates the total value of the ecosystem.
Overestimation is equally as problematic as underestimation in trade-off analyses regarding
human well-being, because there is a danger that it results in an “all or nothing” -situation in a
cost benefit analysis (Barbier et al. 2008). It has been shown to occur quite often in ecosystem
service valuations (Boyd and Banzhaf 2007, Fu et al. 2011, Johnston and Russell 2011).
This fallacy highlights that we need to reassess our understanding of ecosystems as discrete
entities and embrace the landscape or meta-ecosystem approach (Loreau et al. 2003, Bennett et
al. 2009, Schroth and McNeely 2011). Pair-wise interactions can only describe the individual
system functions, but since the systems are non-linear (not composed of separate additive units),
this reductionist methodology in this field might be inadequate (Funtowicz and Ravetz 2003).
One way of dealing with this problem is to embrace the dependency, reduce the interdependence
of the services measured, as shown in Paper I, by grouping services into specific service bundles
before valuation steps are undertaken (Farber et al. 2006, Bennett et al. 2009, Raudsepp-
Hearne et al. 2010). This is also an issue that increases with scale, since the services in a
landscape will be increasingly grouped the larger the scale they are aggregated on, and thus
simple transfer value is vulnerable of double counting some of the services (Burkhard et al.
2009, Paper III). Since Paper II was not a trade-off analysis, I chose a smaller set of five
ecosystem services (Dick 2014). They are all connected to the same type of ecosystem, wetlands,
or affected by its placement by humans in the landscape, most likely representing a single
ecosystem service bundle, and thus elude the misconception.
1.3.2.3. Held and Assigned Values
Social demand determines the value of services either through established market value, or from
socio-cultural values, expressed through art, literature, spirituality, etc.(Plieninger et al. 2013,
Martín-López et al. 2014), or as values enacted in an every-day context. As was the problem with
the pars pro toto fallacy, not looking at the whole system, it is equally difficult to discern held
values, ideals, from assigned values, which measures importance, as these values change with
the social context – e.g. with development, welfare, and educational and/or knowledge level
(Costanza 2000, Liu and Stern 2008, Liu et al. 2010, Paper III). The method used to assess and
value ecosystem services can shape the outcome of trade-off analyses (Brondízio et al. 2010,
19

Martín-López et al. 2014). If monetary valuation techniques are used, then provisioning services
tend to have higher values, whereas biophysical and socio-cultural services value cultural and
regulating services higher than provisioning (Martín-López et al. 2014). This also serves to
remind us that it is not only cultural services have socio-cultural value (Chan et al. 2012).
Different societies and individuals value services differently, depending on the needs, ideologies
and ethics of the individual or group the they represents (Hein et al. 2006, Fisher et al. 2008),
making it difficult to determine universal or absolute values with regards to ecosystem services.
Natural science is oriented towards epistemology and to determine ecological factors – supply,
health, and resilience of the ecological system, map and model the biophysical values, or supply
value, to provide generalized knowledge that define these matters (Flyvbjerg 2005, Martín-López
et al. 2014). Some sociological approaches are also epistemological, such as e.g. economic
valuation (TEEB 2010, Costanza et al. 2014), but Flyvbjerg (2005) argue that there are no social
models that have successfully been able to forecast social systems (see also the model
assumption discussion in section 3.3. and 3.4. in Paper III). Methods and models that use
epistemological methodologies to describe social context often fall short (Flyvbjerg 2005, Norton
2008, Fisher et al. 2009). Instead, Flyvbjerg (2005) argue that a phronetic approach, which
describe the value of services as a social context through socio-cultural values and participatory
development and assessment, is a better approach to assessing socio-ecological systems
(Flyvbjerg 2005). In practice, this means that the social factors should be considered to a larger
extent in the valuation process. This is in line with the reasoning of Funtowicz and Ravetz
(1994b), whom claim ecological economics, and thus ecosystem service assessments to be a post-
normal scientific field.
Post-Normal Science is defined as scientific activity that operates in contexts characterized by
very high systems uncertainties and very high stakes on decision making, as e.g. global
environmental management (Funtowicz and Ravetz 1994a, 1994b, Funtowicz and Ravetz 2003).
Because of the inherent uncertainties the system complexity warrants, traditional scientific
reductionist principles no longer apply, as was the case of the pars pro toto fallacy. The
phronetic approach relies on deliberation and discussion as the core of applied methodologies,
which then ensures quality of the scientific work (Funtowicz and Ravetz 2003, Flyvbjerg 2005,
Norton 2008).
It is not a matter of testing statistical significance on reduced complexities, like the epistemic
model does (Flyvbjerg 2005). This is in essence what is described as the extended peer
community, which includes representatives from multiple scales and levels of stakeholders
(Funtowicz and Ravetz 1994a, Flyvbjerg 2005). The authors argue that by acknowledging the
20

multidisciplinary backgrounds and multifaceted ethics of the extended peer community, a
“democratization of knowledge” would ensure more encompassing solutions to complex
problems (Funtowicz and Ravetz 1994b).
To include participatory approaches was one of the main conclusions in the review of models
and methods in Paper III (section 4.1.), where participatory scenario building, among other, is
discussed as a way to overcome the problems with models and their inherent assumptions. They
could furthermore be equipped with user-friendly interfaces and thus tap into the gaming
community and utilize this vast potential (Paper III). The reasoning behind the scenarios in
Paper II is also to create scientific substance for a debate on what is considered a sustainable
and desirable future, and thus contribute to make more informed decisions.
In summary, all land management decision are trade-offs between different opportunities. If
there is no expressed value of the ecosystem, no matter what form it takes, it is easily assumed to
be worth nothing (Paper III). To deal with the complexity of the dualistic socio-ecological
system, it is very helpful to approach the issue with post-normal scientific approaches, where
attention is turned to evaluation of the social processes through stakeholder participation,
reflexive analysis and deliberation (Funtowicz and Ravetz 1994a, Norton 2008, Paper II, III).
Through this, society as a whole can decide on what is a sustainable and desirable common
future and determine the value of ecosystems (Flyvbjerg 2005, Costanza and Farley 2007,
Costanza et al. 2013).
1.4. Conclusion
In this PhD project I studied the dynamics and distributions of ecosystem services in Denmark
and globally, to examine the socio-ecological system. This system is characterized by co-
existence of humans and nature and should be approached dualistically. Ecosystem services are
spatially specific and this makes GIS very appropriate for analyses. The social scale of the
ecosystem services is contingent on both the direct and indirect stakeholders. The ecologic
process scale is the ecosystem scale, but benefits can reach far beyond the local scale, completely
disregarding various institutional or administrative boundaries. If stakeholders or ecosystem
services are overlooked it can lead to conflicts and mismanagement of the ecosystems. The
assessment scale should reflect the appropriate ecological scale for aggregation and the intended
audience. Practically, it is easier to scale up than scale down. The larger the extent and
aggregation scale, the less specificity is captured. Therefore, national and regional policies could
gain from flexibility at the local scale.
21
Value is a disputed issue, but as all land management decisions are trade-offs between different
opportunities, it is important that we address value questions. To deal with the complexity of the
dualistic socio-ecological system, it is very helpful to approach the issue with post-normal
scientific approaches. Here attention lies in evaluation of the social processes through
stakeholder participation, reflexive analysis and deliberation. Through the process of
democratizing knowledge, society as a whole, made up of its individual parts, can thus decide on
what is a sustainable and desirable common future, and fill out the knowledge gaps on the map
and combat the future dragons. The humble hope is that the methods demonstrated and
developed in the current PhD study will contribute to this process.
22
2. Research Questions and Aim of Ph.D.-Project
This project is centered on development of a framework for mapping and analyzing dynamics
and interactions in socio-ecological systems (Figure 4), and to improve the measurements of
ecosystem services for more sustainable management decisions in landscapes dominated by
human activities. The principles of ecosystem service assessments are gaining importance in
relation to sustainable management of natural resources. As land and resource managers we are
dependent on identifying good management practices in socio-ecological systems, to mitigate the
challenges of developing a desirable and sustainable future. Specifically, the PhD project
addresses the following main research question, through the three sub-analyses and subsequent
papers and additional material:
What characterizes the dynamics and interactions between nature and society in socio-
ecological landscapes with a long-term anthropogenic pressure; and how do we measure
these dynamics and utilize the knowledge for a transition to a more desirable and
sustainable land management paradigm?
Paper I: What are the spatial interactions in the socio-ecological system, using
Denmark as a case? What trade-offs and synergies are revealed in the Danish
landscapes forming ecosystem service bundles?
Paper II: How can decision makers develop better informed land management
policies, based on assessments of ecosystem services, using constructed wetlands as
an example?
Paper III: How are ecosystem services and land management impacts measured in
large scale studies? What data, methods, and models are useful, and what role does
spatial context play with regards to assessing ecosystem services’ contributions to
human well-being?
The core methodology of this project is spatial analyses in GIS. Through spatial analyses we gain
understanding of the geographical context, which is a very important aspect in the coupled socio-
ecological system (Daily 1997, Paper I). We chose to use Denmark as a case study because this
is a landscape defined by a high degree of ecosystem management, agriculture, urban land use,
population pressure, and have a socio-ecological system that has been formed over centuries
(Vos and Meekes 1999). These conditions are interesting in a global context because this is
forecasted to be the direction humanity is heading, in a broad context (Ehrlich and Ehrlich 2004,
Steffen et al. 2007, Rockström et al. 2009, Steffen et al. 2015). Within the DNMARK research
23

alliance (www.dNmark.org), to which the present PhD is attached, these ecosystems service
methods and datasets are included in the overall suite of tools to assess solution scenarios in
interaction with stakeholders (http://dnmark.org/?page_id=312).
2.1. Introduction to Papers
This dissertation consists of three papers, of which two are published (Paper I) in Landscape
and Urban Planning (2014), one is in press (Paper III) in Ecological Modeling, and the last
(Paper II) is a draft intended for Ecological Indicators
(http://www.journals.elsevier.com/ecological-indicators/).
Paper I is a spatial analysis of the present situation of trade-offs, synergies, and the bundle
structure of ecosystem services in Denmark.
Paper II is a methodological approach to inform decision makers of different, and more
sustainable, land management options based on assessments of ecosystem service in constructed
wetlands.
Paper III is a major review of methods, data and models to assess ecosystem services
contribution to human well-being.
2.1.1. Paper I: Bundling Ecosystem Services in Denmark: Synergies and
Trade-offs in a Cultural Landscape
(Paper published in the journal Landscape and Urban Planning, Feb 2014)
Research Questions:
What are the spatial dynamics of ecosystem services in the socio-ecological system in
Denmark
o Are there distinct spatial patterns of ecosystem services across Denmark?
o Which spatial trade-offs and synergies occur between ecosystem services?
o Do multiple ecosystem services consistently co-occur forming spatial ecosystem
bundle types?
24
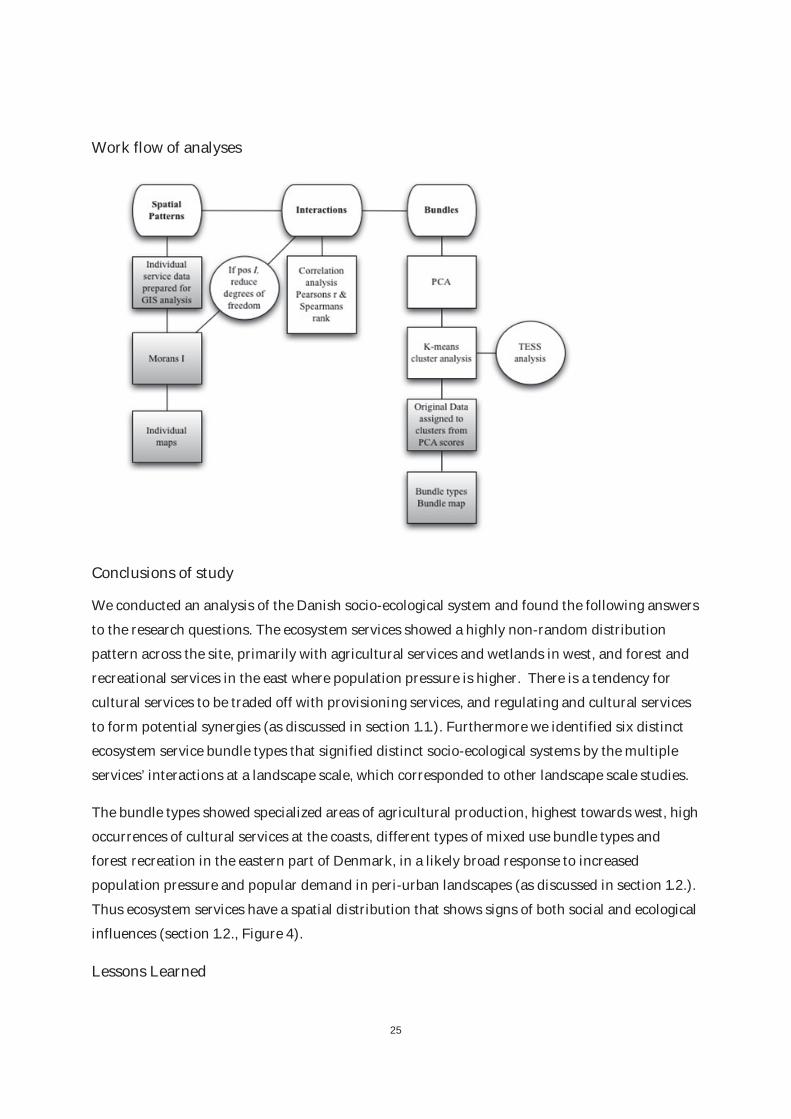
Work flow of analyses
Conclusions of study
We conducted an analysis of the Danish socio-ecological system and found the following answers
to the research questions. The ecosystem services showed a highly non-random distribution
pattern across the site, primarily with agricultural services and wetlands in west, and forest and
recreational services in the east where population pressure is higher. There is a tendency for
cultural services to be traded off with provisioning services, and regulating and cultural services
to form potential synergies (as discussed in section 1.1.). Furthermore we identified six distinct
ecosystem service bundle types that signified distinct socio-ecological systems by the multiple
services’ interactions at a landscape scale, which corresponded to other landscape scale studies.
The bundle types showed specialized areas of agricultural production, highest towards west, high
occurrences of cultural services at the coasts, different types of mixed use bundle types and
forest recreation in the eastern part of Denmark, in a likely broad response to increased
population pressure and popular demand in peri-urban landscapes (as discussed in section 1.2.).
Thus ecosystem services have a spatial distribution that shows signs of both social and ecological
influences (section 1.2., Figure 4).
Lessons Learned
25
The following experiences were made during this study that affected my further research. Land
Use/Land Cover (LULC) data was used as a proxy for most of the ecosystem services (all except
Nature Appreciation and Hunting). This type of data has been criticized because of its simplicity,
and has been called out as unsuitable for ecosystem service assessments (Eigenbrod et al. 2010).
Nevertheless, LCLU data is very useful because of the availability and spatial and temporal
stationarity of this type of data, and studies have shown that biogeographical indicators are very
good at distinguishing different bundle types at a landscape scale (Naidoo et al. 2008, Burkhard
et al. 2009, Kienast et al. 2009, Dick et al. 2014). Furthermore, land cover can be remotely
sensed and that is very useful for large scale assessments (see for instance Paper III, section
2.3.6.). Moreover, land cover and land use is linked in highly managed areas as Denmark, and
there is legislation to protect many of the landscape types, such as forest and wetlands, not to
mention the conserved areas. In such areas biogeographical supply proxies can be used as good
indicators of ecosystem service supply but is also a measure of previous demand, because the
landscape is a consequence of long term management and the (Vos and Meekes 1999, Dick et al.
2014).
Nevertheless, this resulted in some loss of specificity in the amount of services values, as it only
accounts for area of land cover. For instance, the carbon sequestration proxy does not show the
different potential between old growth and new growth forest, which have been shown to be up
till seven times higher in newly-established forests. The same problem goes for the crop
production, where the analyses missed the yield values. This has probably skewed the production
value of crops to the west of the country, as discussed in the paper. Most of the indicators in this
analysis were biophysical supply data, only the services Nature Appreciation and Hunting were
fully or partially socio-cultural demand data.
Secondly, the use of the grid structure for the aggregation unit might also influence the results of
the bundle type structure. This is not a good extent for socio-ecological analysis because it makes
the data vulnerable to uncertainties from modifiable area unit problems (MAUP) (Jelinski and
Wu 1996), since the boundary is placed at random. Small adjustments in one service resulted in
quite large differences in the bundle distribution, although not in the bundle structure, which
remained the same. Instead, I should have used natural boundaries such as watersheds to
minimize the effects of MAUP, or political boundaries as municipalities to make the analysis
more readily useable for municipal and national decision makers (as discussed in sections
1.3.1.1.1. and 1.3.1.1.2).
26

2.1.2. Paper II: Reconstructing Wetlands: Catchment Selection by
Ecosystem Services – Present and Future Scenarios for Denmark
(Draft version prepared for submission to the journal Ecological Indicators)
Research Questions
What is the present general distribution of selected ecosystem services?
o What is present distribution of watersheds with constructed wetlands, and what
priorities in ecosystem services do they reflect?
What are the recommendations for future wetlands priorities in relation to ecosystem
services?
o How do these three policy scenarios change the optimal placement of constructed
wetlands?
o What areas of synthesis are there between the scenarios, which would allow us to
determine where there are high potentials for future demonstration projects,
reflecting the optimal provision of multiple ecosystem services together?
27
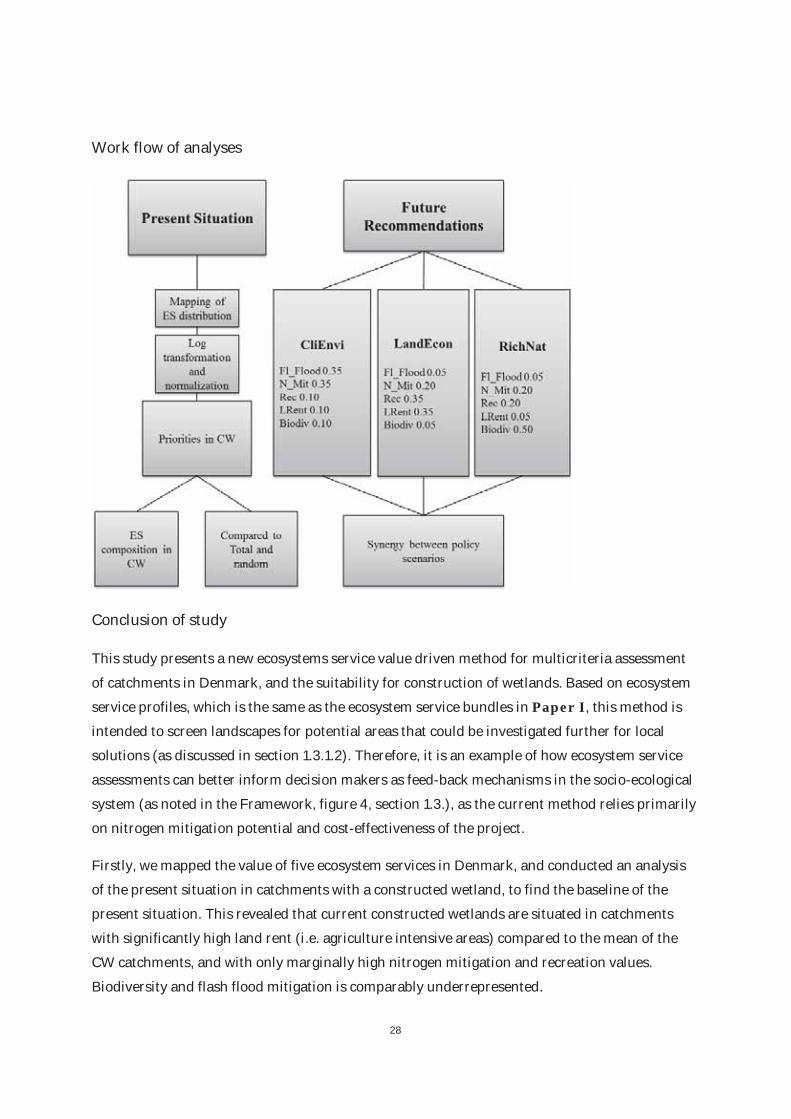
Work flow of analyses
Conclusion of study
This study presents a new ecosystems service value driven method for multicriteria assessment
of catchments in Denmark, and the suitability for construction of wetlands. Based on ecosystem
service profiles, which is the same as the ecosystem service bundles in Paper I, this method is
intended to screen landscapes for potential areas that could be investigated further for local
solutions (as discussed in section 1.3.1.2). Therefore, it is an example of how ecosystem service
assessments can better inform decision makers as feed-back mechanisms in the socio-ecological
system (as noted in the Framework, figure 4, section 1.3.), as the current method relies primarily
on nitrogen mitigation potential and cost-effectiveness of the project.
Firstly, we mapped the value of five ecosystem services in Denmark, and conducted an analysis
of the present situation in catchments with a constructed wetland, to find the baseline of the
present situation. This revealed that current constructed wetlands are situated in catchments
with significantly high land rent (i.e. agriculture intensive areas) compared to the mean of the
CW catchments, and with only marginally high nitrogen mitigation and recreation values.
Biodiversity and flash flood mitigation is comparably underrepresented.
28

Thereafter, to investigate the effects of policies and management decisions in the socio-
ecological system (section 1.3.2), we chose three future policy scenarios to describe the
development in Danish society until 2050, and mapped the hotspots catchments for constructed
wetlands for each of these policy scenarios. These results show that the scenarios CliEnvi and
LandEcon policies show high potential synergies, and result in similar distribution of watersheds
with a high benefit from wetland construction, apparently influenced by peri/-urban areas, as
was also a trend in Paper I. RichNat is rather complementary to this, and the optimal spots for
this strategy lie in and around established and protected nature areas, but have synergies with
CliEnvi in urban areas.
Lastly, we summarized the three scenarios into one maximum suitability map, which show the
synergy between the policy scenarios. The MaxSuit constructed wetlands seems to have the
highest potential around peri-urban and urban areas such as the larger cities at the East coast of
Jutland, central Funen, Northern Zealand and the Copenhagen Metropolitan area, directed by
the dominant CliEnvi and LandEcon scenarios, but this remains to be fully investigated. Most of
the remaining areas are those that overlap with, or have values that are particularly high in the
RichNat scenario.
Lessons Learned
The lessons from Paper I resulted in a different setup for this analysis. This was not a trade-off
analysis, so we concentrated on the best available data on the best available representation of
services in wetlands, both demand and supply data, instead of on a broad national
representation of services. As an alternative of using grids as the aggregation unit, we used the
catchments ID15. This scale is probably more suited for socio-ecological structure. The full
watersheds in Denmark vary a lot in size, and the ID15 sub-watersheds system was constructed
to better analyze hydrology and nutrient transportation for the Danish Nitrogen Mitigation
Assessment Research Alliance (dNmark.org, Dalgaard et al. appendix 6.2.1.). More thought was
given to the choice of services and more weight was put on capturing the social demand of
services (as discussed in section 1.3.2. and 1.3.2.1.).
As mentioned, we designed this analysis to work as a selection tool for future placements of
constructed wetlands. It is not meant as a site selection tool but a screening tool and platform to
launch further investigations into each sub-watershed, and then find local solutions with local
stakeholders (as discussed in section 1.3.1.1.1.). The scale of the study was too coarse to warrant
any local scale conclusions and thus directed at national scale decision makers. The future
recommendations are with these restrictions in mind. It might have been interesting to conduct
29
a hotspot analysis that chose those catchments that had equal amounts of value for each
scenario, for comparison. On the other hand, this might have resulted in a selection of “mediocre
catchments” at best, because there were quite distinct spatial differences between the scenarios.
2.1.3. Paper III: The Economics of Land Degradation: A review of methods,
data, and models to assess the changes in value of ecosystem services
from land degradation and restoration
(Paper published in the journal Ecological Modelling, August 2015)
Review aim
The aim of this paper is to identify and discuss the data and methods used to determine global
scale land degradation and to assess the sustainability of alternative management strategies
through assessment of ecosystem services. This includes reviewing the following aspects of
valuation
What methods for valuing land-use and management options, based on the four capitals
and the types of databases and information proxies, are available?
What valuation methods are used to specifically quantify natural capital and ecosystem
services?
o What available models, on a range from plot scale to global scale, can be used to
develop a method to analyze the impact of sustainable land management
practices?
o What methodologic and knowledge gaps are there in the field and what further
actions should be taken in light of the findings of this review.
Conclusion of study
There is an enormous amount of data and methods available to model and analyze land
management practices. However, they are scattered and requires consolidation and
reformatting, especially adding spatial context. We collected and evaluated databases and
models that could be useful for analyzing and valuing land management options for sustaining
natural capital and maximizing ecosystem services, e.g. GAEZ, WOCAT, and ESVD (see
appendix 6.1.); and models such as ORCHIDEE, GUMBO, and MIMES (See Table 4 and Figure
6).
30
There are still many knowledge gaps to address. For instance, the current methods and models
are not well equipped to handle large scale multidisciplinary analyses (as was discussed in
section 1.1.), and a key conclusion of this synthesis paper is that there is a need for further
development of the integrated approaches, which considers all four types of capital (human,
built, natural, and social; see section 1.1.), and their interaction at spatially explicit, multiple
scales (section 1.3.1.). This could be facilitated by adapting existing models and make them and
their outcomes more accessible to stakeholders.
The classic shortcomings and caveats of model based on their assumptions could be addressed
by adding the human factor (as discussed in section 1.3.2.), for instance in participatory
mapping, or scenario testing. For integration of the models themselves, a more participatory
approach to model development is also recommended (as discussed in section 1.3.2.), along with
the possibility of adding advanced gaming interfaces to the models to allow them to be “played”
by a large number of interested parties and their trade-off decisions to be accumulated and
compared.
Lessons Learned
The amount of data, methods, and models for this paper was very comprehensive. It shed light
on the fact that all the information is probably already out there, but needs to be synthesized.
This does however present all new problems, as discussed in the introduction (section 1.1.). The
lessons learned from this paper were primarily of organizing work processes. For future reviews,
it will be helpful to organize the search process, for instance by using PRISMA-methodology
(Beller et al. 2013).
31

3. References to Introduction
Andrew, M. E., M. A. Wulder, T. A. Nelson, and N. C. Coops. 2015. Spatial data, analysis
approaches, and information needs for spatial ecosystem service assessments: a review.
GIScience & Remote Sensing 52:344-373.
Bai, Y., C. Zhuang, Z. Ouyang, H. Zheng, and B. Jiang. 2011. Spatial characteristics between biodiversity and ecosystem services in a human-dominated watershed. Ecological Complexity 8:177-183.
Barbier, E. B., M. Acreman, and D. Knowler. 1997. Economic valuation of wetlands: a guide for policy makers and planners. Ramsar Convention Bureau Gland, Switzerland.
Barbier, E. B. 2011. Pricing Nature. Annual Review of Resource Economics, Vol 3 3:337-353.
Barbier, E. B., E. W. Koch, B. R. Silliman, S. D. Hacker, E. Wolanski, J. Primavera, E. F. Granek, S. Polasky, S. Aswani, L. A. Cramer, D. M. Stoms, C. J. Kennedy, D. Bael, C. V. Kappel, G. M. E. Perillo, and D. J. Reed. 2008. Coastal Ecosystem-Based Management with Nonlinear Ecological Functions and Values. Science 319:321-323.
Bateman, I. J., A. R. Harwood, G. M. Mace, R. T. Watson, D. J. Abson, B. Andrews, A. Binner, A. Crowe, B. H. Day, S. Dugdale, C. Fezzi, J. Foden, D. Hadley, R. Haines-Young, M. Hulme, A. Kontoleon, A. A. Lovett, P. Munday, U. Pascual, J. Paterson, G. Perino, A. Sen, G. Siriwardena, D. van Soest, and M. Termansen. 2013. Bringing Ecosystem Services into Economic Decision-Making: Land Use in the United Kingdom. Science 341:45-50.
Beller, E. M., P. P. Glasziou, D. G. Altman, S. Hopewell, H. Bastian, I. Chalmers, P. C. Gøtzsche, T. Lasserson, and D. Tovey. 2013. PRISMA for abstracts: reporting systematic reviews in journal and conference abstracts. Plos Medicine 10:e1001419.
Bennett, E. M., G. D. Peterson, and L. J. Gordon. 2009. Understanding relationships among multiple ecosystem services. Ecol Lett 12:1394-1404.
Borgström, S. T., T. Elmqvist, P. Angelstam, and C. Alfsen-Norodom. 2006. Scale mismatches in management of urban landscapes. Ecology and Society 11:16.
Boyd, J., and S. Banzhaf. 2007. What are ecosystem services? The need for standardized environmental accounting units. Ecological Economics 63:616-626.
Brenner, N. 2001. The limits to scale? Methodological reflections on scalar structuration. Progress in Human Geography 25:591-614.
Brondízio, E. S., F. W. Gatzweiler, C. Zografos, M. Kumar, X. Jianchu, J. McNeely, G. K. Kadekodi, and J. Martinez-Alier. 2010. Socio-cultural context of ecosystem and biodiversity valuation.
Burkhard, B., F. Kroll, F. Müller, and W. Windhorst. 2009. Landscapes’ capacities to provide ecosystem services–a concept for land-cover based assessments. Landscape Online 15:1-22.
32

Burton, J. I., A. Ares, D. H. Olson, and K. J. Puettmann. 2013. Management trade-off between aboveground carbon storage and understory plant species richness in temperate forests. Ecological Applications 23:1297-1310.
Carpenter, S. R., H. A. Mooney, J. Agard, D. Capistrano, R. S. Defries, S. Diaz, T. Dietz, A. K. Duraiappah, A. Oteng-Yeboah, H. M. Pereira, C. Perrings, W. V. Reid, J. Sarukhan, R. J. Scholes, and A. Whyte. 2009. Science for managing ecosystem services: Beyond the Millennium Ecosystem Assessment. Proc Natl Acad Sci U S A 106:1305-1312.
Chan, K. M. A., L. Hoshizaki, and B. Klinkenberg. 2011. Ecosystem Services in Conservation Planning: Targeted Benefits vs. Co-Benefits or Costs? Plos One 6.
Chan, K. M. A., T. Satterfield, and J. Goldstein. 2012. Rethinking ecosystem services to better address and navigate cultural values. Ecological Economics 74:8-18.
Clough, Y., J. Barkmann, J. Juhrbandt, M. Kessler, T. C. Wanger, A. Anshary, D. Buchori, D. Cicuzza, K. Darras, D. D. Putra, S. Erasmi, R. Pitopang, C. Schmidt, C. H. Schulze, D. Seidel, I. Steffan-Dewenter, K. Stenchly, S. Vidal, M. Weist, A. C. Wielgoss, and T. Tscharntke. 2011. Combining high biodiversity with high yields in tropical agroforests. Proc Natl Acad Sci U S A 108:8311-8316.
Costanza, R. 2000. Social Goals and the Valuation of Ecosystem Services. Ecosystems 3:4-10.
Costanza, R. 2008. Ecosystem services: Multiple classification systems are needed. Biological Conservation 141:350-352.
Costanza, R., G. Alperovitz, H. Daly, J. Farley, C. Franco, T. Jackson, I. Kubiszewski, J. Schor, and P. Victor. 2013. Building a Sustainable and Desirable Economy-in-Society-in-Nature. ANU E Press, Canberra, Australia.
Costanza, R., R. dArge, R. de Groot, S. Farber, M. Grasso, B. Hannon, K. Limburg, S. Naeem, R. V. Oneill, J. Paruelo, R. G. Raskin, P. Sutton, and M. van den Belt. 1997. The value of the world's ecosystem services and natural capital. Nature 387:253-260.
Costanza, R., R. de Groot, P. Sutton, S. van der Ploeg, S. J. Anderson, I. Kubiszewski, S. Farber, and R. K. Turner. 2014. Changes in the global value of ecosystem services. Global Environmental Change 26:152-158.
Costanza, R., and J. Farley. 2007. Need for a shared vision of a sustainable and desirable future.in N. E. Golubiewski and C. J. Cleveland, editors. Encyclopedia of Earth. Environmental Information Coalition, National Council for Science and the Environment, Washington D.C.
Costanza, R., and I. Kubiszewski. 2012. The authorship structure of “ecosystem services” as a transdisciplinary field of scholarship. Ecosystem Services 1:16-25.
Crossman, N. D., B. Burkhard, S. Nedkov, L. Willemen, K. Petz, I. Palomo, E. G. Drakou, B. Martín-Lopez, T. McPhearson, K. Boyanova, R. Alkemade, B. Egoh, M. B. Dunbar, and J. Maes. 2013. A blueprint for mapping and modelling ecosystem services. Ecosystem Services 4:4-14.
Cumming, G. S., D. H. Cumming, and C. L. Redman. 2006. Scale mismatches in social-ecological systems: causes, consequences, and solutions. Ecology and Society 11:14.
33

Daily, G. C., S. Alexander, P. R. Ehrlich, L. Goulder, J. Lubchenco, P. A. Matson, H. A. Mooney, S. Postel, S. H. Schneider, and D. Tilman. 1997. Ecosystem services: benefits supplied to human societies by natural ecosystems. Issues in Ecology 1:1-18.
de Groot, R. S., R. Alkemade, L. Braat, L. Hein, and L. Willemen. 2010. Challenges in integrating the concept of ecosystem services and values in landscape planning, management and decision making. Ecological Complexity 7:260-272.
DeFries, R. S., J. A. Foley, and G. P. Asner. 2004. Land-use choices: balancing human needs and ecosystem functions. The Ecological Society of America 2:249-257.
Dick, J., C. Andrews, D. A. Beaumont, S. Benham, D. R. Brooks, S. Corbett, D. Lloyd, S. McMillan, D. T. Monteith, E. S. Pilgrim, R. Rose, A. Scott, T. Scott, R. I. Smith, C. Taylor, M. Taylor, A. Turner, and H. Watson. 2010. A comparison of ecosystem services delivered by 11 long-term monitoring sites in the UK environmental change network. Environmetrics 22:639-648.
Dick, J., J. Maes, R. I. Smith, M. L. Paracchini, and G. Zulian. 2014. Cross-scale analysis of ecosystem services identified and assessed at local and European level. Ecological Indicators 38:20-30.
Dinesen, G. E., K. Timmermann, E. Roth, S. Markager, L. Ravn-Jonsen, M. Hjorth, M. Holmer, and J. G. Støttrup. 2011. Mussel Production and Water Framework Directive Targets in the Limfjord, Denmark: an Integrated Assessment for Use in System-Based Management. Ecology and Society 16.
Egoh, B., M. Rouget, B. Reyers, A. T. Knight, R. M. Cowling, A. S. van Jaarsveld, and A. Welz. 2007. Integrating ecosystem services into conservation assessments: A review. Ecological Economics 63:714-721.
Ehrlich, P. R., and A. H. Ehrlich. 2004. One with Nineveh: politics, consumption, and the human future. Island Press.
Eigenbrod, F., P. R. Armsworth, B. J. Anderson, A. Heinemeyer, S. Gillings, D. B. Roy, C. D. Thomas, and K. J. Gaston. 2010. Error propagation associated with benefits transfer-based mapping of ecosystem services. Biological Conservation 143:2487-2493.
ELD-Initiative. 2013. The rewards of investing in sustainable land management. Interim Report for the Economics of Land Degradation Initiative: A global strategy for sustainable land management. www.eld-initiative.org.
Ellis, E. C., K. Klein Goldewijk, S. Siebert, D. Lightman, and N. Ramankutty. 2010. Anthropogenic transformation of the biomes, 1700 to 2000. Global Ecology and Biogeography:no-no.
Farber, S., R. Costanza, D. L. Childers, J. O. N. Erickson, K. Gross, M. Grove, C. S. Hopkinson, J. Kahn, S. Pincetl, A. Troy, P. Warren, and M. Wilson. 2006. Linking Ecology and Economics for Ecosystem Management. BioScience 56:121-133.
Fisher, B., K. Turner, M. Zylstra, R. Brouwer, R. d. Groot, S. Farber, P. Ferraro, R. Green, D. Hadley, J. Harlow, P. Jefferiss, C. Kirkby, P. Morling, S. Mowatt, R. Naidoo, J. Paavola, B. Strassburg, D. Yu, and A. Balmford. 2008. Ecosystem Services And Economic Theory: Integration For Policy-Relevant Research. Ecological Applications 18:2050-2067.
34
Fisher, B., R. K. Turner, and P. Morling. 2009. Defining and classifying ecosystem services for decision making. Ecological Economics 68:643-653.
Flyvbjerg, B. 2005. Social science that matters. Foresight Europe 2:38-42.
Foley, J. A., R. Defries, G. P. Asner, C. Barford, G. Bonan, S. R. Carpenter, F. S. Chapin, M. T. Coe, G. C. Daily, H. K. Gibbs, J. H. Helkowski, T. Holloway, E. A. Howard, C. J. Kucharik, C. Monfreda, J. A. Patz, I. C. Prentice, N. Ramankutty, and P. K. Snyder. 2005. Global consequences of land use. Science 309:570-574.
Foley, J. A., N. Ramankutty, K. A. Brauman, E. S. Cassidy, J. S. Gerber, M. Johnston, N. D. Mueller, C. O/'Connell, D. K. Ray, P. C. West, C. Balzer, E. M. Bennett, S. R. Carpenter, J. Hill, C. Monfreda, S. Polasky, J. Rockstrom, J. Sheehan, S. Siebert, D. Tilman, and D. P. M. Zaks. 2011. Solutions for a cultivated planet. Nature 478:337-342.
Fu, B. J., C. H. Su, Y. P. Wei, I. R. Willett, Y. H. Lu, and G. H. Liu. 2011. Double counting in ecosystem services valuation: causes and countermeasures. Ecological Research 26:1-14.
Funtowicz, S., and J. Ravetz. 2003. Post-normal science. International Society for Ecological Economics (ed.), Online Encyclopedia of Ecological Economics at http://www.ecoeco.org/publica/encyc.html.
Funtowicz, S. O., and J. R. Ravetz. 1994a. Uncertainty, complexity and post-normal science. Environmental Toxicology and Chemistry 13:1881-1885.
Funtowicz, S. O., and J. R. Ravetz. 1994b. The worth of a songbird: ecological economics as a post-normal science. Ecological Economics 10:197-207.
Geist, H. J., and E. F. Lambin. 2004. Dynamic Causal Patterns of Desertification. BioScience 54:817-829.
Ghaley, B. B., and J. R. Porter. 2014. Ecosystem function and service quantification and valuation in a conventional winter wheat production system with DAISY model in Denmark. Ecosystem Services 10:79-83.
Haines-Young, R., and M. Potschin. 2011. Common international classification of ecosystem services (CICES): 2011 Update. Nottingham.
Harley, J. B., and D. Woodward. 1987. Cartography in prehistoric, ancient, and medieval Europe and the Mediterranean. University of Chicago Press Chicago.
Hauck, J., C. Görg, R. Varjopuro, O. Ratamäki, and K. Jax. 2013. Benefits and limitations of the ecosystem services concept in environmental policy and decision making: Some stakeholder perspectives. Environmental Science & Policy 25:13-21.
Hein, L., K. van Koppen, R. S. de Groot, and E. C. van Ierland. 2006. Spatial scales, stakeholders and the valuation of ecosystem services. Ecological Economics 57:209-228.
Hernández-Morcillo, M., T. Plieninger, and C. Bieling. 2013. An empirical review of cultural ecosystem service indicators. Ecological Indicators 29:434-444.
Jelinski, D. E., and J. Wu. 1996. The modifiable areal unit problem and implications for landscape ecology. Landscape Ecology 11:129-140.
35
Johnston, R. J., and M. Russell. 2011. An operational structure for clarity in ecosystem service values. Ecological Economics 70:2243-2249.
Kienast, F., J. Bolliger, M. Potschin, R. S. de Groot, P. H. Verburg, I. Heller, D. Wascher, and R. Haines-Young. 2009. Assessing landscape functions with broad-scale environmental data: insights gained from a prototype development for Europe. Environ Manage 44:1099-1120.
Koenig, W. D. 2002. Global patterns of environmental synchrony and the Moran effect. Ecography 25:283-288.
Kosmas, C., O. Kairis, C. Karavitis, C. Ritsema, L. Salvati, S. Acikalin, M. Alcalá, P. Alfama, J. Atlhopheng, and J. Barrera. 2013. Evaluation and selection of indicators for land degradation and desertification monitoring: methodological approach. Environ Manage:1-20.
Laurans, Y., A. Rankovic, R. Billé, R. Pirard, and L. Mermet. 2013. Use of ecosystem services economic valuation for decision making: Questioning a literature blindspot. J Environ Manage 119:208-219.
Liu, S., R. Costanza, S. Farber, and A. Troy. 2010. Valuing ecosystem services. Annals of the New York Academy of Sciences 1185:54-78.
Liu, S., and D. I. Stern. 2008. A meta-analysis of contingent valuation studies in coastal and near-shore marine ecosystems.
Loreau, M., N. Mouquet, and R. D. Holt. 2003. Meta-ecosystems: a theoretical framework for a spatial ecosystem ecology. Ecol Lett 6:673-679.
Martín-López, B., E. Gómez-Baggethun, M. García-Llorente, and C. Montes. 2014. Trade-offs across value-domains in ecosystem services assessment. Ecological Indicators 37, Part A:220-228.
McCauley, D. J. 2006. Selling out on nature. Nature 443:27.
MEA. 2005. Millennium Ecosystem Assessment, Synthesis. World Resources Institute, Washington, DC.
Mäler, K. G., S. Aniyar, and A. Jansson. 2008. Accounting for ecosystem services as a way to understand the requirements for sustainable development. Proc Natl Acad Sci U S A 105:9501-9506.
Naidoo, R., A. Balmford, R. Costanza, B. Fisher, R. E. Green, B. Lehner, T. R. Malcolm, and T. H. Ricketts. 2008. Global mapping of ecosystem services and conservation priorities. Proc Natl Acad Sci U S A 105:9495-9500.
Nayak, P. K., L. E. Oliveira, and F. Berkes. 2014. Resource degradation, marginalization, and poverty in small-scale fisheries: threats to social-ecological resilience in India and Brazil. Ecol Soc 19:73.
Nkonya, E., N. Gerber, P. Baumgartner, J. Von Braun, A. De Pinto, V. Graw, E. Kato, J. Kloos, and T. Walter. 2011a. The economics of desertification, land degradation, and drought toward an integrated global assessment. ZEF-Discussion Papers on Development Policy.
36

Nkonya, E., M. Winslow, M. S. Reed, M. Mortimore, and A. Mirzabaev. 2011. Monitoring and Assessing the Influence of Social, Economic and Policy Factors on Sustainable Land Management in Drylands. Land Degradation & Development 22:240-247.
Norgaard, R. 1994. Development Betrayed. The End of Progress and a Coevolutionary Revisioning of the Future. Londres, Routledge.
Norgaard, R. B. 1988. Sustainable development: a co-evolutionary view. Futures 20:606-620.
Norgaard, R. B. 2010. Ecosystem services: From eye-opening metaphor to complexity blinder. Ecological Economics 69:1219-1227.
Norton, B. G. 2008. Beyond positivist ecology: Toward an integrated ecological ethics. Science and engineering ethics 14:581-592.
Norton, B. G., and D. Noonan. 2007. Ecology and valuation: Big changes needed. Ecological Economics 63:664-675.
Odgaard, B. V., and P. Rasmussen. 2000. Origin and temporal development of macro-scale vegetation patterns in the cultural landscape of Denmark. Journal of Ecology 88:733-748.
Perman, R., Y. Ma, and J. McGilvray. 2011. Natural Resource and Environmental Economics.
Plieninger, T., S. Dijks, E. Oteros-Rozas, and C. Bieling. 2013. Assessing, mapping, and quantifying cultural ecosystem services at community level. Land Use Policy 33:118-129.
Queiroz, C., M. Meacham, K. Richter, A. V. Norström, E. Andersson, J. Norberg, and G. Peterson. 2015. Mapping bundles of ecosystem services reveals distinct types of multifunctionality within a Swedish landscape. Ambio 44:89-101.
Raudsepp-Hearne, C., G. D. Peterson, and E. M. Bennett. 2010. Ecosystem service bundles for analyzing tradeoffs in diverse landscapes. Proc Natl Acad Sci U S A 107:5242-5247.
Rockström, J., W. Steffen, K. Noone, Å. Persson, F. S. Chapin, E. F. Lambin, T. M. Lenton, M. Scheffer, C. Folke, and H. J. Schellnhuber. 2009. A safe operating space for humanity. Nature 461:472-475.
Sanderson, E. W., M. Jaiteh, M. A. Levy, K. H. Redford, A. V. Wannebo, and G. Woolmer. 2002. The Human Footprint and the Last of the Wild BioScience 52:891-904.
Schroth, G., and J. A. McNeely. 2011. Biodiversity conservation, ecosystem services and livelihoods in tropical landscapes: towards a common agenda. Environ Manage 48:229-236.
Seppelt, R., C. F. Dormann, F. V. Eppink, S. Lautenbach, and S. Schmidt. 2011. A quantitative review of ecosystem service studies: approaches, shortcomings and the road ahead. Journal of Applied Ecology 48:630-636.
Steffen, W., P. J. Crutzen, and J. R. McNeill. 2007. The Anthropocene: Are Humans Now Overwhelming the Great Forces of Nature. AMBIO: A Journal of the Human Environment 36:614-621.
37
Steffen, W., K. Richardson, J. Rockström, S. E. Cornell, I. Fetzer, E. M. Bennett, R. Biggs, S. R. Carpenter, W. de Vries, and C. A. de Wit. 2015. Planetary boundaries: Guiding human development on a changing planet. Science:1259855.
Sutton, M. A., C. M. Howard, and J. W. Erisman. 2011. The European nitrogen assessment: sources, effects and policy perspectives. Cambridge University Press.
TEEB. 2010. The Economics of Ecosystems and Biodiversity Ecological and Economic Foundations. Earthscan, London and Washington.
Tscharntke, T., A. M. Klein, A. Kruess, I. Steffan-Dewenter, and C. Thies. 2005. Landscape perspectives on agricultural intensification and biodiversity � ecosystem service management. Ecol Lett 8:857-874.
Van Lieshout, M., A. Dewulf, N. Aarts, and C. Termeer. in press. The Power to Frame the Scale? Analysing Scalar Politics over, in and of a Deliberative Governance Process. Journal of Environmental Policy & Planning 1-24.
Vejre, H., F. S. Jensen, and B. J. Thorsen. 2010. Demonstrating the importance of intangible ecosystem services from peri-urban landscapes. Ecological Complexity 7:338-348.
Vos, W., and H. Meekes. 1999. Trends in European cultural landscape development: perspectives for a sustainable future. Landscape and Urban Planning 46:3-14.
Wallace, K. J. 2007. Classification of ecosystem services: Problems and solutions. Biological Conservation 139:235-246.
Wegner, G., and U. Pascual. 2011. Cost-benefit analysis in the context of ecosystem services for human well-being: A multidisciplinary critique. Global Environmental Change 21:492-504.
Willemen, L., A. Veldkamp, P. H. Verburg, L. Hein, and R. Leemans. 2012. A multi-scale modelling approach for analysing landscape service dynamics. J Environ Manage 100:86-95.
Zhang, W., T. H. Ricketts, C. Kremen, K. Carney, and S. M. Swinton. 2007. Ecosystem services and dis-services to agriculture. Ecological Economics 64:253-260.
Zia, A., P. Hirsch, A. Songorwa, D. R. Mutekanga, S. O'Connor, T. McShane, P. Brosius, and B. Norton. 2011. Cross-scale value trade-offs in managing social-ecological systems: the politics of scale in Ruaha National Park, Tanzania. Ecology and Society 16:7.
Websites:
Statistics Denmark 2015 http://www.dst.dk/pukora/epub/upload/19006/denmark2015.pdf,
last accessed 27/05/15
FAO Global population: http://www.fao.org/geonetwork/srv/en/main.home, last accessed
27/05/15
World Bank 2015 http://data.worldbank.org/indicator/SP.URB.TOTL.IN.ZS, last accessed
27/05/15
38