mapping boston's public space with 75,000 instagrams
TRANSCRIPT
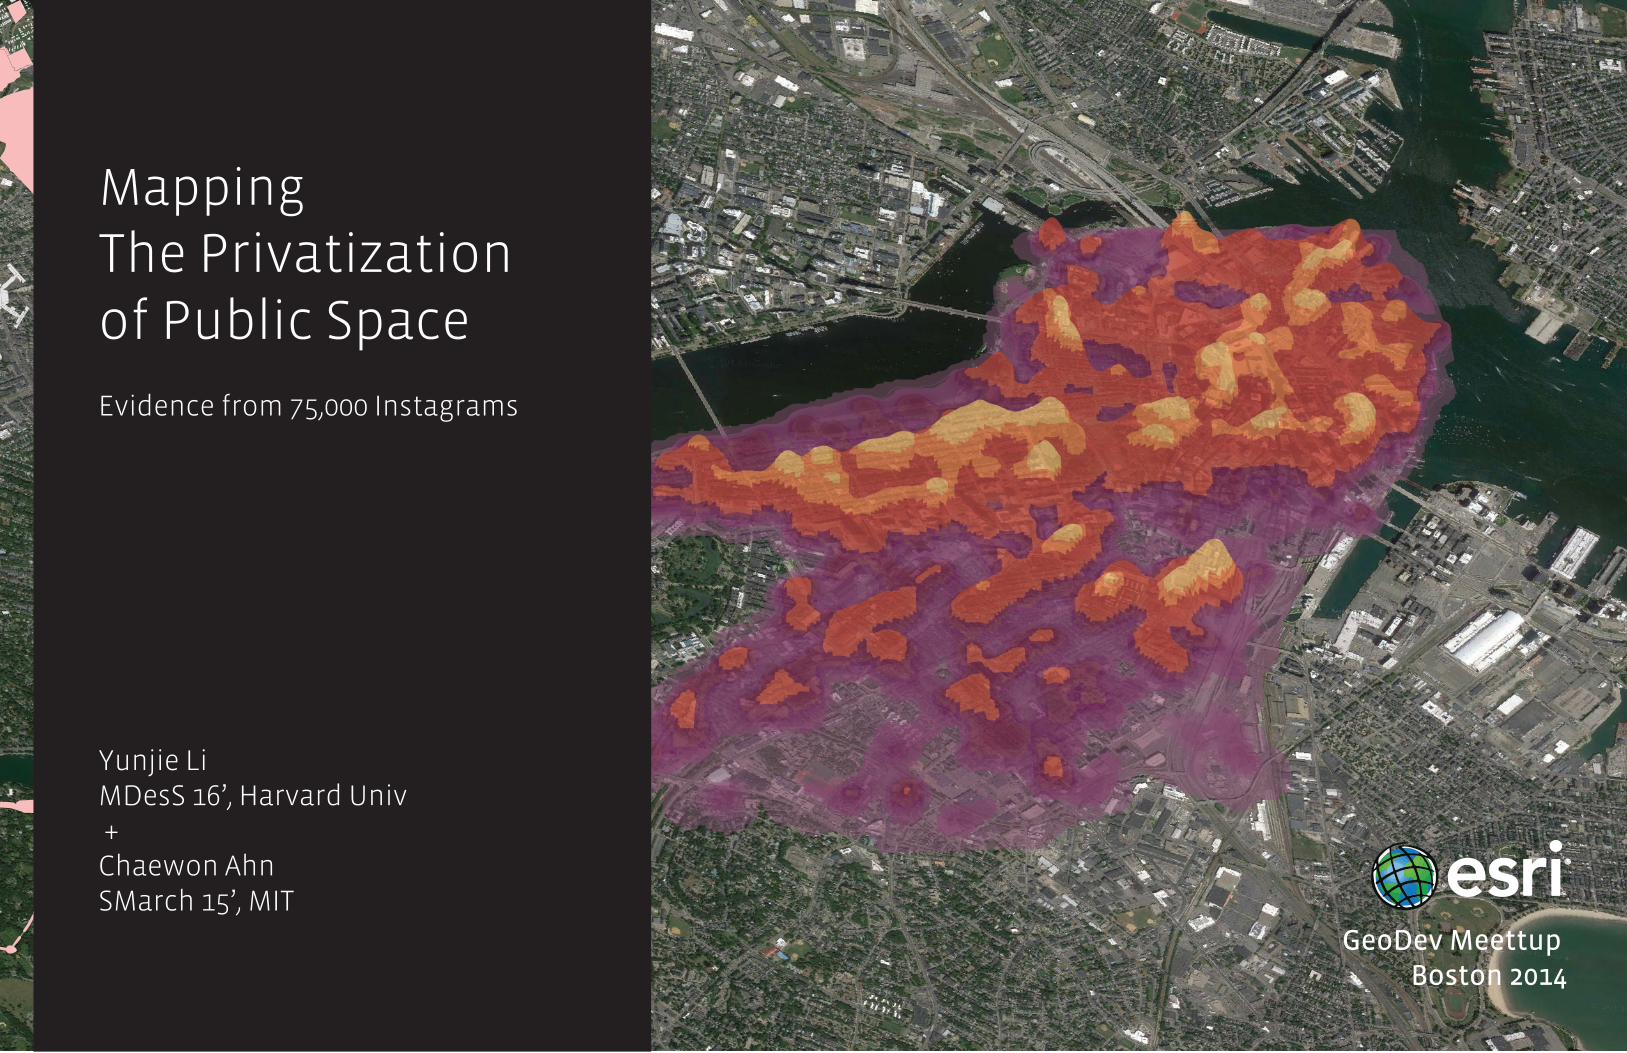
MappingThe Privatizationof Public Space
Evidence from 75,000 Instagrams
Yunjie LiMDesS 16’, Harvard Univ +Chaewon AhnSMarch 15’, MIT
GeoDev Meettup Boston 2014
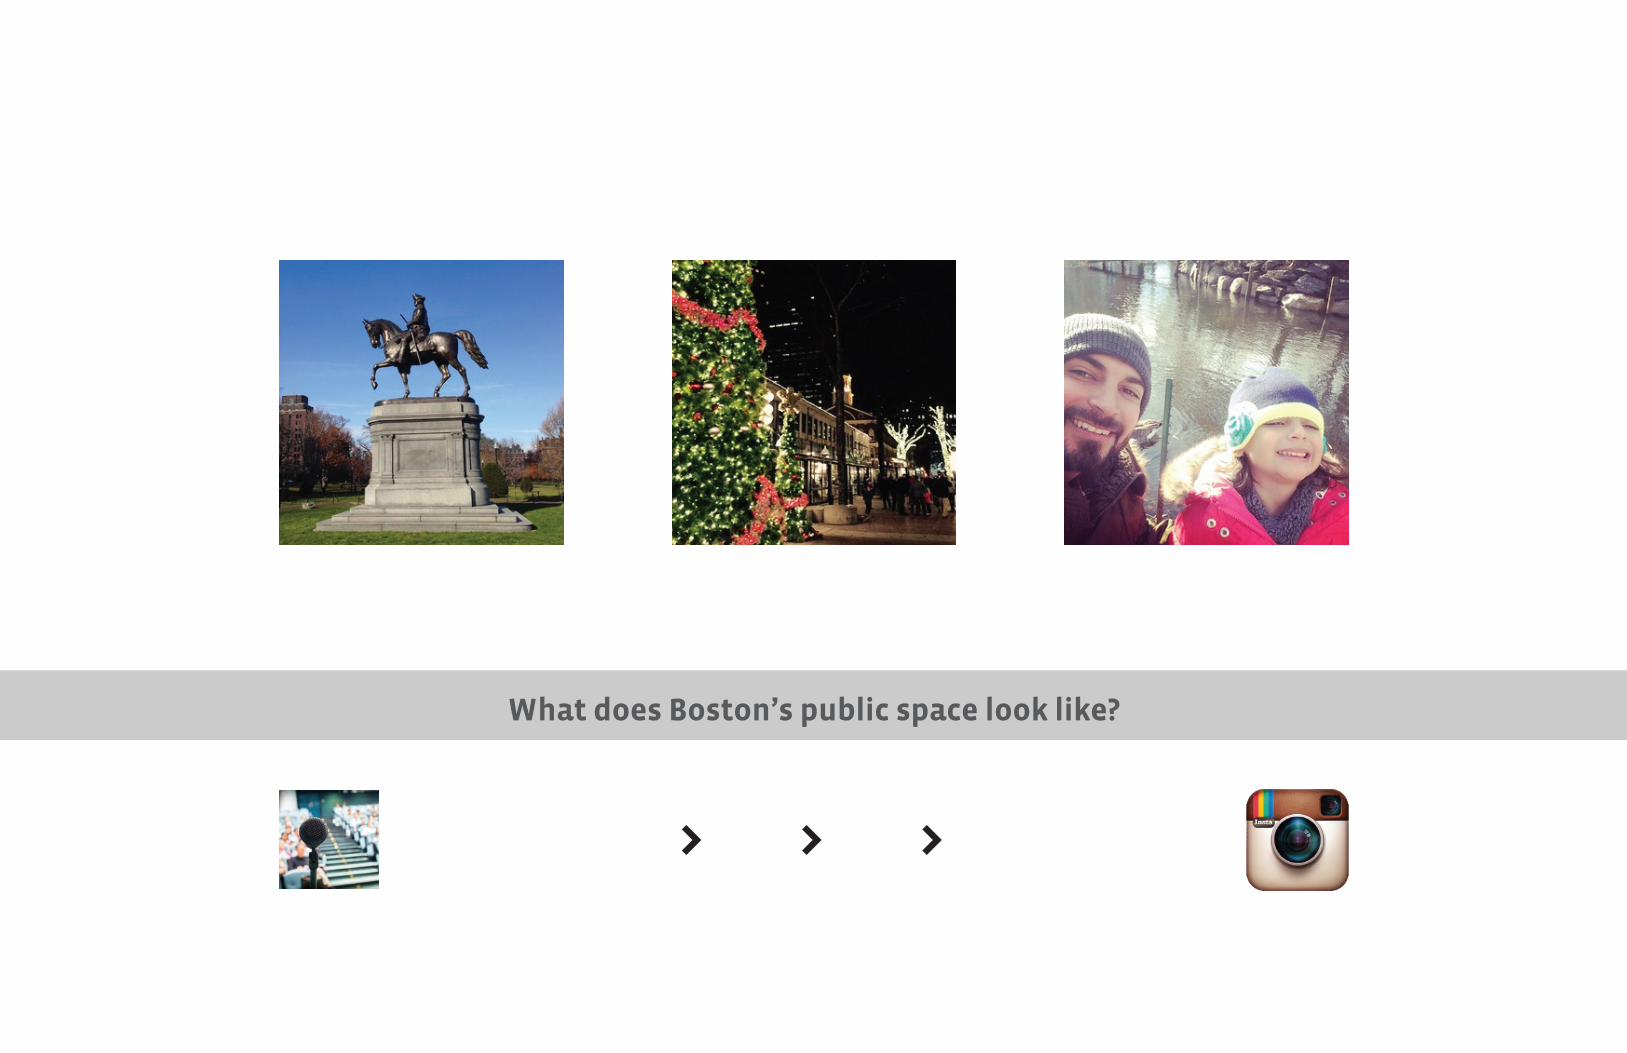
What does Boston’s public space look like?
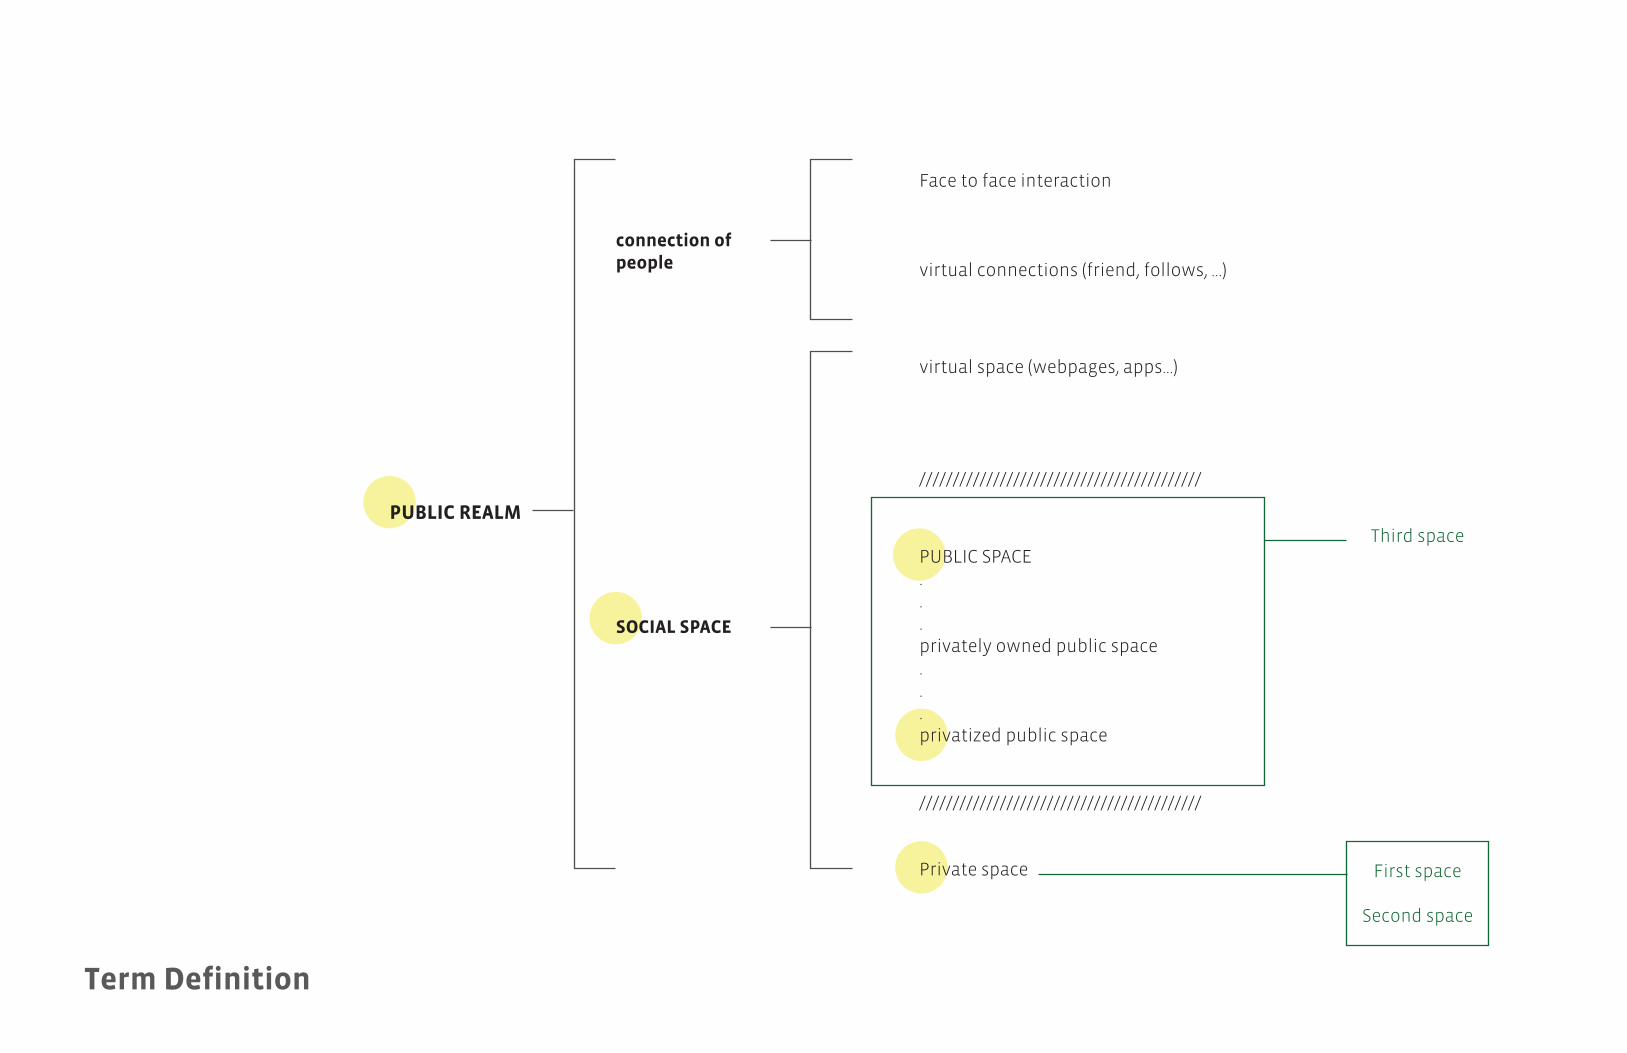
SOCIAL SPACE
PUBLIC SPACE...privately owned public space...privatized public space
//////////////////////////////////////////
Private space
virtual space (webpages, apps...)
//////////////////////////////////////////
PUBLIC REALM
connection of people
Face to face interaction
virtual connections (friend, follows, ...)
Term Definition
Third space
First space
Second space
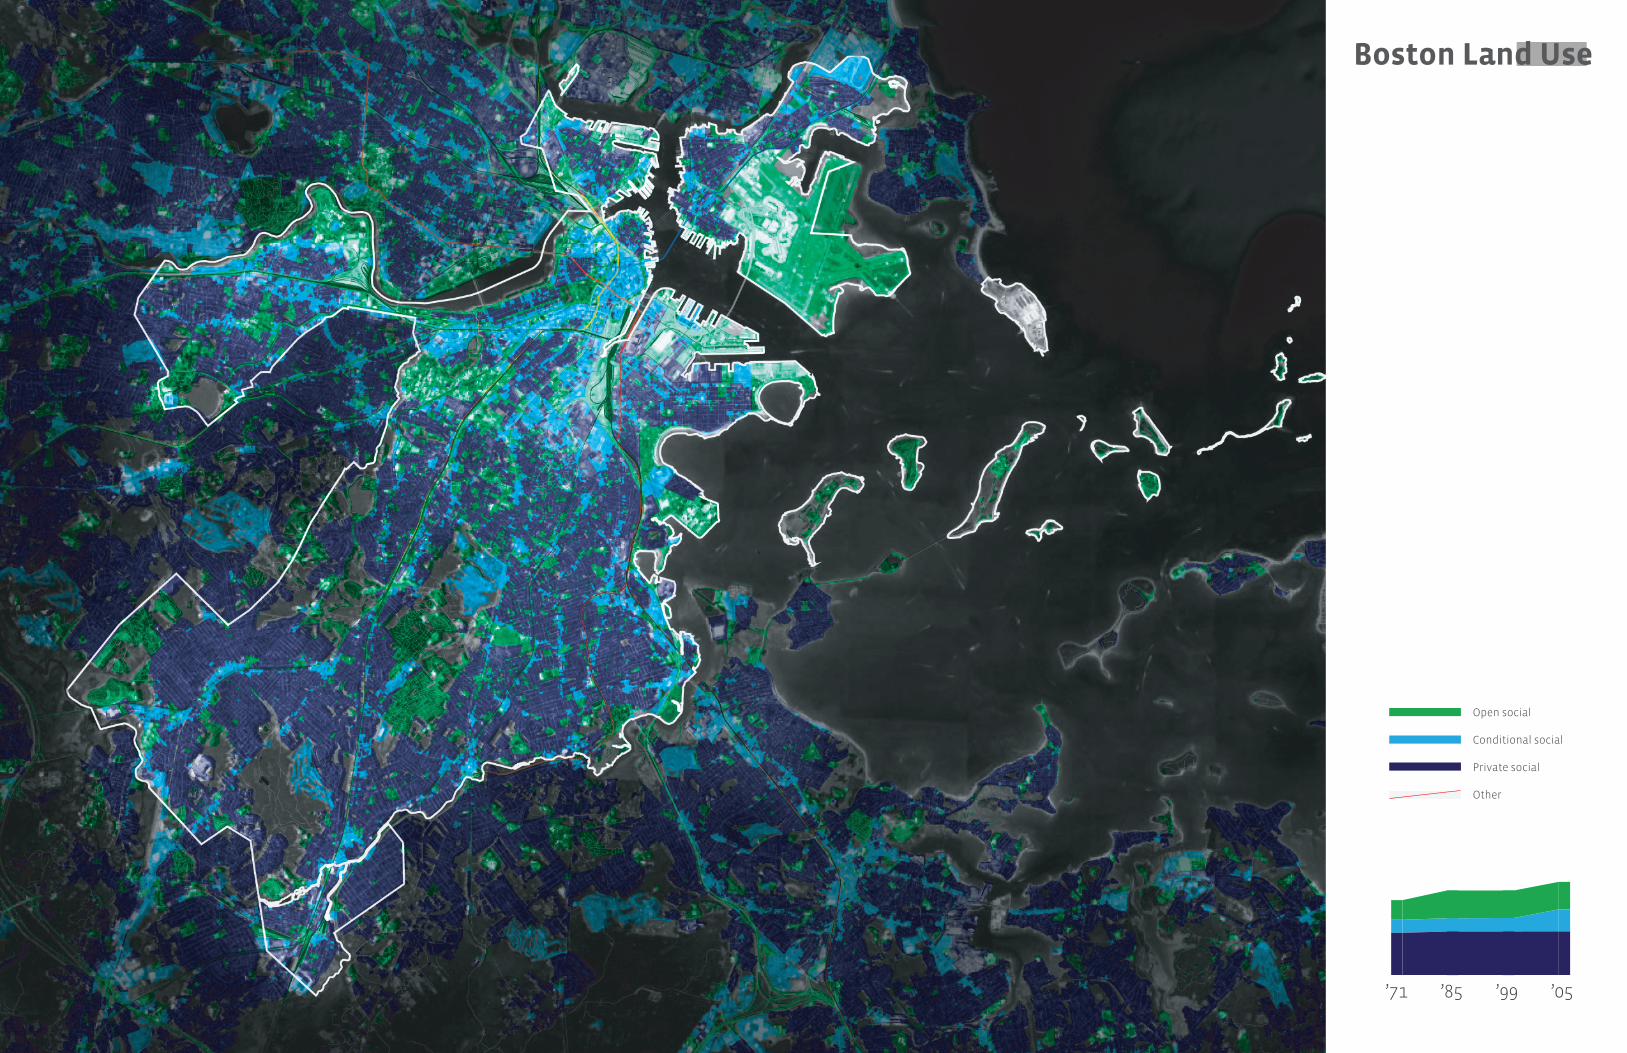
2005Boston Land Use
’71 ’85 ’99 ’05
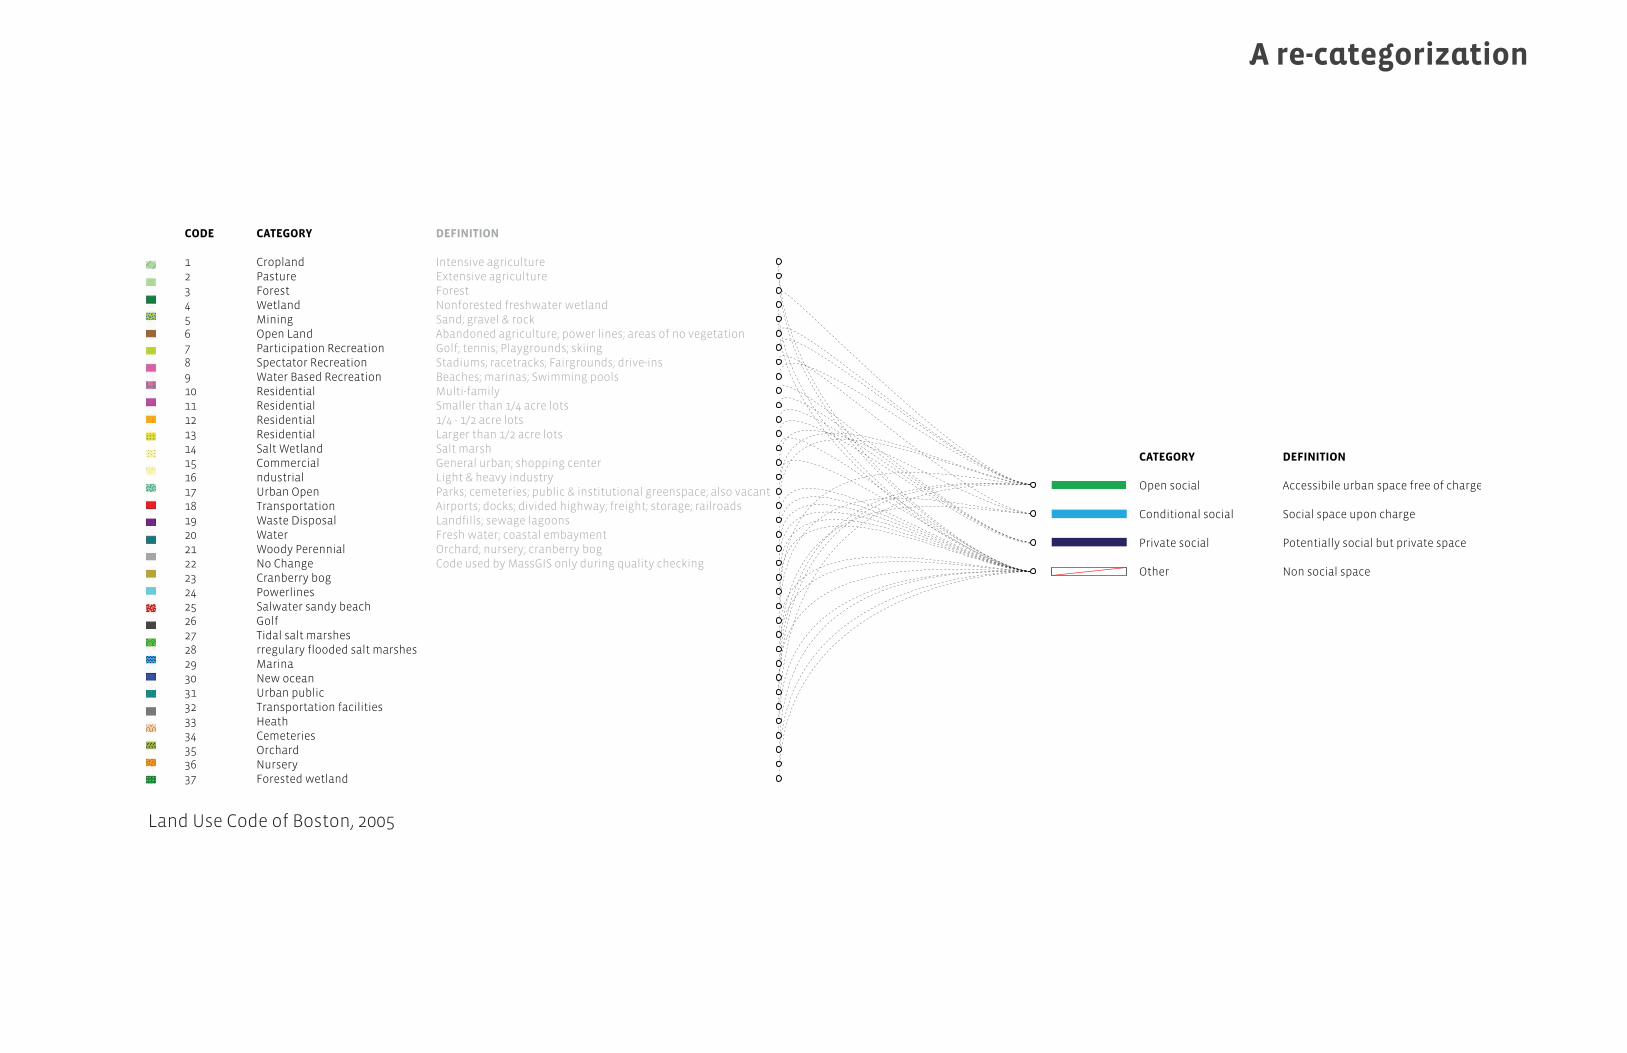
A re-categorization
Land Use Code of Boston, 2005
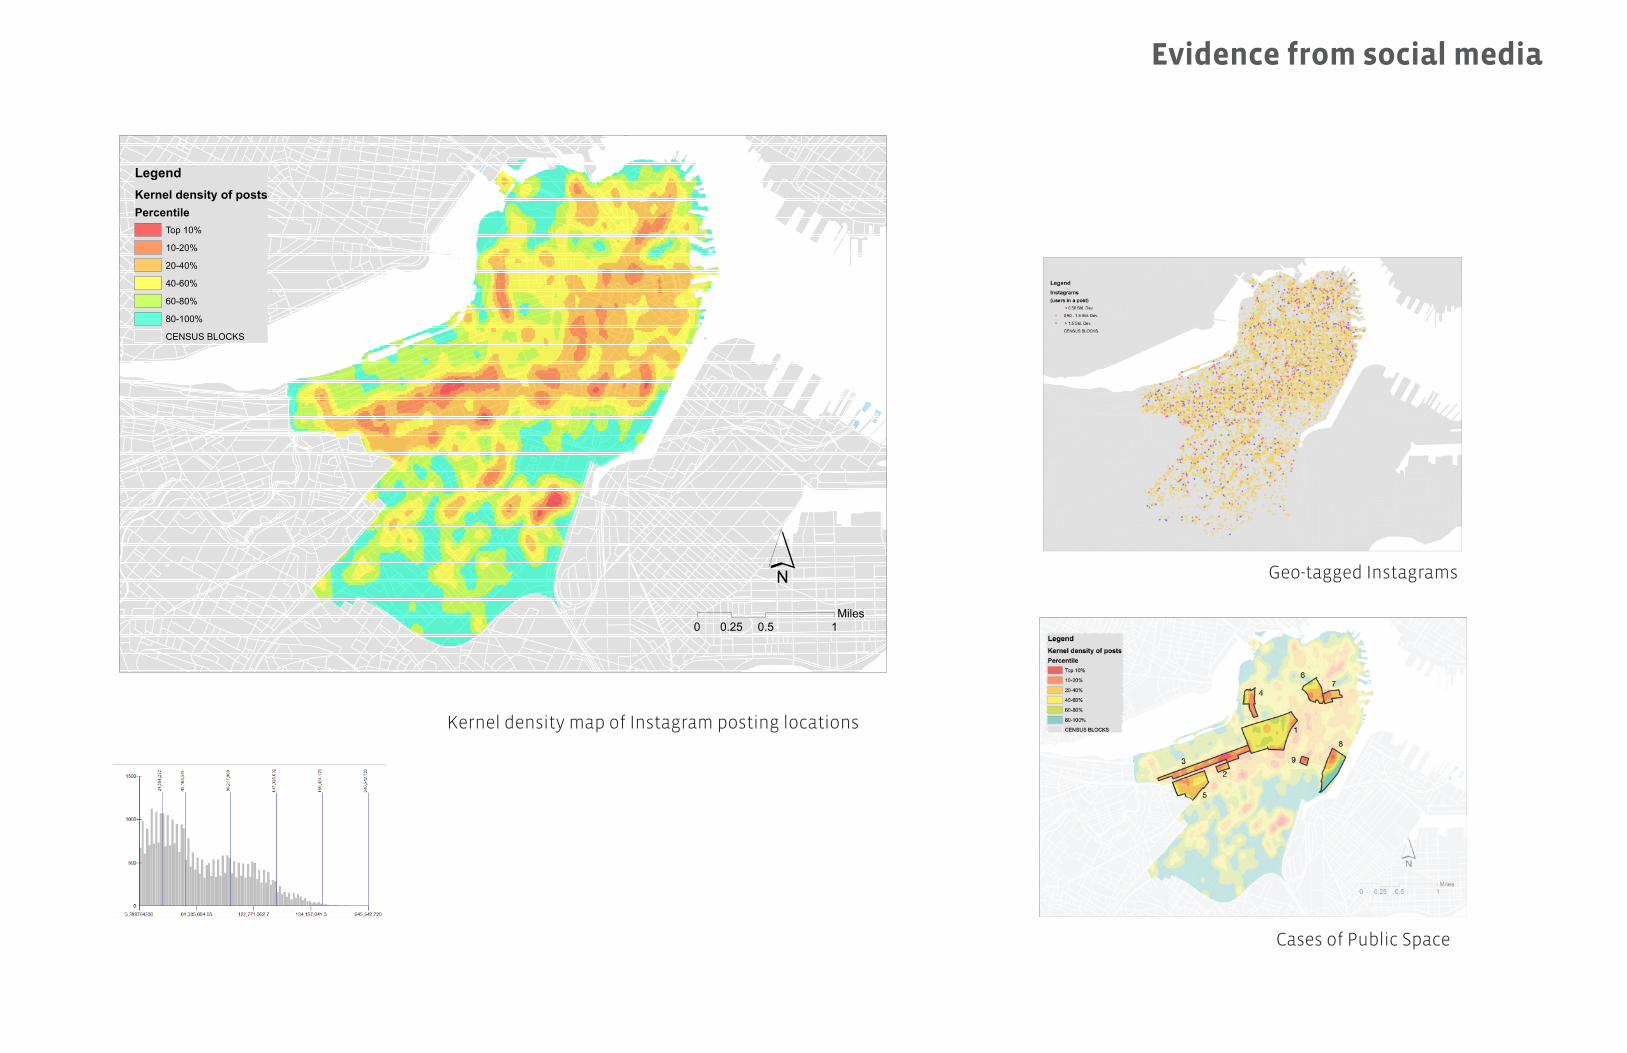
Evidence from social media
LegendKernel density of postsPercentile
Top 10%
10-20%
20-40%
40-60%
60-80%
80-100%
CENSUS BLOCKS
´0 0.5 10.25
Miles
Geo-tagged Instagrams
Cases of Public Space
Kernel density map of Instagram posting locations
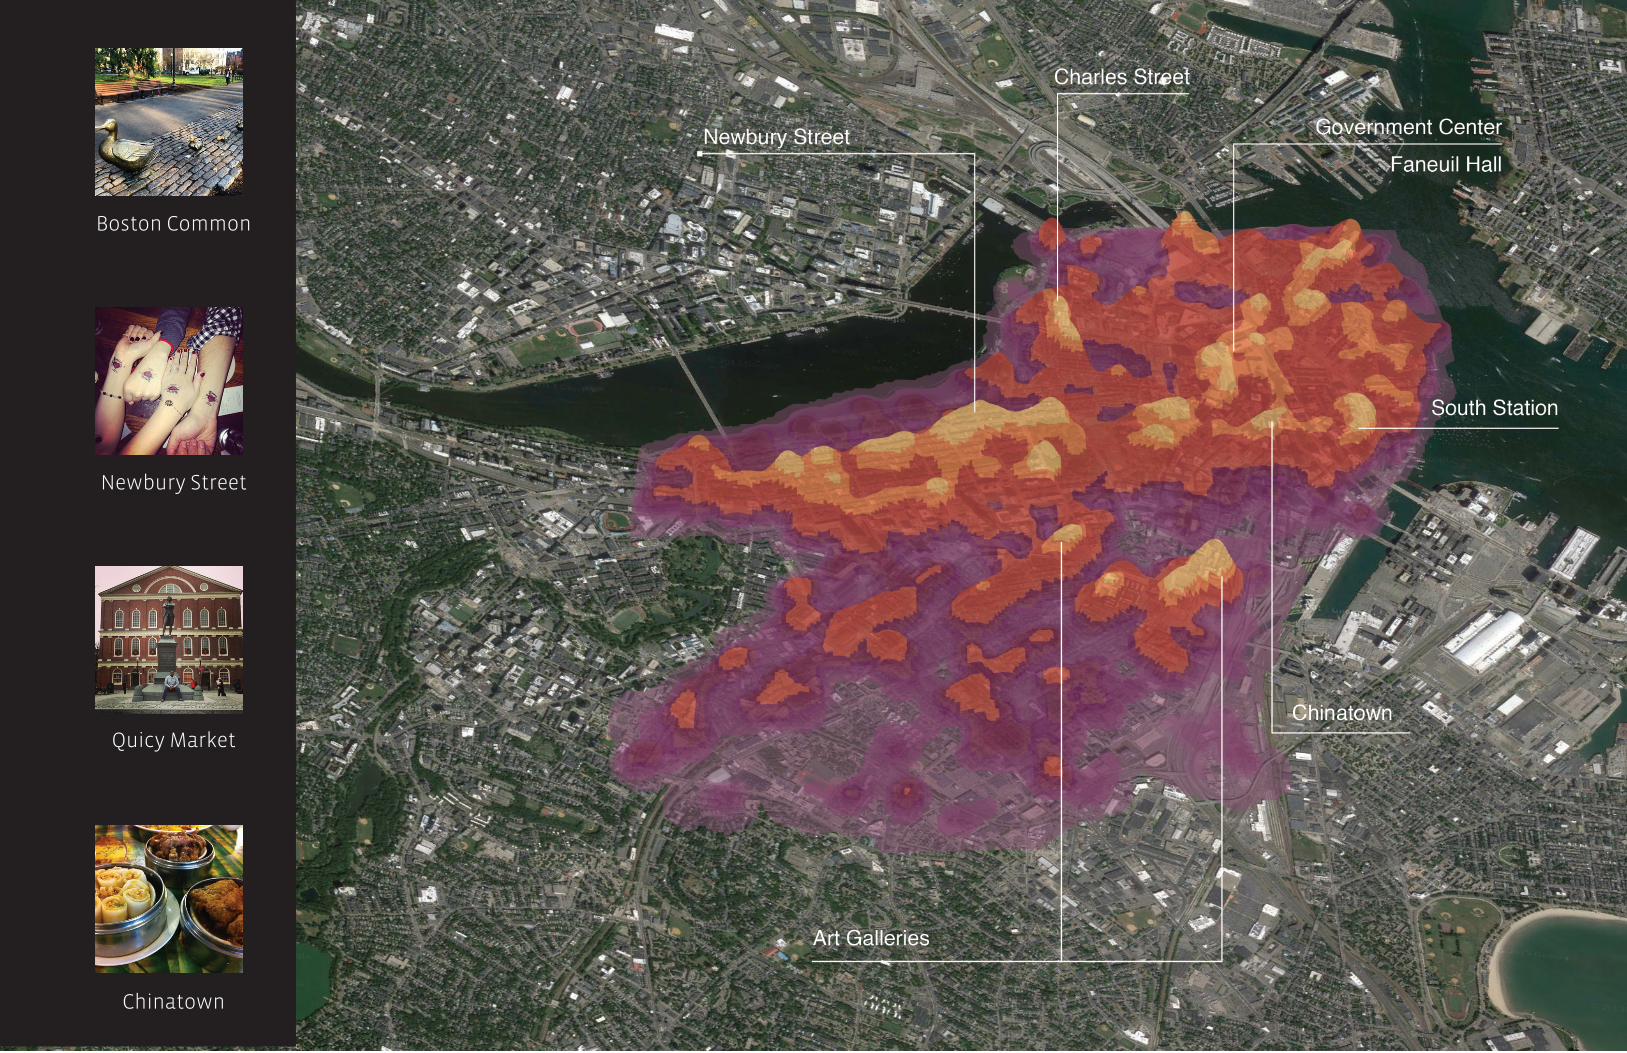
Chinatown
Quicy Market
Newbury Street
Boston Common
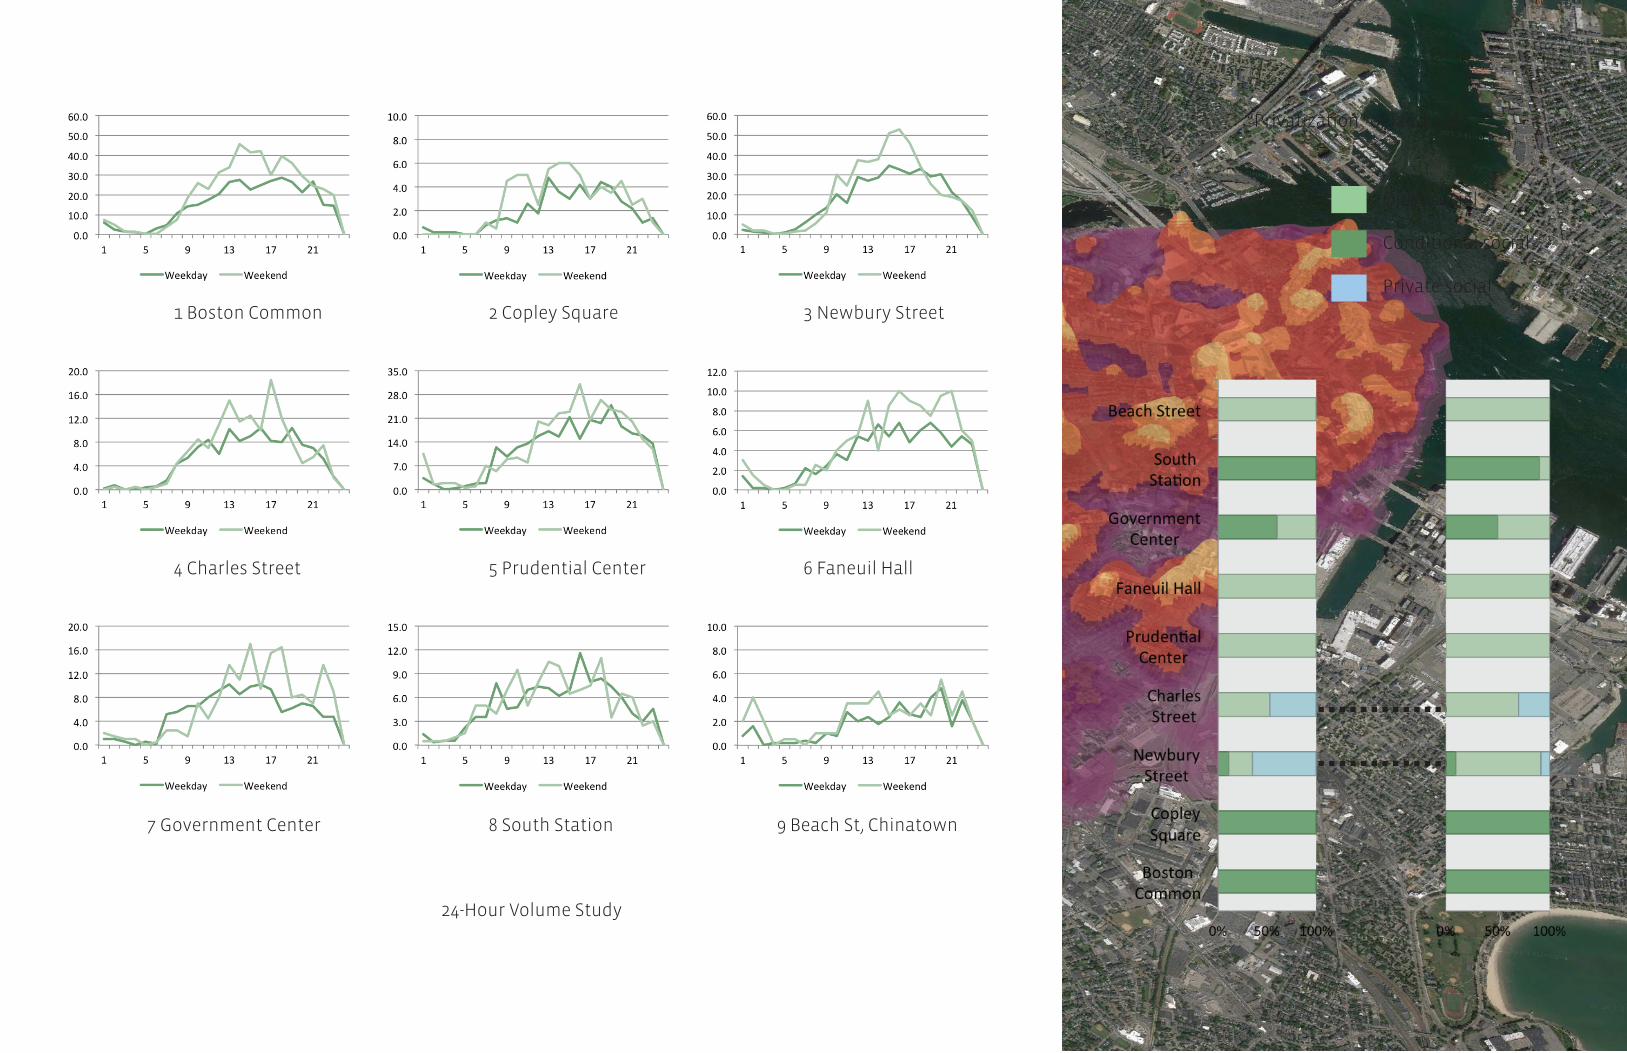
“Privatization” of land use?
24-Hour Volume Study
Open social
Conditional social
Private social
1 Boston Common 2 Copley Square 3 Newbury Street
4 Charles Street 5 Prudential Center 6 Faneuil Hall
7 Government Center 8 South Station 9 Beach St, Chinatown
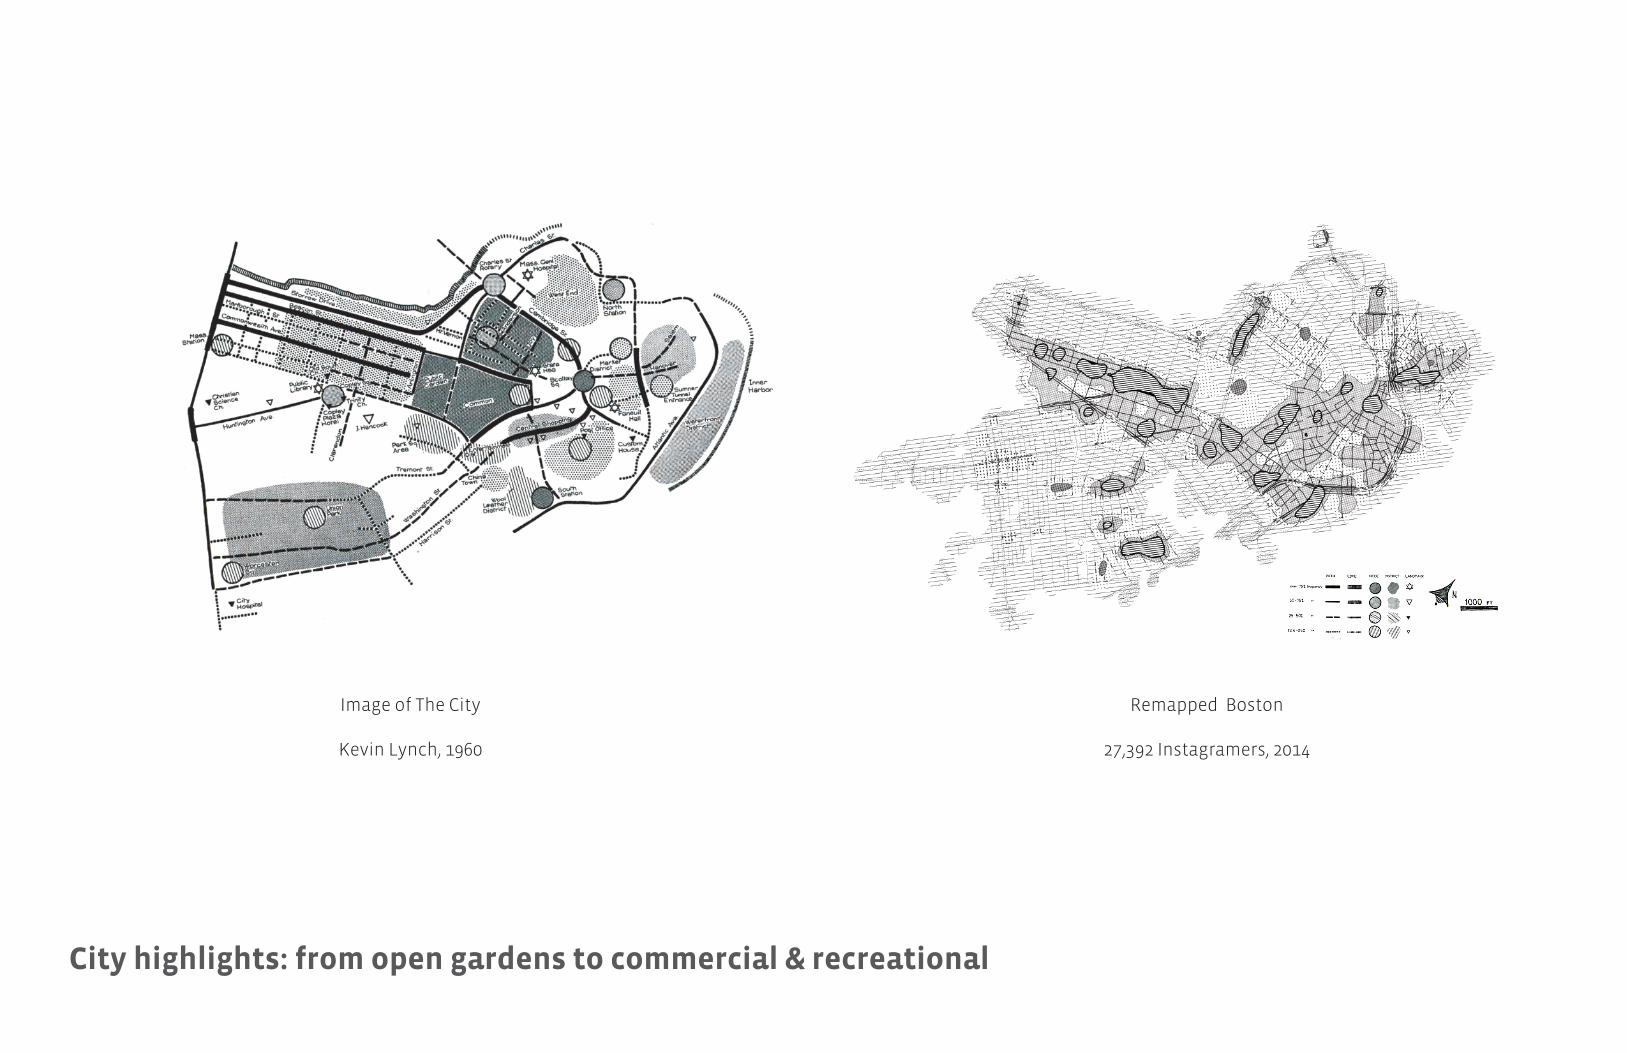
City highlights: from open gardens to commercial & recreational
Image of The City
Kevin Lynch, 1960
Remapped Boston
27,392 Instagramers, 2014