mapping critical water infrastructures in the ... · mapping critical water infrastructures in the...
TRANSCRIPT

Mapping Critical Water Infrastructures
in the Neighborhoods of Burunga,
Arraijan, Panama
Interactive Qualifying Project Report completed in partial fulfillment
of the Bachelor of Science Degree at
Worcester Polytechnic Institute
Submitted: October 11th 2017
By:
Peter Carosa
Brandon Cohen
Alisa daSilva
Luke Fronhofer
Submitted to:
James Chiarelli
Stephen McCauley
ii
ABSTRACT
In the three Panamanian neighborhoods of Nueva Jerusalen, 13 de Febrero, and La
Alameda, significant land development and population growth have caused a growing demand
for a stable method of water distribution. The area is yet to be fully mapped and documented,
causing difficulty for the agencies trying to upgrade community water infrastructures. We
created an interactive map plotting roads and existing water features. With this information, we
provided recommendations on required pipe infrastructures and water pressure.
iii
ACKNOWLEDGEMENTS
The completion of this project would not have been possible without the help and
consideration of those who both advised and contributed to the success of our project. We would
like to recognize and thank those who have been a driving force in helping this project along.
We would first like to thank IDAAN and all the employees that provided us with the
opportunity to work on and complete their project. We would like to extend a specific thanks to
Yamileth Quintero, our IDAAN counterpart, who oversaw the work on our project. With her
help we were able to help gain an understanding of our deliverables and scope of work. We
would also like to thank Alonso “Franco” Castillo for his work in organizing the project amongst
the three IQP teams. He continually provided support and guidance throughout our field work.
Next we would like to extend our gratitude to our sponsor Ricardo “Rick” Montanari and
his nonprofit organization Footprint Possibilities. Rick helped define our scope of work and
helped us with weekly organization and meetings to ensure the project was on schedule. His
dedication to our work was a great help in understanding the needs of our client IDAAN.
Whether it was a last second meeting or email updates, his support was always known and
appreciated.
Our project would not have been possible without the help from our advisors James
Chiarelli and Stephen McCauley for their dedication and assistance in overseeing our projects
completion. Prof. Chiarelli in addition to facilitating our ID2050 seminar, has provided his time
and guidance in helping our project develop. Prof. McCauley helped provide valuable criticism
and guidance in helping our project meet all the requirements of an IQP.
Finally, we would like to recognize and work done by the Footprint Census and
Environmental IQP teams. Their work and data collection helped to contribute to our shared goal
of providing valuable information to IDAAN. Both teams helped to organize and set up field
work as well as continued communication with our sponsor and client. Without the
accomplishments and collaborations of these teams, our project would not stand as successful.

iv
EXECUTIVE SUMMARY
Purpose Overview
The Panama Canal runs north-south and divides the country of Panama into Eastern and
Western zones. The state-owned lands surrounding the Panama Canal Zone have become home
to settlers over the last 20 years due to the availability of the land with the handover of the canal
back to the country of Panama. As a result, governmental agencies, such as El Instituto de
Acueductos y Alcantarillados Nacionales (National Institute of Aqueducts and Sewers), also
known as IDAAN, have been struggling to provide these new communities with basic utilities;
most households in these areas do not have potable water.
Arraijan is a district just west of the canal which contains the sub-district of Burunga,
where many of the houses have been built within the last 10 years. Currently in the region of
Burunga, there exists a water tower holding 50,000 gallons and an additional 1.6 million gallons
in an underground reserve tank; this water tower will service three of the over a dozen
neighborhoods in Burunga: La Alameda, Nueva Jerusalen and 13 de Febrero. This is part of a
World Bank funded project to provide Burunga with a water and sewage system; $10 million of
this loan is going to the three communities in which we worked. IDAAN will pump water from
the water tower to the highest points in La Alameda and 13 de Febrero where gravity fed water
tanks, that are large enough to sustain the community’s water needs, will distribute water to the
surrounding areas. The underlying issue for IDAAN was a lack of information about the
communities and the existing infrastructure in the region. Without this information it has been
impossible for IDAAN to distribute the water to the nearby neighborhoods. Therefore existing
maps needed to be updated to reflect this population expansion and to establish a baseline profile
of existing infrastructures to provide these areas with potable water.
Our project goal was to provide IDAAN with knowledge of the current water
infrastructures (such as water tanks and culverts) and create maps of neighborhoods in the
Burunga sub-district to establish formal boundary lines and identify paved roads. Our maps of
the rural communities in Burunga will help IDAAN and other governmental agencies to assess
the living situations of people in these regions and alleviate a major problem that these
communities face: the lack of access to a potable and sanitary water supply. We worked in
cooperation with Footprint Possibilities, a nonprofit organization that works to improve the
v
wellbeing of Panamanian communities, in coordination with partners from IDAAN, to reach the
goal of helping the rural communities of Panama establish capable water systems and overall
community improvement.
Methods
The overall purpose of our project was to plot, organize, and map the communities’
critical water features in a single database. This will assist our sponsor, IDAAN, to determine
where to allocate the $10 million dollar World Bank loan to much-needed infrastructure in the
neighborhoods of La Alameda, Nueva Jerusalen and 13 de Febrero in the sub-district of
Burunga.
The features in the area were mainly culverts, personal water tanks, and roads. We
mapped these features using the iPhone application Map Plus, which allowed us to mark points
with descriptions and pictures of the features and transfer them into a distinct mapping layer for
each feature we encountered.
Our first task in the mapping work was to establish polygons representing the boundaries
of the neighborhoods, which we determined by referencing IDAAN’s latest maps of the region
(from 2009) and by walking the perimeter of the communities. Once our areas of work were
established we broke up into teams of two and walked each road while making note of the
location and description of critical water infrastructures in the Map Plus app.
Our team set out over five days and covered 40.84km (25.38 miles) of roads in the three
communities. The communities covered a total of 1.32km2 (326 acres), but the terrain was very
hilly and in some cases difficult to walk. In total our team had an elevation gain of almost 1300
m (4265 ft) and spent almost 14 hours on these mapping excursions.
While plotting and mapping the three neighborhoods, we engaged with community
members who showed interest in the work. In many instances we were approached and asked
what were we doing and why were we doing it. We used practiced Spanish phrases to establish
rapport with community members as well as to explain the nature of our work. This
communication was an important component in completing our project.
This year there were three different WPI Project teams coordinating with Footprint
Possibilities which required us to work cohesively not only with our sponsor and client, but with

vi
two other WPI teams. Our team took on the responsibility of organizing the data collected by the
other teams into a comprehensive interactive map to allow all of the data collected to be viewed
in one location. One team, the Census Team, surveyed the neighborhoods to later make an
estimation on water demand, while the other team, the Environmental Team, tested water quality
of the Burunga River which ran along all three neighborhoods. We used Google MyMaps to
allow different members of IDAAN to access this information.
To provide recommendations on the pipe requirements to pump water from the water
tower to La Alameda and 13 de Febrero we calculated the minimum cross sectional area of the
main pipes needed. We also identified the locations of the highest altitudes in La Alameda and
13 de Febrero and mapped a route for the pipes from the existing water tower to the highest
points, where IDAAN has plans for gravity fed water tanks to be built. We also used the
Bernoulli Equation to estimate the pressure needed to deliver water to these locations.
Results
Table I: Critical Infrastructure in the Three Mapped Communities
In La Alameda 23 water tanks were found, in Nueva Jerusalen 22 were found and in 13
de Febrero 100 water tanks were found. A similar trend can be seen with the number of culverts,
and fire hydrants found. More established areas were seen to have more infrastructure and less
La Alameda Nueva Jerusalen 13 de Febrero Total
Water Tanks 23 22 107 152
Culverts 14 10 36 60
Culverts that need Service 1 1 5 7
Bridges 3 2 3 8
Fire Hydrant 0 0 1 1
Roads (km) 3.9 1.8 11.3 17
Area (km^2) 0.39 0.11 0.82 1.32
Highest Elevation (m) 127 85.7 139
Lowest Elevation (m) 38.9 45.2 24.4
vii
maintenance; the neighborhood of 13 de Febrero is the oldest and largest community which is
where a majority of the features we found were located.
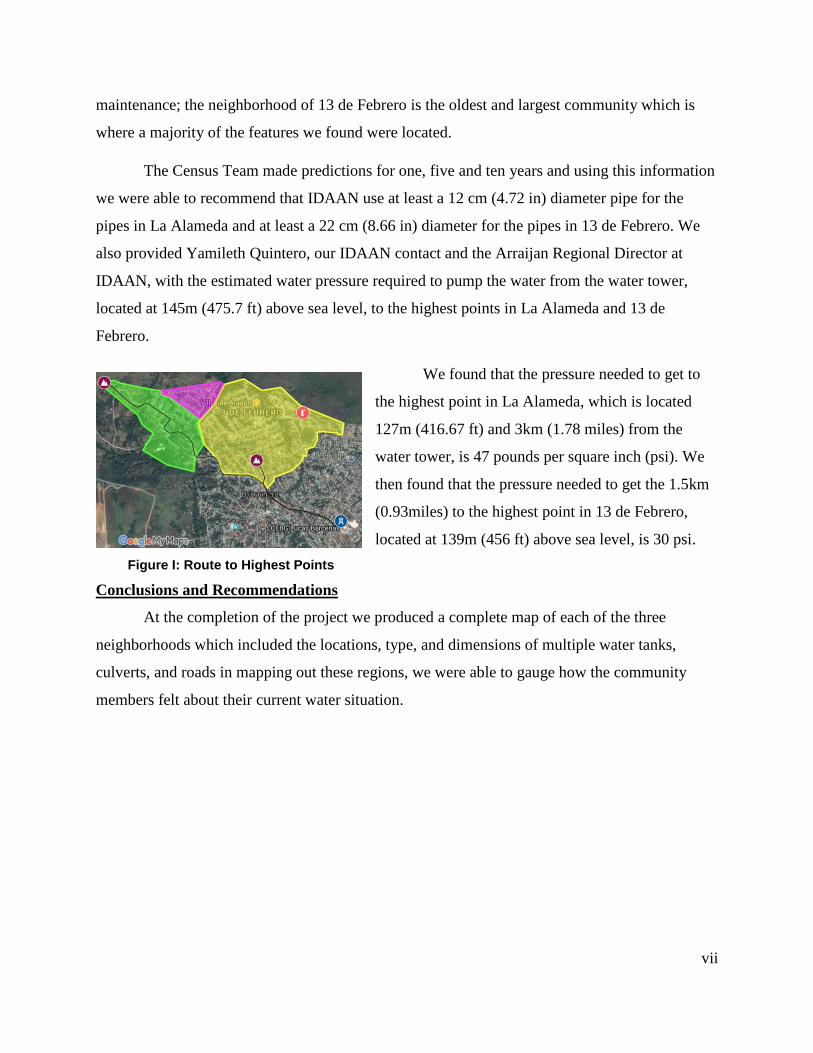
The Census Team made predictions for one, five and ten years and using this information
we were able to recommend that IDAAN use at least a 12 cm (4.72 in) diameter pipe for the
pipes in La Alameda and at least a 22 cm (8.66 in) diameter for the pipes in 13 de Febrero. We
also provided Yamileth Quintero, our IDAAN contact and the Arraijan Regional Director at
IDAAN, with the estimated water pressure required to pump the water from the water tower,
located at 145m (475.7 ft) above sea level, to the highest points in La Alameda and 13 de
Febrero.
We found that the pressure needed to get to
the highest point in La Alameda, which is located
127m (416.67 ft) and 3km (1.78 miles) from the
water tower, is 47 pounds per square inch (psi). We
then found that the pressure needed to get the 1.5km
(0.93miles) to the highest point in 13 de Febrero,
located at 139m (456 ft) above sea level, is 30 psi.
Figure I: Route to Highest Points
Conclusions and Recommendations
At the completion of the project we produced a complete map of each of the three
neighborhoods which included the locations, type, and dimensions of multiple water tanks,
culverts, and roads in mapping out these regions, we were able to gauge how the community
members felt about their current water situation.

viii
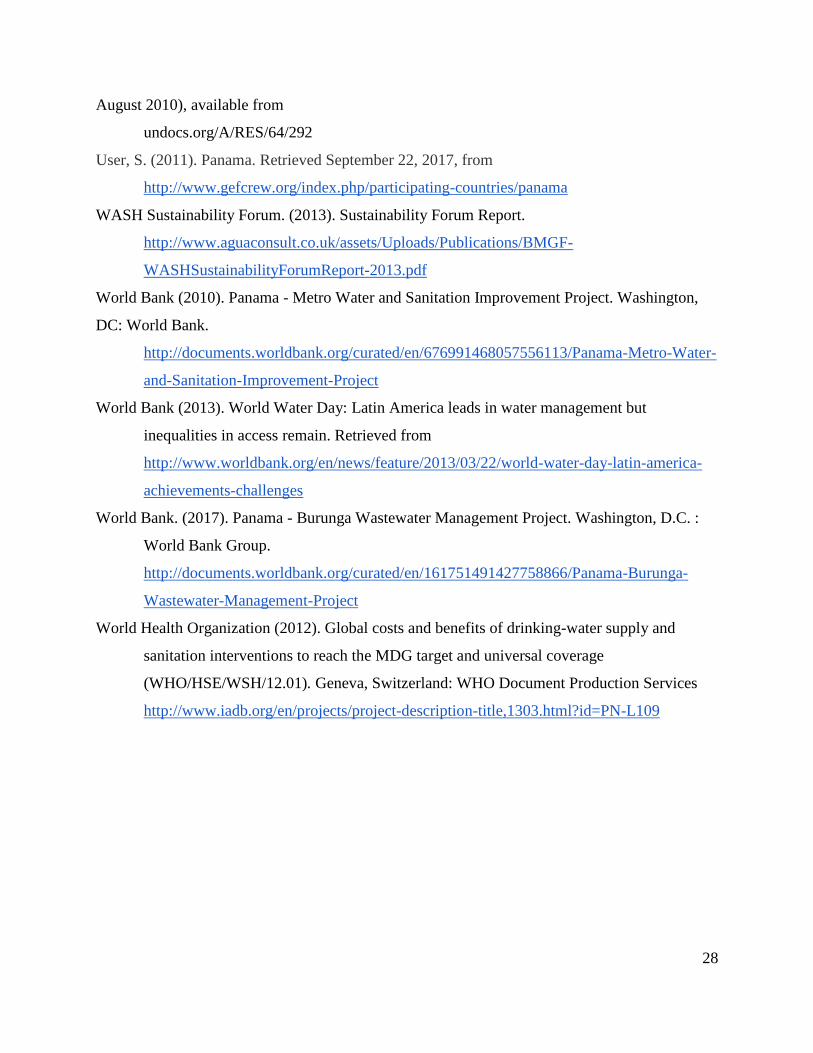
Figure II: Map of Critical Water Infrastructures in Neighborhoods of Burunga, Arraijan
In addition to plotting these points we also came across a single fire hydrant which
allowed the Environmental Team make recommendations for their project regarding a proposed
use for treated waste water. To assure IDAAN would be able to make use out of our interactive
map, access to the online map was provided, along with a printed copy for access away from a
computer. This series of PDF files included the maps and a legend indicating what each symbol
represented were presented in both English and Spanish. The locations of each feature were also
converted and displayed in a table in UTM coordinates so that they would be easily imported and
compatible with the software IDAAN uses to map areas across Panama.

ix
AUTHORSHIP
Peter Carosa
Peter shared responsibilities with Luke as the primary data collector during the fieldwork stage
of the project. He used his phone to mark points of interest and track the roads of the
neighborhoods. Using Photoshop he created offline versions of our interactive maps in English
and Spanish. He also wrote some aspects of the Introduction and Findings as well as edited the
Methodology and Findings.
Brandon Cohen
Brandon served as the primary author of the paper, having contributed to nearly in all sections.
He coauthored the Abstract, Introduction, Background, Methodology, and Findings. He also was
the main designer of our poster.
Alisa daSilva
Alisa served as the primary editor by proofreading many drafts and ensuring the paper was of
high quality. In addition, she wrote some parts of the Background, Objectives and Findings. She
was also made sure the formatting was up to the standards set forth by WPI. She was also
responsible for doing the calculations for pressure and cross sectional area for IDAAN.
Luke Fronhofer
Luke, with Peter, was a primary data collector. In addition to marking points of interest and
tracking the roads of the neighborhoods. He was the main editor of our online interactive maps.
He also wrote aspects of the Background and Findings and edited the Introduction and
Background.

x
TABLE OF CONTENTS
ABSTRACT ii
ACKNOWLEDGEMENTS iii
EXECUTIVE SUMMARY iv
AUTHORSHIP ix
TABLE OF CONTENTS x
LIST OF FIGURES xi
LIST OF TABLES xi
CHAPTER 1: INTRODUCTION 1
CHAPTER 2: BACKGROUND 3
2.1 IDAAN 5
2.2 IDAAN’s Current Projects 6
2.3 Footprint Possibilities 8
2.4 Community History 8
CHAPTER 3: METHODOLOGY 9
3.1 Meeting the Needs of our Clients and Sponsor 10
3.2 Mapping Roads and Critical Water Infrastructure 10
3.3 Producing the Interactive Map 12
3.4 Gaining a Community Perspective 14
3.5 Recommending Pipe Size and Determining Water Pressure 15
3.6 Client and Sponsor Interactions 16
CHAPTER 4: FINDINGS 17
4.1 Community Water Management Practices 17
4.2 Community Perspectives 18
4.3 Mapping of Roads and Critical Water Infrastructure 19
4.4 Pipe and Pressure 22
CHAPTER 5: CONCLUSION & RECOMMENDATIONS 24
5.1 Overview of Deliverables 24
5.2 Observed Patterns and Trends 25
5.3 Recommendations for IDAAN 26
REFERENCES 27
APPENDIX A: Map of Critical Water Infrastructures in Neighborhoods of Burunga, Arraijan 29
APPENDIX B: Map of Critical Water Infrastructures in Nueva Jerusalen of Burunga, Arraijan, Panama 30
APPENDIX C: Map of Critical Water Infrastructures in La Alameda of Burunga, Arraijan, Panama 31
APPENDIX D: Map of Critical Water Infrastructures in 13 de Febrero of Burunga, Arraijan, Panama 32
APPENDIX E: Map of Roads of Bridges in Neighborhoods of Burunga, Arraijan, Panama 33
APPENDIX F: Map of Water Tanks in Neighborhoods of Burunga, Arraijan, Panama 34
APPENDIX G: Map of Culverts in Neighborhoods of Burunga, Arraijan, Panama 35
APPENDIX H: Gantt Chart 36
APPENDIX I: UTM Coordinates of Culverts 37
APPENDIX J: UTM Coordinates of Water Tanks 40
APPENDIX K: UTM Coordinates of Bridges 43
xi
LIST OF FIGURES
Figure 1: Water Tank in Burunga 2
Figure 2: Landscape in Burunga 4
Figure 3: Burunga Water Tower 7
Figure 4: Map Plus Logo 11
Figure 5: Google My Maps Logo 12
Figure 6: Measuring Culverts in La Alameda 15
Figure 7: Map of Roads and Bridges in Neighborhoods of Burunga, Arrijan, Panama 20
Figure 8: Map of Water Tanks in neighborhoods of Burunga, Arrijan, Panama 20
Figure 9: Map of Culverts in Neighborhoods of Burunga, Arrijan, Panama 21
Figure 10: Route to Highest Points 23
LIST OF TABLES
Table 1: Variable Table 16
Table 2: Critical Infrastructure in the Three Mapped Communities 22

1
CHAPTER 1: INTRODUCTION
Of the over seven billion people in the world, one in ten lack access to safe drinking
water. Roughly 663 million people, or about twice the population of the United States, are living
without adequate access to this vital resource (United Nations, 2010). The social and economic
effects of disproportionate water distribution are experienced globally. The lack of adequate
water supply and sanitation leads to an annual loss of 260 billion dollars globally (World Health
Organization, 2012) due to factors such as health expenses and undocumented tapping of water
networks. In Panama the effects of this disproportionate water distribution can be seen in the
neighborhoods of Burunga and the surrounding areas.
In many of the areas around Panama City, there exists a series of challenges in providing
water services to informal settlements. The lack of access to potable water in Panama lies not
only within urban areas, but also in rural areas. In 2009, the standard for clean drinking water in
Panama was raised. According to this new standard, 75% of the population of urban areas and
only 50% of the population of rural areas around Panama City have access to clean drinking
water (UNICEF, 2009). Many of the rural areas outside of Panama City have difficulties
acquiring clean drinking water. These areas either informally tap into existing pipe lines or
utilize water tanks to store rainwater. The use of these personal water tanks are a popular method
of storing water as well as being a backup water source for residents. Water tanks, although
helpful in aspects such as having a water supply during a drought, often lead to water hoarding,
which builds up a supply of stagnant water which is more prone to becoming contaminated with
bacteria. Government organizations in Panama look to help solve the growing issue of water
distribution in Panama. Recently, water distribution organizations have begun distributing water
tanks which are similar to personal water tanks but are much larger and can be sealed to prevent
the growth of bacteria.

2
Figure 1: Water Tank in Burunga
The Panama Canal runs north-south and divides the country of Panama into Eastern and
Western zones. The state-owned lands surrounding the Panama Canal Zone have become home
to settlers over the last 20 years due to the availability of the land. As a result, governmental
agencies, such as El Instituto de Acueductos y Alcantarillados Nacionales (National Institute of
Aqueducts and Sewers) or otherwise known as IDAAN, have been struggling to keep up with the
growing population and have provided these new communities with basic utilities; most
households in the area do not have potable water.
Arraijan is a district just west of the canal which contains the sub-district of Burunga,
where many of the houses have been built within the last 10 years. Currently in the region of
Burunga, there exists a water tower holding 50,000 gallons and an additional 1.6 million gallons
in an underground reserve tank. IDAAN can then place gravity fed water tanks that are large
enough to sustain a level that will allow all of the citizens to have access to water. The
underlying issue for IDAAN is a lack of information about the communities and the existing
infrastructure in the region. Without this information it is impossible for IDAAN to distribute the
water to the nearby neighborhoods. Therefore existing maps need to be updated to take into
consideration this population expansion to provide these areas with potable water.
Our project goal was to expand knowledge of information and create maps of regions in
the Burunga sub-district to reflect the increase in population that has occurred in recent years. It

3
was important to learn more about existing infrastructure and its current condition in the
neighborhoods of Nueva Jerusalen, 13 de Febrero, and La Alameda, so that an appropriate and
effective solution can be implemented in these areas. Our maps of the rural communities in
Burunga will help IDAAN and other governmental agencies to assess the living situations of
people in these regions and alleviate a major problem that these communities face: the lack of
access to a potable and sanitary water supply. We worked in cooperation with Footprint
Possibilities, a nonprofit organization that works to improve the wellbeing of Panamanian
communities, in coordination with partners from IDAAN, to reach the goal of helping the rural
communities of Panama establish capable water systems and overall community improvement.
CHAPTER 2: BACKGROUND
This project addresses challenges associated with the issue of water distribution and the
growing demand to access potable water in the rural Burunga region outside of Panama City.
Panama is a nation with both a growing economy and an expanding population. Part of this
growing population is a result of the rise of informal settlements outside of Panama City, such as
Burunga, the area in which our project took place. People from surrounding countries migrate to
Panama because of the loose existing laws on staking claims to land plots. Residents of informal
settlements make claim to either public or private lots of land and find legal protection in
inhabiting the land due to squatting laws, which are common in Latin American countries. These
settlements arise sporadically, making it difficult for the government to provide vital services
such as potable water to these regions (Huchzermeyer, 2002). Burunga is no outlier to this
pattern in Latin America. The Burunga settlement was created in 2003 due to the creation of a
new law expanding property rights to the citizens of Panama. This law led to a great increase in
immigration to this area due to the ability to claim property lots without cost to the settler (Law
42, 2003).
4
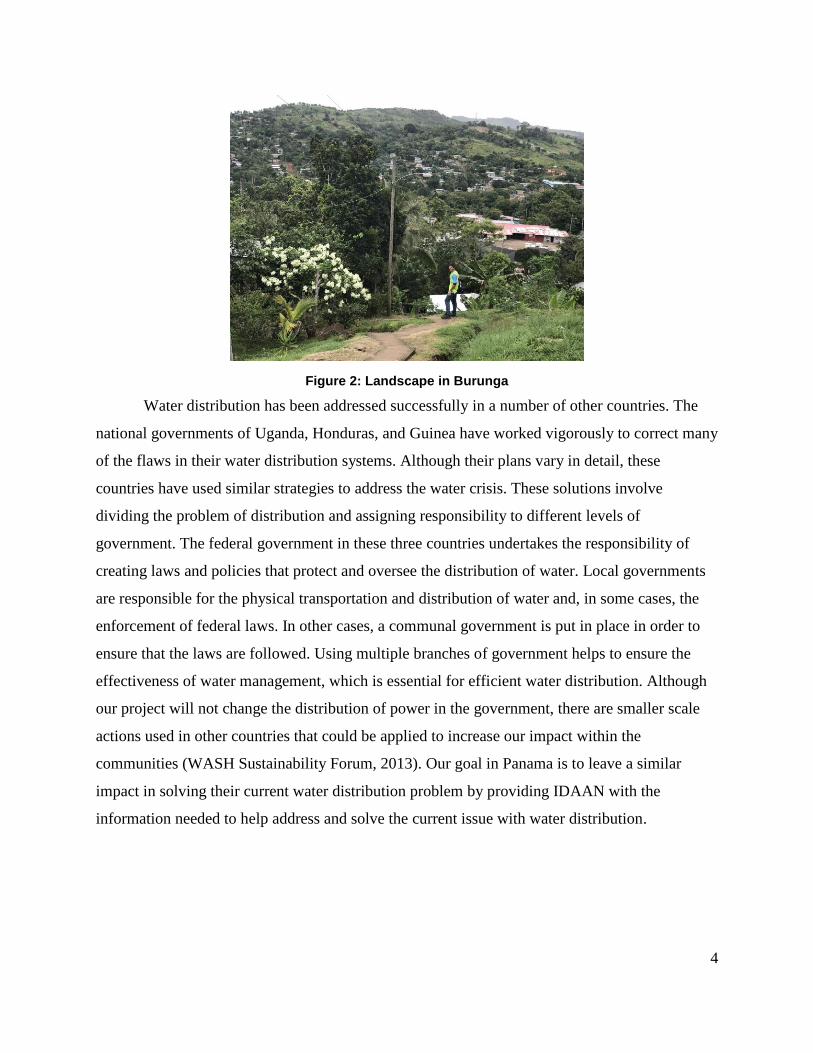
Figure 2: Landscape in Burunga
Water distribution has been addressed successfully in a number of other countries. The
national governments of Uganda, Honduras, and Guinea have worked vigorously to correct many
of the flaws in their water distribution systems. Although their plans vary in detail, these
countries have used similar strategies to address the water crisis. These solutions involve
dividing the problem of distribution and assigning responsibility to different levels of
government. The federal government in these three countries undertakes the responsibility of
creating laws and policies that protect and oversee the distribution of water. Local governments
are responsible for the physical transportation and distribution of water and, in some cases, the
enforcement of federal laws. In other cases, a communal government is put in place in order to
ensure that the laws are followed. Using multiple branches of government helps to ensure the
effectiveness of water management, which is essential for efficient water distribution. Although
our project will not change the distribution of power in the government, there are smaller scale
actions used in other countries that could be applied to increase our impact within the
communities (WASH Sustainability Forum, 2013). Our goal in Panama is to leave a similar
impact in solving their current water distribution problem by providing IDAAN with the
information needed to help address and solve the current issue with water distribution.

5
2.1 IDAAN
The Instituto de Acueductos y Alcantarillados Nacional (“National Institute of Aqueducts
and Sewers” or IDAAN) oversees the water distribution and wastewater management for
Panama and is working to improve the welfare of the country through increased access to
drinking water, and management of sewage; 97% of the potable water used in Panama is
provided and serviced by IDAAN but still only 57% of the population can access this water
IDAAN provides (World Bank, 2015). Before IDAAN, the Water and Sewerage Commission of
the Sanitary Engineering Division of the Ministry of Labor, Social Welfare, and Public Health
controlled water management for around ten years but was replaced when they were not
distributing water effectively. Before that, the United States-controlled Panama Canal Authority
administered water resources around the Canal Zone. Everywhere else in Panama, the less
wealthy communities did not have regulated water sources and more typically had a small well
or communal water source. IDAAN was formed in 1961 with the goal of improving water
management in Panama. IDAAN has faced many complex financial issues in its history,
including a history of debt and mismanagement of spending. In 1982 a water tariff was created
with the intention of helping IDAAN balance its operation budget, but it has not been adjusted or
changed since, which can be directly connected to the unstable and underfunded water systems
throughout Panama. In recent years IDAAN has had support from many banks, including the
World Bank through the Panama Metro Water and Sanitation Improvement Project.
The World Bank funded Panama Metro Water and Sanitation Improvement Project is
meant to increase the quality, coverage and efficiency of Panama’s water supply and sewage
system (World Bank, 2010). Even though this initiative is almost 7 years old, there are still many
parts of Panama that do not have access to this basic human right. As Panama’s population is
continuing to expand, it is becoming harder for IDAAN to reach their goal of supplying water to
the entire population. With the expanding population, the water tariff needs to be adjusted to
accommodate the increase in consumers. IDAAN also does not often collect the money that a
community owes because of the current size of their operation across the large area they provide
service to. These financial constraints limit IDAAN to supplying a mainline to larger, better-off
communities leaving smaller communities and villages without appropriate connections to tap
into these lines. This informal tapping causes increased water use to go undocumented and the
6
richer communities are then charged for the smaller village’s water usage. Smaller communities
that pay for water are given large water tanks but because of the remote locations and the lack of
quality roads, these tanks are not as reliable as pipelines. Inconsistent service to its customers is
one of the reasons for IDAAN’s huge amount of debt. Customers have stopped paying their dues
for the services but still are obtaining water (Holtey, 2001).
According to IDAAN’s official website, it is their goal to provide clean water and
maintain a level of transparency of their actions. The organization continues to battle against the
ongoing water crisis and has made significant progress in its efforts to address the water crisis in
Panama. Presently, IDAAN is responsible for rural water distribution with a specific focus in the
communities surrounding Panama City. Current IDAAN projects include repairing water
infrastructure such as pipes and other utilities, delivering water to strategically placed water
tanks, and overseeing reservoir operations in Panama. Sustainability is a major component in the
long term success of these water systems. This includes the quality of the pipes and other
equipment that are brought into the communities. In order to make water efficiently accessible
and affordable, infrastructure should not fail within a few months or years, as gravity water
systems and pipes have in the past. The quality of water infrastructures has been neglected in the
past in many developing countries, but is starting to be an area of major change.
2.2 IDAAN’s Current Projects
Developing efforts in Panama and IDAAN are very focused on emphasizing
infrastructure quality. A major reason IDAAN is focusing on infrastructure is because they
believe sustainability will happen if high quality infrastructure is installed. From 2011 to 2015
the Panamanian government worked with IDAAN to complete the Water and Sanitation
Improvement Project in Colón, Panama. The purpose of the project was to increase quality,
coverage, and efficiency of potable water and sanitation and to strengthen IDAAN as an
institution. Additional projects were also initiated to improve the efficiency of water regulation
and water transportation reliability with this project. The benefits of such programs, however,
were not directed toward the communities without water, but for those who were already clients
of IDAAN. Many of IDAAN’s projects are focused on the maintenance of existing infrastructure
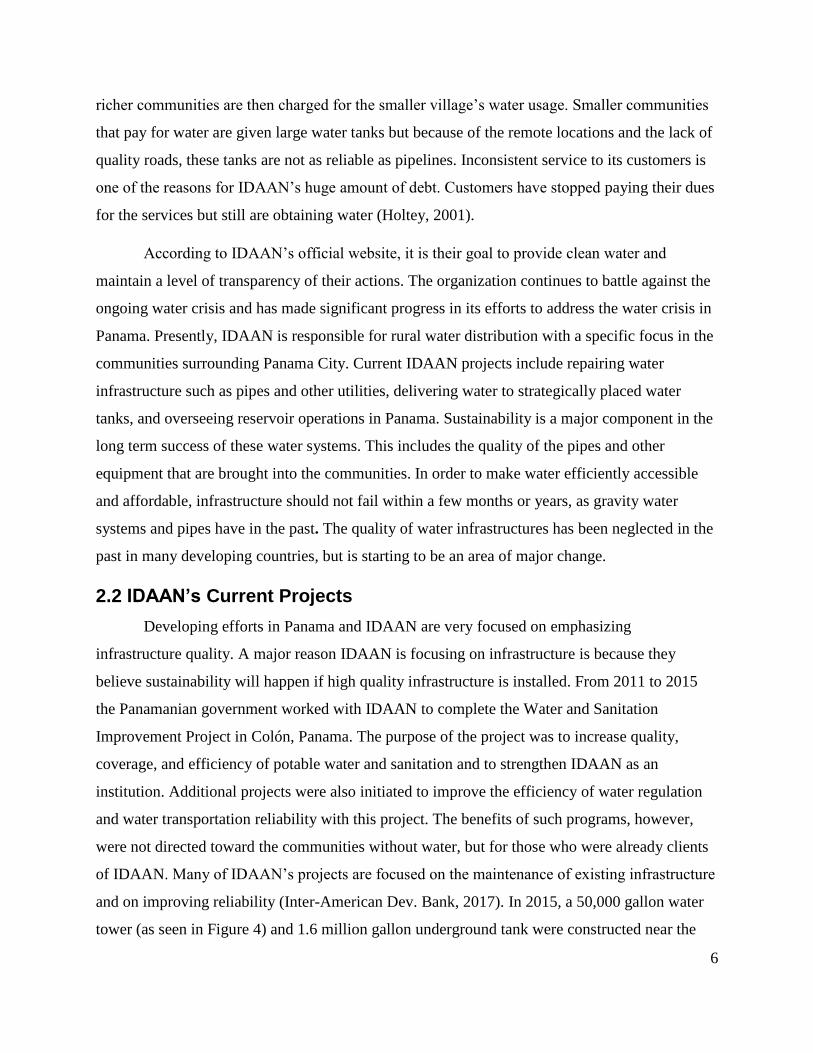
and on improving reliability (Inter-American Dev. Bank, 2017). In 2015, a 50,000 gallon water
tower (as seen in Figure 4) and 1.6 million gallon underground tank were constructed near the

7
center of Burunga, at one of the highest elevations in the community. IDAAN was unable to
build the supporting infrastructure needed to distribute water from the tower and underground
tank to the local neighborhoods. As a result, the tower and underground tank are not in service
and sit full of water that had been pumped from the Panama Canal Zone. Once in operation,
IDAAN plans on transporting water from Laguna Alta in the western region of Panama to supply
the tower and underground tank. In early 2017, the World Bank approved the $65 million
Burunga Wastewater Management Project. The main goal of this project is to provide a sewerage
system to the communities in Burunga, including the three communities our group is working in
(World Bank, 2017). Ten million dollars of the Burunga Wastewater Management Project are
being allocated to build the much needed supporting infrastructure to allow the water tower and
underground tank to go fully operational.
Figure 3: Burunga Water Tower
One of the first phases of the Burunga Wastewater Management Project is having
residents of the neighborhoods pay $20 per household to have the appropriate connections
installed at their homes. This will ensure that all homes will be compatible with the new
infrastructure. Before IDAAN carries out this phase, they need baseline information on the
community, including maps of current infrastructure, up to date census data, and environmental
analysis of the local river. This Burunga project is currently in the process of approval and
8
planning and will take an estimated two years to complete. As of now, the residents of Burunga
know little about this current project or the payment for water services.
The efforts of IDAAN have provided a valuable service throughout Panama and will play
a critical role in improving water services in the expanding communities around Panama City.
Efforts to improve efficiency in delivering water to these areas are ongoing. Despite these
attempts, disproportionate water distribution remains a major problem in Panama. It is essential
to address the issue in order to maintain a high quality standard of living for the country’s
citizens. The government of Panama helps to fund IDAAN in an attempt to tackle the ongoing
battle against water scarcity.
2.3 Footprint Possibilities
Footprint Possibilities is a non-profit, volunteer based, non-governmental organization
(NGO) that is focused on seeking funding for, and organizing local community efforts and
improvements. Footprint provides volunteers to serve government organizations such as IDAAN
to help tackle problems of water access. The goal of the organization is to enhance basic health
conditions and to supply people with accessible clean drinking water. Based in St. Petersburg,
Florida, Footprint Possibilities has affected more than ten thousand lives throughout the rural
regions of Panama. Although Footprint Possibilities is a non-profit NGO and is strictly operated
and staffed by volunteers, closely affiliated companies help with a majority of the expenses.
Caterpillar Corporation and Coselecto, two of the major contributors, provide tools and materials
for larger projects that need more than just human labor. Other affiliates such as the University
of Panama and Engineers Without Borders offer student volunteers opportunities to work with
Footprint Possibilities helping to complete projects, large and small.
2.4 Community History
The community of Burunga can best be described as a place of settlers who have come to
inhabit the land over the course of the past 30 years. Although Burunga was not officially
deemed a sub-district until 2003, many of the community members have held a claim to the land
since years before the recognition of the community. It is this sentiment of long lasting
communal relationships that characterize Burunga as a tight-knit community. The location and
accessibility of the area isolate the neighborhoods of 13 de Febrero, Nueva Jerusalen, and La

9
Alameda from the other neighborhoods of Burunga. Recent legislation such as law 42 made
squatting and staking claim to the land easier and helped to establish a period of growth in the
community (Leya 42, 2003). The area remains a close community despite the growing and
expanding population. There currently exists no reliable estimation publically available for the
population in these areas. Due to increasing financial activity and economic growth in Panama,
interest in living in and around Panama City has grown. These factors contribute to both the
feelings and behavior of how residents of Burunga react to an outside presence. Residents of
Burunga consider themselves closer among each other than they do among government officials
and outsiders. This perspective on the community adds a layer of difficulty in collecting
information related to the project for community members would typically be less willing to
reveal any information that they could perceive as sensitive.
CHAPTER 3: METHODOLOGY
The overall purpose of our project was to map the communities’ critical water features in
order to establish a baseline for IDAAN to plan their Burunga project. The work of our project
was done in coordination with two other WPI project teams also providing valuable information
to IDAAN. The Environmental and Census teams both contributed to the overall goal of
assisting IDAAN with preparation for the Burunga water distribution project. The Census team
focused on collecting information about waste water from residents in the community while the
environmental team focused on the quality and disposal of the waste water. The information
collected will assist our client, IDAAN, to determine where to allocate the $10 million dollar
World Bank loan for much-needed infrastructure in the sub-district of Burunga. Our project was
broken down into a set of objectives that included:
1. Understand and interpret the needs of IDAAN and Footprint Possibilities
2. Define the areas of work, map, and measure the current critical water
infrastructures as well as the existing roads and walking paths within these
neighborhoods.
3. Evaluate community member’s perspectives on IDAAN and how current water
infrastructure affects their everyday lives.
4. Organize the collected information as well as the data collected from the Census
and Environmental teams into a layered interactive map.
10
5. Calculate recommendations for pipe diameter and water pressure required to
provide access to the neighborhoods of La Alameda and 13 de Febrero.
3.1 Meeting the Needs of our Clients and Sponsor
One of the first challenges in tackling our project was to understand what our client
(IDAAN) and sponsor (Footprint Possibilities) needed from our work. An initial meeting on
August 28th, 2017 at IDAAN’s headquarters helped to establish their expectations of our work.
Representatives from IDAAN outlined the deliverables in specific terms including the desired
features to be mapped and an excel sheet with the UTM formatted coordinates of each feature.
Our sponsor from Footprint Possibilities, Ricardo Montanari, also had requests that he
wanted to see in our project: a complete interactive map in which information from all three
teams were combined and layered as well as photos weekly of our work in Burunga. Mr.
Montanari helped guide our project and helped with communicating with the client.
3.2 Mapping Roads and Critical Water Infrastructure
Our team was tasked with mapping critical infrastructure such as water tanks, culverts,
fire hydrants, roads, and bridges. Water tanks can be used to estimate the quantity of water that
the region relies on while mapping culverts helps IDAAN understand the condition of the current
waste water system in place. Identifying roads and road types helps IDAAN plan what routes are
accessible and easy for trucks and vehicles to access. Marking other infrastructure helps IDAAN
with their record of what exists within the sub-districts.
Before we could map any roads or infrastructure our team had to research and select a
mobile app to be used as our mapping tool. We initially selected an app called MapPath and
tested it out while we were still in the United States. Team members tested the app by walking
around their neighborhoods and mapping features to get a feel for how the app was going to be
used in Panama. After arriving to the Project Center and meeting with our sponsor and client we
realized that the requirements for our app changed. We needed an application that was able to
relay on the cell phones satellite services and not its data services. As a result, we began looking
for a new app that could meet all of these specifications. The mobile app we ended up using was

11
Map Plus (as seen in Figure 5) and we conducted similar test trials in the large quad on the
campus of Ciudad del Saber, our residence during the project term.
Figure 4: Map Plus Icon
The first step in mapping the water infrastructure was creating polygons for each of the
neighborhoods. The polygons served to outline the boundary defining the area of work. Our first
attempt at drawing the polygons was based upon assumptions of which roads divided the sub-
districts and using features such as rivers and bridges to draw district lines. We were later given a
series of printed maps and boundary lines, from IDAAN’s last mapping of the neighborhoods in
2009. The boundary lines for each district were based on this series of maps we received from
IDAAN and were later verbally confirmed by IDAAN representatives at the regional IDAAN
office in Arraijan. These polygons served as an important reference to assure that the features we
were plotting fell within the assigned neighborhoods.
While plotting in the field, our team often split apart in groups of two to map the region
faster. Before each day’s mapping we met and established walking routes to efficiently cover
each region in a timely manner. Walkie talkies allowed our team to communicate during these
moments apart and helped us to further to prevent the overlapping of data. While in the field, we
used the iPhone app Map Plus to track and mark the path, and thus we were able to track the path
we walked as well as mark and label critical infrastructure points spotted on the way. One
member in each of the two member teams used the Map Plus app to track the progress of that
team and plot out the locations of the water features passed while hiking. The other member
would spot the water features and assist in the measuring of these features. At the end of the day,
the data collected from both devices was exported to the Google My Maps (as seen in Figure 6).
In order to provide UTM coordinates for the mapped points, which was required by IDAAN,
from the app, we used an online batch converter to convert the Longitude and Latitude
information from the app to UTM coordinates. The batch converter used is named Earth Point
and the owner, Bill Clark, gave our team free access to the program after we explained our work.

12
He was also available for any follow up questions or additional information, if needed, about the
coordinates and conversions.
Figure 5: Google My Maps Logo
Plotting and mapping the desired features and paths was a crucial component of our
project; these features included culverts, fire hydrants, water tanks, bridges, and other existing
water related structures or features (see Appendix A-G). After the points were collected in the
field, the files were exported to the desktop program, Google My Maps, which allowed for easier
manipulation of the map data. This allowed for the formation of the data collected into one
collective map composed of layers. Each layer on the map was set to represent a certain feature.
In the application Map Plus, the roads are recorded as paths which stretch across a series
of coordinates connecting together to form a line. The data collected in the field would be messy
and the lines walked not consistent due to walking the same roads twice and issues with phone
signal strength, so the maps were polished and refined using Google My Maps program. This
was done by redrawing the roads in Google My Maps so the lines were straight and all the same
width (see Appendix E).
3.3 Producing the Interactive Map
The final product of this project includes an interactive map containing the data collected
from all three teams. Each of the critical infrastructure features was assigned a unique data layer
within the Map Plus application to allow for independent viewing of each layer on the final map
(see Appendix A-G). It is important that layers could be removed so that the user may view the
locations of a specific feature. The Map Plus application would save the information collected on
the device, but could not organize the data collectively each day. The data was organized within
the Google My Maps program to solve this problem of data collaboration. The organized
information was imported into Google My Maps to differentiate between each type of feature,
13
and to also include the measurements taken to the description of each culvert. The map consisted
of multiple data layers, each representing a certain feature of the water infrastructure. Culverts
were placed in their own layer and labeled accordingly, with their size, length, material, and
condition in the description box. Water tanks were identified by their color but were all placed
on one layer with the colors detailed in the description box.
Footprint Possibilities also sponsored two additional IQP teams: a team updating the
Burunga Census (referred to as the Census Team) and a team investigating the pollutants of the
Burunga River (referred to as the Environmental Team). While each of the other teams was
responsible for collecting and analyzing its own data, we were responsible for composing the
final interactive map displaying all of the teams’ information.
The Census team was responsible for gathering information from the houses in the area.
This information included information on the number of residents in the household, how the
residents get water, housing conditions, and wastewater. Google My Maps restricts the number
of layers that could be added to a single map to ten, so each team was allotted a certain number
of layers. The information they collected composed their three allotted layers on the final
interactive map: a layer for each house survey, a layer for each house that had a latrine, and the
last layer illustrated what houses have a septic tank. The Environmental team collected data
based on what contaminants are found in the Burunga River, which runs along the border of all
three neighborhoods. The data collected from the Environmental team would be arranged as two
more layers to the map: one layer marking the estimated sampling points and a layer marking the
points that were tested.
While IDAAN is very interested in the interactive map and the visuals of the different
layers, they also need to be able to compute our data into their system. They required a CSV file
to import into their database for mapping water infrastructure across Panama. A CSV file is a
Microsoft Excel sheet that we could be export from Map Plus. Even though the app had the
UTM coordinates associated with the individual points, when the file was exported it only
carried the more popular latitude and longitude coordinates. After running the excel sheet
through the online batch converter, Earth Point, the UTM coordinates were side by side with the
latitude and longitude coordinates. When we send the Excel files to IDAAN, they will easily be
able to import our data into their database.
14
3.4 Gaining a Community Perspective
Interacting with the community was an important component of our project. This
objective was important because of the difficulties we expected to encounter as a result of being
outsiders coming into a secluded community. Our project could not have been completed while
silently mapping the area. It was essential to respond to the concerns and needs of the
community in order to be welcomed onto private lanes and secluded roads.
Our greatest challenge was the language barrier, which we had to adapt and overcame
using strategic planning. Our team considered a list of questions we thought would be the most
frequently asked by the community members, such as who we worked for, what we were doing,
and the reason for our presence in Burunga. From there we determined the phrases we needed to
know in order to respond to the anticipated questions. In an environment where government
agencies can be seen as either helpful or hurtful to the community, it was essential that we
remind the community that our work aims to benefit them and improve their quality of life.
Throughout plotting and mapping the three neighborhoods, we had multiple encounters with
curious onlookers and community members. In many instances we were approached and asked in
Spanish what were we doing and why were we doing it. We used our practiced Spanish phrases
to ease the tensions created by the presence of outsiders as well as to explain the nature of our
work. In these instances it was important to explain that we were students working on a mapping
project for IDAAN and that the results of the project would serve to benefit the water quality for
the community. Although the language barrier was problematic, the Spanish we knew was
sufficient enough to both understand and respond to the individuals we encountered. As a result
of our preparation, residents were friendly and confident with our presence in their community.

15
Figure 6: Measuring culverts in La Alameda
3.5 Recommending Pipe Size and Determining Water Pressure
IDAAN had asked us to make recommendations for a pipe size as well as calculation of
water pressure in those pipes based upon the information collected from our project as well as
the Census team’s project. We also were to deliver to IDAAN the location of the highest
elevation point in La Alameda and 13 de Febrero, which was recorded by Map Plus app while
we were mapping the communities. IDAAN wanted to know the pressure the water would be at
these elevations. This information is used to adjust the plant’s output velocity (how fast the water
is pumped) to benefit the residents of these high elevation points. To solve for the pressure of
water at the highest points, given the anticipated pump velocity, we used the Bernoulli Equation
(Equation 1). These values are important to IDAAN because they will help provide important
estimations for the Burunga wastewater project. Determining water pressure would help IDAAN
gain a better idea of the mechanics of their piping network. Another detail to this piping network
that is important to IDAAN is a recommendation of choosing the correct diameter pipe (Equation
2) IDAAN should use for their water system as well as the locations of the main lines in each
community. This process is straighter forward than the previous calculations. We used the
Census team’s data on how much water per day each community will need, in 1 year, in 5 years,
and in 10 years. With this information and the values given to us by IDAAN we will be able to
recommend a diameter for the main pipe lines to be installed in each community.

16
(Equation 1)
Q = V*A (Equation 2)
Table 1: Variables Used in Calculation of Pipe Diameter and Pressure
Variable Represents Value
Pout Pressure from the water tower 20 psi
Vout How fast water is moving
while in the Water Tower
0 m/s
zout Height above the ground the
water tower is located
145 m
Pin Pressure of water at highest
elevation house
What we are looking for
Vin How fast water is pumped to
the houses
1.5 m/s
zin Height above the ground
where the tallest house is
Varies depending on region
g Gravity 9.81 m/s2
𝛾 Specific weight of water 9.807 kN/m3
ℎ𝑓 Head loss (how much energy
is lost due to friction within
the pipes)
Varies in regards to length of
pipe
3.6 Client and Sponsor Interactions
Every Monday morning included a weekly meeting with our sponsor from Footprint
Possibilities where we would update him on the past week’s progress and give a general outline
for the week to come. This proved to be a good time for Mr. Montanari to ask questions from the
Footprint Possibilities perspective as well as raise some concerns pertaining to IDAAN.
Tuesdays through Thursdays were reserved for the field work of plotting and mapping the
17
planned neighborhoods. During this time we were accompanied by an IDAAN driver who would
assist in transportation needs and relaying any urgent information about our project to us. A
majority of our information from IDAAN came from Yamileth (our assigned IDAAN
supervisor). In order to complete the field work in a timely manner, work dates were assigned to
each neighborhood to maximize efficiency (see GANTT Chart in Appendix H). Each
neighborhood was assigned a set of dates in which we planned to complete the mapping in that
area. It was important to communicate with both parties what we could and could not accomplish
in the given time frame. Fortunately, we were able to fit the scope of work specified by from
both our client and sponsor into our 7 week time constraint.
CHAPTER 4: FINDINGS
4.1 Community Water Management Practices
After spending two weeks in the three neighborhoods we made some observations while
mapping the roads and streets of the sub-districts. In some areas residents had installed 2” PVC
water distribution pipes that ran from house to house. The water that flows through these pipes
appears to originate from the tanks of other residents. One resident will pay to have their water
tank filled by IDAAN or a third-party and then have other residents pay to tap into the same
water tank. This explained why we noticed in the areas that had these 2” PVC pipes there seemed
to be fewer water tanks. Some houses had both 2” PVC pipes and a water tank. The water tank at
these houses was probably used as a backup source of water. The PVC pipes also indicated that
the area was more developed and that the residents had been around for a fair amount of time
when compared to the areas without PVC pipes where homes seemed less permanent. It was
unclear on whether all houses that were visually more affluent used the 2” piping or whether they
had professionally installed pipes.
One of the first questions we had before surveying the community was why did these
individuals settle in Burunga? One possible explanation was the residents moved to the area for
the jobs that had been springing up due to the economic boom of Panama City. However, we
quickly found out that the people moved there because the land was available, but one question
still remained: where did they work? It was too difficult to determine if the residents worked in
the communities in which they inhabited. The proximity between Burunga and Panama City
18
would make working in the city a realistic option. Bus services and the abundance of taxis made
commuting to the city a strong possibility. That being said there were still some common
occupations that we observed. Taxis were constantly passing by us as we walked the streets and
it wasn’t uncommon to see a taxi parked in the driveway of the houses in the more affluent
neighborhoods. Additionally there were a fair amount of small businesses including convenience
stores, cafes, and printing/photocopying centers.
4.2 Community Perspectives
Gaining an insight of the community’s perspective was very important in helping
understand the impact and effects of future projects in the area. IDAAN’s name seemed to have
carried a positive connotation among most of the community. After explaining our cooperation
with IDAAN, community members understood that the work we were doing was intended to
help them.
In one instance, a man approached our group and helped us locate some of the water
tanks that were hidden behind houses. In another instance on that same day of field work, an
elderly woman engaged us in a fifteen minute conversation about her time in Burunga as well as
an account of her experience in the area. We were approached by members of the community
every day in the field and had to react and respond to their concerns. On one occasion a lady saw
us two days in a row. While on the first day we only exchanged hellos, on the second day the
lady was curious about our involvement in the community. She has wondered why the two
students were walking around an area in which outsiders were not a common sight. In the same
community one group was approached by a lady who seemed concerned about our presence.
Once talking to her she was put at ease but she was still curious as to what IDAAN was. She
later explained her water situation as heavily dependent on the slope of the land to receive the
rainwater from the ditch that leads to her house because her pipes, which we concluded were not
IDAAN sanctioned, were not working properly.
We received looks of curiosity as a result of our long sleeve IDAAN blue shirts and
yellow high-visibility vests. Many individuals associated us with the nearby construction
workers and would ask questions regarding the project progress. This helped them identify us
positively rather than as wandering strangers. Communication was an important component in
completing our project.

19
4.3 Mapping of Roads and Critical Water Infrastructure
Our team set out over five days and covered 40.84 km (25.38 miles) of roads in the three
communities. Our group of four would split into teams of two to cover more ground. The
communities covered a total of 1.32 km2 (326 acres), but the terrain was very hilly and in some
cases difficult to walk. In the biggest community of 13 de Febrero there were many dead ends
that would lead approximately 200 m down or up the mountain side on which the locals had no
problem driving their vehicles. The highest elevation our teams reached was 139m(456ft) and the
lowest elevation was 24.4 m (80ft), both in 13 de Febrero. The communities of Nueva Jerusalen
and La Alameda were also very hilly but had half as much area and extent of roads as 13 de
Febrero. In total our team had an elevation gain of 1247.6 m (4093.18ft) and a total loss of
1424.39 m (4673.2ft) and spent 824 minutes (13.7 hours) out in the field.
The three communities all had at least one road that seemed to be the main road. In La
Alameda and Nueva Jerusalen there was one paved road that went through both communities and
connected them to 13 de Febrero via bridge. Both of these bridges connecting the communities
were currently under construction in the early phases of the project work and the only way to get
to the communities of La Alameda and Nueva Jerusalen was to drive through the river where
pavement had been laid down but the river was around six inches deep. After our first few days
the bridge connecting La Alameda and 13 de Febrero was complete enough for use, with the
bridge connecting Nueva Jerusalen and 13 de Febrero expected to be completed in the following
weeks. 13 de Febrero is a little bigger and had more paved roads and many dead end dirt roads.
When it came to the water infrastructure features that were mapped, La Alameda and
Nueva Jerusalen were similar in number but there were many more found in 13 de Febrero. In La
Alameda 23 water tanks were found, in Nueva Jerusalen 22 were found and in 13 de Febrero 100
water tanks were found.

20
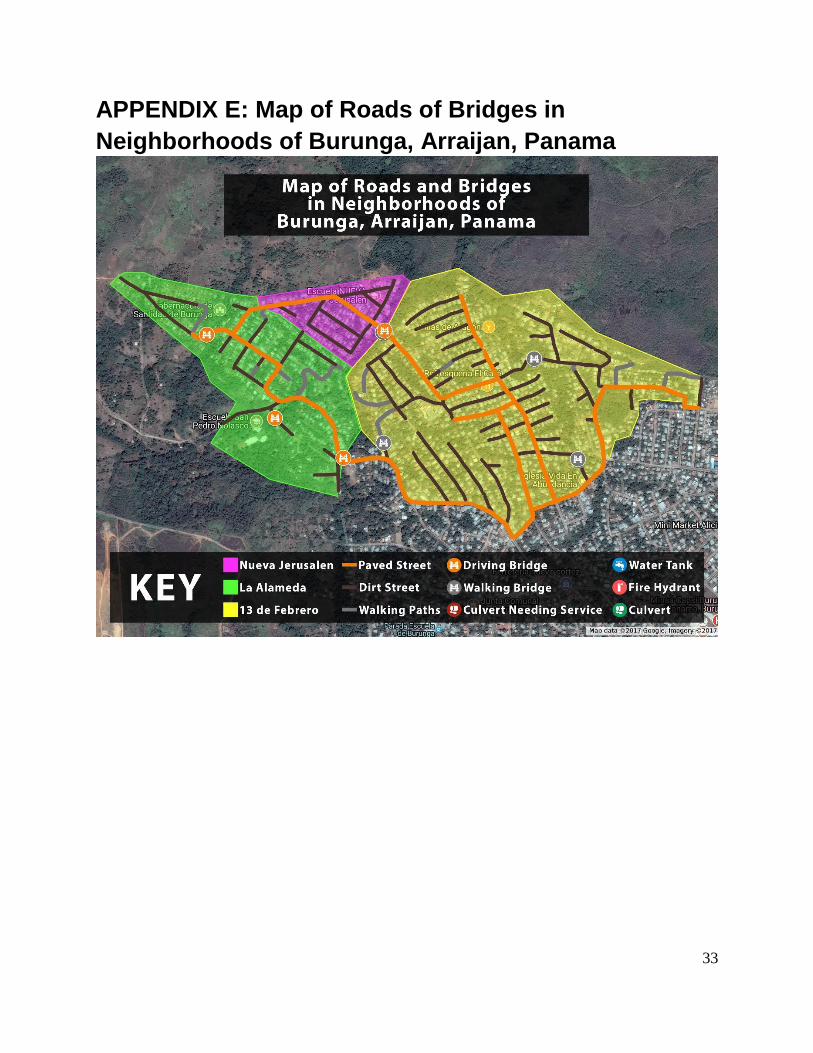
Figure 7: Map of Roads and Bridges in Neighborhoods of Burunga, Arraijan, Panama
Figure 8: Map of Water Tanks in Neighborhoods of Burunga, Arraijan, Panama

21
A similar trend can be seen with the number of culverts and fire hydrants found (as seen
in Table 1). 13 de Febrero is an older and bigger community so it has more infrastructure. While
it is older, we found that a greater percentage needed service or was in disrepair. 13 de Febrero
had 36 culverts with five needing service while La Alemada and Nueva Jerusalen had 14 and 10
respectively, with only one in each commnunity that needed service.
Figure 9: Map of Culverts in Neighborhoods of Burunga, Arraijan, Panama

22
Table 1: Critical Infrastructure in the Three Mapped Communities
La Alameda Nueva Jerusalen 13 de Febrero Total
Water Tanks 23 22 107 152
Black Tanks 17 16 47 80
Blue Tanks 5 6 43 54
White Tanks 0 0 14 14
Green Tanks 1 0 2 3
Red Tanks 0 0 1 1
Culverts 14 10 36 60
Culverts that need Service 1 1 5 7
Walking Bridge 0 1 3 4
Driving Bridge 3 1 0 4
Fire Hydrant 0 0 1 1
Paved Roads (km) 1.1 0.5 4.2 5.8
Dirt Roads (km) 2.2 1.3 6.1 9.6
Walking Paths (km) 0.6 0 1.0 1.6
Area (km^2) 0.39 0.11 0.82 1.32
Highest Elevation (m) 127 85.7 139
Lowest Elevation (m) 38.9 45.2 24.4
Elevation Difference (m) 87.1 40.5 114.6
4.4 Pipe and Pressure
In order to estimate the shortest route from the water tower in Burunga to the highest
points in La Alameda and 13 de Febrero, we first identified the locations of the highest
elevations. We drew the routes in My Maps to identify the distances and combined that
information with the water demand data collected from the Census Team to determine minimum
pipe size and pressure needed to pump water from the water tower to the highest elevations. That
team’s projections for water demand in La Alameda were 78,600 gallons per day, 91,962 gallons
per day, 172,326 gallons per day and 377,817 gallons per day for the current population, 1 year
in the future, 5 years in the future and 10 years in the future, respectively. In 13 de Febrero the
23
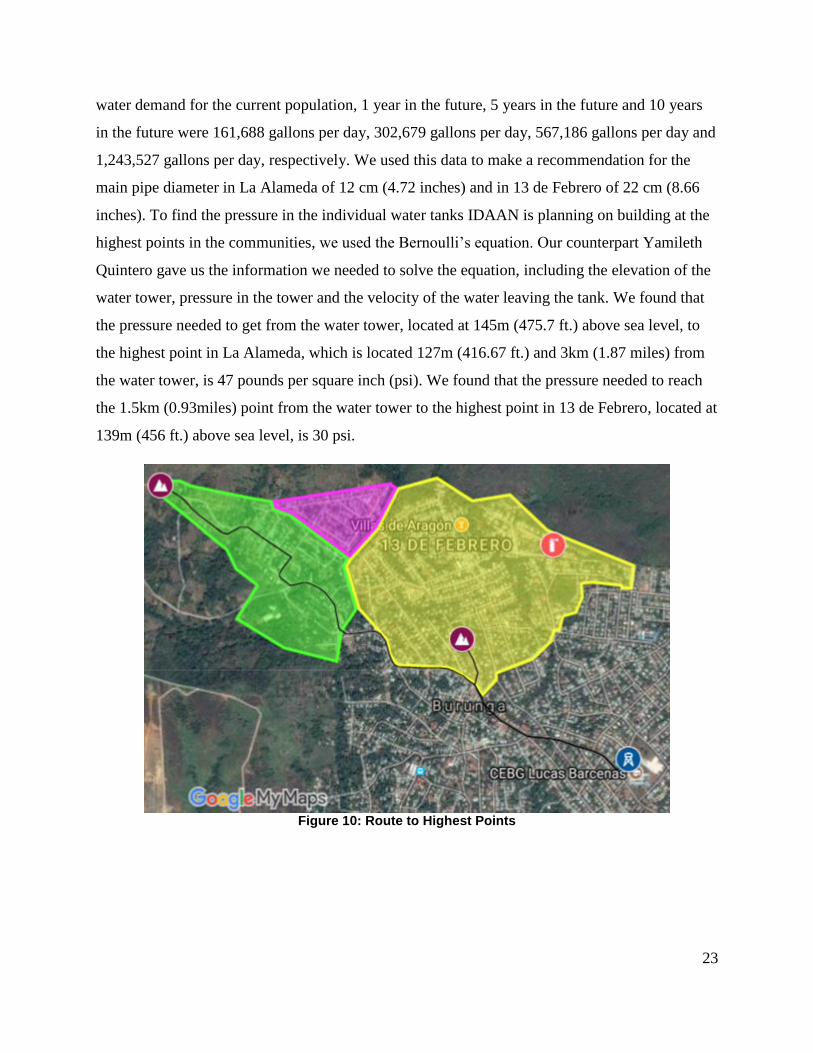
water demand for the current population, 1 year in the future, 5 years in the future and 10 years
in the future were 161,688 gallons per day, 302,679 gallons per day, 567,186 gallons per day and
1,243,527 gallons per day, respectively. We used this data to make a recommendation for the
main pipe diameter in La Alameda of 12 cm (4.72 inches) and in 13 de Febrero of 22 cm (8.66
inches). To find the pressure in the individual water tanks IDAAN is planning on building at the
highest points in the communities, we used the Bernoulli’s equation. Our counterpart Yamileth
Quintero gave us the information we needed to solve the equation, including the elevation of the
water tower, pressure in the tower and the velocity of the water leaving the tank. We found that
the pressure needed to get from the water tower, located at 145m (475.7 ft.) above sea level, to
the highest point in La Alameda, which is located 127m (416.67 ft.) and 3km (1.87 miles) from
the water tower, is 47 pounds per square inch (psi). We found that the pressure needed to reach
the 1.5km (0.93miles) point from the water tower to the highest point in 13 de Febrero, located at
139m (456 ft.) above sea level, is 30 psi.
Figure 10: Route to Highest Points

24
CHAPTER 5: CONCLUSION & RECOMMENDATIONS
5.1 Overview of Deliverables
We completed this project by mapping each of the three neighborhoods in Burunga as
well as making recommendations regarding pipe diameter sizes required to deliver water to the
communities. In mapping out these regions, we were able to identify the locations, type, and
dimensions of multiple water tanks, culverts, and roads. In addition to plotting these points we
also came across a single fire hydrant. We had expected to find more of these features, along
with sewer grates and manhole covers, but our mapping efforts revealed that such infrastructure
does not exist in the neighborhoods.
To assure IDAAN would be able to make use of our interactive map, we provided our
partners at IDAAN access to the online map along with a printed copy for access away from a
computer. These series of PDF files included the maps and a legend indicating what each symbol
represented and presented in both English and Spanish. The locations of each feature were
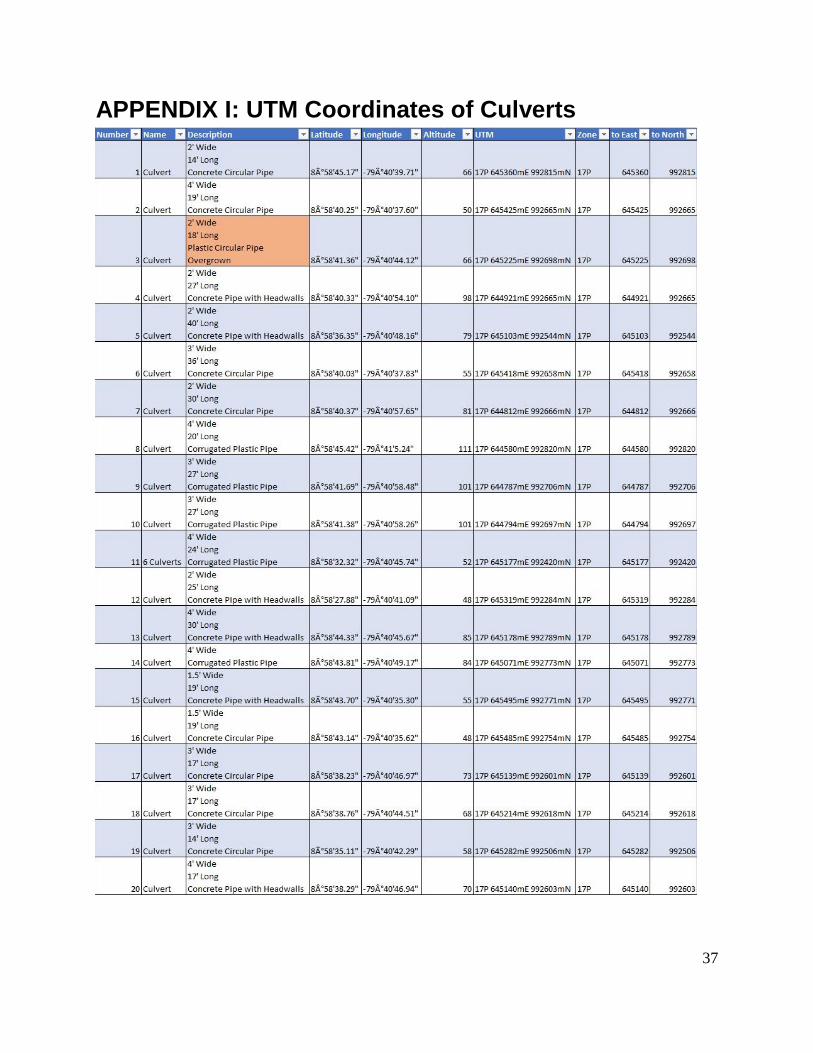
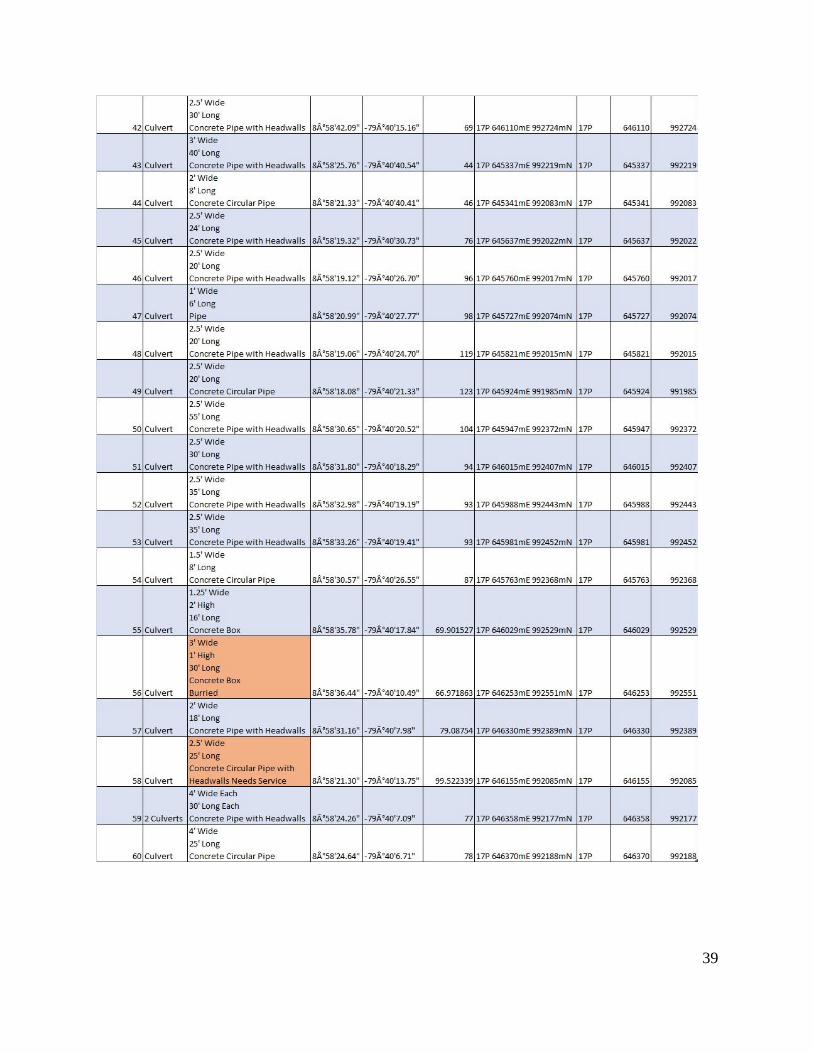
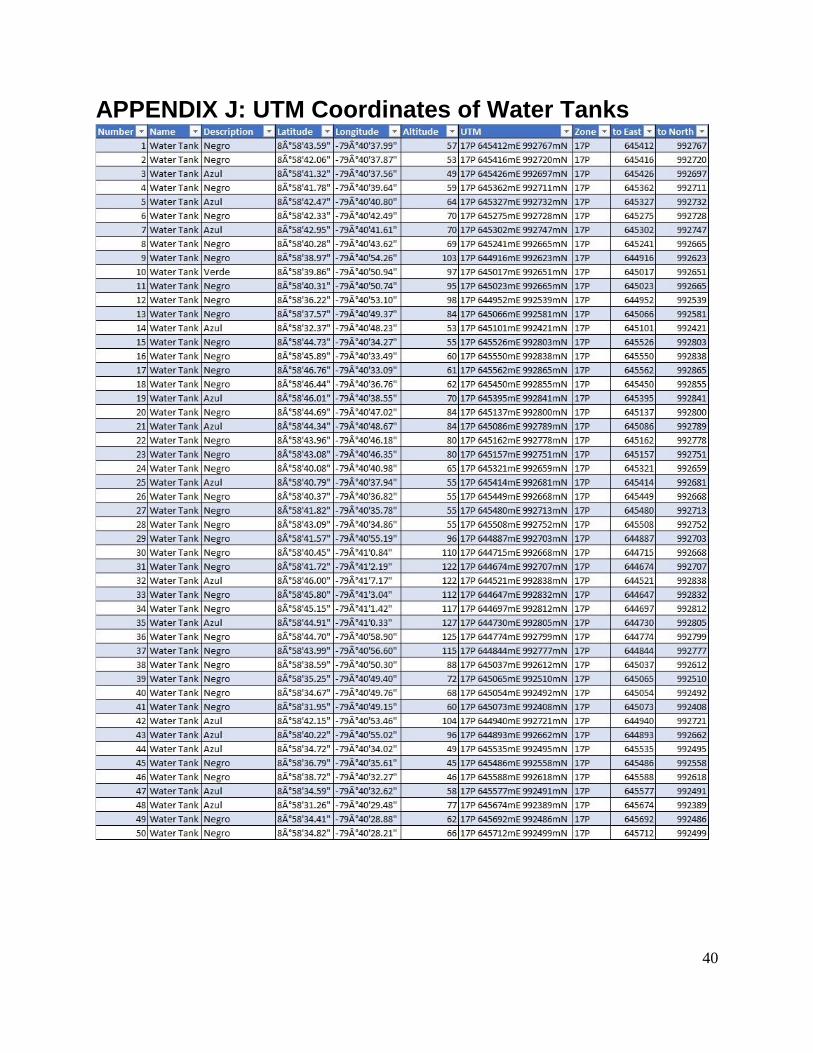
converted and displayed in a table in UTM coordinates (see Appendix I, J, K) so that they would
be compatible with the software IDAAN uses to map areas across Panama. The Google My
Maps tool allows users to visualize the data in a compelling interactive format that can support
their work with their main data platform. These findings, when plotted on the Google My Map
server, helped to reveal trends and differences between the neighborhoods. It was of greater
priority to IDAAN that the submitted UTM coordinates worked than the interactive, layered
Google My Maps. IDAAN’s interest in our data was mainly the spatial coordinates of all the
infrastructure in the area and after confirming that the UTM coordinates were correct we made
the files neat and easy to understand for IDAAN.
Google My Maps: Critical Water Infrastructure Map:
https://drive.google.com/open?id=1fkIOVhsYLNRqgM_uaxiNwvhN7as&usp=sharing
Google My Maps: 3 Team (Topography, Census, and Environmental) Map:
https://drive.google.com/open?id=1k8h8a4p4hgbcCN5d1GWrFqYRZ0o&usp=sharing
25
5.2 Observed Patterns and Trends
The information collected on the interactive map database helped us observe a series of
patterns and trends that help relate the located features with the type of living in each area.
Through background research and the information gathered by the Census team, we know that
the water tanks are used as both a primary and secondary source of water for residents who own
them. However, we have also learned that some of the water tanks are used to supply water for
other members of the community. Some owners of water tanks choose to sub-sell their water,
allowing neighbors to purchase and tap into their water supply. In areas of 13 de Febrero where
housing was simpler and less affluent, we observed a pattern of increased water tanks as well as
increased sighting of the 2” PVC pipe use to tap into the tanks. Areas that appeared to have more
affluent and complex houses often had drastically less water tanks in the area as well as less two
inch piping. Signs of wealth included the size, material, and conditions of the house, presence of
cars and/or garages. We theorize that these areas utilize IDAAN’s tap water network either by
paying for the service or by accessing the piping through tapping into the water supply
undetected.
While we were out looking for infrastructure, we also would mark infrastructure that
needed service. The only infrastructure that we found that needed attention were culverts. In total
we found seven culverts that needed service and we tagged them in our CSV file to IDAAN, as
well as marked them on our interactive map. There did exist only one fire hydrant in the three
communities, which we identified as a fire hazard.
Throughout our experiences in the communities we noticed a consistency as to how the
communities reacted to our presence as outsiders. While in a high visibility vest and IDAAN
shirts, it was obvious to the community that we were not residents of the area. During a number
of interactions with the community, there was a trend of positive reactions while mentioning our
nature of work with IDAAN. As an organization, IDAAN’s name carries a generally positive
connotation throughout the communities. The mention of their name put community members at
ease and very much helped in their understanding of our purpose. The impact of IDAAN was
known throughout all three neighborhoods and some of the community members were aware of
the current ongoing projects IDAAN oversees in their area.
26
5.3 Recommendations for IDAAN
One of our deliverables was to recommend to IDAAN the ample water pipe width and
water pressure needed in building the infrastructure to get water from the current water tower to
the future water towers at the highest points in the communities. We were able to recommend
that IDAAN use at least a 12 cm (4.72 in) diameter pipe for the pipes in La Alameda and at least
a 22 cm (8.66 in) diameter for the pipes in 13 de Febrero. We also recommended the necessary
water pressure needed to get to the highest point in La Alameda is 47 pounds per square inch
(psi) and the pressure needed to get to the highest point in 13 de Febrero is 30 psi. Our IDAAN
counterpart, Yamileth Quintero, did not need the information for the community of Nueva
Jerusalen because IDAAN is planning something different for the piping in that community.
We would also like to recommend that IDAAN establish and continue a strong line of
communication with the community regarding the progress and goals of their projects in
Burunga. The community members have a great deal of interest in what occurs in their
neighborhoods and are sometimes concerned with the presence of government officials. As we
had limited knowledge of the Spanish language we were unable to fully explain the projects of
IDAAN so it may benefit them to be more transparent with upcoming and current projects. By
clarifying the work and benefits each resident will be entitled as a result of the project, we
anticipate the residents may be more willing to cooperate with payments and will overall have
more support for the project. The community cares a great deal about the ongoing actions that
take place in their area and would benefit greatly from any or all information IDAAN makes
public or advertises. As of now the residents have little to no knowledge about the Burunga
waste water project.

27
REFERENCES Catholic Relief Services. (2013). Water Services that Last in Central America
Recommendations: for financial viability, equitable distribution, and water source
protection. Retrieved from
http://globalwaterinitiative.org/media/AchievingWaterServicesThatLastInCentralAmeric
a.pdf
Holtey, D. (2001, September 27). Idaan Pays off US$1mn Elektra Debt. Retrieved April 09,
2017, from
http://www.bnamericas.com/en/news/waterandwaste/Idaan_Pays_off_US*1mn_Elektra_
Debt
Huchzermeyer, M. (2002). Informal Settlements. Latin American Perspectives, 29(1),
83-105. doi:10.1177/0094582x0202900105
http://www.lincolninst.edu/sites/default/files/pubfiles/regularization-informal-
settlements-latin-america-full_0.pdf
IDAAN. (n.d.). Retrieved April 09, 2017, from
https://idaan.gob.pa/
Inter-American Development Bank. (2017) PN-L1093 : Water and Sanitation Multiphase
Investment Program - Phase II. Retreived from:
http://www.iadb.org/en/projects/project-description-title,1303.html?id=PN-L1093
Ley 42 De 2003. (2003). Retrieved September 22, 2017, from
http://panama.justia.com/federales/leyes/42-de-2003-may-6-2003/gdoc/
Rapport JMP 2008. (2009, February 12). Retrieved September 22, 2017, from
https://www.unicef.org/french/media/media_44093.html
Régimen Jurídico. (n.d.). Retrieved August 30, 2017, from
https://idaan.gob.pa/regimen-juridico/#1460651290450-f6f67bf6-4a7e
Terrevazzi, O. (n.d.). ORGANIZATION OF WATER SUPPLY AGENCIES IN THE
AMERICAS’ . Retrieved September 22, 2017.
http://iris.paho.org/xmlui/bitstream/handle/123456789/12732/ev1n1p60.pdf?sequence=1
United Nations, General Assembly, The human right to water and sanitation, A/RES/64/292 (3
28
August 2010), available from
undocs.org/A/RES/64/292
User, S. (2011). Panama. Retrieved September 22, 2017, from
http://www.gefcrew.org/index.php/participating-countries/panama
WASH Sustainability Forum. (2013). Sustainability Forum Report.
http://www.aguaconsult.co.uk/assets/Uploads/Publications/BMGF-
WASHSustainabilityForumReport-2013.pdf
World Bank (2010). Panama - Metro Water and Sanitation Improvement Project. Washington,
DC: World Bank.
http://documents.worldbank.org/curated/en/676991468057556113/Panama-Metro-Water-
and-Sanitation-Improvement-Project
World Bank (2013). World Water Day: Latin America leads in water management but
inequalities in access remain. Retrieved from
http://www.worldbank.org/en/news/feature/2013/03/22/world-water-day-latin-america-
achievements-challenges
World Bank. (2017). Panama - Burunga Wastewater Management Project. Washington, D.C. :
World Bank Group.
http://documents.worldbank.org/curated/en/161751491427758866/Panama-Burunga-
Wastewater-Management-Project
World Health Organization (2012). Global costs and benefits of drinking-water supply and
sanitation interventions to reach the MDG target and universal coverage
(WHO/HSE/WSH/12.01). Geneva, Switzerland: WHO Document Production Services
http://www.iadb.org/en/projects/project-description-title,1303.html?id=PN-L109
29
APPENDIX A: Map of Critical Water Infrastructures in
Neighborhoods of Burunga, Arraijan
30
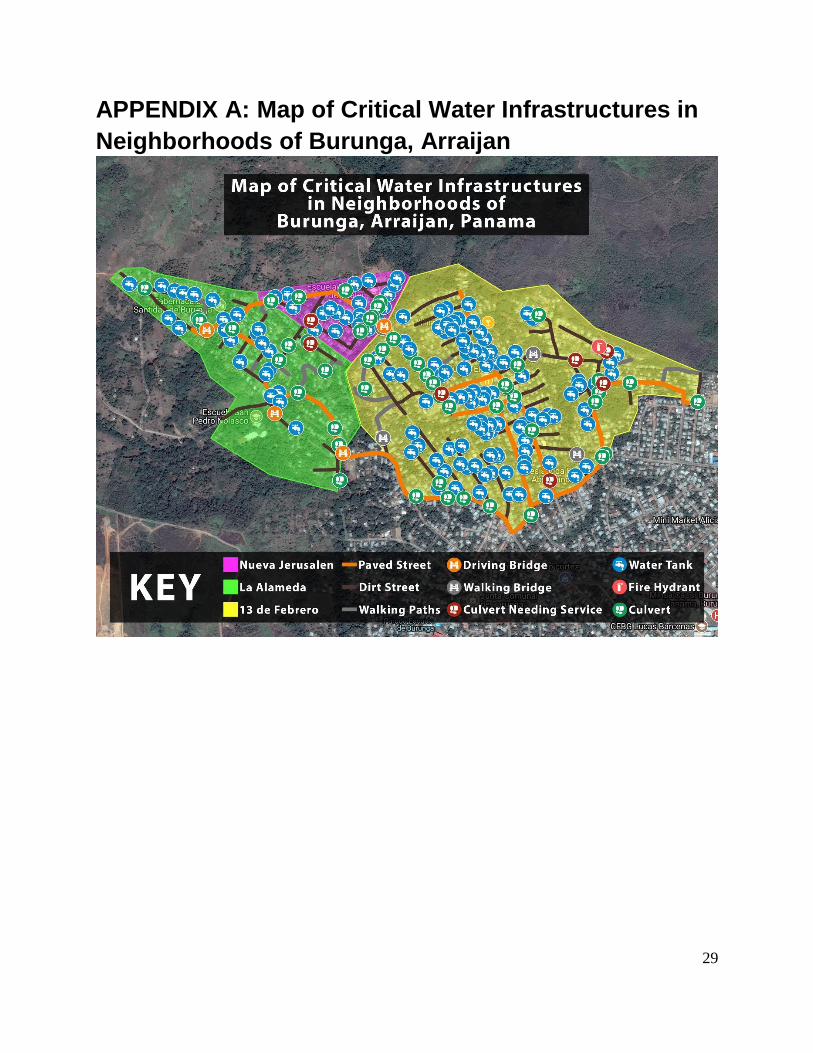
APPENDIX B: Map of Critical Water Infrastructures in
Nueva Jerusalen of Burunga, Arraijan, Panama

31
APPENDIX C: Map of Critical Water Infrastructures in
La Alameda of Burunga, Arraijan, Panama
32
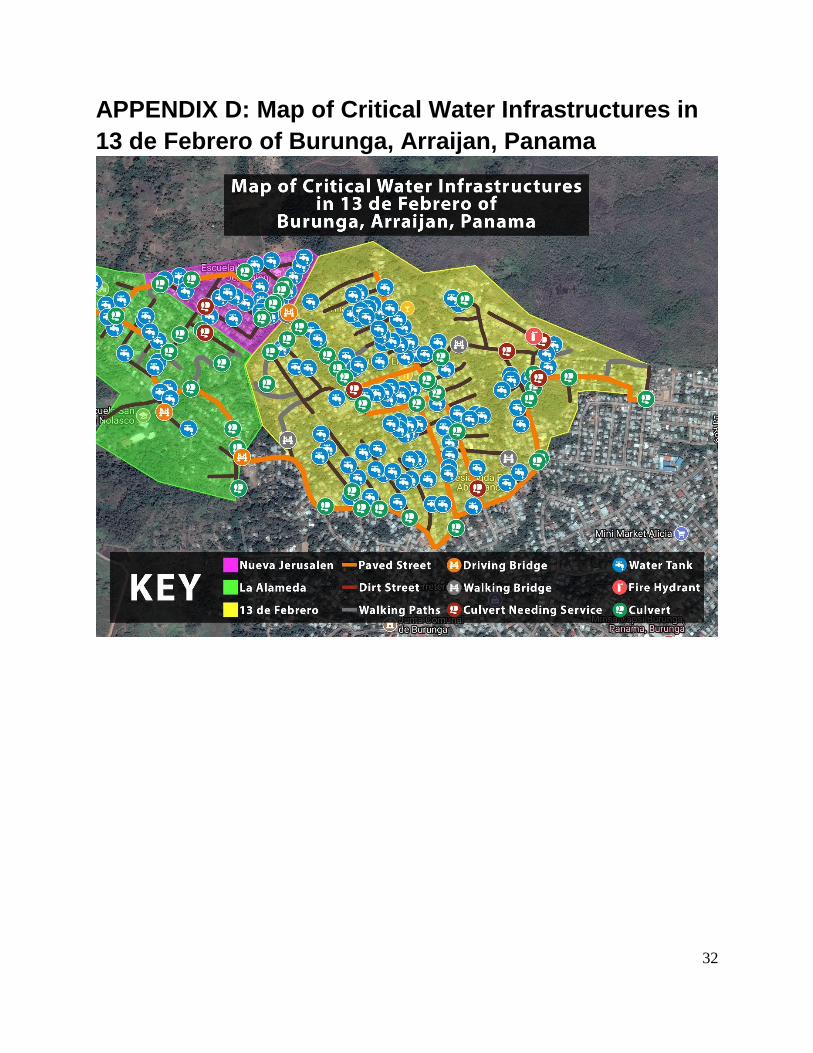
APPENDIX D: Map of Critical Water Infrastructures in
13 de Febrero of Burunga, Arraijan, Panama
33
APPENDIX E: Map of Roads of Bridges in
Neighborhoods of Burunga, Arraijan, Panama

34
APPENDIX F: Map of Water Tanks in Neighborhoods
of Burunga, Arraijan, Panama

35
APPENDIX G: Map of Culverts in Neighborhoods of
Burunga, Arraijan, Panama

36
APPENDIX H: Gantt Chart
TEAM A - TOPOThe top Gannt Chart consists of days only in the field. The second Gannt Charts includes all days.
Field Work Days Only
9/5 9/6 9/7 9/13 9/14 9/19 9/20 9/21 9/26 9/27 9/28 10/3 10/4 10/5 10/10 10/11 10/12
1 2 3 4 5 6 7 8 9 10 11 12 13 14 15 16 17 18 19 20 21 22 23 24 25 26 27 28 29 30 31 32 33 34 35 36 37 38
Nuevo Jeruslen 1 2 1 1 100%
La Alameda 3 4 1 2 100%
13 de Febrero 7 5 2 3 100%
All Days (including weekends)
9/5 9/6 9/7 9/8 9/9 9/10 9/11 9/12 9/13 9/14 9/15 9/16 9/17 9/18 9/19 9/20 9/21 9/22 9/23 9/24 9/25 9/26 9/27 9/28 9/29 9/30 10/1 10/2 10/3 10/4 10/5 10/6 10/7 10/8 10/9 10/10 10/11 10/12
1 2 3 4 5 6 7 8 9 10 11 12 13 14 15 16 17 18 19 20 21 22 23 24 25 26 27 28 29 30 31 32 33 34 35 36 37 38Mapping (Data Collection and Map
Creation) 1 24 1 25 100%
Data Analysis 24 4 14 12 100%
Poster Presentation Prep 26 5 16 10 100%
IDAAN Presentation Prep 26 7 25 8 100%
IQP Paper 1 36 1 36 100%
PERCENT
COMPLETEACTIVITY PLAN START
PLAN
DURATION
ACTUAL
START
ACTUAL
DURATION
% Complete (beyond plan)
ACTIVITY PLAN STARTPLAN
DURATION
ACTUAL
START
ACTUAL
DURATION
PERCENT
COMPLETE
Plan Duration Actual Start % Complete Actual (beyond plan)
37
APPENDIX I: UTM Coordinates of Culverts

38
39
40
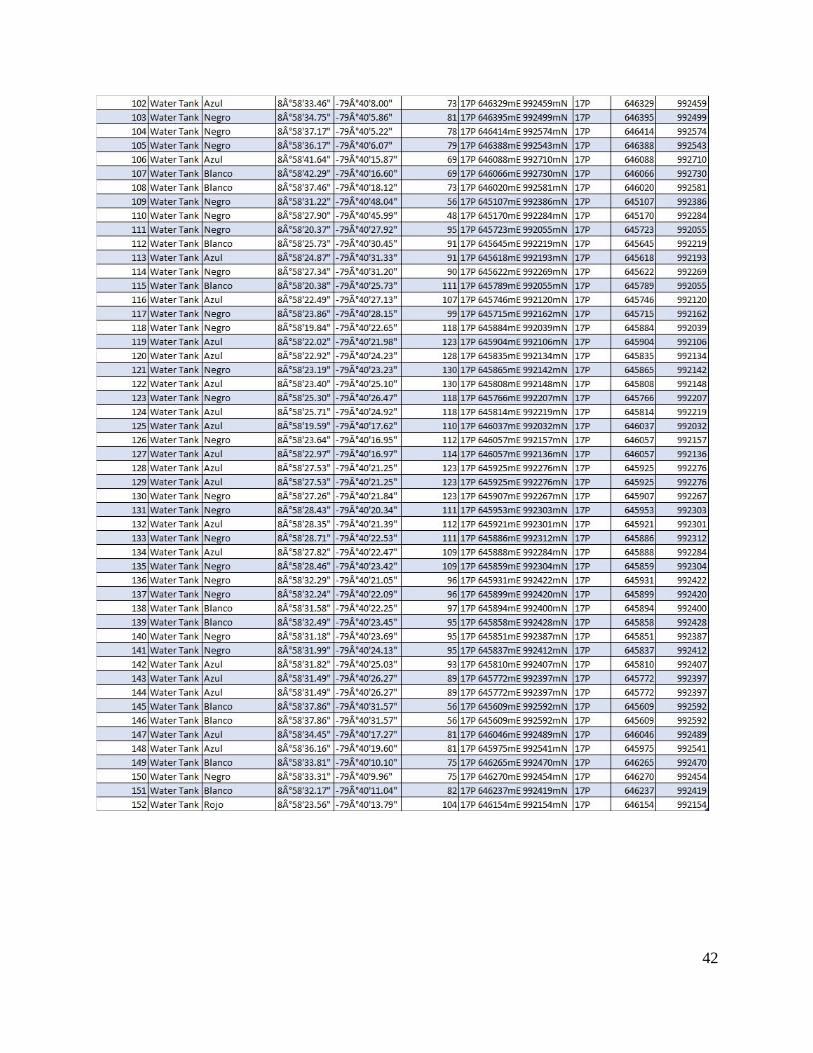
APPENDIX J: UTM Coordinates of Water Tanks

41
42

43
APPENDIX K: UTM Coordinates of Bridges