mapping daily evapotranspiration and dryness index in the
TRANSCRIPT

Hydrol. Earth Syst. Sci., 15, 163–170, 2011www.hydrol-earth-syst-sci.net/15/163/2011/doi:10.5194/hess-15-163-2011© Author(s) 2011. CC Attribution 3.0 License.
Hydrology andEarth System
Sciences
Mapping daily evapotranspiration and dryness index in the EastAfrican highlands using MODIS and SEVIRI data
Z. Sun1, M. Gebremichael1, J. Ardo2, and H. A. R. de Bruin3
1Civil & Environmental Engineering, University of Connecticut, 261 Glenbrook Road, Storrs, CT 06269-2037, USA2Department of Earth and Ecosystem Sciences, Lund University, Lund, Sweden3Associated Professor Emeritus, Wageningen University, freelance researcher, Bilthoven, The Netherlands
Received: 10 August 2010 – Published in Hydrol. Earth Syst. Sci. Discuss.: 26 August 2010Revised: 12 November 2010 – Accepted: 9 January 2011 – Published: 18 January 2011
Abstract. Routine information on regional evapotranspira-tion (ET) and dryness index is essential for agricultural watermanagement, drought monitoring, and studies of water cycleand climate. However, this information is not currently avail-able for the East Africa highlands. The main purpose of thisstudy is to develop (1) a new methodology that produces spa-tially gridded daily ET estimates on a (near) real-time basisexclusively from satellite data, and (2) a new dryness indexthat depends only on satellite data and weather forecast data.The methodology that calculates daily actual ET involvescombining data from two sensors (MODIS and SEVIRI) on-board two kinds of platforms (Terra – polar orbit satellite andMSG – geostationary orbit satellite). The methodology is ap-plied to the East African highlands, and results are comparedto eddy covariance measurements at one site. Results showthat the methodology produces ET estimates that accuratelyreproduce the daily fluctuation in ET but tends to underesti-mate ET on the average. It is concluded that the synergisticuse of the polar-orbiting MODIS data and the geostationary-orbiting SEVIRI data has potential to produce reliable dailyET, but further research is needed to improve the accuracyof the results. This study also proposes an operational newdryness index that can be calculated from the satellite-baseddaily actual ET estimates and daily reference ET estimatesbased on SEVIRI data and weather forecast air temperature.Comparison of this index against ground measurements ofdaily actual ET at one site indicates that the new dryness in-dex can be used for drought monitoring.
Correspondence to:M. Gebremichael([email protected])
1 Introduction
Routine information on regional evapotranspiration (ET) anddryness index is essential for agricultural water management,drought monitoring, and studies of water cycle and climatedynamics (Potter et al., 1993; Churkina et al., 1999; Nemaniet al., 2002). The MODerate resolution Imaging Spectro-radiometer (MODIS) sensor on board Terra and Aqua satel-lites has long been recognized for its potential to produce fre-quent ET maps across the globe. Few researchers have usedMODIS data to produce ET maps in different regions forsome periods (Nagler et al., 2005; Patel et al., 2006; Cleughet al., 2007; Mallick et al., 2007; Mu et al., 2007; Wang et al.,2007; Leuning et al., 2008; Venturim et al., 2008). However,despite these limited successes, we still do not have oper-ational daily ET maps across Africa. This is because cur-rent MODIS-based ET algorithms represent only “instanta-neous or snapshot” values (while daily aggregated ET mapsare more meaningful and useful), and methods of scaling upthe instantaneous value to daily require ground-based mea-surements of radiation, which are not readily available in theEast African highlands. The first objective of this study is todevelop a methodology for estimating daily ET exclusivelyfrom satellite data through the use of a combination of geo-stationary and polar orbiting satellite data.
Dryness indices of land surface provide useful informationfor agricultural and water resources managements. Amongvarious dryness indices, two meteorological dryness indicesare widely accepted and used, the Palmer’s Drought SeverityIndex (PSDI) (Palmer, 1965; Guttman et al., 1992) and theStandardized Precipitation Index (SPI) (Tsakiris and Vange-lis, 2004). The PDSI is a “meteorological” drought indexthat responds to weather conditions that have been abnor-mally dry or abnormally wet. The PDSI is calculated based
Published by Copernicus Publications on behalf of the European Geosciences Union.

164 Z. Sun et al.: Mapping daily evapotranspiration and dryness index
on precipitation, temperature and available water content ofthe soil. The major problem with the PDSI index is that onlypoint measurements with over 15–20 years of record can beused in the calculation of the index and that the spatial cov-erage of the point meteorological measurement in the EastAfrican highlands is scarce. The SPI is another meteorolog-ical index that suffers from the same problems as the PSDIindex except that it overcomes the time lag problem associ-ated with the PSDI index.
In addition, the major pitfall of both indices is thatthey contain no economic component which is impor-tant to declare drought and seek help from the Govern-ment and donors. Yield is linearly related to accumula-tive evapotranspiration through the evapotranspiration pro-duction functions (Doorenbos and Kassam, 1979). There-fore, evapotranspiration-based indices of drought or drynessare much more useful for real-world applications. Dooren-bos and Pruitt (1977) developed the water requirement sat-isfaction index (WRSI), and Jackson et al. (1981) developedthe Crop Water Stress Index (CWSI). Both of them are de-termined by actual and potential ETs that require intensiveground-based measurements. The second objective of thisstudy is to develop a dryness index that is based on satel-lite data and weather forecast data. In this study, we developand apply a new methodology to calculate daily ET and dry-ness index over the East African highlands, and assess theaccuracy of the results by comparing them against flux towermeasurements at one site in Sudan.
2 Data
The proposed methodology (in Sect. 3) requires inputs ofMODIS and geostationary-orbiting satellite data to calculatedaily actual ET. In addition to these inputs, weather forecastair temperature data are also required to calculate the dry-ness index. The results of this methodology are validatedusing ground measurements from an eddy covariance (EC)flux site. Below, we describe these data sources.
MODIS Data – MODIS sensor onboard the Terra andAqua polar-orbiting satellites has 36 spectral bands over awide range at moderate resolutions (250, 500, and 1000 m)with almost daily coverage of the Earth (http://modis.gsfc.nasa.gov/). We used three MODIS/Terra land dataproducts: 8-day land surface temperature, yearly Interna-tional Geosphere-Biosphere Programme (IGBP) land covermap, and 16-day Normalized Difference Vegetation Index(NDVI).
SEVIRI Data– the Spinning Enhanced Visible InfraRedImager (SEVIRI) sensor onboard the Meteorological SecondGeneration (MSG) geostationary-orbiting satellite provides30/15-min observations of land surface and the atmospherein 12 spectral bands for Europe, South America, and Africaat 3.1 km spatial resolution at nadir (http://www.esa.int/SPECIALS/MSG/). We used five SEVIRI/MSG data prod-
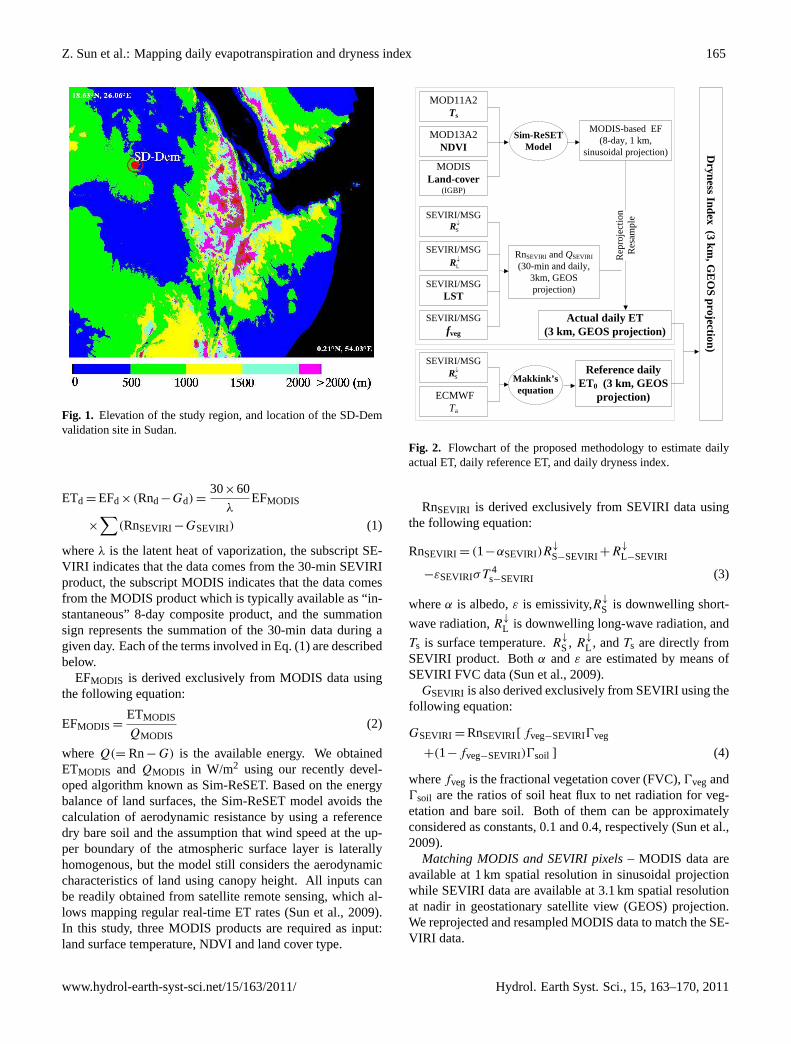
ucts: 30-min downwelling shortwave radiation flux (DSSF),30-min downwelling long-wave radiation flux (DSLF), 15-min land surface temperature (LST), daily vegetation coverfraction (FVC), and static auxiliary digital elevation (DEM,see Fig. 1) data.
Weather forecast air temperature data– we obtained airtemperature at 2 m height (T2 m) from forecasts provided bythe European Centre for Medium-range Weather Forecasts(ECMWF) model. The initial 3-hourlyT2 m forecasts at aresolution of about 25 km are linearly interpolated in timeto hourly, and bi-linearly interpolated in space to the SE-VIRI/MSG resolution. TheT2 m values undergo a further ad-justment to correct differences between the ECMWF modesurface topography and SEVIRI pixel altitude using a con-stant lapse rate of 0.67◦C/100 m. See Trigo et al. (2011) fordetails about ECMWF data.
Ground measurements– flux sites are sparse in Africa,especially in the East African highlands. Among the Car-boAfrica flux network, we only found the SD-Dem flux sitein the East African highlands. So our site selection wasdictated by data availability. We obtained ground measure-ments of quality-controlled 30-min net radiation, soil heatflux, sensible and latent heat fluxes from the SD-Dem Car-boAfrica flux tower site in Sudan (see Fig. 1 for the lo-cation map). The SD-Dem site is located at 13.2829◦ N,30.4783◦ E, 540 m above sea level, and is characterized bysparse acacia savanna, mean annual air temperature of 28◦C,and mean annual precipitation of about 320 mm with themajority falling during June to October (Ardo et al., 2008;Sjostrom et al., 2009). A LI7500 (Li-Cor, Lincoln, US)open-path infrared CO2 and H2O gas analyzer and a GILLR3 Ultrasonic Anemometer (GILL Instruments, UK) weremounted 9 m above the ground, approximately 4 m above thesparse canopy. About 400 m away from the flux tower was amicrometeorological station that measures routine meteoro-logical data such as net radiation, soil heat flux, air temper-ature, humidity and wind speed. We collected ground mea-surements during the period 1 July–29 December 2007.
3 Methodology
The proposed methodology for the estimation of daily actualET and dryness index is illustrated with a flow chart in Fig. 2.Here, we discuss in detail the algorithms involved.
3.1 Daily actual ET (ETd)
ETd (mm/day) is estimated using inputs of daily net radiation(Rnd) and daily soil heat flux (Gd) derived from SEVIRI and“instantaneous” evaporative fraction (EF) during the daytimederived from MODIS, and making the commonly used as-sumption that the EF is constant during the daytime (e.g.,Brutsaert and Sugita, 1992):
Hydrol. Earth Syst. Sci., 15, 163–170, 2011 www.hydrol-earth-syst-sci.net/15/163/2011/
Z. Sun et al.: Mapping daily evapotranspiration and dryness index 165
17
Fig. 1
Fig. 1. Elevation of the study region, and location of the SD-Dem validation site in
Sudan.
Fig. 1. Elevation of the study region, and location of the SD-Demvalidation site in Sudan.
ETd = EFd×(Rnd−Gd) =30×60
λEFMODIS
×
∑(RnSEVIRI−GSEVIRI) (1)
whereλ is the latent heat of vaporization, the subscript SE-VIRI indicates that the data comes from the 30-min SEVIRIproduct, the subscript MODIS indicates that the data comesfrom the MODIS product which is typically available as “in-stantaneous” 8-day composite product, and the summationsign represents the summation of the 30-min data during agiven day. Each of the terms involved in Eq. (1) are describedbelow.
EFMODIS is derived exclusively from MODIS data usingthe following equation:
EFMODIS =ETMODIS
QMODIS(2)
whereQ(= Rn−G) is the available energy. We obtainedETMODIS and QMODIS in W/m2 using our recently devel-oped algorithm known as Sim-ReSET. Based on the energybalance of land surfaces, the Sim-ReSET model avoids thecalculation of aerodynamic resistance by using a referencedry bare soil and the assumption that wind speed at the up-per boundary of the atmospheric surface layer is laterallyhomogenous, but the model still considers the aerodynamiccharacteristics of land using canopy height. All inputs canbe readily obtained from satellite remote sensing, which al-lows mapping regular real-time ET rates (Sun et al., 2009).In this study, three MODIS products are required as input:land surface temperature, NDVI and land cover type.
18
Fig. 2
MODIS-based EF (8-day, 1 km,
sinusoidal projection)
MOD11A2Ts
MODISLand-cover
(IGBP)
MOD13A2NDVI
Sim-ReSETModel
SEVIRI/MSG LST
SEVIRI/MSG fveg
RnSEVIRI and QSEVIRI (30-min and daily,
3km, GEOS projection)
Actual daily ET(3 km, GEOS projection)
Rep
roje
ctio
nR
esam
ple
ECMWFTa
Reference daily ET0 (3 km, GEOS
projection)
Dryness Index (3 km
, GE
OS projection)
Makkink’s equation
SEVIRI/MSG ↓LR
SEVIRI/MSG ↓SR
SEVIRI/MSG ↓SR
Fig. 2. Flowchart of the proposed methodology to estimate daily actual ET, daily reference ET, and daily dryness index.
Fig. 2. Flowchart of the proposed methodology to estimate dailyactual ET, daily reference ET, and daily dryness index.
RnSEVIRI is derived exclusively from SEVIRI data usingthe following equation:
RnSEVIRI = (1−αSEVIRI)R↓
S−SEVIRI+R↓
L−SEVIRI
−εSEVIRIσT 4s−SEVIRI (3)
whereα is albedo,ε is emissivity,R↓
S is downwelling short-
wave radiation,R↓
L is downwelling long-wave radiation, and
Ts is surface temperature.R↓
S, R↓
L , andTs are directly fromSEVIRI product. Bothα andε are estimated by means ofSEVIRI FVC data (Sun et al., 2009).
GSEVIRI is also derived exclusively from SEVIRI using thefollowing equation:
GSEVIRI = RnSEVIRI[ fveg−SEVIRI0veg
+(1−fveg−SEVIRI)0soil ] (4)
wherefveg is the fractional vegetation cover (FVC),0veg and0soil are the ratios of soil heat flux to net radiation for veg-etation and bare soil. Both of them can be approximatelyconsidered as constants, 0.1 and 0.4, respectively (Sun et al.,2009).
Matching MODIS and SEVIRI pixels– MODIS data areavailable at 1 km spatial resolution in sinusoidal projectionwhile SEVIRI data are available at 3.1 km spatial resolutionat nadir in geostationary satellite view (GEOS) projection.We reprojected and resampled MODIS data to match the SE-VIRI data.
www.hydrol-earth-syst-sci.net/15/163/2011/ Hydrol. Earth Syst. Sci., 15, 163–170, 2011

166 Z. Sun et al.: Mapping daily evapotranspiration and dryness index
3.2 Dryness Index (DI)
Similar to the CWSI (Jackson et al., 1981) and the WRSI(Doorenbos and Pruitt, 1977), Anderson et al. (2007) pro-posed the evaporative stress index (ESI) which is determinedfrom actual and potential ET. The potential ET is typicallycalculated by multiplying the reference evapotranspiration(ET0) by the crop coefficient (Kc) (Allen et al., 1998). Thereference ET is standardized to ideal grass, a hypotheticalsurface of 8 to 15 cm tall green grass cover of uniform height,actively growing, completely shading the ground and notshort of water (de Bruin and Lablans, 1998). It is difficult toestimateKc from SEVIRI data due to the crop type hetero-geneity in the large SEVIRI pixel. We propose a new drynessindex (DI) that avoidsKc as follows:
DI =
{1−
ETdET0
, for ET0 ≥ ETd
0, for ET0 < ETd(5)
We estimated ET0 using the modified Makkink equation.The modified Makkink equation is a suitable alternative forPenman’s equation for the determination of ET0 (de Bruinand Lablans, 1998) as follows:
ET0 = c1
λ
1
1+γ
∑R
↓
S−SEVIRI (6)
where c is a constant (0.65 suggested by de Bruin andLablans, 1998),γ is the psychrometric constant (kPa/◦C),and1 is the slope of the saturation vapor pressure curveat air temperature (kPa/◦C). We obtainedT2 m from forecastsprovided by the ECMWF model. Then1 is determined bymeans ofT2 m, andγ is determined by means of the DEMdata:
1 =4098[0.6108exp( 17.27T2 m
237.3+T2 m)]
(237.3+T2 m)2
Pa= 101.3(1−0.0065z
293)5.26
γ = 0.665×10⁻³Pa (7)
wherePa is the atmospheric pressure (kPa),z is the eleva-tion above sea level (m). A detailed description of the ET0algorithm is available in de Bruin et al. (2010).
4 Results
We applied our methodology to obtain satellite-based esti-mates of dryness index and daily actual and reference ETsfor the Northeast Africa for the year 2007. Figure 3 showssample maps for different seasons. Since ET0 is controlledby solar radiation, air temperature, and air pressure, its val-ues are comparatively low in mountainous regions with highaltitudes (shown in brown and blue colors in Fig. 3). Duringthe rainy season in Ethiopia, daily actual ET values are high
19
Fig. 3
Actual daily ET Reference daily ET Dryness index
Fig. 3. Sample maps of (left panel) actual daily ET, (middle panel) daily reference ET,
and (right panel) daily dryness index in different seasons in the study region.
2007/01/21
2007/04/23
2007/07/11
2007/10/12
2007/01/21 2007/01/21
2007/04/23 2007/04/23
2007/07/11 2007/07/11
2007/10/12 2007/10/12
Fig. 3. Sample maps of (left panel) actual daily ET, (middle panel)daily reference ET, and (right panel) daily dryness index in differentseasons in the study region.
(shown in blue) and dryness index values are low (shown ingreen), as expected. Figure 4 shows time series of estimatedactual daily ET, estimated reference daily ET, EC-based ob-served ET, and estimated dryness index at the SD-Dem sitein 2007. Due to missing data, some data lines are discontin-uous.
The accuracy of our results was assessed through compari-son with ground-based measurements. In Fig. 5, the satellite-based daily actual ET estimates are compared with ground-based measurements at the SD-Dem site in Sudan. There isa good correlation (R2
= 0.73) between our satellite-basedestimates and ground measurements, however, the satelliteestimates tend to underestimate the daily actual ET by about18%. The mean absolute error (MAE) is 0.92 mm/day, whichis better than the 1∼1.5 mm/day range reported in other val-idation studies of satellite ET estimation (e.g., Carlson et al.,1995; Gomez et al., 2005; Sanchez et al., 2008). In Fig. 6,the daily satellite-based dryness index estimates are com-pared against ground-based daily actual ET measurementsat the SD-Dem site. There is a good correlation (R2
= 0.72)between the two, indicating that the satellite-based drynessindex estimates are reasonable. Ideally, the dryness indexshould be 1.00 when daily actual ET is 0, and should de-crease with increasing ET. Our results are consistent with this
Hydrol. Earth Syst. Sci., 15, 163–170, 2011 www.hydrol-earth-syst-sci.net/15/163/2011/

Z. Sun et al.: Mapping daily evapotranspiration and dryness index 167
20
Fig. 4
0.0
0.2
0.4
0.6
0.8
1.0
1.2
0
1
2
3
4
5
6
7
1/1 2/1 3/1 4/1 5/1 6/1 7/1 8/1 9/1 10/1 11/1 12/1
DI
ET
dan
d E
T0
(mm
/day
)
Date (2007)
ETd ET0 ET_EC DIETd ET0
Fig. 4. Time series of estimated actual daily ET (ETd), estimated reference daily ET (ET0),
eddy covariance-based observed ET (ET_EC), and estimated dryness index (DI) at the SD-Dem site in 2007.
Fig. 4. Time series of estimated actual daily ET (ETd), esti-mated reference daily ET (ET0), eddy covariance-based observedET (ET EC), and estimated dryness index (DI) at the SD-Dem sitein 2007.
expectation: the dryness index estimate is 1.04 when ET is0, and decreases with increasing ET with a good correlation(R2
= 0.72), indicating that the satellite-based dryness indexestimates are reasonable. Validation of the satellite-baseddaily reference ET estimates in the Ethiopian highlands isaddressed by de Bruin et al. (2010) who reported satisfactoryresults on the accuracy of the satellite-based estimates.
5 Discussion
Our results reveal that the synergistic use of MODIS and SE-VIRI data has the potential to provide realistic values of dailyactual ET, daily reference ET, and daily dryness index. How-ever, the resulting daily ET values, calculated using our al-gorithm, tend to be underestimated as compared to the ECmeasurements at the SD-Dem site. The discrepancy betweenthe two values could be caused by factors, such as algorithmlimitation and the mismatch between the SEVIRI pixel andflux tower footprint, among others. In the following, we dis-cuss these issues in further detail.
Error in net radiation– the daily net radiation is estimatedby summing up the 30-min net radiation obtained from theSEVIRI data during the day. In cloudy sky conditions, theremotely sensed radiation and surface temperature data arenot available, and this leads to underestimation of the dailynet radiation on cloudy days. Figure 7 indicates that cloudyor partially cloudy days usually occur in wet seasons. Vali-dation results reported by LSA-SAF (2008) indicate that theSEVIRI LST values tend to overestimate surface tempera-ture, and this leads to underestimation of the daily net radia-tion. LSA-SAF (2009) also reported underestimation of theSEVIRI downwelling shortwave radiation, which again leadsto underestimation of the daily net radiation. Our comparisonresult shows that daily net radiation estimates from the SE-VIRI data are underestimated with a MAE of 1.46 mm/day(equivalent evaporation in mm/day) (Fig. 8). Underestima-
21
Fig. 5
y = 0.71x - 0.07R² = 0.73
MAE=0.92 mm/day
0
1
2
3
4
5
0 1 2 3 4 5
Rem
ote s
ensi
ng-b
ased
estim
ates
of d
aily
E
T (m
m/d
ay)
Ground measurements of daily ET (mm/day)
1:1 line
Fig. 5. Comparison of satellite-based daily actual ET estimates and eddy covariance
measurements of daily actual ET at the SD-Dem site.
Fig. 5. Comparison of satellite-based daily actual ET estimates andeddy covariance measurements of daily actual ET at the SD-Demsite.
22
Fig. 6
y = -0.15x + 1.04R² = 0.72
0.0
0.2
0.4
0.6
0.8
1.0
1.2
0 1 2 3 4 5
Rem
ote s
ensi
ng-b
ased
estim
ates
of
dryn
ess i
ndex
Ground measurements of daily ET (mm/day)
Fig. 6. Satellite-based daily dryness index estimates versus eddy covariance
measurements of daily actual ET at the SD-Dem site.
Fig. 6. Satellite-based daily dryness index estimates versus eddycovariance measurements of daily actual ET at the SD-Dem site.
tion of daily net radiation directly leads to underestimationof actual daily ET, and this is consistent with our finding thatour algorithm tends to underestimate the daily actual ET.
Errors and assumption in Evaporative Fraction– EF isestimated by means of the VI-Ts diagram in the Sim-ReSETmodel (Sun et al., 2009). It is difficult to establish a correctVI-Ts diagram in dry seasons or regions due to the lack ofpixels with full ranges of VI and surface moisture (Sun etal., 2008). As shown in Fig. 9, EF values estimated from
www.hydrol-earth-syst-sci.net/15/163/2011/ Hydrol. Earth Syst. Sci., 15, 163–170, 2011
168 Z. Sun et al.: Mapping daily evapotranspiration and dryness index
23
Fig. 7
-1000
100200300400500600700800
7/9/078/9/079/9/0710/9/0711/9/0712/9/0713/9/0714/9/0715/9/0716/9/0717/9/0718/9/0719/9/0720/9/0721/9/0722/9/0723/9/0724/9/0725/9/0726/9/0727/9/07
30-m
in n
et r
adia
ion
flux
(W/m
2 )
Date
Cloudy or partially cloudy
Fig. 7. Samples of daily patterns of 30-min net radiation during the period Sep. 7-27,
2007 at the SD-Dem site.
Fig. 7. Samples of daily patterns of 30-min net radiation during theperiod 7–27 September 2007 at the SD-Dem site.
24
Fig. 8
0
1
2
3
4
5
6
9/4 9/11 9/18 9/25 10/2 10/9 10/16 10/23 10/30 11/6 11/13 11/20 11/27
Dai
ly n
et r
adia
tion
(mm
/day
)
Date (2007)
Remote sensing-based estimates Ground-based measurements
MAE=1.46 mm/day
Fig. 8. Daily net radiation time series of remote sensing-based estimates and ground-
based measurements at the SD-Dem site in 2007.
Fig. 8. Daily net radiation time series of remote sensing-based esti-mates and ground-based measurements at the SD-Dem site in 2007.
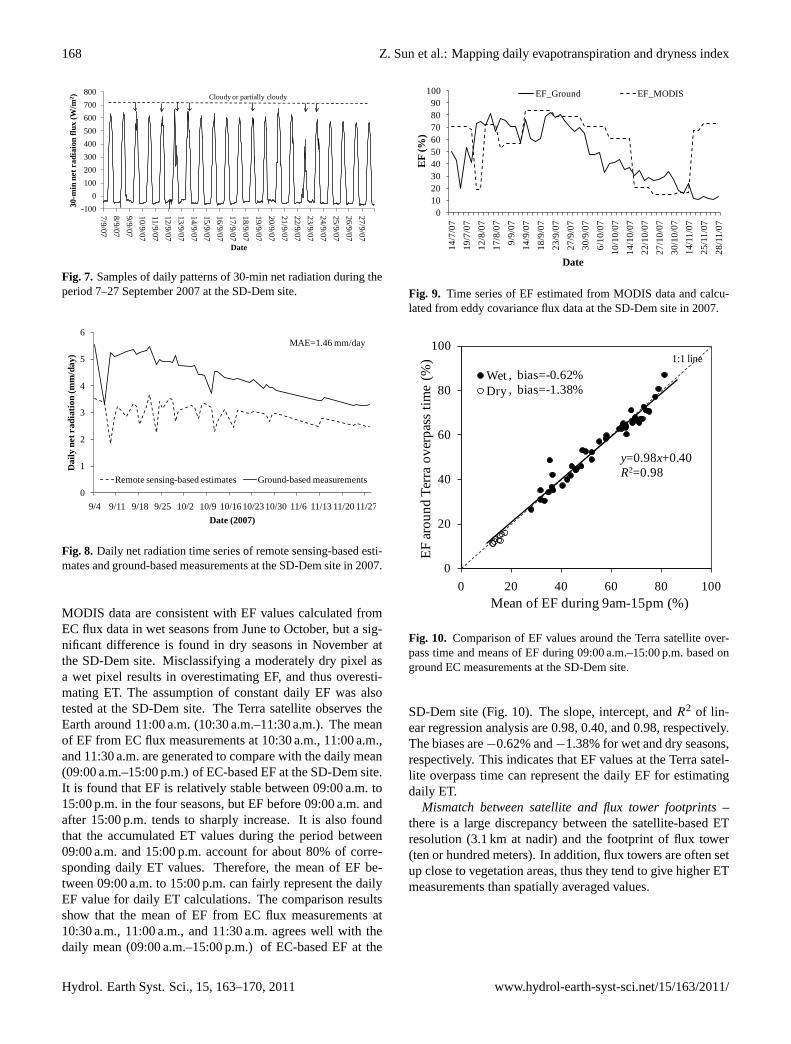
MODIS data are consistent with EF values calculated fromEC flux data in wet seasons from June to October, but a sig-nificant difference is found in dry seasons in November atthe SD-Dem site. Misclassifying a moderately dry pixel asa wet pixel results in overestimating EF, and thus overesti-mating ET. The assumption of constant daily EF was alsotested at the SD-Dem site. The Terra satellite observes theEarth around 11:00 a.m. (10:30 a.m.–11:30 a.m.). The meanof EF from EC flux measurements at 10:30 a.m., 11:00 a.m.,and 11:30 a.m. are generated to compare with the daily mean(09:00 a.m.–15:00 p.m.) of EC-based EF at the SD-Dem site.It is found that EF is relatively stable between 09:00 a.m. to15:00 p.m. in the four seasons, but EF before 09:00 a.m. andafter 15:00 p.m. tends to sharply increase. It is also foundthat the accumulated ET values during the period between09:00 a.m. and 15:00 p.m. account for about 80% of corre-sponding daily ET values. Therefore, the mean of EF be-tween 09:00 a.m. to 15:00 p.m. can fairly represent the dailyEF value for daily ET calculations. The comparison resultsshow that the mean of EF from EC flux measurements at10:30 a.m., 11:00 a.m., and 11:30 a.m. agrees well with thedaily mean (09:00 a.m.–15:00 p.m.) of EC-based EF at the
25
Fig. 9
0102030405060708090
100
14/7
/07
19/7
/07
12/8
/07
17/8
/07
9/9/
0714
/9/0
718
/9/0
723
/9/0
727
/9/0
730
/9/0
76/
10/0
710
/10/
0714
/10/
0722
/10/
0727
/10/
0730
/10/
0714
/11/
0725
/11/
0728
/11/
07
EF
(%)
Date
EF_Ground EF_MODIS
Fig. 9. Time series of EF estimated from MODIS data and calculated from eddy
covariance flux data at the SD-Dem site in 2007.
Fig. 9. Time series of EF estimated from MODIS data and calcu-lated from eddy covariance flux data at the SD-Dem site in 2007.
26
Fig. 10
0
20
40
60
80
100
0 20 40 60 80 100
EF ar
ound
Ter
ra o
verp
ass
time
(%)
Mean of EF during 9am-15pm (%)
WetDry
1:1 line
y=0.98x+0.40R2=0.98
, bias=-0.62%, bias=-1.38%
Fig. 10. Comparison of EF values around the Terra satellite overpass time and means of
EF during 9 am - 15 pm based on ground EC measurements at the SD-Dem site.
Fig. 10. Comparison of EF values around the Terra satellite over-pass time and means of EF during 09:00 a.m.–15:00 p.m. based onground EC measurements at the SD-Dem site.
SD-Dem site (Fig. 10). The slope, intercept, andR2 of lin-ear regression analysis are 0.98, 0.40, and 0.98, respectively.The biases are−0.62% and−1.38% for wet and dry seasons,respectively. This indicates that EF values at the Terra satel-lite overpass time can represent the daily EF for estimatingdaily ET.
Mismatch between satellite and flux tower footprints–there is a large discrepancy between the satellite-based ETresolution (3.1 km at nadir) and the footprint of flux tower(ten or hundred meters). In addition, flux towers are often setup close to vegetation areas, thus they tend to give higher ETmeasurements than spatially averaged values.
Hydrol. Earth Syst. Sci., 15, 163–170, 2011 www.hydrol-earth-syst-sci.net/15/163/2011/

Z. Sun et al.: Mapping daily evapotranspiration and dryness index 169
6 Conclusions
We proposed a methodology to estimate actual ET, refer-ence ET and dryness index on a daily time scale. Themethod combines information from the once-daily polar-orbiting satellite data of MODIS/Terra and the 15/30-mingeostationary-orbiting satellite data of SEVIRI/MSG. Dailyactual ET is estimated from “instantaneous” EF (MODIS-based), and daily net radiation and soil heat flux (SEVIRI-based). Daily reference ET is estimated from downwellingshortwave radiation (SEVIRI-based) and air temperature(ECMWF weather forecast product). We also proposed anew measure of drought, the dryness index which is calcu-lated from the ratio between daily actual and reference ET.
We applied the methodology over the East African high-lands, and calculated the daily actual ET, daily reference ETand dryness index for the year 2007. We compared the re-sults against eddy covariance measurements of ET at the SD-Dem flux tower site in Sudan. Results show that there is agood agreement (R2
= 0.73 and MAE= 0.92 mm/day) be-tween our satellite-based daily ET values and the eddy co-variance measurements, however, our estimates tend to un-derestimate the daily actual ET values by about 18%.
Based on the findings of this study, we conclude thatthe synergistic use of the polar-orbiting MODIS data andthe geostationary-orbiting SEVIRI data has potential to pro-duce reliable daily ET (actual or reference) and a measureof drought exclusively from satellite data and weather fore-cast data. We have presented a methodology of combiningthese datasets that adequately reproduces the daily temporalfluctuation of ET, but tends to underestimate actual daily ET.Further research is needed to improve the accuracy of themethodology, especially in cloudy sky conditions.
Acknowledgements.This study is funded by the NASA NIP GrantNNX08AR31G. The authors would like to thank Isabel Trigo of theLANDSAF team for providing gridded data for mapping referenceET, and also thank LP DAAC for providing MODIS data. Themeasurements at the SD-Dem were supported by EU through theCARBOAFRICA project and by the Swedish Research Council(contract 2004-3888).
Edited by: S. Uhlenbrook
References
Anderson, M. C., Norman, J. M., Mecikalski, J. R., Otkin,J. A., and Kustas, W. P.: A climatological study of evapo-transpiration and moisture stress across the continental UnitedStates based on thermal remote sensing: 2. Surface mois-ture climatology, J. Geophys. Res.-Atmos., 112(D11), D11112,doi:10.1029/2006JD007507, 2007.
Allen, R. G., Pereira, L. S., Raes, D., and Smith, M.: CropEvapotranspiration–Guidelines for Computing Crop Water Re-quirements, FAO Irrigation and drainage paper 56, Rome, Italy:
Food and Agriculture Organization of the United Nations, ISBN92-5-104219-5, 1998.
Ardo, J., Molder, M., El-Tahir, B. A., and Elkhidir, H. A. M.:Seasonal variation of carbon fluxes in a sparse savanna in semiarid Sudan, Carbon Balance Manage., 1, 3–7, doi:10.1186/1750-0680-3-7, 2008.
Brutsaert, W. and Sugita, M.: Application of self-preservation in thediurnal evolution of the surface energy budget to determine dailyevaporation, J. Geophys. Res., 97(D17) 18, 377–382, 1992.
Carlson, T., Capehart, W., and Gillies, R.: A new look at the simpli-fied method for remote-sensing of daily evapotranspiration, Re-mote Sens. Environ., 54, 161–167, 1995.
Churkina, G., Running, S. W., Schloss, A. L., and The Participantsof the Potsdam NPP Model Intercomparison: Comparing globalmodels of terrestrial net primary productivity (NPP): The impor-tance of water availability, Glob. Change Biol., 5(suppl.1), 46–55, 1999.
Cleugh, H. A., Leuning, R., Mu, Q., and Running, S. W.: Regionalevaporation estimates from flux tow and MODIS satellite data,Remote Sens. Environ., 106, 285–304, 2007.
de Bruin, H. A. R. and Lablans, W. N.: Reference crop evapotran-spiration determined with a modified Makkink equation, Hydrol.Process., 12, 1053–1062, 1998.
de Bruin, H. A. R., Trigo, I. F., Jitan, M. A., Temesgen Enku, N.,van der Tol, C., and Gieske, A. S. M.: Reference crop evap-otranspiration derived from geo-stationary satellite imagery: acase study for the Fogera flood plain, NW-Ethiopia and the Jor-dan Valley, Jordan, Hydrol. Earth Syst. Sci., 14, 2219–2228,doi:10.5194/hess-14-2219-2010, 2010.
Doorenbos, J. and Kassam, A. H.: Yield response to water, Irriga-tion and Drainage Paper 33, FAO, United Nations, Rome, 1979.
Doorenbos, J. and Pruitt, W. O.: Crop water requirements, Irrigationand Drainage Paper 24, FAO, United Nations, Rome, 1977.
Gomez, M., Olioso, A., Sobrino, J. A., and Jacob, F.: Retrieval ofevapotranspiration over the Alpilles/ReSeDA experimental siteusing airborne POLDER sensor and a thermal camera, RemoteSens. Environ., 96, 399–408, 2005.
Guttman, N., Wallis, J., and Hosking, J.: Spatial comparability ofthe Palmer Drought Severity Index, Water Resour. Bull., 28(6),1111–1119, 1992.
Jackson, R. D., Idso, S. B., Reginato, R. J., and Pinter Jr., P. J.:Canopy temperature as a crop water stress indicator, Water Re-sour. Res., 17, 1133–1138, 1981.
Leuning, R., Zhang, Y. Q., Rajaud, A., Cleugh, H., and Tu,K.: A simple surface conductance model to estimate regionalevaporation using MODIS leaf area index and the Penman-Monteith equation, Water Resour. Res., 44(10), W10419,doi:10.1029/2007WR006562, 2008.
LSA-SAF: Validation Report: Land Surface Temperature (LST),available at:http://landsaf.meteo.pt/, 2008.
LSA-SAF: Validation Report: Down-welling long wave flux(DSLF), available at:http://landsaf.meteo.pt/, 2009.
Mallick, K., Bhattacharya, B. K., Chaurasia, S., Dutta, S., Nigam,R., Mukherjee, J., Banerjee, S., Kar, G., Rao, V. U. M., Gadgil,A. S., and Parihar, J. S.: Evapotranspiration using MODIS dataand limited ground observations over selected agroecosystems inIndia, Int. J. Remote Sens., 28(10), 2091–2110, 2007.
Mu, Q., Heinsch, F. A., Zhao, M., and Running, S. W.: Develop-ment of a global evapotranspiration algorithm based on MODIS
www.hydrol-earth-syst-sci.net/15/163/2011/ Hydrol. Earth Syst. Sci., 15, 163–170, 2011

170 Z. Sun et al.: Mapping daily evapotranspiration and dryness index
and global meteorology data, Remote Sens. Environ., 111, 519–536, 2007.
Nagler, P. L., Cleverly, J., Glenn, E., Lampkin, D., Huete, A., andWan, Z. M.: Predicting riparian evapotranspiration from MODISvegetation indices and meteorological data, Remote Sens. Envi-ron., 94(1), 17–30, 2005.
Nemani, R. R., White, M. A., Thornton, P., Nishida, K., Reddy,S., Jenkins, J., and Running, S. W.: Recent trends in hydro-logic balance have enhanced the carbon sink in the United States,Geophys. Res. Lett., 29(10), 1468, doi:10.1029/2002GL014867,2002.
Palmer, W.: Meteorological drought, Research Paper 45, USWeather Bureau, Washington DC, 1965.
Patel, N. R., Rakhesh, D., and Mohammed, A. J.: Mapping of re-gional evapotranspiration in wheat using Terra/MODIS satellitedata, Hydrol. Sci. J., 51(2), 325–335, 2006.
Potter, C. S., Randerson, J. T., Field, C. B., Matson, P. A., Vitousek,P. M., Mooney, H. A., and Klooster, S. A.: Terrestrial ecosystemproduction: a process model based on global satellite and surfacedata, Global Biogeochem. Cy., 7, 811–841, 1993.
Sanchez, J. M., Scavone, G., Caselles, V., Valor, E., Copertino, V.A., and Telesca, V.: Monitoring daily evapotranspiration at a re-gional scale from Landsat-TM and ETM+ data: Application tothe Basilicata region, J. Hydrol., 351, 58–70, 2008.
Sjostrom, M., Ardo, J., Eklundh, L., El-Tahir, B. A., El-Khidir, H.A. M., Hellstrom, M., Pilesjo, P., and Seaquist, J.: Evaluationof satellite based indices for gross primary production estimatesin a sparse savanna in the Sudan, Biogeosciences, 6, 129–138,doi:10.5194/bg-6-129-2009, 2009.
Sun, Z., Wang, Q., Matsushita, B., Fukushima, T., Ouyang Z., andWatanabe, M.: A new method to define the VI-Ts diagram us-ing subpixel vegetation and soil information: a case study over asemiarid agricultural region in the North China Plain, Sensors, 8,6260–6279, 2008.
Sun, Z., Wang, Q., Matsushita, B., Fukushima, T., Ouyang, Z., andWaternabe, M.: Development of a simple remote sensing evap-otranspiration model (Sim-ReSET): algorithm and model test, J.Hydrol., 376(3–4), 476–485, 2009.
Trigo, I. F., DaCamara, C. C., Viterbo, P., Roujean, J.-L., Olesen,F., Barroso, C., Camacho-de Coca, F., Carrer, D., Freitas, S. C.,Garcıa-Haro, J., Geiger, B., Gellens-Meulenberghs, F., Ghilain,N., Melia, J., Pessanha, L., Siljamo, N., and Arboleda, A.: Thesatellite application facility on land surface analysis, Int. J. Re-mote Sens., in press, 2011.
Tsakiris, G. and Vangelis, H.: Towards a drought water systembased on spatial SPI, Water Resour. Manage., 18(1), 1–12, 2004.
Venturim, V., Islam, S., and RodrigueZ, L.: Estimation of evap-orative fraction and evapotranspiration from MODIS productsusing a complementary based model, Remote Sens. Environ.,112(1), 132–141, 2008.
Wang, K. C., Wang, P., Li, Z. Q., Cribb, M., and Sparrow,M.: A simple method to estimate actual evapotranspirationfrom a combination of net radiation, vegetation index andtemperature, J. Geophys. Res.-Atmos., 112(D15), D15107,doi:10.1029/2006JD008351, 2007.
Hydrol. Earth Syst. Sci., 15, 163–170, 2011 www.hydrol-earth-syst-sci.net/15/163/2011/