mapping downtown honolulu’s urban past: exploring the
TRANSCRIPT

Mapping Downtown Honolulu’s Urban Past: Exploring the
Potential of Geographic Information Systems (GIS) and
Sanborn Fire Insurance Maps for Historic Preservation
Mary M. L. Kodama
MAY 2013
Submitted towards the fulfillment of the requirements for the Doctor of
Architecture Degree.
School of Architecture
University of Hawai‘i
Doctorate Project Committee
Spencer Leineweber, Chairperson
William Chapman
Ross W. Stephenson
Mapping Downtown Honolulu's Urban Past: Exploring thePotential of Geographic Information Systems (GIS) and SanbornFire Insurance Maps for Historic Preservation
Mary M. L. KodamaMAY 2013
We certify that we have read this Doctorate Project and that, inour opinion, it is satisfactory in scope and quality infuffillment asa Doctorate Projectfor the degree of Doctor of Architecture in theSchool of Architecture, University of Hawai'i ot Manoa.
Doctorate Project Committee
frz^czn Gr."€^rr]p<o-

iii
Acknowledgements
I would like to gratefully acknowledge my committee Chairperson, Spencer
Leineweber, for her invaluable supervision and support and for providing me thoughtful
guidance when I was unsure of how I should proceed with my research. I would also like to
thank my other committee members, Dr. William Chapman and Dr. Ross Stephenson for
all of their suggestions, advice and feedback. From day one, I felt that all the members of
my committee were right alongside me on my journey, providing positive encouragement
and sage advice to help me complete my research goals.
Without question, this dissertation would not be possible if I did not have the
support and understanding of my family. Thanks to my children, Samantha and Haru who I
enlisted to help me with my final edits and to Mika who so often stayed with me during my
many weekends in the studio. To my parents-in-laws, Harvey and Betty Kodama, thank
you for your patience and understanding all these years.
To my in-laws in California, Bryan who graciously let me stay at his place during
my practicum in San Francisco, and Grant, Wayne, and Mia, thank you all for your
hospitality and kindness.
This dissertation is dedicated to both my husband, Harvey, who has been my rock
from day one, and whose support remained steadfast throughout my stressful ups and
downs during this entire process, and to my remarkable father, Clifford Chan, who has
always been my greatest cheerleader. His unwavering support of all my endeavors and his
unshakable faith in me carried me to the finish line. Thanks Dad!

iv
Abstract
Historic maps are a valuable resource for understanding our past. Historic
preservationists, in their endeavor to conserve, protect, and preserve historic buildings
and neighborhoods, use historic maps to gain a richer understanding of the places where
we lived, worked, and played. This research explored the synergy of using Geographic
Information Systems (GIS) with historic maps to achieve a greater appreciation and
understanding of the past.
The Sanborn Fire Insurance Maps are a set of maps that traced the growth and
development of major cities and neighborhoods from 1867 to 2007. Developed as an aid
for insurance companies in estimating fire insurance liabilities in urban areas, the maps
not only provide parcel information such as property sizes, block numbers, street names
and addresses, they also depict a wealth of building information, such as shape and
height, construction materials, locations of windows and doors, uses and occupants.
When viewed over an extended time period, these maps accurately document the growth,
decline and changes in cities and communities over time.
ArcGIS software was used to digitize and map the rich source of data inherent in
the Sanborn Fire Insurance Maps for a 25-block area surrounding Fort Street Mall in
downtown Honolulu, Hawaii. Seven time periods of Sanborn Fire Insurance Maps from
1914 through 1993 were digitized and mapped using GIS to demonstrate how urban areas
could be studied and interpreted through this particular mapping method. The resulting
methodology showed that by using GIS with historic maps to track and analyze urban
changes over time, a wealth of information and insight about a community’s past is
revealed, something that is not apparent when simply studying individual paper maps.
v
Table of Contents
Acknowledgements ............................................................................................................ iii
Abstract ............................................................................................................... iv
List of Figures ............................................................................................................. viii
List of Tables ............................................................................................................... xi
Chapter 1. Introduction .............................................................................................1
1.1 Maps .................................................................................................................... 1
1.2 Historic Preservation through Mapping .............................................................. 2
1.3 Sanborn Fire Insurance Maps ............................................................................. 4
1.3.1 History............................................................................................................. 4
1.3.2 Other uses for the Sanborn maps .................................................................... 7
1.4 Geographic Information Systems ....................................................................... 9
1.4.1 The Essential Elements of GIS ..................................................................... 11
1.4.2 Users of Geographic Information Systems ................................................... 12
1.4.3 ArcGIS Software ........................................................................................... 15
1.4.4 GIS vs Google Earth ..................................................................................... 16
Chapter 2. Historic Preservation - Sanborn Maps and GIS ....................................18
2.1 Use of Sanborn Maps for Historic Preservation ............................................... 19
2.2 Case Studies - Sanborn Fire Insurance Maps ................................................... 24
2.2.1 Vieux Carré Commission, New Orleans, LA ............................................... 24
2.2.2 Blandwood Mansion, Greensboro, NC ......................................................... 28
2.2.3 Mapping the Industrial Archeology of Boston ............................................. 31
2.3 Use of GIS for historic preservation ................................................................. 32
2.4 Case Studies - GIS ............................................................................................ 34
2.4.1 Mapping the Medieval Urban Landscape ..................................................... 34
2.4.2 Mapping Medieval Chester ........................................................................... 35
2.4.3 Historical GIS: Boston 1775 ......................................................................... 35
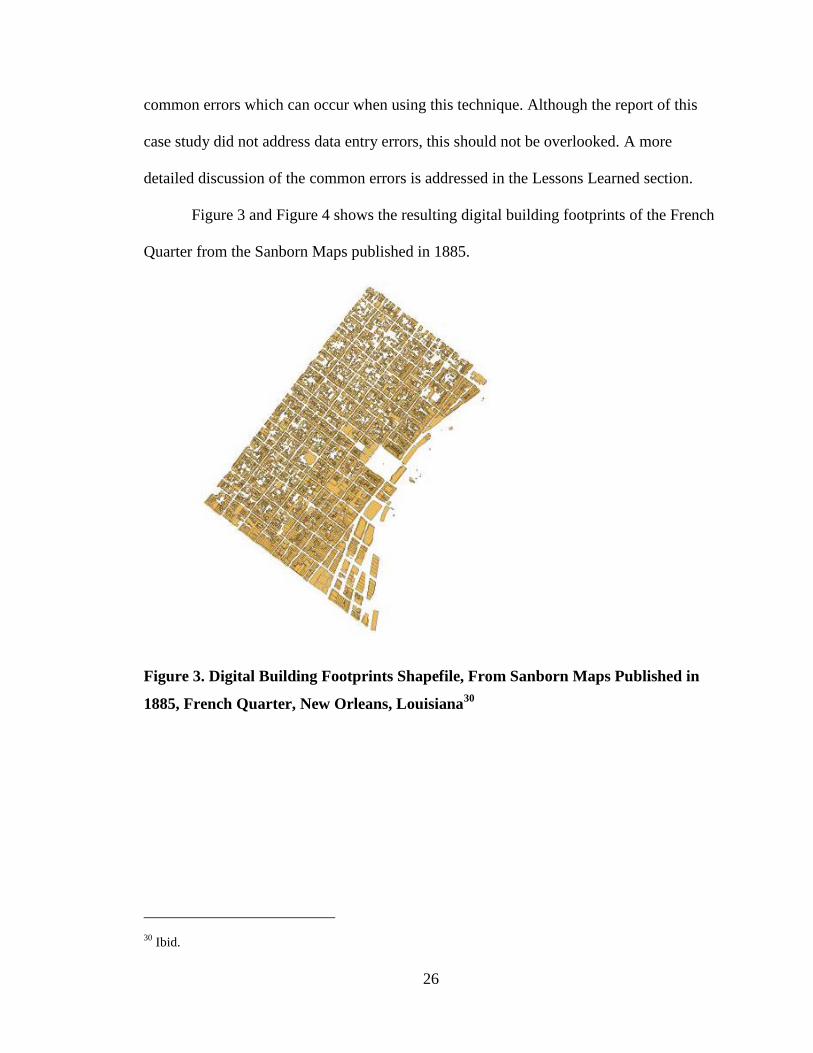
Chapter 3. Applied Research ..................................................................................39
3.1 Fort Street and Downtown Honolulu ................................................................ 39
3.1.1 Fort Street Area Description ......................................................................... 40

vi
3.1.2 Historical Buildings on Fort Street Mall ....................................................... 42
3.2 Creation of GIS Maps ....................................................................................... 43
3.2.1 Gathering the Maps ....................................................................................... 44
3.2.2 Preparing the Maps ....................................................................................... 48
3.2.3 Georeferencing Process ................................................................................ 52
3.2.4 Creating Map Mosaics .................................................................................. 55
3.2.5 Digitizing ...................................................................................................... 57
3.2.5.1 Building Footprints and City Blocks .................................................... 57
3.2.5.2 Digitization Workflow .......................................................................... 59
3.2.6 Database Development ................................................................................. 60
3.2.7 Time Estimates.............................................................................................. 61
3.3 Historical Building Photographs ....................................................................... 62
3.3.1 Data Sources ................................................................................................. 62
3.3.2 Data Collection ............................................................................................. 63
3.3.3 Database Development ................................................................................. 63
3.3.4 Displaying the Photographs .......................................................................... 64
Chapter 4. Results ...................................................................................................68
4.1 City Blocks........................................................................................................ 69
4.1.1 Street Analysis Example ............................................................................... 70
4.1.2 City Block Analysis Example ....................................................................... 74
4.1.3 Urban Change Analysis Example ................................................................. 75
4.2 Urban Density Analysis .................................................................................... 76
4.3 Land Use ........................................................................................................... 82
4.3.1 Downtown Honolulu Land Use Statistics ..................................................... 83
4.4 Relational Database .......................................................................................... 88
4.5 Web-based Representation of the Data for Public Access ................................ 89
Chapter 5. Next Steps ..............................................................................................92
5.1 Expand Mapping Area ...................................................................................... 92
5.2 Brainstorming Database Queries ...................................................................... 92
5.3 Dakin Maps ....................................................................................................... 94
5.4 City Planning Maps........................................................................................... 96

vii
5.5 Business or Residential Directories .................................................................. 97
5.6 Creating Historic 3D Building Models from Footprint Information and Historic
Photographs .................................................................................................................. 97
Chapter 6. Lessons Learned ....................................................................................98
6.1 Quality of the maps ........................................................................................... 98
6.2 Mapping Fatigue ............................................................................................... 98
6.3 Interpreting the Building Data .......................................................................... 99
6.4 Level of Knowledge Required ........................................................................ 100
Chapter 7. Conclusion ...........................................................................................101
Bibliography .............................................................................................................103

viii
List of Figures
Figure 1. Color Sanborn Fire Insurance Index Map of Honolulu, 1914 ........................... 21
Figure 2. Sanborn Fire Insurance Company Color-Coded Legend .................................. 22
Figure 3. Digital Building Footprints Shapefile, From Sanborn Maps Published in 1885,
French Quarter, New Orleans, Louisiana.................................................................. 26
Figure 4. Digital Sanborn Building Footprints, French Opera House circa 1885, French
Quarter, New Orleans, Louisiana .............................................................................. 27
Figure 5. 1907, 1919, and 1925 Footprints Determined from Sanborn Fire Insurance
Maps .......................................................................................................................... 30
Figure 6. City of Boston, c. 1775 ...................................................................................... 37
Figure 7. Samples of Historic Boston Maps Used ............................................................ 38
Figure 8. Downtown Honolulu, Aerial Map ..................................................................... 41
Figure 9. Building Footprints, Downtown Honolulu ........................................................ 41
Figure 10. Location of Historical Buildings on Fort Street .............................................. 43
Figure 11. 1927 Sanborn Fire Insurance Index Map of Honolulu .................................... 45
Figure 12. Detail of 1927 Sanborn Map Index and Map Nos. 223 and 225 ..................... 46
Figure 13. Downtown Honolulu Mapping Coverage Area ............................................... 48
Figure 14. Sanborn Fire Insurance Map dated 1927 –3 City blocks on one sheet ........... 50
Figure 15. Sanborn Fire Insurance Map 223, Cropped into three map files ..................... 51
Figure 16. Sanborn Fire Insurance Map - Reference Points ............................................. 54
Figure 17. Sanborn Fire Insurance Map Tiles Georeferenced to a Base Map .................. 54
Figure 18. Sanborn Fire Insurance Map Mosaic - Showing Footprint of Map Sheets ..... 56
Figure 19. Sanborn Fire Insurance Map Mosaic - Final ................................................... 56
Figure 20. Digital Building Footprints – 1914 Sanborn Fire Insurance Maps (viewed
using ArcScene) ........................................................................................................ 58
Figure 21. City Block Digitization - 1914 Sanborn Maps ................................................ 59
Figure 22. Historic Photographs in Mapping Area ........................................................... 65
Figure 23. Building Photograph Pop Up Window ............................................................ 66
Figure 24. Corner of King Street looking up Fort Street. First National Bank on the right.
M.A. Gunst building on left ...................................................................................... 67

ix
Figure 25. Mapping Area - Downtown Honolulu ............................................................. 68
Figure 26. City Blocks in Mapping Area from 1914 to 1993 ........................................... 69
Figure 27. 1914 Sanborn Map Mosaic – Bethel St. .......................................................... 71
Figure 28. 1927 Sanborn Map Mosaic – Bethel St. .......................................................... 71
Figure 29. 1950 Sanborn Map Mosaic – Bethel St. .......................................................... 72
Figure 30. 1914 Sanborn Map Mosaic - Bishop St. .......................................................... 73
Figure 31. 1927 Sanborn Map Mosaic - Bishop St. .......................................................... 73
Figure 32. Block Changes Due to Bethel and Bishop Street Extension - 1914 to 1950 ... 74
Figure 33. 20-Foot Buffer - Bethel St ............................................................................... 75
Figure 34. Buildings affected by Bethel St. Extension ..................................................... 76
Figure 35. 3D Building Footprints - 1914 to 1993 ........................................................... 77
Figure 36. Building Footprints - 1914 &1927 .................................................................. 78
Figure 37. Building Footprints - 1950 & 1956 ................................................................. 78
Figure 38. Building Footprints - 1975 & 1986 ................................................................. 79
Figure 39. Building Footprints – 1993 .............................................................................. 79
Figure 40. Change in Number of Buildings - 1914 to 1993 ............................................. 80
Figure 41. Average Square Foot Per Building - 1914 to 1993 ......................................... 81
Figure 42. Square Footage of Buildings & Total Number of Buildings - 1914 to 1993 .. 81
Figure 43. Average Building Height and Number of Buildings per Year ........................ 82
Figure 44. Land Use Percentages in Study Area – 1914 .................................................. 83
Figure 45. Land Use Percentages in Study Area - 1927 ................................................... 83
Figure 46. Land Use Percentages in Study Area - 1950 ................................................... 84
Figure 47. Land Use Percentages in Study Area - 1956 ................................................... 84
Figure 48. Land Use Percentages in Study Area – 1975 .................................................. 85
Figure 49. Land Use Percentages in Study Area - 1986 ................................................... 85
Figure 50. Land Use Percentages in Study Area - 1993 ................................................... 86
Figure 51. Land Use Change Over Time .......................................................................... 86
Figure 52. Land Use - 1927 Sanborn Fire Insurance Map ................................................ 87
Figure 53. Land Use - 1927 Sanborn Fire Insurance Map - 3D View .............................. 88
Figure 54. Extract of Database Table for Honolulu Downtown Buildings ...................... 89
Figure 55. ArcGIS On-line Map - Historic Sanborn Maps of Downtown Honolulu ....... 90

x
Figure 56. ArcGIS On-Line Map - Compare Web Maps ................................................. 91
Figure 57. Building or Company Names .......................................................................... 93
Figure 58. 1904 Dakin Fire Insurance Map overlayed on 1914 Sanborn Map Mosaic .... 95
Figure 59. Detail of Dakin Fire Insurance Map ................................................................ 96

xi
List of Tables
Table 1-1. GIS Users......................................................................................................... 14
Table 3-1. Historic Buildings on Fort Street in Downtown Honolulu .............................. 42
Table 3-2. Sanborn Fire Insurance Maps Downloaded from Proquest ............................. 47
Table 3-3. Sanborn Fire Insurance Maps from the Univ of Hawaii Hamilton Library
Microfilm collection ................................................................................................. 47
Table 3-4. Summary of Number of Maps Required for Georeferencing .......................... 52
Table 3-5. Summary of Buildings Digitized ..................................................................... 58
Table 3-6. Sanborn Fire Insurance Map Database Fields Summary ................................ 61
Table 3-7. Time Required to Complete Mapping ............................................................. 61
Table 3-8. Building Photograph Database Fields Summary ............................................. 64

1
Chapter 1. Introduction
1.1 Maps
Maps have been used throughout history to help us explore, inform, and find our
way. From the earliest days, man has used maps as a tool to better understand the world.
Whether as a painting on cave walls or carved into clay tablets, maps were used to
abstractly convey a part of our environment. We create maps to provide information; the
information provided is dependent on our goals as a map maker. Today, maps in all
forms are everywhere—on phones, car navigation systems, route maps at bus stops, or
inside local papers. Maps are a ubiquitous and essential part of our lives.
But what constitutes a map? All maps are estimations, generalizations and
interpretations of true geographic conditions.1 Because it is impossible to completely
translate the real world onto a map, we pick and choose what to depict. No map can show
all the physical, biological and cultural features for even the smallest area. For a long
time, the most well-known maps were the ones painstakingly produced on paper by
cartographers who took years to accurately complete them. Those maps were open to
interpretation and criticism by people who did not agree with perhaps the borders drawn,
or the depiction of the area of the land mass. Maps today are still subject to criticism or
praise, based on the information provided and the audience reading them.
In his book, “Artifacts and the American Past,” Thomas J. Schlereth states that
“since historical scholarship began in the European Renaissance, maps have been
considered a crucial interpretive tool in deciphering the major economic, political,
1 James S. Aber, "Brief History of Maps and Cartography,"
http://academic.emporia.edu/aberjame/map/h_map/h_map.htm.

2
diplomatic, and military events of the past five centuries.”2 Historic maps offer a glimpse
into showing what life was like in days past and pinpoint events to geographic locations.
Historic maps convey spatial information more efficiently than words and are
indispensable to recreating the story of our past.
1.2 Historic Preservation through Mapping
Historic maps are an abundant source of information about the past. Historic maps
reveal much about the history of an area, how it developed and where historic events took
place. They enable preservationists to understand and interpret the past. Preservationists
use historic maps to research and plan for the preservation of important historic and
archaeological resources.
Historic Preservation is the process of identifying, protecting, and enhancing
buildings, places, and objects of historical and cultural significance. The National
Historic Preservation Act of 1966 defines Historic Preservation as:
Identification, evaluation, recordation, documentation, curation, acquisition,
protection, management, rehabilitation, restoration, stabilization, maintenance,
research, interpretation, conservation, and education and training regarding the
foregoing activities, or any combination of the foregoing activities.3
Historic preservation includes performing specific activities related to preserving
a building for its architectural or educational value, or because it links us to characters or
events from the past. One key historic preservation activity is the research and
2 Thomas J. Schlereth, Artifacts and the American Past (Nashville, Tenn.: American Association for State
and Local History, 1980). 66.
3 "National Historic Preservation Act of 1966, as amended through 1992," in 16 U.S.C. 470 (Washington,
D.C.: US Congress, 1992), 32.

3
interpretation of past structures, neighborhoods or landscapes. When done thoroughly and
thoughtfully, the documented history becomes an honest interpretation of the past, not
clouded by historical bias or prejudice. Historic preservation also includes looking at our
surroundings today and comparing it to the past to figure out the evolution of our
environment. Schlereth states that we should consider the American environment as a
historical museum. In particular, seeing landscapes as artifacts and using those artifacts to
aid us in “understanding the uncommon history of common things.”4 According to
Schlereth, artifacts are the physical evidence that link us to the past. Examples of artifacts
include such items as photographs, mail-order catalogues, cartography, historic sites, and
landscape and vegetation. Historic research and interpretation involves synthesizing
many such artifacts in order to get a true representation of the past. A visual way to
combine such artifacts is through mapping. Maps provide an excellent method of
visualizing the layers of data within a spatial framework. However, this type of
comparative work is extremely time-consuming. It is very difficult to manually integrate
an array of artifacts and filter it down into digestible data onto a map. Fortunately,
computers have drastically changed how we visualize and use maps. Over the last 10
years, computer mapping tools have made it possible to combine and compare huge and
diverse datasets, including satellite imagery, aerial photographs and digital mapping. This
allows data from both historical and other sources to be easily integrated and examined at
multiple scales. Using computer mapping tools, a time series of digitized historical maps
can yield a wealth of data that may not have been readily apparent by just viewing two-
dimensional, paper maps.
4 Schlereth, Artifacts and the American Past. 4
4
The Sanborn Fire Insurance maps, drawn for the same areas over a number of
decades, provide valuable temporal information such as settlement patterns, urban
planning, businesses industrial building locations, street patterns, block size, and
construction materials. For Historic Preservation research, the Sanborn maps are the ideal
artifacts to help interpret the past.
1.3 Sanborn Fire Insurance Maps
1.3.1 History
Founded in 1867 by Daniel Alfred Sanborn, a surveyor from Somerville, Mass,
the Sanborn Map Company was the primary American publisher of fire insurance maps
for nearly 100 years. D. A. Sanborn began his career in 1866 by doing commissions for
the Aetna Insurance Company, producing fire insurance maps of Boston and Tennessee.
A year later, he founded the D.A. Sanborn National Insurance Diagram Bureau, which
was later called the Sanborn Map and Publishing Company. His new firm mapped 50
towns in its first year and more than 600 within the next seven.5 The Sanborn map
collection consists of a uniform series of large-scale maps, dating from 1867 to 2007,
depicting the commercial, industrial, and residential sections of some twelve thousand
cities and towns in the United States, Canada, and Mexico.6
Why was there such a market to produce these maps? The Industrial Revolution
in the nineteenth century caused rapid urban growth. As the density of urban areas
increased, fires became a growing threat to the life and property of city dwellers. During
this time period, fire-fighting services, still in their infancy were usually ineffective, and
5 "A Visit to the Sanborn Library," (Milford: EDR (Environmental Data Resources Inc), 2007).
6 "Introduction to the Sanborn Map Collection," http://www.loc.gov/rr/geogmap/sanborn/san4a1.html.

5
very few buildings were actually fire-resistant.7 When a fire struck, it often destroyed
multiple buildings and threatened entire districts. Following the Great Chicago Fire of
1871, which destroyed a third of the city, fire insurance companies increased their efforts
to manage their risk of catastrophic loss by limiting or refusing to insure fire-prone
structures and by avoiding insuring too many properties within a single neighborhood.8
Because insurance underwriters were too busy to personally assess every building they
insured, they began hiring surveyors like D.A. Sanborn to create fire insurance maps of
cities and towns, containing every detail needed to assess each commercial, residential, or
industrial building for the risk of fire. The maps were designed to assist fire insurance
agents in determining the degree of hazard associated with a particular property and
therefore showed the size, shape, and construction of dwellings, commercial buildings,
and factories, as well as fire walls, locations of windows and doors, sprinkler systems,
and types of roofs. The maps also indicate the widths and names of streets, property
boundaries, building use, house and block numbers, the locations of water mains and
their dimensions, fire alarm boxes, and fire hydrants. Sanborn maps are thus an unrivaled
source of information about the structure and use of buildings in American cities.
Although there were other smaller mapping companies who specialized in
producing fire insurance maps, by 1920, virtually every underwriter in the country were
buying maps from the Sanborn Company.9 Sanborn Maps were an essential tool for fire
7 "A Visit to the Sanborn Library."
8 Ibid.
9 Diane L. Oswald, Fire Insurance Maps: Their History and Applications (College Station, Tex.: Lacewing
Press, 1997). 31.
6
insurance companies, allowing underwriters to recognize possible risks based on clear
evidence of the building’s characteristics in particular areas.10
Sanborn maps cover both major urban areas and many smaller cities and towns.
The surveyors documented very specific and in-depth detail of the built environment of
that time. The maps D.A. Sanborn produced provided a wealth of information, such as
building outline, size and shape, windows and doors, street and sidewalk widths,
boundaries, and property numbers. The maps often included details on construction
materials and building use; they also depicted pipelines, railroads, wells, water mains,
dumps, and other features likely to affect the property’s vulnerability to earthquake, fire,
and flood.11
These maps are drawn to scale and color coded to distinguish each building's
construction material--olive for adobe, blue for stone, pink for brick, yellow for wood and
gray for metal. Additionally, there are symbols to record specific details such as sprinkler
systems, fire alarms, steam boilers, elevator details as well as window and door openings.
The Sanborn Maps were updated frequently, usually once a year, sometimes as
often as every six months in rapidly changing large urban areas. The frequent updates
were necessary because the fire-insurance underwriters needed to issue policies based on
the most current facts. For their updates, the surveyors sometimes created completely
new maps. Other times, they pasted their updated information directly onto their existing
maps.12
This updating process, which was necessary at the time for the fire-insurance
companies, proved to be invaluable for modern historians and other professions who use
10 Kim Keister, "Charts of Change," Historic Preservation: Quarterly of the National Council for Historic
Sites and Buildings 45, no. 3 (1993): 47.
11 "Digital Sanborn Maps 1867-1970," http://www.proquest.com/en-
US/catalogs/databases/detail/sanborn.shtml.
12 "A Visit to the Sanborn Library."

7
the Sanborn maps to chart and analyze the change of urban areas over time. The
evolution of cities and towns can be researched through successive surveys with
buildings being built and demolished, with land being used for differing purposes, with
new and necessary businesses growing or diminishing.
Over the years, the Sanborn Company and other institutions with Sanborn map
collections have digitized their map collection. The digitization of the maps increased
their accessibility and thus their popularity. They have become an important reference
source for professionals outside of the insurance business, such as genealogists,
demographers, environmentalists, urban planners, and laypersons.13
The Sanborn Library
contains more than 1.2 million Sanborn fire insurance maps, comprising a detailed visual
and textual record of the structural and industrial history of more than 12,000 American
cities and towns.14
The Library of Congress has the largest public collection of Sanborn
Maps and state, local, and university libraries as well as historical societies, have their
own smaller collections.15
1.3.2 Other uses for the Sanborn maps
Sanborn maps are frequently consulted by historians, urban planners,
genealogists, demographers, preservationist and environmentalists. The Sanborn maps
are used by such a variety of professionals because of the extensive detail they provide
and they are an ideal source to observe change over time in urban areas. The maps can be
used to date historic buildings and structures, to document development patterns in
13 Kenning Arlitsch, "Digitizing Sanborn Fire Insurance Maps for a Full Color Publicly Accessible
Collection," D-Lib Magazine 8, no. 7/8 (2002).
14 "A Visit to the Sanborn Library."
15 Keister, "Charts of Change," 45.
8
districts, and to determine the characteristic of a neighborhood. Other communities or
organizations used Sanborn Maps for their historical preservation efforts.
Today, the largest users of the Sanborn maps are environmental professionals who
access the maps to identify historical environmental conditions that potentially impact the
sites they are investigating.16
Interestingly, the Sanborn maps were not intended to chart
environmental risks but to assist insurance underwriters who needed to know about the
uses and physical attributes of buildings in order to estimate the risk of a fire destroying
an insured property. Environmentalists find value in the Sanborn maps because the
property features which the cartographers mapped because of their fire risk, such as
storage facilities for fuels and chemicals, are clues that can pinpoint the exact locations of
possible environmental issues. The Sanborn Maps also show the historic uses of
properties (a paint supply store, for example), and environmentalists can infer from this
information about potential environmental concerns. By carefully reviewing relevant
Sanborn Maps, environmental professionals conducting a site assessment can track the
historical presence of operations such as gas stations, auto repair shops, underground
storage tanks and industrial sites that may have caused contamination, as well as the
specific operational processes associated with industrial locations.
Genealogists researching old addresses use the Sanborn Fire Insurance Maps to
determine which new house number corresponds to particular old dwellings when a
community or city renumbers. Historians use the Sanborn Maps to locate and identify
neighborhoods and buildings to track changes over time. Urban planners use Sanborn
16 "A Visit to the Sanborn Library."
9
Maps to study the layouts of cities and view the effects of urban expansion and industry,
while demographers study population shifts.17
1.4 Geographic Information Systems
A complete appreciation of historic buildings requires not only a comprehensive
understanding of the building and its history; but also a comprehension of its relationship
to the site and the surrounding communities. These relationships are often defined by
their spatial proximity to each other. Geographic Information System (GIS) is the perfect
tool to highlight the spatial relationships between historical buildings to other historical
buildings and sites, and to the surrounding neighborhoods.
GIS is a computer based system which aids in the collection, maintenance,
storage, analysis, output, and distribution of spatial data and information.18
GIS allows
information that we have always had at our fingertips to be viewed in a different way.
GIS can be considered the merging of cartography, statistical analysis, and database
technology, visualized as a layered map. GIS is currently used in numerous and varied
professions such as operations and maintenance engineers, regional planners, road
engineers, forest managers, oil tank captains, and bank officials.19
GIS allows one to
combine, organize, and layer many different types of data, such as streets, buildings, and
landmarks, in a spatial format to help one gain a better appreciation of a place. GIS can
17 "Using Maps in Genealogical Research," http://www.ancestry.com.
18 Paul Bolstad, GIS Fundamentals : A First Text on Geographic Information Systems, 3rd ed. (White Bear
Lake, Minn.: Eider Press, 2008). 1.
19 Tor Bernhardsen, Geographic Information Systems : An Introduction, 3rd ed. (New York: Wiley, 2002).
26.

10
make very complicated statistical data clearer because it can show the data spatially,
making it much easier to understand.
What makes GIS unique is that it is able to integrate spatial data in the form of
points, lines, polygons, or grid cells, with data about each of these spatial units stored in a
relational database. One of the most fundamental principles of GIS is the layering of
many different datasets for analysis. For instance, a data layer containing road data can
store the individual road names, road widths, and the number of people who drive on that
road daily. GIS is able to make connections between road activities based on spatial
proximity. This information could be used by transportation officials to track traffic
patterns in high density cities. A tree data layer which maps the location of all the trees in
a neighborhood could be used by city landscapers to determine how many trees are
within a 5 mile radius of a development area, how many trees within a 5 mile radius
exceed 20 feet height limit, or how many trees within a 3-mile radius are Red Oaks. An
infinite amount of statistical and relational data can be easily derived using GIS. GIS can
be used to manage forests by finding the bests soils for a specific tree species to grow, or
to analyze the types of vegetation growing in a particular forest and to keep track of areas
that have been cut, burned, or otherwise managed at some point.
GIS plays a significant role in historical preservation. Accurate locational
information is a key factor in the interpretation of cultural resources. The National Park
Service recognizes the significance of spatial data and cultural resource management.
Examining cultural resources within their geographical context provides us with an
alternative perspective, allowing one to see the interaction of resources and larger trends

11
across regions.20
Although historic sites can be considered a single entity, it can be
viewed from a variety of perspectives: as built features, as part of an archaeological site,
as a cultural landscape, or as a part of an existing thriving neighborhood. GIS allows us to
overlap or merge these perspectives to see history from a different vantage point. GIS
technology to map and analyze historical building data is important not only to
preservationists, but to government policy makers and regulators because it provides a
powerful visual tool to assist with decision making and management. The potential of
GIS to visualize historic preservation in a spatial context is exciting and GIS software can
create maps that can enrich the context understanding of a historic building and site.
1.4.1 The Essential Elements of GIS
GIS software provides the tools to manage, analyze, and effectively display and
disseminate spatial data and spatial information.21
GIS allows us to take any real world
object and geographically represent it with these three components: location, shape and
description. The location is the geographic location of the object. The shape is the
geometric representation (polygon, point or line) of the object drawn on the map. The
description is data about object, provided in a database format. The resulting spatial data
is used in GIS to represent any type of real world objects, such as buildings, city blocks,
rivers, and city streets.
Spatial data is a graphic representation of a landscape or of objects that are around
us. There are two types of spatial data: Vector Data and Raster Data. Vector data consists
of points, lines, or polygons. Vector data represent different objects in the landscape. For
20 "Critical Nature of Spatial Data in Cultural Resource Management,"
http://www.nps.gov/history/hdp/standards/CRGIS/spatial.htm.
21 Bolstad, GIS Fundamentals : A First Text on Geographic Information Systems: 14.

12
example, roads on a map can be represented by lines. Buildings can be represented by
polygons of various sizes depending on the size of the building. Trees can be represented
by points or circles. Points would be used if only the location of the tree needed to be
known, not the exact shape.
Raster data is composed of a series of flat squares known as pixels. These pixels
in turn represent a certain property or characteristic of the landscape. Many pixels next to
each other create a raster graphic. A digital image such as an aerial photograph is an
example of one type of raster graphic. Both raster and vector data types are
georeferenced, meaning that the vector or raster exist at a certain location atop the earth’s
surface. The advantage of GIS is its ability to overlay spatial data to produce an accurate
representation of the physical environment at the site.
Attribute data consists of numeric values and text that describe the characteristics
of the spatial data. Attribute data is a database of information about corresponding spatial
data.
Attribute data for a map of roads may include road names, the length or area of
the roads, or even information about the number of cars that travel the road daily or when
it was last paved. If the information can be put into a table, then it can be stored in a GIS
attribute table.
1.4.2 Users of Geographic Information Systems
GIS is an essential tool use by many businesses and government, educational, and
non-profit organizations to help plan, design, engineer, build and maintain information
infrastructures that affects our everyday lives. Many government agencies use GIS to
help in planning and organizing their geographic data.

13
Local and state governments use GIS to keep track of the properties, public
works, roads, and more within their jurisdiction. They use them in environmental
applications, statistical applications and to disseminate information to the public. Police
departments, fire departments and other emergency services use GIS to help in their daily
operations. GIS software can help officials track crime, find the shortest route to
emergencies and more.
Real estate agents and bankers use GIS to track properties, property values, and
tax information. Health care professionals are using GIS to track the spread of disease
and provide wellness information. Communication technology companies use GIS in
planning of their utility expansions. Weather forecasting also uses GIS technologies and a
host of other businesses use it for marketing purposes.
Table 1-1 shows how GIS is used by business, government, education and
science, environment and conservation, natural science, and utilities sectors. This list
reveals just how extensively GIS applications have permeated into our day-to-day lives.

14
Table 1-1. GIS Users22
Business How they Use GIS
Banking Financial analysts employ GIS for targeting their markets by visualizing service needs
Insurance To visualize, analyze, and distribute risk
Logistics Planning the distribution fleet’s activities, route locations, and schedules
Media Analyzing circulation and attracting advertisers, and creating maps used in the advertisements
Real Estate Map-based contact management, investment analysis in large real estate investment trusts
Retail Maintain information about sales, customers, inventory, demographic profiles and mailing lists
Government How they Use GIS
National Government Method to provide public information, to evaluate the results of the U.S. Census, link documents and
image files to map features for an integrated view of information
Local Government Revenue collection, economic development, and public information
Homeland Security Emergency response in the areas of detection, risk assessment, mitigation and prevention, preparedness, response, and recovery
Military Defense Intelligence, terrain analysis, mission planning, and facilities management
Fire/Emergency Medical
Services/Disaster
Plan for emergency response, determine mitigation priorities, analyze historical events, and predict future
events
Law Enforcement Planning and event modeling, tactical and strategic planning, and incident mapping
Health Epidemiological and public health monitoring, geographically track public health indicators, identify
disease clusters, and explore sites of environmental risk.
Transportation Insight for networking planning and analysis, vehicle tracking and routing, inventory tracking, and route planning analysis
Education and Sciences How they Use GIS
Research Helps researchers model real world, classify & observe phenomena, and predict changes over time
Libraries and Museums Creates interactive maps for museum exhibits that help visitors explore people, places, and events
K-12 Education Helps learners of all ages grasp the ways in which geography matters
Higher Education Opened up employment opportunities. More than 3,000 colleges and universities have developed course
and certificate and degree programs in GIS
Environment & Conservation How they Use GIS
Water Habitat, wetland, and water quality mapping and planning
Oceans Data from oceans and seas to represent near-shore and deepwater phenomena such as current, salinity, temperature, biological and ecological mass, and density
Land Digital maps of sites linked to a relational database that stores topography, baseline data, site
documentation, and aerial digital photography
Wildlife Enables the study of animal populations at a variety of scales as well as analysis tools to study habitat corridors, migration patterns
Vegetation Mapping and inventorying vegetation across landscapes to better understand threatened and endangered
species inventories for scientific and managerial applications
Natural Resources How they Use GIS
Agriculture Site-specific spatial analyses of agronomic data, forecast crop yields and determine fertilizer spreads for
farmers
Forestry Managing timber resources and maintaining sustainable forest management
Mining Terrain and ore body modeling, exploration, drilling, mine planning, reclamation, and rehabilitation mapping
Oil and Gas Resource analysis for determining where to drill, route a pipeline, or build a refinery
Utilities How they Use GIS
Power Management Routing of energy is highly dependent on geographic information, used for network design and outage
management
Electricity Leverage facilities management to respond to storm-caused outages
Gas Gas source and physical pipeline management depend on GIS for every detail from stations and pipe
pressures to valves and pipe diameter.
Telecommunications Analyzing relationships among signal coverage, test results, trouble tickets, customer inquiries, revenues, and gap analysis
Water and Wastewater Use high resolution maps to detail the location of its underground pipelines, watersheds, reservoirs, and
hydroelectric facilities
22 "Who Uses GIS?," http://www.gis.com/content/who-uses-gis.

15
1.4.3 ArcGIS Software
The GIS software utilized for this study was ArcGIS Version 10.1. ArcGIS is a
software suite consisting of a group of geographic information system (GIS) products
produced by Environmental Systems Research Institute, Inc. (Esri), a company based in
Redlands, California. Esri is a privately held global company founded in 1969 by Jack
and Laura Dangermond.
ArcGIS is a system for working with maps and geographic information. It is used
for creating and using maps; compiling geographic data; analyzing mapped information;
sharing and discovering geographic information; using maps and geographic information
in a range of applications; and managing geographic information in a database. The
system provides an infrastructure for making maps and geographic information available
throughout an organization, across a community, and openly on the Web.
ArcMap is the main component of Esri’s ArcGIS suite of geospatial processing
programs and is used primarily to view, edit, create, and analyze geospatial data. ArcMap
allows the user to explore data within a data set, symbolize features accordingly, and
create maps. ArcMap users can create and manipulate data sets to include a variety of
information. For example, the maps produced in ArcMap generally include features such
as north arrows, scale bars, titles, legends, etc. The software package includes a style-set
of these features.
The ArcGIS suite is available at three license levels: Arc View, ArcEditor, and
ArcInfo. Each step up in the license provides the user with more extensions that allow a
variety of querying to be performed on a data set. ArcInfo is the highest level of
licensing, and allows the user to use such extensions as 3D Analyst, Spatial Analyst, and
the Geostatistical Analyst.

16
Maps created and saved within ArcMap will create a file on the hard drive with an
.mxd extension. Once an .mxd file is opened in ArcMap, the user can display a variety of
information, as long as it exists within the data set. At this time the user can create an
entirely new map output and use the customization and design features to create a unique
product. Upon completion of the map, ArcMap has the ability to save, print, and export
files to PDF.
The geographic information that is loaded into ArcMap can be viewed in two
ways: data view and layout view. In data view, the user can interact with the geographic
information presented, and the map elements are hidden from view. Most projects begin
in this view, and continue to the layout view for final editing and production. While in the
layout view, the user can incorporate a number of useful features such as scale bars and
north arrows. These elements are crucial to map-making, and provide clients with
appropriate reference information.
ArcGIS also offers two 3D visualization applications in which to work—
ArcGlobe and ArcScene, which allows display, analyze and animation of 3D or 2D data
in a 3D space.
1.4.4 GIS vs Google Earth
Google Earth is sometimes confused with GIS. Geographic Information system
(GIS) integrates hardware, software, and data for capturing, managing, analyzing, and
displaying all forms of geographically referenced information. GIS also allows us to
view, understand, question, interpret, and visualize data in many ways that reveal
relationships, patterns, and trends in the form of maps, globes, reports, and charts.

17
Google Earth is an online virtual globe, map and geographical information
program called Earth Viewer 3D, and was created by Keyhole, Inc, a company acquired
by Google in 2004. It maps the earth by the superimposition of images obtained from
satellite imagery, aerial photography and GIS 3D globe.23
The main difference between
the two is that GIS is primarily a platform to analyze data and Google Earth is a platform
to display data.
23 "Google Earth," http://en.wikipedia.org/wiki/Google_earth.

18
Chapter 2. Historic Preservation - Sanborn Maps and GIS
Utilizing the functionality of GIS, historical data from the Sanborn maps can
produce detailed histories of past neighborhoods. A time series of Sanborn maps gives a
clear visual timeline of changes in a community. More difficult to see are answers to
questions such as the underlying reasons as to how and why a community has changed, or
during what time periods were the changes most significant. GIS can provide this type of
analysis by carefully scrutinizing all the bits of information on the maps and correlating it
with other data in order to glean out new information for interpreting the historical spatial
patterns.
Geographic Information Systems basically take data and plot it on maps. By
mapping the data it is often much easier to spot patterns or trends. GIS is an important
tool to uncover information buried within the Sanborn Fire Insurance maps. Different
variables can be considered, such as land use, construction materials, building heights,
etc., and changes charted over time.
Cultural resources are separated organizationally depending on the type of
resource: archeological, building, ritual, etc.24
This results in a fragmentary look at
cultural resources where each group is cared for by different disciplines and managers.
For resource managers, planners and decision-makers, the current challenge is trying to
make sense of a battery of information from multiple sources because there is no
umbrella organization of methodology for linking all the various cultural resource
databases together. In this case, geography itself must be the underlying key that
24 "Critical Nature of Spatial Data in Cultural Resource Management".
19
integrates these various databases – a single location becomes the key between different
disciplines.25
2.1 Use of Sanborn Maps for Historic Preservation
The Sanborn Fire Insurance maps have a great deal to offer the field of Historic
Preservation because they are a rich and detailed source of historical data and contain
information that is fundamental to reconstructing past buildings and places. The Sanborn
maps provide abundant information about buildings and neighborhoods and their
relationship to the surrounding area. Although the maps were initially intended to assist
fire insurance assessors, they have transcended their original purpose and are now
regularly used by anyone interested in seeing urban history unfold in the Sanborn map’s
rich wealth of detail. The types of information included in the maps were designed to
specifically assist Fire Insurance companies to properly insure buildings without actually
visiting the sites. It was fortunate this was done because this same type of information has
proven invaluable to historians and preservationists.
The Sanborn Fire Insurance maps are particularly valuable because they provide
not only contextual information, but very specific information about the building that is
typically not available anywhere else (such as the footprint of each building, the size,
shape and construction materials, heights, and function of structures, location of windows
and doors). The maps often indicate construction details (for example, steel beams or
reinforced walls) and differentiate building materials (wood, brick, metal or stone) using
a color-coded shading system. The maps also show street names, street and sidewalk
widths, property boundaries, building uses, and house and block numbers.
25 Ibid.

20
A Sanborn survey of an area includes the overall town map (index sheet), legend,
street listings, and scaled neighborhood drawings which typically consisted of four to six
city blocks drawn on one map sheet. A typical index sheet includes an overview of the
entire area mapped in the set, an index of streets and prominent local sites, a legend and a
short report of subjects which would be of interest to Fire Insurance Companies, such as
the location and construction status of water towers, pumping stations and Fire stations,
and population statistics and economy data.
The original Sanborn Maps were hand-drawn and colored. The building’s
construction materials were distinguished by its color—olive for adobe, blue for stone,
pink for brick, yellow for wood, and gray for metal.26
Figure 1 shows a color-coded index
map of the Honolulu area in 1914. The color map provides a striking image of the fabric
of the neighborhood, visibly highlighting the concentration of businesses and residential
areas on the map. The pink shading indicates brick buildings and the yellow shading
indicates framed (wood) buildings. Commercial buildings were typically larger and built
with brick, and residential buildings were smaller and built with wood. Figure 2 is an
example of a legend for the Sanborn Maps produced in 1940. The Sanborn legends
explained the color coding system and the various symbols used on the maps. The
symbols allowed the map surveyors to clearly convey complex information about a
building’s risk for fire.
26 Keister, "Charts of Change," 45.

21
Figure 1. Color Sanborn Fire Insurance Index Map of Honolulu, 191427
27 "Congested District of Honolulu," in Sanborn Fire Insurance Maps, 1914 (University of Hawaii at
Manoa Digital Map Collection).

22
Figure 2. Sanborn Fire Insurance Company Color-Coded Legend28
28 "The Key to Symbols," in Description and Utilization of the Sanborn Map (New York: Sanborn Map
Company, 1942), 2.

23
Depending on the date the Sanborn maps were issued it is possible it could show a
building’s original size and construction details, before subsequent alterations and
additions that are almost inevitable for an old building. Other drawings on the same map
can be studied to learn about the neighborhood, and thus place the building into a context
that probably would not be gained from a city directory or even from tax records. The
Sanborn Map Company updated their maps every few years. In some cases, seven or
eight different editions of the maps are available, showing both urban growth and even a
limited amount of migration trend information.
The Sanborn maps are a valuable historical tool for a wide range of professionals,
such as urban specialists, social historians, architects, geographers and planners, with
each profession gleaning their own specific data from the Sanborn maps. Genealogists,
for example, use the maps to pinpoint the houses and neighborhoods of their ancestors.
Planners use the maps to decipher the layouts of urban living. Environmentalists look for
indications of natural features erased long ago and of businesses that might have
produced toxic waste. Urban geographers use the maps to re-create the growth and
evolution of cities and demographers use the maps to examine population shifts.
But perhaps no one has found more vital, varied, and constant usefulness of
Sanborn maps than preservationists. Historic preservation and the fire-insurance industry
both focus on characteristics of individual buildings. Sanborn maps were designed to
efficiently provide information, and they often prove to be the fastest, simplest, and most
graphic way to learn details about a building.
In one city, for example, a number of Sanborn maps may have been drawn over a
span of time covering the last part of the nineteenth and early twentieth centuries, a
24
period of tremendous urban growth. The Sanborn maps together with other historical
records such as old photographs and property records can be a critical tool for studying
the growth of an area. By comparing the different sets of maps, a researcher could tell
when brick structures began to replace frame shops, when specialty stores appeared and
general stores declined, and when the commercial area started to expand in what had
previously been a residential area. For preservationists, the wealth of information gleaned
from these maps can help in the study of urban growth and change in American cities and
in the identification and justification of historic districts.
2.2 Case Studies - Sanborn Fire Insurance Maps
The following three case studies all utilized the Sanborn Fire Insurance maps for
their research but in different ways. The first case study parallels the methodology of this
research document the most. The other two case studies used the Sanborn maps in
another way--one focused on a small area and the other only extracted specific data from
the maps. All three show how different researchers were able to extract what they needed
from the Sanborn maps.
2.2.1 Vieux Carré Commission, New Orleans, LA
In 1999, the Vieux Carré Commission, a state agency in New Orleans which
oversees the historic French Quarter district, purchased historic Sanborn maps of the
French Quarter for the year 1885. The Commission’s goal was to expand its collection of
historic information on the French Quarter. The digital versions of the maps could allow
the commission to study changes in the area and identify patterns in urban development.
They commissioned a study with the Sanborn Map Company to digitize the historic
Sanborn map building footprints for this year.
25
In a paper published in the Journal of GIS Archaeology, Volume 1, Joseph W.
Berry, a Senior Proposal Coordinator for the Sanborn Map Company, discussed the
methodology for this effort. The first step was to determine a base map to use as the base
layer to overlay the Sanborn map upon. A proper base map is important because the
Sanborn map would be georeferenced or aligned with this reference map. If the base map
had errors, then all subsequent georeferenced data would be incorrect. In this study, they
used the base map provided by the GIS department within their City Planning Office.
Most cities or states have a department dedicated to GIS data and is the repository for all
the official GIS layers for their area. For the state of Hawaii, this department is the GIS
Program under the Office of Planning. For the City and County of Honolulu, the GIS
department is the Honolulu Land Information System (HoLIS), under the Department of
Planning & Permitting.
According to Berry, the most difficult part of this task was the complexity of the
georeferencing because spatial accuracy is difficult to ensure.29
Once the scanned maps
were georeferenced to the base map, the building footprints were digitized on the
computer screens using a “heads-up” digitizing technique and the associated attributes for
each building were entered into the GIS database. Heads-up digitizing is the process of
creating the digital building footprints manually, straight off a computer screen, using a
mouse or digitized cursor. The digitization of the building footprints essentially means
tracing the outline of the building using GIS software. This is an extremely tedious
process but must be accomplished as accurately as possible. There are a number of
29 Joseph W. III Berry, "Historic Sanborn Maps in the Digital Age: City of New Orleans," Journal of GIS
Archaeology, Volume I(2003),
http://www.esri.com/library/journals/archaeology/volume_1/historic_maps.pdf.
26
common errors which can occur when using this technique. Although the report of this
case study did not address data entry errors, this should not be overlooked. A more
detailed discussion of the common errors is addressed in the Lessons Learned section.
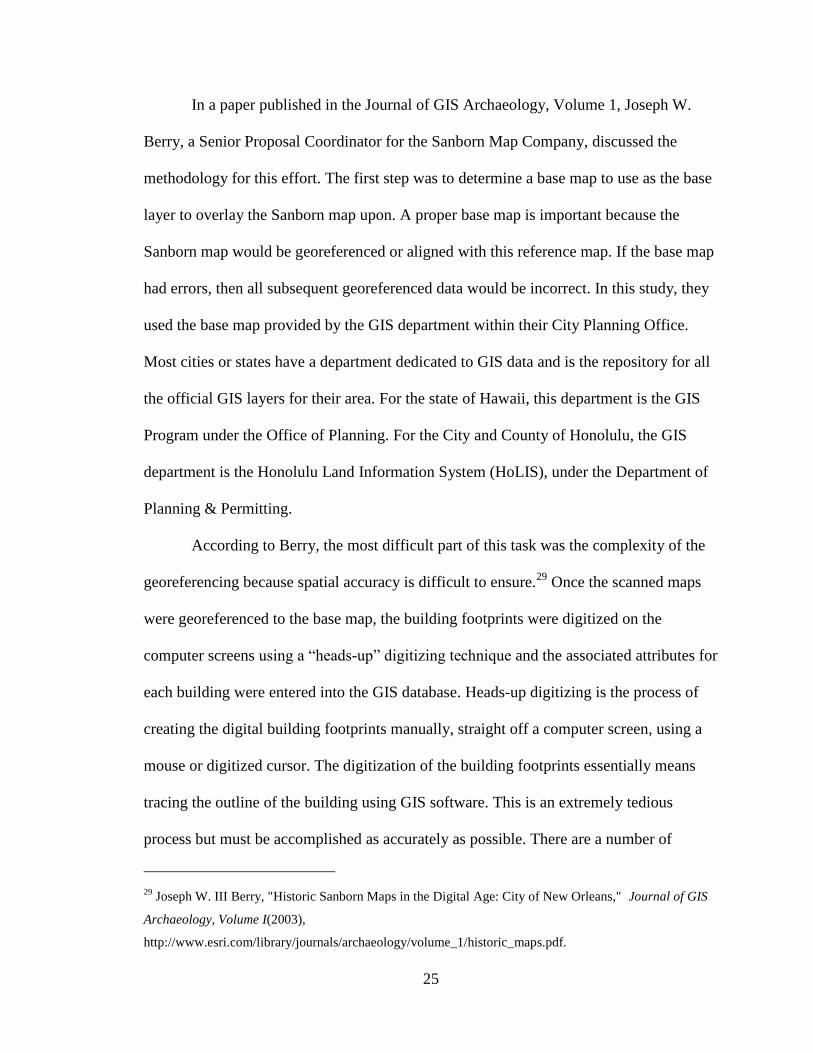
Figure 3 and Figure 4 shows the resulting digital building footprints of the French
Quarter from the Sanborn Maps published in 1885.
Figure 3. Digital Building Footprints Shapefile, From Sanborn Maps Published in
1885, French Quarter, New Orleans, Louisiana30
30 Ibid.

27
Figure 4. Digital Sanborn Building Footprints, French Opera House circa 1885,
French Quarter, New Orleans, Louisiana31
Each building footprint, called a polygon, contains specific building information
called attributes. The types of attribute information captured from the original map
include: number of stories above ground, building height, building use, construction
material, address and floor construction information.
Many historic districts could be mapped in this same way to provide a window
into the conditions of an area from a past time period. This report did not show any
discussion of the attribute data or whether they were analyzed in any way. Research to
determine the current status of this digitization project in New Orleans proved fruitless.
Other than the initial proof-of-concept study, the commission has not done any further
analysis studies on these Sanborn maps. In a telephone interview, the Vieux Carré
Commission staff Historian could not recall the study and was not aware of any past,
present or future Sanborn map georeferencing projects. The Historian confessed that in
the wake of the Katrina disaster and recent budget cuts and reorganizations, their
31 Ibid.

28
priorities are on other issues. Email contact with the author of the paper yielded similar
results. Although the Vieux Carré Commission did not continue this project past a proof-
of-concept study, the methodology on how they accomplished this digitization process
was very valid and can be used for future digitization projects.
2.2.2 Blandwood Mansion, Greensboro, NC
Blandwood, the home of former North Carolina Governor John Motley
Morehead, was constructed in 1844 by the nationally renowned architect Alexander
Jackson Davis and is considered the oldest standing example of Italianate architecture in
the United States. This home was nominated to the National Register of Historic Places
in 1970 and also named a National Historic Landmark in 1988. 32
William Robinson’s
Master’s Thesis, “Archaeological Data Management and Analysis at Blandwood
Mansion” discusses data resulting from an archaeological excavation held within the
Blandwood property in 2008.33
Robinson’s thesis involved the creation, organization, and
analysis of digital archaeological data within a GIS and Microsoft Access relational
database for the results of excavations at the Blandwood Mansion. A major goal of his
study was to gain further understanding about the periods of buildings within the property
and to find evidence which explains the functions of each building. Robinson used old
photographs, maps and schematics to gain a clearer picture of Blandwood’s historical
landscape. To show the change of the site over time, Robinson used four Sanborn Fire
Insurance maps from years 1907, 1919 and two from 1925. The Sanborn maps provided a
32 Preservation Greensboro Incorporated, "Blandwood: Where the Old South and New South Meet,"
http://www.blandwood.org/blandwood.html.
33 William R. Robinson, "Archaeological Data Management and Analysis at Blandwood Mansion"
(University of North Carolina at Greensboro, 2010).

29
detailed look into the structural makeup of the buildings and surrounding Blandwood
estate.
As this study encompasses a relatively small area, georeference accuracy is not as
important. Robinson used the four corners of the existing main house structure as the
main anchor points of reference. Normally, this would not be a good idea because
reference points should be widely spaced out, but since the area of interest did not extend
beyond the boundaries of the Blandwood property, the house served as the best historical
reference point. Robinson also pointed out that having the maps scale to the known
corners of the house served to test the accuracy of the overall map scale and helped with
the comparison of the building footprints presented by each map.34
Robinson found discrepancies between the 1907 and 1919 maps relative to the
distances between buildings. He attributed the errors due to the map creation process
rather than the georeferencing process. Errors on such a scale is not surprising since the
maps were not designed to act as detailed building blueprints, but were used to
approximate size, relative relationship to surrounding structures and other pertinent
attributes of each structure for fire insurance assessment.35
When conducting an
archaeological study, discrepancies in the building footprints can reveal a hidden
foundation or possibly a heretofore unknown building.
Robinson utilized other Sanborn maps to show the urbanization that eventually
surrounded the farmstead. The maps illustrate how the land surrounding the Blandwood
property changed from large tracts to the smaller urban lot present today. Aerial images
34 Ibid., 17.
35 Ibid., 19.

30
covering different time periods were also used, which aided in the interpretation and
identification of many of the features identified throughout the duration of the
excavation.
Figure 5 illustrates the spatial differences of the footprints from three time
periods. There were discrepancies in location between the building footprint and the
excavated features, but despite these errors, the maps were able to date the construction
of features which could later serve as a helpful benchmark for interpreting artifact
remains associated with the features and their role in the overall site.
Figure 5. 1907, 1919, and 1925 Footprints determined from Sanborn Fire Insurance
Maps36
36 Ibid., 66.

31
2.2.3 Mapping the Industrial Archeology of Boston
In a pilot project initiated in September of 2001, the Boston Public Health
Commission, in collaboration with the Department of Urban Studies and Planning at the
Massachusetts Institute of Technology, developed a methodology for superimposing
historical and present-day industrial land use data layers with demographic information
and public health data. The goal was to identify and to possibly define a historical
relationship between present-day public health concerns and past practices of land use
within an urban environment. Historical data layers showing location and type of
industries known to emit hazardous substances were interpreted from Sanborn Fire
Insurance maps in the years 1888, 1962 and 1968.37
This study used the Sanborn Fire Insurance maps as their primary source of
historical data as they provided detailed and comprehensive information about the type of
industry present at the time and its inferred land use, building typology, building
footprint, and limited physiographical details about the landscape such as the presence of
bluffs and streams.38
This study used a heads-up digitizing process but did not trace
building footprints because this study was more focused on the nature and scale of
industrial activities at specific sites rather than information about building sizes and
types. Each building was translated into point data, which included attribute data of the
name of the building and the type of facility, along with a hazard ranking. They utilized a
GIS tool to perform a “spatial filtering” to add up the hazard rankings of facilities within
37 Kris Kolodziej, Raul P. Lejano, Chikako Sassa, and Jalal Ghaemghami Sushila Maharjan, and Thomas
Plant, "Mapping the Industrial Archeology of Boston," URISA Journal 16, no. 1 (2004).
38 Ibid., 6.

32
a Census tract and displayed the results on thematic maps, identifying areas of potential
risks to public health.
This research study developed a systematic methodology for documenting and
analyzing the industrial ecology of past industrial activities, in an effort to better
comprehend present-day environmental risk. The investigators of this project explored
various uses of such a tool to conduct research and design health intervention programs in
a way that enables them to target the zones of the greatest concern. The most significant
outcome of this study is that communities can utilize this mapping tool as a community
information system in an attempt to mobilize around issues of health and potential risk.
Developers and communities, in partnership, can use the mapping to make better
investment decisions and to allocate funds more aggressively for cleanup. In many ways
this methodology can be applied to documenting and analyzing historical building
patterns and using that knowledge to predict future building patterns. This study showed
the value of digital cartography when combined with a spatial database at enhancing our
interpretation of the past and of improving the possibility of changing the future.
2.3 Use of GIS for historic preservation
In the context of historical districts, GIS clearly can play an important role in the
research and understanding of a historical area. Anne Knowles, in her book, “Placing
History: How Haps, Spatial Sata, and GIS are Changing Historical Scholarship,” notes
that archaeologists were among the first scholars in the humanities to use GIS and global
positioning system (GPS) methods, beginning in the early 1980s.39
Their familiarity with
39 Anne Kelly Knowles and Amy Hillier, Placing History: How Maps, Spatial Data, and GIS are Changing
Historical Scholarship, 1st ed. (Redlands, Calif.: ESRI Press, 2008). 7.

33
field methods and long-standing interest in the relationship between terrain and human
settlement drew archaeologists to digital tools that could improve the accuracy of site
measurements and locate artifacts more precisely.
GIS can also be a tool of analytical thinking and visualization by using it as an
educational aid to engage history students. GIS can add value to education because it can
teach valuable analytical and problem-solving strategies and emphasize visualization as
an approach to process large amounts of information. Through GIS, students also learn to
develop skills for collecting, assessing and comprehending a wide range of information.
GIS can uncover the truth about certain historical events that are taken for
granted, like the Dust Bowl. Many consider the ‘Dust Bowl’ a unique period in history,
largely due to the breaking of the surface of agricultural land. Yet, historical records and
GIS analyses show several periods previous to the 1930s where dust and winds were
blowing across the US mid-west in equal or greater amounts. Getting to the ground truth
allows us to make reasonable assumptions about the past. As to the reason why the Dust
Bowl seems to have such a prominent exposure, research suggests it had a lot to do with
the media of the day, often wanting to get people into the west and not frightening them
off. 40
GIS proves to be a valuable tool for revealing the “truth” and addresses the
relevant issues between GIS as a technology and historical endeavor as a discipline.
History was documented quite differently before geographic science. Geographic science
tools bring to the table a lot of fascinating new technology to help make historical studies
clearer or more understandable.
40 Ibid., 96.

34
2.4 Case Studies - GIS
The following case studies are examples of how GIS is used for historical
mapping. The common theme among the case studies here is how GIS can used as a base
to connect disparate pieces of information for a historic area in addition to being the
spatial and analytical powerhouse of maps.
2.4.1 Mapping the Medieval Urban Landscape
“Mapping the Medieval Urban Landscape” was a two-year project funded by the
Arts and Humanities Research Council (AHRC).41
The project was completed at the end
of May 2005. This project was concerned with new ways of analyzing medieval urban
landscapes. This project explored the design and planning of towns in the Middle Ages.
This required the careful study of the surviving layouts of medieval towns, looking in
particular at their shape and form. They combined survey data using Global Positioning
Systems and the analysis of these data in a GIS. They used GIS to amalgamate different
sources of spatial data for each of their twelve study towns. GIS thus provided an
analytical tool which enabled them to examine the morphological make-up of a town, the
shape of its component features. GIS also provided a means of visualizing the data and
representing the urban landscape cartographically, in three dimensions. This project
resulted in an interactive online atlas of medieval towns--a digital resource for a wide
public audience. GIS provides a means of visualizing these data and representing the
urban landscape cartographically, in three dimensions.
41 "Mapping the Medieval Urban Landscape," http://www.qub.ac.uk/urban_mapping/.

35
A georectified plan, digitized from historical Ordnance Survey mapping, shows
the layout of each of the twelve study towns. The features selected are the towns’ streets
and plots, as well as key medieval buildings such as castles and churches.
2.4.2 Mapping Medieval Chester
“Mapping Medieval Chester” is a project that brings together scholars working in
different disciplines such as geography, archaeology and history to explore how material
and imagined urban landscapes construct and convey a sense of place-identity.42
The
focus of the project is the city of Chester in Cheshire, England and the identities that its
inhabitants formed between 1200 and 1500. A key aspect of the project is to integrate
geographical and literary mappings of the medieval city using cartographic and textual
sources and using these to recognize how urban landscapes in the Middle Ages were
interpreted and navigated by local inhabitants. A key goal of the project was to develop
and use technology in innovative ways.
This project used GIS to create a map of Chester as it was in 1500 and as a means
of widening access and public interest in Chester’s medieval past and in medieval urban
studies generally by linking literary and cartographic sources in digital media.
2.4.3 Historical GIS: Boston 1775
This project, created by Charlie Frye, Chief Cartographer and manager of the
Mapping Center and Cartographic Projects Group at ESRI, is a GIS map of colonial
Boston at the time of the American Revolution in 1775 using only maps published from
that period. The goal was to create as a complete picture as possible of Boston’s
environment in 1775. Another goal was to cite every feature to a source document. To
42 "Mapping Medieval Chester," http://www.medievalchester.ac.uk/index.html.

36
that end, information included notes about which sources were used to determine whether
that feature existed in 1775, the name of the feature, and anything else interesting about
that feature.
The map began as a research project about the Battle of Bunker Hill. The database
was then expanded to include all of Boston, and the surrounding coastline. Between 400-
500 hours of GIS work was expended researching, drawing and creating data over a four-
year period. Nearly every place and name on the map is shown based on it appearing in a
document published prior to 1784.
The most interesting facet of this study is the use of a citation methodology to
connect the GIS data to the bibliographic information. The information in the GIS
database was cited in much the same way that facts and ideas are cited in academic
literature. The result is accountability in mapping. In this case study, a Citation Data
Model (CDM), an ArcGIS proprietary data base schema designed to manage spatial data
in ESRI’s ArcGIS software was utilized to manage the reference data. A CDM stores and
relates bibliographic information to the GIS features on the map. These bibliographic
sources range from traditional scholarly texts and journal articles to primary documents
such as maps, field notes, and manuscripts. Once these sources are linked to the feature in
GIS, those features can be queried or shown based on their bibliographic characteristics.
For instance it is possible, with CDM, to derive a list of all the features in the GIS that a
particular source was used as a basis for citation.
A side-benefit of implementing the CDM is that it enforces rigorous organization
of data in order to ensure fidelity between features and sources. That in turn results in the
formation of logical connections between features or places in time. Once historical data

37
is entered into a geodatabase, it can easily be sorted and cross indexed to quickly find
connections and inconsistencies.
Figure 6. City of Boston, c. 1775
43
43 Charlie Frye, "Historical GIS Template: Boston 1775,"
http://blogs.esri.com/support/blogs/mappingcenter/archive/2009/05/28/historical-gis-template-boston-
1775.aspx.

38
Figure 7. Samples of Historic Boston Maps Used
44
44 Ibid.
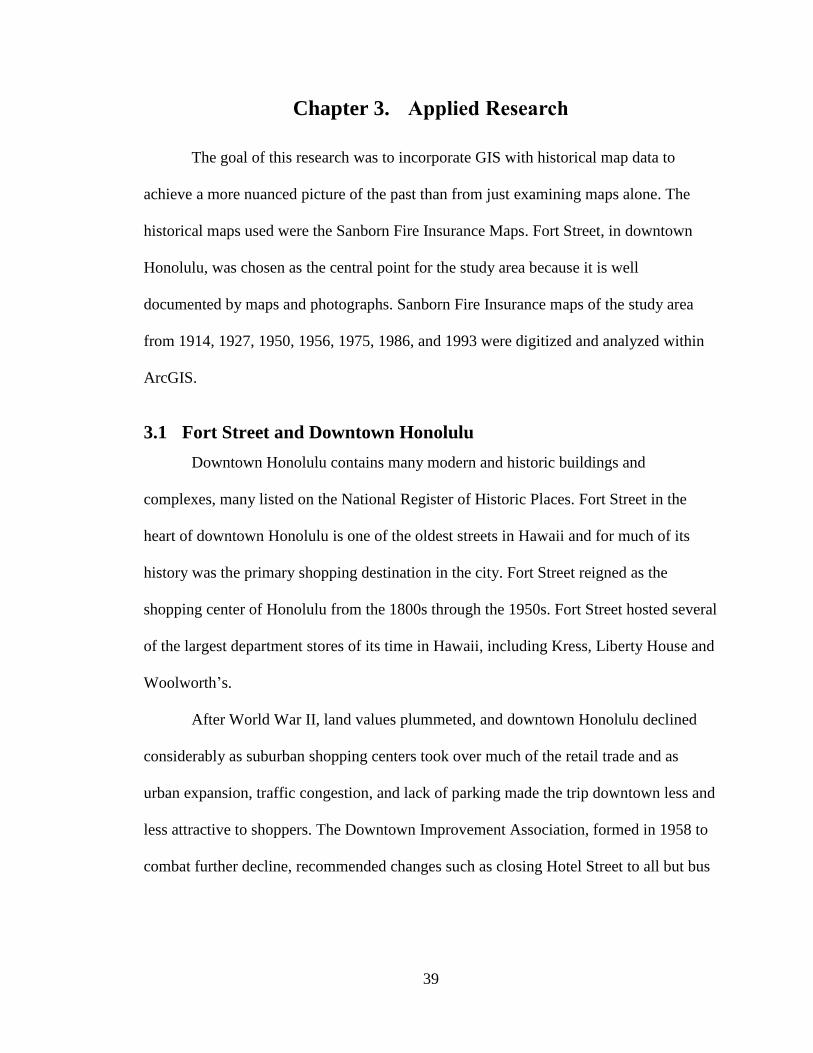
39
Chapter 3. Applied Research
The goal of this research was to incorporate GIS with historical map data to
achieve a more nuanced picture of the past than from just examining maps alone. The
historical maps used were the Sanborn Fire Insurance Maps. Fort Street, in downtown
Honolulu, was chosen as the central point for the study area because it is well
documented by maps and photographs. Sanborn Fire Insurance maps of the study area
from 1914, 1927, 1950, 1956, 1975, 1986, and 1993 were digitized and analyzed within
ArcGIS.
3.1 Fort Street and Downtown Honolulu
Downtown Honolulu contains many modern and historic buildings and
complexes, many listed on the National Register of Historic Places. Fort Street in the
heart of downtown Honolulu is one of the oldest streets in Hawaii and for much of its
history was the primary shopping destination in the city. Fort Street reigned as the
shopping center of Honolulu from the 1800s through the 1950s. Fort Street hosted several
of the largest department stores of its time in Hawaii, including Kress, Liberty House and
Woolworth’s.
After World War II, land values plummeted, and downtown Honolulu declined
considerably as suburban shopping centers took over much of the retail trade and as
urban expansion, traffic congestion, and lack of parking made the trip downtown less and
less attractive to shoppers. The Downtown Improvement Association, formed in 1958 to
combat further decline, recommended changes such as closing Hotel Street to all but bus

40
traffic and turning Fort Street into a pedestrian promenade.45
The opening of the Ala
Moana Shopping Center in 1959 led to an exodus of Fort Street’s retail businesses, even
as high rise office buildings began sprouting up around Fort Street. In 1968, the City &
County of Honolulu converted Fort Street into a pedestrian mall as a part of a long range
effort to improve the downtown experience for pedestrians and to compete with Ala
Moana Center.46
During the business week, Fort Street Mall is bustling and teeming with office
workers and shoppers. After business hours and on the weekends, the Mall becomes
underutilized and transforms into a deserted place like most of the downtown business
area. Recently Macy’s, the last major department store in downtown, closed down. Fort
Street may undergo yet another change as it tries to recover from the loss of this anchor
store.
3.1.1 Fort Street Area Description
Fort Street Mall is eight city blocks long and runs in a Mauka-Makai direction
beginning at S. Kukui St. near Central Intermediate School and ends at Aloha Tower
Marketplace. Figure 8 is an aerial photo of the downtown area, with Fort Street Mall
highlighted in yellow and the study area boundaries bordered in red. Fort Street Mall has
a mix of high rise office buildings and historical structures. Figure 9 depicts the current
building footprints of the structures in the downtown area.
45 Edward Greaney, "Crossroads," Honolulu Advertiser, March 20, 1958.
46 "Fort Street Mall," http://www.fortstreetmall.org/.
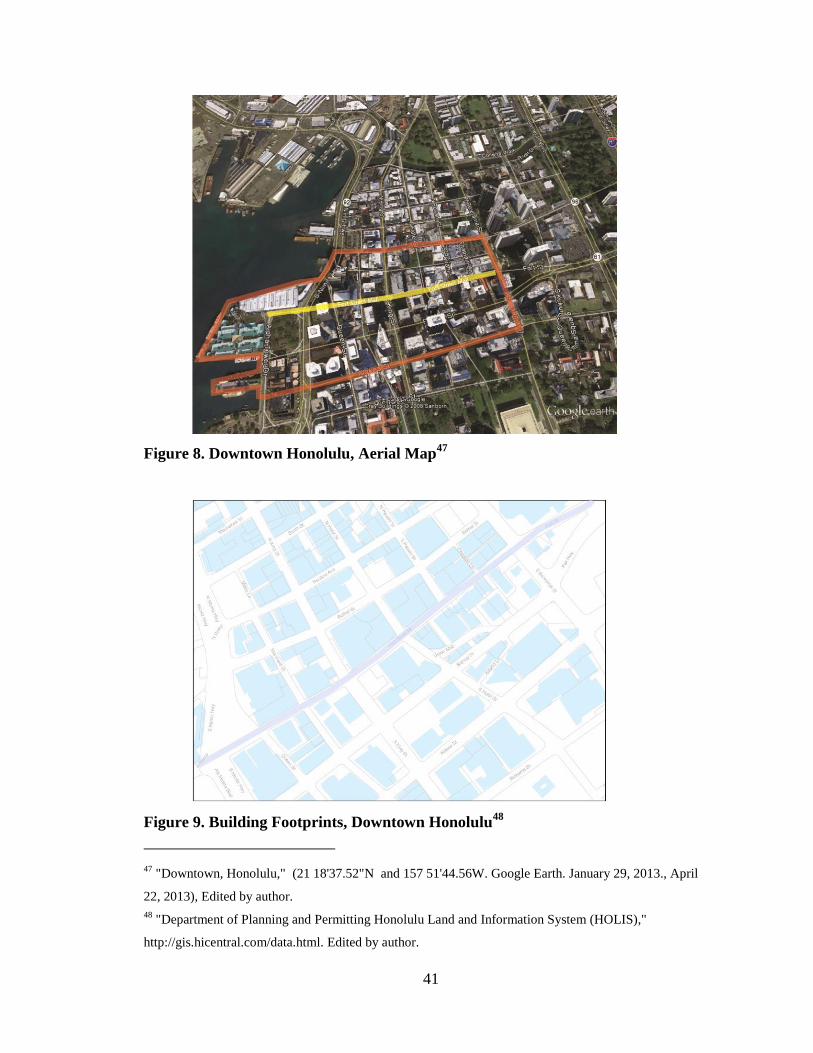
41
Figure 8. Downtown Honolulu, Aerial Map47
Figure 9. Building Footprints, Downtown Honolulu48
47 "Downtown, Honolulu," (21 18'37.52"N and 157 51'44.56W. Google Earth. January 29, 2013., April
22, 2013), Edited by author.
48 "Department of Planning and Permitting Honolulu Land and Information System (HOLIS),"
http://gis.hicentral.com/data.html. Edited by author.

42
3.1.2 Historical Buildings on Fort Street Mall
Many historical buildings are located on Ft. Street Mall.
Table 3-1 summaries a few of the historical buildings located on Fort Street and
Figure 10 shows the locations of these buildings. These buildings contribute to the “sense
of place” of downtown Honolulu.
Historic Buildings Year Built Address
1 Central Fire Station 1934-5 104 Beretania Street
2 The Cathedral of Our Lady of Peace 1843 1183 Fort Street
3 Sacred Hearts Convent School 1901 1159 Fort Street
4 Pantheon Block
(Altered c. 1955 and c. 1968)
1911
1102-1122 Fort Street
5 The McCorriston Building 1914 1107 Fort Street
6 Judd Building 1899 111 Merchant Street
7 Stangenwald Building 1901 119 Merchant Street
8 C. Brewer & Co. 1930 827 Fort Street
Table 3-1. Historic Buildings on Fort Street in Downtown Honolulu

43
Figure 10. Location of Historical Buildings on Fort Street
49
3.2 Creation of GIS Maps
The digital maps for the downtown Honolulu Sanborn Map study were created
using ArcMap 10.01. The process for creating the GIS maps area involved first obtaining
the correct Sanborn Fire Insurance maps for the study area, preparing the maps for
georeferencing, executing the georeferencing process, creating map mosaics, digitizing
the data and populating the database with the information from the maps. Each process is
explained further in this section.
49 Ibid. Edited by the author

44
3.2.1 Gathering the Maps
From its original paper sheet form, many Sanborn Fire Insurance Maps have
either been digitally scanned or put on microfilm. In Hawaii, paper, microfilm and digital
copies of Sanborn Fire Insurance Maps are held at the University of Hawaii Manoa
Library, the Hawaii State Archives, the Hawaii State Library and the Bishop Museum.
Each location differs as to the extent of their map collection. The most complete digital
collection is available through the ProQuest Information and Learning microfilm
collection, which can be accessed through the University of Hawaii Hamilton Library
website. ProQuest's Digital Sanborn Map collections were created from the Chadwyck-
Healey microfilm collection, which had, in the early 1990s microfilmed the maps from
the Library of Congress collection.50
Those microfilm copies, including the ones for
Hawaii, are in black and white. A few color maps in their original hardcopy form are
located at the University of Hawaii Hamilton Library Map Collection, the Hawaii State
Archives and the Bishop Museum. The color maps are obviously preferable to the black
and white versions. Unfortunately, they are not all widely available in digital form. The
University of Hawaii has scanned color copies of their 1914 Sanborn maps available by
request.
The first step for determining which maps to use is to refer to the Sanborn Index
Map for the specific year. Figure 11 is the 1927 Sanborn Fire Insurance Index Map for
Honolulu. The 1927 series of Sanborn Fire Insurance Maps for Honolulu were divided
into three volumes. The Central Honolulu area is part of Volume 2. The map numbers for
a specific area are indicated on the index maps. Figure 12 is a zoomed in detail of the
50 "Introduction to the Sanborn Map Collection".
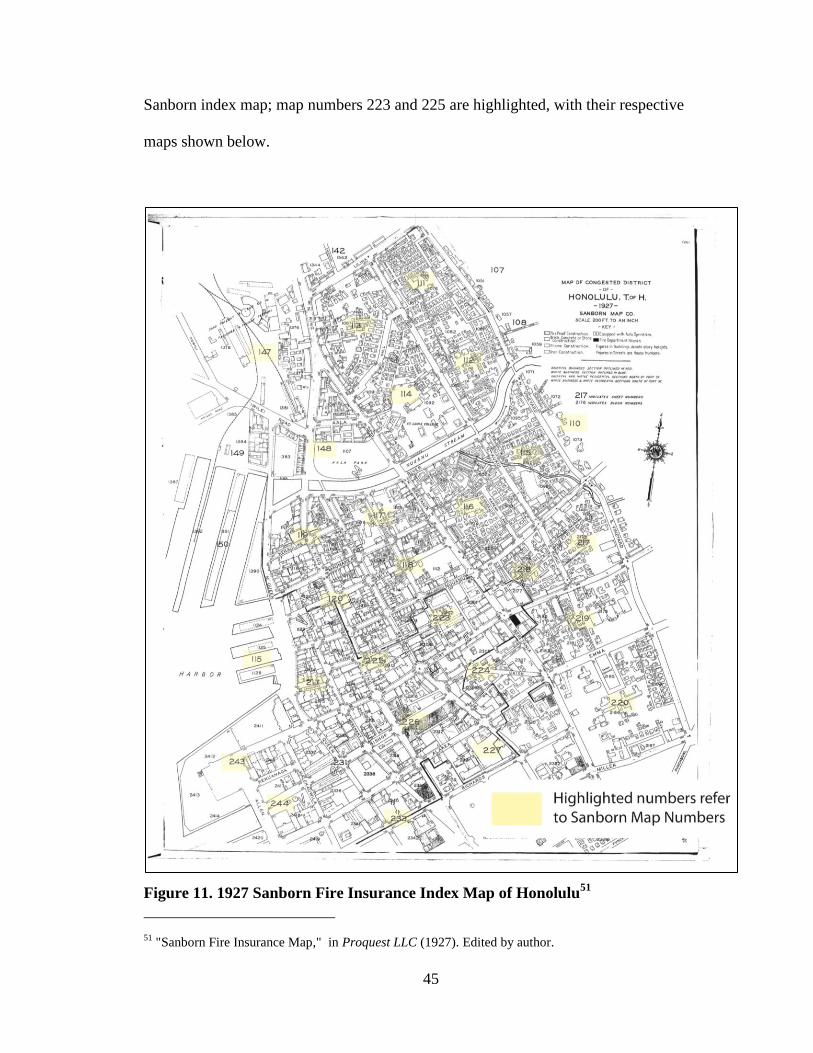
45
Sanborn index map; map numbers 223 and 225 are highlighted, with their respective
maps shown below.
Figure 11. 1927 Sanborn Fire Insurance Index Map of Honolulu51
51 "Sanborn Fire Insurance Map," in Proquest LLC (1927). Edited by author.

46
Figure 12. Detail of 1927 Sanborn Map Index and Map Nos. 223 and 22552
52 Ibid. Edited by author

47
Table 3-2 lists the sheet numbers and summarizes the number of Sanborn Fire
Insurance Maps downloaded for each year. A total of 44 maps were downloaded as PDFs
from the ProQuest Digital Map Collection. The web page was accessed via the University
of Hawaii at Manoa Library on-line portal.
Name Date Sheet Numbers Number
of Maps
Sanborn Maps of
Honolulu, Volume 2
1914 32, 36, 39, 40, 51, 53, 54, 57 & 59 9
Sanborn Maps of
Honolulu, Volume 2
1927 217, 223, 224, 225, 226, 231, 243,
and 244
8
Sanborn Maps of
Honolulu, Volume 2
1950 217, 223, 224, 225, 226, 231, 243,
and 244
8
Sanborn Maps of
Honolulu, Volume 2
1956 201, 202, 203, 204, 205, 206, 207,
208, 209, 211, 212, 223, 224, 225,
226, 231, 231A, 243, and 244
19
Table 3-2. Sanborn Fire Insurance Maps Downloaded from Proquest
Table 3-3 lists the Sanborn Fire Insurance Maps which were retrieved from the
University of Hawaii at Manoa Library Microfilm Collection and digitally scanned. A
total of 56 maps were retrieved from this collection.
Name Date Sheet Numbers Number
of Maps
Sanborn Maps of
Honolulu, Volume 2
1975 201, 202, 203, 204, 205, 206, 207,
208, 209, 211, 212, 223, 224, 225,
226, 231, 231A, 243, and 244
19
Sanborn Maps of
Honolulu, Volume 2
1986 202, 203, 204, 205, 206, 207, 208,
209, 211, 212, 223, 224, 225, 226,
231, 231A, 243, and 244 (note: sheet
201 missing from microfilm file)
18
Sanborn Maps of
Honolulu, Volume 2
1993 201, 202, 203, 204, 205, 206, 207,
208, 209, 211, 212, 223, 224, 225,
226, 231, 231A, 243, and 244
19
Table 3-3. Sanborn Fire Insurance Maps from the Univ of Hawaii Hamilton Library
Microfilm collection

48
The maps selected covered the area two blocks east and west of Fort Street, South
of Beretania Street to the ocean as shown in Figure 13.
Figure 13. Downtown Honolulu Mapping Coverage Area53
3.2.2 Preparing the Maps
The original Sanborn Fire Insurance Maps were drawn at a scale of 1 inch = 50 feet on
sheets measuring 21 by 25 inches.54
Depending on the size of the block, a single sheet
53 "Department of Planning and Permitting Honolulu Land and Information System (HOLIS)". Edited by
author

49
may depict between two to four city blocks. Often the distances between the blocks are
not drawn to scale so that the blocks can be drawn more neatly on a single sheet.
Figure 14. Sanborn Fire Insurance Map dated 1927 –3 City blocks on one sheet
An example is shown in Figure 14. On the left is a detail of the 1927 Sanborn map index,
highlighting the coverage area for map number 223 which is shown on right. Map 223
depicts three adjoining blocks, even though at first glance the map appears as if blocks
are not adjoining. Georeferencing the entire sheet as one map would be problematic
because the distance between the blocks is not to scale. To resolve this problem, each
block must be cropped out and saved as a separate digital file and georeferenced as
illustrated by Figure 15. Table 3-4 summarizes the total number of individual maps
required for georeferencing after cropping to separate out the city blocks.
54 "A Visit to the Sanborn Library."

50
Figure 14. Sanborn Fire Insurance Map dated 1927 –3 City blocks on one sheet55
55 "Sanborn Fire Insurance Map." Edited by author.

51
Figure 15. Sanborn Fire Insurance Map 223, Cropped into three map files56
56 Ibid. Edited by author.

52
Map Year Original Number of
Maps in Study
Area
Final Number of Maps after
Separating out the City Blocks
1914 9 15
1927 8 21
1950 8 21
1956 19 21
1975 19 21
1986 19 20
1993 19 21
Total 101 140
Table 3-4. Summary of Number of Maps Required for Georeferencing
3.2.3 Georeferencing Process
Georeferencing is the process of aligning an image, a map for example, to a
known coordinate system. Prior to georeferencing, a digitized map has no spatial
reference to the earth’s surface—meaning that it is not correlated to real-world
coordinates. Georeferencing places the map on the correct “place” on the earth’s surface.
Georeferencing may involve shifting, rotating, scaling, skewing, and in some areas
warping, rubber sheeting, or orthorectifying the data.57
These terms are used to describe
how a map is made larger or smaller, turned or rotated, or stretched to best fit a
geographic area. Once georeferenced, a map can be viewed, queried, and analyzed with
other geographic data.
The mechanics of georeferencing the Sanborn Fire Insurance maps in ArcGIS is
essentially the process of overlaying a map or image on a “base map” and adjusting the
Sanborn map until the landmarks present in both maps are aligned. To make the Sanborn
57 Tasha Wade and Shelly Sommer, A to Z GIS : An Illustrated Dictionary of Geographic Information
Systems, 2nd ed. (Redlands, Calif.: ESRI Press : Independent Publishers Group [distributor], 2006). 89.

53
map match with the base map, the ArcGIS software is used to increase or decrease,
rotate, stretch or compress parts of the map to make the best fit. Control points are added
to anchor the Sanborn map to similar features on the base map.
The City and County of Honolulu GIS tax parcels, building footprints, and street
line shape files were used as the “base map” for the georeferencing. These shape files
were obtained from the City and County of Honolulu Department of Planning &
Permitting Honolulu Land Information System (HOLIS) website located at
http:gis.hicentral.com. The projected coordinate system in use at the City and County of
Honolulu is NAD_1983_HARN_StatePlane_Hawaii_3_FIPS_5103_Feet.
The Sanborn maps were georeferenced in the order of the most current to the
oldest. The latest Sanborn maps were the first set to be georeferenced because they had a
larger number of similar landmarks with the base map, making them easier to match up.
As each map was georeferenced, they in turn were used as reference points to
georeference the earlier maps. The street centerlines or city block corner points were
typically reliable reference points for georeferencing, as shown in Figure 16Error!
Reference source not found.. There are many factors that affect the quality of the
georeferencing such as if the original map was not drawn to a consistent scale or if it was
of a poor quality. Georeferencing is not an exact science, but the goal is to achieve the
best “fit.” Figure 17Error! Reference source not found. displays a portion of the study
area with a number of georeferenced maps.

54
Figure 16. Sanborn Fire Insurance Map - Reference Points
Figure 17. Sanborn Fire Insurance Map Tiles Georeferenced to a Base Map
55
3.2.4 Creating Map Mosaics
Map Mosaics in ArcGIS are a collection of georeferenced images which are
joined together in the software to allow them to be displayed simultaneously. The mosaic
feature makes it appear as if the individual map files are part of one large map mosaic.
The images are arranged based on the georeferencing information given on the reference
image. The advantage of mosaics map is that all the blocks in the study area can be
viewed at once instead of opening each map individually. The extraneous data on the
edges of each map can also be blocked out to make the entire mosaic seem like one large
seamless map. The mosaics are also helpful for researching multiple years at once. The
entire area can be displayed as one map, making it easier to go from one year to the next
to study the maps.
Without a map mosaic, all the maps for the area would need to be opened
individually, a time consuming process, particularly if studying a large area
encompassing many maps. Mosaics were created for years 1914, 1927, 1950, 1950, 1975,
1986, and 1993. An example is shown in Figure 19, which shows the 1927 Sanborn map
mosaic for the study area created from tiling 22 Sanborn map tiles. In this figure, the
footprints for each map sheet is highlighted. Figure 19 shows the final version of the
mosaic. Notice that there do not appear to be any seamlines between the map sheets in
the final mosaic.

56
Figure 18. Sanborn Fire Insurance Map Mosaic - Showing Footprint of Map Sheets
Figure 19. Sanborn Fire Insurance Map Mosaic - Final

57
3.2.5 Digitizing
Digitizing is the process by which landmarks from a map, image, or other sources
are converted into a digital format in a GIS.58
The digitization process was the most time-
consuming and tedious part of this project due to the large number of footprints. The poor
reproduction quality of some of the maps also made it difficult to decipher the
information on the maps.
3.2.5.1 Building Footprints and City Blocks
Once the Sanborn maps were georeferenced to the basemap, the building footprints
and city block shapes were created by tracing the outlines from the georeferenced maps.
Each shape is associated with a unique record in the database. As each shape is created,
descriptive information is such as height, year built, land use and address was added to
the database. Figure 20 shows the digital building footprints for the 1914 Sanborn Fire
Insurance Maps. A total of 2,431 buildings were digitized for all 7 years. A summary of
the number of buildings digitized for each year is shown in Table 3-5.
58 "Sanborn Fire Insurance Map."

58
Figure 20. Digital Building Footprints – 1914 Sanborn Fire Insurance Maps (viewed
using ArcScene)
Map Year Number of Buildings Digitized
1914 573
1927 504
1950 400
1956 379
1975 223
1986 179
1993 173
Total buildings digitized 2,431
Table 3-5. Summary of Buildings Digitized

59
In addition to digitizing the building footprints, the city blocks were traced using
the mosaic maps for each year. An example of the city block shape file is shown on the
right in Figure 21. On the left side is the 1914 Sanborn mosaic map. City block shape
files were created from the Sanborn mosaics for the 1914, 1927, 1950, 1956, 1975, 1986
and 1993 map years.
Figure 21. City Block Digitization - 1914 Sanborn Maps
3.2.5.2 Digitization Workflow
As in the georeferencing process, the digitization process began with the most
current Sanborn map. The latest Sanborn maps would have the most commonality
between the present day buildings and city blocks. The digitization for all the years of
one block would be completed before moving on to the next block. Starting with a block
from the 1993 Sanborn year, the buildings were digitized and the database populated for
each building. Once all the buildings were completed for the block, the next earlier
Sanborn Map year was digitized. Once the earliest year was completed, then another
block was started. If most of the buildings on one block were the same as the prior years’,

60
the data was simply cut and pasted and corrected for any discrepancies. This method
made it easier to check for outliers and perform data quality checks.
3.2.6 Database Development
Building information is critical to the field of historic preservation. The more
information we know about a building, the better we are at interpreting its history and
how to best preserve it. Culling the data from the Sanborn Fire Insurance maps and
organizing it in a database will assist with the preservation of spatial and historical
information and follow on research and analysis.
The building database was developed using Microsoft Access, a relational database
which allows related data stored in different tables to be joined together to summarize
and calculate data. Microsoft Access databases are compatible with ArcGIS, as tables
within Access databases can be directly accessed by ArcGIS and added to the ArcGIS
map. Databases are joined to shape files based on a common field, and the data within the
tables can be mapped. Table 3-6 describes the information included in the database for
each building footprint along with the data type (text or numeric).

61
Table 3-6. Sanborn Fire Insurance Map Database Fields Summary
3.2.7 Time Estimates
This project to map the Fort Street downtown area involved digitizing maps and
creating a database describing the area from 7 different time periods, beginning in 1914
through 1993. The area covered an area of approximately 22 blocks--20 maps per year,
140 maps total. The following are the time estimates for each step in the mapping
process.
Task Time per map
(mins)
Number of
Maps
Total Time
(Hrs)
Georeferencing Sanborn Maps 15 minutes 140 35
Digitizing the Building Footprints 60 minutes 140 140
Entering data into the database 120 min 140 280
Reviewing the data 30 minutes 140 70
Total time (hrs) 525
Table 3-7. Time Required to Complete Mapping
Field Name Description Type
Building Id Building Identifier Text
Map Year Date of the Sanborn Map Text
Map No Map reference number Text
Block No Block Number Text
House No House Number Text
Street Name Street Name Text
House No (2) Alternate House Number Text
Street Name (2) Alternate Street Name Text
Height Height of Building in Feet Numeric
Stories Number of floors Text
YB Year Built Text
LU Building Use Code (commercial, warehouse, store, etc.) Text
FP Fire Proof Construction Text
Desc Building Data1 (Name of Building or Use) Text
Desc Building Data2 (construction or other bldg. data) Text
Desc Building Data3 (construction or other bldg. data) Text
62
3.3 Historical Building Photographs
Historical building photographs are a rich source of information essential for
interpreting the past and serve as compelling records of people, events, and places. Old
photographs remind people of a past time and evoke ideas and emotions in ways that
maps, words or statistics alone cannot. In addition to displaying a clear visual record of a
structure, historical building photographs can reveal much about people and how and
where they lived and worked and bring to life what was once forgotten. The photographs
reveal the building styles of the period, the uses for the buildings and many other clues
about that time period.
When historic photos are displayed with their location on a map, the resultant
combination of the two can intensify and enliven the history of a particular place and
provide an innovative way to interpret history. Historic building photographs achieve
greater historical value if information is known about where and when they were taken
and about people, building or objects in the photograph. GIS is an effective tool to
integrate the photograph and the information about the photograph to locations on maps
and to historical databases.
3.3.1 Data Sources
Archival photographs are publically available at many locations, such as the state
and university libraries, state archives, and museums. Historic building photographs can
also be gleaned from books, microfiche collections, and on-line searches. There is a large
archive of historic photographs of the Downtown Honolulu area. For this study, historic
building photographs were obtained from the Hawaii State Archives. The majority of the

63
Archives’ photographic collections are hard copy images although they have a limited
number of images available on-line.
3.3.2 Data Collection
The Hawaii State Archive does not allow scanning of their images so the only
way to obtain a digital copy is to photograph the pictures. To ensure an optimal image,
special care must be taken when using a camera to document historical photographs. The
photograph should be taken in an area with no strong directional lighting that will cause
hotspots or glare to appear on the image. To keep perspective distortion at a minimum, a
tripod should be used and the camera lens must not be tilted on an angle compared with
the plane of the photograph.
Most of the archival photographs were grouped in manila folders or photo
albums. The workflow involved working with a batch of 30-40 images at a time. After
one batch is photographed, the images are downloaded to a computer and information
about the photograph—the date, the location, building name, collection name and any
other available information about the photograph are logged onto a database. All the
processing is completed for a batch before moving on to the next batch of photographs. It
is much easier to work with a small number of photographs at a time in case a problem
occurs which requires double checking the data. If an image did have a problem with it,
for example if it was blurry, it was much easier to backtrack to locate the image and take
another photograph of the picture.
3.3.3 Database Development
Similar to the workflow for the building footprints, the database was kept as a
table separate from the geographic shape files because the data entry process within

64
Microsoft Access is much simpler than within ArcGIS. The type of information recorded
for each photograph is detailed in Table 3-8.
Field Name Description Type
Desc Description of Photograph Text
Addr1 Location by Street Text
Addr2 Location by Street - 2 Text
Photo_Yr Year photo taken Text
Source Photo Source Text
Coll_Na Name of Collection Text
Call_Num Call Number Text
Author Photographer Text
File_na Internal File name Text
Link Hyperlink to Photograph Text
Table 3-8. Building Photograph Database Fields Summary
3.3.4 Displaying the Photographs
The photographs were pinned to a geographic location on the map as point shape
files based on the information known about the photograph’s building location. Figure 22
shows the locations of where the images are pinned to on the map. Access to the
individual photograph files is through a hyperlink to a local drive or a cloud-based
storage site. Although a total of 362 images were retrieved from State Archives collection
and catalogued into the database, only 121 images were pinned to geographic locations
on the map because the remaining images did not have enough information in its label or
in the image to confirm its location.

65
Figure 22. Historic Photographs in Mapping Area
As shown in Figure 23, the photographs are represented as points on a map.
Clicking on a point will bring up a pop-up window displaying the building images for the
area. The pop-up window may be customized to include additional information about the
building, such as street address, or date photograph taken.

66
Figure 23. Building Photograph Pop Up Window
By first spatially connecting the photograph to a location on the map, more
detailed data is obtained when zooming in on the Sanborn Map and comparing the
photograph with the information from the map. This is illustrated in Figure 24, which
shows a photograph taken from the King Street and Fort Street intersection and depicts
the buildings on Fort Street. The Sanborn map shows that the two-story corner building
on the left is 24 feet in height, functions as a store and has office space on the south west
corner. The adjacent structure is a four-story 63-foot height rectangular building. The
ground floor includes a store and a drug store and the upper floors are halls. Across the
street, a two-story, 30-foot height building is occupied by a bank. The Sanborn map also
shows addresses which can also be correlated to the buildings in the photographs.
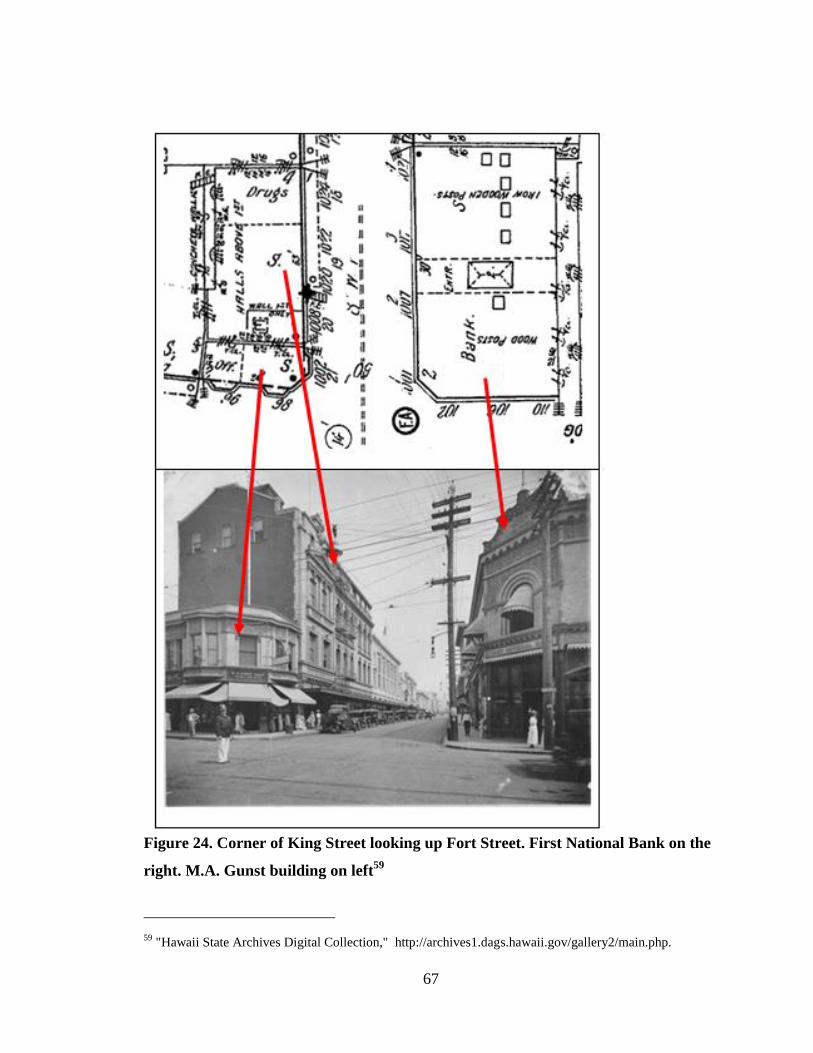
67
Figure 24. Corner of King Street looking up Fort Street. First National Bank on the
right. M.A. Gunst building on left59
59 "Hawaii State Archives Digital Collection," http://archives1.dags.hawaii.gov/gallery2/main.php.

68
Chapter 4. Results
The advantage to using GIS in the study of historical maps is that it allows
visualization of how an area has changed over time, where patterns exist, and where they
vary across the study areas. By using the spatial component in the analysis a more
sophisticated understanding of the information on the maps can be developed.
Digitization of the Sanborn Fire Insurance Maps of the downtown Honolulu area
from 1914 to 1993 reveals how dramatically the urban space changed during this 79-year
time period. Figure 25 shows the mapping area for this study. Practically every city block
has gone through a transformation to accommodate the emergence of large office
buildings and complexes throughout the city. Only a handful of the buildings from the
early 1900s still exist today.
Figure 25. Mapping Area - Downtown Honolulu

69
4.1 City Blocks
Figure 26. City Blocks in Mapping Area from 1914 to 1993
The growth and changes of a city can be seen by examining the street and block
changes over time. As discussed in Section 3.2.5, the city blocks were digitally traced
using the mosaic maps created for each year. Figure 26 shows the outline of the city
blocks for the study area for each year mapped, and depicts at a glance how the city
blocks changed from 1914 to 1993. GIS can be used to analyze and study the streets and
blocks in a number of ways. For example, the number of blocks and the total square

70
footage at different time periods can be easily computed. The street and block patterns
can also be examined to help determine the time frame of undated historic maps.
Tracking this type of change in addition to providing quantitative data would be difficult
without GIS.
4.1.1 Street Analysis Example
Examining the GIS map mosaics sheets for the study area over different time
periods makes it easy to visualize and compare the street and block changes. Figure 27
shows the 1914 Sanborn mosaic maps for the study area. The outline of the digitized
blocks and the modern street names are layered over the map mosaic to further visually
highlight the blocks and provide a present-day point of reference, respectively. Using
Bethel Street as an example, the 1914 maps shows Bethel Street extended just through
two blocks from Merchant Street to Hotel Street, as indicated by the yellow highlight on
the map. The change to Bethel Street over time can be seen in the 1927 Sanborn map
mosaic at Figure 28 which shows Bethel Street extended north one block up to Pauahi
Street. By 1950, Bethel Street had extended up two more blocks to Beretania Street on
the north and on the South, down through one block through to Queen Street, as shown in
the 1950 Sanborn map mosaic at Figure 29.

71
Figure 27. 1914 Sanborn Map Mosaic – Bethel St.
Figure 28. 1927 Sanborn Map Mosaic – Bethel St.
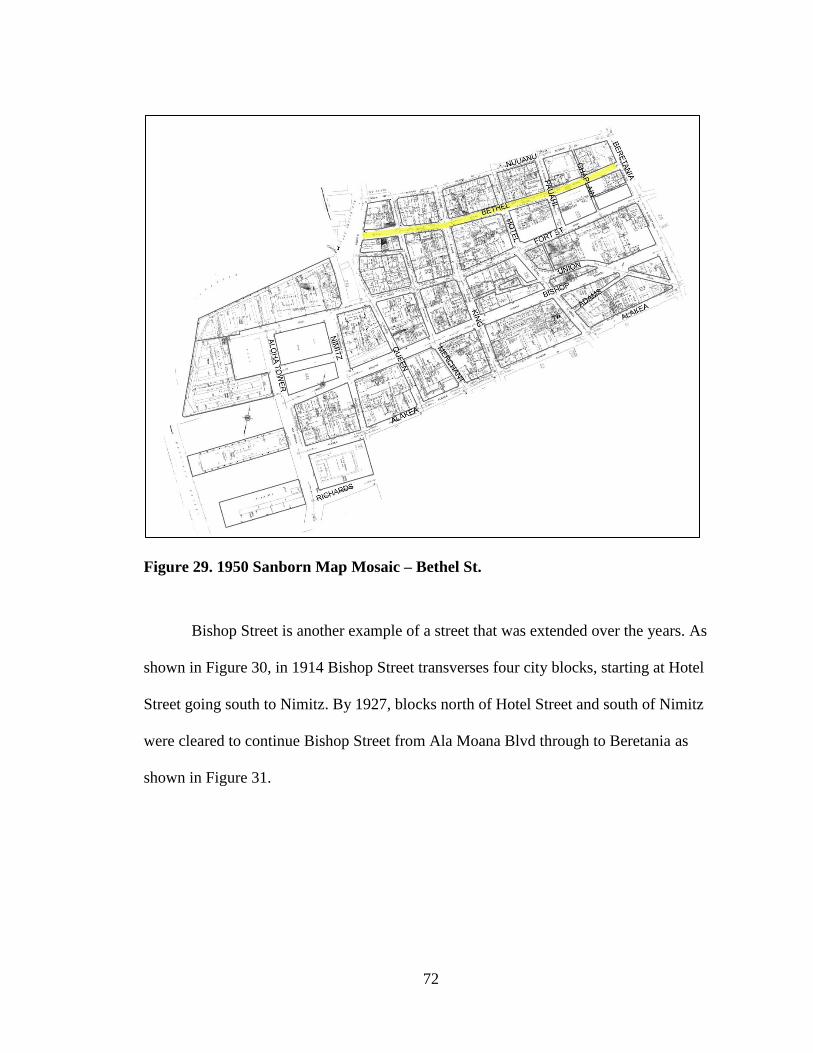
72
Figure 29. 1950 Sanborn Map Mosaic – Bethel St.
Bishop Street is another example of a street that was extended over the years. As
shown in Figure 30, in 1914 Bishop Street transverses four city blocks, starting at Hotel
Street going south to Nimitz. By 1927, blocks north of Hotel Street and south of Nimitz
were cleared to continue Bishop Street from Ala Moana Blvd through to Beretania as
shown in Figure 31.

73
Figure 30. 1914 Sanborn Map Mosaic - Bishop St.
Figure 31. 1927 Sanborn Map Mosaic - Bishop St.

74
4.1.2 City Block Analysis Example
In conjunction with the street extensions were the alterations to the blocks to
accommodate the modifications to the streets. To illustrate how GIS can be used to
analyze street and block changes, the blocks for the study area for 1914 and 1950 were
compared to see the effect from the two street extensions. Figure 32 shows the blocks in
the study area for 1914 and 1950 and illustrates which downtown blocks were cleared to
accommodate the road extensions for both the Bethel and Bishop Street extensions. The
blocks affected by the Bishop and Bethel Street extensions are shown with dashed lines
in the 1914 map. The 1950 map shows the resulting effects of the street extensions.
Figure 32. Block Changes Due to Bethel and Bishop Street Extension - 1914 to 1950
By adding more digital information to the GIS map, urban street information such
as roads that have been widened, made narrower, closed, made longer or shorter or

75
changed direction over time can give more information to help researchers learn more
about a historical place.
4.1.3 Urban Change Analysis Example
Various data about the buildings affected due to the street expansions can be
analyzed using GIS’s analysis toolset. Information such as quantity of buildings, total
square footage, and types of buildings affected can be computed to aid in the analysis of a
city’s past.
To determine the buildings impacted by the Bethel Street expansion, a 20-ft
buffer was created on both sides of the centerline of the Bethel Street, as shown in Figure
33. Using the Spatial Join analysis tool in GIS, buildings that fell in the path of the buffer
are selected. The resulting building data shown in Figure 34 can be further analyzed to
determine the total square footage affected, in addition to the types of and age of the
buildings affected.
Figure 33. 20-Foot Buffer - Bethel St

76
Figure 34. Buildings affected by Bethel St. Extension
4.2 Urban Density Analysis
The building fabric of downtown Honolulu, once the center of city life, has seen
much change over the years. From 1914 thru 1993, the total number of structures in the
downtown study area decreased from 573 to 173. During the same time period, the
average square foot of the building increased from 4,161 SF to 82,665 SF. The digitized
building footprint maps for each year provides a visual impact to the story of how much
downtown has changed. GIS allows the data to be visualized in multiple ways. Figure 35
shows the 3D view of the buildings from1914 to 1993. Figure 36 thru Figure 39 depicts
the same information for each year from an overhead view. Both the 3D and overhead
views illustrate how dramatically downtown Honolulu has changed over time.

77
Figure 35. 3D Building Footprints - 1914 to 1993

78
Figure 36. Building Footprints - 1914 &1927
Figure 37. Building Footprints - 1950 & 1956
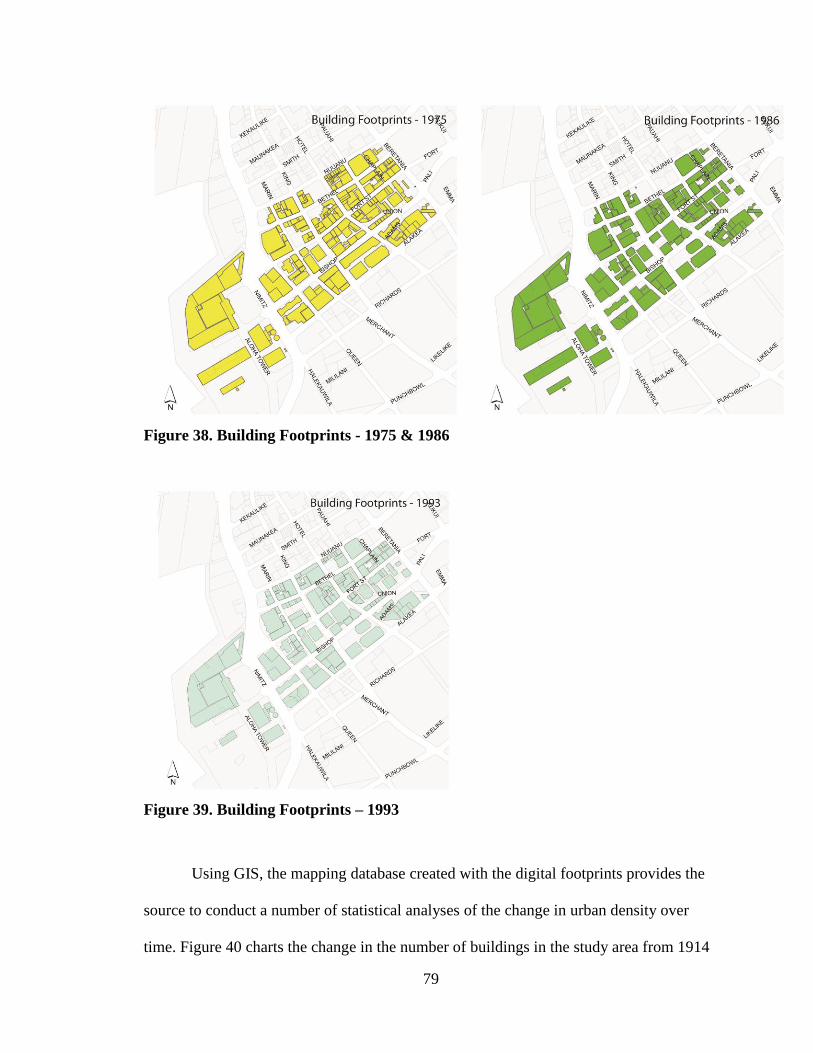
79
Figure 38. Building Footprints - 1975 & 1986
Figure 39. Building Footprints – 1993
Using GIS, the mapping database created with the digital footprints provides the
source to conduct a number of statistical analyses of the change in urban density over
time. Figure 40 charts the change in the number of buildings in the study area from 1914

80
to 1993. As indicated in the chart, the number of buildings declined steadily from a high
of 573 buildings in 1914 to 173 buildings in 1993.
Figure 40. Change in Number of Buildings - 1914 to 1993
The size of the buildings in the study area also changed dramatically during this
time period. As shown in Figure 41, the average square footage changed from 4,000 SF
to 82,000 SF from 1914 to 1993, indicating the steady change in the overall charateristic
and feel in the study area over this time period.
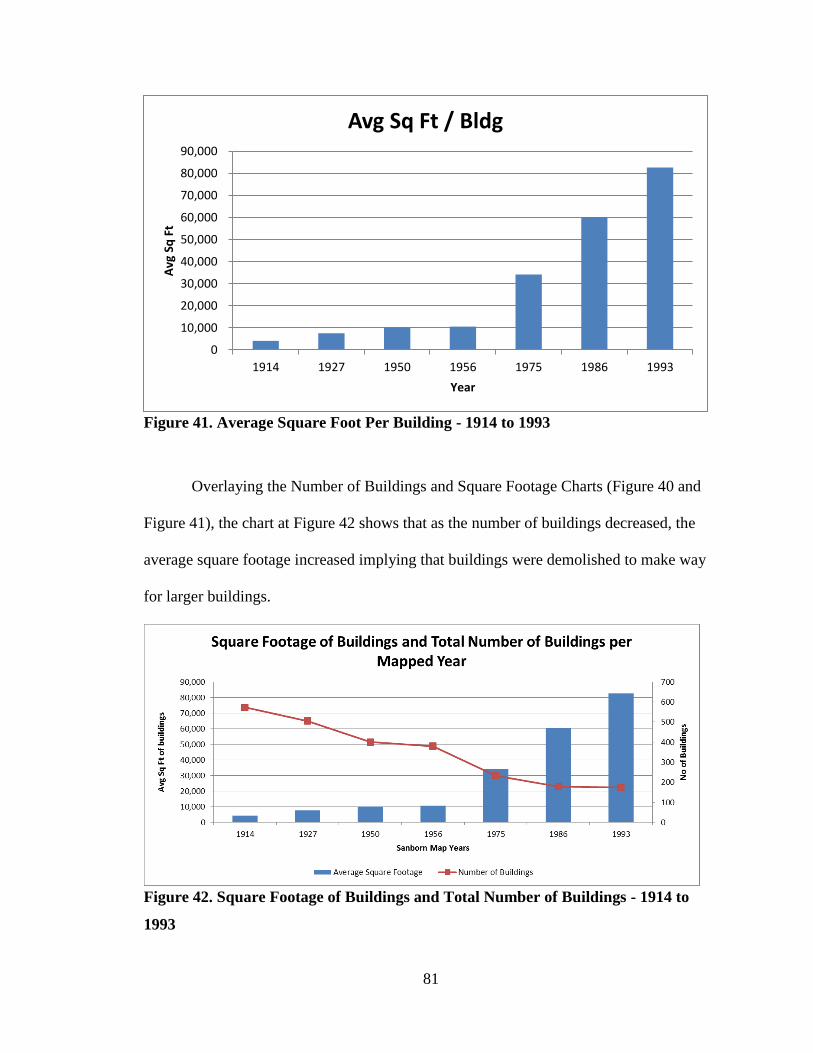
81
Figure 41. Average Square Foot Per Building - 1914 to 1993
Overlaying the Number of Buildings and Square Footage Charts (Figure 40 and
Figure 41), the chart at Figure 42 shows that as the number of buildings decreased, the
average square footage increased implying that buildings were demolished to make way
for larger buildings.
Figure 42. Square Footage of Buildings and Total Number of Buildings - 1914 to
1993
0
10,000
20,000
30,000
40,000
50,000
60,000
70,000
80,000
90,000
1914 1927 1950 1956 1975 1986 1993
Avg
Sq
Ft
Year
Avg Sq Ft / Bldg
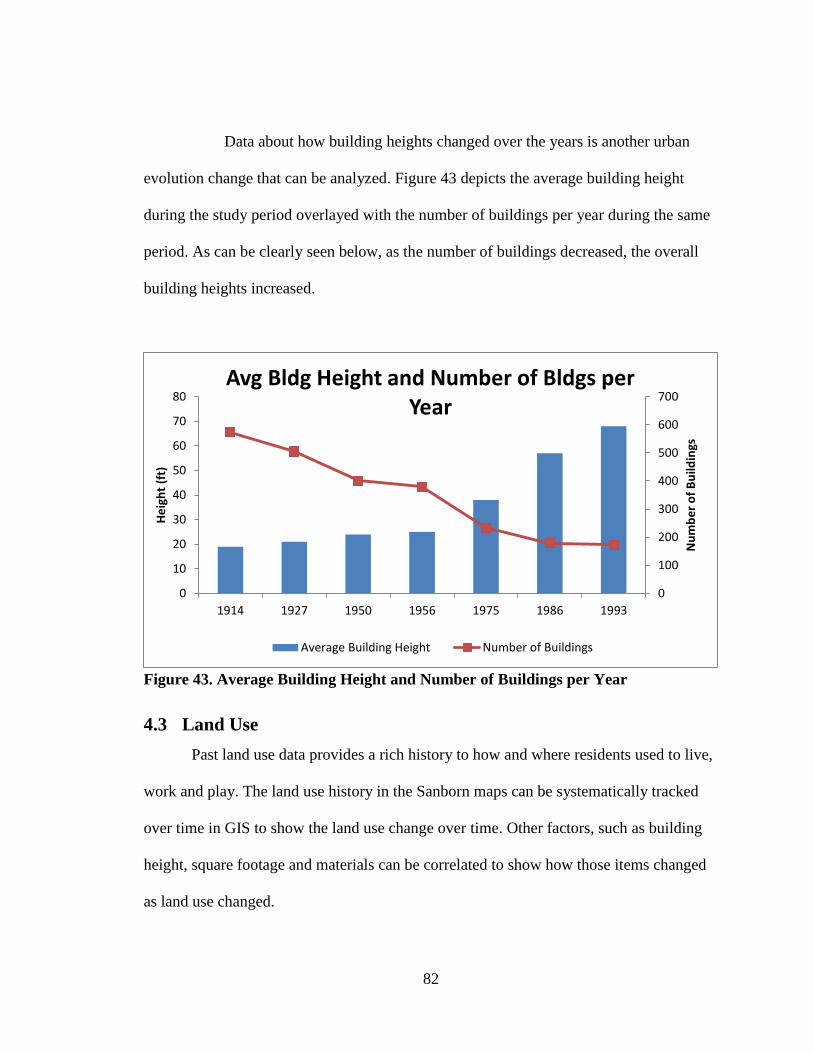
82
Data about how building heights changed over the years is another urban
evolution change that can be analyzed. Figure 43 depicts the average building height
during the study period overlayed with the number of buildings per year during the same
period. As can be clearly seen below, as the number of buildings decreased, the overall
building heights increased.
Figure 43. Average Building Height and Number of Buildings per Year
4.3 Land Use
Past land use data provides a rich history to how and where residents used to live,
work and play. The land use history in the Sanborn maps can be systematically tracked
over time in GIS to show the land use change over time. Other factors, such as building
height, square footage and materials can be correlated to show how those items changed
as land use changed.
0
10
20
30
40
50
60
70
80
1914 1927 1950 1956 1975 1986 1993
0
100
200
300
400
500
600
700
He
igh
t (f
t)
Nu
mb
er
of
Bu
ildin
gs
Avg Bldg Height and Number of Bldgs per Year
Average Building Height Number of Buildings
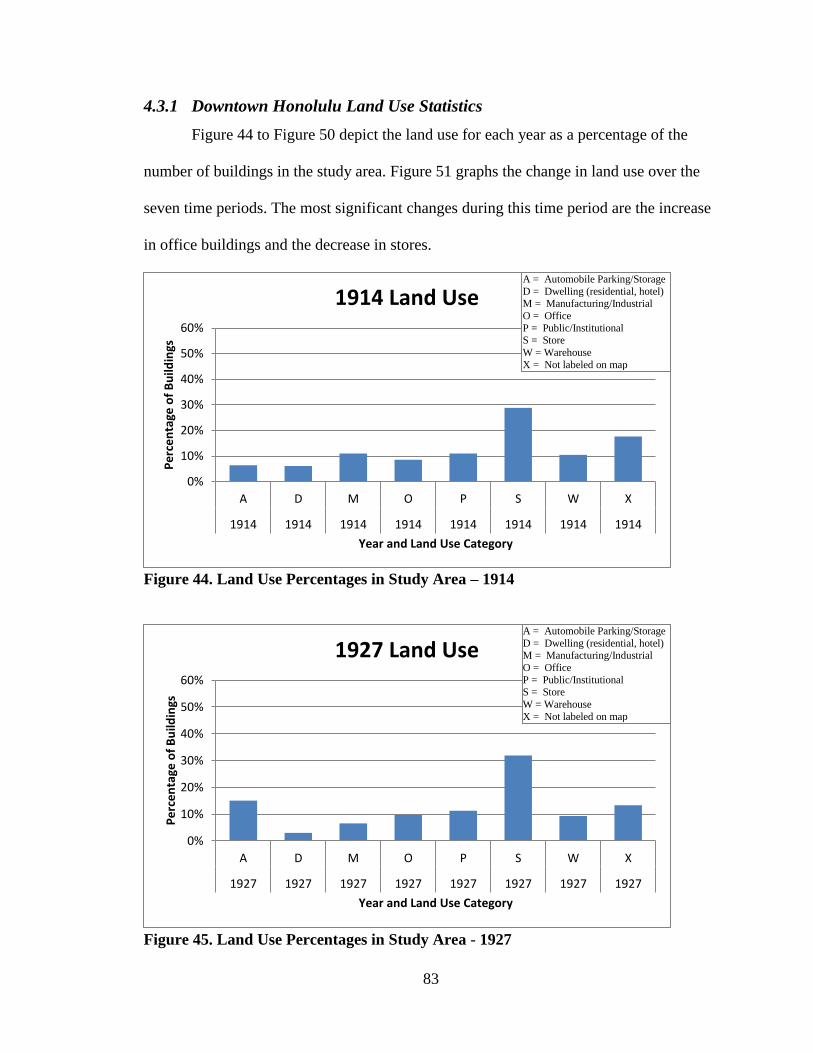
83
4.3.1 Downtown Honolulu Land Use Statistics
Figure 44 to Figure 50 depict the land use for each year as a percentage of the
number of buildings in the study area. Figure 51 graphs the change in land use over the
seven time periods. The most significant changes during this time period are the increase
in office buildings and the decrease in stores.
Figure 44. Land Use Percentages in Study Area – 1914
Figure 45. Land Use Percentages in Study Area - 1927
0%
10%
20%
30%
40%
50%
60%
A D M O P S W X
1914 1914 1914 1914 1914 1914 1914 1914
Pe
rce
nta
ge o
f B
uild
ings
Year and Land Use Category
1914 Land Use
0%
10%
20%
30%
40%
50%
60%
A D M O P S W X
1927 1927 1927 1927 1927 1927 1927 1927
Pe
rce
nta
ge o
f B
uild
ings
Year and Land Use Category
1927 Land Use
A = Automobile Parking/Storage
D = Dwelling (residential, hotel) M = Manufacturing/Industrial
O = Office
P = Public/Institutional S = Store
W = Warehouse
X = Not labeled on map
A = Automobile Parking/Storage
D = Dwelling (residential, hotel) M = Manufacturing/Industrial
O = Office
P = Public/Institutional S = Store
W = Warehouse
X = Not labeled on map

84
Figure 46. Land Use Percentages in Study Area - 1950
Figure 47. Land Use Percentages in Study Area - 1956
0%
10%
20%
30%
40%
50%
60%
A D M O P S W X
1950 1950 1950 1950 1950 1950 1950 1950
Pe
rce
nta
ge o
f B
uild
ings
Year and Land Use Category
1950 Land Use
0%
10%
20%
30%
40%
50%
60%
A D M O P S W X
1956 1956 1956 1956 1956 1956 1956 1956
Pe
rce
nta
ge o
f B
uild
ings
Year and Land Use Category
1956 Land Use
A = Automobile Parking/Storage
D = Dwelling (residential, hotel) M = Manufacturing/Industrial
O = Office
P = Public/Institutional S = Store
W = Warehouse
X = Not labeled on map
A = Automobile Parking/Storage
D = Dwelling (residential, hotel) M = Manufacturing/Industrial
O = Office
P = Public/Institutional S = Store
W = Warehouse
X = Not labeled on map

85
Figure 48. Land Use Percentages in Study Area – 1975
Figure 49. Land Use Percentages in Study Area - 1986
0%
10%
20%
30%
40%
50%
60%
A D M O P S W X
1975 1975 1975 1975 1975 1975 1975 1975
Pe
rce
nta
ge o
f B
uild
ings
Year and Land Use Category
1975 Land Use
0%
10%
20%
30%
40%
50%
60%
A D M O P S W X
1986 1986 1986 1986 1986 1986 1986 1986
Prc
en
tage
of
Bu
ildin
gs
Year and Land Use Category
1986 Land Use
A = Automobile Parking/Storage
D = Dwelling (residential, hotel) M = Manufacturing/Industrial
O = Office
P = Public/Institutional S = Store
W = Warehouse
X = Not labeled on map
A = Automobile Parking/Storage
D = Dwelling (residential, hotel) M = Manufacturing/Industrial
O = Office
P = Public/Institutional S = Store
W = Warehouse
X = Not labeled on map
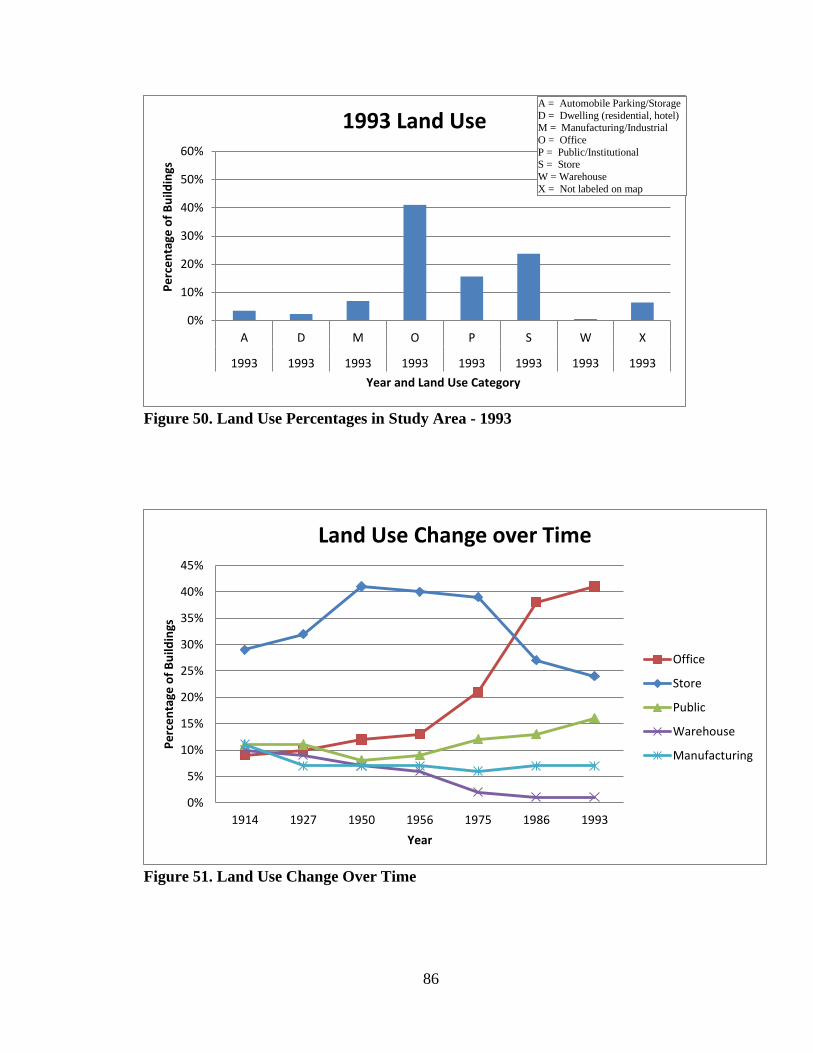
86
Figure 50. Land Use Percentages in Study Area - 1993
Figure 51. Land Use Change Over Time
0%
10%
20%
30%
40%
50%
60%
A D M O P S W X
1993 1993 1993 1993 1993 1993 1993 1993
Pe
rce
nta
ge o
f B
uild
ings
Year and Land Use Category
1993 Land Use
0%
5%
10%
15%
20%
25%
30%
35%
40%
45%
1914 1927 1950 1956 1975 1986 1993
Pe
rce
nta
ge o
f B
uild
ings
Year
Land Use Change over Time
Office
Store
Public
Warehouse
Manufacturing
A = Automobile Parking/Storage
D = Dwelling (residential, hotel) M = Manufacturing/Industrial
O = Office
P = Public/Institutional S = Store
W = Warehouse
X = Not labeled on map

87
The land use data shown in the previous charts and graphs can also be displayed
on a map. In Figure 52 the land use data for the 1927 Sanborn Maps are color-coded and
displayed spatially. The same data is displayed in a 3-dimensional view in Figure 53.
This method of displaying the data provides another viewpoint for interpreting the past.
Figure 52. Land Use - 1927 Sanborn Fire Insurance Map

88
Figure 53. Land Use - 1927 Sanborn Fire Insurance Map - 3D View
4.4 Relational Database
The final database consisted of 2571 records. As mentioned in Section 3.2.6, the
building database was developed using Microsoft Access, a relational database which
allows related data stored in different tables to be joined together to summarize and
calculate data. The database was kept as a table separate from the geographic shape files
because the data entry process within Microsoft Access is much more user friendly than
within ArcGIS. In addition, the data can be sorted in multiple ways, making error-
checking and locating records much easier. The database can be joined with the shape file
as needed. An extract of the database is shown at Figure 54.
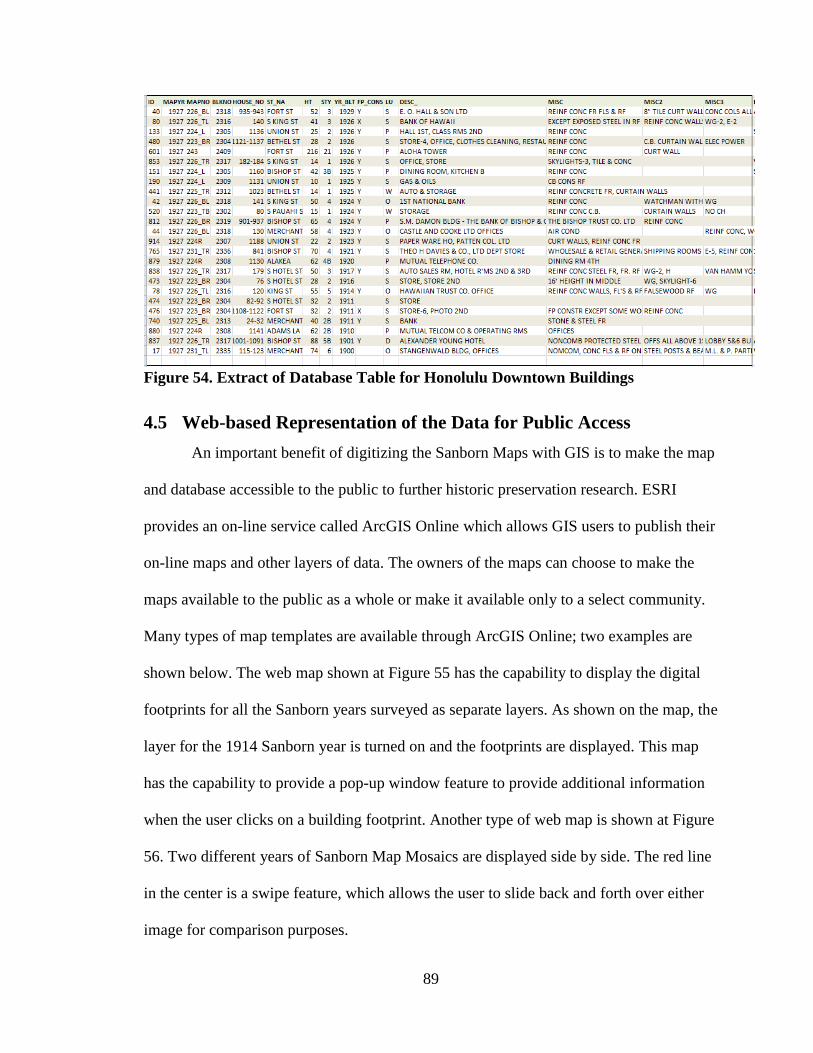
89
Figure 54. Extract of Database Table for Honolulu Downtown Buildings
4.5 Web-based Representation of the Data for Public Access
An important benefit of digitizing the Sanborn Maps with GIS is to make the map
and database accessible to the public to further historic preservation research. ESRI
provides an on-line service called ArcGIS Online which allows GIS users to publish their
on-line maps and other layers of data. The owners of the maps can choose to make the
maps available to the public as a whole or make it available only to a select community.
Many types of map templates are available through ArcGIS Online; two examples are
shown below. The web map shown at Figure 55 has the capability to display the digital
footprints for all the Sanborn years surveyed as separate layers. As shown on the map, the
layer for the 1914 Sanborn year is turned on and the footprints are displayed. This map
has the capability to provide a pop-up window feature to provide additional information
when the user clicks on a building footprint. Another type of web map is shown at Figure
56. Two different years of Sanborn Map Mosaics are displayed side by side. The red line
in the center is a swipe feature, which allows the user to slide back and forth over either
image for comparison purposes.

90
Figure 55. ArcGIS On-line Map - Historic Sanborn Maps of Downtown Honolulu
60
60 "Historic Sanborn Maps of Downtown Honolulu," (generated by Mary Kodama using ArcGIS On-Line
http://uhm.maps.arcgis.com/home/webmap/viewer.html?webmap=d0769837d4a1436ea6f150afdc84a626,
May 2, 2013).
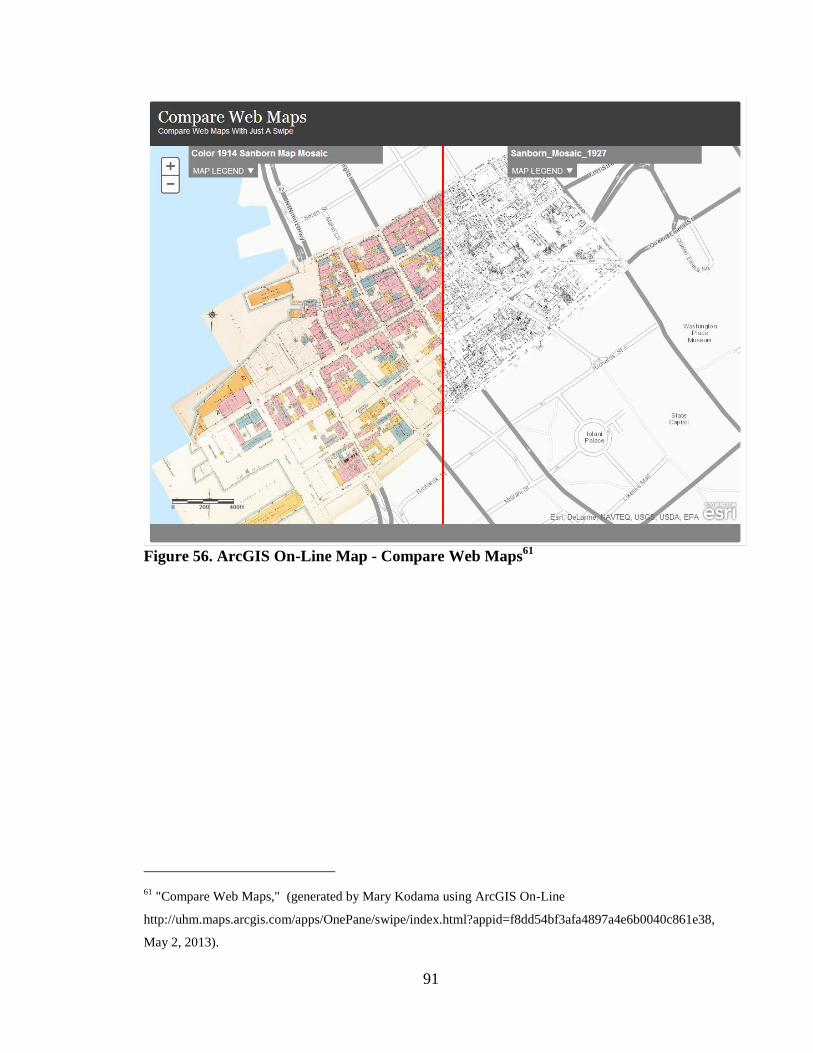
91
Figure 56. ArcGIS On-Line Map - Compare Web Maps
61
61 "Compare Web Maps," (generated by Mary Kodama using ArcGIS On-Line
http://uhm.maps.arcgis.com/apps/OnePane/swipe/index.html?appid=f8dd54bf3afa4897a4e6b0040c861e38,
May 2, 2013).

92
Chapter 5. Next Steps
5.1 Expand Mapping Area
The Sanborn Fire Insurance Company mapped many urban areas on Oahu in
addition to the outer islands. The next steps for this research could be to expand the
mapping area to include the entire downtown area or start anew with another urban
location on Hawaii. The data already recorded should be reviewed for consistency
throughout. As color maps become available, those should be georeferenced and
correlated with the existing database to add data not included initially. The framework
has been established now for the inclusion of other maps and records into the area of
study. GIS can be used to integrate data from different sources and added to the map as
another layer of information.
5.2 Brainstorming Database Queries
The database and visual nature of the data naturally opens the door to exploring
many different queries, which takes only a few seconds to compute but would be quite
time and labor intensive if using just paper maps. For example, if we wanted to answer
the question, “How many buildings were labeled by their building or company names and
what were they?” A quick query of the database shows 65 buildings meeting this
criterion. The full results are shown in Figure 57. The names are listed according to the
year the name first appears on the maps.
Another query could be, “How many buildings listed “coral” as a construction
material?” The answer according to the database is: 14. Many queries, simple or
complex are possible

93
Figure 57. Building or Company Names

94
5.3 Dakin Maps
Utilizing established georeferencing techniques, maps from different sources can
be overlayed and integrated to evaluate historical development over time. Ancillary data
such as city planning maps, city directory databases and census data can enhance the
information. The Dakin Publishing Company of San Francisco also produced fire
insurance maps. The company published maps from about 1885 until the early 1960's,
and actively produced insurance maps from its beginning until the second decade of the
20th Century.62
These maps are dated earlier than the Sanborn maps of the same area, and
as a result are suitable to be added to the database to provide continuity of urban
development prior to 1914. The University of Hawaii Hamilton Library have colored
scanned copies of the maps for the years 1891, 1899 and 1906 which are available
through the University of Hawaii at Manoa Hamilton Library website.
Figure 58 displays how the map looks with a Dakin Fire Insurance map sheet
added as another layer to the GIS map of the research area. Zooming in to get a closer
look at the city blocks circled in red, the Dakin or Sanborn layer can be turned on or off
as in Figure 59. Transparency levels are also available to view both maps over each other.
This is especially helpful when researching the chronological history of a building or
area.
62 Philip R. Hoen, "Dakin Publishing Company and its Fire Insurance Maps," (Information Bulletin
Western Association of Map Libraries, 1976), 47.

95
Figure 58. 1904 Dakin Fire Insurance Map overlayed on 1914 Sanborn Map Mosaic

96
Figure 59. Detail of Dakin Fire Insurance Map
5.4 City Planning Maps
Old city planning maps provides insight to how the local government viewed past
urban environments. Building information annotations and planned street improvements

97
are often shown on these maps. These old city planning maps can be overlayed to the
existing maps to compare or supplement the data from the Sanborn maps.
5.5 Business or Residential Directories
Since the address information in the Sanborn Maps have been included in the
database, researchers using historical directories will be able to locate businesses or
people associated with the address. Conversely, old business directories can be used to
fill in the gaps of the main database.
5.6 Creating Historic 3D Building Models from Footprint Information
and Historic Photographs
3-D Reconstruction of a historic city or area is an effective means of visualizing
the landscape at different points in time and communicating development patterns. 3-D
reconstruction models faithful to the original historical urban space are difficult to
achieve using just photographs because of the labor intensive process to decipher the
height and scale of the buildings and the relationship of the buildings with other
structures. With the GIS Sanborn maps the digital footprints and building height data
provide an accurate foundation for 3-D building reconstruction over multiple time
periods. Combining the data with the historical building photographs provides more
detailed information to accurately build 3-D models.
98
Chapter 6. Lessons Learned
6.1 Quality of the maps
The majority of the maps obtained for this research were in a digital format,
downloaded from the ProQuest Sanborn Map collection. As mentioned in Section 3.2.1,
the entire collection was scanned from the black and white microfilm masters. An
important part of the Sanborn system was its color coding of building construction
materials. The lack of color undercuts the informational value of these maps because it
becomes more difficult to readily recognize building and land-use trends. Despite the
inclusion of a key developed by the Sanborn Map Company for use on black-and-white
versions of its maps the lack of color added a layer of difficulty to the digitization
process. The maps obtained from the University of Hawaii at Manoa Library Microfilm
catalog were of poor quality, making it difficult to accurately digitize the building
footprints and decipher the building information on the maps.
6.2 Mapping Fatigue
The digitizing and data entry process was the most tedious and time consuming
part of the research. Each building had to be individually digitized and the attributes for
each building entered into a database and verified. It was often difficult to decipher the
information on the maps, so the next or previous year had to be examined to determine if
the same building data was present and more legible. As described in Section 3.2.7, each
block took about 3 hours to complete. Taking breaks periodically helped to break up the
monotony of mapping.

99
6.3 Interpreting the Building Data
The building height of some buildings, in particular the outlying buildings, only
indicated the number of stories, not the building height. For those buildings, a special
data entry method for the building height was used. For example, a one story building’s
height would be inputted as 10.01 feet in the database, a 2 story building as 20.02 feet
and so forth. The fraction was used as an indicator in the database to signify the number
was interpreted from the map.
Many structures were not a consistent height throughout and many structures also
indicated multiple stories but did not indicate a division line. Not all buildings had
addresses listed. On commercial buildings, individual structures often had a range of
addresses, with no clear internal divisions. The addresses recorded for buildings that did
not have an address listed were close to or the same as the address of the nearest building.
Buildings located on the corners were recorded with both street names. There were many
small structures which were unknown as to what main buildings they were associated
with. Many buildings did not indicate their use (store, office, dwelling, etc.) and so were
listed as unknown in the database.
Some of the blocks and roads on some of the earlier Sanborn maps no longer
existed which made georeferencing difficult. The street center lines were used as a
control point in georeferencing in most cases, but sometimes this did not result in a
proper alignment with previous maps, so readjustments were made. Some buildings did
not correctly line up, even though the buildings were the same buildings.

100
6.4 Level of Knowledge Required
The care and precision in performing the building digitization can make a big
difference to the final quality of the maps. When digitizing, the cursor must be placed on
the correct spot to capture the exact location accurately. When drawing building corners,
it is important to capture the precise point at which the line changes direction. The data
entry process was also an area where mistakes were likely to occur. Firmly established
procedures and guidelines for this process can minimize errors and ensure consistency in
the data entry and digitization process. Besides the necessary GIS software training, it is
important to have a thorough understanding of the Sanborn map symbols used and
familiarity with where the building heights were drawn on the building, where addresses
were indicated, and special symbols. There are different versions of legends developed
for the maps depending on the date of and whether the maps were in color or black and
white, so it is important to ensure the correct legend is used.

101
Chapter 7. Conclusion
This study explored the use of geographic information systems as a framework for
analyzing digitized Sanborn Fire Insurance Maps and effectively demonstrated the
benefits of digital mapping with GIS for historic preservation research. Geographic
Information Systems are a powerful tool for the rapid analysis and visualization of
historic neighborhoods. GIS can infuse new life into historic maps and aid planners,
historians, and other researchers by looking at a particular area from a different
perspective. Although the creation of a GIS historical database covering a large area is a
major undertaking, the resulting database and spatial data which displays the change over
time offers much potential. The documentation of the spatial and historical information
through GIS helps to expand our knowledge base and promote a wider appreciation of the
past landscape.
The Sanborn Fire Insurance Maps are unquestionably an invaluable data source
for historic preservationists. The challenge with these maps has always been the
cumbersome size of the maps making it difficult to browse, reproduce and analyze. The
Sanborn Fire Insurance Maps have publically been available to researchers for years, but
the bulk of the data was spread out over many books of maps, or if on a digital collection,
over a confusing system of sheets, making the process of using the maps in a systematic
fashion to glean a comprehensive database almost impossible. Locating the Sanborn
Maps for one area over a span of years is challenging because the Sanborn Map
Company often completely redrew and renumbered their sheets from one edition to the
next. An area covered by one sheet may be divided among two or three sheets in a later

102
edition. With GIS, the digital maps are catalogued geospatially allowing the analysis of
data to be displayed as an aggregate instead of small snapshots in time.
GIS allows the use of layers of data to easily display a neighborhood during
different time periods, making it possible to analyze changes in the landscape through
time. Both time and space can now be explored allowing researchers to reconstruct past
neighborhoods and show the relationship with the present. When photographs are tied to
locations on the map, there is a better appreciation for understanding each building in
relationship to the surrounding buildings.
In conducting historical urban research over a broad area, it is difficult to see
patterns of change without comparing the differences over time. This study has shown
how using GIS allows multiple data sources to be spatially integrated and examined to
uncover unexplored insights into the past. The GIS approach opens new possibilities for
research in the integrated study of historical areas.
103
Bibliography
Aber, James S. "Brief History of Maps and Cartography."
http://academic.emporia.edu/aberjame/map/h_map/h_map.htm. Accessed March
12, 2012.
Arlitsch, Kenning. "Digitizing Sanborn Fire Insurance Maps for a Full Color Publicly
Accessible Collection." D-Lib Magazine 8, no. 7/8 (2002): 11.
Bernhardsen, Tor. Geographic Information Systems : An Introduction. 3rd ed. New
York: Wiley, 2002.
Berry, Joseph W. III. "Historic Sanborn Maps in the Digital Age: City of New Orleans."
In, Journal of GIS Archaeology, Volume I (2003).
http://www.esri.com/library/journals/archaeology/volume_1/historic_maps.pdf.,
Accessed January 15, 2011.
Bolstad, Paul. Gis Fundamentals : A First Text on Geographic Information Systems. 3rd
ed. White Bear Lake, Minn.: Eider Press, 2008.
"Compare Web Maps." generated by Mary Kodama using ArcGIS On-Line
http://uhm.maps.arcgis.com/apps/OnePane/swipe/index.html?appid=f8dd54bf3afa
4897a4e6b0040c861e38, May 2, 2013.
"Congested District of Honolulu." In Sanborn Fire Insurance Maps, 1914: University of
Hawaii at Manoa Digital Map Collection.
"Critical Nature of Spatial Data in Cultural Resource Management."
http://www.nps.gov/history/hdp/standards/CRGIS/spatial.htm. Accessed May 5,
2012.
"Department of Planning and Permitting Honolulu Land and Information System
(Holis)." http://gis.hicentral.com/data.html. Accessed December 10, 2011
"Digital Sanborn Maps 1867-1970." http://www.proquest.com/en-
US/catalogs/databases/detail/sanborn.shtml. Accessed February 5, 2012.
"Downtown, Honolulu." 21 18'37.52"N and 157 51'44.56W. Google Earth. January 29,
2013., April 22, 2013.
"Fort Street Mall." http://www.fortstreetmall.org/. Accessed January 10, 2013.

104
Frye, Charlie. "Historical Gis Template: Boston 1775."
http://blogs.esri.com/support/blogs/mappingcenter/archive/2009/05/28/historical-
gis-template-boston-1775.aspx. Accessed September 15, 2012.
"Google Earth." http://en.wikipedia.org/wiki/Google_earth. Accessed February 5, 2011
Greaney, Edward "Crossroads." Honolulu Advertiser, March 20, 1958.
"Hawaii State Archives Digital Collection."
http://archives1.dags.hawaii.gov/gallery2/main.php. Accessed November 10,
2012.
"Historic Sanborn Maps of Downtown Honolulu." generated by Mary Kodama using
ArcGIS On-Line
http://uhm.maps.arcgis.com/home/webmap/viewer.html?webmap=d0769837d4a1
436ea6f150afdc84a626, May 2, 2013.
Hoen, Philip R. "Dakin Publishing Company and Its Fire Insurance Maps." 47-59:
Information Bulletin Western Association of Map Libraries, 1976.
Incorporated, Preservation Greensboro. "Blandwood: Where the Old South and New
South Meet." http://www.blandwood.org/blandwood.html. Accessed September
15, 2012.
"Introduction to the Sanborn Map Collection."
http://www.loc.gov/rr/geogmap/sanborn/san4a1.html. Accessed September 2,
2011.
Keister, Kim. "Charts of Change." Historic Preservation: Quarterly of the National
Council for Historic Sites and Buildings 45, no. 3 (March 1993).
"The Key to Symbols." In Description and Utilization of the Sanborn Map. New York:
Sanborn Map Company, 1942.
Knowles, Anne Kelly, and Amy Hillier. Placing History: How Maps, Spatial Data, and
Gis Are Changing Historical Scholarship. 1st ed. Redlands, Calif.: ESRI Press,
2008.
Kolodziej, Kris, Raul P. Lejano, Chikako Sassa,, and Jalal Ghaemghami Sushila
Maharjan, and Thomas Plant. "Mapping the Industrial Archeology of Boston."
URISA Journal 16, no. 1 (2004): 9.

105
"Mapping Medieval Chester." http://www.medievalchester.ac.uk/index.html. Accessed
September 15, 2012.
"Mapping the Medieval Urban Landscape." http://www.qub.ac.uk/urban_mapping/.
Accessed September 15, 2012
"National Historic Preservation Act of 1966, as Amended through 1992." In 16 U.S.C.
470. Washington, D.C.: US Congress, 1992.
Oswald, Diane L. Fire Insurance Maps: Their History and Applications. College Station,
Tex.: Lacewing Press, 1997.
Robinson, William R. . "Archaeological Data Management and Analysis at Blandwood
Mansion." University of North Carolina at Greensboro, 2010.
"Sanborn Fire Insurance Map." In Proquest LLC, Digital Sanborn Fire Insurance Maps,
1927.
Schlereth, Thomas J. Artifacts and the American Past. Nashville, Tenn.: American
Association for State and Local History, 1980.
"Using Maps in Genealogical Research." http://www.ancestry.com. Accessed October 5,
2012.
"A Visit to the Sanborn Library." Milford: EDR (Environmental Data Resources Inc),
2007.
Wade, Tasha, and Shelly Sommer. A to Z Gis : An Illustrated Dictionary of Geographic
Information Systems. 2nd ed. Redlands, Calif.: ESRI Press : Independent
Publishers Group [distributor], 2006.
"Who Uses Gis?". http://www.gis.com/content/who-uses-gis. Accessed September 5,
2012.
Wrigley, Robert L., Jr. "The Sanborn Map as a Source of Land Use Information for City
Planning." Land Economics 25, no. 2 (May, 1949 1949): 3.