mapping functional connectivity in patients with brain lesions
TRANSCRIPT
Mapping Functional Connectivity in Patientswith Brain Lesions
Adrian G. Guggisberg, MD,1,2 Susanne M. Honma, RT,1 Anne M. Findlay, MA,1 Sarang S. Dalal, PhD,1
Heidi E. Kirsch, MD,1,3 Mitchel S. Berger, MD,4 and Srikantan S. Nagarajan, PhD1
Objective: The spatial distribution of functional connectivity between brain areas and the disturbance introduced by focal brainlesions are poorly understood. Based on the rationale that damaged brain tissue is disconnected from the physiological interac-tions among healthy areas, this study aimed to map the functionality of brain areas according to their connectivity with otherareas.Methods: Magnetoencephalography recordings of spontaneous cortical activity during resting state were obtained from 15consecutive patients with focal brain lesions and from 14 healthy control subjects. Neural activity in the brain was estimatedusing an adaptive spatial filtering technique. The mean imaginary coherence between brain voxels was then calculated as anindex of functional connectivity.Results: Imaginary coherence was greatest in the alpha frequency range corresponding to the human cortical idling rhythm. Inhealthy subjects, functionally critical brain areas such as the somatosensory and language cortices had the highest alpha coher-ence. When compared with healthy control subjects, all lesion patients had diffuse or scattered brain areas with decreased alphacoherence. Patients with lesion-induced neurological deficits displayed decreased connectivity estimates in the correspondingbrain area compared with intact contralateral regions. In tumor patients without preoperative neurological deficits, brain areasshowing decreased coherence could be surgically resected without the occurrence of postoperative deficits.Interpretation: Resting state coherence measured with magnetoencephalography is capable of mapping the functional connec-tivity of the brain, and can therefore offer valuable information for use in planning resective surgeries in patients with brainlesions, as well as investigations into structural-functional relationships in healthy subjects.
Ann Neurol 2008;63:193–203
The ability to map the functions of discrete brain re-gions has led to unprecedented advances in the under-standing of brain physiology and pathology. In addi-tion to the enormous utility of cortical maps incognitive and behavioral research, they are routinelyused in the clinical management of patients. In partic-ular, functional maps of individual patient brains areused during surgical planning, to preserve critical braintissue1 and avoid disabling postsurgical functional def-icits. Intraoperative maps based on direct cortical stim-ulation mapping2 are highly reliable but have the dis-advantage of being invasive. Functional maps createdwith noninvasive techniques such as functional mag-netic resonance imaging (fMRI)3,4 or magnetic sourceimaging (MSI)5–8 generally correlate well with intraop-erative findings, but their accuracy can depend on pa-tient cooperation and on study paradigms that are ca-pable of reliably activating the brain area of interest. Inparticular, paradigms for activating language areas are
currently not generally available for clinical functionalimaging.
Instead of mapping brain areas using activation orlesion methods, this study aimed to map brain areas bymeasuring their functional connectivity with other areas.The underlying rationale is that necrotic or structurallydisconnected (ie, nonfunctional) tissue does not partic-ipate in the dynamic interactions occurring between in-tact brain areas and would therefore be expected toshow decreased connectivity. Moreover, it is reasonableto speculate that such decreased connectivity might beobserved during the resting state and during cognitivetasks. Thus, measurement of functional connectivity ofeach brain area with sufficiently high spatial resolution,even if done during the resting state, might yield valu-able information about their functionality, and suchresting state measurements could be made without de-pendence on patient cooperation or specific activationparadigms. Indeed, a pioneering study assessing func-
From the 1Biomagnetic Imaging Lab, Department of Radiology,University of California San Francisco, San Francisco, CA; 2Depart-ment of Neurology, University of Berne, Inselspital, Bern, Switzer-land; and Departments of 3Neurology and 4Neurological Surgery,University of California San Francisco, San Francisco, CA.
Received Jun 13, 2007, and in revised form Jul 24. Accepted forpublication Aug 3, 2007.
Published online Sep 25, 2007, in Wiley InterScience(www.interscience.wiley.com). DOI: 10.1002/ana.21224
Address correspondence to Drs Nagarajan and Guggisberg, Biomag-netic Imaging Lab, Department of Radiology, University of Califor-nia San Francisco (UCSF), 513 Parnassus Avenue, S-362, SanFrancisco, CA 94143-0628.E-mail: [email protected], [email protected]
© 2007 American Neurological Association 193Published by Wiley-Liss, Inc., through Wiley Subscription Services
tional connectivity in patients with brain lesions usingelectroencephalographic (EEG) coherence found highlysignificant decreases in EEG coherence in lesion patientsduring the resting state, and these decreases were mostpronounced in the alpha frequency range correspondingto the human idling rhythm.9 Furthermore, studies us-ing electrocorticographic coherence demonstrated in-creased short-range coherence between electrodes record-ing directly from brain lesions, but decreased long-rangecoherence between tumor and intact tissue.10
However, previous noninvasive EEG- and magne-toencephalography (MEG)-based investigations of thefunctional connectivity of brain lesions were unable torelate changes measured by extracerebral sensors tostructural alterations within the brain, and fMRI-basedconnectivity studies were insensitive to focal cerebrallesions.11 Therefore, the spatial distribution of lesion-induced connectivity changes remains poorly under-stood. Furthermore, the available data appear to beconflicting. Whereas EEG and electrocorticographicstudies showed changes restricted to the affected hemi-sphere9 or to the electrodes overlying tumor,10 MEGstudies found that tumors produce diffuse, not focal,decreases in functional connectivity.12,13
Here, we introduce an MEG-based approach that al-lows a precise relation of changes in functional connec-tivity to structural lesions. It first uses a well-established adaptive spatial filtering technique14–19 toestimate the neural oscillations at each volume element(voxel) in the brain from the signals recorded by thewhole MEG sensor array. Then, imaginary coherence(IC) is calculated and used as index of the functionalconnectivity between voxels that is insensitive to vol-ume conduction and sensor crosstalk.20
Subjects and MethodsPatients and Healthy Control SubjectsAll 15 patients with unilateral brain lesions who underwentMEG scanning and MSI at the University of California SanFrancisco (UCSF) Biomagnetic Imaging Lab between Febru-ary 2006 and February 2007 and who had a subsequent cra-niotomy with biopsy and/or resection at UCSF were in-cluded in this retrospective study. One further patient wasexcluded because of the presence of bilateral lesions. Themean age of the patients was 39.6 (range, 20–74) years, and9 were women. In addition, 14 healthy control subjects(mean age, 42; range, 25–75 years; 5 women) were studied.All participants gave their written informed consent to partic-ipate in the experiments, all procedures were approved by theUCSF Committee on Human Research, and all experimentswere conducted according to the Declaration of Helsinki.
Structural ImagesMagnetic resonance imaging (MRI) was performed at 1.5Tesla. The protocol typically included the following sequenc-es: (1) a T1-weighted, three-dimensional spoiled gradient-recalled echo in a steady-state sequence with TR of 34 mil-
liseconds, TE of 3 to 8 milliseconds, and flip angle of 30degrees; and (2) a T2-weighted, three-dimensional fast spin-echo sequence with TR of 3,000 milliseconds and TE of 105milliseconds. Both sequences had a slice thickness of 1.5mm,matrix 256 � 256 � (108–140), and a field view of 260 �260mm with skin-to-skin coverage to include the nasion andpreauricular points. Tumor volumes were estimated by re-sampling the MRI volumes into a 1 � 1 � 1mm voxelspace, delineating the lesions (excluding edema) in threeplanes, and calculating the number of voxels included. In ad-dition, voxels that were located within 2cm of a tumor or re-lated edema were manually segmented and defined as “tumorvoxels.”
Magnetoencephalographic RecordingsThe participants were laying awake and with their eyes closedin a magnetically shielded room while their continuous restingstate MEG was recorded with a 275-channel whole-head CTFOmega 2000 system (VSM MedTech, Coquitlam, British Co-lumbia, Canada), using a sampling rate of 600Hz. An artifact-free epoch of 1-minute duration was selected for subsequentanalysis in each patient and subject. These parameters werefound to provide the maximum amount of data within thememory capacity limits of our hardware.
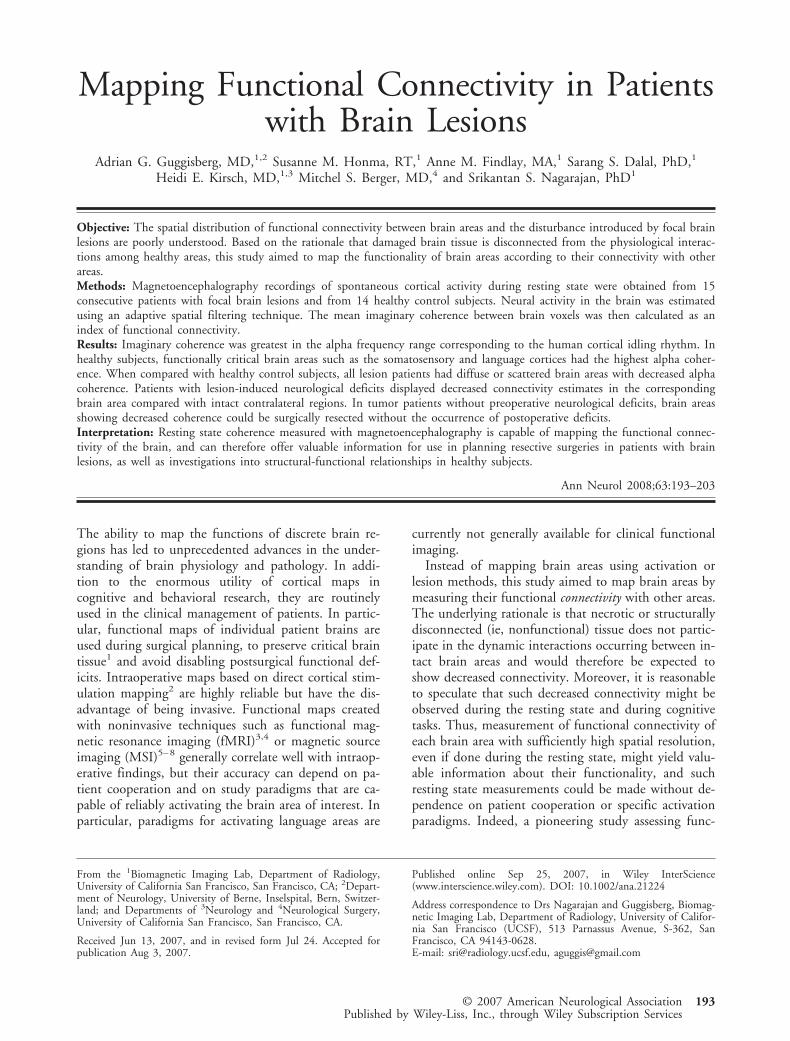
General AlgorithmsAn adaptive spatial filter (“beamformer”) was used to recon-struct the electromagnetic neural activity at each brain voxelfrom the signal recorded by the entire MEG sensor array.The detailed algorithms for this technique are described else-where.15–19 In brief, the raw MEG data were bandpass fil-tered with a fourth-order Butterworth filter, and the spatialcovariance matrix was calculated for the entire recording of 1minute in duration. We also computed the lead-field matrix,corresponding to the forward solution for a unit dipole at aparticular location, for each voxel of interest in the brain.From the spatial covariance and the forward field matrix, aspatial weight matrix was then obtained for optimal estima-tion of the signal power in each voxel. The activity at eachtime in each voxel was calculated as the linear combinationof the spatial weighting matrix with the sensor data matrix.Thus, all sensors contribute to some degree to all voxel timeseries estimates from which we analyze functional connectiv-ity. Most of the commonly used measures of functional con-nectivity such as coherence,21 phase locking value,22,23 andsynchronization likelihood24 overestimate the magnitude oftrue connectivity in this setting because of common refer-ences and crosstalk between voxels (see Fig 1), a problemthat is also well known in connectivity estimation from EEGtime series.25 In addition, traditional approaches to func-tional connectivity are sensitive to volume conduction26 andspatial blur in reconstruction.
Recently, an alternative method for estimating functionalconnectivity was introduced that overcomes the overestima-tion biases arising from crosstalk or volume conduction.20 ICexploits the fact that phase similarities among time seriesarising from a common reference or volume conduction oc-cur with zero time delay. Thus, by omitting the real compo-nent of coherence, which mostly contains similarities with zerotime lag, we remove suspect associations and limit the analysis
194 Annals of Neurology Vol 63 No 2 February 2008
to the imaginary component of coherence, which representstrue interactions between brain areas occurring with a certaintime lag. Figure 1 shows that IC effectively eliminates overes-timation biases in deep brain areas inherent to traditional co-herence, and that it has a functionally plausible spatial distri-bution. IC, I, between a given voxel pair for each frequencybin f was calculated according to the following formula20:
IXY � f � � |Im
�k�1
K
Xk � f � Y*k � f �
��k�1
K
|Xk � f �|2 �k�1
K
|Yk � f �|2| (1)
where Xk and Yk are Hanning-windowed, Fourier-transformed segments of two virtual time series, and * indi-cates the complex conjugate. Each segment k was 2 secondslong and overlapped adjacent segments by 1 second. The ab-solute value of the overall IC across segments was used ratherthan coherency because we were interested in the magnitudeof connectivity at each voxel rather than in the directionalityof the information flow.20 IC values for frequency bandswere calculated from the sum of autospectra and cross-spectra of the corresponding frequency bins.
Estimates of functional connectivity can also be obtainedwith the previously introduced dynamic imaging of coherentsources (DICS) algorithm27 by examining the imaginary partof the cross-spectrum in voxel coordinates. Unlike the pro-posed method, dynamic imaging of coherent sources usescorrelations in the frequency domain for source estimationinstead of temporal correlations. It first calculates a cross-spectrum density matrix of all physical MEG sensors, andthen applies an adaptive spatial filter to reconstruct sourcepower and coherence for a given frequency bin or band. Itcan be shown that the resulting estimates are computation-ally equivalent.
Adaptive spatial filters are based on the assumption thatthe reconstructed sources are independent from each other,and the accuracy of spatial reconstructions and of coherenceestimates reported here therefore depends on the absence ofhighly correlated sources. Previous studies have demonstratedthat, given a sufficient signal-to-noise ratio, significant errorsoccur only when reconstructing sources that have a correla-tion coefficient greater than approximately 0.8514,17,27 andthat are highly correlated during more than 40% of the anal-ysis time window,28 which is rarely the case in recordings ofspontaneous cerebral activity of several seconds to minutes induration. Furthermore, this study focused on regions withlow coherence, which are unaffected by this potential limi-tation.
Functional ImagesA three-dimensional grid of voxels covering the entire brainwas created for each subject and recording, based on a mul-tisphere head model of co-registered structural MRI scans.Alignment of structural and functional images was ensuredby marking three prominent anatomical points (nasion andpreauricular points) of the subject’s head in the MRI imagesand localizing three fiducials attached to the same points be-fore and after each MEG scan.
The selection of bandpass filter settings (ie, of the fre-quency band used for reconstruction of source time series) isa compromise between providing sufficient bandwidth forstability of the spatial filter whereas optimizing the obtainedweighting matrix for a narrow band of interest. At first, abroad 1- to 55Hz band was used for calculation of the spec-tral distribution of IC magnitude. A narrower band of 1 to20Hz was chosen for calculation of IC in the alpha band.
After calculating the time series at each voxel, pairs of vox-els were subjected to analysis of IC as described earlier. Forthe creation of IC spectra, frequency bins between 1 and55Hz were analyzed, using a resolution of 0.59Hz (1,024frequency bins). For analysis of idling rhythms, alpha fre-quency bins that showed greatest power density during rest-
Fig 1. Spatial distribution of average coherence (A) and imag-inary coherence (B) magnitude in the alpha frequency band ofall 14 healthy control subjects. Coherence overestimates connec-tivity, especially in deep brain regions, because of sensorcrosstalk and volume conduction. Images are presented in neu-rological convention.
Guggisberg et al: Functional Connectivity Maps 195
ing state were chosen individually for each subject and aver-aged. A frequency resolution of 1.17Hz (512 frequency bins)was used.
The connectivity, I�, at each voxel of interest was estimatedby averaging across all its Fisher’s Z-transformed connec-tions, C.20
I� � tanh �1
C �C
tanh�1 �I�� (2)
Maps of lesion-specific connectivity changes (L-images) were ob-tained by analyzing all connections between “tumor voxels”(see earlier definition) of 8 � 8 � 8mm extension and acentered, equally spaced, whole-brain grid of each fourthvoxel within the entire set of 8 � 8 � 8mm voxels (approx-imately 10,000–100,000 voxel pairs in total, depending onthe individual head and tumor size). As a control, the con-nectivity I� was also calculated for connections between voxelscontralateral to tumor voxels and the same whole-brain voxelgrid:
I� �PatientTumor, PatientWholeBrain�
N I� �PatientContralateral, PatientWholeBrain� (3)
Maps of patient-specific connectivity changes (P-images) wereobtained by analyzing all possible connections between 2voxels of 20 � 20 � 20mm extension for each tumor pa-tient and, as a control, for each healthy subject (approxi-mately 30,000–60,000 voxel pairs in total, depending onthe individual head size):
I� �PatientWholeBrain�N I� �HealthyControlsWholeBrain� (4)
The computation time of the maps could be reduced toabout 10 minutes by distributing the processing of batches ofvoxel pairs to a cluster of 10 Linux workstations.
Three-dimensional renderings of the maps were createdwith the freely available programs BET29 (http://fsl.fmrib.ox.ac.uk/fsl/bet2/) and mri3dX (http://www.aston.ac.uk/lhs/staff/singhkd/mri3dX/mri3dX.jsp).
Clinical AnalysesMSI of the somatosensory and auditory cortices was per-formed for all tumor patients according to standard proce-dures.8,30 After the MEG scans, all patients underwent cra-niotomy. In 10 patients, intraoperative cortical mapping ofthe motor cortex, language areas, or both, was performed,depending on the tumor location. Subcortical stimulationwas sometimes used to identify the corona radiata and theinternal capsule at the border of the resection.31 Biopsy sam-ples were always obtained. In 14 patients, neoplasms werehistologically confirmed and resected whereas avoiding criti-cal tissue. Neurological deficits before and after surgery wereassessed by qualified physicians who were blinded to theMEG data.
Statistical Analyses and ClassificationsThe mean Z-transformed IC values of all alpha frequencybins between 8 and 12Hz were tested for across-subject dif-ferences between tumor voxels and nontumor voxels of pa-tients with brain tumors using two-tailed paired t tests, andbetween tumor voxels and voxels of healthy control subjectsusing two-tailed unpaired t tests. In accordance with the hy-pothesis that damaged brain tissue is associated with lowervalues of functional connectivity, only patients withoutresection-related postsurgical functional deficits, that is, with-out relevant functional tissue in vicinity of the tumor, wereincluded for this analysis step (n � 10).
L-images were used to assess tumor voxels of all patientsfor within-subject differences with contralateral voxels usingtwo-tailed t tests for one sample, which tested the null hy-pothesis that the Z-transformed connectivity I� between agiven tumor voxel and reference voxels is equal to the meanof the Z-transformed connectivities between all contralateralvoxels and the same reference voxels. The resulting probabil-ities can be corrected easily for multiple testing by using afalse discovery rate. However, because the uncorrected mapsproved to be conservative even in the absence of corrections(ie, no brain area was erroneously mapped as nonfunctionalwhile containing critical tissue), we report here the uncor-rected images.
L-images of all patients were classified into three grades oftumor tissue disconnection according to the percentage oftumor voxels that showed significant increases or decreases inconnectivity as compared with the contralateral tissue: grade2 � �50% of the tumor voxels show significant decreaseand 0% show significant increase; grade 1 � 20 to 50%show decrease and 0% show increase; grade 0 � �20%show decrease or �0% show increase. The tumors were clas-sified as invading or being located close to eloquent tissue ifat least one of the following criteria was fulfilled: MSI equiv-alent current dipoles located within 5mm of the tumor, neu-rological deficits induced by electrical stimulation over thetumor during intraoperative cortical mapping, or increasedneurological deficits after surgery (some of these neurologicaldeficits were transient only and probably caused by swellingbut were also considered as a sign of eloquent tissue in vi-cinity of the tumor). Disconnection grades were then testedfor significant associations with the presence or absence ofeloquent tissue in vicinity of the tumor, and with the risk forpostsurgical deficits using Fisher–Freeman–Halton tests.
To test P-image voxels of all 15 tumor patients for differ-ences with healthy control subjects, we spatially normalizedthem to the canonical Montreal Neurological Institute spaceaccording to the co-registered structural MRI, using the tool-box Statistical Parametric Mapping 2 (SPM2) for MATLAB(http://www.fil.ion.ucl.ac.uk/spm/software/spm2/). All nor-malized P-image voxels of tumor patients with Z-transformedconnectivity estimates greater than or less than the 95% con-fidence interval of the values of healthy control subjects wereconsidered significant. The proportion of “disconnected vox-els” in each patient was defined as the ratio between thenumber of voxels with significantly decreased connectivitycompared with healthy control subjects and the total numberof voxels. The percentage of disconnected voxels was testedfor associations with patient age and tumor volume using
196 Annals of Neurology Vol 63 No 2 February 2008
Spearman’s correlations, and with tumor histology using anonparametric Kruskal-Wallis test.
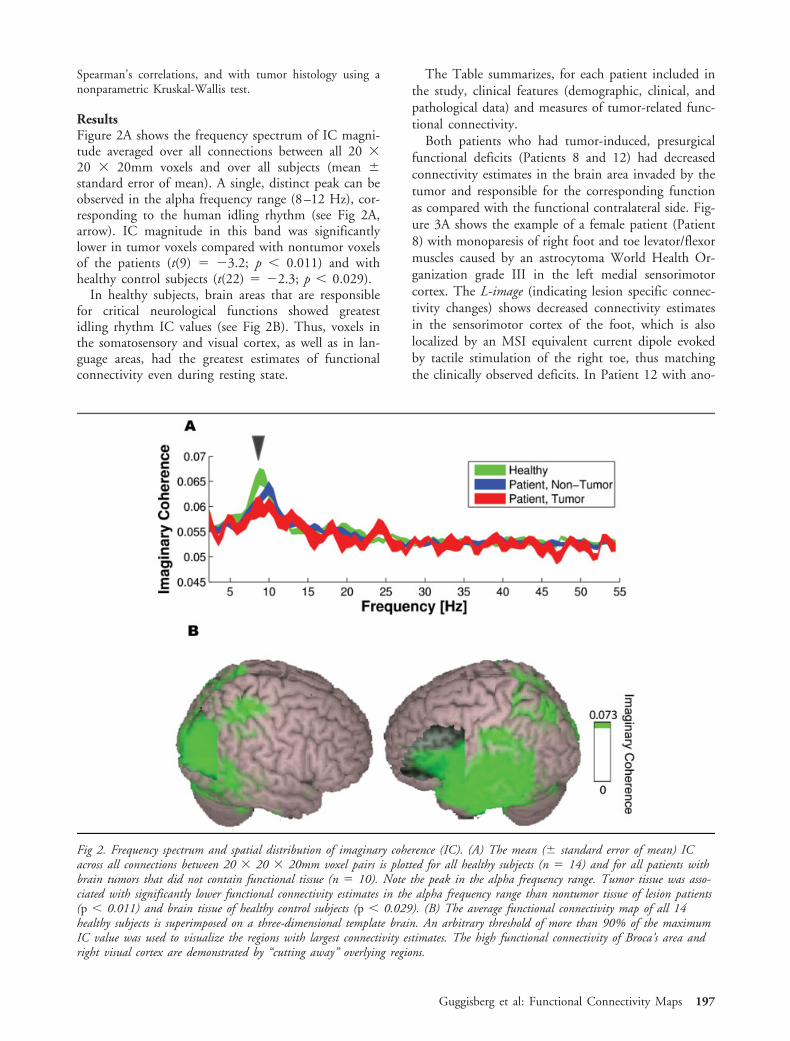
ResultsFigure 2A shows the frequency spectrum of IC magni-tude averaged over all connections between all 20 �20 � 20mm voxels and over all subjects (mean �standard error of mean). A single, distinct peak can beobserved in the alpha frequency range (8–12 Hz), cor-responding to the human idling rhythm (see Fig 2A,arrow). IC magnitude in this band was significantlylower in tumor voxels compared with nontumor voxelsof the patients (t(9) � �3.2; p � 0.011) and withhealthy control subjects (t(22) � �2.3; p � 0.029).
In healthy subjects, brain areas that are responsiblefor critical neurological functions showed greatestidling rhythm IC values (see Fig 2B). Thus, voxels inthe somatosensory and visual cortex, as well as in lan-guage areas, had the greatest estimates of functionalconnectivity even during resting state.
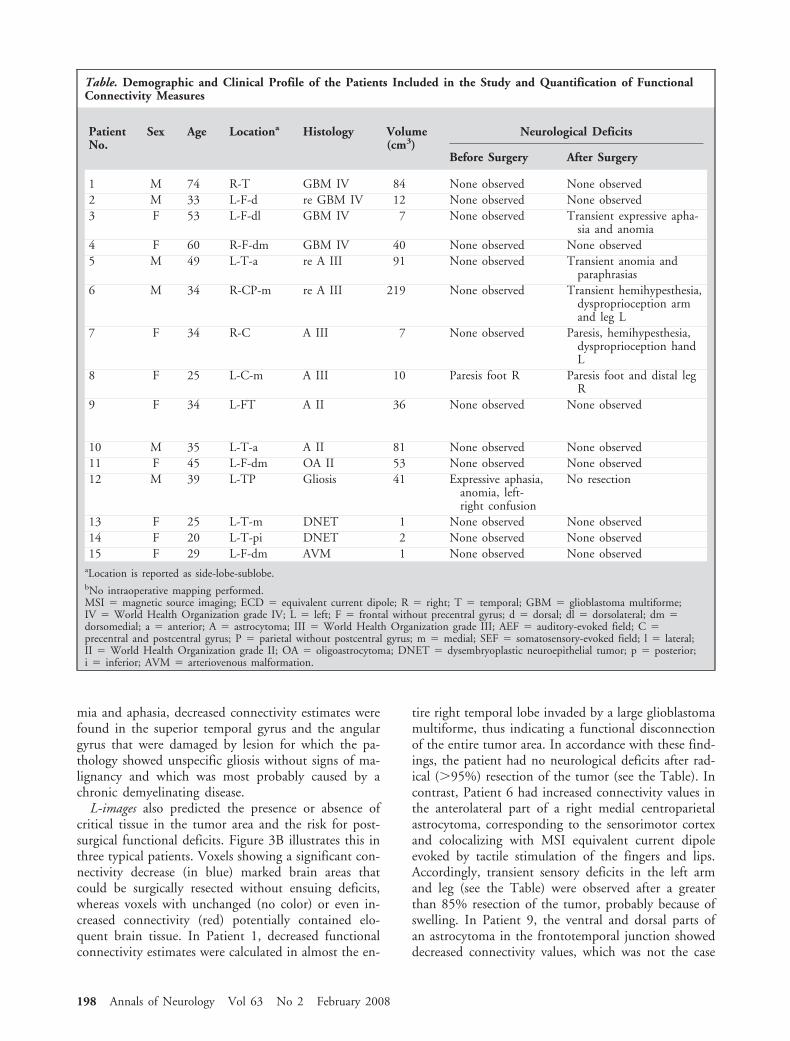
The Table summarizes, for each patient included inthe study, clinical features (demographic, clinical, andpathological data) and measures of tumor-related func-tional connectivity.
Both patients who had tumor-induced, presurgicalfunctional deficits (Patients 8 and 12) had decreasedconnectivity estimates in the brain area invaded by thetumor and responsible for the corresponding functionas compared with the functional contralateral side. Fig-ure 3A shows the example of a female patient (Patient8) with monoparesis of right foot and toe levator/flexormuscles caused by an astrocytoma World Health Or-ganization grade III in the left medial sensorimotorcortex. The L-image (indicating lesion specific connec-tivity changes) shows decreased connectivity estimatesin the sensorimotor cortex of the foot, which is alsolocalized by an MSI equivalent current dipole evokedby tactile stimulation of the right toe, thus matchingthe clinically observed deficits. In Patient 12 with ano-
Fig 2. Frequency spectrum and spatial distribution of imaginary coherence (IC). (A) The mean (� standard error of mean) ICacross all connections between 20 � 20 � 20mm voxel pairs is plotted for all healthy subjects (n � 14) and for all patients withbrain tumors that did not contain functional tissue (n � 10). Note the peak in the alpha frequency range. Tumor tissue was asso-ciated with significantly lower functional connectivity estimates in the alpha frequency range than nontumor tissue of lesion patients(p � 0.011) and brain tissue of healthy control subjects (p � 0.029). (B) The average functional connectivity map of all 14healthy subjects is superimposed on a three-dimensional template brain. An arbitrary threshold of more than 90% of the maximumIC value was used to visualize the regions with largest connectivity estimates. The high functional connectivity of Broca’s area andright visual cortex are demonstrated by “cutting away” overlying regions.
Guggisberg et al: Functional Connectivity Maps 197
mia and aphasia, decreased connectivity estimates werefound in the superior temporal gyrus and the angulargyrus that were damaged by lesion for which the pa-thology showed unspecific gliosis without signs of ma-lignancy and which was most probably caused by achronic demyelinating disease.
L-images also predicted the presence or absence ofcritical tissue in the tumor area and the risk for post-surgical functional deficits. Figure 3B illustrates this inthree typical patients. Voxels showing a significant con-nectivity decrease (in blue) marked brain areas thatcould be surgically resected without ensuing deficits,whereas voxels with unchanged (no color) or even in-creased connectivity (red) potentially contained elo-quent brain tissue. In Patient 1, decreased functionalconnectivity estimates were calculated in almost the en-
tire right temporal lobe invaded by a large glioblastomamultiforme, thus indicating a functional disconnectionof the entire tumor area. In accordance with these find-ings, the patient had no neurological deficits after rad-ical (�95%) resection of the tumor (see the Table). Incontrast, Patient 6 had increased connectivity values inthe anterolateral part of a right medial centroparietalastrocytoma, corresponding to the sensorimotor cortexand colocalizing with MSI equivalent current dipoleevoked by tactile stimulation of the fingers and lips.Accordingly, transient sensory deficits in the left armand leg (see the Table) were observed after a greaterthan 85% resection of the tumor, probably because ofswelling. In Patient 9, the ventral and dorsal parts ofan astrocytoma in the frontotemporal junction showeddecreased connectivity values, which was not the case
Table. Demographic and Clinical Profile of the Patients Included in the Study and Quantification of FunctionalConnectivity Measures
PatientNo.
Sex Age Locationa Histology Volume(cm3)
Neurological Deficits
Before Surgery After Surgery
1 M 74 R-T GBM IV 84 None observed None observed2 M 33 L-F-d re GBM IV 12 None observed None observed3 F 53 L-F-dl GBM IV 7 None observed Transient expressive apha-
sia and anomia4 F 60 R-F-dm GBM IV 40 None observed None observed5 M 49 L-T-a re A III 91 None observed Transient anomia and
paraphrasias6 M 34 R-CP-m re A III 219 None observed Transient hemihypesthesia,
dysproprioception armand leg L
7 F 34 R-C A III 7 None observed Paresis, hemihypesthesia,dysproprioception handL
8 F 25 L-C-m A III 10 Paresis foot R Paresis foot and distal legR
9 F 34 L-FT A II 36 None observed None observed
10 M 35 L-T-a A II 81 None observed None observed11 F 45 L-F-dm OA II 53 None observed None observed12 M 39 L-TP Gliosis 41 Expressive aphasia,
anomia, left-right confusion
No resection
13 F 25 L-T-m DNET 1 None observed None observed14 F 20 L-T-pi DNET 2 None observed None observed15 F 29 L-F-dm AVM 1 None observed None observed
aLocation is reported as side-lobe-sublobe.bNo intraoperative mapping performed.MSI � magnetic source imaging; ECD � equivalent current dipole; R � right; T � temporal; GBM � glioblastoma multiforme;IV � World Health Organization grade IV; L � left; F � frontal without precentral gyrus; d � dorsal; dl � dorsolateral; dm �dorsomedial; a � anterior; A � astrocytoma; III � World Health Organization grade III; AEF � auditory-evoked field; C �precentral and postcentral gyrus; P � parietal without postcentral gyrus; m � medial; SEF � somatosensory-evoked field; l � lateral;II � World Health Organization grade II; OA � oligoastrocytoma; DNET � dysembryoplastic neuroepithelial tumor; p � posterior;i � inferior; AVM � arteriovenous malformation.
198 Annals of Neurology Vol 63 No 2 February 2008
for a region in the frontal operculum. Intraoperativelanguage mapping indeed demonstrated that electricalstimulation in this region elicited speech arrest andanomia, thus indicating that it corresponded to a func-tionally critical expressive language area. Moreover, aspredicted by the L-image, resection of the remainingareas did not produce any functional deficits (see theTable).
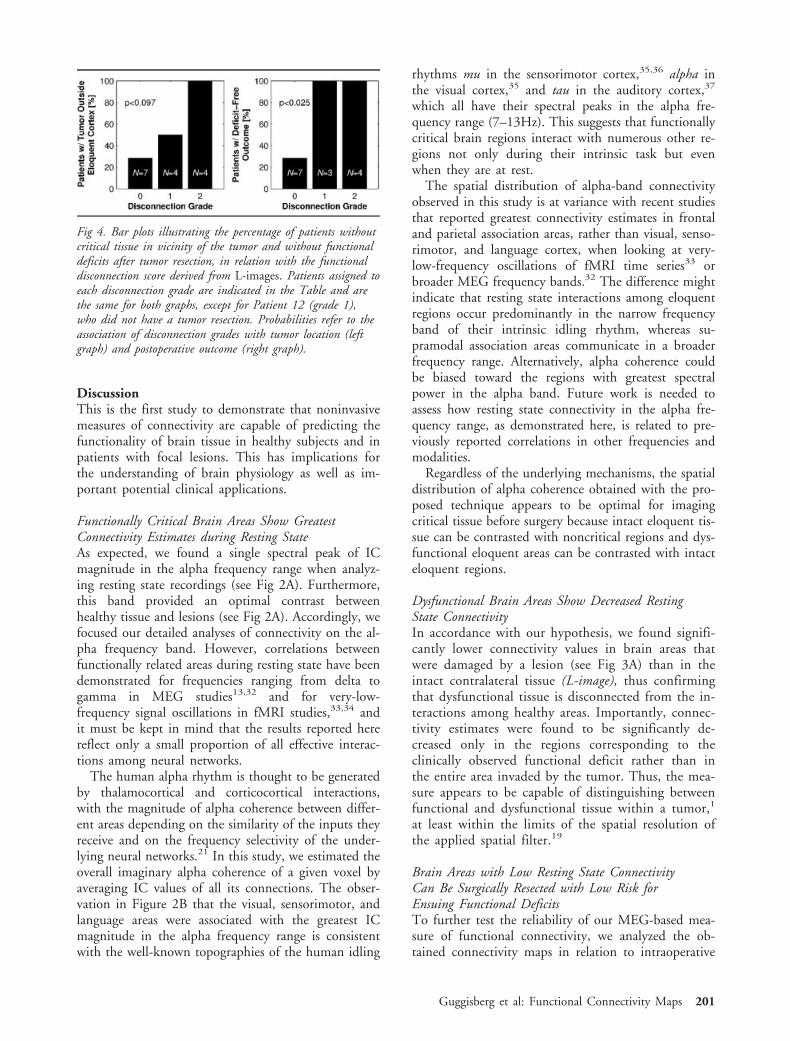
To quantify the validity of L-images across all pa-tients, we classified them into three grades of tumortissue disconnection. The close relation between thedegree of lesion specific connectivity reduction and thefunctionality of the tissue can be seen in the Table andin Figure 4. Note that none of the patients with tumordisconnection grade 2 had eloquent tissue in vicinity ofthe tumor, and none had postsurgical functional defi-
cits. In contrast, this was only the case in 29% of thepatients with disconnection grade 0 (p � 0.025 forpostsurgical outcome; p � 0.097 for presence of criti-cal tissue).
P-images were created to assess patient-specific con-nectivity changes as compared with healthy controlsubjects. Voxels with significant functional connectivitydeficits were found in all patients (see the Table),whereas none of the patients had any voxels with sig-nificantly greater functional connectivity than healthycontrol subjects. As shown in Figure 3, the spatial pat-tern of P-image voxels with decreased connectivity wasunrelated to tumor location and clinical deficits. Fur-thermore, no relation could be found between the per-centage of disconnected voxels and age of patient, tu-mor volume, or tumor histology (p � 0.16).
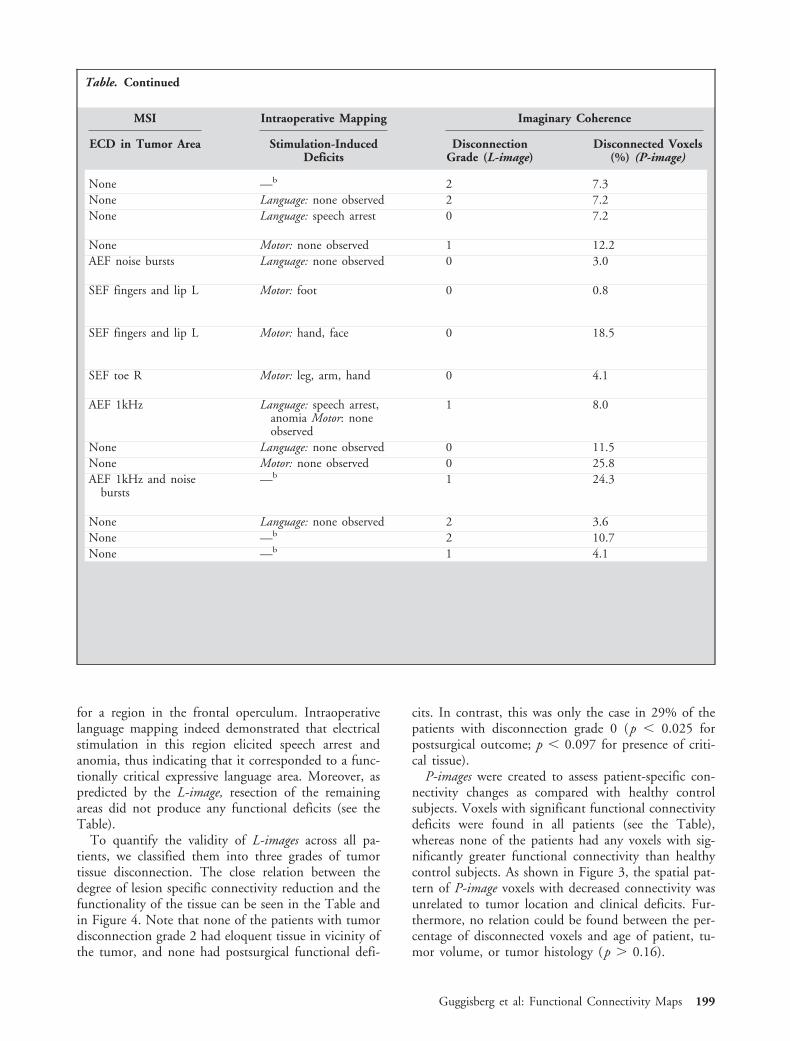
Table. Continued
MSI Intraoperative Mapping Imaginary Coherence
ECD in Tumor Area Stimulation-InducedDeficits
DisconnectionGrade (L-image)
Disconnected Voxels(%) (P-image)
None —b 2 7.3None Language: none observed 2 7.2None Language: speech arrest 0 7.2
None Motor: none observed 1 12.2AEF noise bursts Language: none observed 0 3.0
SEF fingers and lip L Motor: foot 0 0.8
SEF fingers and lip L Motor: hand, face 0 18.5
SEF toe R Motor: leg, arm, hand 0 4.1
AEF 1kHz Language: speech arrest,anomia Motor: noneobserved
1 8.0
None Language: none observed 0 11.5None Motor: none observed 0 25.8AEF 1kHz and noise
bursts—b 1 24.3
None Language: none observed 2 3.6None —b 2 10.7None —b 1 4.1
Guggisberg et al: Functional Connectivity Maps 199
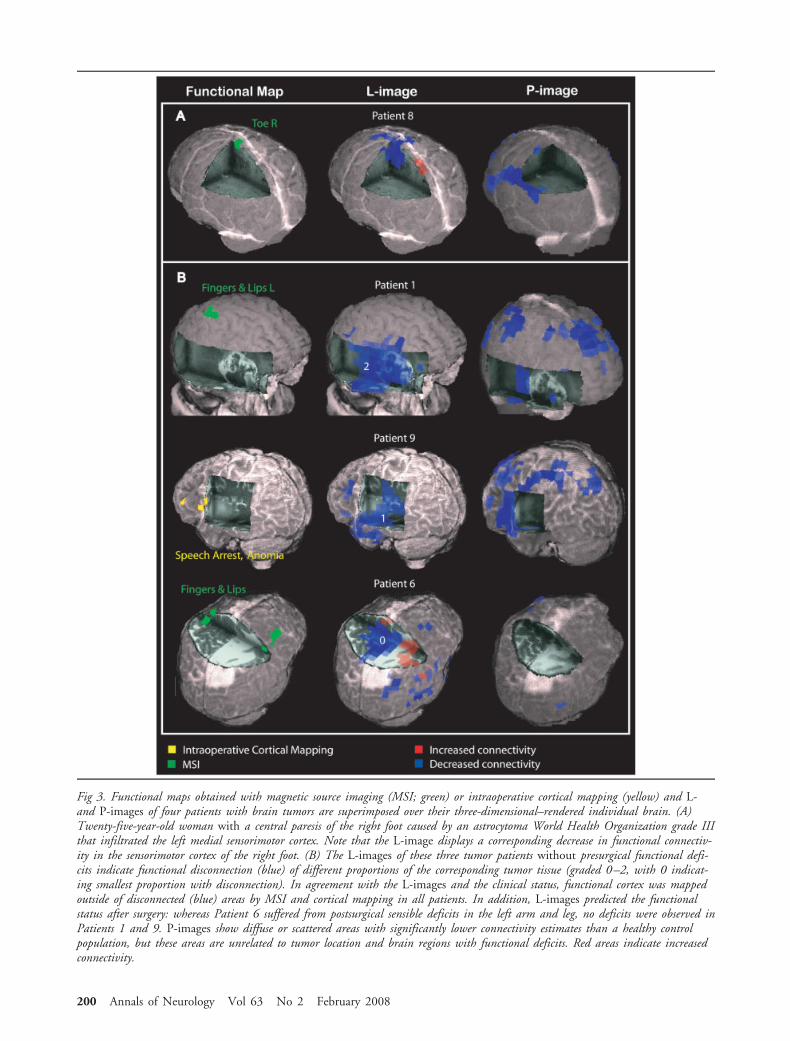
Fig 3. Functional maps obtained with magnetic source imaging (MSI; green) or intraoperative cortical mapping (yellow) and L-and P-images of four patients with brain tumors are superimposed over their three-dimensional–rendered individual brain. (A)Twenty-five-year-old woman with a central paresis of the right foot caused by an astrocytoma World Health Organization grade IIIthat infiltrated the left medial sensorimotor cortex. Note that the L-image displays a corresponding decrease in functional connectiv-ity in the sensorimotor cortex of the right foot. (B) The L-images of these three tumor patients without presurgical functional defi-cits indicate functional disconnection (blue) of different proportions of the corresponding tumor tissue (graded 0–2, with 0 indicat-ing smallest proportion with disconnection). In agreement with the L-images and the clinical status, functional cortex was mappedoutside of disconnected (blue) areas by MSI and cortical mapping in all patients. In addition, L-images predicted the functionalstatus after surgery: whereas Patient 6 suffered from postsurgical sensible deficits in the left arm and leg, no deficits were observed inPatients 1 and 9. P-images show diffuse or scattered areas with significantly lower connectivity estimates than a healthy controlpopulation, but these areas are unrelated to tumor location and brain regions with functional deficits. Red areas indicate increasedconnectivity.
200 Annals of Neurology Vol 63 No 2 February 2008
DiscussionThis is the first study to demonstrate that noninvasivemeasures of connectivity are capable of predicting thefunctionality of brain tissue in healthy subjects and inpatients with focal lesions. This has implications forthe understanding of brain physiology as well as im-portant potential clinical applications.
Functionally Critical Brain Areas Show GreatestConnectivity Estimates during Resting StateAs expected, we found a single spectral peak of ICmagnitude in the alpha frequency range when analyz-ing resting state recordings (see Fig 2A). Furthermore,this band provided an optimal contrast betweenhealthy tissue and lesions (see Fig 2A). Accordingly, wefocused our detailed analyses of connectivity on the al-pha frequency band. However, correlations betweenfunctionally related areas during resting state have beendemonstrated for frequencies ranging from delta togamma in MEG studies13,32 and for very-low-frequency signal oscillations in fMRI studies,33,34 andit must be kept in mind that the results reported herereflect only a small proportion of all effective interac-tions among neural networks.
The human alpha rhythm is thought to be generatedby thalamocortical and corticocortical interactions,with the magnitude of alpha coherence between differ-ent areas depending on the similarity of the inputs theyreceive and on the frequency selectivity of the under-lying neural networks.21 In this study, we estimated theoverall imaginary alpha coherence of a given voxel byaveraging IC values of all its connections. The obser-vation in Figure 2B that the visual, sensorimotor, andlanguage areas were associated with the greatest ICmagnitude in the alpha frequency range is consistentwith the well-known topographies of the human idling
rhythms mu in the sensorimotor cortex,35,36 alpha inthe visual cortex,35 and tau in the auditory cortex,37
which all have their spectral peaks in the alpha fre-quency range (7–13Hz). This suggests that functionallycritical brain regions interact with numerous other re-gions not only during their intrinsic task but evenwhen they are at rest.
The spatial distribution of alpha-band connectivityobserved in this study is at variance with recent studiesthat reported greatest connectivity estimates in frontaland parietal association areas, rather than visual, senso-rimotor, and language cortex, when looking at very-low-frequency oscillations of fMRI time series33 orbroader MEG frequency bands.32 The difference mightindicate that resting state interactions among eloquentregions occur predominantly in the narrow frequencyband of their intrinsic idling rhythm, whereas su-pramodal association areas communicate in a broaderfrequency range. Alternatively, alpha coherence couldbe biased toward the regions with greatest spectralpower in the alpha band. Future work is needed toassess how resting state connectivity in the alpha fre-quency range, as demonstrated here, is related to pre-viously reported correlations in other frequencies andmodalities.
Regardless of the underlying mechanisms, the spatialdistribution of alpha coherence obtained with the pro-posed technique appears to be optimal for imagingcritical tissue before surgery because intact eloquent tis-sue can be contrasted with noncritical regions and dys-functional eloquent areas can be contrasted with intacteloquent regions.
Dysfunctional Brain Areas Show Decreased RestingState ConnectivityIn accordance with our hypothesis, we found signifi-cantly lower connectivity values in brain areas thatwere damaged by a lesion (see Fig 3A) than in theintact contralateral tissue (L-image), thus confirmingthat dysfunctional tissue is disconnected from the in-teractions among healthy areas. Importantly, connec-tivity estimates were found to be significantly de-creased only in the regions corresponding to theclinically observed functional deficit rather than inthe entire area invaded by the tumor. Thus, the mea-sure appears to be capable of distinguishing betweenfunctional and dysfunctional tissue within a tumor,1
at least within the limits of the spatial resolution ofthe applied spatial filter.19
Brain Areas with Low Resting State ConnectivityCan Be Surgically Resected with Low Risk forEnsuing Functional DeficitsTo further test the reliability of our MEG-based mea-sure of functional connectivity, we analyzed the ob-tained connectivity maps in relation to intraoperative
Fig 4. Bar plots illustrating the percentage of patients withoutcritical tissue in vicinity of the tumor and without functionaldeficits after tumor resection, in relation with the functionaldisconnection score derived from L-images. Patients assigned toeach disconnection grade are indicated in the Table and arethe same for both graphs, except for Patient 12 (grade 1),who did not have a tumor resection. Probabilities refer to theassociation of disconnection grades with tumor location (leftgraph) and postoperative outcome (right graph).
Guggisberg et al: Functional Connectivity Maps 201
cortical stimulation results and postsurgical outcome.As shown in the Table, Figure 3B, and Figure 4, alocal decrease in functional connectivity as comparedwith the contralateral region (L-image) reliably indi-cated the resectability of the underlying tissue in all ourpatients. Moreover, 71% of the patients with no con-nectivity deficit or with increased connectivity esti-mates in the brain area invaded by the tumor sufferedfrom transient or permanent functional deficits after itssurgical resection (p � 0.025). The reliability of themethod was better in patients with tumors in the vi-cinity of (or contralateral to) eloquent tissue (centralsulcus, language areas; eg, Patients 1, 3, and 6–9) thanin patients with tumors outside of critical areas (dorso-medial prefrontal cortex; eg, Patients 4 and 11). Thisfits with the finding that critical tissue has the greatestintrinsic connectivity, and thus allows a better contrastwith dysfunctional areas. Future studies might be ableto further improve the reliability of connectivity mapsby segmenting gray and white matter of the individualbrains and limiting the calculation of connectivity mea-sures to gray matter voxel pairs, as well as by usingnovel nonlinear and unbiased measures of connectiv-ity.38
Comparison with Healthy Control SubjectsWhen performing a voxel-wise comparison of connec-tivity estimates between lesion patients and healthycontrol subjects (P-images), we found scattered or dif-fuse areas with decreased connectivity in all patients,which, however, were unrelated to tumor location,clinical deficits, tumor histology, tumor volume, andage of the patient. This confirms the findings of a pre-vious study using MEG-based measures of functionalconnectivity in patients with brain tumors.12 In agree-ment with these authors, we conclude that focal lesionsproduce a diffuse decrease in brain connectivity, whentumor patients are compared with a healthy popula-tion. However, we demonstrate here that when per-forming statistical analyses on the individual patientlevel, significant focal changes can be observed corre-sponding to the location of the tumor and to the pa-tient’s functional state, which agrees with previous elec-trocorticographic studies.10
ConclusionsWe may thus conclude that, unlike conventional im-aging techniques that localize a limited brain area acti-vated by a given paradigm, the proposed approach ap-pears to be capable of mapping the connectivity andfunctionality of the entire cortex whereas requiringmerely 1 minute of recording time and no active par-ticipation from the subjects. This reduces the patienteffort to a minimum and makes the method also suit-able for patients who are unable to cooperate. A larger
prospective study is, however, needed to confirm theclinical usefulness of these findings.
We thank anonymous reviewers for valuable comments and sugges-tions. This was funded in part by NIH grants R01DC004855 andR01DC006435 (S.S.N.).
References1. Ojemann JG, Miller JW, Silbergeld DL. Preserved function in
brain invaded by tumor. Neurosurgery 1996;39:253–258.2. Berger MS, Kincaid J, Ojemann GA, et al. Brain mapping tech-
niques to maximize resection, safety, and seizure control in chil-dren with brain tumors. Neurosurgery 1989;25:786–792.
3. Mueller WM, Yetkin FZ, Hammeke TA, et al. Functional mag-netic resonance imaging mapping of the motor cortex in pa-tients with cerebral tumors. Neurosurgery 1996;39:515–520.
4. Fandino J, Kollias SS, Wieser HG, et al. Intraoperative valida-tion of functional magnetic resonance imaging and cortical re-organization patterns in patients with brain tumors involvingthe primary motor cortex. J Neurosurg 1999;91:238–250.
5. Roberts TP, Zusman E, McDermott M, et al. Correlation offunctional magnetic source imaging with intraoperative corticalstimulation in neurosurgical patients. J Image Guid Surg 1995;1:339–347.
6. Ganslandt O, Fahlbusch R, Nimsky C, et al. Functional neu-ronavigation with magnetoencephalography: outcome in 50 pa-tients with lesions around the motor cortex. J Neurosurg 1999;91:73–79.
7. Alberstone CD, Skirboll SL, Benzel EC, et al. Magnetic sourceimaging and brain surgery: presurgical and intraoperative plan-ning in 26 patients. J Neurosurg 2000;92:79–90.
8. Schiffbauer H, Berger MS, Ferrari P, et al. Preoperative mag-netic source imaging for brain tumor surgery: a quantitativecomparison with intraoperative sensory and motor mapping.Neurosurg Focus 2003;15:E7.
9. Harmony T, Marosi E, Fernandez T, et al. EEG coherences inpatients with brain lesions. Int J Neurosci 1994;74:203–226.
10. Towle VL, Syed I, Berger C, et al. Identification of the sensory/motor area and pathologic regions using ECoG coherence.Electroencephalogr Clin Neurophysiol 1998;106:30–39.
11. Quigley M, Cordes D, Wendt G, et al. Effect of focal andnonfocal cerebral lesions on functional connectivity studiedwith MR imaging. AJNR Am J Neuroradiol 2001;22:294–300.
12. Bartolomei F, Bosma I, Klein M, et al. How do brain tumorsalter functional connectivity? A magnetoencephalography study.Ann Neurol 2006;59:128–138.
13. Bartolomei F, Bosma I, Klein M, et al. Disturbed functionalconnectivity in brain tumour patients: evaluation by graph anal-ysis of synchronization matrices. Clin Neurophysiol 2006;117:2039–2049.
14. Van Veen BD, van DW, Yuchtman M, et al. Localization ofbrain electrical activity via linearly constrained minimum vari-ance spatial filtering. IEEE Trans Biomed Eng 1997;44:867–880.
15. Vrba J, Robinson SE. Signal processing in magnetoencephalog-raphy. Methods 2001;25:249–271.
16. Sekihara K, Nagarajan SS, Poeppel D, et al. Reconstructingspatio-temporal activities of neural sources using an MEG vec-tor beamformer technique. IEEE Trans Biomed Eng 2001;48:760–771.
17. Sekihara K, Nagarajan SS, Poeppel D, et al. Performance of anMEG adaptive-beamformer technique in the presence of corre-lated neural activities: effects on signal intensity and time-courseestimates. IEEE Trans Biomed Eng 2002;49:1534–1546.
202 Annals of Neurology Vol 63 No 2 February 2008
18. Sekihara K, Nagarajan SS, Poeppel D, et al. Performance of anMEG adaptive-beamformer source reconstruction technique inthe presence of additive low-rank interference. IEEE TransBiomed Eng 2004;51:90–99.
19. Sekihara K, Sahani M, Nagarajan SS. Localization bias and spa-tial resolution of adaptive and non-adaptive spatial filters forMEG source reconstruction. Neuroimage 2005;25:1056–1067.
20. Nolte G, Bai O, Wheaton L, et al. Identifying true brain in-teraction from EEG data using the imaginary part of coherency.Clin Neurophysiol 2004;115:2292–2307.
21. Lopes da Silva FH, van Lierop TH, Schrijer CF, et al. Orga-nization of thalamic and cortical alpha rhythms: spectra andcoherences. Electroencephalogr Clin Neurophysiol 1973;35:627–639.
22. Lachaux JP, Rodriguez E, Martinerie J, et al. Measuring phasesynchrony in brain signals. Hum Brain Mapp 1999;8:194–208.
23. Le Van QM, Foucher J, Lachaux J, et al. Comparison of Hil-bert transform and wavelet methods for the analysis of neuronalsynchrony. J Neurosci Methods 2001;111:83–98.
24. Stam CJ, Breakspear M, van Cappellen van Walsum AM, et al.Nonlinear synchronization in EEG and whole-head MEG re-cordings of healthy subjects. Hum Brain Mapp 2003;19:63–78.
25. Fein G, Raz J, Brown FF, et al. Common reference coherencedata are confounded by power and phase effects. Electroen-cephalogr Clin Neurophysiol 1988;69:581–584.
26. Nunez PL, Srinivasan R, Westdorp AF, et al. EEG coherency.I: Statistics, reference electrode, volume conduction, Laplacians,cortical imaging, and interpretation at multiple scales. Electro-encephalogr Clin Neurophysiol 1997;103:499–515.
27. Gross J, Kujala J, Hamalainen M, et al. Dynamic imaging ofcoherent sources: studying neural interactions in the humanbrain. Proc Natl Acad Sci U S A 2001;98:694–699.
28. Hadjipapas A, Hillebrand A, Holliday IE, et al. Assessing inter-actions of linear and nonlinear neuronal sources using MEGbeamformers: a proof of concept. Clin Neurophysiol 2005;116:1300–1313.
29. Smith SM. Fast robust automated brain extraction. Hum BrainMapp 2002;17:143–155.
30. Nakasato N, Kumabe T, Kanno A, et al. Neuromagnetic eval-uation of cortical auditory function in patients with temporallobe tumors. J Neurosurg 1997;86:610–618.
31. Keles GE, Lundin DA, Lamborn KR, et al. Intraoperativesubcortical stimulation mapping for hemispherical perirolan-dic gliomas located within or adjacent to the descending mo-tor pathways: evaluation of morbidity and assessment of func-tional outcome in 294 patients. J Neurosurg 2004;100:369 –375.
32. Bassett DS, Meyer-Lindenberg A, Achard S, et al. Adap-tive reconfiguration of fractal small-world human brain func-tional networks. Proc Natl Acad Sci U S A 2006;103:19518 –19523.
33. Fox MD, Snyder AZ, Vincent JL, et al. The human brain isintrinsically organized into dynamic, anticorrelated functionalnetworks. Proc Natl Acad Sci U S A 2005;102:9673–9678.
34. Achard S, Salvador R, Whitcher B, et al. A resilient, low-frequency, small-world human brain functional network withhighly connected association cortical hubs. J Neurosci 2006;26:63–72.
35. Pfurtscheller G. Event-related synchronization (ERS): an elec-trophysiological correlate of cortical areas at rest. Electroen-cephalogr Clin Neurophysiol 1992;83:62–69.
36. Tiihonen J, Kajola M, Hari R. Magnetic mu rhythm in man.Neuroscience 1989;32:793–800.
37. Lehtela L, Salmelin R, Hari R. Evidence for reactive magnetic10-Hz rhythm in the human auditory cortex. Neurosci Lett1997;222:111–114.
38. Stam CJ, Nolte G, Daffertshofer A. Phase lag index: assessmentof functional connectivity from multi channel EEG and MEGwith diminished bias from common sources. Hum Brain Mapp(in press).
Guggisberg et al: Functional Connectivity Maps 203