mapping genes for plant structure, development and evolution: functional mapping meets ontology
TRANSCRIPT
Review
Mapping genes for plant structure,development and evolution: functionalmapping meets ontologyQiuling He1, Arthur Berg2, Yao Li3, C. Eduardo Vallejos4 and Rongling Wu5,2,6,1
1 The Key Laboratory of Forest Genetics and Gene Engineering, College of Forest Resources and Environment, Nanjing Forestry
University, Nanjing, JS 210037, China2 Department of Public Health Sciences, Pennsylvania State University, Hershey, PA 17033, USA3 Department of Statistics, West Virginia University, Morgantown, WV 26506, USA4 Department of Horticultural Sciences, University of Florida, Gainesville, FL 27606, USA5 The State Key Laboratory of Tree Breeding, College of Life Sciences and Biotechnology, Beijing Forestry University,
Beijing 100083, China6 Department of Statistics, Pennsylvania State University, University Park, PA 16802, USA
One of the fundamental tasks in biology is the identifi-cation of genes that control the structure and develop-mental pattern of complex traits and their responses tothe environment during trait development. Functionalmapping provides a statistical means for detecting quan-titative trait loci (QTLs) that underlie developmentaltraits, such as growth trajectories, and for testing theinterplay between gene action and development. Herewe describe how functional mapping and studies ofplant ontology can be integrated so as to elucidatethe expression mechanisms of QTLs that control plantgrowth, morphology, development, and adaptation tochanging environments. This approach can also be usedto construct an evo-devo framework for inferring theevolution of developmental traits.
Functional mapping for developmental traitsPlants and animals are complex organisms that haveevolved into a diverse array of forms through the accumu-lation of mutations in genes that control the cascades ofdevelopmental processes leading to mature forms [1–3]. Anincreasing number of evolutionary studies have identifiedthe genetic changes that must take place to produce aphenotype that is divergent from its ancestral form [4–
6]. It has been demonstrated that changes in the size andshape of organisms can be the result of heterochrony: thechange in the rate and/or timing of developmental events[1]. Thus, heterochrony can lead to the evolution of newspecies from ancestral forms.
Genetic mapping with molecular markers has proved tobe a powerful tool for dissecting complex phenotypes intotheir underlying quantitative trait loci (QTLs) [7,8]. Thismethodology has been used extensively to map a diversearray of complex phenotypes, but in the vast majority ofcases the endpoint phenotypes have been used as thetarget trait. For example, as one of the most interestingendpoint phenotypes in plant breeding, plant height atmaturity has been extensively studied by traditional
Corresponding authors: Vallejos, C.E. ([email protected]);Wu, R. ([email protected]).
0168-9525/$ – see front matter � 2009 Elsevier Ltd. All rights reserved. doi:10.1016/j.tig.2009.1
genetic mapping, but this approach does not take intoaccount the genetic mechanisms underlying the develop-mental trajectory of this phenotype. To illustrate thispoint, consider a group of segregants from a populationdisplaying exactly the same endpoint phenotype. If theseseemingly identical phenotypes develop over significantlydifferent periods of time, then differences can be attributedto variation in the genes that control the developmentaltrajectory of the phenotype. Functional mapping (Box 1) isa QTL mapping approach that directly targets the genesthat control growth and development by treating thesebiological processes as dynamic traits rather than staticendpoint phenotypes [9–11].
The power of functional mapping rests on its parsimo-nious modeling of temporal trends and the covariancestructure of the model. For these reasons it is statisticallymore advantageous in parameter estimation, gene detec-tion power, and computational efficiency and feasibilitythan traditional QTL mapping methods of complex traitsat individual time points. From a developmental biologyperspective, results from functionalmapping can be visual-ized as dynamic curves of gene expression in time [12–15]and, in principle, offers an opportunity to identify and mapgenes that play a pivotal role in regulating the timing ofmajor developmental milestones [16].
In this article we discuss the versatility of functionalmapping for unraveling the genetic and molecular mech-anisms that control developmental trajectories and mile-stones, and examine pleiotropic effects exerted by somegenes on different developmental landmarks and biologicalprocesses. Functional mapping can play a strengtheningrole in the emerging discipline of biology–ontology [17–23].The marriage between functional mapping and ontology isopening up a new gateway for characterizing the geneticarchitecture of ontogenetic trajectories from embryo tosenescence in developmental time and space. The resultsof this ‘marriage’ are likely to provide impetus for theconstruction of the evo-devo framework of organismicstructure and development so as to address fundamentalquestions related to how developmental processes evolved.
1.004 Available online 26 November 2009 39
Box 1. The basic principle of functional mapping
Model formulation
Functional mapping was originally proposed to detect the genetic
control of QTLs over the length of any developmental stage and any
development event. It is founded on finite mixture models, a type of
density model that comprises a number of component functions.
According to the mixture models, functional mapping assumes that
the curve for individual i from a mapping population, fitted by a finite
set of measurements with T time points, yi = (yi(1), . . ., yi(T)), has
arisen from one of a certain number of components. If there are J
genotypes that contribute to the variation among different curves,
then yi is proportional to the mixture density as follows:
yi � pðyi jvi ;c;hÞ ¼ v1 j i f 1ðyi ; c1;hÞ þ � � � þ vJ j i f Jðyi ; cJ ;hÞ (Eqn I)
where vi = (v1ji, . . ., vJji) are the mixture proportions (i.e. QTL genotype
frequencies) for an individual i that are constrained to be non-negative
and sum to unity; c = (c1, . . ., cJ) are the component- (or genotype)
specific parameters, with cj being specific to component j; and h
represents the parameters that are common to all components. Each
component is modeled by a multivariate distribution density fj(yi;cj,h).
Functional mapping directly models time-specific mean vectors using
the growth parameters of individual QTL genotypes rather than com-
puting mean growth parameters from those estimated for the individ-
uals mapped.
Model structure
To solve the mixture model (Eqn I) upon which functional mapping is
built, we need to perform three tasks. First, the frequency of QTL
genotype j is derived from the genotypes of the markers that are linked
to the QTL. This frequency, expressed as vjji, is individual-specific and
represents a conditional probability of the QTL genotype given the
marker genotype. Depending on the nature of the mapping population,
vjji can be described either in terms of the recombination fraction
(linkage mapping for a crossed pedigree) or of linkage disequilibrium
(association mapping for a natural population). The derivation of the
conditional probability vjji is available in the literature [45,46].
Second, the mean vector for each QTL genotype in the multivariate
normal distribution, fj(yi;cj,h), that is composed of genotypic means at
different time points, is fit by a set of QTL genotype-specific parameters
cj in a parametric, nonparametric, or semiparametric way.
If a functional relationship exists between the expectation of an
observation and its time of measurements and possibly other
covariates, a parametric function can be used. For example, plant
height growth can be modeled by a sigmoid curve (Eqn 1).
By estimating the mathematical parameters, cj = (aj,bj,rj,kj), that
define these different curves for individual QTL genotypes j,
functional mapping allows for the test of genetic control over
developmental patterns of variation for a dynamic trait [12].
When there is no explicit form for dynamic curves, nonparametric
approaches based on B-splines, Legendre polynomials, or kernel
estimators can be used to characterize the change of growth over
time. A complete life process is composed of two sequential phases,
growth and senescence/death. We model the growth phase by the
parametric growth law and the death phase by nonparametric
Legendre polynomials. This semiparametric approach has been
successfully used to identify significant QTLs that control tiller
development in rice [47].
Third, models for covariance structure can incorporate a functional
relationship between the variance or covariance of any two observa-
tions and the times of their measurement, and possibly other
covariates. The covariance structure can be modeled parametrically
by diverse statistical approaches including autoregressive, antede-
pendence, autoregressive moving average, brownian motion, and the
Ornstein–Uhlenbeck processes.
When no functional relationship exists, nonparametric analogs of
parametric modeling can be used [48]. For example, Diggle and
Verbyla [49] used kernel-weighted local linear regression smoothing
of sample variograms ordinates and of squared residuals to provide a
nonparametric estimator for the covariance structure without assum-
ing stationarity. Zeger and Diggle [50] and Moyeed and Diggle [51]
studied a semiparametric model for longitudinal data in which the
covariates were entered parametrically, and only the time effect was
entered non-parametrically. To fit the model, they extended to
longitudinal data using the backfitting algorithm of Hastie and
Tibshirani for semiparametric regression [52].
Hypothesis tests
Functional mapping allows the tests for the genetic control of
individual growth parameters that define the growth function (Eqn 1).
Because these parameters describe different biological aspects of
growth, such tests are biologically meaningful in understanding the
role genes play in regulating growth processes. Also, we can make
hypothesis tests based on the combination of parameters. For example,
the inflection point of a growth curve (1) is the time at which relative
growth rate is maximal, calculated by ln(b/k–1)/r. The growth at the
inflection point is ak1
1�k . How genes control the timing and growth at the
inflection point can be well understood with functional mapping.
Review Trends in Genetics Vol.26 No.1
Although the framework applies to growth trajectories inother species, we have articulated our argument usingplants as an example.
Plant ontologyBiological ontology addresses questions concerning thecomponents of biological systems, the types of relation-ships between these elements, and how this informationcan be organized to facilitate retrieval and utilization. Theincreasing availability of data from several genomesequencing projects has allowed the implementation ofthis concept. Examples include the Gene Ontology Con-sortium site (www.geneontology.org), that covers modelorganisms from all Life Domains, and the Plant OntologyConsortium (POC: http://www.plantontology.org) thatfocuses on model plant species. These and other sites werelaunched to develop standard vocabularies for the genericdescription of molecular function, biological processes, andcellular and higher order structures [17,21,22]. The stan-dard vocabularies allow a uniform annotation of datasetsacross diverse taxonomic groups [23]. This approachmakesontology a powerful tool for investigating genes and their
40
functional and sequence homologs that are involved ingrowth and development. The Open Biomedical Ontology(www.obofoundry.org) was recently created in an effort tostandardize vocabularies among ontologies developed fordiverse organisms [24]. Standardization will greatly facili-tate the phylogenic and evolutionary comparisons ofmorphological structure and developmental patterns.
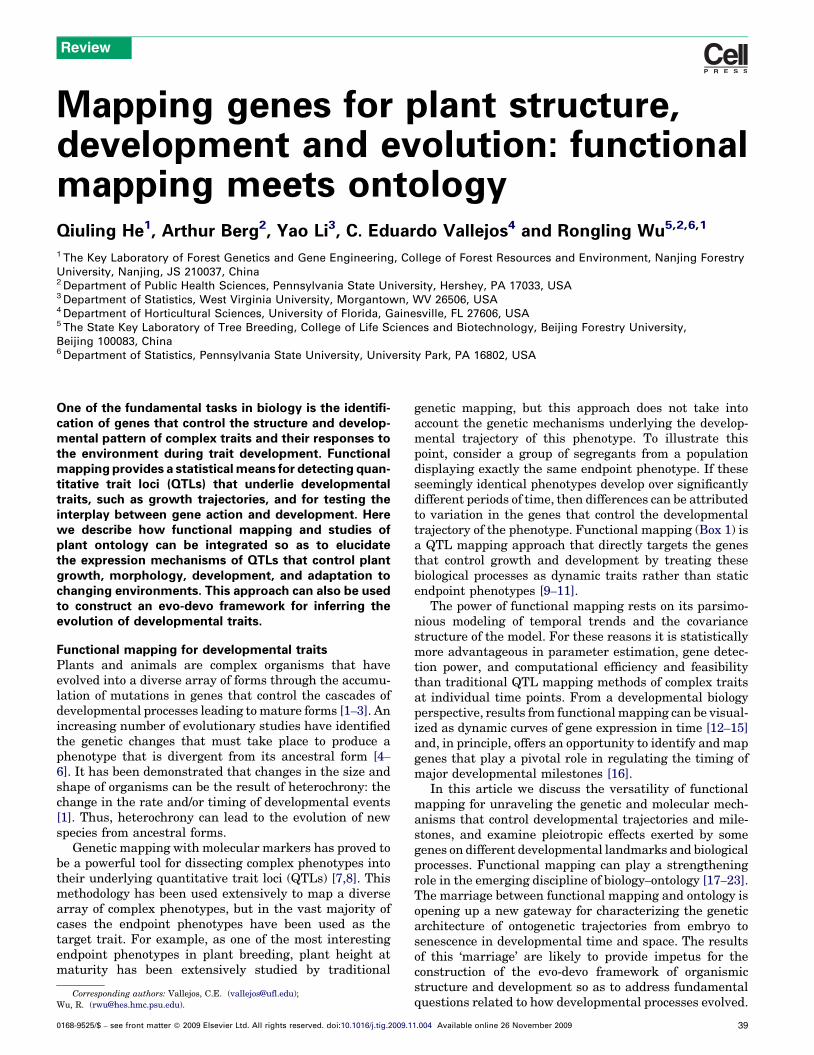
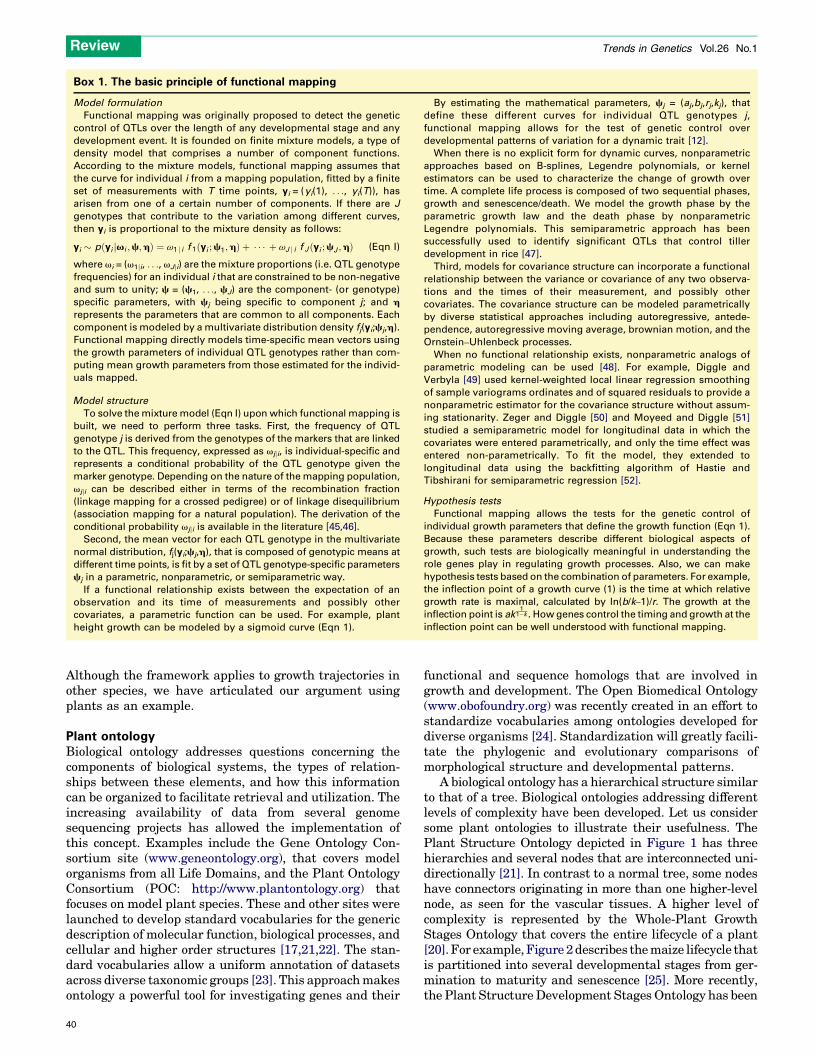
A biological ontology has a hierarchical structure similarto that of a tree. Biological ontologies addressing differentlevels of complexity have been developed. Let us considersome plant ontologies to illustrate their usefulness. ThePlant Structure Ontology depicted in Figure 1 has threehierarchies and several nodes that are interconnected uni-directionally [21]. In contrast to a normal tree, some nodeshave connectors originating in more than one higher-levelnode, as seen for the vascular tissues. A higher level ofcomplexity is represented by the Whole-Plant GrowthStages Ontology that covers the entire lifecycle of a plant[20]. For example, Figure 2describes themaize lifecycle thatis partitioned into several developmental stages from ger-mination to maturity and senescence [25]. More recently,the Plant Structure Development Stages Ontology has been
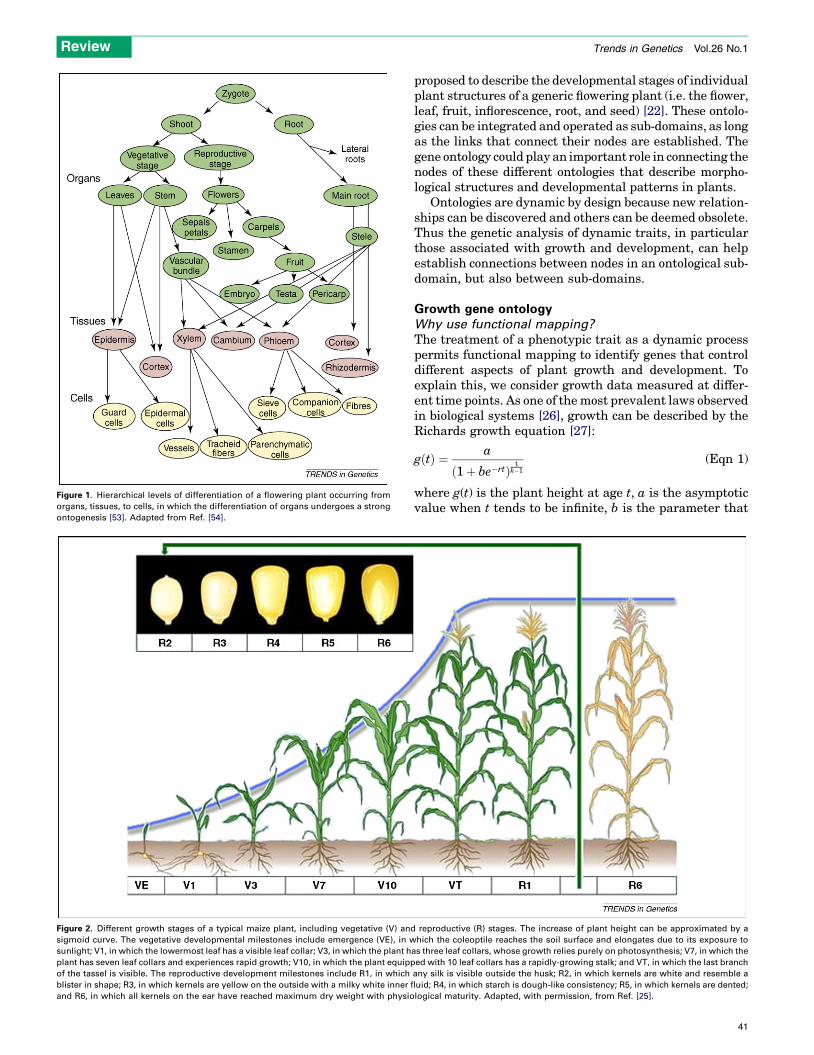
Figure 1. Hierarchical levels of differentiation of a flowering plant occurring from
organs, tissues, to cells, in which the differentiation of organs undergoes a strong
ontogenesis [53]. Adapted from Ref. [54].
Figure 2. Different growth stages of a typical maize plant, including vegetative (V) and
sigmoid curve. The vegetative developmental milestones include emergence (VE), in w
sunlight; V1, in which the lowermost leaf has a visible leaf collar; V3, in which the plant h
plant has seven leaf collars and experiences rapid growth; V10, in which the plant equipp
of the tassel is visible. The reproductive development milestones include R1, in which
blister in shape; R3, in which kernels are yellow on the outside with a milky white inner f
and R6, in which all kernels on the ear have reached maximum dry weight with physio
Review Trends in Genetics Vol.26 No.1
proposed to describe the developmental stages of individualplant structures of a generic flowering plant (i.e. the flower,leaf, fruit, inflorescence, root, and seed) [22]. These ontolo-gies can be integrated and operated as sub-domains, as longas the links that connect their nodes are established. Thegene ontology could play an important role in connecting thenodes of these different ontologies that describe morpho-logical structures and developmental patterns in plants.
Ontologies are dynamic by design because new relation-ships can be discovered and others can be deemed obsolete.Thus the genetic analysis of dynamic traits, in particularthose associated with growth and development, can helpestablish connections between nodes in an ontological sub-domain, but also between sub-domains.
Growth gene ontologyWhy use functional mapping?
The treatment of a phenotypic trait as a dynamic processpermits functional mapping to identify genes that controldifferent aspects of plant growth and development. Toexplain this, we consider growth data measured at differ-ent time points. As one of themost prevalent laws observedin biological systems [26], growth can be described by theRichards growth equation [27]:
gðtÞ ¼ a
ð1þ be�rtÞ1
k�1(Eqn 1)
where g(t) is the plant height at age t, a is the asymptoticvalue when t tends to be infinite, b is the parameter that
reproductive (R) stages. The increase of plant height can be approximated by a
hich the coleoptile reaches the soil surface and elongates due to its exposure to
as three leaf collars, whose growth relies purely on photosynthesis; V7, in which the
ed with 10 leaf collars has a rapidly-growing stalk; and VT, in which the last branch
any silk is visible outside the husk; R2, in which kernels are white and resemble a
luid; R4, in which starch is dough-like consistency; R5, in which kernels are dented;
logical maturity. Adapted, with permission, from Ref. [25].
41
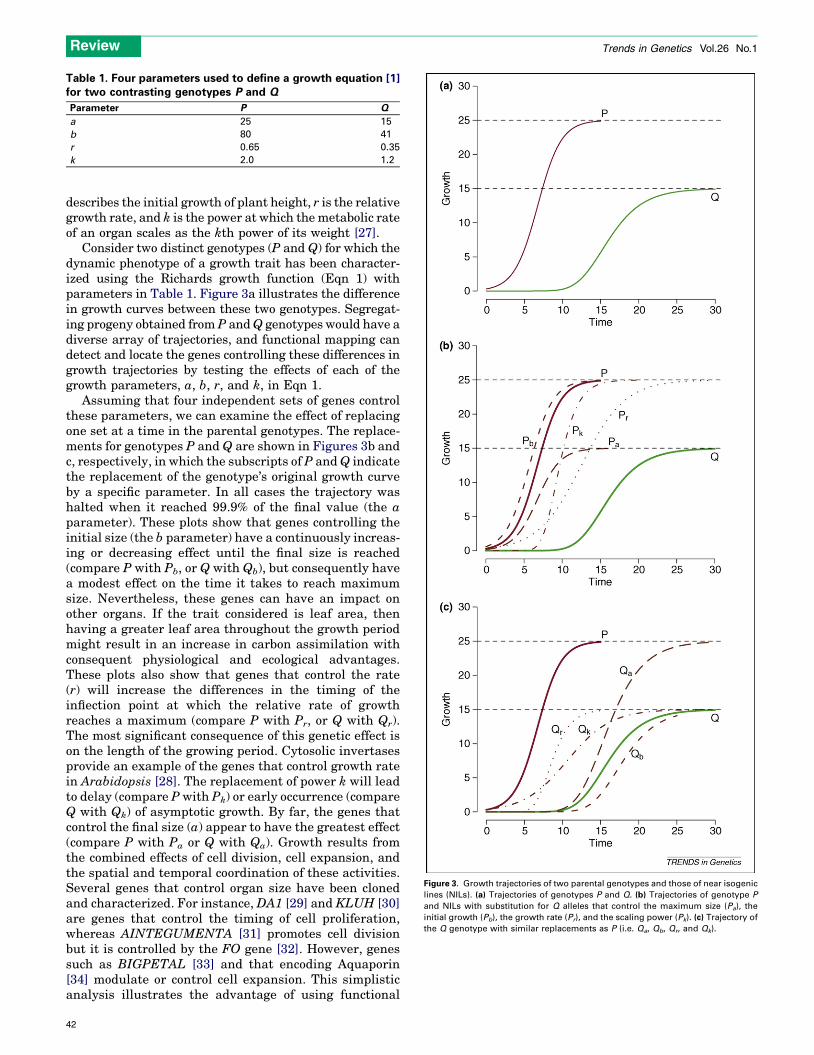
Table 1. Four parameters used to define a growth equation [1]for two contrasting genotypes P and Q
Parameter P Q
a 25 15
b 80 41
r 0.65 0.35
k 2.0 1.2
Figure 3. Growth trajectories of two parental genotypes and those of near isogenic
lines (NILs). (a) Trajectories of genotypes P and Q. (b) Trajectories of genotype P
and NILs with substitution for Q alleles that control the maximum size (Pa), the
initial growth (Pb), the growth rate (Pr), and the scaling power (Pk). (c) Trajectory of
the Q genotype with similar replacements as P (i.e. Qa, Qb, Qr, and Qk).
Review Trends in Genetics Vol.26 No.1
describes the initial growth of plant height, r is the relativegrowth rate, and k is the power at which the metabolic rateof an organ scales as the kth power of its weight [27].
Consider two distinct genotypes (P and Q) for which thedynamic phenotype of a growth trait has been character-ized using the Richards growth function (Eqn 1) withparameters in Table 1. Figure 3a illustrates the differencein growth curves between these two genotypes. Segregat-ing progeny obtained from P andQ genotypes would have adiverse array of trajectories, and functional mapping candetect and locate the genes controlling these differences ingrowth trajectories by testing the effects of each of thegrowth parameters, a, b, r, and k, in Eqn 1.
Assuming that four independent sets of genes controlthese parameters, we can examine the effect of replacingone set at a time in the parental genotypes. The replace-ments for genotypes P and Q are shown in Figures 3b andc, respectively, in which the subscripts of P andQ indicatethe replacement of the genotype’s original growth curveby a specific parameter. In all cases the trajectory washalted when it reached 99.9% of the final value (the aparameter). These plots show that genes controlling theinitial size (the b parameter) have a continuously increas-ing or decreasing effect until the final size is reached(compare P with Pb, or Q with Qb), but consequently havea modest effect on the time it takes to reach maximumsize. Nevertheless, these genes can have an impact onother organs. If the trait considered is leaf area, thenhaving a greater leaf area throughout the growth periodmight result in an increase in carbon assimilation withconsequent physiological and ecological advantages.These plots also show that genes that control the rate(r) will increase the differences in the timing of theinflection point at which the relative rate of growthreaches a maximum (compare P with Pr, or Q with Qr).The most significant consequence of this genetic effect ison the length of the growing period. Cytosolic invertasesprovide an example of the genes that control growth ratein Arabidopsis [28]. The replacement of power k will leadto delay (compare P with Pk) or early occurrence (compareQ with Qk) of asymptotic growth. By far, the genes thatcontrol the final size (a) appear to have the greatest effect(compare P with Pa or Q with Qa). Growth results fromthe combined effects of cell division, cell expansion, andthe spatial and temporal coordination of these activities.Several genes that control organ size have been clonedand characterized. For instance, DA1 [29] and KLUH [30]are genes that control the timing of cell proliferation,whereas AINTEGUMENTA [31] promotes cell divisionbut it is controlled by the FO gene [32]. However, genessuch as BIGPETAL [33] and that encoding Aquaporin[34] modulate or control cell expansion. This simplisticanalysis illustrates the advantage of using functional
42
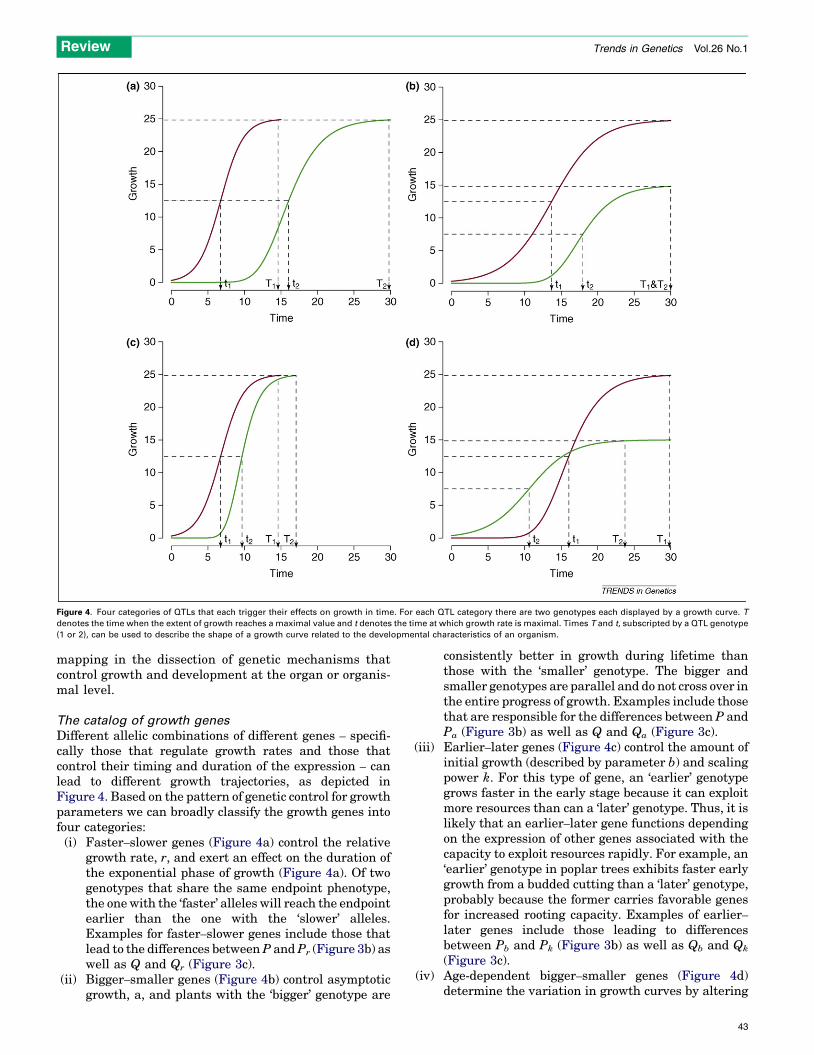
Figure 4. Four categories of QTLs that each trigger their effects on growth in time. For each QTL category there are two genotypes each displayed by a growth curve. T
denotes the time when the extent of growth reaches a maximal value and t denotes the time at which growth rate is maximal. Times T and t, subscripted by a QTL genotype
(1 or 2), can be used to describe the shape of a growth curve related to the developmental characteristics of an organism.
Review Trends in Genetics Vol.26 No.1
mapping in the dissection of genetic mechanisms thatcontrol growth and development at the organ or organis-mal level.
The catalog of growth genes
Different allelic combinations of different genes – specifi-cally those that regulate growth rates and those thatcontrol their timing and duration of the expression – canlead to different growth trajectories, as depicted inFigure 4. Based on the pattern of genetic control for growthparameters we can broadly classify the growth genes intofour categories:
(i) F aster–slower genes (Figure 4a) control the relativegrowth rate, r, and exert an effect on the duration ofthe exponential phase of growth (Figure 4a). Of twogenotypes that share the same endpoint phenotype,the onewith the ‘faster’ alleles will reach the endpointearlier than the one with the ‘slower’ alleles.Examples for faster–slower genes include those thatlead to the differences betweenP andPr (Figure 3b) aswell as Q and Qr (Figure 3c).
(ii) B
igger–smaller genes (Figure 4b) control asymptoticgrowth, a, and plants with the ‘bigger’ genotype areconsistently better in growth during lifetime thanthose with the ‘smaller’ genotype. The bigger andsmaller genotypes are parallel and do not cross over inthe entire progress of growth. Examples include thosethat are responsible for the differences between P andPa (Figure 3b) as well as Q and Qa (Figure 3c).
(iii) E
arlier–later genes (Figure 4c) control the amount ofinitial growth (described by parameter b) and scalingpower k. For this type of gene, an ‘earlier’ genotypegrows faster in the early stage because it can exploitmore resources than can a ‘later’ genotype. Thus, it islikely that an earlier–later gene functions dependingon the expression of other genes associated with thecapacity to exploit resources rapidly. For example, an‘earlier’ genotype in poplar trees exhibits faster earlygrowth from a budded cutting than a ‘later’ genotype,probably because the former carries favorable genesfor increased rooting capacity. Examples of earlier–later genes include those leading to differencesbetween Pb and Pk (Figure 3b) as well as Qb and Qk
(Figure 3c).
(iv) A ge-dependent bigger–smaller genes (Figure 4d)determine the variation in growth curves by altering
43
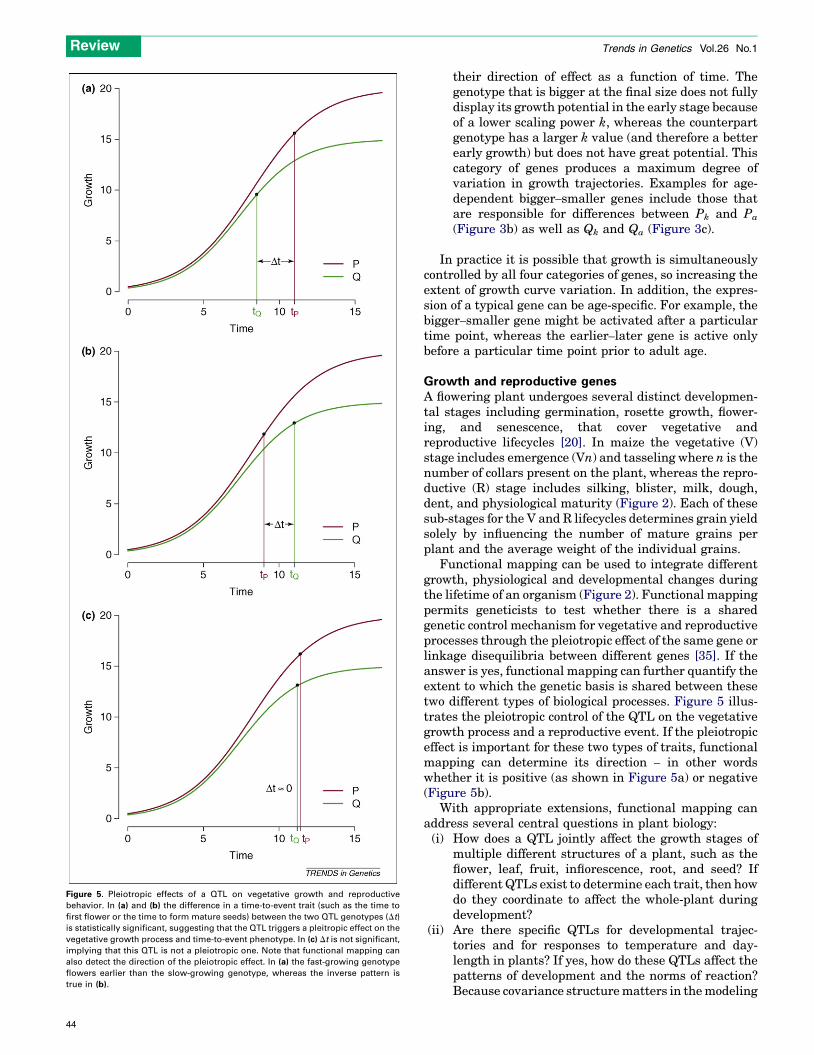
Figure 5. Pleiotropic effects of a QTL on vegetative growth and reproductive
behavior. In (a) and (b) the difference in a time-to-event trait (such as the time to
first flower or the time to form mature seeds) between the two QTL genotypes (Dt)
is statistically significant, suggesting that the QTL triggers a pleitropic effect on the
vegetative growth process and time-to-event phenotype. In (c) Dt is not significant,
implying that this QTL is not a pleiotropic one. Note that functional mapping can
also detect the direction of the pleiotropic effect. In (a) the fast-growing genotype
flowers earlier than the slow-growing genotype, whereas the inverse pattern is
true in (b).
Review Trends in Genetics Vol.26 No.1
44
their direction of effect as a function of time. Thegenotype that is bigger at the final size does not fullydisplay its growth potential in the early stage becauseof a lower scaling power k, whereas the counterpartgenotype has a larger k value (and therefore a betterearly growth) but does not have great potential. Thiscategory of genes produces a maximum degree ofvariation in growth trajectories. Examples for age-dependent bigger–smaller genes include those thatare responsible for differences between Pk and Pa
(Figure 3b) as well as Qk and Qa (Figure 3c).
In practice it is possible that growth is simultaneously
controlled by all four categories of genes, so increasing theextent of growth curve variation. In addition, the expres-sion of a typical gene can be age-specific. For example, thebigger–smaller gene might be activated after a particulartime point, whereas the earlier–later gene is active onlybefore a particular time point prior to adult age.Growth and reproductive genesA flowering plant undergoes several distinct developmen-tal stages including germination, rosette growth, flower-ing, and senescence, that cover vegetative andreproductive lifecycles [20]. In maize the vegetative (V)stage includes emergence (Vn) and tasseling where n is thenumber of collars present on the plant, whereas the repro-ductive (R) stage includes silking, blister, milk, dough,dent, and physiological maturity (Figure 2). Each of thesesub-stages for the V and R lifecycles determines grain yieldsolely by influencing the number of mature grains perplant and the average weight of the individual grains.
Functional mapping can be used to integrate differentgrowth, physiological and developmental changes duringthe lifetime of an organism (Figure 2). Functional mappingpermits geneticists to test whether there is a sharedgenetic control mechanism for vegetative and reproductiveprocesses through the pleiotropic effect of the same gene orlinkage disequilibria between different genes [35]. If theanswer is yes, functional mapping can further quantify theextent to which the genetic basis is shared between thesetwo different types of biological processes. Figure 5 illus-trates the pleiotropic control of the QTL on the vegetativegrowth process and a reproductive event. If the pleiotropiceffect is important for these two types of traits, functionalmapping can determine its direction – in other wordswhether it is positive (as shown in Figure 5a) or negative(Figure 5b).
With appropriate extensions, functional mapping canaddress several central questions in plant biology:
(i) H ow does a QTL jointly affect the growth stages ofmultiple different structures of a plant, such as theflower, leaf, fruit, inflorescence, root, and seed? Ifdifferent QTLs exist to determine each trait, then howdo they coordinate to affect the whole-plant duringdevelopment?
(ii) A
re there specific QTLs for developmental trajec-tories and for responses to temperature and day-length in plants? If yes, how do these QTLs affect thepatterns of development and the norms of reaction?Because covariance structurematters in themodeling
Review Trends in Genetics Vol.26 No.1
of longitudinal data, more robust statisticalapproaches are needed when considering the depen-dence of longitudinal responses to different agents.
(iii) W
hat is the impact of developmental stage and theenvironment on the expression of these QTLs? Dothey interact to form a web of epistatic network thatregulates plant growth and development at the wholeplant level?(iv) H
ow can the developmental pattern of a morphologi-cal trait be genetically coupled with gene expressionprofiling, proteomic profiling, and metabolic profilingat different stages of growth? Can we use these profiledata as biomarkers to predict developmental trajec-tories based on a plant’s genetic makeup?Concluding remarksPlant systems are complex, both structurally and function-ally, and the genes that direct the growth and developmentof a plantwill also have complex patterns of gene expressionin time and space. Functional mapping provides a powerfulstatistical tool for identifying the interplay between genesand development and for determining how the roles ofspecific genes evolve as a function of time. In contrast totraditional QTL mapping approaches that target endpointphenotypes, functional mapping models address discretegrowth stages that span the entire life cycle of the plant,therebymaximizing our ability to detect subtle changes thataffect only a limited aspect of development.
With the completion of genome-sequencing projects forseveral plants and animals [36–44], the next major chal-lenge will be the large-scale determination of gene functionin diverse plant species. However, complete understandingof a gene’s function is only achieved once it is associatedwith a phenotype of interest at the organismal level [4].The next decade will witness a surge of interest in accumu-lating a vast amount of phenotypic data comprising ana-tomical, morphological, and developmental characteristicsof plants. In this regard we must consider that the for-mation and progression of dynamic phenotypes requiretemporal and spatial coordination of the expression ofdifferent gene networks. Functional mapping allowsdynamic phenotypes to be linked with their respectiveunderlying genotypes throughout growth and develop-ment, and can be used to assist plant ontology in capturingand interpreting phenomena associated with these pro-cesses. On a wider view, the marriage of functional map-ping and ontology can shed some light on how genescontrolling developmental trajectories play an importantrole in heterochrony and the evolution of form and struc-ture in plants.
As our understanding of the gene networks and under-lying molecular details of developmental pathwaysimproves, we are faced with the challenge of constructinga genetic regulatory network with data generated fromhigh-throughput genotyping, microarrays, proteomics andtranscriptomics. Functional mapping, plant ontology, geneand ‘omics’ ontologies will together identify problems andgaps in knowledge related to gene annotation in differentplants species in which their developmental and evolution-ary relationships are not yet entirely clear.
AcknowledgementsThis work is partially supported by NSF/NIH Joint grant DMS/NIGMS-0540745, the Changjiang Scholarship Award at Beijing ForestryUniversity, and the Innovation Fund of the Institutes of Food andAgricultural Sciences at the University of Florida.
References1 Rice, S.H. (1997) The analysis of ontogenetic trajectories: when a
change in size or shape is not heterochrony. Proc. Natl. Acad. Sci.U. S. A. 94, 907–912
2 Rice, S.H. (2002) A general population genetic theory for the evolutionof developmental interactions. Proc. Natl. Acad. Sci. U. S. A. 99, 15518–
155233 Raff, R.A. (2000) Evo-devo: the evolution of a new discipline. Nat. Rev.
Genet. 1, 74–794 Boyes, D.C. et al. (2001) Growth stage-based phenotypic analysis of
Arabidopsis: a model for high throughput functional genomics inplants. Plant Cell 13, 1499–1510
5 Barthelemy, D. and Caraglio, Y. (2007) Plant architecture: A dynamic,multilevel and comprehensive approach to plant form, structure andontogeny. Ann. Bot. 99, 375–407
6 Efroni, I. et al. (2008) A protracted and dynamic maturation scheduleunderlies Arabidopsis leaf development. Plant Cell 20, 2293–2306
7 Lander, E.S. and Botstein, D. (1989) Mapping Mendelian factorsunderlying quantitative traits using RFLP linkage maps. Genetics121, 185–199
8 Kao, C.H. and Zeng, Z.B. (2002)Modeling epistasis of quantitative traitloci using Cockerham’s model. Genetics 160, 1243–1261
9 Ma, C.X. et al. (2002) Functional mapping of quantitative trait lociunderlying the character process: A theoretical framework. Genetics161, 1751–1762
10 Wu, R.L. and Lin, M. (2006) Functional mapping – how to map andstudy the genetic architecture of dynamic complex traits. Nat. Rev.Genet. 7, 229–237
11 Wu, R.L. et al. (2003) Molecular dissection of allometry, ontogeny andplasticity: A genomic view of developmental biology. BioScience 53,1041–1047
12 Wu, R.L. et al. (2004) A general framework for analyzing the geneticarchitecture of developmental characteristics.Genetics 166, 1541–1551
13 Wu, R.L. et al. (2004) A mechanistic model for genetic machinery ofontogenetic growth. Genetics 168, 2383–2394
14 Zhao,W. et al. (2004) A unified statistical model for functional mappingof genotype by environment interactions for ontogenetic development.Genetics 168, 1751–1762
15 Zhao, W. et al. (2004) A unifying statistical model for QTL mapping ofgenotype-sex interaction for developmental trajectories. Physiol.Genomics 19, 218–227
16 Poethig, R.S. (2003) Phase change and the regulation of developmentaltiming in plants. Science 301, 334–336
17 Jaiswal, P. et al. (2005) Plant Ontology (PO): A controlled vocabularyof plant structures and growth stages. Comp. Funct. Genomics 6,388–397
18 Bard, J.B. and Rhee, S.Y. (2004) Ontologies in biology: design,applications and future challenges. Nat. Rev. Genet. 5, 213–222
19 Bard, J. et al. (2005) An ontology for cell types. Genome Biol. 6, R2120 Pujar, A. et al. (2006) Whole-plant growth stage ontology for
angiosperms and its application in plant biology. Plant Physiol. 142,414–428
21 Ilic, K. et al. (2007) The plant structure ontology, a unified vocabulary ofanatomy and morphology of a flowering plant. Plant Physiol. 143, 587–
59922 Avraham, S. et al. (2008) The Plant Ontology Database: a community
resource for plant structure and development stages controlledvocabulary and annotations. Nucl. Acids Res. 36, D449–D454
23 Bruskiewich, R. et al. (2002) The Plant OntologyTM Consortium andplant ontologies. Comp. Funct. Genomics 3, 137–142
24 Smith, B. et al. (2007) The OBO Foundry: coordinated evolution ofontologies to support biomedical data integration. Nature Biotechnol.25, 1251–1255
25 Neeser, C. et al. (2004) WeedSOFT1: a weed management decisionsupport system. Weed Sci. 52, 115–122
26 West, G.B. et al. (2001) A general model for ontogenetic growth.Nature413, 628–631
45
Review Trends in Genetics Vol.26 No.1
27 Richards, F.J. (1959) A flexible growth function for empirical use. J.Exp. Bot. 10, 290–300
28 Barratt, D.H.P. et al. (2009) Normal growth of Arabidopsis requirescytosolic invertase but not sucrose synthase.Proc. Natl. Acad. Sci. U. S.A. 106, 13124–13129
29 Li, Y.H. et al. (2008) Control of final seed and organ size by the DA1gene family in Arabidopsis thaliana. Genes Dev. 22, 1331–1336
30 Anastasiou, E. et al. (2007) Control of plant organ size by KLUH/CYP78A5-dependent intercellular signaling. Dev. Cell 13, 843–856
31 Mizukami, Y. and Fischer, L.R. (2000) Plant organ size control:AINTEGUMENTA regulates growth and cell numbers duringorganogenesis. Proc. Natl. Acad. Sci. U. S. A. 97, 942–947
32 Delgado-Benarroch, L. et al. (2009) FORMOSA controls cell divisionand expansion during Floral development in Antirrhinum majus.Planta 229, 1219–1229
33 Szecsi, J. et al. (2006) BIGPETALp, a bHLH transcription factor isinvolved in the control of Arabidopsis petal size. EMBO J. 25, 3912–
392034 Ma, N. et al. (2008) Rh-PIP2;1, a rose aquaporin gene, is involved in
ethylene-regulated petal expansion. Plant Phys. 148, 894–90735 Lin, M. andWu, R.L. (2006) A joint model for nonparametric functional
mapping of longitudinal trajectories and time-to-events. BMCBioinformatics 7, 138
36 Arabidopsis Genome Initiative (2000) Analysis of the genome sequenceof the flowering plant Arabidopsis thaliana. Nature 408, 796–815
37 International Rice Genome Sequencing Project (2005) The map-basedsequence of the rice genome. Nature 436, 793–800
38 Yu, J. et al. (2002) A draft sequence of the rice genome (Oryza sativa L.ssp. indica). Science 296, 79–92
39 Jaillon, O. et al. (2007) The grapevine genome sequence suggestsancestral hexaploidization in major angiosperm phyla. Nature 449,463–467
40 Tuskan, G.A. et al. (2006) The genome of black cottonwood, Populustrichocarpa (Torr. & Gray). Science 313, 1596–1604
46
41 Mouse Genome Sequencing Consortium (2002) Initial sequencingand comparative analysis of the mouse genome. Nature 420, 520–
56242 International Human Genome Sequencing Consortium (2001) Initial
sequencing and analysis of the human genome. Nature 409, 860–92143 Venter, J.C. et al. (2001) The sequence of the human genome. Science
291, 1304–135144 The Chimpanzee Sequencing and Analysis Consortium (2005) Initial
sequence of the chimpanzee genome and comparison with the humangenome. Nature 437, 69–87
45 Wu, R.L. et al. (2007) Statistical Genetics of Quantitative Traits:Linkage, Maps, and QTL, Springer-Verlag
46 Wu, R.L. and Lin, M. (2008) Statistical and ComputationalPharmacogenomics, Chapman & Hall/CRC Press
47 Cui, Y.H. et al. (2006) Functional mapping for genetic control ofprogrammed cell death. Physiol. Genomics 25, 458–469
48 Yap, J.S. et al. (2009) Nonparametric modeling of longitudinalcovariance structure in functional mapping of quantitative trait loci.Biometrics (in press) DOI:10.1111/j.15410420.2009.01222.x (http://www.biometrics.tibs.org/)
49 Diggle, P.J. and Verbyla, A.P. (1998) Nonparametric estimation ofcovariance structure in longitudinal data. Biometrics 54, 401–415
50 Zeger, S.L. and Diggle, P.J. (1994) Semiparametric model forlongitudinal data with application to CD4 cell numbers in HIVseroconvertiers. Biometrics 50, 689–699
51 Moyeed, R.A. and Diggle, P.J. (1994) Rates of convergence insemi-parametric modelling of longitudinal data. Aust. J. Stat. 36,75–93
52 Hastie, T. and Tibshirani, R. (1990) Generalized Additive Models,Chapman & Hall
53 Wareing, P.F. and Phillips, I.D.J. (1978) The Control of Growth andDifferentiation in Plants, Pergamon Press
54 von Sengbusch, P. (2003) Botany Online – The Internet Hypertextbook(http://www.biologie.uni-hamburg.de/b-online/e00/default.htm)