mapping interactions within the evolving science of science and innovation policy community
TRANSCRIPT

Mapping interactions within the evolving scienceof science and innovation policy community
Angela M. Zoss • Katy Borner
Received: 29 November 2011 / Published online: 23 December 2011� Akademiai Kiado, Budapest, Hungary 2011
Abstract The Science of Science and Innovation Policy (SciSIP) program at the National
Science Foundation (NSF) supports research designed to advance the scientific basis
of science and innovation policy. The program was established at NSF in 2005 in response
to a call from Dr. John Marburger III, then science advisor to the U.S. President, for a
‘‘science’’ of science policy. As of January 2011, it has co-funded 162 awards that aim to
develop, improve, and expand data, analytical tools, and models that can be directly
applied in the science policy decision making process. The long-term goals of the SciSIP
program are to provide a scientifically rigorous and quantitative basis for science policy
and to establish an international community of practice. The program has an active listserv
that, as of January 2011, has almost 700 members from academia, government, and
industry. This study analyzed all SciSIP awards (through January 2011) to identify existing
collaboration networks and co-funding relations between SciSIP and other areas of science.
In addition, listserv data was downloaded and analyzed to derive complementary discourse
information. Key results include evidence of rich diversity in communication and funding
networks and effective strategies for interlinking researcher and science policy makers,
prompting discussion, and resource sharing.
Keywords Mixed methods � Content analysis � Collaboration networks �Community mapping
Introduction
Burgeoning research fields depend on a solid scientific and resource foundation as well as
an active community for success and development. The early phases of a new area of
interest offer an opportunity to identify the key research teams, foundational research
works, and communication patterns that influence the growth of the field. While
A. M. Zoss (&) � K. BornerCyberinfrastructure for Network Science Center, School of Library and Information Science,Indiana University, 1320 E. 10th Street, Bloomington, IN 47405, USAe-mail: [email protected]
123
Scientometrics (2012) 91:631–644DOI 10.1007/s11192-011-0574-8

publications and funding awards hint at the structure of the field that will be, publication
and citation time delays lead to data sparseness in the early years. Just as the research
within the field will evolve over time, the associations to and influence from external
research will also change. Other indicators of interaction, such as engagement in scholarly
discourse venues, can provide a richer picture of activity in the field and complement
traditional network analyses to map the structure of younger fields of research.
This paper follows in the tradition of earlier attempts to visualize online communities
(Donath et al 1999; Welser et al 2007; Xiong and Donath, 1999) and begins the work of
mapping the emerging field of Science of Science and Innovation Policy (SciSIP) research
by combining traditional bibliometric methods with content analysis of a less formal
scholarly communication venue: the listserv associated with the NSF SciSIP program
(‘‘Science of Science and Innovation Policy,’’ 2010). Analyzing discourse can highlight
both the roles of individual community members and the patterns of solicitation and
response that guide interaction. These may offer insights into the growth of the community
unavailable by other methods.
Research questions
This research is informed by the following research questions:
• What interactions are made visible by analysis of formal communication channels like
awards and publications?
• How can analysis of informal communication supplement traditional analysis
techniques?
• What roles do researchers play in the various interaction networks?
In this study, traditional network analysis techniques are used to analyze funding,
collaboration, and communication networks, each of which operationalize a type of
interaction relevant to the SciSIP community. These methods are contextualized by and
layered with the results of a content analysis that examines communication strategies and
evaluates their effectiveness.
Methods
The network analyses presented here use award and publication data from the NSF SciSIP
program downloaded from National Science Foundation Award Search site (‘‘NSF’s Award
Search,’’ 2008). The email messages used for the content analysis were sent to the SciSIP
listserv ([email protected]) between January 1, 2009 and December 31, 2010 (24 months).
Award and publication data
Quantitative analysis of the SciSIP award data began by preparing the award and publi-
cation data collected from the NSF award search site. A search performed by looking up
the ‘‘Science of Science Policy’’ program (i.e., those awards with program element code
‘‘7626’’) on December 17, 2010 resulted in 162 active and expired awards. The award
metadata for these results were downloaded in Excel format. Within the results page, each
award number is linked to the award’s abstract page on the NSF site. Of the 162 awards, 22
of the abstract pages advertise publications that have resulted from the award, and these
632 A. M. Zoss, K. Borner
123

references were collected and associated with the award metadata for these awards. A total
of 56 unique publications1 were found for the 22 awards. Publication data are summarized
in Table 1.
Award and publication metadata were processed to normalize the names of investigators
and authors for the collaboration networks. Award amounts were split evenly among
investigators and funding programs in determining the normalized amount of funding
received or distributed. Individuals were also cross-referenced with members of the listserv
to determine how many investigators and authors were also captured within our participant
list for the SciSIP listserv. Networks were generated and analyzed using the Sci2 Tool (Sci2
Team 2009; Weingart et al. 2010).
Listserv data
Content analysis began by preparing the data collected from the SciSIP listserv. Because
the community of practice includes both those who send messages to the listserv and those
who subscribe but do not actively participate in discussion, the roster of subscribers was
retrieved from the listserv. As of January 21, 2010, the SciSIP listserv had 475 ‘‘normal’’
members (where ‘‘normal’’ is the default membership type given by the listserv program).
A follow-up request on December 18, 2010 showed 659 members. An additional request
on January 10, 2011 to examine continued growth showed 674 members.
These membership rosters were compared, normalized, and combined with the list of
message senders to capture as large of a snapshot of the community as possible. For
example, senders were matched to registered emails where possible, but they were retained
even if they did not appear on any of the subscription lists. The full list of normalized
participants with connections to the listserv used for this study comprises 728 individuals.
This snapshot is almost certainly a subset of the individuals who have ever subscribed to the
listserv, but it is likely to be a large and representative sample of the membership of the list,
given the relative youth of the list and the low attrition rate of membership. (Only 36 of the
475 members from January 2010 – less than 8% – had left the list by December 2010, and
the January 2011 list showed a loss of only 2 additional members from the December list).
The full membership list of 728 individuals was analyzed for institutional affiliation and
country to provide descriptive context for the discussions that take place on the listserv. That
is, each individual was associated to a type of institution based on email address or public
employment information. Institutional affiliations (across countries) were normalized to the
Table 1 Publication data,subdivided by start date ofaward and date of publication
Award start date in
2006 2007 2008 2009
Number of Awards 2 5 13 2
Papers Published in
2007 4 3 1 0
2008 5 1 8 0
2009 1 2 14 2
2010 0 3 11 1
1 While these data are certainly incomplete, the extent is not clear. The publications found include papers from2010, but the publication information for each award may still be incomplete. Likewise, many of the awardswithout publication information likely have publications that have not yet been added to the abstract pages.
Evolving science of science and innovation 633
123

following four types, inspired by standard email top-level domains: commercial (com?),
educational (edu?), government (gov?), or non-profit organization (org?). For eg., any
independent, non-profit organization from any country was coded as ‘‘org?’’, regardless of
the domain used by the organization. All government agencies or departments were coded
as ‘‘gov?’’ (as were the small number of ‘‘.mil’’ and ‘‘.us’’ addresses). The ‘‘com?’’ code
includes both individuals that were confirmed to be working for a commercial company and
those using free email services that could not otherwise be associated with an institution.
Summaries of the affiliations and countries of origin can be seen in Tables 2 and 3,
respectively. (The 24 countries with fewer than three senders are omitted).
The entire corpus of email messages to the SciSIP listserv (as of January 4, 2011) was
downloaded, cleaned, and coded for this project. The corpus includes 919 messages from
199 individual senders (or almost 27% of the aggregated membership list of 728). Message
distribution across senders can be seen in Fig. 1. Raw values and logarithmic binning
(Milojevic 2010) emphasize that a majority of senders send only a single message.
Messages were compiled in a format appropriate for analysis by using Microsoft
Outlook and Access, both of which have the capability to convert emails to a tabular
format. Of the 919 messages, two contained content that was unreadable because of text
encoding problems. The header information for these two messages is included in thread
analysis, but as the message content cannot be deciphered, the two messages are excluded
from content analysis.
Results
Funding and publication activity
Traditional bibliometric analyses might utilize funding and publication data similar to the
data set that has been prepared for SciSIP awards. These data are often taken as indicators
Table 2 Normalized institu-tional affiliations for participantson the SciSIP listserv (both thefull list of readers and those whosent messages)
Full list Senders
com? 96 (13%) 14 (7%)
edu? 284 (39%) 94 (47%)
gov? 250 (34%) 66 (33%)
org? 98 (13%) 25 (13%)
Total 728 (100%) 199 (100%)
Table 3 Top 6 normalizedcountries of origin for partici-pants on the SciSIP listserv (boththe full list of readers and thosewho sent messages)
Full list Senders
us 608 (83.52%) 167 (83.92%)
uk 27 (3.71%) 10 (5.03%)
se 20 (2.75%) 3 (1.51%)
ca 15 (2.06%) 3 (1.51%)
au 6 (0.82%) 3 (1.51%)
nl 4 (0.55%) 3 (1.51%)
(24 omitted) – –
Total 728 (100%) 199 (100%)
634 A. M. Zoss, K. Borner
123

of collaboration, interdisciplinarity, productivity, and impact. For example, interdisci-
plinarity might be studied by examining the department affiliations of Principal investi-
gators or the publication outlets of the papers that have been produced by an award.
Productivity might be operationalized as the volume of papers or patents produced by an
award. These measures, however, are highly sensitive to the availability of data, the
duration of an award, the amount awarded, and the time that has elapsed since the start date
of the award. With a program that has only been in operation for a short time, these metrics
will be unavailable or unreliable. The few data points that do exist for the SciSIP program,
however, may hint at the structure of the field as it emerges from multiple domains of
science.
The top ten of the 162 SciSIP awards by dollar amount are summarized in Table 4. The
highest award amounts are dominated by longer contracts that are co-funded by other
programs. When the top ten are excluded, the remaining awards – primarily standard grants
– are of shorter duration (2.49 years on average) and have received smaller award amounts
to date (approximately $235,000 on average).
Interestingly, many of the SciSIP awards are co-funded by other NSF directorates. The
co-funding network in Fig. 2 shows particularly strong ties between SciSIP and Eco-
nomics; Science, Technology and Society; and Innovation & Organizational Sciences
(IOS). None of the 41 programs in the network has co-funded more than 12 awards with
SciSIP, suggesting that the collaborations between SciSIP and other programs are widely
distributed. (The shade of the nodes represents the sum of the normalized awarded
amounts; awarded amounts were divided evenly among the co-funding programs for each
award. The size of the node represents the number of awards co-funded by the program,
and the size of the edges represents the number of awards shared by the two programs).
The co-funding network shows how the SciSIP program is situated within the larger
funding landscape and how it relates to other fields of interest. Collaboration networks such
as co-PI and co-author networks can instead be used to represent the interconnectedness
within a community or field. In the case of SciSIP, an investigator (either as primary
investigator or co-PI) rarely received multiple awards within this 4 year time frame, though
Fig. 1 Distribution of messages across senders, with raw and binned (Milojevic, 2010) values
Evolving science of science and innovation 635
123

Ta
ble
4T
he
top
ten
hig
hes
tfu
nd
edS
ciS
IPaw
ards
Su
bje
ctP
rogra
m(s
)A
war
din
stru
men
tL
eng
tho
faw
ard
(in
yea
rs)
Aw
ard
edam
ou
nt
CY
2002
NS
F/c
ensu
sin
tera
gen
cyag
reem
ent
for
surv
eyo
fin
du
stri
alre
sear
chan
dd
evel
op
men
tR
esea
rch
&d
evel
op
men
tst
atis
t;sc
ien
cere
sou
rces
stat
isti
cs;
SR
Ssu
rvey
;sc
ien
ceo
fsc
ien
cep
oli
cyC
on
trac
tin
tera
gen
cyag
reem
ent
13
$2
2,2
70
,72
4
Res
earc
h,
red
esig
nan
dco
nd
uct
the
surv
eyo
fg
rad
uat
est
ud
ents
and
po
std
oct
ora
tes
insc
ien
ce&
eng
inee
rin
g(G
SS
)F
all
20
07
,2
00
8,
and
20
09
Hum
anre
sourc
esst
atis
tics
PG
M;
scie
nce
reso
urc
esst
atis
tics
;sc
ien
ceo
fsc
ien
cep
oli
cyC
on
trac
t5
$7
,52
5,2
43
Dat
ao
nsc
ien
tifi
cp
ub
lica
tio
ns
Hu
man
reso
urc
esst
atis
tics
PG
M;
scie
nce
&en
gin
eeri
ng
indic
ators
;sc
ience
reso
urc
esst
atis
tics
;S
RS
surv
ey;
scie
nce
of
scie
nce
po
licy
Co
ntr
act
5$
7,3
09
,76
7
Red
esig
no
fth
esu
rvey
of
rese
arch
and
dev
elo
pm
ent
exp
endit
ure
sat
un
iver
siti
esan
dco
lleg
esR
esea
rch
&d
evel
op
men
tst
atis
t;sc
ien
ceo
fsc
ien
cep
oli
cyC
on
trac
t3
$1
,99
9,4
83
Pro
du
cin
ga
BE
A/N
SF
rese
arch
and
dev
lop
men
tsa
tell
ite
acco
un
tR
esea
rch
&d
evel
op
men
tst
atis
t;sc
ien
cere
sou
rces
stat
isti
cs;
SR
Ssu
rvey
;sc
ien
ceo
fsc
ien
cep
oli
cyC
on
trac
tin
tera
gen
cyag
reem
ent
7$
1,8
20
,00
0
Tec
hn
ical
pro
posa
lto
con
duct
ph
ase
2:
po
std
oc
dat
ap
roje
ctS
cien
cere
sourc
esst
atis
tics
;S
RS
surv
ey;
scie
nce
of
scie
nce
po
licy
Co
ntr
act
3$
1,5
83
,57
1
An
atio
nal
surv
eyo
fo
rgan
izat
ion
sto
stu
dy
glo
bal
izat
ion
,in
no
vat
ion
and
emplo
ym
ent
Sci
ence
of
scie
nce
po
licy
;in
no
vat
ion
&o
rgsc
ien
ces
(IO
S);
soci
olo
gy
Sta
nd
ard
gra
nt
3$
1,0
12
,49
6
Man
agem
ent
and
org
aniz
atio
nal
pra
ctic
esac
ross
the
US
Sci
ence
of
scie
nce
poli
cy;
innovat
ion
&org
scie
nce
s(I
OS
);d
ecis
ion
risk
&m
anag
emen
tsc
i;ec
on
om
ics
Sta
nd
ard
gra
nt
2$
79
4,8
78
DA
T:
av
isu
alan
aly
tics
app
roac
hto
scie
nce
and
inn
ov
atio
np
oli
cyS
cien
ceo
fsc
ien
cep
oli
cyS
tan
dar
dg
ran
t3
$7
46,5
71
TL
S:
scie
nce
&te
chno
log
yin
no
vat
ion
con
cep
tk
no
wle
dge-
bas
e(S
TIC
K):
mo
nit
ori
ng
,u
nd
erst
and
ing
,an
dad
van
cin
gth
e(r
)ev
olu
tion
of
scie
nce
&te
chn
olo
gy
inn
ov
atio
ns
Sci
ence
of
scie
nce
po
licy
Sta
nd
ard
gra
nt
3$
71
8,6
44
636 A. M. Zoss, K. Borner
123

investigators do occasionally obtain additional funding for a workshop through a separate
award. As a result, the co-PI network for SciSIP awards is largely unconnected. There
are 236 investigators (including both PIs and co-PIs) in the network. The network has 133
components, including 71 isolated nodes. The 165 connected investigators are thus dis-
tributed over 62 components, for an average of only 2.66 investigators for each of these
components. The density of the network is 0.0055. Rather than taking this low density as
an indication that investigators do not collaborate, the network suggests that the SciSIP
funding mechanism is successfully distributing funding across many different collaborative
groups.
The preliminary publication data collected can be used to supplement award data and
show additional collaborations. Excluding the awards that had no publication data, there
are 22 awards associated with 56 publications. The 123 investigators and authors associ-
ated with these awards and publications are visualized in Fig. 3. The relationship between
two individuals is given by the color and style of the edge between the nodes. Individuals
with a co-PI relationship have a yellow, long-dashed edge. Those with a co-author rela-
tionship have a blue, short-dashed edge. Edges that denote both relationships have a solid
edge in the resulting mixture color: green. Nodes are size-coded by the number of com-
bined awards and papers for which they appear as a collaborator.
Individuals who appear among the 728 identified listserv participants also have a thick,
shaded outline. Of the 123 nodes in the collaboration network, 20(16.2%) also participate
on the listserv. (Among all 139 PIs, 37(26.6%) are listserv participants). All but one of the
listserv participants in the network have edu? affiliations, as might be expected among
award recipients.
Solid edges in the network (representing both co-author and co-PI relationships) are
comparatively rare. There are only six instances of individuals sharing both relationship
types. This particular set of awards includes three awards with five investigators each, but
Fig. 2 Network of programs that co-fund SciSIP awards
Evolving science of science and innovation 637
123

even among these it appears uncommon for investigators to co-author papers. Though
these results are tempered by the sparseness of data, they offer the opportunity to explore
these interactions in a more complete data set. If PIs largely do not share authorship ties,
there may be a division of labor where an investigator ‘‘team’’ is engaging in predomi-
nantly isolated projects.
Activity within the online community
Until the publication and citation data for the field mature, it may be possible to uncover
evidence of interaction and community structure within other community resources, like
the SciSIP listserv. To explore solicitation and response with the community, each listserv
message was assigned to a thread, which in this context is defined as a series of one or
more messages that relate to each other. The 919 messages belong to 426 threads, for an
average of 2.16 messages per thread. Messages without replies are considered threads of
only a single message; there were 322 such threads. The remaining 104 threads contained
597 messages, for an average of 5.74 messages for multi-message threads. The average
length of the threads is 2.69 days over all threads and 7.93 days when excluding single
message threads.
The content analysis of the 425 uncorrupted thread initiation messages identified four
primary types of messages: (1) announcement of a resource (e.g., papers, tools, websites)
or event (e.g., conference, workshop) of interest, (2) request for submissions to a formal
solicitation (e.g., CFP, RFA), (3) request for feedback or input on a posed question or topic
(e.g., looking for literature on a particular subject), and (4) other (e.g., subscription
attempts, technical matters). Each thread was further analyzed by coding the number of
messages in the thread, the length of time between the first message and the last message,
the affiliation of the individual who sent the first message of the thread, the number of
individuals who sent responses to the thread, the affiliations of the individuals who
responded, and the type of message that began the thread. Summary statistics of the coded
threads are available in Tables 5, 6, 7, and 8.
Table 5 shows the responsiveness of threads (or the ability for threads to elicit
response), subdivided by initiation message type. As might be expected, requests for
feedback are over twice as prevalent in the subgroup of messages that received a response
Fig. 3 Collaboration network, including all awards with available publication data
638 A. M. Zoss, K. Borner
123
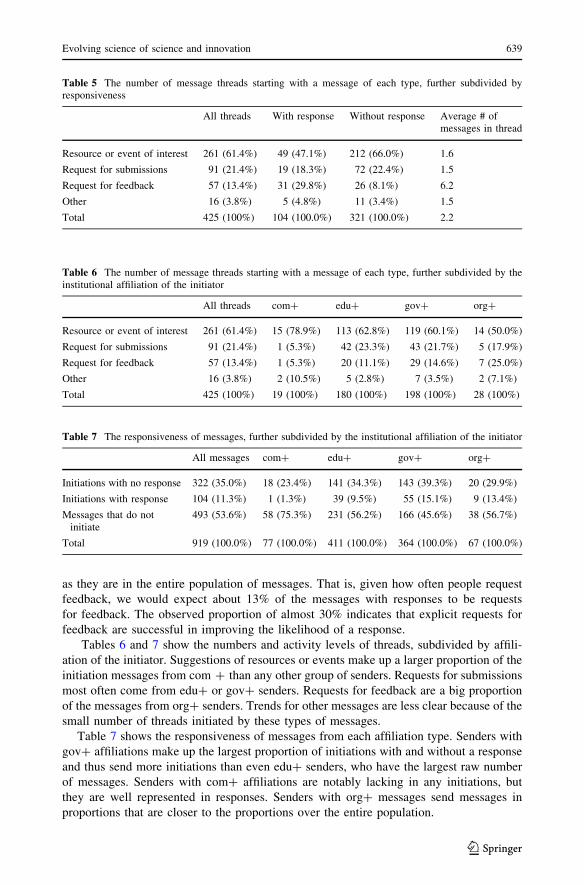
as they are in the entire population of messages. That is, given how often people request
feedback, we would expect about 13% of the messages with responses to be requests
for feedback. The observed proportion of almost 30% indicates that explicit requests for
feedback are successful in improving the likelihood of a response.
Tables 6 and 7 show the numbers and activity levels of threads, subdivided by affili-
ation of the initiator. Suggestions of resources or events make up a larger proportion of the
initiation messages from com ? than any other group of senders. Requests for submissions
most often come from edu? or gov? senders. Requests for feedback are a big proportion
of the messages from org? senders. Trends for other messages are less clear because of the
small number of threads initiated by these types of messages.
Table 7 shows the responsiveness of messages from each affiliation type. Senders with
gov? affiliations make up the largest proportion of initiations with and without a response
and thus send more initiations than even edu? senders, who have the largest raw number
of messages. Senders with com? affiliations are notably lacking in any initiations, but
they are well represented in responses. Senders with org? messages send messages in
proportions that are closer to the proportions over the entire population.
Table 5 The number of message threads starting with a message of each type, further subdivided byresponsiveness
All threads With response Without response Average # ofmessages in thread
Resource or event of interest 261 (61.4%) 49 (47.1%) 212 (66.0%) 1.6
Request for submissions 91 (21.4%) 19 (18.3%) 72 (22.4%) 1.5
Request for feedback 57 (13.4%) 31 (29.8%) 26 (8.1%) 6.2
Other 16 (3.8%) 5 (4.8%) 11 (3.4%) 1.5
Total 425 (100%) 104 (100.0%) 321 (100.0%) 2.2
Table 6 The number of message threads starting with a message of each type, further subdivided by theinstitutional affiliation of the initiator
All threads com? edu? gov? org?
Resource or event of interest 261 (61.4%) 15 (78.9%) 113 (62.8%) 119 (60.1%) 14 (50.0%)
Request for submissions 91 (21.4%) 1 (5.3%) 42 (23.3%) 43 (21.7%) 5 (17.9%)
Request for feedback 57 (13.4%) 1 (5.3%) 20 (11.1%) 29 (14.6%) 7 (25.0%)
Other 16 (3.8%) 2 (10.5%) 5 (2.8%) 7 (3.5%) 2 (7.1%)
Total 425 (100%) 19 (100%) 180 (100%) 198 (100%) 28 (100%)
Table 7 The responsiveness of messages, further subdivided by the institutional affiliation of the initiator
All messages com? edu? gov? org?
Initiations with no response 322 (35.0%) 18 (23.4%) 141 (34.3%) 143 (39.3%) 20 (29.9%)
Initiations with response 104 (11.3%) 1 (1.3%) 39 (9.5%) 55 (15.1%) 9 (13.4%)
Messages that do notinitiate
493 (53.6%) 58 (75.3%) 231 (56.2%) 166 (45.6%) 38 (56.7%)
Total 919 (100.0%) 77 (100.0%) 411 (100.0%) 364 (100.0%) 67 (100.0%)
Evolving science of science and innovation 639
123

Table 8 shows the top ten most active threads. One early initiation received 65
responses in just over a week. The activity level drops off quickly from that peak, and most
threads have a length of only a few days. Eight of the top ten threads were initiated by
senders with gov? affiliations, and all but one was initiated by an explicit request for
feedback.
Figures 4 and 5 give several views of thread activity over time. Figure 4 summarizes
the activity of those who initiate threads. Each chart represents threads started by different
types of initiation messages. All threads in a particular month are collapsed into a single
circle. The circle is placed on the y-axis according to how many threads were started by
senders of a particular affiliation during that month. The size of the circle indicates the
number of different senders who begun threads. Affiliation of the senders who initiated the
threads is represented by the color of the circles.
The circles that float to the top are those that stand for highly active affiliations during a
particular month. The circles that are high and large small represent many threads started
by many different individuals. Overall, higher circles do tend to be larger, suggesting
that more than just a few individuals are initiating threads. A counter-example might be
the requests for submissions initiated by gov? senders in August of 2010. The number of
threads for this month is similar to the number for September, but the circle is much
smaller than that of September.
Over time, threads initiated by announcing a resource or event of interest become more
prevalent, especially for edu? and gov? initiators. There is an early spike for threads that
request feedback, but those stabilize to a lower level than announcements and requests for
submissions.
Figure 5 shows the activity of those responding to the thread initiations. Note again
that only 104 threads received any response. In this figure, the size of the circle shows the
diversity of responders to threads from a particular affiliation in a particular month. That is,
if a thread started by a sender from a particular affiliation elicits responses from responders
of all affiliations, the circle will be the largest size.
Table 8 The top ten most active threads
Subject Number ofmessagesin thread
Initiatoraffiliation
Type ofinitiationmessage
Length ofthread(in days)
Congressional and executive branchrequests for information…
66 gov? Request for feedback 8
Illustration of innovation ecology 33 gov? Request for feedback 14
Need a reference 19 gov? Request for feedback 3
Wiki versus blog versus ??? 16 gov? Request for feedback 2
Question from the executive branch 14 gov? Request for feedback 4
US S&T book/article query? 13 edu? Request for feedback 2
Energy innovation systems from thebottom up…
12 edu? Resource or event ofinterest
2
Help re citations data 12 gov? Request for feedback 2
Federal innovation inducementprizes
12 gov? Request for feedback 2
FW: collaboration - achieving betterresults by working together
12 gov? Request for feedback 2
640 A. M. Zoss, K. Borner
123

Requests for feedback from edu? or gov? initiators, particularly in the early months, tend
to get responses from each of the four affiliation groups (com?, edu?, gov?, and org?).
Also, while com? senders do initiate threads with each type of initiation message (Fig. 4),
only one thread (a resource of interest in March 2010) receives any response. High respondent
diversity (large size) and a high response count (large y-axis value) might be expected from
explicit requests for feedback, and this supposition does seem to be supported by the data.
Figure 6 shows the network of initiations and responses from the 919 listserv messages.
Messages that do not initiate a thread (i.e., all subsequent messages in a thread after it is
Fig. 4 Message activity, including number of threads and senders. Each month has data points for eachtype of initiation message and each affiliation of the thread initiator
Evolving science of science and innovation 641
123

initiated) are treated as responses to the initiation message, although they may in fact be
responses to a response. This convention is adopted to visualize the activity that the
initiation message prompts from the community, as opposed to the precise flow of infor-
mation through the sender network. For example, the directed edges from one individual to
another could be seen as responses that are drawn (directly or indirectly) from members of
the community by the initiator. The indegree of a node is thus a measure of the individual’s
ability to draw many different individuals into the conversation. Outdegree of a node
indicates an individual’s willingness to engage with many different initiators. Nodes are
color-coded by total degree.
Fig. 5 Message activity, including number and affiliations of responders. Each month has data points foreach type of initiation message and each affiliation of the thread initiator
642 A. M. Zoss, K. Borner
123

The size coding of the nodes in the email response network represents the number of
messages sent by the individual. The node outline shade indicates the affiliation of the
node. Each of the four affiliation types is active in the primary component of the network.
The network shows many roles of individuals and many ways of participating in the
discussion, from broadcasters, who send announcements and updates but do not spark or
fuel discussion, to those who serve brokerage roles and those who send only a few mes-
sages but elicit responses from a variety of others. The interconnectedness of the partic-
ipants and the sheer number of links created supports the interpretation of the listserv as an
environment where individuals from many different professions actively engage in a
productive dialogue.
Discussion
Though the highly interdisciplinary SciSIP community is still young and resists widespread
bibliometric analysis, it is possible to use network and content analysis methods to describe
different facets of the community for a more comprehensive view of how the field is
developing. This research shows that while the analysis of formal collaborations suggests
some degree of isolation among award recipients, many of those recipients do participate
in a diverse and active online community. On the other hand, many of the members of
the online community (e.g., those from other countries, those who are not affiliated with
educational or research institutions) are absent from the traditional bibliometric studies,
and though informal communication venues do not serve the same purposes as formal
venues, a richer understanding of the research community as a whole can nonetheless
contribute to ongoing policy and infrastructure decisions related to the field. In a field
Fig. 6 Email response network. Nodes are individuals who sent messages to the listserv. A directed linkpoints from a responder to the person who initiated the thread
Evolving science of science and innovation 643
123

where connections to policy makers and industry professionals are crucial to the success of
researchers and vice versa, it is essential to be able to describe these informal interactions
and analyze how they complement research activities.
Though the limitations of data sparseness and small scope prevent broader general-
izations or predictions, the methods explored here sketch the rough boundaries of the
community and offer suggestions for future research on SciSIP and for new mapping
studies. With more robust publication data, additional bibliometric analyses can be
incorporated and compared to other mapping studies. To increase the scalability of the
content analysis, some automated text mining might be applied to email corpora both
to identify thread assignment (e.g., using quoted material in addition to subject heading)
and to code messages, perhaps by identifying and locating key phrases or other statistical
markers. This paper takes the first early step toward mapping the SciSIP community, but as
the community continues to grow and change, so too must the methods of description and
the questions around which the explorations revolve.
Acknowledgments This work is funded in part by the James S. McDonnell Foundation, the NationalScience Foundation under award SBE-0738111, and the National Institutes of Health under award NIHU24RR029822. Any opinions, findings, and conclusions or recommendations expressed in this material arethose of the author(s) and do not necessarily reflect the views of the National Science Foundation. Thisarticle is an extended version of a paper presented at the 13th International Conference on Scientometricsand Informetrics, Durban (South Africa), 4–7 July 2011 (Zoss & Borner, 2011).
References
Donath, J. Karahalios, K. & Viegas, F. (1999). Visualizing conversation. Journal of Computer-MediatedCommunication, 4(4). Retrieved January 15, 2011 from: http://jcmc.indiana.edu/vol4/issue4/donath.html.
Milojevic, S. (2010). Power law distributions in information science: Making the case for logarithmicbinning. Journal of the American Society for Information Science and Technology, 61(12), 2417–2425.
National Science Foundation Award Search. (2008). Retrieved January 15, 2011 from: http://www.nsf.gov/awardsearch/.
Science of Science and Innovation Policy. (2010). Retrieved January 15, 2011 from: http://www.nsf.gov/funding/pgm_summ.jsp?pims_id=501084&org=sbe.
Sci2 Team. (2009) Science of science (Sci2) tool. Indiana University and SciTech Strategies. RetrievedSeptember 28, 2010 from: http://sci2.cns.iu.edu.
Weingart, S. Guo, H. Borner, K. Boyack, K. W. Linnemeier, M. W. Duhon, R. J. Phillips, P. A. Tank, C. &Biberstine, J. (2010). Science of science (Sci2) tool user manual. Cyberinfrastructure for NetworkScience Center, School of Library and Information Science, Indiana University, Bloomington.Retrieved January 15, 2011 from: http://sci2.wiki.cns.iu.edu.
Welser, H. T. Gleave, E., Fisher, D. & Smith, M. (2007). Visualizing the signatures of social roles in onlinediscussion groups. Journal of Social Structure, 8(2). Retrieved January 15, 2001 from: http://www.cmu.edu/joss/content/articles/volume8/Welser/.
Xiong, R. & Donath, J. (1999). PeopleGarden: Creating data portraits for users. In Proceedings of the 12thannual ACM symposium on User interface software and technology (UIST ‘99), New York, NY, ACM,37–44.
Zoss, A. M. & Borner, K. (2011). Mapping interactions within the evolving Science of science and inno-vation policy community. In: Noyons, E. Ngulube, P. Leta, J. (Eds), Proceedings of ISSI 2011–The13th International Conference on Scientometrics and Informetrics, South Africa, Durban, 4–7 July2011, 924–935.
644 A. M. Zoss, K. Borner
123