mapping invasive species to efficiently monitor · ico) is cheatgrass (bromus tectorum). ... (oli)...
TRANSCRIPT

16 • Connections Across People, Place, and Time
Mapping Invasive Species to Efficiently Monitor Southwestern National Park Areas
Ryan Avery, NASA DEVELOP – Langley Research Center, Mail Stop 307, Hampton VA 23681; [email protected]
Dakoyta Greenman, NASA DEVELOP – Langley Research CenterKatherine Landesman, NASA DEVELOP – Langley Research CenterJordan Vaa, NASA DEVELOP – Langley Research CenterTimmera Whaley, NASA DEVELOP – Langley Research Center
IntroductionWhether purposefully introduced or unintentionally transported, non-native plant species are a major problem across the United States. The excessive competition that pre-adapted invasive species bring to native landscapes has been categorized as the second largest catalyst of extinc-tion and habitat destruction behind human development (Wilcove et al. 1998). This threat poses a serious challenge for the National Park Service. In the southwest, the accumulated impact of the reduction of native herbaceous vegetation and an influx of non-native seeds has increased the landscape’s susceptibility to invasive species (Pellant 1996). To this end, NASA DEVEL-OP’s Southwest US Ecological Forecasting team created invasive species distribution maps using Landsat 8 and Sentinel-2 multispectral imagery, in order to explore the feasibility of these data products to be used in locating invasives.
One of the most widespread and problematic invasive weeds that land managers must contend with in Valles Caldera National Preserve and Bandelier National Monument (both in New Mex-ico) is cheatgrass (Bromus tectorum). Cheatgrass has the ability to germinate in the fall or the spring and is usually dry by mid-July (Pellant 1996; Peterson 2005). This early phenology allows cheatgrass to plant its seeds earlier in the year than other perennial species, allowing it to quickly establish post-wildfire and crowd out native species. Additionally, its early dry season makes it is a significant fire hazard (Menakis, Osborne, and Miller 2002). These advantages allow cheatgrass to permanently alter entire ecosystems, posing threats to the preservation of the native and natural character of parks as well as the ecological functions of the landscape.
Citation: Weber, Samantha, ed. 2017. Connections Across People, Place, and Time: Proceedings of the 2017 George Wright Society Conference on Parks, Protected Areas, and Cultural Sites. Hancock, Michigan: George Wright Society.
© 2017 George Wright Society. All rights reserved. Please direct all permission requests to [email protected].
3
Connections Across People, Place, and Time • 17
Another non-native weed in the southwest region that thrives on fire is giant reed (Arundo do-nax). Since its introduction to California as an erosion control agent in the 1820s, it has now established itself in monocultures along the stream banks of the Rio Grande. This perennial grass can grow up to 10 m (32 ft) in height and, like cheatgrass, giant reed is highly flammable and can propagate quickly after fire by being the first to grow after recent burns (Bell 1997; DiPietro 2002; Yang, Goolsby, and Everitt 2009). Aside from crowding out native species, giant reed does little to provide food or habitat for wildlife and consumes exceptional amounts of water (DiPietro 2002; Yang, Goolsby, and Everitt 2009). These characteristics make giant reed a threat to both the hy-drology and ecosystem health of southwestern Texas.
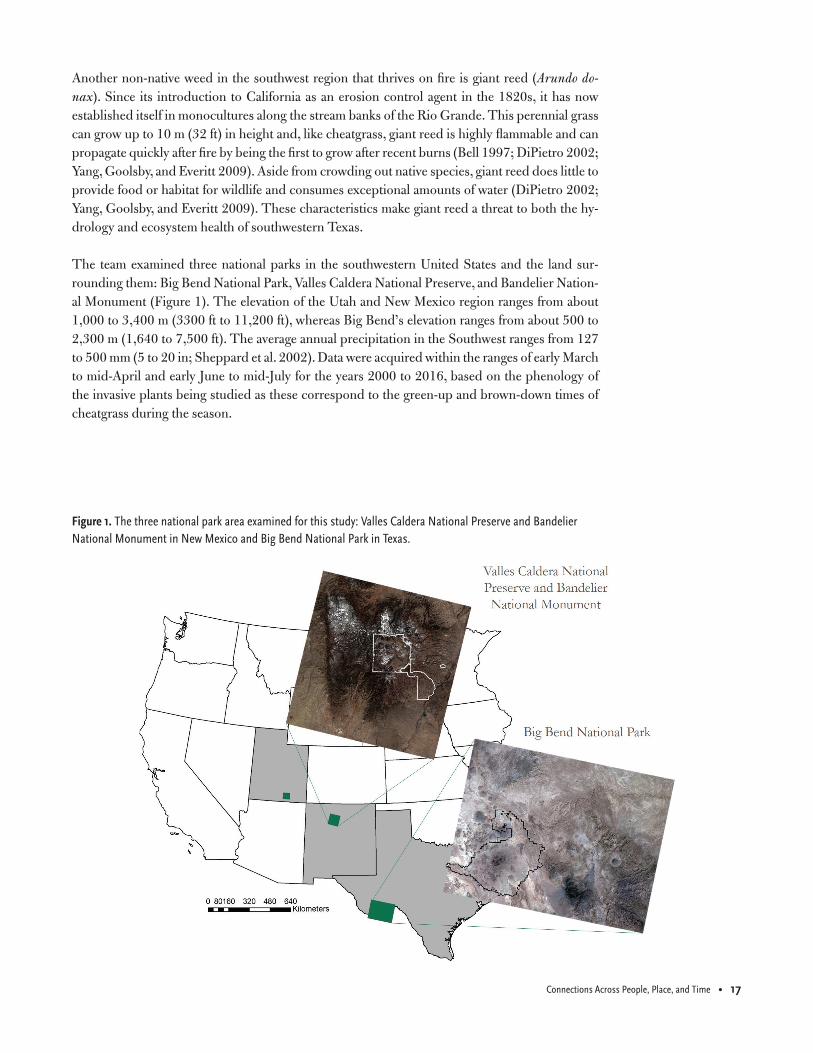
The team examined three national parks in the southwestern United States and the land sur-rounding them: Big Bend National Park, Valles Caldera National Preserve, and Bandelier Nation-al Monument (Figure 1). The elevation of the Utah and New Mexico region ranges from about 1,000 to 3,400 m (3300 ft to 11,200 ft), whereas Big Bend’s elevation ranges from about 500 to 2,300 m (1,640 to 7,500 ft). The average annual precipitation in the Southwest ranges from 127 to 500 mm (5 to 20 in; Sheppard et al. 2002). Data were acquired within the ranges of early March to mid-April and early June to mid-July for the years 2000 to 2016, based on the phenology of the invasive plants being studied as these correspond to the green-up and brown-down times of cheatgrass during the season.
Figure 1. The three national park area examined for this study: Valles Caldera National Preserve and Bandelier National Monument in New Mexico and Big Bend National Park in Texas.
18 • Connections Across People, Place, and Time
MethodsThe team obtained Landsat 5 Thematic Mapper (TM), Landsat 7 ETM+, and Landsat 8 Opera-tional Land Imager (OLI) Surface Reflectance Level 1 imagery for the years 2000 through 2016 from the United States Geological Survey (USGS) Earth Explorer download client. Two images with the least amount of cloudiness were downloaded for each year, one in late April, early May and one in late June, early July, for the study region of each national park area. Images were se-lected in late April and in late June because of cheatgrass’ unique phenology; it greens up before the surrounding vegetation in late April, early May and browns down before other vegetation in late June, early July. However, spatial variance also plays a factor into its phenology. According to our project partners, cheatgrass observations have also shown to green up in May within higher elevations in Valles Caldera National Preserve; therefore, we acquired Landsat scenes for May and July to classify scenes that represent different estimations of cheatgrass’ phenological profile. The team also downloaded 10 m Sentinel-2, Level 3 images for the months of January through June for 2016 from the Copernicus download hub. Sentinel-2 is operated by the European Space Agency (ESA) and due to the constrained window of access that is placed on Sentinel-2 data within the US, only data from within a six month time period could be procured. Scenes were downloaded for the area surrounding Big Bend National Park and the Rio Grande River, and scenes with min-imal cloud cover were selected for processing.
One-third arc-second void-filled digital elevation models (DEM) were procured for each study area from the USGS’s TNM Download Client. We then derived slope and aspect from these mod-els. The NPS provided the team with ESRI shapefiles of wildfire extent within the Valles Caldera and Bandelier park areas as well as with presence/absence data for cheatgrass, and coverage data of giant reed. In situ data were collected by the NPS from the year 2000 to 2016. Additionally, in situ data for cheatgrass were downloaded from SciNET. The team also utilized version two of the land cover data from the National Gap Analysis Program (GAP) supported by the USGS. GAP is a meso-scale land cover map, and the land cover data are based on spectro-physiographic zoning and uses 1999-2001 Landsat 7 ETM+ products as base maps, along with ecological categories through the NatureServe’s Ecological System and other similar modeling techniques (Lowry et al. 2007). From the GAP dataset, the team extracted the introduced and semi-natural vegetation class, which is categorized by vegetation dominance, from the ecological systems layers in each NPS boundary. The ecological systems layer contains plants with similar ecological behaviors that grow within particular landscapes based on their phenological properties (Lowry et al. 2007).
Each Landsat scene’s respective study area was processed to include only the national park, re-duce edge artifacts of Landsat scenes, and to remove land cover types that cannot serve as invasive species habitat (such as urban cover). Additionally, the study area was also clipped to exclude areas above 3,000 m (9,800 ft) since cheatgrass typically does not grow in this elevation. For Big Bend National Park, two Landsat scenes taken in the same orbital path were mosaicked in order to capture a larger extent of the Rio Grande River. Additionally, NDVI images were made using the red and near infrared bands for every Landsat image and then the June NDVI image was sub-tracted from the April NDVI image for each year.
Our team made two classification maps for the years 2002 and 2016 in the area surrounding Bandelier and Valles Caldera using K-means clustering. This unsupervised classification method was chosen since this method does not require labeled training data. K-means was run several times with different combinations of variables used. In the end, using Landsat 7 bands 1-7 from the early green-up date, aspect, and an NDVI difference image between the early and late dates as

Connections Across People, Place, and Time • 19
variables produced the best results for the year 2002. For 2016, Landsat 8 bands 2-7 from the ear-ly green-up date, aspect, and an NDVI difference image between the early and late start dates was computed. Once the classification maps were produced, the in situ points for each respective year were overlaid and the classes with the most in situ points within them were calculated. Because of the inconsistency of amount of in situ points for each year, in situ points for 2002 and 2003 were analyzed with the 2002 image, and in situ points from 2013–2016 were analyzed with the 2016 image. Classes with a significant amount of in situ points were visually inspected in Google Earth to determine if these areas showed likelihood for cheatgrass invasion.
Having more coverage information with the in situ polygons of giant reed around the Rio Grande, the team was able to perform supervised classifications in the area surrounding Big Bend. Two methods of supervised classification were run and compared. First, both Landsat bands and Sen-tinel-2 bands were classified using the Classification Tree Analysis method in TerrSet. Addition-ally, we used a Random Forest algorithm in R, where the classification tree process is iterated hundreds of times, using a different random sample of training data to validate and label each Classification Tree Analysis run. After all runs were computed, each pixel was labeled with the class that it was classified as most often out of all individual runs, to arrive at the final classification image. The team ran Random Forest with different spectral band combinations for both Landsat 8 and Sentinel-2. The training data included in situ shapefiles of giant reed monocultures and shapefiles of other classes (water, bare soil, shrubland, and other vegetation) that were visually identified by the team looking at a false color composite of Sentinel-2a and high resolution Na-tional Agriculture Imagery Program (NAIP) imagery. Random Forest was run several times, using different band combinations and number of training pixels sampled. Our best classification result with Landsat 8 used bands 2–7 and sampled 200 training pixels. Our best classification result with Sentinel-2 used bands 2, 4, 8, 11, and 12, and sampled 500 pixels. Because the shortwave infrared bands in Sentinel-2 (bands 11 and 12) are at 20 m (66 ft), all the other bands were resa-mpled up to 20 m (66 ft) as well.
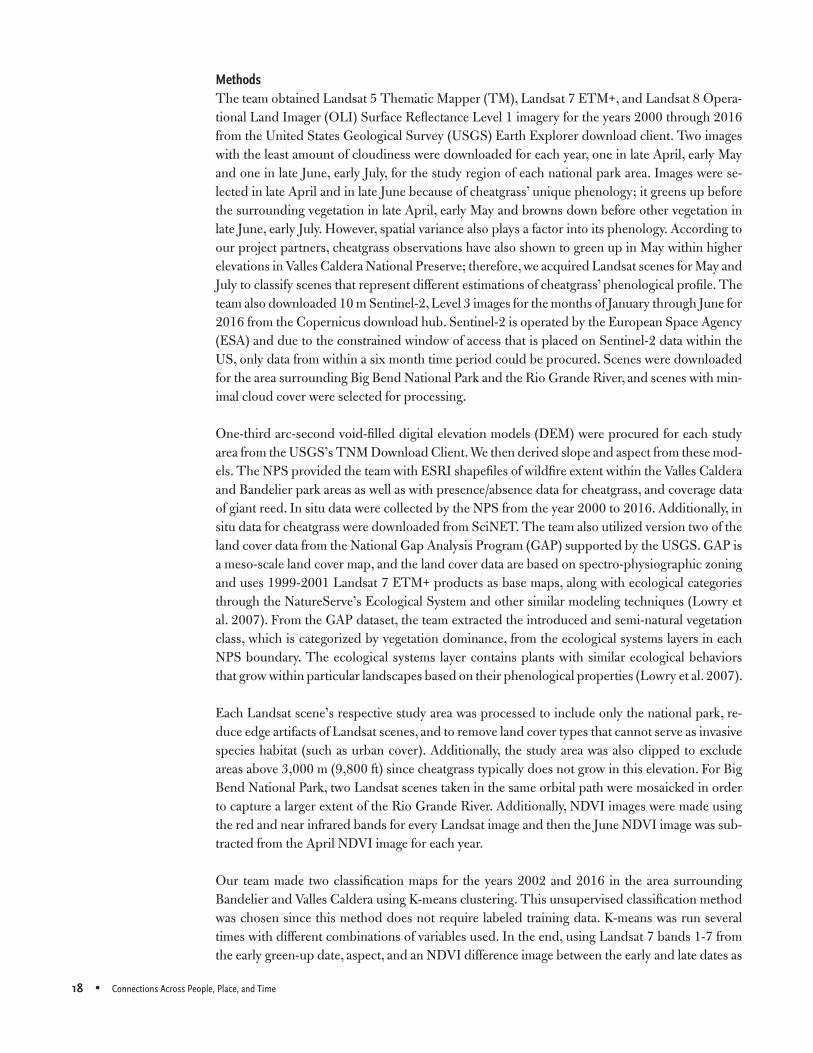
Results and discussionThe classification maps of Valles Caldera and Bandelier performed best when using bands 2–7 from either Landsat 7 or Landsat 8, an NDVI difference image computed using a March and June date, and aspect (Figure 2). Classification performance was qualitatively assessed by determining which classification captured the most in situ data points within the smallest number of classes. Classifications in 2016 were more thorough than 2002 in mapping grassland susceptible to cheat-grass as evidenced by the difference in coverage of grasslands within Valles Caldera.
The 2002 classification was also compared to GAP land cover classes to check if the validated classes matched up with larger class groups. The classifications are mainly on the East side of the study area and fall mostly on the Forest and Woodland class, most of that being within Pinyon-Ju-niper. Many of our classifications also fall within the recently burned areas. This is most likely due to cheatgrass’ ability to regrow quickly after a fire. The 2002 classification does not, however, map potential invasion areas in the grassland classes; our 2016 classification explains this grassland invasion much better. This is likely due to the large amount of in situ data points within the period of 2013–2016 compared with 2002–2003.
We were not able to discern meaningful differences in the reflectance values of Landsat pixels where cheatgrass coverage was deemed present by field observations. This could be because Landsat’s resolution is too coarse, the polygons did not represent 100% coverage of cheatgrass at
20 • Connections Across People, Place, and Time
high density, or that the cheatgrass had not experienced significant green-up or brown down rel-ative to the surrounding vegetation at the time that the Landsat scenes were taken. It was difficult to obtain a cloud free Landsat image that fell within our time range and it was necessary to use in situ data outside the year of the remotely sensed data to validate the classification. The Valles Caldera National Preserve park staff acknowledge that cheatgrass experiences variability in phe-nology events from year to year and because of an elevation difference, the preserve’s patches of cheatgrass experience these events later relative to Bandelier’s patches. However, it was necessary to classify cheatgrass using Landsat imagery which covered Bandelier in order to have enough in situ points to validate a classification.
Sentinel-2 performs much better than Landsat 8 in correctly classifying most classes, especially the open water of the Rio Grande (Figure 3). Our error matrix for Sentinel-2 shows that giant reed was classified correctly about 90% of the time; however, we believe that this is because both results over classify areas along the river as giant reed when in reality those areas could be other types of riverside vegetation. This hypothesis is supported by the fact that our error matrix for our Random Forest Sentinel-2 classification shows that the other vegetation class was classified as giant reed about 5% of the time. Furthermore, from a visual inspection of our classified map over-laid with high resolution imagery from Google Earth, it is clear that the classifier labels multiple vegetation types as giant reed or other vegetation.
Additionally, the best Random Forest classified image classified a little over half the pixels that make up the entire class of giant reed with at least 75% certainty. The measure of certainty indi-cates, for a given pixel, that out of all classification trees generated by the Random forest algorithm, 75% or more agree that a given pixel is classified as giant reed. This is not a measure of accuracy and we still believe that the classifier over classifies riparian vegetation as giant reed. However, we are excited that the Sentinel-2 data are able to so finely separate these classes as it is and we expect that more training data and training shapefiles of vegetation classes other than giant reed.
ConclusionsNASA Earth observations have the potential to be an essential tool in mapping distributions of invasive species and forecasting their future spread. Important considerations from this study include the importance of the amount of in situ data in training a classification and the limitations of Landsat and other moderate resolution satellite imagery due to the mixed pixel effect. We de-termined after this study that there is opportunity to arrive at more accurate and representative landscape classifications if there were more in situ data to train our classifier to detect not just
Figure 2. The 2002 and 2016 unsupervised classifications showing areas of potential cheatgrass in Valles Caldera and Bandelier National Monument.

Connections Across People, Place, and Time • 21
invasive coverage, but also other common vegetation types and soil types, since spectral proper-ties can differ greatly between different species and substrates. We expect that in the future, with more in situ data and more opportunities to collect cloud-free imagery from Sentinel-2, image classifications can be a helpful tool for park managers in detecting and mitigating invasive species.
Any opinions, findings, and conclusions or recommendations expressed in this material are those of the author(s) and do not necessarily reflect the views of the National Aeronautics and Space Admin-istration. This material is based upon work supported by NASA through contract NNL16AA05C and cooperative agreement NNX14AB60A.
ReferencesBell, G.P. 1997. Ecology and management of Arundo donax and approaches to riparian habi-
tat restoration in southern California. In Plant Invasions: Studies from North America and Europe, ed. J.H. Brock, M. Wade, P. Pyšek, and D. Green, 103–113. Leiden, Netherlands: Backhuys Publishers.
DiPietro, D.Y. 2002. Mapping the invasive plant Arundo donax and associated riparian vegetation using hyperspectral remote sensing. PhD diss., University of California, Davis.
Lowry, J.H, Jr., R.D. Ramsey, K.A. Thomas, D. Schrupp, W. Kepner, T. Sajwaj, J. Kirby, E. Waller, S. Schrader, S. Falzarano, L. Langs Stoner, G. Manis, C. Wallace, K. Schulz, P. Comer, K. Pohs, W. Rieth, C. Velasquez, B. Wolk, K.G., Boykin, L. O’Brien, J. Prior-Magee, D. Brad-ford, and B. Thompson. 2007. Land cover classification and mapping. In Southwest Regional Gap Analysis Final Report, ed. J. Prior-Magee, K. Boykin, D.F. Bradford, W.G. Kepner, J. Lowry, D. Schrupp, K. Thomas, and B. Thompson, 14–38. Corvallis, OR: USGS.
Menakis, J.P., D. Osborne, and M. Miller. 2002. Mapping the cheatgrass-caused departure from historical natural fire regimes in the Great Basin, USA. In Fire, Fuel Treatments, and Ecolog-ical Restoration: Conference proceedings, ed. Philip N. Omi, and Linda A. Joyce, 281–287. Ft. Collins, CO: U.S. Department of Agriculture, Forest Service, Rocky Mountain Research Station.
Pellant, M. 1996. Cheatgrass: The invader that won the west. Interior Columbia Basin Ecosystem Management Project. Boise, ID: BLM.
Figure 3. Random Forest classification of land cover type using Landsat (top) and Sentinel-2 (bottom) around the Rio Grande.
22 • Connections Across People, Place, and Time
Peterson, E.B. 2005. Estimating cover of an invasive grass (Bromus tectorum) using tobit regres-sion and phenology derived from two dates of Landsat ETM+ data. International Journal of Remote Sensing 26(12):2491–2507.
Sheppard, P.R., A.C. Comrie, G.D. Packin, K. Angersbach, and M.K. Hughes. 2002. The climate of the US Southwest. Climate Research 21(3):219–238.
Wilcove, D.S., D. Rothstein, J. Dubow, A. Phillips, and E. Losos. 1998. Quantifying threats to imperiled species in the United States. BioScience 48(8):607–615.
Yang, C., J.A. Goolsby, and J.H. Everitt. 2009. Mapping giant reed with QuickBird imagery in the Mexican portion of the Rio Grande Basin. Journal of Applied Remote Sensing 3(1):033530–033530.