mapping medicare disparities tool overview.pdf
TRANSCRIPT

Mapping Medicare Disparities

1
INTRODUCTION & BACKGROUNDChronic diseases, such as diabetes and cardiovascular diseases, pose a significant problem in the United States, resulting in substantial morbidity, mortality, disability, and cost. In 2012, two-thirds of Medicare beneficiaries had multiple chronic conditions and accounted for 93 percent of Medicare spending.1 Racial and ethnic minority communities are disproportionately affected by the disparities in disease, and the burden of disease differs by where individuals live.2
The Centers for Medicare & Medicaid Services (CMS) Office of Minority Health (OMH) released the first CMS Equity Plan for Improving Quality in Medicare.
From this equity plan, CMS developed an interactive map to increase understanding of geographic disparities in chronic disease among Medicare beneficiaries. The Mapping Medicare Disparities (MMD) Tool identifies disparities between sub-populations (e.g., racial and ethnic groups) in health outcomes, utilization, and spending. The MMD Tool is expected to help government agencies, policymakers, researchers, community-based organizations, health providers, quality improvement organizations, and the general public analyze chronic disease disparities, identifying how a region or population may differ from the state or national average.
Understanding geographic differences in disparities is important to informing policy decisions and efficiently targeting populations and geographies for interventions.
1. Centers for Medicare & Medicaid Services (CMS). ChronicConditions among Medicare Beneficiaries, Chartbook, 2012edition. Baltimore, MD: CMS, 2012.
2. Agency for Healthcare Research and Quality (AHRQ).2014 National Healthcare Quality and Disparities Report.Publication No. 15-0007. Rockville, MD: AHRQ, May 2015.
Racial and ethnic minorities experience disproportionately higher rates of disease, inferior quality of care, and reduced access to care. The identification of areas with large numbers of vulnerable populations (including beneficiaries eligible for Medicare and dually eligible for Medicare and Medicaid) with chronic diseases will increase understanding of geographic differences in disparities, helping to inform policy decisions and better target interventions. This initiative provides an important first step on the path to health equality by improving the infrastructure for health equity activities and initiatives. CMS OMH collaborated with the Centers for Disease Control and Prevention (CDC), as well as other centers and offices within CMS, in designing the MMD Tool to ensure that it would add value by building on existing tools.
The MMD Tool presents health-related measures from Medicare claims by sex, age, dual eligibility for Medicare and Medicaid, race and ethnicity, and state and county via a public interactive website. The MMD Tool provides users with a quick and easy way to identify areas with large numbers of vulnerable populations and to target interventions to address racial and ethnic disparities. This issue brief provides an overview of the MMD Tool, highlighting four ways in which it can be used and how it differs from other federal mapping tools.
2
Additionally, the MMD Tool includes information on the prevalence, costs, and hospitalizations of beneficiaries having ESRD and/or a disability based on the original or current reason for entitlement.
For a complete list of the chronic conditions and measures presented by the MMD Tool, as well as the data and methodology used, refer to Table 1 below and The Mapping Medicare Disparities Tool: Technical Documentation.
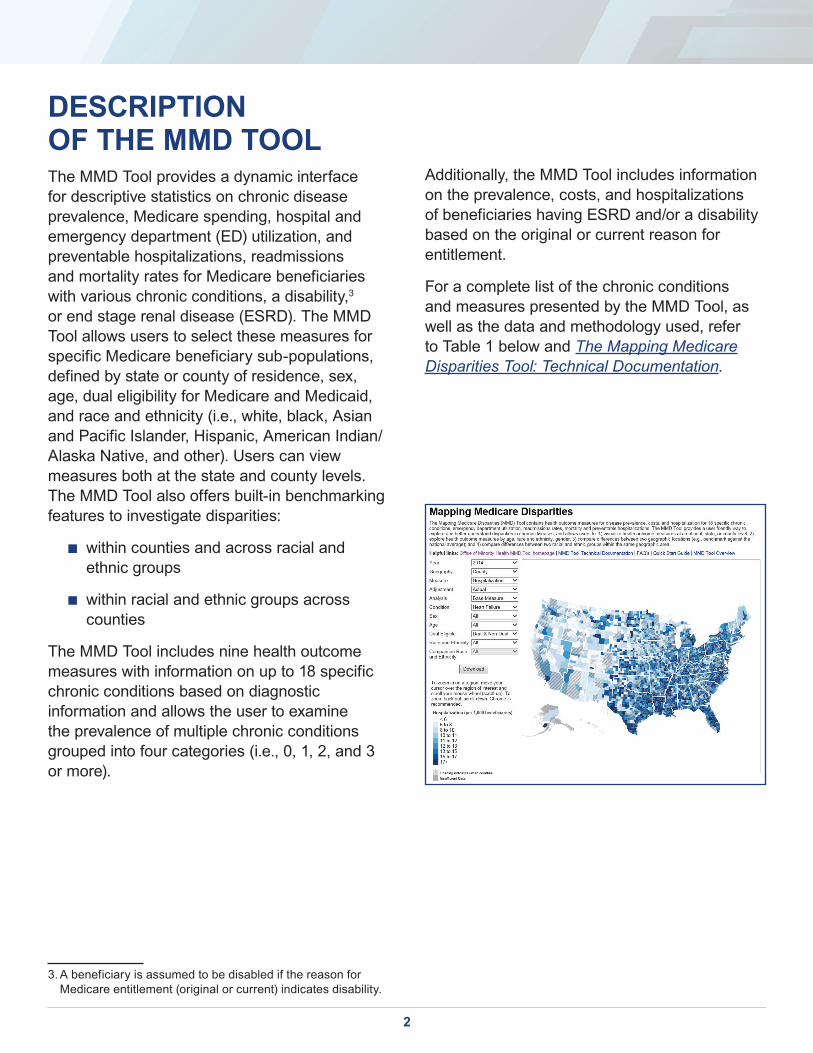
DESCRIPTION OF THE MMD TOOLThe MMD Tool provides a dynamic interface for descriptive statistics on chronic disease prevalence, Medicare spending, hospital and emergency department (ED) utilization, and preventable hospitalizations, readmissions and mortality rates for Medicare beneficiaries with various chronic conditions, a disability,3 or end stage renal disease (ESRD). The MMD Tool allows users to select these measures for specific Medicare beneficiary sub-populations, defined by state or county of residence, sex, age, dual eligibility for Medicare and Medicaid, and race and ethnicity (i.e., white, black, Asian and Pacific Islander, Hispanic, American Indian/Alaska Native, and other). Users can view measures both at the state and county levels. The MMD Tool also offers built-in benchmarking features to investigate disparities:
■ within counties and across racial andethnic groups
■ within racial and ethnic groups acrosscounties
The MMD Tool includes nine health outcome measures with information on up to 18 specific chronic conditions based on diagnostic information and allows the user to examine the prevalence of multiple chronic conditions grouped into four categories (i.e., 0, 1, 2, and 3 or more).
3. A beneficiary is assumed to be disabled if the reason forMedicare entitlement (original or current) indicates disability.

3
1. Cancer includes: breast cancer, colorectal cancer, prostate cancer, and lung cancer. Having any of these cancers (including havingmore than one) counts as one condition.
2. Provides users with the hospitalization rate (i.e., not condition-specific) for beneficiaries with 0, 1, 2, or 3+ conditions from thelist above.
3. PQIs represent preventable hospitalizations to identify quality of care for “ambulatory care sensitive conditions”.
Table 1. Measures and Conditions in the Mapping Medicare Disparities Tool
Mea
sure
Prevalence Rates and Costs Hospitalization Rates
Prevention Quality Indicators (PQIs)3
Readmission and Mortality
Rates
Emergency Department
(ED) Visit Rates
• Acute Myocardial Infarction
• Arthritis
• Asthma
• Atrial Fibrillation
• Alzheimer’s Disease, RelatedDisorders, or Senile Dementia
• Cancer (breast, colorectal,lung, and/or prostate)1
• Chronic Kidney Disease
• Chronic ObstructivePulmonary Disease (COPD)
• Acute Myocardial Infarction
• Arthritis
• Asthma
• Alzheimer’s Disease,Related Disorders, orSenile Dementia
• Cancer (breast, colorectal,lung, and/or prostate)
• Cardiac Dysrhythmia
• Chronic Kidney Disease
• COPD
• Diabetes Short-termComplications
• Perforated Appendix
• Diabetes Long-termComplications
• COPD or Asthmain Older Adults
• Hypertension
• Heart Failure
• Dehydration
• Bacterial Pneumonia
• AcuteMyocardialInfarction
• Heart Failure
• Overall Rate
• 0, 1, 2, or 3+Conditions
Con
ditio
n
• Depression
• Diabetes
• Heart Failure
• Hyperlipidemia (highcholesterol)
• Depression
• Diabetes
• Heart Failure
• Hyperlipidemia (highcholesterol)
• Urinary TractInfection
• Angina withoutProcedure
• UncontrolledDiabetes
• Hypertension
• Ischemic Heart Disease
• Obesity
• Osteoporosis
• Schizophrenia/OtherPsychotic Disorders
• Stroke/TransientIschemic Attack
• 0, 1, 2, or 3+ Conditions
• ESRD
• Disability
• Hypertension
• Ischemic Heart Disease
• Obesity
• Osteoporosis
• Schizophrenia/OtherPsychotic Disorders
• Stroke
• Overall Rate
• 0, 1, 2, or 3+ Conditions2
• ESRD
• Disability
• Lower-ExtremityAmputationamong Patientswith Diabetes
• Prevention QualityOverall Composite
• Prevention QualityAcute Composite
• Prevention QualityChronic Composite
4
MMd tool PoPulationThe MMD Tool presents information for Medicare beneficiaries age 65 years or older, persons under age 65 with certain disabilities, and persons of any age with ESRD. Medicare beneficiaries with any Medicare Advantage enrollment during the year are excluded since claims data are not available for these beneficiaries. Beneficiaries who died during the year are included up to their date of death, if they meet the other inclusion criteria described above.
data SourceAs of March 2016, the MMD Tool is based on the CMS administrative claims data4 for Medicare beneficiaries enrolled in the fee-for-service (FFS) program, which are available from CMS through the Chronic Conditions Data Warehouse, including beneficiaries who are also eligible for Medicaid.5 These claims files are known as the CMS Research Identifiable Files (RIFs), which consist of the Denominator File—with beneficiary eligibility, enrollment, and characteristics data—and final action items for services covered by Medicare Part A (hospital insurance) and Part B (medical insurance). The prevalence rates are based on 100 percent of Part A and Part B claims. The hospital utilization, preventable hospitalization, and readmission and mortality rates are based on 100 percent of inpatient claims, while ED utilization rates are based on 100 percent of inpatient and outpatient claims.
4. The MMD Tool provides measures for 2012-2014. However,the methodology for the prevalence of chronic conditionsrequires up to three years of claims, making 2010-2011 datanecessary.
5. See www.ccwdata.org. Data dictionaries for CMS RIFs can be found on www.resdac.org.
Protection of Beneficiary confidentiality & PrivacyThe underlying data in the MMD Tool is certified as de-identified according to the HIPAA Privacy Rule. In addition, the MMD Tool performs a series of checks and data suppression decisions based on the size of the selected measure’s study population and the share of the study population that leads to the calculated domain/measure (e.g., hospitalization rate). If the study population for the chosen set of beneficiary characteristics (i.e., every combination of state and county of residence, sex, age group, racial and ethnic group, and dual eligibility indicator) is less than 11 beneficiaries, the MMD Tool will not display the chosen domain or measure. Also, if the number of beneficiaries for the numerator of a measure (e.g., beneficiaries who are hospitalized) is less than three but greater than zero, the MMD Tool will display 0 percent.
5
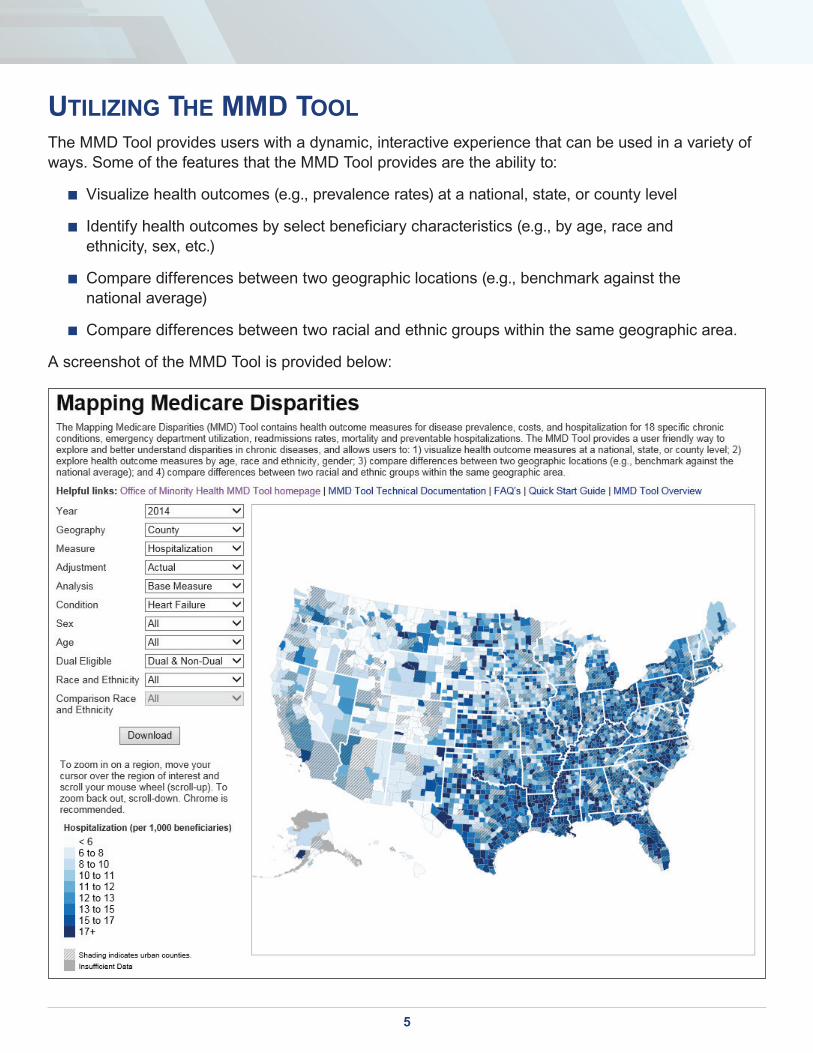
utilizing the MMd toolThe MMD Tool provides users with a dynamic, interactive experience that can be used in a variety of ways. Some of the features that the MMD Tool provides are the ability to:
■ Visualize health outcomes (e.g., prevalence rates) at a national, state, or county level
■ Identify health outcomes by select beneficiary characteristics (e.g., by age, race andethnicity, sex, etc.)
■ Compare differences between two geographic locations (e.g., benchmark against thenational average)
■ Compare differences between two racial and ethnic groups within the same geographic area.
A screenshot of the MMD Tool is provided below:
6
FOUR EXAMPLES OF THE MMD TOOLHere are four examples of what can be done using the . The MMD Tool allows users to build a query step-by-step. A user can choose to use all of the menus provided by the MMD Tool, or to leave one or more of the menus unselected, which will then default to “All.” Not all of the menu options provided by the MMD Tool are utilized in the examples provided.
MMD Tool
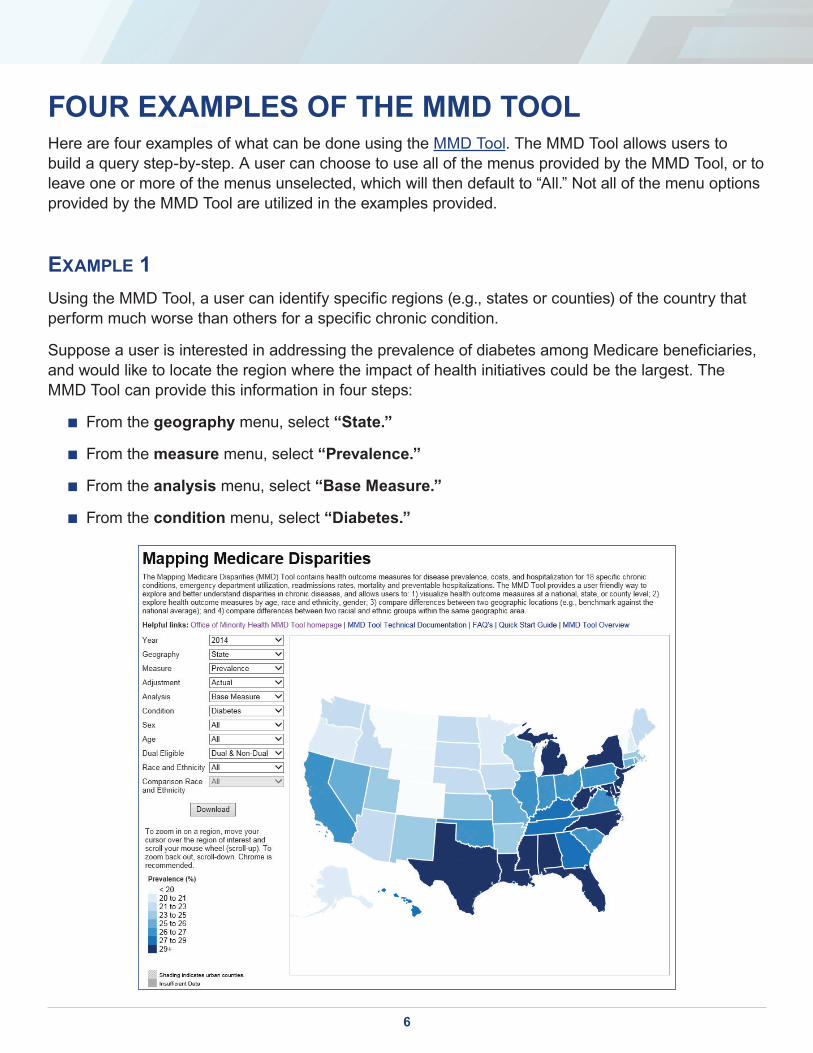
exaMPle 1Using the MMD Tool, a user can identify specific regions (e.g., states or counties) of the country that perform much worse than others for a specific chronic condition.
Suppose a user is interested in addressing the prevalence of diabetes among Medicare beneficiaries, and would like to locate the region where the impact of health initiatives could be the largest. The MMD Tool can provide this information in four steps:
■ From the geography menu, select “State.”
■ From the measure menu, select “Prevalence.”
■ From the analysis menu, select “Base Measure.”
■ From the condition menu, select “Diabetes.”
7
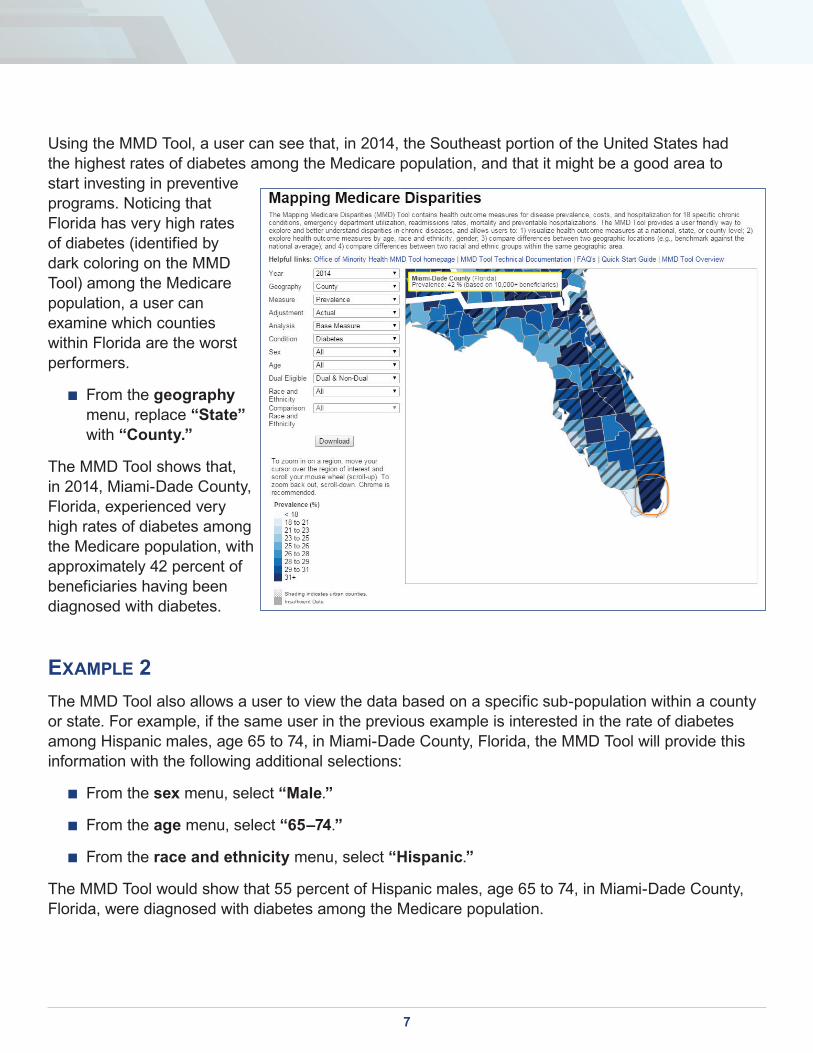
Using the MMD Tool, a user can see that, in 2014, the Southeast portion of the United States had the highest rates of diabetes among the Medicare population, and that it might be a good area to start investing in preventive programs. Noticing that Florida has very high rates of diabetes (identified by dark coloring on the MMD Tool) among the Medicare population, a user can examine which counties within Florida are the worst performers.
■ From the geography menu, replace “State” with “County.”
The MMD Tool shows that, in 2014, Miami-Dade County, Florida, experienced very high rates of diabetes among the Medicare population, with approximately 42 percent of beneficiaries having been diagnosed with diabetes.
exaMPle 2The MMD Tool also allows a user to view the data based on a specific sub-population within a county or state. For example, if the same user in the previous example is interested in the rate of diabetes among Hispanic males, age 65 to 74, in Miami-Dade County, Florida, the MMD Tool will provide this information with the following additional selections:
■ From the sex menu, select “Male.”
■ From the age menu, select “65–74.”
■ From the race and ethnicity menu, select “Hispanic.”
The MMD Tool would show that 55 percent of Hispanic males, age 65 to 74, in Miami-Dade County, Florida, were diagnosed with diabetes among the Medicare population.
8
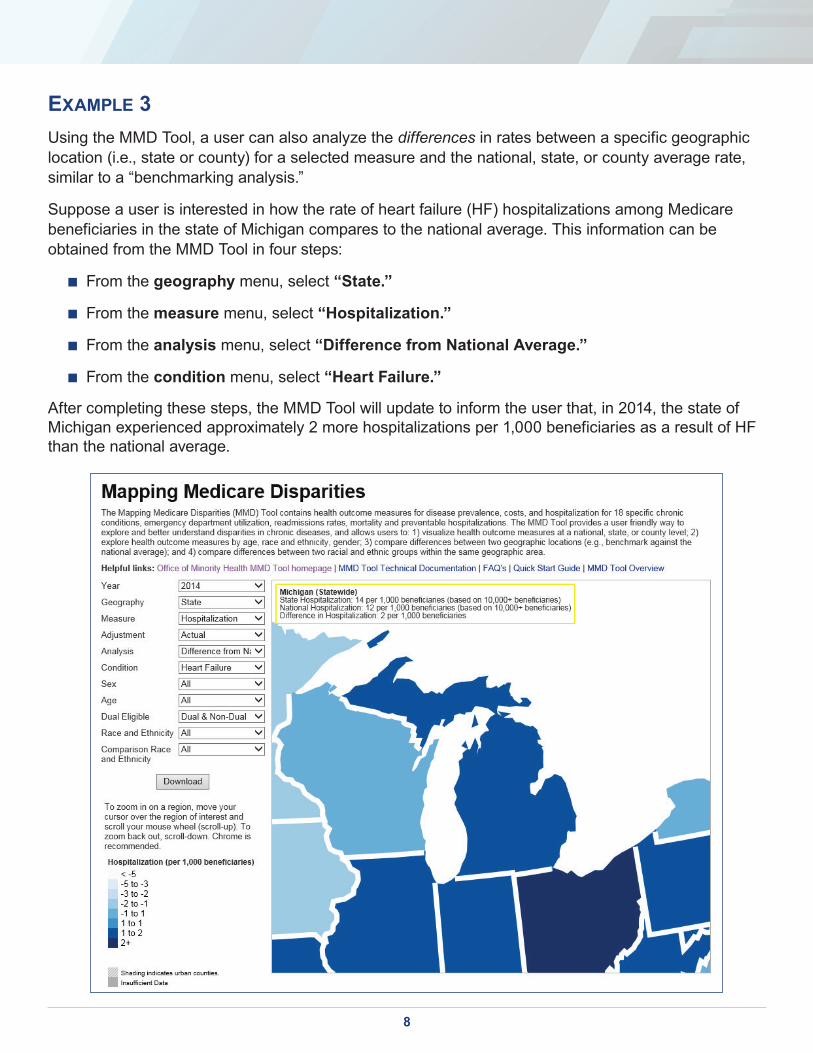
exaMPle 3Using the MMD Tool, a user can also analyze the differences in rates between a specific geographic location (i.e., state or county) for a selected measure and the national, state, or county average rate, similar to a “benchmarking analysis.”
Suppose a user is interested in how the rate of heart failure (HF) hospitalizations among Medicare beneficiaries in the state of Michigan compares to the national average. This information can be obtained from the MMD Tool in four steps:
■ From the geography menu, select “State.”
■ From the measure menu, select “Hospitalization.”
■ From the analysis menu, select “Difference from National Average.”
■ From the condition menu, select “Heart Failure.”
After completing these steps, the MMD Tool will update to inform the user that, in 2014, the state of Michigan experienced approximately 2 more hospitalizations per 1,000 beneficiaries as a result of HF than the national average.
9
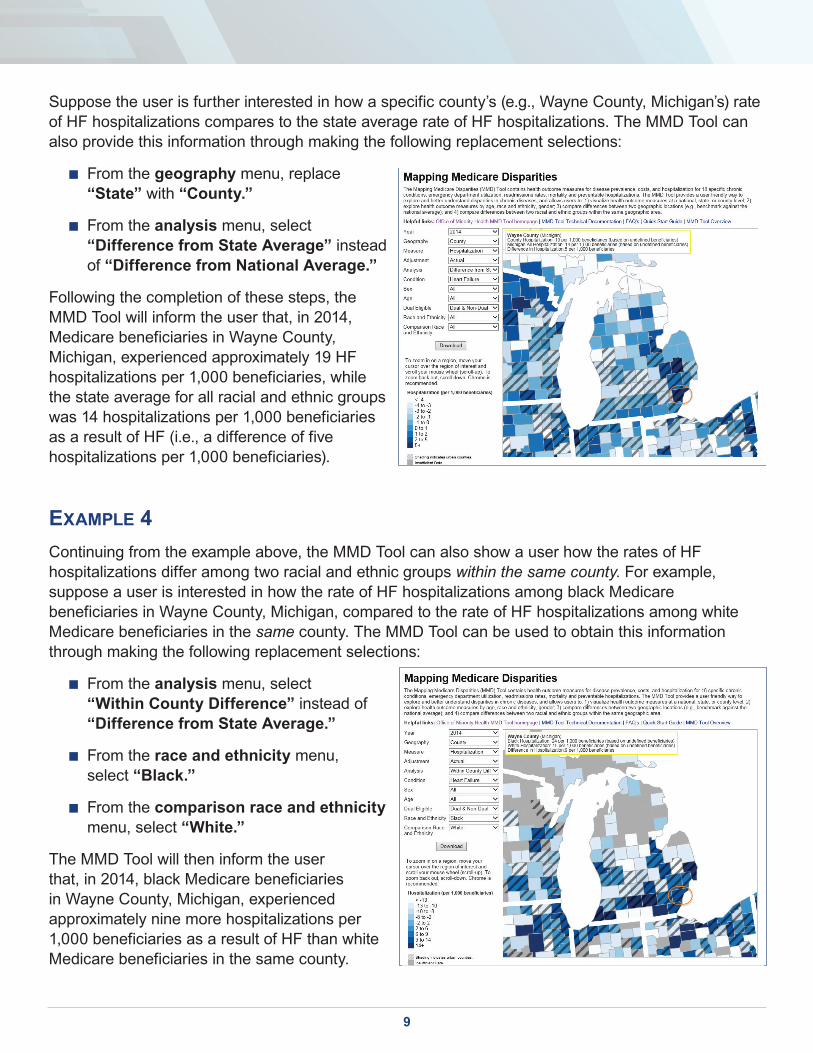
Suppose the user is further interested in how a specific county’s (e.g., Wayne County, Michigan’s) rate of HF hospitalizations compares to the state average rate of HF hospitalizations. The MMD Tool can also provide this information through making the following replacement selections:
■ From the geography menu, replace“State” with “County.”
■ From the analysis menu, select“Difference from State Average” insteadof “Difference from National Average.”
Following the completion of these steps, the MMD Tool will inform the user that, in 2014, Medicare beneficiaries in Wayne County, Michigan, experienced approximately 19 HF hospitalizations per 1,000 beneficiaries, while the state average for all racial and ethnic groups was 14 hospitalizations per 1,000 beneficiaries as a result of HF (i.e., a difference of five hospitalizations per 1,000 beneficiaries).
exaMPle 4Continuing from the example above, the MMD Tool can also show a user how the rates of HF hospitalizations differ among two racial and ethnic groups within the same county. For example, suppose a user is interested in how the rate of HF hospitalizations among black Medicare beneficiaries in Wayne County, Michigan, compared to the rate of HF hospitalizations among white Medicare beneficiaries in the same county. The MMD Tool can be used to obtain this information through making the following replacement selections:
■ From the analysis menu, select“Within County Difference” instead of“Difference from State Average.”
■ From the race and ethnicity menu,select “Black.”
■ From the comparison race and ethnicitymenu, select “White.”
The MMD Tool will then inform the user that, in 2014, black Medicare beneficiaries in Wayne County, Michigan, experienced approximately nine more hospitalizations per 1,000 beneficiaries as a result of HF than white Medicare beneficiaries in the same county.
10
NEXT STEPSThe MMD Tool is a dynamic and analytical product, which will be continuously improved and enriched over time. Planned enhancements include adding data for more recent years to allow for trending analyses, adding measures for other chronic conditions, and including measures for other minority populations in Medicare.
DIFFERENCES BETWEEN THE MMD TOOL AND OTHER FEDERAL HEALTH MAPPING TOOLSThere are other publicly available tools with similar objectives as the MMD Tool that may provide users with additional, complementary information on health disparities. Four of these tools are described in the following pages.
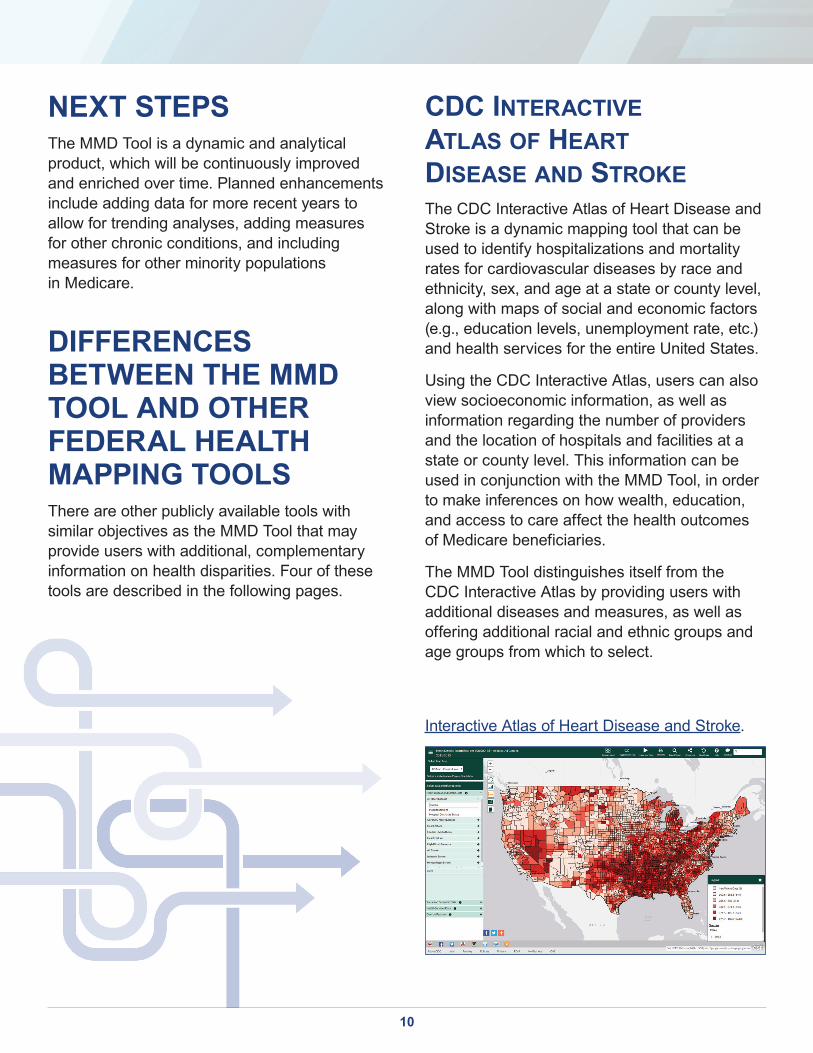
cdc interactive atlaS of heart diSeaSe and StrokeThe CDC Interactive Atlas of Heart Disease and Stroke is a dynamic mapping tool that can be used to identify hospitalizations and mortality rates for cardiovascular diseases by race and ethnicity, sex, and age at a state or county level, along with maps of social and economic factors (e.g., education levels, unemployment rate, etc.) and health services for the entire United States.
Using the CDC Interactive Atlas, users can also view socioeconomic information, as well as information regarding the number of providers and the location of hospitals and facilities at a state or county level. This information can be used in conjunction with the MMD Tool, in order to make inferences on how wealth, education, and access to care affect the health outcomes of Medicare beneficiaries.
The MMD Tool distinguishes itself from the CDC Interactive Atlas by providing users with additional diseases and measures, as well as offering additional racial and ethnic groups and age groups from which to select.
Interactive Atlas of Heart Disease and Stroke.
11
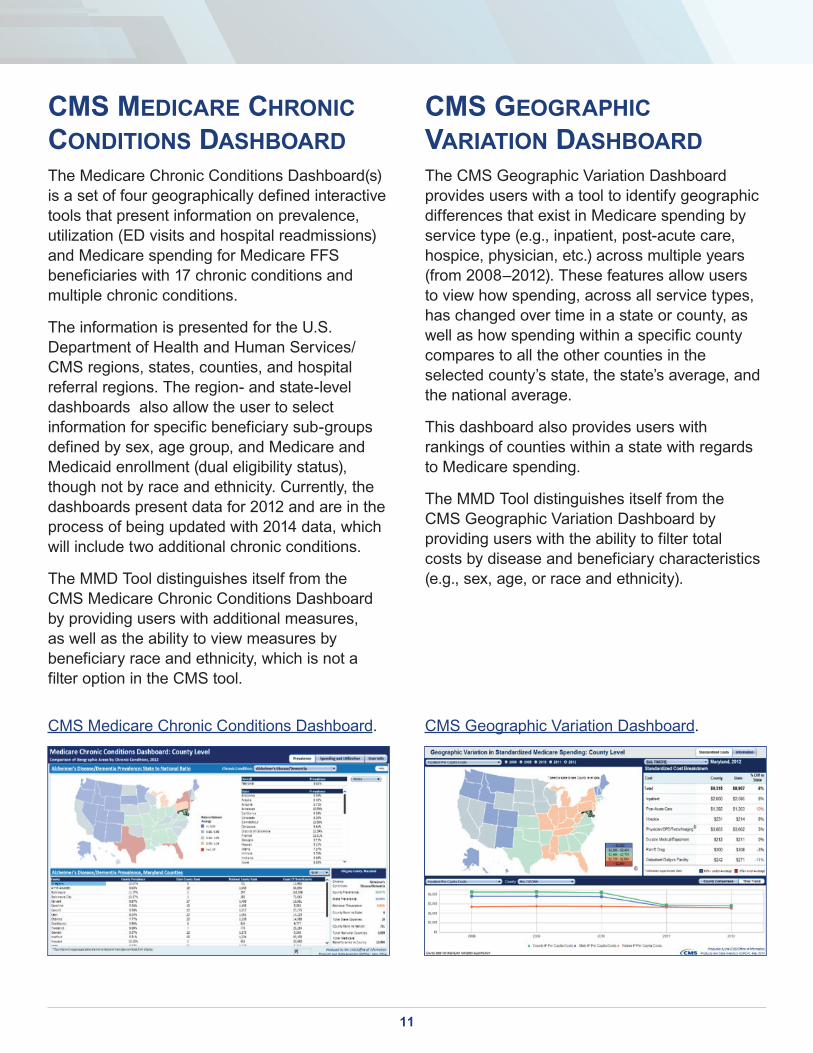
cMS Medicare chronic conditionS daShBoardThe Medicare Chronic Conditions Dashboard(s) is a set of four geographically defined interactive tools that present information on prevalence, utilization (ED visits and hospital readmissions) and Medicare spending for Medicare FFS beneficiaries with 17 chronic conditions and multiple chronic conditions.
The information is presented for the U.S. Department of Health and Human Services/CMS regions, states, counties, and hospital referral regions. The region- and state-level dashboards also allow the user to select information for specific beneficiary sub-groups defined by sex, age group, and Medicare and Medicaid enrollment (dual eligibility status), though not by race and ethnicity. Currently, the dashboards present data for 2012 and are in the process of being updated with 2014 data, which will include two additional chronic conditions.
The MMD Tool distinguishes itself from the CMS Medicare Chronic Conditions Dashboard by providing users with additional measures, as well as the ability to view measures by beneficiary race and ethnicity, which is not a filter option in the CMS tool.
CMS Medicare Chronic Conditions Dashboard.
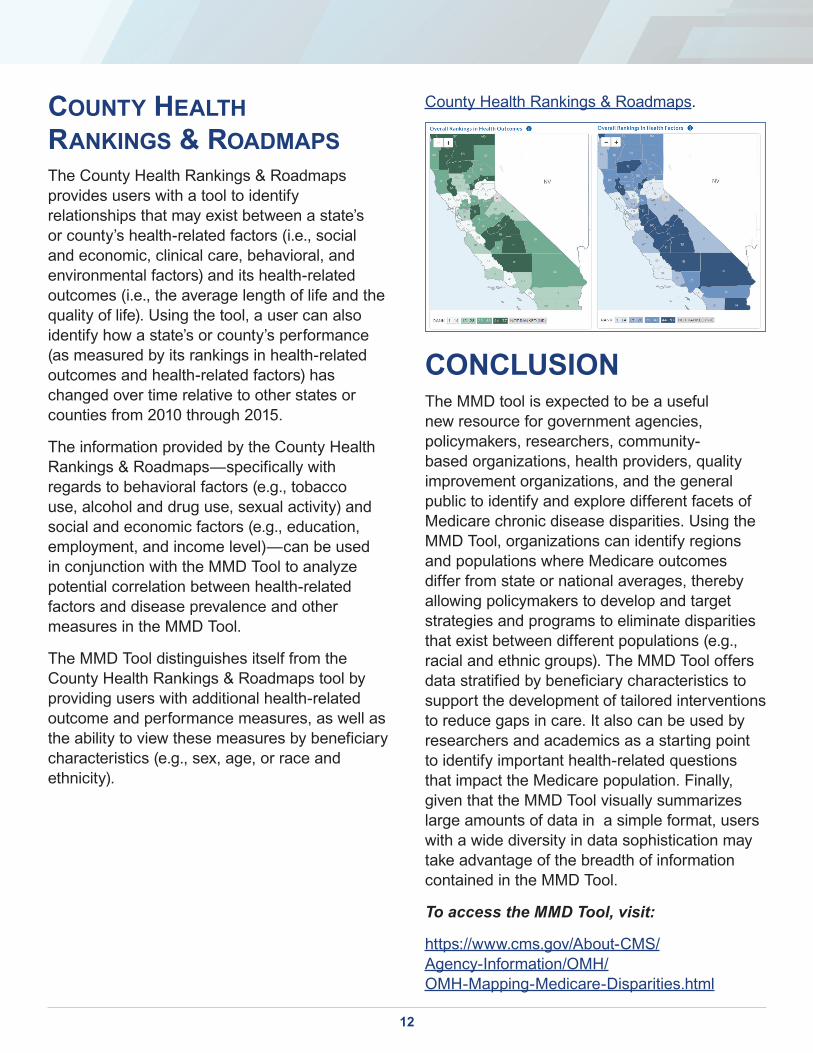
cMS geograPhic variation daShBoard The CMS Geographic Variation Dashboard provides users with a tool to identify geographic differences that exist in Medicare spending by service type (e.g., inpatient, post-acute care, hospice, physician, etc.) across multiple years (from 2008–2012). These features allow users to view how spending, across all service types, has changed over time in a state or county, as well as how spending within a specific county compares to all the other counties in the selected county’s state, the state’s average, and the national average.
This dashboard also provides users with rankings of counties within a state with regards to Medicare spending.
The MMD Tool distinguishes itself from the CMS Geographic Variation Dashboard by providing users with the ability to filter total costs by disease and beneficiary characteristics (e.g., sex, age, or race and ethnicity).
CMS Geographic Variation Dashboard.
12
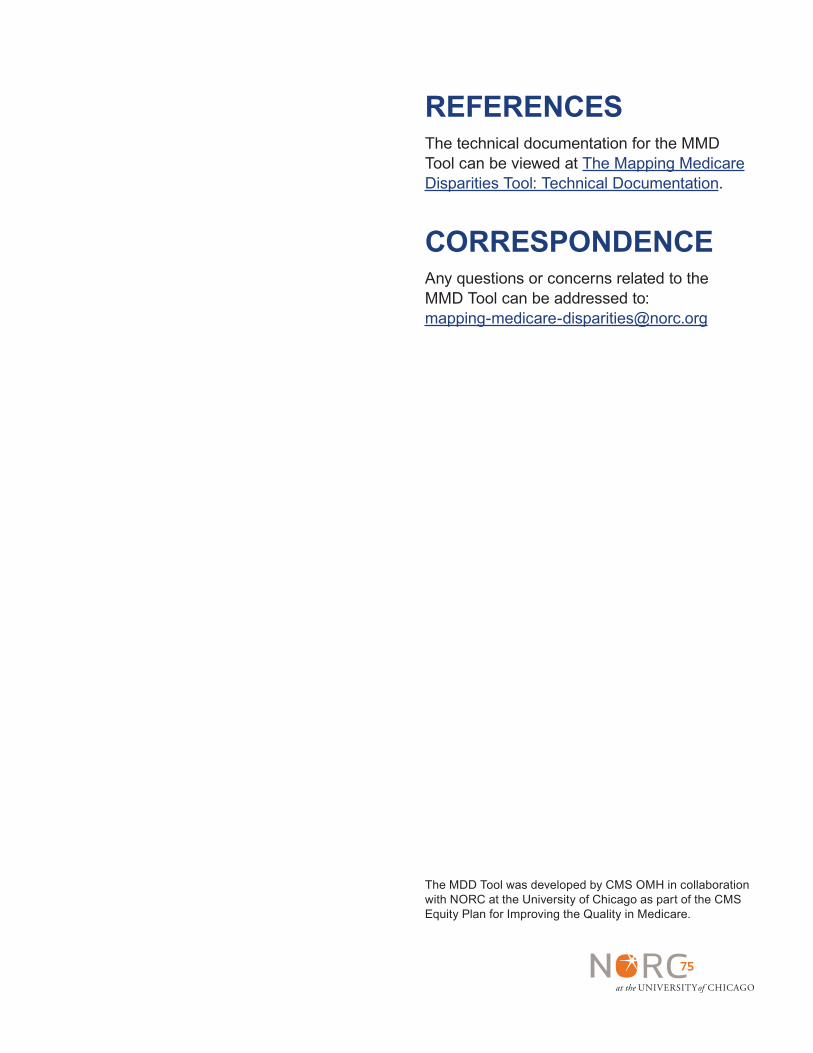
county health rankingS & roadMaPSThe County Health Rankings & Roadmaps provides users with a tool to identify relationships that may exist between a state’s or county’s health-related factors (i.e., social and economic, clinical care, behavioral, and environmental factors) and its health-related outcomes (i.e., the average length of life and the quality of life). Using the tool, a user can also identify how a state’s or county’s performance (as measured by its rankings in health-related outcomes and health-related factors) has changed over time relative to other states or counties from 2010 through 2015.
The information provided by the County Health Rankings & Roadmaps—specifically with regards to behavioral factors (e.g., tobacco use, alcohol and drug use, sexual activity) and social and economic factors (e.g., education, employment, and income level)—can be used in conjunction with the MMD Tool to analyze potential correlation between health-related factors and disease prevalence and other measures in the MMD Tool.
The MMD Tool distinguishes itself from the County Health Rankings & Roadmaps tool by providing users with additional health-related outcome and performance measures, as well as the ability to view these measures by beneficiary characteristics (e.g., sex, age, or race and ethnicity).
County Health Rankings & Roadmaps.
CONCLUSIONThe MMD tool is expected to be a useful new resource for government agencies, policymakers, researchers, community-based organizations, health providers, quality improvement organizations, and the general public to identify and explore different facets of Medicare chronic disease disparities. Using the MMD Tool, organizations can identify regions and populations where Medicare outcomes differ from state or national averages, thereby allowing policymakers to develop and target strategies and programs to eliminate disparities that exist between different populations (e.g., racial and ethnic groups). The MMD Tool offers data stratified by beneficiary characteristics to support the development of tailored interventions to reduce gaps in care. It also can be used by researchers and academics as a starting point to identify important health-related questions that impact the Medicare population. Finally, given that the MMD Tool visually summarizes large amounts of data in a simple format, users with a wide diversity in data sophistication may take advantage of the breadth of information contained in the MMD Tool.
To access the MMD Tool, visit:
https://www.cms.gov/About-CMS/ Agency-Information/OMH/ OMH-Mapping-Medicare-Disparities.html
REFERENCESThe technical documentation for the MMD Tool can be viewed at The Mapping Medicare Disparities Tool: Technical Documentation.
CORRESPONDENCEAny questions or concerns related to the MMD Tool can be addressed to: [email protected]
The MDD Tool was developed by CMS OMH in collaboration with NORC at the University of Chicago as part of the CMS Equity Plan for Improving the Quality in Medicare.