mapping the conceptual design activity of ... · team was asked to solve the design problem without...
TRANSCRIPT
Loughborough UniversityInstitutional Repository
Mapping the conceptualdesign activity of
interdisciplinary teams
This item was submitted to Loughborough University's Institutional Repositoryby the/an author.
Citation: AUSTIN, S.A. ... et al, 2001. Mapping the conceptual design activityof interdisciplinary teams. Design Studies, 22 (3), pp.211-232
Additional Information:
• This journal article was published in the journal, Design Stud-ies [ c© Elsevier] and the definitive version is available at:http://www.elsevier.com/wps/find/journaldescription.cws_home/30409/description#description
Metadata Record: https://dspace.lboro.ac.uk/2134/4225
Version: Accepted for publication
Publisher: c© Elsevier
Please cite the published version.
This item was submitted to Loughborough’s Institutional Repository (https://dspace.lboro.ac.uk/) by the author and is made available under the
following Creative Commons Licence conditions.
For the full text of this licence, please go to: http://creativecommons.org/licenses/by-nc-nd/2.5/
2
Mapping the conceptual design activity of interdisciplinary teams
Simon Austin1, John Steele2, Sebastian Macmillan2, Paul Kirby2, Robin Spence2
(1) Department of Civil and Building Engineering, Loughborough University, Loughborough, Leicestershire, LE11 3TU. (2) The Martin Centre for Architectural and Urban Studies, Department of Architecture, University of Cambridge, 6 Chaucer Road, Cambridge, CB2 2EB, UK Keywords Evaluation, conceptual design, design process, interdisciplinary, teamwork. Synopsis
The conceptual design phase of any project is, by its very nature, a vibrant, creative and
dynamic period. It can also be disorganised with much backtracking accompanying the
exchange of information between design team members. The transfer of information,
ideas and opinion is critical to the development of concepts and as such, rather than being
recognised as merely a component of conceptual design activity, it needs to be
understood and, ultimately, managed. This paper describes an experimental workshop
involving fifteen design professionals in which conceptual design activity was tracked,
and subsequently mapped, in order to test and validate a tentative design framework
(phase and activity model). The nature of the design progression of the various teams is
captured and analysed, allowing a number of conclusions to be drawn regarding both the
iterative nature of this phase of design and how teams of professionals actually design
together.
3
1 Introduction
1.1 An overview of the research domain
Many writers in the field of design research have produced maps and procedures for
negotiating what has become commonly known as the design process. Markus 1 and
Maver 2, French 3, Archer 4, Pugh and Morley 5, Pahl and Beitz 6 and Cross 7 are just
some of the many writers, from across the architectural and engineering design domain,
who have attempted to generate standardised design procedures. Yet it is disturbing that,
although the work of these many writers has been utilised with varying degrees of
success in a number of engineering domains, the construction industry has shown little
interest in defining a procedure aimed at improving the efficiency of their design activity.
This is not to say that the building industry has failed to benefit from the implementation
of standardised procedure altogether, as the construction phase of any building project is
planned thoroughly in a bid to improve efficiency and reduce time spans. So why has
there been little transfer of this philosophy to the activity of design?
The lack of appreciation of the rewards that can be gained from planning design activity
seems to owe much to the fact that design and construction are often perceived as being
mutually exclusive activities. This is to say that the activity of designing was undertaken
by a discrete group of individuals that would hand over their work to the construction
engineers, at which point their input to the project would end. Thus, the activities of
design and construction became segregated. This resulted in the common misconception
that design could be managed without the help of specific planning and management
4
tools, whilst in construction there were clearer and more easily realisable benefits from
improved planning 8.
In today's lean construction environment this myth is being dispelled and it has become
generally recognised that efficiency and client satisfaction can be improved if design
activity is planned and managed. Thus, methods such as the Analytical Design Planning
Technique (ADePT) have been developed, which have focused to date on the
development of models of the detailed design phase 9 and are currently being applied
within the construction industry. Through the collaborative research work of a number of
academic institutions, construction organisations and clients, attempts have been made to
closely integrate all the phases involved in bringing a building to a customer. This
research has resulted in the production of several standardised process maps, the most
notable of which are the BAA Project Process 10 and the Process Protocol 11, which seem
to be converging toward a similar format. However, at present the RIBA Plan of Work
for Design Team Operation 12, which was developed some 30 years ago, remains the
most widely used model of building design, although it is currently under revision in the
light of these latest developments.
1.2 Research focus
The areas of building industry research documented above have focused on improving
understanding of the entire design process but investigations have also been undertaken
which concentrate on the individual stages of the process. It could be argued that these
more detailed analyses are of more direct relevance to the industry as they de-mystify the
5
intricacies of design activity at a deeper and more detailed level. More over, it is only by
understanding the activities involved within the individual stages of design that the
interfaces between stages of work can be understood and subsequently managed.
The existing systematic design procedures advocated by the engineering researchers have
rarely been subjected to any realistic evaluation in practice 13, 14, 15. Nevertheless, it is still
claimed that their use will lead to better quality artefacts and/or shorter time to design
completion 13. In the few instances that the earlier models have been tested on live
projects their phases account for only a fraction of the actual activity that occurs 14, 15. For
example, when the systematic design model of Pahl and Beitz 6 was subjected to a
detailed investigation in a live design project in practice, the activities that were
accounted for by the model made up only 47% of the design team work 14. The more
recently developed models of the design process, such as those generated using ADePT,
have proven significantly more robust, with models of the detailed design phase proving
to be 90% generic in applications to date 8. Testing of Hubka's 16 model of engineering
design failed to validate claims that design cycle time or artefact quality were positively
affected by the use of systematic procedure 13.
The Mapping the design process during the conceptual phase of building projects (MDP)
research project, currently being undertaken at the University of Cambridge, with support
from the Department of Civil and Building Engineering, Loughborough University, is
investigating the most vibrant but disorganised of the phases, namely conceptual design.
This paper describes the testing of a preliminary conceptual design framework (phase and
6
activity model) that has been developed over the course of this project. An experimental
session was held in a bid to both verify the framework structure and ensure that its
components were subjected to rigorous testing in a live design environment. It also
allowed the research team to monitor and subsequently analyse how design professionals
undertake collaborative design activity.
1.3 Development of the conceptual design framework
An extensive literature search, which involved the collection, and subsequent analysis, of
the existing design process models, enabled a direct comparison to be made between the
phases outlined in these various descriptions, the details of which are provided elsewhere
17. In addition to this, two further sources of information were added. First, several case
study investigations, involving systematic interviewing and archive analysis, were
undertaken to gain an understanding of the activities and phases performed over the
conceptual phase of various building industry projects. Second, a previous workshop that
had been held, the form of which mirrors that of the workshop described here, enabled
the phases of design progression over a concentrated period to be recorded and analysed
18. The subsequent combination of these three sources of information allowed a
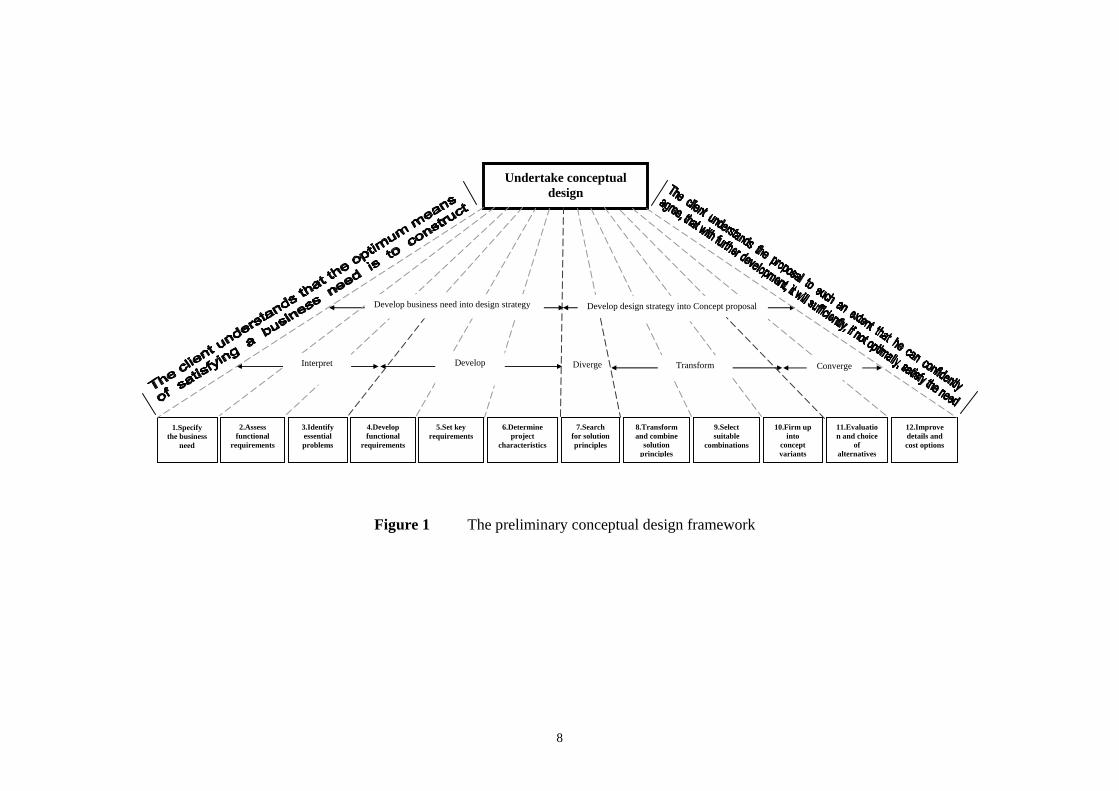
preliminary conceptual design framework (Figure 1) to be developed for testing 19.
2 Overview of the workshop
2.1 Workshop description
The workshop was held over a two-day period and involved delegates from a number of
building design industry organisations, representing the industrial collaborators from the
7
MDP research project. The workshop had three major aims: to test the applicability and
validity of a preliminary model of the conceptual design phase; to provide an additional
opportunity to monitor interdisciplinary design teams in practice; and to test a number of
‘Team Thinking Tools’ that had been identified during the course of the research.
The session involved fifteen design professionals in total, with each of the collaborating
organisations being represented. The fifteen delegates were divided into three teams, each
team comprising five designers, with each organisation being represented once in every
team. This ensured that each team had a full compliment of the relevant building design
disciplines, namely architects, building services engineers, civil/structural engineers. This
also reflected the way in which teams are newly formed in practice.
Two of the teams were designated as test groups and the third as the control group. The
two test groups were provided with a copy of the preliminary conceptual design
framework (shown in figure 1) and tutored on its terminology and structure.
8
1.Specify the business
need
2.Assess functional
requirements
3.Identify essential problems
4.Develop functional
requirements
5.Set key requirements
6.Determine project
characteristics
7.Search for solution principles
8.Transform and combine
solution principles
9.Select suitable
combinations
10.Firm up into
concept variants
11.Evaluation and choice
of alternatives
12.Improve details and cost options
Undertake conceptual design
Develop business need into design strategy Develop design strategy into Concept proposal
Interpret Develop Diverge Transform Converge
Figure 1 The preliminary conceptual design framework
9
One team was given the option to follow it while the other team was asked to follow it.
The two teams were then introduced to the brief and told to begin the exercise. The third
team was asked to solve the design problem without the framework model.
Each team was provided with a booklet of Team Thinking Tools (design techniques or
methods such as brainstorming and mind mapping) which they were asked to use during
the exercise. A brief presentation of these tools was provided, which gave the delegates
an insight into how to apply and use the tools and which particular periods of design each
tool was developed to assist. Details of this component of the investigation are provided
elsewhere 20.
2.2 Workshop format
Each team was asked to design an adaptable and flexible modular window system that
could be used to reclad existing office buildings. The brief stated that the system should
be a manufactured product, available virtually from stock, and should enhance the
environmental performance of the building. A number of design requirements and
parameters were outlined, which provided the teams with some initial constraints. A half-
hour presentation was given to introduce the cladding exercise, which comprised a wide-
ranging and well illustrated review of the function and history of the window. This
presentation drew examples of many types and forms of window and introduced a
number of passive environmental conditioning strategies such as the use of Brise-soleil
and low emissivity glazing.
10
Upon completion of the exercise, the individual team members were asked to complete
questionnaires. Teams A and B completed questionnaires relating to the design
framework model, the respective team performance, and the usefulness of the design
techniques. Team C completed the latter two only.
During actual design activity, a member of each team recorded the phases of design as
they were being undertaken and the design activities performed. This recording was
undertaken at five-minute intervals throughout the duration of the exercise. To verify and
support this self-assessment, members of the research group monitored each team and
made notes of both the time and activities being observed. This provided additional
information regarding the design activity and also acted as a means of verifying the self-
assessment records. The information provided by these questionnaires, combined with the
observations made during the course of the design activity, allowed a number of
preliminary findings to be drawn. Additionally, the data gathered during the session
allowed patterns of each team’s design progression to be generated.
Once finished, the respective concept proposals were presented in a 20-minute pin-up.
Although it was not a pre-requisite, each team member presented a section of the
proposal. Three independent experts critiqued the proposals and ranked them with respect
to the ease of which they could be subsequently developed into workable solutions that
satisfy the brief.
11
3 Workshop findings
This particular design problem, although appearing to be relatively simple, has the
advantage of requiring input from each of the design disciplines. Those teams that realise
the need for integration of the disciplinary issues into simple systems tend to be most
successful. Each of the teams produced appropriate concepts that they believed could be
subsequently developed into working systems. However, the manner in which the teams
worked and the nature of the proposals produced were quite different.
3.1 Observation and team member perception
Team A
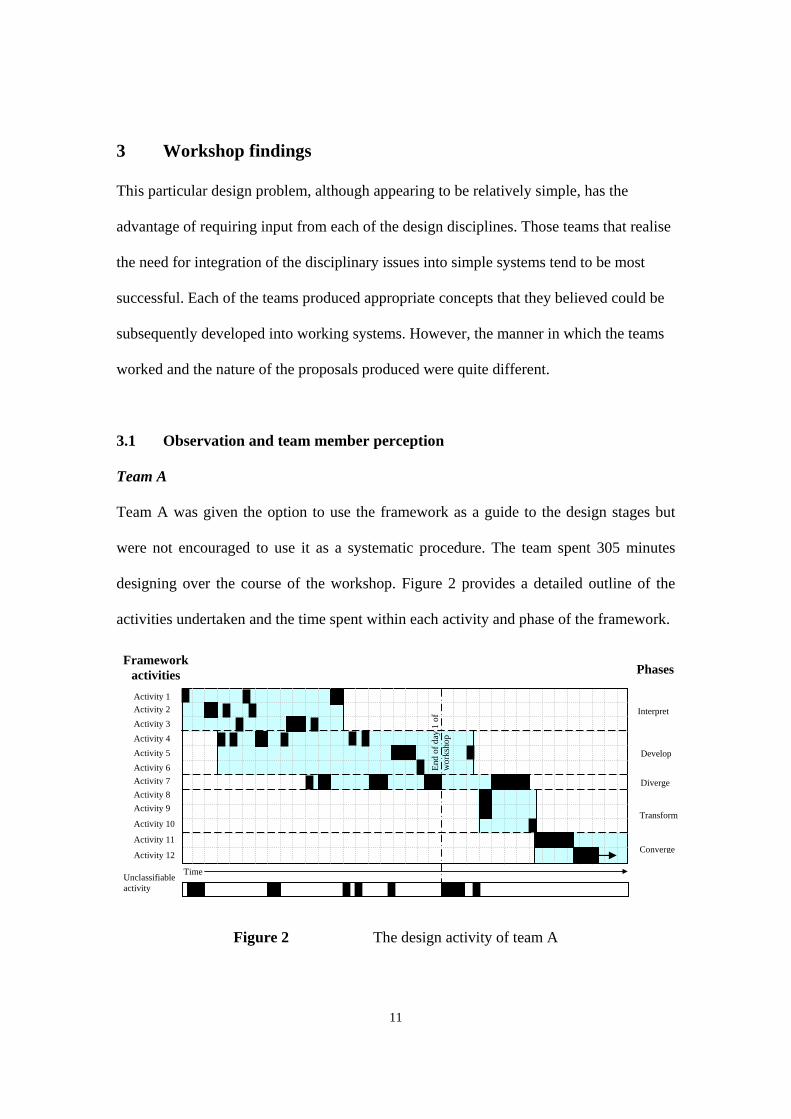
Team A was given the option to use the framework as a guide to the design stages but
were not encouraged to use it as a systematic procedure. The team spent 305 minutes
designing over the course of the workshop. Figure 2 provides a detailed outline of the
activities undertaken and the time spent within each activity and phase of the framework.
Figure 2 The design activity of team A
Unclassifiable activity
End
of d
ay 1
of
wor
ksho
p
Time
Activity 1 Activity 2 Activity 3 Activity 4 Activity 5 Activity 6 Activity 7 Activity 8 Activity 9
Activity 10
Activity 11
Activity 12
Framework activities
Interpret
Develop
Diverge
Transform
Converge
Phases
12
Team A followed the design framework to some extent but jumped between activities.
However, although the iteration was indiscriminate in manner, a noticeable sequential
pattern is apparent which suggests that the framework has actually been followed, albeit
fairly loosely. It is important to note that a reasonable period of design time,
approximately 1 hour, could not be classified within the proposed framework.
Team A produced a ‘kit of parts’ solution to the problem, which comprised a number of
interchangeable, standardised components from which a client could select the most
applicable arrangement. The phrase 'kit of parts' not only describes the solution but also
the way in which the team worked. The group did not interact well. Instead, each member
looked at a different element of the problem, with these partial solutions being brought
together at the end. There was little, if any, integration between the disciplines despite the
fact that the disciplinary components were connected.
The team leader (who had assumed this role) appeared to guide the group through the
design activity without agreeing this direction with the remainder of the team. It was
commented that 'the design appeared to be a vehicle for the leaders enthusiasms'. Later,
the leader commented that he had taken control because the team was too timid as a
group, with no one being prepared to take the lead role. As such, the leader progressed
through the activities without consulting the other team members.
This opportunistic design progression led to discontentment between members of the
team, and resulted in a confrontational atmosphere and lack of cohesion between
13
individuals. To this end the team in their own words ‘sometimes lacked direction’, with a
‘split in focus of team members’ and as a result, the team members ‘grew frustrated’. One
team member stated that the lack of common agreement on how to progress was the basis
of the team’s problems. Even though the team discussed the lack of cohesion felt by some
of the design members at the start of the second day; no action was undertaken to address
it. However, the dissatisfied team members felt that ‘the design collaboration improved’
to some extent, thus they bought back into the design progression. However, there were
‘still undercurrents of a lack of collaboration’ and as such, team members soon fell back
into their disciplinary sub-teams as the work progressed. The divisions remained apparent
throughout the exercise. It was also noted that there was a clash of personalities within
the team; a factor that did not aid the situation.
Team members reported that the framework could guide the design process if the entire
team would agree to follow it (findings would suggest that agreement on any procedure
would improve team interaction, collaboration, and resultantly, team effectiveness). The
early jumping between activities did not help the team, making the individual members
frustrated. Interestingly, it was stated that because the framework was not followed in
sufficient detail, being referred to after the fact, it was not used as it should have been e.g.
as a guiding principal. Additionally, it was stated that ‘someone needed to catch the
process, as [the team] tended to jump around the process rather than use it as a
[sequential] process’. Several team members agreed that concerns were not aired at an
early enough time in the process to enable the team to make changes and remedy the
situation.
14
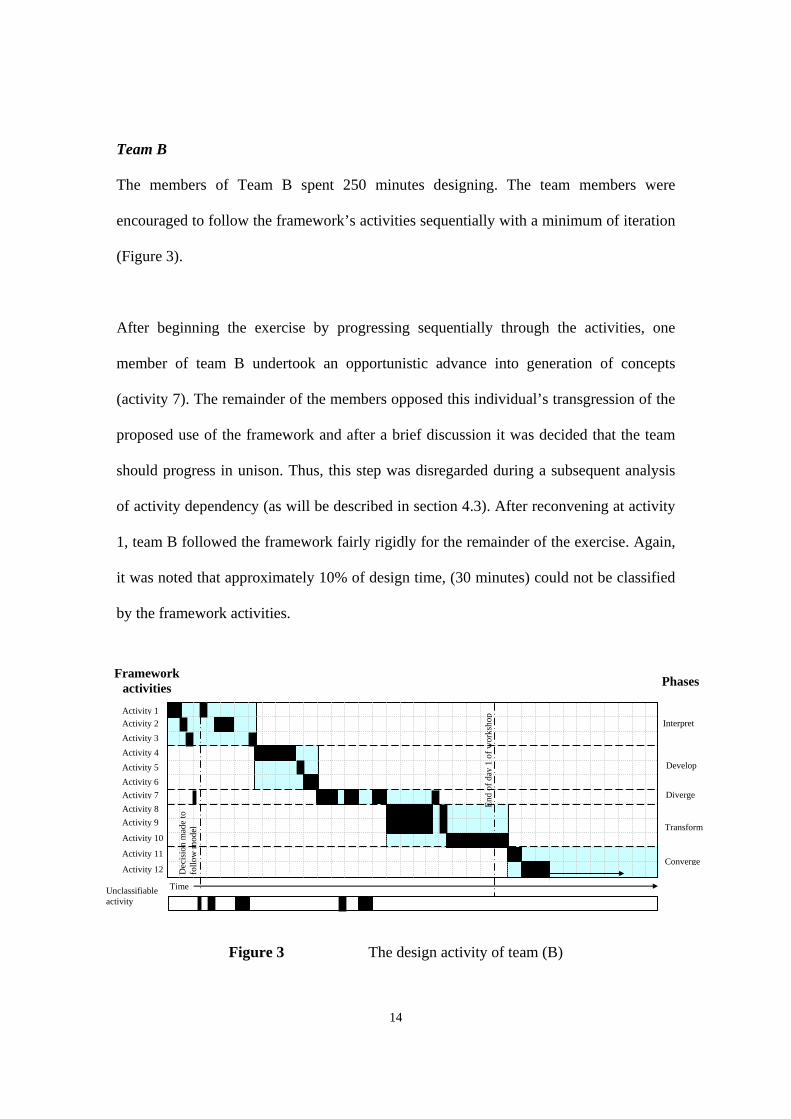
Team B
The members of Team B spent 250 minutes designing. The team members were
encouraged to follow the framework’s activities sequentially with a minimum of iteration
(Figure 3).
After beginning the exercise by progressing sequentially through the activities, one
member of team B undertook an opportunistic advance into generation of concepts
(activity 7). The remainder of the members opposed this individual’s transgression of the
proposed use of the framework and after a brief discussion it was decided that the team
should progress in unison. Thus, this step was disregarded during a subsequent analysis
of activity dependency (as will be described in section 4.3). After reconvening at activity
1, team B followed the framework fairly rigidly for the remainder of the exercise. Again,
it was noted that approximately 10% of design time, (30 minutes) could not be classified
by the framework activities.
Figure 3 The design activity of team (B)
Unclassifiable activity
End
of d
ay 1
of w
orks
hop
Dec
isio
n m
ade
to
follo
w m
odel
i
ll
Time
Activity 1 Activity 2 Activity 3 Activity 4 Activity 5 Activity 6 Activity 7 Activity 8 Activity 9
Activity 10
Activity 11
Activity 12
Framework activities
Interpret
Develop
Diverge
Transform
Converge
Phases
15
The concept generated by team B was based around a clip-on spandrel of limited use in
terms of either aesthetics or shading. The design concept was generally undeveloped,
with the concept tending to re-create the type of environmental problem that it was
attempting to remedy.
The crudity of the solution seemed to be the result of a mistaken belief that the problem
was simple. Generally, a high level of cohesion was apparent within the group but,
though the team interacted well throughout, the resulting concept was judged fairly poor
by the expert assessors.
The team members discussed their roles in advance of the design activity and, with one
exception, were happy about their positions, with individuals being flexible in their
approach to forwarding ideas across the boundaries of the disciplines. The objector,
whose background was in project management, felt that the leader had assumed sole
responsibility for the position, and had not let the other team members become involved
in progressing the design. However, on reflection, no other member of the team stated
that they had wanted to ‘lead’ the design at any time before, during or after the exercise.
In fact, one individual stated that ‘the group worked together very well right from the
start, but became even more organised as time went on’.
It was suggested that the team selection is a key factor in the success of design activity.
One suggestion for getting the interaction element correct was to let the team members
16
pick themselves. One team member felt that there was too much interest in details, rather
than in ensuring that the strategy/concept was defined.
Team C
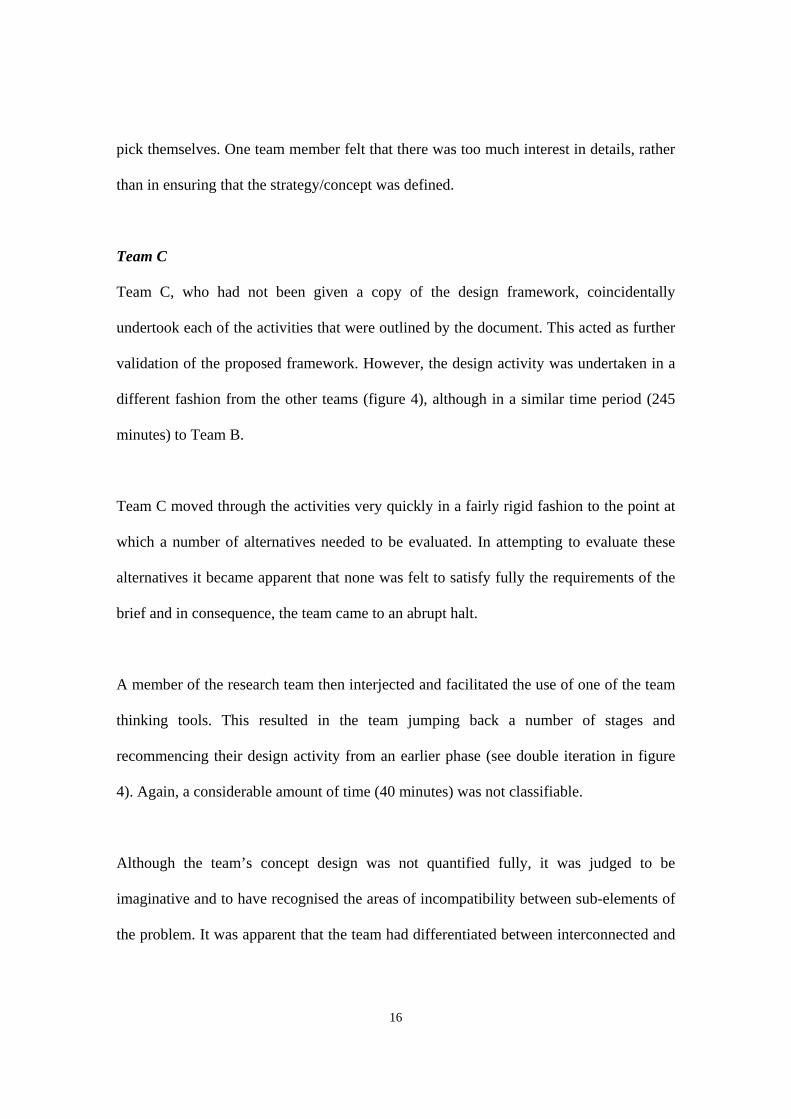
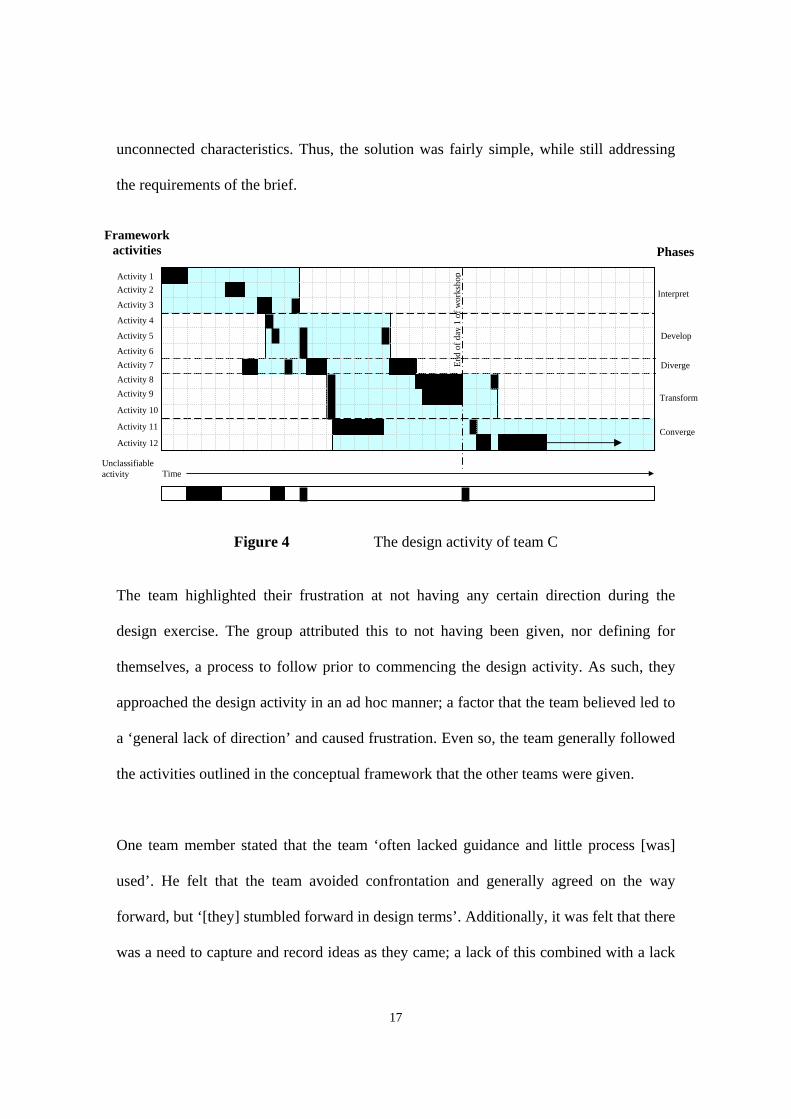
Team C, who had not been given a copy of the design framework, coincidentally
undertook each of the activities that were outlined by the document. This acted as further
validation of the proposed framework. However, the design activity was undertaken in a
different fashion from the other teams (figure 4), although in a similar time period (245
minutes) to Team B.
Team C moved through the activities very quickly in a fairly rigid fashion to the point at
which a number of alternatives needed to be evaluated. In attempting to evaluate these
alternatives it became apparent that none was felt to satisfy fully the requirements of the
brief and in consequence, the team came to an abrupt halt.
A member of the research team then interjected and facilitated the use of one of the team
thinking tools. This resulted in the team jumping back a number of stages and
recommencing their design activity from an earlier phase (see double iteration in figure
4). Again, a considerable amount of time (40 minutes) was not classifiable.
Although the team’s concept design was not quantified fully, it was judged to be
imaginative and to have recognised the areas of incompatibility between sub-elements of
the problem. It was apparent that the team had differentiated between interconnected and
17
unconnected characteristics. Thus, the solution was fairly simple, while still addressing
the requirements of the brief.
Figure 4 The design activity of team C
The team highlighted their frustration at not having any certain direction during the
design exercise. The group attributed this to not having been given, nor defining for
themselves, a process to follow prior to commencing the design activity. As such, they
approached the design activity in an ad hoc manner; a factor that the team believed led to
a ‘general lack of direction’ and caused frustration. Even so, the team generally followed
the activities outlined in the conceptual framework that the other teams were given.
One team member stated that the team ‘often lacked guidance and little process [was]
used’. He felt that the team avoided confrontation and generally agreed on the way
forward, but ‘[they] stumbled forward in design terms’. Additionally, it was felt that there
was a need to capture and record ideas as they came; a lack of this combined with a lack
End
of d
ay 1
of w
orks
hop
Time Unclassifiable activity
Activity 1 Activity 2
Activity 3
Activity 4
Activity 5
Activity 6 Activity 7 Activity 8 Activity 9
Activity 10
Activity 11
Activity 12
Framework activities
Interpret
Develop
Diverge
Transform
Converge
Phases
18
of an agreed process caused frustration. However, despite some individuals having
doubts about the potential contribution that they could provide in the early stages of the
activity, a full team effort did occur later in the process.
Another team member held a similar view, stating that ‘at the beginning of the exercise
the team members did not really gel’. He felt that this initially caused different stances to
be taken by individuals during the idea development stages. This individual suggested
that the problem would have been overcome if they had had a process, either imposed or
self generated, with which to harmonise their activity.
Critique of the three schemes
A critique was held at the end of the design period. Of the three teams, team C was
adjudged to have produced the best proposal. This appeared to owe much to the team
sharing the leadership, with each member tending to advise and then ask for comment,
instead of simply dominating the flow of work. The negative aspect of this was the
occasional lack of leadership, with no single member being willing to take the lead in
times of dispute (the group was too polite to allow that to happen). The key to the success
of the proposal seems to be that they had a wide knowledge base and were willing to
listen to one another.
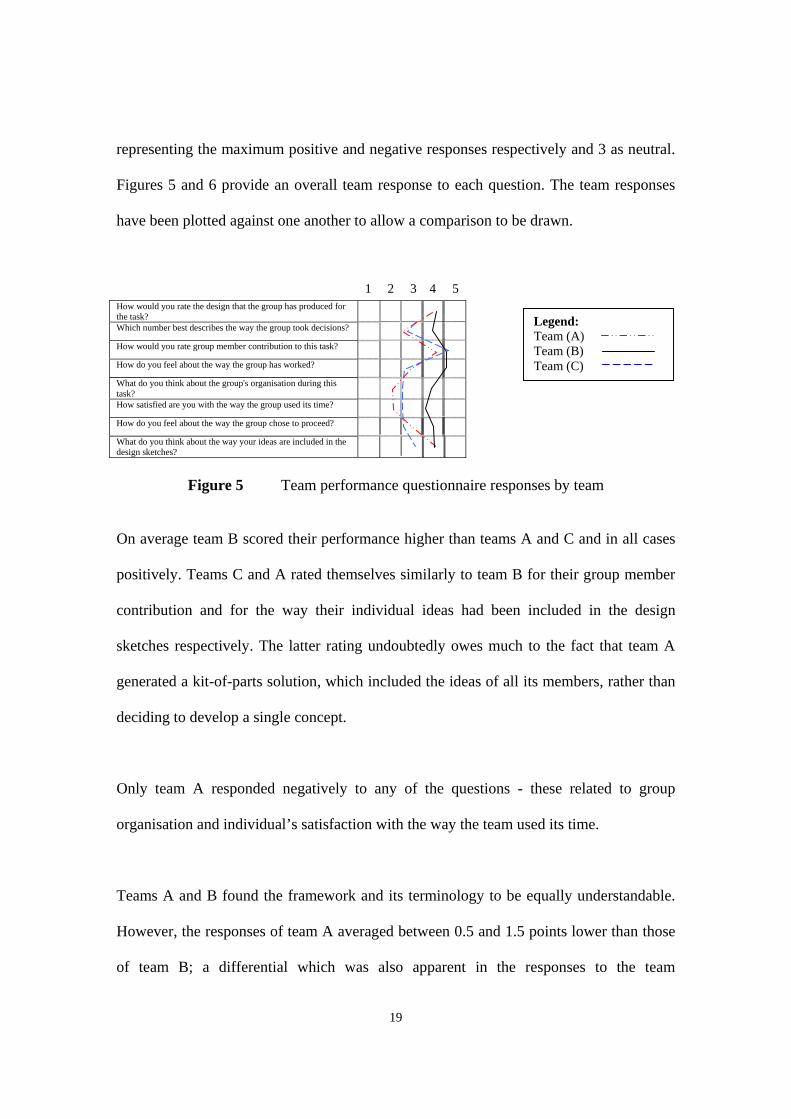
3.2 Questionnaire responses
The information gathered from the design framework and team performance
questionnaires is shown below. A five point Likert scale was applied with 5 and 1
19
representing the maximum positive and negative responses respectively and 3 as neutral.
Figures 5 and 6 provide an overall team response to each question. The team responses
have been plotted against one another to allow a comparison to be drawn.
How would you rate the design that the group has produced for the task? Which number best describes the way the group took decisions? How would you rate group member contribution to this task? How do you feel about the way the group has worked? What do you think about the group's organisation during this task? How satisfied are you with the way the group used its time? How do you feel about the way the group chose to proceed? What do you think about the way your ideas are included in the design sketches?
Figure 5 Team performance questionnaire responses by team
On average team B scored their performance higher than teams A and C and in all cases
positively. Teams C and A rated themselves similarly to team B for their group member
contribution and for the way their individual ideas had been included in the design
sketches respectively. The latter rating undoubtedly owes much to the fact that team A
generated a kit-of-parts solution, which included the ideas of all its members, rather than
deciding to develop a single concept.
Only team A responded negatively to any of the questions - these related to group
organisation and individual’s satisfaction with the way the team used its time.
Teams A and B found the framework and its terminology to be equally understandable.
However, the responses of team A averaged between 0.5 and 1.5 points lower than those
of team B; a differential which was also apparent in the responses to the team
1 2 3 4 5
Legend: Team (A) Team (B) Team (C)
20
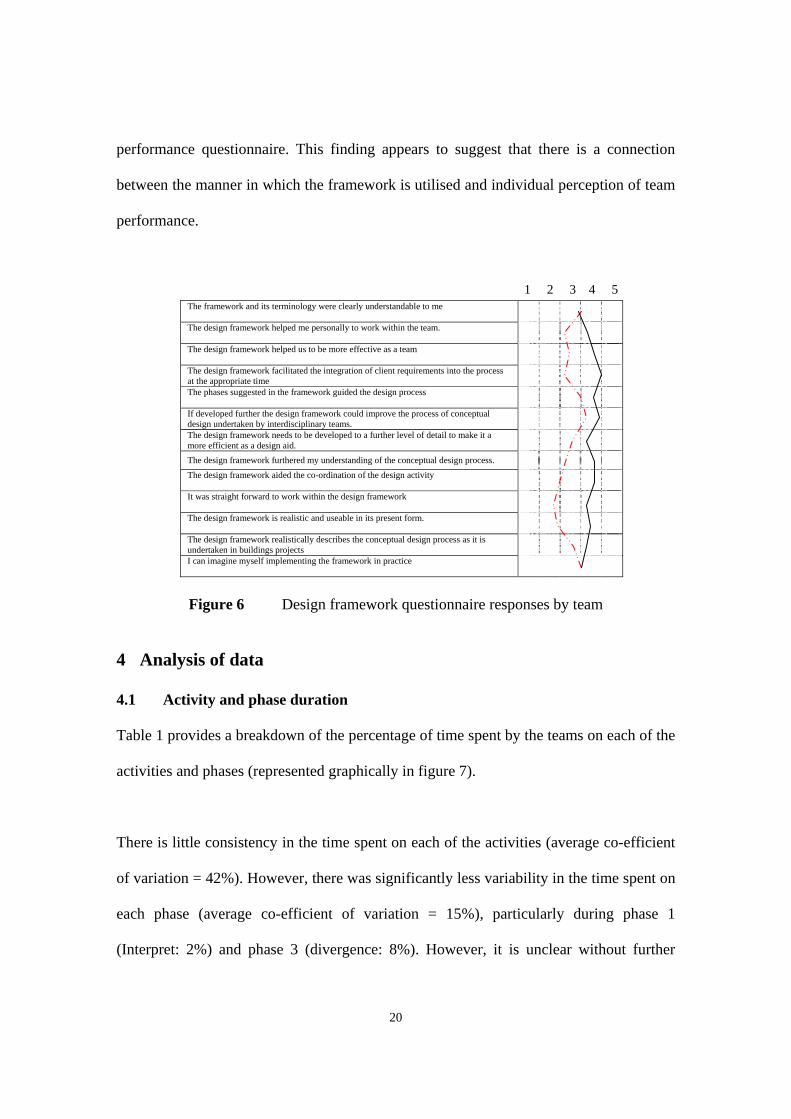
performance questionnaire. This finding appears to suggest that there is a connection
between the manner in which the framework is utilised and individual perception of team
performance.
The framework and its terminology were clearly understandable to me The design framework helped me personally to work within the team. The design framework helped us to be more effective as a team The design framework facilitated the integration of client requirements into the process at the appropriate time The phases suggested in the framework guided the design process If developed further the design framework could improve the process of conceptual design undertaken by interdisciplinary teams. The design framework needs to be developed to a further level of detail to make it a more efficient as a design aid. The design framework furthered my understanding of the conceptual design process. The design framework aided the co-ordination of the design activity It was straight forward to work within the design framework The design framework is realistic and useable in its present form. The design framework realistically describes the conceptual design process as it is undertaken in buildings projects
I can imagine myself implementing the framework in practice
Figure 6 Design framework questionnaire responses by team
4 Analysis of data
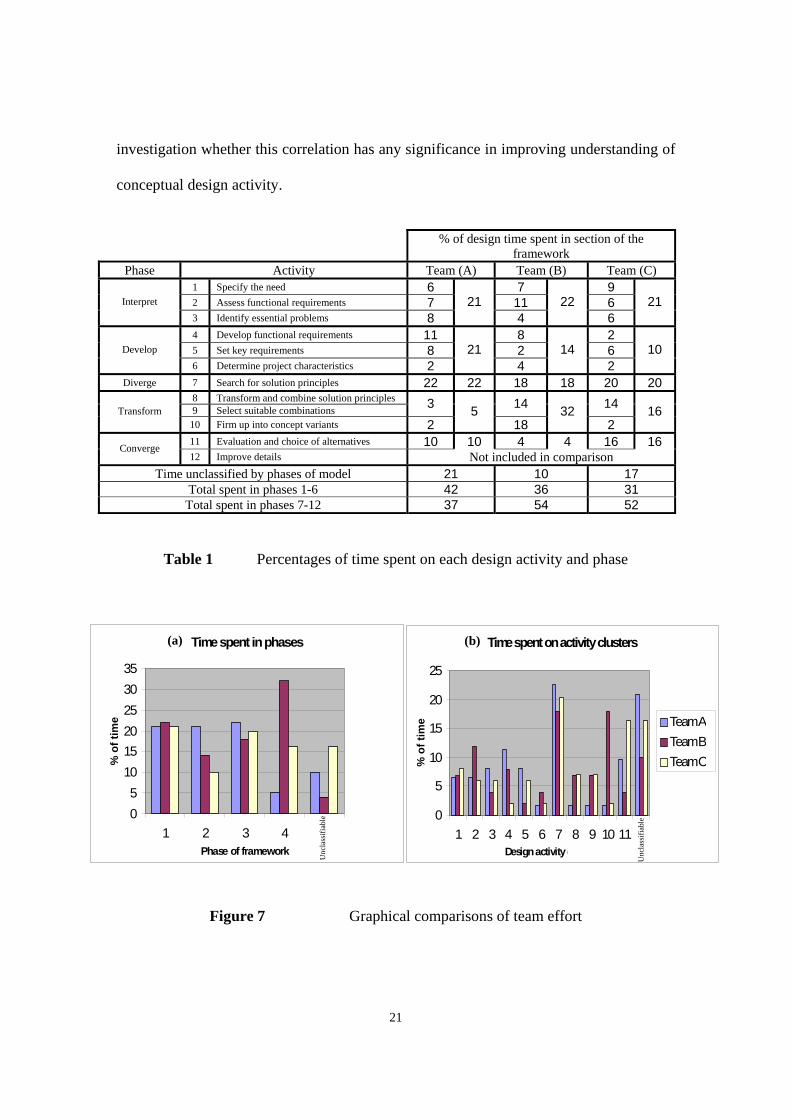
4.1 Activity and phase duration
Table 1 provides a breakdown of the percentage of time spent by the teams on each of the
activities and phases (represented graphically in figure 7).
There is little consistency in the time spent on each of the activities (average co-efficient
of variation = 42%). However, there was significantly less variability in the time spent on
each phase (average co-efficient of variation = 15%), particularly during phase 1
(Interpret: 2%) and phase 3 (divergence: 8%). However, it is unclear without further
1 2 3 4 5
21
investigation whether this correlation has any significance in improving understanding of
conceptual design activity.
% of design time spent in section of the
framework Phase Activity Team (A) Team (B) Team (C)
1 Specify the need 6 7 9 2 Assess functional requirements 7 11 6 Interpret 3 Identify essential problems 8
21 4
22 6
21
4 Develop functional requirements 11 8 2 5 Set key requirements 8 2 6 Develop 6 Determine project characteristics 2
21 4
14 2
10
Diverge 7 Search for solution principles 22 22 18 18 20 20 8 Transform and combine solution principles 9 Select suitable combinations 3 14 14 Transform
10 Firm up into concept variants 2 5
18 32
2 16
11 Evaluation and choice of alternatives 10 10 4 4 16 16 Converge 12 Improve details Not included in comparison
Time unclassified by phases of model 21 10 17 Total spent in phases 1-6 42 36 31 Total spent in phases 7-12 37 54 52
Table 1 Percentages of time spent on each design activity and phase
Figure 7 Graphical comparisons of team effort
Time spent in phases
05
101520253035
1 2 3 4 5Phase of framework
% o
f tim
e
Time spent on activity clusters
0
5
10
15
20
25
1 2 3 4 5 6 7 8 9 10 11 12Design activity cluster
% o
f tim
e Team A2Team B2Team C2
Unc
lass
ifiab
le
Unc
lass
ifiab
le
(a) (b)
22
4.2 Unclassifiable activity
As can be seen from table 1, between 10% and 21% of the time spent designing could not
be classified within the preliminary conceptual design framework model. This time was
spent on a number of activities:
• Introductions by team members.
• Individuals outlining their roles within the design team.
• The pooling of knowledge - team members giving a synopsis of their knowledge of
window system design and precedent cases.
• Planning and discussing the process of design to be followed.
• The development of a shared understanding of the requirements of the system.
• The generation of programmes to allocate time periods to particular activities.
• Identifying interconnected and unconnected elements of the design problem and
solution.
• Discussion of problems regarding the performance of the team
Upon further analysis of this final point it became apparent that discussions were
generally based on five specific issues:
• Working as a team (initial introductions, roles, responsibilities: defining teamwork)
• Maintaining interaction between members
• Lack of communication
• Team dynamics (attempts to maintain collaboration between team members)
23
• Redirecting the team to maintain efficiency
To this end, it was recognised that one of the main elements missing from the design
framework is the need to recognise and manage team maintenance. This needs to be
addressed and accounted for in a realistic model of conceptual design activity.
4.3 Dependency across activities
The patterns of actual design progression of the teams through the framework activities
(figures 2-4) could be the result of one of two things: i) there is some form of dependency
between those activities; or ii) the team picked the next activity to be addressed at
random, simply because they recognised that it had to be visited at some point during the
process. However, if the latter eventually proves to be true then present attempts to
understand conceptual design are doomed to fail. For the purposes of this research it has
been assumed that design progression has an underlying rationale, and it is this that the
authors seek to discover and, ultimately, support.
A technique developed in the 1980’s 21 known as the dependency structure matrix
(DSM), which has been applied previously in design research 22, 23, 24, 25 to portray the
dependencies between sets of activities, can be utilised to analyse design progression. In
the context of this investigation, the DSM is produced by assuming that, as the various
patterns of progression depict the actual design activity of the teams, progression from
one activity to another must be the result of some dependency between those activities.
The DSM works on the premise that the activities are undertaken in the order suggested
24
by the rows (and columns; which are always in the same order). The dependence of one
activity (e.g 2) on another (e.g 4) is indicated by placing a mark in row 2, column 4 of the
matrix. A mark placed above the diagonal indicates feedback (i.e dependence on a future
activity) and hence, iteration.
A DSM is usually evolved from a previously defined process model of activities and
dependencies. The optimum order of activities (minimising iteration) can be found by
applying a ‘partitioning’ algorithm. In this instance the process has been reversed: the
sequence in the pattern of progression has been used to infer the activity dependencies
and hence, construct the matrix.
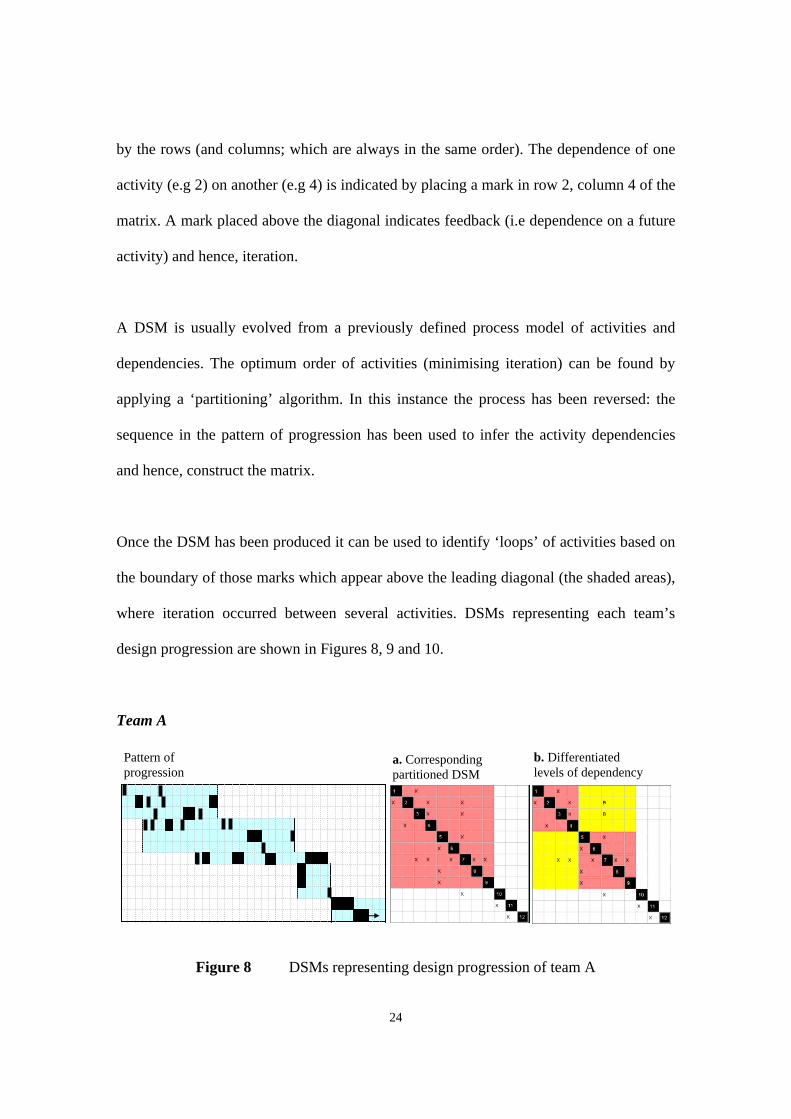
Once the DSM has been produced it can be used to identify ‘loops’ of activities based on
the boundary of those marks which appear above the leading diagonal (the shaded areas),
where iteration occurred between several activities. DSMs representing each team’s
design progression are shown in Figures 8, 9 and 10.
Team A
Figure 8 DSMs representing design progression of team A
Pattern of progression
a. Corresponding partitioned DSM
b. Differentiated levels of dependency
25
The DSM of team A (figure 8-a) portrays a large interdependency block within and
between activities 1-9. During this period, rather than completing one activity entirely
before progressing to the next, the team jumped between them. Once they had selected
suitable combinations of concepts (activity 9) they progressed sequentially through the
remainder of the design activity.
However, within the large iterative block of activities a differentiation can be drawn
between the nature of dependencies. If those marks furthest from the leading diagonal are
designated as having a different level of dependency (marked B) to those representing a
lesser backward step (i.e. those falling closer to the leading diagonal) it is apparent that
iterations within certain clusters of activities fall inside the higher level of iteration
represented by the large dependency block. This revised DSM (figure 8–b) moves closer
to the DSM describing team B’s design activity (figure 9).
Team B
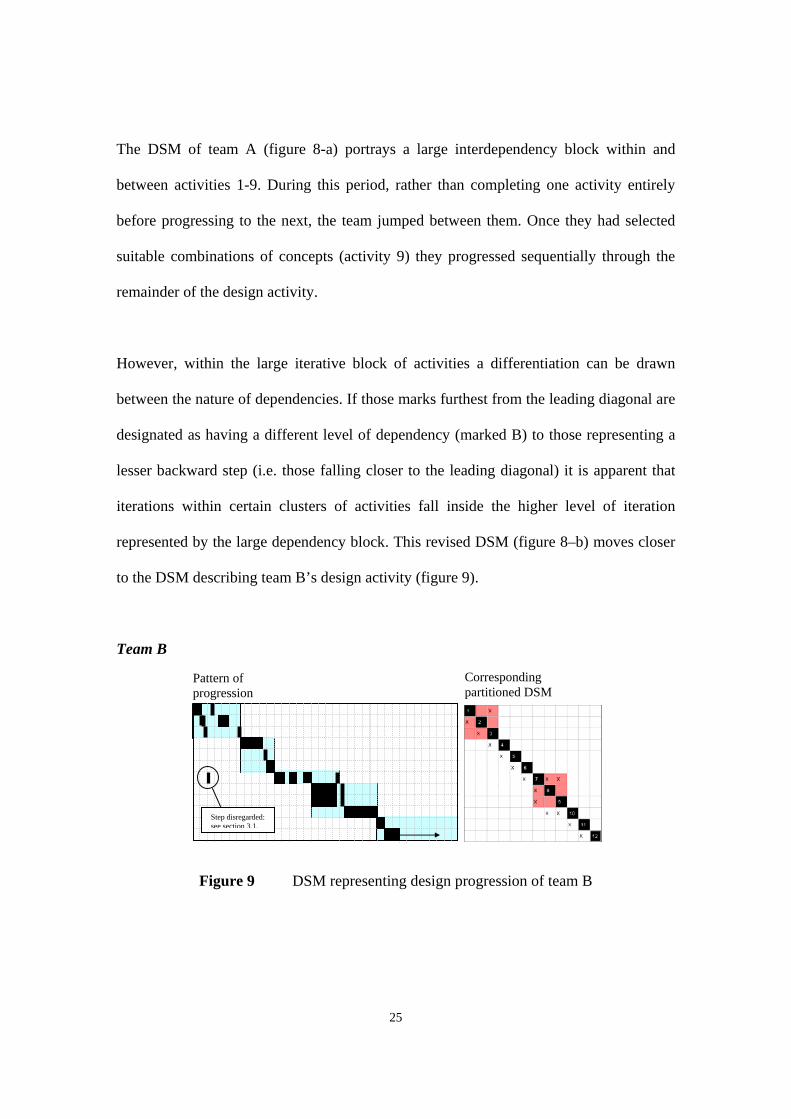
Figure 9 DSM representing design progression of team B
Corresponding partitioned DSM
Pattern of progression
Step disregarded: see section 3.1.
26
The design progression of team B is very similar to that of team A (figure 8-a), with each
describing two blocks of interdependence. However, they differ in the fact that the blocks
of iteration described in figure 9 are independent of one another and are not contained
within a larger iterative loop. Activities 1-3 are interdependent, after which there is a
sequential progression up to the determination of project characteristics (activity 6). Upon
completion of this activity, the following three activities - 7) searching for solution
principles; 8) transforming and combining these, and 9) selecting suitable combinations,
were undertaken in an iterative manner. Again, once this ‘loop’ was complete the
remaining design activity was undertaken sequentially.
Team C
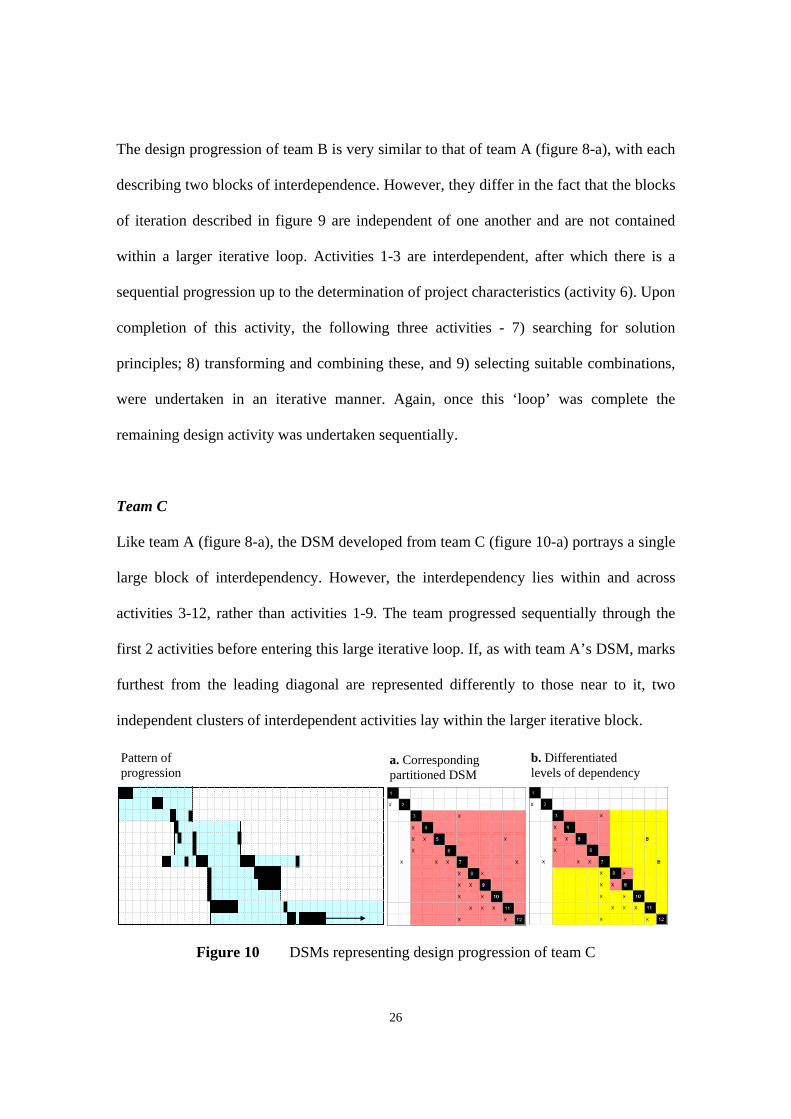
Like team A (figure 8-a), the DSM developed from team C (figure 10-a) portrays a single
large block of interdependency. However, the interdependency lies within and across
activities 3-12, rather than activities 1-9. The team progressed sequentially through the
first 2 activities before entering this large iterative loop. If, as with team A’s DSM, marks
furthest from the leading diagonal are represented differently to those near to it, two
independent clusters of interdependent activities lay within the larger iterative block.
Figure 10 DSMs representing design progression of team C
Pattern of progression
a. Corresponding partitioned DSM
b. Differentiated levels of dependency
27
However, it is important to note that, once the team had identified the essential problems
(at activity 3), they undertook what appear to be two similar processes to complete the
exercise. Upon further examination it is apparent that, if the two similar processes are
considered separately, the design progression, and the resulting DSMs, are very similar to
those exhibited by team B.
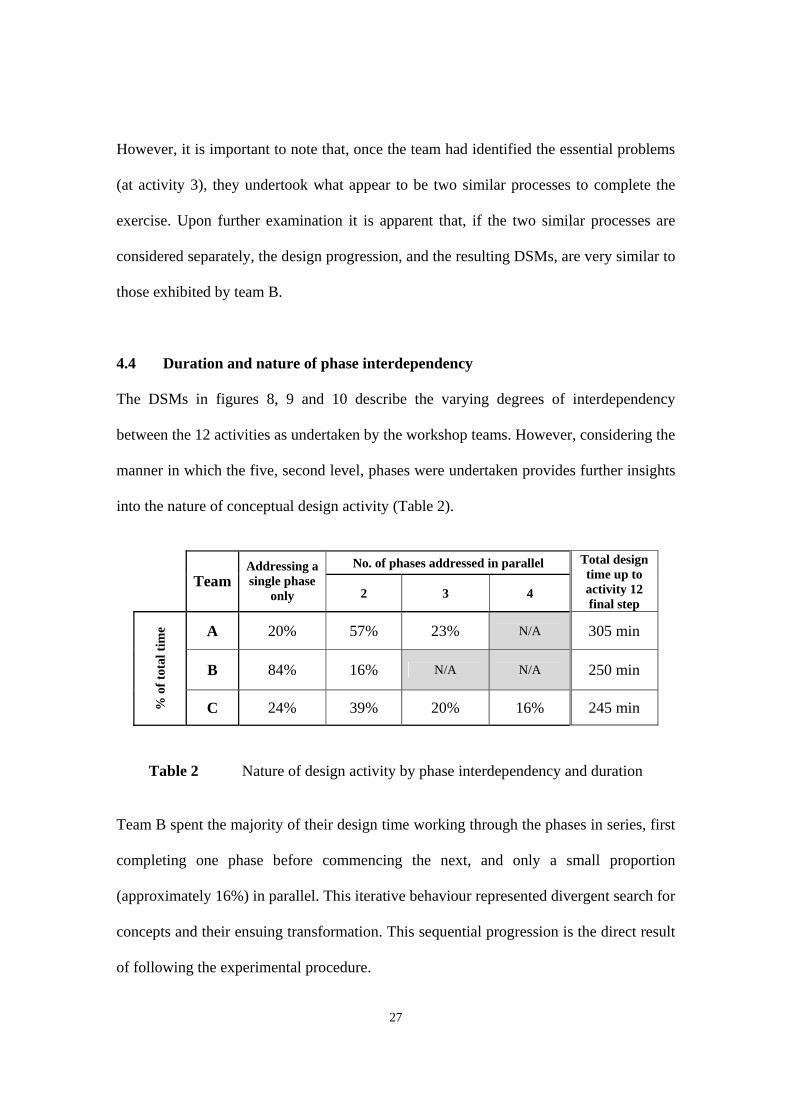
4.4 Duration and nature of phase interdependency
The DSMs in figures 8, 9 and 10 describe the varying degrees of interdependency
between the 12 activities as undertaken by the workshop teams. However, considering the
manner in which the five, second level, phases were undertaken provides further insights
into the nature of conceptual design activity (Table 2).
No. of phases addressed in parallel
Team Addressing a single phase
only 2 3 4
Total design time up to activity 12 final step
A 20% 57% 23% N/A 305 min
B 84% 16% N/A N/A 250 min
% o
f tot
al ti
me
C 24% 39% 20% 16% 245 min
Table 2 Nature of design activity by phase interdependency and duration
Team B spent the majority of their design time working through the phases in series, first
completing one phase before commencing the next, and only a small proportion
(approximately 16%) in parallel. This iterative behaviour represented divergent search for
concepts and their ensuing transformation. This sequential progression is the direct result
of following the experimental procedure.
28
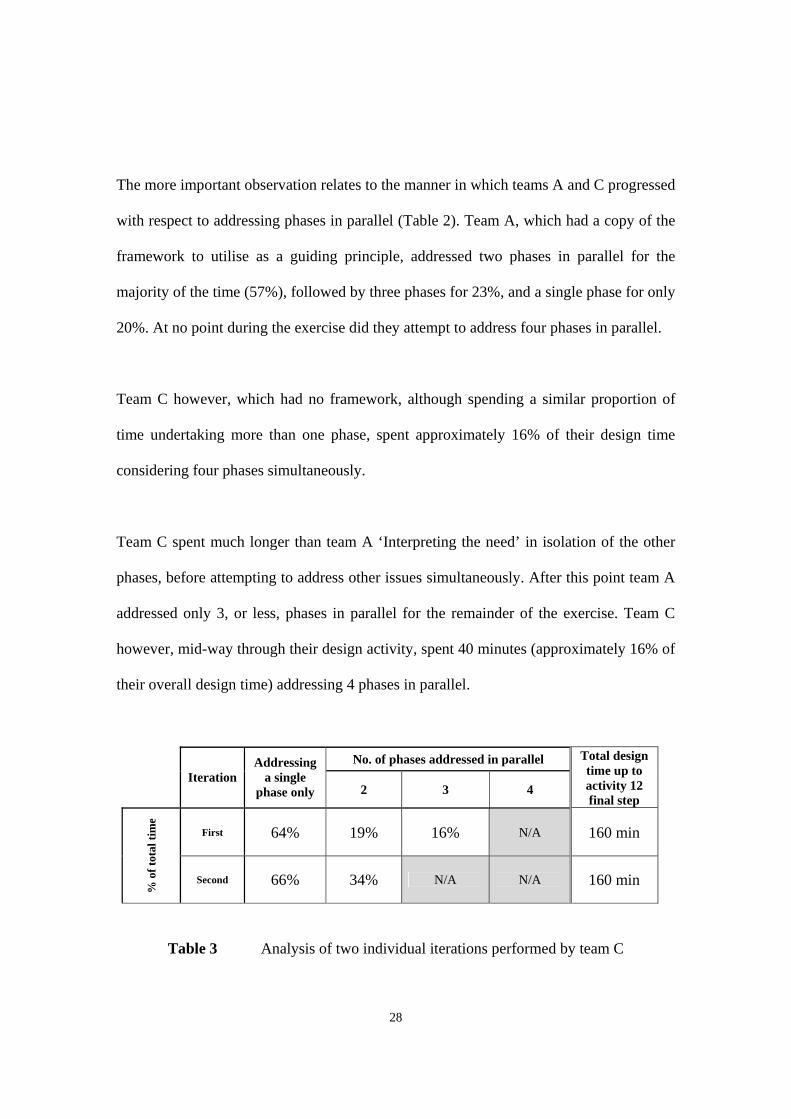
The more important observation relates to the manner in which teams A and C progressed
with respect to addressing phases in parallel (Table 2). Team A, which had a copy of the
framework to utilise as a guiding principle, addressed two phases in parallel for the
majority of the time (57%), followed by three phases for 23%, and a single phase for only
20%. At no point during the exercise did they attempt to address four phases in parallel.
Team C however, which had no framework, although spending a similar proportion of
time undertaking more than one phase, spent approximately 16% of their design time
considering four phases simultaneously.
Team C spent much longer than team A ‘Interpreting the need’ in isolation of the other
phases, before attempting to address other issues simultaneously. After this point team A
addressed only 3, or less, phases in parallel for the remainder of the exercise. Team C
however, mid-way through their design activity, spent 40 minutes (approximately 16% of
their overall design time) addressing 4 phases in parallel.
No. of phases addressed in parallel
Iteration Addressing
a single phase only 2 3 4
Total design time up to activity 12 final step
First 64% 19% 16% N/A 160 min
% o
f tot
al ti
me
Second 66% 34% N/A N/A 160 min
Table 3 Analysis of two individual iterations performed by team C
29
It must be remembered that team C’s progression through the activities, once activity four
had been completed, represented two discrete iterations (figure 4). Table 3 considers
these two progression patterns individually, based on the premise that phase one is
common to both iterations.
This data suggests that a larger proportion of time, approximately 65%, was spent
undertaking phases in isolation of one another. Additionally, rather than considering 4
phases in unison for periods during the design activity, team C actually considered 3
phases in parallel during the first iteration and then only two during the second. This
implies that team C, who were considered to have developed the solution which could be
subsequently developed to meet the brief most effectively, considered phases in isolation,
and two and three phases in parallel to generate the holistic concept. After which, the
team, having settled on the high level concept, developed the final proposal by
undertaking phases singularly, or by considering no more than two phases in parallel.
This suggests that team C considered multiple phases to form the concept, which then
allowed them to reduce the number of phases being performed in unison to crystallise the
proposal.
4.5 Observations and comparison
Considering figures 8, 9 and 10 in addition to the analysis undertaken in section 4.4, it is
apparent that iterations across the activities and phases of the recorded design processes
fit within a higher level of iteration representing the entire conceptual design phase. In
30
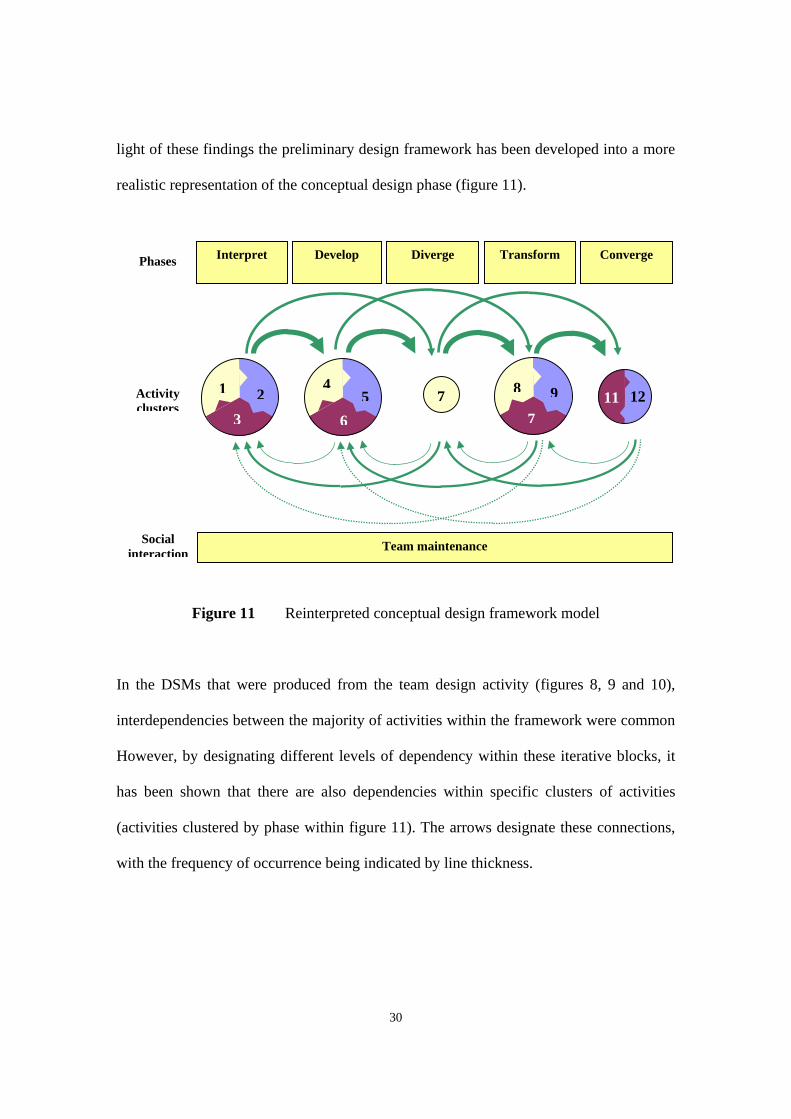
light of these findings the preliminary design framework has been developed into a more
realistic representation of the conceptual design phase (figure 11).
Figure 11 Reinterpreted conceptual design framework model
In the DSMs that were produced from the team design activity (figures 8, 9 and 10),
interdependencies between the majority of activities within the framework were common
However, by designating different levels of dependency within these iterative blocks, it
has been shown that there are also dependencies within specific clusters of activities
(activities clustered by phase within figure 11). The arrows designate these connections,
with the frequency of occurrence being indicated by line thickness.
Activity clusters
Phases Interpret Develop Diverge Transform Converge
1 2 54
7 98 11 12 3 6 7
Team maintenance Social interaction
31
This concept of iteration-within-iteration has been proposed previously by Hickling 26,
who represented the whirling process of decision making in design in a similar manner
(figure 12).
Figure 12 The extended whirling process
Owing to the fact that ‘no foolproof experiment was available with which to demonstrate
these connections’ 26, Hickling suggested, rather than asserted, their existence. However,
upon comparing the iterative nature of the design activity of the workshop teams with the
cyclic whirling process prescribed by Hickling, the notion that differing levels of
dependency exist within and across activities appears to be substantiated.
Hickling model (to big to handle)
32
5 Summary and conclusions
This research involved three interdisciplinary design teams made up of a number of
design professionals from several different organisations. The investigations did not take
into account the abilities, expertise or knowledge base of the individual designers and as
such, no comment can be passed on the influence that these issues can have on the design
process. In statistical terms the number of participants in the workshop is very few and it
would be premature to draw general inferences from this limited evidence. However,
within these limitations, the following conclusions were drawn:
i. the majority of design activity undertaken by the teams (between 79 and 90%) could
be classified within the activities of the conceptual design framework;
ii. social interaction and team maintenance account for a portion (between 10 and
21%) of design time but neither issue is classified within the conceptual framework
model;
iii. the evidence suggests that designers perceive they have performed better as a team
when they agree on, and subsequently follow, a design process;
iv. there is no evidence to suggest that following a design process, be it in an iterative
or systematic manner, will help the team to generate a better design concept or
reduce the time period spent reaching that concept;
v. the evidence suggests that a team must be led throughout the design activity.
However, the team must agree on who should lead it and how it should be led if it is
to work effectively as a unit and avoid confrontation; and
33
vi. if the team does not agree on a design process to follow, individual team members
tend to make opportunistic forays into particular areas of the problem in an ad hoc
manner. If other team members do not agree on the direction of that foray then this
can lead to a lack of synchronisation in the team effort and a lack of input from one
or a number of it's members.
In light of these conclusions it is apparent that initial validation of the framework
structure has been achieved. Additionally, this initial validation of the preliminary
conceptual design framework has enabled an improved representation of conceptual
design activity to be generated which not only describes the activities and phases of
conceptual design, but also illustrates their interconnectedness. Moreover, a critical
component of conceptual design activity, namely the process of social interaction, which
was missing from the preliminary framework, has now been introduced and embedded
within the revised model. Future development of the conceptual design framework
involves turning it into a web-based design tool intended for use by design teams 27. At
some point in the future the authors hope to report on its acceptability and usefulness in
practice.
6 Acknowledgements
This work has been undertaken as part of a project entitled ‘Mapping the Design Process
during the conceptual phase of building projects’. The research is funded under research
grant GR/L39292 by the EPSRC and industry (AMEC Design, BAA Plc., Hotchkiss
Ductwork Ltd, Hutter, Jennings and Titchmarsh, Matthew Hall, and Pascall & Watson).
34
Loughborough University is also contributing to the project. The final version of the
paper benefited from suggestions made by the referee.
References:
1. Markus TA (1969). ‘The role of building performance measurement and appraisal in design method’. In Broadbent, Ward (eds.) Design methods in Architecture. London, Lund Humphries. 2. Maver TW (1970). ‘Appraisal in the building design process’. In Moore GT (ed.). Emerging methods in environmental design and planning. Cambridge, Mass. MIT Press. 3. French M.J (1971). Engineering Design: The Conceptual Stage. Heinemann Educational Books. 4. Archer B.L (1984). ‘Systematic method for designers’. In: Cross, N (ed.) Developments in design methodology. Wiley, Chichester, UK, pp. 57-82. 5. Pugh S, Morley IE (1988). Total design: Towards a theory of total design. Published by Design Division, University of Strathclyde, UK. 6. Pahl G, Beitz W (1988). Engineering Design: A Systematic Approach. The Design Council-Springer/Verlag. 7. Cross N (1989). Engineering Design Methods: Strategies for Product Design. John Wiley & Sons. 8. Austin S, Baldwin A, Li B, Waskett P (1999a). ‘Analytical design planning technique: a model of the detailed building design process’. Design studies, Vol.20, No3, pp 279-296. 9. Austin S, Baldwin A, Li B & Waskett P (1999b). ‘Analytical Design Planning Technique for Programming the Building Design Process’. Proceedings of the Institution of Civil Engineers, Structures and Building, Vol.134, No.2, May, pp 111-118. 10. BAA Plc (1995). The Project Process: A guide to the BAA project process. Internal publication. BAA Plc, Aug '95. London. 11. Kagioglou et al (1998). A generic guide to the Design and Construction Process Protocol. The University of Salford.
35
12. RIBA (1969). Plan of work for Design Team Operation - Royal Institute of British Architects. Original Edition.
13. Minneman S.L (1991). The social construction of a technical reality: Empirical studies of group engineering design practice. PhD Dissertation. Stanford University, USA. 14. Hales, C (1987). Analysis of the engineering design process in an industrial context. PhD Thesis. Cambridge University Press. 15. Blessing LTM (1996). A process based approach to computer supported engineering design. Black Bear Press Ltd, Cambridge, UK. 16. Hubka V (1982). Principles of engineering Design. Butterworths & Co. 17. Macmillan S, Steele J, Austin S, Spence R, Kirby P (1999a). ‘Mapping the early stages of the design process - a comparison between engineering and construction’. Proceedings of 12th International Conference on Engineering Design (ICED '99). Munich, Germany. 18. Austin S, Steele J, Macmillan S, Kirby P, Spence R (1999). ‘Using training workshops to map interdisciplinary team working’. Proceedings of Chartered Institute of Building Services Engineers National Conference 1999, Harrogate, UK. 19. Macmillan S, Steele J, Austin S, Spence R, Kirby P (1999b). ‘Development of a generic conceptual design framework’. Submitted to Design studies for publication. 20. Macmillan S, Steele J, Austin S, Spence R, Kirby P (1999c). ‘Testing design tools in an interdisciplinary design environment’. Working paper. The martin centre, University of Cambridge, UK. 21. Steward, D (1981). Analysis and management: structure, strategy and design. Petrocelli Books, Princeton, NJ, USA. 22. McCord K, Eppinger S (1993). ‘Managing the integration problem in concurrent engineering’. Working paper. MIT Sloan School of Management, WP 3594-93 1993. 23. Rogers J, Padula S (1989). An intelligent advisor for the design manager. NASA Technical Report, TM-101558. 24. Huovila P, Koskela L, Lautanala M, Tanhuanpaa V (1995). ‘Use of the design structure matrix in construction.’ Proceedings of 3rd International workshop on lean construction, Albuquerque.

36
25. Austin S, Baldwin A, Li B, Waskett P (1998). ‘Development of the ADePT methodology: an interim report on the Link IDAC 100 Project’. Department of Civil and Building Engineering, Loughborough University, UK. 26. Hickling A (1982). ‘Beyond a linear iterative process?’ In Evans B, Powell JA, Talbot RJ (eds.) (1982) Changing Design. John Wiley and Sons Ltd. UK. 27. Steele J, Austin S, Macmillan S, Kirby P, Spence R (forthcoming). ‘An internet-based system to support interdisciplinary and inter-organisational collaborative conceptual design’. Chartered Institute of Building Services Engineers (CIBSE) National Conference, Dublin, UK.