mapping the proteome of poplar and application to the discovery of drought-stress responsive...
TRANSCRIPT
RESEARCH ARTICLE
Mapping the proteome of poplar and application to the
discovery of drought-stress responsive proteins
Christophe Plomion1, Céline Lalanne1, Stéphane Claverol2, Hakim Meddour1,Annegret Kohler3, Marie-Béatrice Bogeat-Triboulot4, Aurélien Barre5, Grégoire Le Provost1,Hélène Dumazet5, 6, Daniel Jacob5, Catherine Bastien7, Erwin Dreyer4, Antoine de Daruvar5,Jean-Marc Guehl4, Jean-Marie Schmitter8, Francis Martin3 and Marc Bonneu2
1 UMR Biodiversité Gènes Communautés, INRA, Equipe de génétique, Cestas, France2 Pôle Protéomique de la Plateforme Génomique Fonctionnelle Bordeaux, Université Bordeaux 2,
Bordeaux, France3 UMR Interactions Arbres/Micro-organismes, Champenoux, France4 UMR INRA-UHP Ecologie et Ecophysiologie Forestières, IFR 110 Génomique Ecophysiologie et
Ecologie Fonctionnelle, Champenoux, France5 Centre de Bioinformatique de Bordeaux, Plateforme Génomique fonctionnelle Bordeaux,
Université Bordeaux 2, Bordeaux, France6 Laboratoire Bordelais de Recherche en Informatique, Talence, France7 INRA – Unité Amélioration, Génétique et Physiologie forestières, Olivet, France8 Institut Européen de Chimie et Biologie (IECB)-ENSCPB, Pessac, France
Poplar is the first forest tree genome to be decoded. As an initial step to the comprehensiveanalysis of poplar proteome, we described reference 2-D-maps for eight tissues/organs of theplant, and the functional characterization of some proteins. A total of 398 proteins were excisedfrom the gels. About 91.2% were identified by nanospray LC-MS/MS, based on comparison with260 000 Populus sp. ESTs. In comparison, reliable PMFs were obtained for only 51% of the spotsby MALDI-TOF-MS, from which 43% (83 spots) positively matched gene models of the Populustrichocarpa genome sequence. Among these 83 spots, 58% matched with the same proteins asidentified by LC-MS/MS, 21.7% with unknown function proteins and 19.3% with completelydifferent functions. In the second phase, we studied the effect of drought stress on poplar rootand leaf proteomes. The function of up- and down-regulated proteins is discussed with respect tothe physiological response of the plants and compared with transcriptomic data. Some importantclues regarding the way poplar copes with water deficit were revealed.
Received: May 15, 2006Revised: August 7, 2006
Accepted: September 9, 2006
Keywords:
2-DE / Database / Drought / PMF / Peptide sequence tag
Proteomics 2006, 6, 6509–6527 6509
1 Introduction
The genus Populus comprises approximately 30 widely dis-tributed species of significant ecological and economic valuein the Northern hemisphere. It is now a well-establishedmodel organism to elucidate the biological function uniqueto trees [1]. While the Populus genome sequence provides acomprehensive overview of the genes in poplar trees [2], it ishowever becoming increasingly clear that this invaluableresource is only a very fragmentary beginning to define thefunction and interaction of all potential proteins. Further-more, while transcript abundance is a very useful indicator of
Correspondence: Dr. Christophe Plomion, UMR BiodiversitéGènes Communautés, INRA, Equipe de génétique, 69 routed0Arcachon, 33612 Cestas, FranceE-mail: [email protected]: 133-5-57122881
Abbreviations: BSP, bark storage proteins; CZ, cambial zone; DSX,
developing secondary xylem; DVB, dormant vegetative bud; EL,
expanding leaf; GS, glutamine synthase; LAR, leucoanthocyani-din reductase; MLP, major latex protein; MPP, mitochondrial pro-cessing peptidase; PRP, proline-rich protein; RMB, reproductivemale bud; SOD, superoxide dismutase; WR, white root; YFI,
young female inflorescence; YL, young leaf
DOI 10.1002/pmic.200600362
© 2006 WILEY-VCH Verlag GmbH & Co. KGaA, Weinheim www.proteomics-journal.com

6510 C. Plomion et al. Proteomics 2006, 6, 6509–6527
gene expression (e.g. [3]), it only provides one layer of infor-mation. Indeed, transcript profiling does not provide infor-mation related to protein turnover, PTMs such as signalpeptide cleavage, phosphorylation or glycosylation, sub-cellular localization of proteins or the complex interactionsbetween proteins.
The concept of ‘proteome’, (the full complement of pro-teins produced by a particular genome [4]), has emerged toprovide complementary and critical information by revealingthe regulation, quantities, activities and interaction of everyprotein in the cell. Proteomics is now becoming an activefield of plant genomics and has proliferated within the pastfew years. Plant proteomic studies published to date haveconcentrated on mapping the proteomes of various organs,tissues, cells and organelles, from the model species Arabi-dopsis [5–8], rice (reviewed in [9]) and barrel medic [10–12], toother important crops including wheat [13, 14], soybean [15],pea [16] and maize [17]; maritime pine [18, 19], white spruce[20] and oak [21, 22] being the main forest tree species thathave been subjected to extensive proteomic analysis so far. Inthis context, it is peculiar that poplar proteomics is still in itsinfancy [23], in spite of large collections of publicly availableESTs and an 8.5X depth whole-genome shotgun from Popu-lus trichocarpa [2] that provide key genomic resources formass spectrometric technology-based protein identification.In this study, highly reproducible and well-resolved 2-DEmaps of proteins were first obtained for 8 tissues/organs ofPopulus sp. Then, MS was successfully used to identify 363expressed proteins.
The present work was also conducted to determine theeffect of a drought stress on root and leaf proteomes.Drought constitutes one of the most frequent limitations toplant growth and productivity [24]. Perennial plants such astrees are frequently exposed to diverse levels of soil watershortage throughout their life span, which affects their woodproductivity. In recent decades, forest decline in several for-est tree species has been mainly attributed to recurrentdroughts [25]. Trees probably maintain adaptive mechanismsto help them cope with repeated periods of adverse environ-mental conditions. Moreover, given the possible changes inthe climatic regime [26], these long-lived organisms will haveto face rapid modifications of their environment, includingmore frequent occurrence of drought episodes like the oneexperienced in Western Europe during 2003. The main-tenance of a sustained productivity during periods of watershortage will require the selection of genetic resourcespotentially adapted to these future climatic conditions.Efforts to genetically improve growth and productivity offorest trees under drought have, however, been hamperedbecause of the difficulty in defining precise criteria ofdrought adaptation. Interdisciplinary studies are now beingdeveloped to understand the physiological, genetic and mo-lecular mechanisms of drought-stress tolerance, and providereadily accessible criteria for the genetic improvement ofdrought tolerance [27, 28]. Although the physiologicaldrought-avoidance and drought-tolerant behaviours of many
important woody plants including poplar have been welldocumented [29–33], there is still little information on themolecular basis of drought-stress response in trees com-pared to annual plants (reviewed in [34, 35]). In this study, weused genomic tools to identify potential key molecular play-ers that may be very helpful in accelerating breeding andfacilitating the creation of tolerant varieties by either marker-assisted selection or genetic engineering. In particular, 2-DEfollowed by image analysis allowed the detection of severalup- and down-regulated proteins. Their function reveals themetabolic pathways that may be involved in the response ofpoplar to water deficit. Comparison with transcriptomic datafinally reveals the strength and limits of the proteomicapproach.
Finally, using these catalogued proteins as referencepoints in future studies and a common web-based applica-tion to store proteomic data [36], we hope that this report willprovide a useful template for other poplar proteomicresearchers, and enable future comparative analysis ofpoplar proteomics.
2 Materials and methods
2.1 Plant material
2.1.1 Tissue sampling for mapping the poplar
proteome (experiment 1)
For mapping the proteome, a series of tissues/organs (Table1) were collected from two 23-year-old trees grown at the for-estry station of INRA Orléans, i.e. a male (clone 101-74) and afemale (clone Fritzi Pauley) of P. trichocharpa, as well as2-month-old rooted cuttings of a P. trichocarpa6P. deltoideshybrid (clone Beaupré) raised in a greenhouse. Pictures ofthe sampled tissues are available at the Protic Populus data-base (http://cbi.labri.fr/outils/protic/PublicPopulus.php).
2.1.2 Experimental set-up to identify drought-stress
responsive transcripts and proteins
(experiment 2)
Cuttings of P. trichocarpa6deltoides cv Beaupré were plantedin root-observation boxes (6506300640 mm3) filled with apeat/sand mix (2:1 v/v) amended with (Ca, Mg)CO3 (2 g/L)in order to reduce substrate acidity and fertilized with a slow-release fertilizer (Nutricote 100, N/P/K 13:13:13 plus oligo-elements, 4 g/L substrate). Plants were grown in a green-house (minimum temperature was 167C/237C during night/day) for 2 months, being watered to field capacity two tothree times a day. Once the plants had at least 15 leaves, halfof the plants, randomly chosen, were drought stressed. Waterconsumption of controls and droughted plants was meas-ured daily by weighting the pots. While controls werereturned to their field capacity every day, stressed plants were
© 2006 WILEY-VCH Verlag GmbH & Co. KGaA, Weinheim www.proteomics-journal.com
Proteomics 2006, 6, 6509–6527 Plant Proteomics 6511
Table 1. List of tissues sampled to map the poplar proteomes and identify drought-stress responsive proteins, number of spots detectedand analysed by LC-MS/MS
Tissue/organ Study Samplingdate
Growingcondition
Age Clone Numberof spotdetected
Numberof spotsanalyseda)
DVB Mapping 20.01.2004 Field 23-year-old tree P. trichocarpa 101-74 650 461(1,1,0)RMB Mapping 20.02.2004 Field 23-year-old tree P. trichocarpa 101-74 1401 471(0,1,0)YFI Mapping 06.04.2004 Field 23-year-old tree P. trichocarpa Fritzi Pauley 990 381(10,0,0)YL (LPI = 1 1 2, just after
bud burst)Mapping 06.04.2004 Field 23-year-old tree P. trichocarpa 101-74 969 451(2,1,0)
Expanding leaf (LPI = 1 2 3) Drought stress 08.05.2001 Greenhouse 2-month-old cuttings P. trichocarpa6P.deltoides
1600 461(0,4,1)
CZ Mapping 08.06.2004 Field 23-year-old tree P. trichocarpa 101-74 567 471(0,1,0)DSX Mapping 08.06.2004 Field 23-year-old tree P. trichocarpa 101-74 645 461(2,0,0)
WRMapping 08.05.2001 Greenhouse 2-month-old cuttings P. trichocarpa6P.
deltoides1300 321(0,0,0)
Drought stress 08.05.2001 Greenhouse 2-month-old cuttings P. trichocarpa6P.deltoides
161(0,5,6)
a) Refers to the spot with at least two peptides obtained by LC-MS/MS. In parenthesis (no peak obtained in mass spectra, number of spotswith only one peptide, unknown function proteins).
given 50% of the control relative consumption. After 6 daysof increasing stress, the physiological state of two well-watered and two droughted cuttings was characterized.Expanded leaves (first and third from the top of shoot) andwhite roots (WRs) (including about 10% of actively growingtissue) were also harvested for transcriptome and proteomeanalysis. This sampling was done among a larger factorialexperiment, crossing stress duration by stress intensity withthe main objective to analyse the ecophysiological and mo-lecular response to mild water shortage.
2.2 Physiological measurement (experiment 2)
Soil water content was measured with a TDR probe (Trase,Soilmoisture Equipement, Goleta, CA, USA). Predawn andmid-day leaf water potentials were measured with a Scho-lander pressure chamber on mature leaves. Net assimilationrate (A) and stomatal conductance to water vapour (gs) wererecorded with a portable gas exchange chamber Licor 6200(Li-Cor, Lincoln, USA) on the third growing leaf from the topof the shoot. Internal CO2 concentration (ci) was calculated asci = ca 2 A/gs, with ca:CO2 concentration in the atmosphere.Root growth was measured by recording the length increaseof ten roots on the transparent film stacked to the transpar-ent wall of the observation boxes during the 24 h precedingthe harvest.
2.3 Protein extraction and quantification
Starting from 500 mg fresh tissue, total proteins wereextracted following the procedure described by Damerval etal. [37], with the following modifications indicated in Gion et
al. [19]. Three different extractions were completed for eachsample and pooled for protein quantification. The resultingmix was quantified over six replicated assays, using a mod-ified Bradford assay described by Ramagli and Rodriguez[38]. The mean concentration was then calculated and usedto load 300 mg of proteins on each IPG-strip.
2.4 2-D PAGE and gel staining
2-DE was used to analyse total proteins extracted from thesamples of experiments 1 and 2. For the IEF, 24 cm stripswith a linear pH gradient ranging from 4 to 7 were used inthe IPGphor system (Amersham Biosciences, Uppsala,Sweden). We used the protocol described in Gion et al. [19]for 2-DE and gel staining. To ensure gel reproducibility inexperiment 2, two to four replicates were performed for eachof the four samples, namely expanding leaf (EL) (L) and WR(R) from well-watered (W) and droughted (D) cuttings; fur-ther referred as WL, WR, DL and DR samples.
2.5 Image acquisition, spot detection and statistical
analysis
Stained gels were digitalized and analysed as described inGion et al. [19]. As for experiment 1, gel images correspond-ing to a given tissue were placed in different folders and an-alysed independently. As for experiment 2, gel images wereplaced in two distinct folders corresponding to WR and EL,respectively. Replicated gels were matched within a folder inorder to attribute a common spot identity for the same spotsderived from different images. For this, we used the auto-matically matching options of IM2D. After visual checking of
© 2006 WILEY-VCH Verlag GmbH & Co. KGaA, Weinheim www.proteomics-journal.com

6512 C. Plomion et al. Proteomics 2006, 6, 6509–6527
the matching options, the IM2D software was used to con-struct a master gel for each tissue. For each sample, when aprotein was detected in all of the replicates, this protein wasautomatically added to the master gel, thus creating a refer-ence map for both tissues. Normalized volumes were finallyobtained using the total spot volume normalization procedureof IM2D. Simple t-tests were performed for each pairwisecomparison, namely WL versus DL, WR versus DR, to detectthose proteins showing significant (p-value,0.001) drought-stress effect.
2.6 Characterization by MS
2.6.1 In-gel protein digestion
CBB-stained protein spots were manually excised from thegels and washed in H2O/MeOH/acetic acid (47.5:47.5:5)until destaining. The solvent mixture was removed andreplaced by ACN. After shrinking of the gel pieces, ACN wasremoved and gel pieces were dried in a vacuum centrifuge.Gel pieces were rehydrated in 8 ng/mL trypsin (Sigma-Aldrich, St. Louis, MO, USA) in 50 mM NH4HCO3 andincubated overnight at 377C. The supernatant was removedand the gel pieces were incubated for 15 min in 50mMNH4HCO3 at room temperature under rotary shaking. Thissecond supernatant was pooled with the previous one, and aH2O/ACN/HCOOH (47.5:47.5:5) solution was added ontothe gel pieces for 15 min. This step was repeated again twice.Supernatants were pooled and concentrated in a vacuumcentrifuge to a final volume of 25 mL. Digests were finallyacidified by the addition of 1.2 mL of acetic acid (5% v/v) andstored at 2207C.
2.6.2 MALDI-TOF-MS and data analysis
MALDI-TOF mass spectra were acquired on a Bruker ReflexIII (Bruker Daltonics, Bremen, Germany) mass spectrome-ter equipped with a nitrogen laser with an emission wave-length of 337 nm. Positive ion spectra were obtained byaccumulating an average of 200 shots in the reflectron mode.External calibration was achieved with a mixture of eightpeptides covering a 900–3500 Da mass range. After analysis,data mining was performed using MASCOT through Bio-tools software (Bruker) against the Populus genome database(http://genome.jgi-psf.org/Poptr1/Poptr1.home.html) con-sisting of the first draft of the Populus genome assembly. Thisdatabase was derived from the assembly of a collection ofsequences clustered into 6800 contigs and 59 200 singletons.These nucleic sequences were translated in all six readingframes using the transeq program available in the sequenceanalysis package EMBOSS [39], resulting in six proteinsequences. Each protein sequence, when obtained from acontig, can bring together several proteins fused by artifi-cially translated intergenic regions. Therefore, in order toextract potential protein sequences, those protein sequenceswere divided using potential STARTs and STOPs. Positive
matches presenting a MOWSE score greater than 71 wereconsidered as significant, and were subsequently blastedagainst the Swiss-Prot database (http://www.expasy.ch/sprot). A Perl script was developed for automatic analysis,results extraction and web pages production. This programsubmits PMF in batch mode for database comparison. Webpages produced for each spot are available at http://cbi.labri.fr/outils/protic/PublicPopulus.php. They contain a link tothe original BLAST results and the annotation of the besthomologue is proposed as well as a link to the Swiss-Protentry of the protein at Expasy web site. The number of pep-tides allowing the identification and a graphical representa-tion of the sequence coverage are also integrated in the webpages.
2.6.3 Nanospray LC-MS/MS and data analysis
Peptide mixtures were analysed by on-line capillary chroma-tography (LC Packings, Amsterdam, The Netherlands) cou-pled to a nanospray LCQ IT mass spectrometer (Thermo-Finnigan, San Jose, CA, USA). Peptides were separated on a75 mm id615-cm C18 PepMap column (LC Packings). Theflow rate was set at 200 nL/min. Peptides were eluted using a5–65% linear gradient of solvent B in 30 min (solvent A was0.1% formic acid in 2% ACN, and solvent B was 0.1% formicacid in 80% ACN). The mass spectrometer was operated inpositive ion mode at a 2 kV needle voltage and a 38 V capil-lary voltage. Data acquisition was performed in a data-de-pendent mode consisting of, alternatively in a single run, afull scan MS over the range m/z 300–2000 and three full scanMS/MS of the three most intense ions in the precedent MSspectra. MS/MS data were acquired using a 2 m/z units ionisolation window, a 35% relative collision energy, and a5 min dynamic exclusion duration. Peptides were identifiedusing SEQUEST (ThermoFinnigan, Torrence, CA) and adatabase consisting of about 260 000 Populus ESTs availableat dbEST (http://www.ncbi.nlm.nih.gov/dbEST) on March2005. ESTs were translated in all six reading frames using thetranseq program of the sequence analysis package EMBOSS.Positive matches were then blasted against the Swiss-Protdatabase. As described previously for MALDI-TOF-MS data,peptide sequence tags and BLAST results were automaticallygenerated and are available at http://cbi.labri.fr/outils/pro-tic/PublicPopulus.php.
2.7 Generation and analysis of cDNA arrays
Total RNA extraction was performed using the RNeasy PlantMini kit (Qiagen, Courtaboeuf, France) as described by Koh-ler et al. [40]. DNase I (Qiagen) treatment was included in theextraction procedure according to the manufacturer’sinstructions. The transcript populations of leaves and rootswere separately amplified, labelled and hybridized to NCmicroarrays as described before [41, 42]. The cDNA arrayscontained 4608 ESTs, including 4470 ESTs from adventitiousroots and leaves of P. trichocarpa6P. deltoides cv Beaupré
© 2006 WILEY-VCH Verlag GmbH & Co. KGaA, Weinheim www.proteomics-journal.com
Proteomics 2006, 6, 6509–6527 Plant Proteomics 6513
[41]. These 4470 EST sequences were blasted against thepoplar genome sequence (http://genome.jgi-psf.org/Poptr1/Poptr1.home.html) and corresponded to 2541 unique genemodels. Analysis of the cDNA arrays was performed asdescribed before [40]. Signal intensities lower than two-foldthat of the background were eliminated and central normal-ization was performed on the remaining data. A baysian sta-tistical method (CyberT, http://visitor.ics.uci.edu/genex/cybert/index.shtml) [43], based on the t-test, was used to testfor statistically significant differences in gene expression.Transcripts with more than three-fold changes in signalintensity between control and drought-stressed plants andwith a PPDE (posterior probability of differential expression)value higher than 0.9 were considered as significantly regu-lated.
3 Results
3.1 2-DE reference maps of poplar tissues
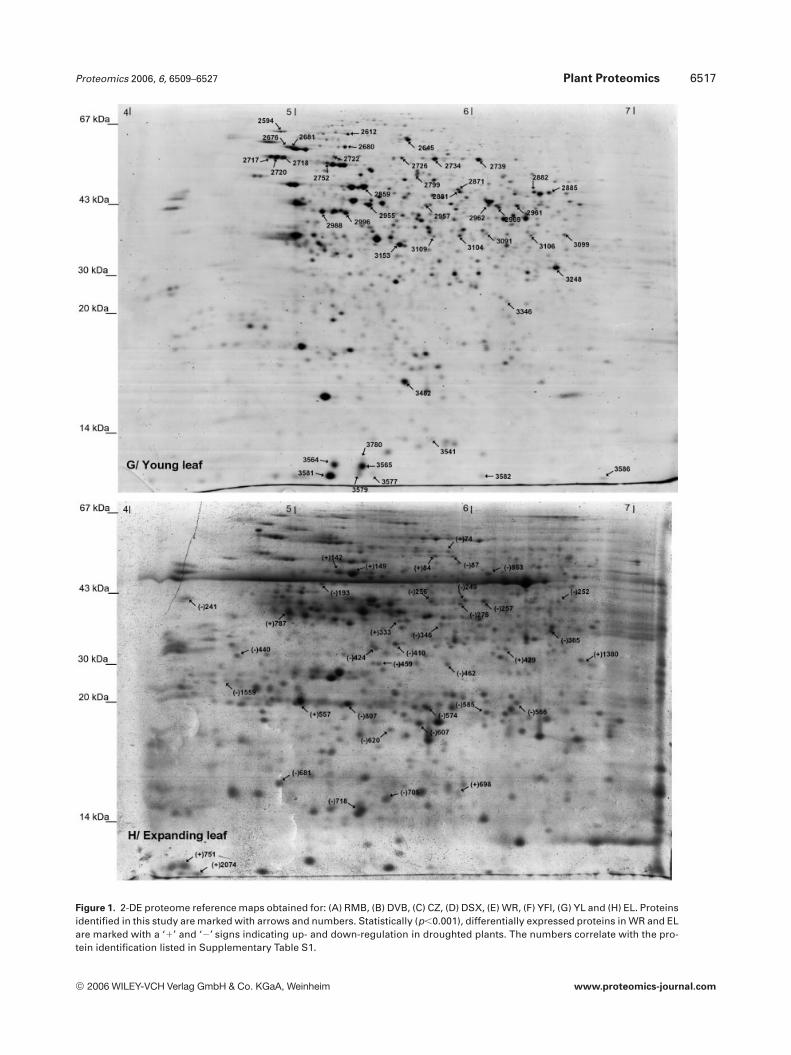
The 2-DE reference maps were established using proteinsextracted from 8 tissues/organs of Populus sp. (Fig. 1, Table1), namely: dormant vegetative bud (DVB), reproductivemale bud (RMB), young female inflorescence (YFI), youngleaf (YL), EL, cambial zone (CZ), developing secondary xylem(DSX) and WR. In the 4–7 pH gradient, the number of spotsdetected range from 567 in CZ to 1600 in EL. Expanding thepH gradient to 3–10 range did not improve significantly thenumber of spots detected.
3.2 Database query strategies and success rates of
protein identification
A total of 48 spots were selected for each tissue, except forWR [59] and EL [51], resulting in 398 spots excised from the2-D gels. Spots were randomly chosen, except for WR and ELfor which most were selected based on their behaviour indrought-stressed plants (i.e. up- or down-regulated). Peptidesequence tags were obtained for the whole dataset using LC-MS/MS and comparisons with Populus ESTs. Fifteen failed toshow any peak in the mass spectra, 13 were identified basedon only one peptide and were further discarded from theanalysis and seven did not match with any translated EST.Interestingly, these seven spots corresponded to drought-stress responsive proteins. The 363 spots for which at leasttwo peptides allowed an identification are listed in Supple-mentary Tables S1 and S2, and indicated by numbers on the2-DE reference maps (Fig. 1).
MALDI-TOF-MS profiles were also generated for 320spots in order to assess the resolution of protein detectionbased on PMFs, and compare the identification rate to thatobtained by LC-MS/MS. High quality spectra were obtainedfor 163 spots (50.9%) and showed a sequence similarity withtranslation products from the Populus genome sequencedigested in silico with trypsin. Half (83 spots) positively
matched with an accession in the Populus genome database,from which 58% returned an identification similar to thatobtained by MS/MS. The 42% remaining spots showedeither different functions (20.5%) or matched with unknownfunction genes of the Populus genome (21.5%) (Table 2).
3.3 Functional classification
Taking into account the different sources of multiplicity ofspots (see Section 4), we were able to identify a total of 163different proteins of known function. The proteins identifiedin the eight tissues by LC-MS/MS were classified using thedbget system (http://www.genome.jp/dbget/) into 17groups. The functional categories represented in this Poplarproteome project are summarized in Supplementary Fig. S1.Classification was based on their predominant function. Thegreatest percentage of the identified proteins fell into thecarbohydrate metabolism (19%), with the next largest in theunclassified (14%), defence (13%) and energy (11%) cate-gories. The remainder of the identified proteins were dis-tributed among genetic information processing (8%), cyto-skeleton (6%), amino acid metabolism (6%), other metabo-lisms (6%), lignin biosynthesis (3%), nucleotide metabolism,biosynthesis of secondary metabolites, cellular organization(2% each), cellular process, environmental information pro-cessing, lipid metabolism and metabolism of cofactor andvitamins (1% each). Since 2-DE only reveals the most abun-dant proteins, this result suggests that the tissues were sam-pled from trees grown under optimal conditions, producingproteins required for primary and secondary growth. Inter-estingly, 4.7% of the spots corresponded to proteins forwhich no function has yet been characterized (referred asunknown function proteins in Supplementary Tables S1 andS2). The fact that these proteins are rather abundant sug-gests that they could serve as unidentified ‘housekeeping’functions unique to trees. Of course, this hypothesis remainsto be proved.
3.4 Proteins expression in the different tissues/
organs of the plant
Supplementary Fig. S1 summarizes the functional cate-gories of the proteins detected in each tissue. Below we dis-cuss only the main features of this distribution.
3.4.1 Leaf
Photosynthetic enzymes (plastocyanin A, chlorophyll A/B-binding protein, RuBisCO subunit-binding protein betasubunit) were abundantly expressed as expected for a greentissue. The Energy category also contained many subunits ofATP synthase. The Carbohydrate metabolism category com-prised 14 proteins, 7 being involved in glycolysis and/or glu-coneogenesis (2,3-bisphosphoglycerate-independent phos-phoglycerate mutase, enolase, alpha-1,4-glucan-protein syn-thase, triosephosphate isomerase and pyruvate kinase). In
© 2006 WILEY-VCH Verlag GmbH & Co. KGaA, Weinheim www.proteomics-journal.com
6514 C. Plomion et al. Proteomics 2006, 6, 6509–6527
Figure 1.
© 2006 WILEY-VCH Verlag GmbH & Co. KGaA, Weinheim www.proteomics-journal.com

Proteomics 2006, 6, 6509–6527 Plant Proteomics 6515
© 2006 WILEY-VCH Verlag GmbH & Co. KGaA, Weinheim www.proteomics-journal.com

6516 C. Plomion et al. Proteomics 2006, 6, 6509–6527
© 2006 WILEY-VCH Verlag GmbH & Co. KGaA, Weinheim www.proteomics-journal.com
Proteomics 2006, 6, 6509–6527 Plant Proteomics 6517
Figure 1. 2-DE proteome reference maps obtained for: (A) RMB, (B) DVB, (C) CZ, (D) DSX, (E) WR, (F) YFI, (G) YL and (H) EL. Proteinsidentified in this study are marked with arrows and numbers. Statistically (p,0.001), differentially expressed proteins in WR and ELare marked with a ‘1’ and ‘2’ signs indicating up- and down-regulation in droughted plants. The numbers correlate with the pro-tein identification listed in Supplementary Table S1.
© 2006 WILEY-VCH Verlag GmbH & Co. KGaA, Weinheim www.proteomics-journal.com
6518 C. Plomion et al. Proteomics 2006, 6, 6509–6527
Table 2. Number of spots assigned to a function either by LC-MS/MS or MADI-TOF-MS and comparison between bothmethods
Tissue MS/MSa) MALDIb) MALDI =MS/MSc)
MALDI ?MS/MSd)
DVB 46 (5) 21 16 3 1 2RMB 47 (6) 12 5 3 1 4YFI 38 (4) 5 2 2 1 1YL 45 (2) 5 3 1 1 1Expanding leaf 46 (8) 0 0 0 1 0CZ 47 (3) 17 13 3 1 1DSX 46 (3) 10 6 1 1 3WR 48 (3) 13 3 4 1 6Total 363 (34) 83 48 (58%) 17 1 18 (42%)
a) Number of spots identified by LC-MS/MS with at least twopeptides. Number of spots containing multiple proteins areindicated in parenthesis.
b) Number of spots identified by MALDI-TOF-MS (MOWSE score.71).
c) Number of spots with identical assignment between bothmethods.
d) Number of spots with different assignments between bothmethods. First and second digits indicate the number of spotswith different or unknown proteins, respectively.
higher plants, glycolysis is a central pathway for energy pro-duction. Other proteins of this category were involved in eithercarbon fixation (malate dehydrogenase and transketolase) orsugar metabolism (UDP-glucose 4-epimerase, UTP-glucose-1-phosphate uridylyltransferase and glucan endo-1,3-beta-glucosidase). Given the nature of the sampled leaves, just afterbud burst of young leaves and on the expansion phase ofexpanding leaves, the expression of these proteins reveals animportant activity of photosynthetic tissues. Many of theabove-mentioned proteins (but for photosynthesis) were alsoobserved in the other tissues, indicating that the samples weretaken during the growing phase of the plants, even in the caseof apparently dormant buds. The Genetic information proces-sing category was represented by 12 proteins including pepti-dases, elongation factors and ribosomal proteins, these latterbeing only identified in leaves. Additional proteins exclusivelydetected in leaf tissues included a glutamate-1-semialdehyde2,1-aminomutase and a delta-aminolevulinic acid dehy-dratase, two enzymes involved in chlorophyll biosynthesis.Finally, the Amino acid metabolism category was representedby seven proteins, including 3 S-adenosyl-L-methionine syn-thetases (SAMs). SAMs serves as universal methyl groupdonor in numerous transmethylation reactions. It is also thesubstrate for many reactions such as vitamins, polyamine,gaseous phytohormone, lignin and nucleotide biosynthesis.
3.4.2 YFI
The main feature of this tissue was an over-representation ofanther-specific proline-rich proteins (PRPs; six spots), bark
storage proteins (BSP precursors A and B, six spots) and21 kDa seed proteins (three spots). Anther-specific proteinsbelong to the proline-PRP family. PRPs were first identifiedas proteins that accumulate in cell walls in response to stress(i.e. physical damage) and have subsequently been shown tobe temporally regulated during plant development (reviewedin [44]). Moreover, studies using protein localization sug-gested that PRPs may function both in controlling cell typespecific wall structure during plant development, and con-tributing to defence against physical damage and pathogeninfection. These six spots presented similar Mr (33.5–36 kDa) but highly variable pI (4.95–6.70), suggesting post-translational processing of the protein or the products of amultigene family.
BSPs have been shown to be involved in seasonal nitro-gen cycling in Populus (reviewed in [45, 46]). In this species,accumulation of BSPs and their mRNAs is associated withshort day and may also be related to nitrogen availability,whereas degradation of poplar BSPs and nitrogen remobili-zation appears to be related to sink demand from active budgrowth [47]. BSPs precursor A protein was found at differentpositions of the gel. Spots 3525 and 3560 presented identicalpI (5.78) and slightly different masses 24 278 and 22 705 Da,suggesting that these two proteins could correspond to allelicproducts of the same gene rather than different products of agene family, as reported by de Vienne et al. [48]. BSPs canalso be highly glycosylated [45] and this property likelyexplains the position of spot 2901 with completely different2-DE gel coordinates (6.86/50583).
3.4.3 RMB
This proteome contained proteins from almost every cate-gory, the major proportion consisting of carbohydrate me-tabolism (14 spots) from which seven were involved in gly-colysis and/or gluconeogenesis and three corresponded toL-ascorbate peroxidase, an enzyme that was only detected inthe female reproductive tissue. Interestingly enough was thepresence of three enzymes from the secondary metabolism(dihydroflavonol-4-reductase, naringenin, 2-oxoglutarate3-dioxygenase and chalcone-flavonone isomerase) and manyproteins of the defence category, including a [Cu–Zn] super-oxide dismutase (SOD). Watson et al. [10] reported similarresults in flowers of Medicago truncatula and hypothesizedthat altogether these proteins may play a role in cell protec-tion against oxidative stress induced by UVs and/or otherabiotic and biotic stresses.
3.4.4 DSX and CZ
The relative contribution of the different functional categorieswas quite similar between both tissues. This is probably due tothe difficulty to isolate the vascular cambium from differ-entiating secondary xylem. The carbohydrate metabolismcategory was quite abundant and represented by enzymesessentially involved in pentose and glucuronate interconver-
© 2006 WILEY-VCH Verlag GmbH & Co. KGaA, Weinheim www.proteomics-journal.com

Proteomics 2006, 6, 6509–6527 Plant Proteomics 6519
sions, as well as glycolysis/gluconeogenesis. For instance,UTP-glucose-1-phosphate uridyltransferase and UDP-glucose6-dehydrogenase were found in both tissues. These enzymesare involved in the production of glycosil units used for thesynthesis of cell wall polysaccharides [49]. Fructokinase foundin the CZ is involved in the reversible reaction, convertingfructose 6-P into fructose. In cotton fibres, it has been shownthat a larger flux to cellulose can be achieved by recyclingfructose to sucrose [50] and that fructokinase is among thethree enzymes involved in this mechanism. The cytoskeletoncategory comprised 12 spots corresponding to only two pro-teins: namely tubulin (alpha and beta chains) and actin. Theseproteins were also found to be highly expressed in poplar woodforming tissue at transcriptome [51] and proteome [19] levels.Chaffey [52] reported that cortical microtubules could controlthe cell wall pattern by defining the position and orientation ofcellulose microfibrils during the differentiation of tracheidelements. Lignin biosynthesis was represented by several pro-teins of the phenyl propanoid pathway such as Caffeic acid3-O-methyltransferase, Caffeoyl-CoA O-methyltransferase, aswell as enzymes involved in lignin polymerization (SOD andperoxidases [53]). In vascular tissue, lignin is the second mostimportant compound of the cell wall after cellulose. As report-ed by Watson et al. [10] in Medicago, adenosine kinases werealso quite abundant in poplar stem tissues.
3.4.5 DVB
Carbohydrate metabolism, energy and genetic informationprocessing were among the most important functional cate-gories found in DVBs, showing that this apparently dor-mant/quiescent structure was indeed very active. In a recentstudy carried out at the transcriptome level, Derory et al. [54]also identified the energy category as a major component ofthe onset of bud burst in oak. They also detected a number ofgenes involved in defence processes like we did here. Forexample, transcripts for pathogenesis-related (PR) proteins,HSPs and LEA were found to be up-regulated during theonset of bud burst. In the present report, buds displayed thehighest proportion of defence-related proteins as comparedto the other tissues: 12 spots identified as HSP70 and80 kDa, chaperonin HSP60, SOD, PR proteins, minor aller-gen proteins and dehydrin. The amino acid metabolismcategory was represented by three proteins: phospholipidhydroperoxide glutathione peroxidase, S-adenosyl-L-homo-cysteine hydrolase and GST. GSTs are involved in glutha-tione metabolism. In plants, free radicals can be removedthrough a series of oxidation/reduction in which ascorbateand glutathione are playing a major role. In apple tree, a de-crease of free radicals in the cell induced bud break [55].
3.4.6 WR
Very little is known about the genes controlling root devel-opment and functions in trees. As the root system is com-mitted to nutrient acquisition and assimilation and interac-
tions with rhizospheric microbes, regulation of gene expres-sion in these tissues is of special interest. However, very littleis known about the genes controlling root development andfunctioning in trees. At the proteome level, more than half(seven spots) of the proteins of the Unclassified categorywere represented by isoforms of major latex proteins (MLPs).MLPs are low-molecular-weight polypeptides that were firstisolated from the latex of Opium poppy [56], but were alsofound in a wide range of plant tissues [57]. The exact role ofthese very abundant proteins in poplar roots is not knownyet. MLPs show significant similarity to PR proteins, whichare known to be overexpressed in the presence of pathogensor stress (reviewed in [58]). At the transcript level, several PRproteins were found to be highly expressed in developingadventitious roots (Kohler and Martin, unpublished results).
3.5 Poplar proteome database
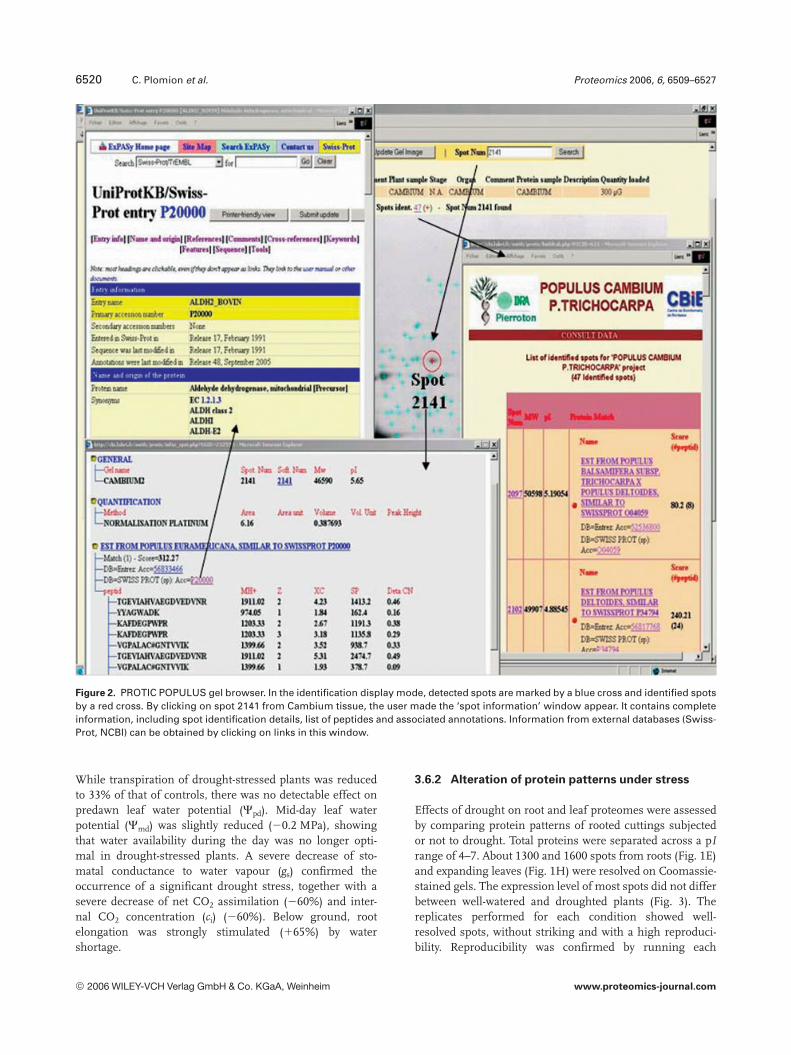
As a starting point for sharing proteomic data in poplar, theproteomes presented in this report were stored within theweb-based application ‘PROTICdb’ [36]. It is the aim ofPROTIC Populus to provide to the poplar proteomics com-munity: (i) a minimum standard for 2-D PAGE-MS repre-sentation to facilitate data comparison, exchange and ver-ification, (ii) a public repository centre for MS data where themany levels of MS data are stored and made available for datamining (raw data, peak lists, peptide identification and pro-tein identification). Such repository also includes thedescription of the experiments to allow users to observe con-comitant changes across studies, and (iii) direct links fromeach annotated protein to other types of biological informa-tion (NCBI, Swiss-Prot). The data presented here (from plantinformation to peptide sequences) can be viewed in moredetails at http://cbi.labri.fr/outils/protic/PublicPopulus.php.A graphical gel browser (Fig. 2) allows the user to accessfrom basic (spot ID, pI and Mr: by moving the mouse overthe spot) to detailed (MS report: by clicking on the spot)information. Any spot can be searched by keywords or spotID. If adapted by the poplar proteomics community thePROTIC standard could enable future comparative analysis.
3.6 Physiological and molecular responses to
drought
3.6.1 Physiological characterization of
drought-stress response
Physiological measurements were performed on two well-watered and two drought-stressed rooted cuttings in order tocharacterize the physiological status of hybrid poplars duringthe course of drought (Table 3). Although the number ofreplicates was limited, water potential, growth and gas-exchange data were in accordance with previously observedresponses of poplar to water deficit [33, 59, Bogeat-Triboulot,M. B., Brosche, M., Renaut, J., Jouve, L. et al., submitted].
© 2006 WILEY-VCH Verlag GmbH & Co. KGaA, Weinheim www.proteomics-journal.com
6520 C. Plomion et al. Proteomics 2006, 6, 6509–6527
Figure 2. PROTIC POPULUS gel browser. In the identification display mode, detected spots are marked by a blue cross and identified spotsby a red cross. By clicking on spot 2141 from Cambium tissue, the user made the ‘spot information’ window appear. It contains completeinformation, including spot identification details, list of peptides and associated annotations. Information from external databases (Swiss-Prot, NCBI) can be obtained by clicking on links in this window.
While transpiration of drought-stressed plants was reducedto 33% of that of controls, there was no detectable effect onpredawn leaf water potential (Cpd). Mid-day leaf waterpotential (Cmd) was slightly reduced (20.2 MPa), showingthat water availability during the day was no longer opti-mal in drought-stressed plants. A severe decrease of sto-matal conductance to water vapour (gs) confirmed theoccurrence of a significant drought stress, together with asevere decrease of net CO2 assimilation (260%) and inter-nal CO2 concentration (ci) (260%). Below ground, rootelongation was strongly stimulated (165%) by watershortage.
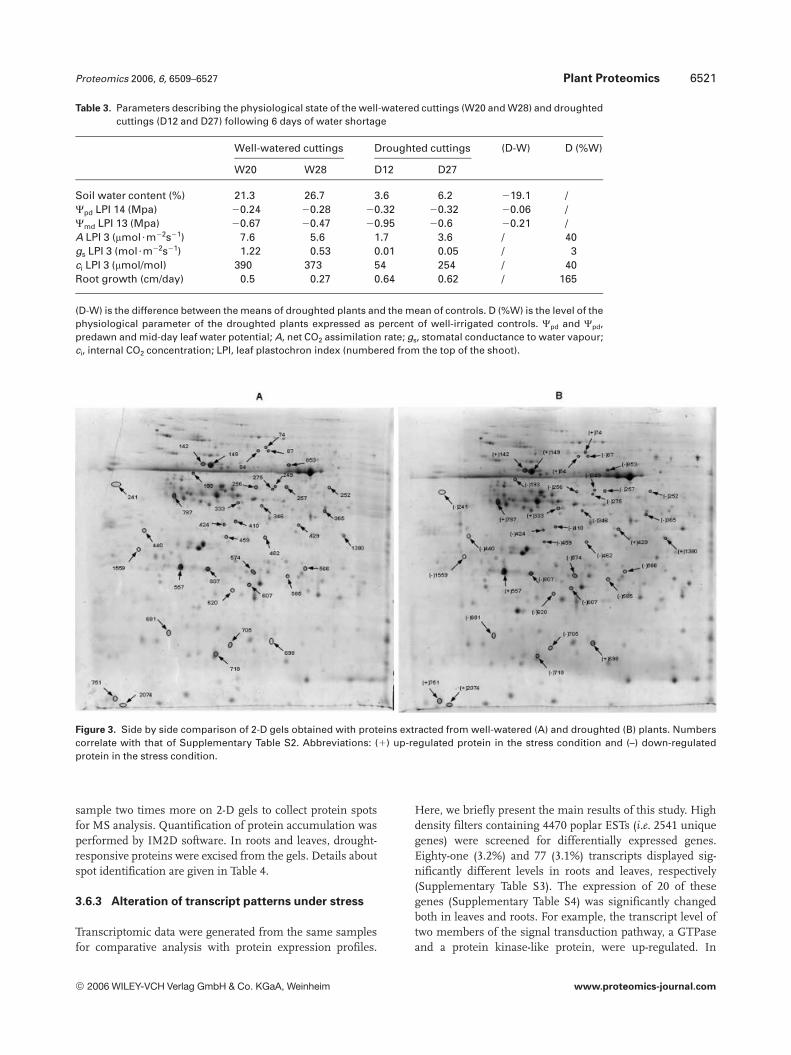
3.6.2 Alteration of protein patterns under stress
Effects of drought on root and leaf proteomes were assessedby comparing protein patterns of rooted cuttings subjectedor not to drought. Total proteins were separated across a pIrange of 4–7. About 1300 and 1600 spots from roots (Fig. 1E)and expanding leaves (Fig. 1H) were resolved on Coomassie-stained gels. The expression level of most spots did not differbetween well-watered and droughted plants (Fig. 3). Thereplicates performed for each condition showed well-resolved spots, without striking and with a high reproduci-bility. Reproducibility was confirmed by running each
© 2006 WILEY-VCH Verlag GmbH & Co. KGaA, Weinheim www.proteomics-journal.com
Proteomics 2006, 6, 6509–6527 Plant Proteomics 6521
Table 3. Parameters describing the physiological state of the well-watered cuttings (W20 and W28) and droughtedcuttings (D12 and D27) following 6 days of water shortage
Well-watered cuttings Droughted cuttings (D-W) D (%W)
W20 W28 D12 D27
Soil water content (%) 21.3 26.7 3.6 6.2 219.1 /Cpd LPI 14 (Mpa) 20.24 20.28 20.32 20.32 20.06 /Cmd LPI 13 (Mpa) 20.67 20.47 20.95 20.6 20.21 /A LPI 3 (mmol?m22s21) 7.6 5.6 1.7 3.6 / 40gs LPI 3 (mol?m22s21) 1.22 0.53 0.01 0.05 / 3ci LPI 3 (mmol/mol) 390 373 54 254 / 40Root growth (cm/day) 0.5 0.27 0.64 0.62 / 165
(D-W) is the difference between the means of droughted plants and the mean of controls. D (%W) is the level of thephysiological parameter of the droughted plants expressed as percent of well-irrigated controls. Cpd and Cpd,predawn and mid-day leaf water potential; A, net CO2 assimilation rate; gs, stomatal conductance to water vapour;ci, internal CO2 concentration; LPI, leaf plastochron index (numbered from the top of the shoot).
Figure 3. Side by side comparison of 2-D gels obtained with proteins extracted from well-watered (A) and droughted (B) plants. Numberscorrelate with that of Supplementary Table S2. Abbreviations: (1) up-regulated protein in the stress condition and (–) down-regulatedprotein in the stress condition.
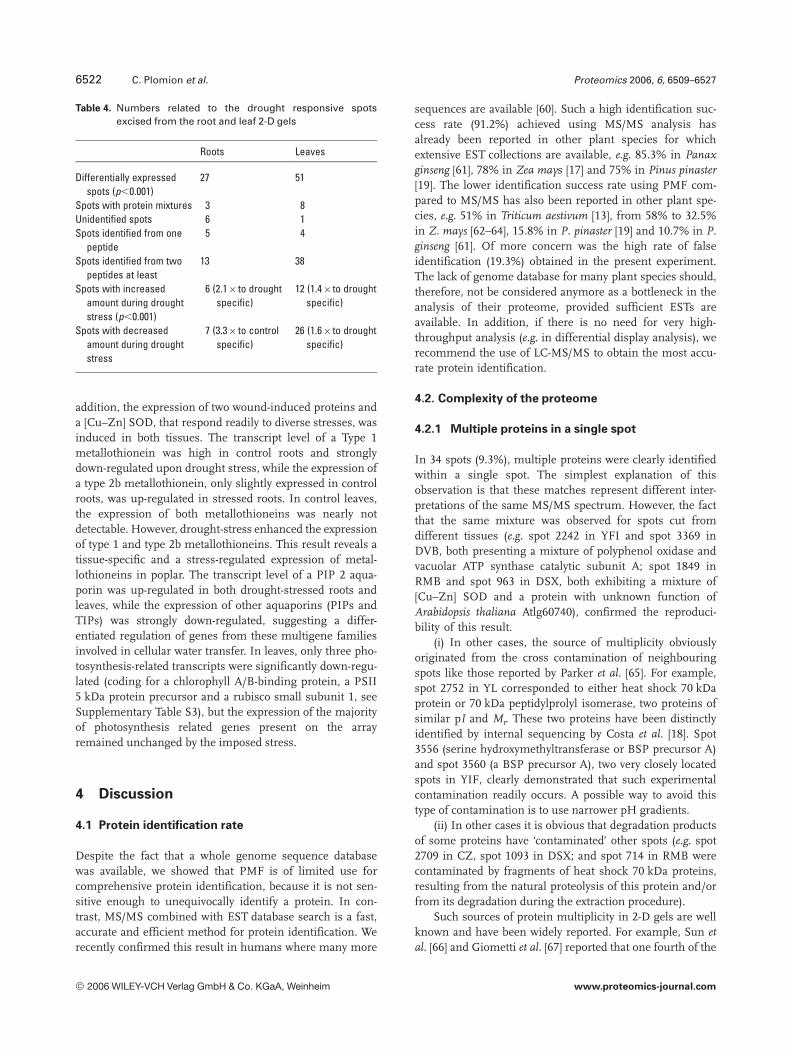
sample two times more on 2-D gels to collect protein spotsfor MS analysis. Quantification of protein accumulation wasperformed by IM2D software. In roots and leaves, drought-responsive proteins were excised from the gels. Details aboutspot identification are given in Table 4.
3.6.3 Alteration of transcript patterns under stress
Transcriptomic data were generated from the same samplesfor comparative analysis with protein expression profiles.
Here, we briefly present the main results of this study. Highdensity filters containing 4470 poplar ESTs (i.e. 2541 uniquegenes) were screened for differentially expressed genes.Eighty-one (3.2%) and 77 (3.1%) transcripts displayed sig-nificantly different levels in roots and leaves, respectively(Supplementary Table S3). The expression of 20 of thesegenes (Supplementary Table S4) was significantly changedboth in leaves and roots. For example, the transcript level oftwo members of the signal transduction pathway, a GTPaseand a protein kinase-like protein, were up-regulated. In
© 2006 WILEY-VCH Verlag GmbH & Co. KGaA, Weinheim www.proteomics-journal.com
6522 C. Plomion et al. Proteomics 2006, 6, 6509–6527
Table 4. Numbers related to the drought responsive spotsexcised from the root and leaf 2-D gels
Roots Leaves
Differentially expressedspots (p,0.001)
27 51
Spots with protein mixtures 3 8Unidentified spots 6 1Spots identified from one
peptide5 4
Spots identified from twopeptides at least
13 38
Spots with increasedamount during droughtstress (p,0.001)
6 (2.16to droughtspecific)
12 (1.46to droughtspecific)
Spots with decreasedamount during droughtstress
7 (3.36to controlspecific)
26 (1.66to droughtspecific)
addition, the expression of two wound-induced proteins anda [Cu–Zn] SOD, that respond readily to diverse stresses, wasinduced in both tissues. The transcript level of a Type 1metallothionein was high in control roots and stronglydown-regulated upon drought stress, while the expression ofa type 2b metallothionein, only slightly expressed in controlroots, was up-regulated in stressed roots. In control leaves,the expression of both metallothioneins was nearly notdetectable. However, drought-stress enhanced the expressionof type 1 and type 2b metallothioneins. This result reveals atissue-specific and a stress-regulated expression of metal-lothioneins in poplar. The transcript level of a PIP 2 aqua-porin was up-regulated in both drought-stressed roots andleaves, while the expression of other aquaporins (PIPs andTIPs) was strongly down-regulated, suggesting a differ-entiated regulation of genes from these multigene familiesinvolved in cellular water transfer. In leaves, only three pho-tosynthesis-related transcripts were significantly down-regu-lated (coding for a chlorophyll A/B-binding protein, a PSII5 kDa protein precursor and a rubisco small subunit 1, seeSupplementary Table S3), but the expression of the majorityof photosynthesis related genes present on the arrayremained unchanged by the imposed stress.
4 Discussion
4.1 Protein identification rate
Despite the fact that a whole genome sequence databasewas available, we showed that PMF is of limited use forcomprehensive protein identification, because it is not sen-sitive enough to unequivocally identify a protein. In con-trast, MS/MS combined with EST database search is a fast,accurate and efficient method for protein identification. Werecently confirmed this result in humans where many more
sequences are available [60]. Such a high identification suc-cess rate (91.2%) achieved using MS/MS analysis hasalready been reported in other plant species for whichextensive EST collections are available, e.g. 85.3% in Panaxginseng [61], 78% in Zea mays [17] and 75% in Pinus pinaster[19]. The lower identification success rate using PMF com-pared to MS/MS has also been reported in other plant spe-cies, e.g. 51% in Triticum aestivum [13], from 58% to 32.5%in Z. mays [62–64], 15.8% in P. pinaster [19] and 10.7% in P.ginseng [61]. Of more concern was the high rate of falseidentification (19.3%) obtained in the present experiment.The lack of genome database for many plant species should,therefore, not be considered anymore as a bottleneck in theanalysis of their proteome, provided sufficient ESTs areavailable. In addition, if there is no need for very high-throughput analysis (e.g. in differential display analysis), werecommend the use of LC-MS/MS to obtain the most accu-rate protein identification.
4.2. Complexity of the proteome
4.2.1 Multiple proteins in a single spot
In 34 spots (9.3%), multiple proteins were clearly identifiedwithin a single spot. The simplest explanation of thisobservation is that these matches represent different inter-pretations of the same MS/MS spectrum. However, the factthat the same mixture was observed for spots cut fromdifferent tissues (e.g. spot 2242 in YFI and spot 3369 inDVB, both presenting a mixture of polyphenol oxidase andvacuolar ATP synthase catalytic subunit A; spot 1849 inRMB and spot 963 in DSX, both exhibiting a mixture of[Cu–Zn] SOD and a protein with unknown function ofArabidopsis thaliana Atlg60740), confirmed the reproduci-bility of this result.
(i) In other cases, the source of multiplicity obviouslyoriginated from the cross contamination of neighbouringspots like those reported by Parker et al. [65]. For example,spot 2752 in YL corresponded to either heat shock 70 kDaprotein or 70 kDa peptidylprolyl isomerase, two proteins ofsimilar pI and Mr. These two proteins have been distinctlyidentified by internal sequencing by Costa et al. [18]. Spot3556 (serine hydroxymethyltransferase or BSP precursor A)and spot 3560 (a BSP precursor A), two very closely locatedspots in YIF, clearly demonstrated that such experimentalcontamination readily occurs. A possible way to avoid thistype of contamination is to use narrower pH gradients.
(ii) In other cases it is obvious that degradation productsof some proteins have ‘contaminated’ other spots (e.g. spot2709 in CZ, spot 1093 in DSX; and spot 714 in RMB werecontaminated by fragments of heat shock 70 kDa proteins,resulting from the natural proteolysis of this protein and/orfrom its degradation during the extraction procedure).
Such sources of protein multiplicity in 2-D gels are wellknown and have been widely reported. For example, Sun etal. [66] and Giometti et al. [67] reported that one fourth of the
© 2006 WILEY-VCH Verlag GmbH & Co. KGaA, Weinheim www.proteomics-journal.com
Proteomics 2006, 6, 6509–6527 Plant Proteomics 6523
spots analysed could not be identified precisely due to thepresence of several different proteins in a single spot. In arecent study in maize, 12.1% of the spots were found tomatch with 2–4 proteins [17]. Since the most widely used pHrange for IEF for 2-DE is 4–7, it is likely that more than 20%of the spots analysed will contain multiple proteins [68].Rather than a problem, the possibility to detect multipleproteins within a single spot using LC-MS/MS provides amajor information that needs to be taken into account whenreporting on differentially expressed spots. This will even-tually avoid false biological interpretations.
4.2.2 Occurrence of a protein in multiple
locations
It has been frequently reported that many proteins areresolved into multiple spots on 2-D gels (e.g. [19, 63, 64, 69]).Many of the phenomena listed below are responsible for thediscrepancy observed between experimentally determinedand database determined pI and Mr, but at this stage it is stilldifficult to predict its exact nature. Variation in either pI orMr could stem from: (i) Allelic product translated from thesame gene, or post-translationally modified forms (e.g. phos-phorylation, methylation and glycosylation) of the same pro-tein. Spots presenting minor (transketolase in DVB, spots3323 and 3324; caffeic acid 3-O-methyltransferase 1 in CZ:spots 2360 and 2361), medium (chaperonin CPN60 in DVB,spots 3421, 3424 and 3427) or even major (UTP-glucose-1-phosphate uridylyltransferase in DSX: spots 239 and 241;ATP synthase alpha chain in RMB: spots 482, 488 and 501)shifts in pI, but identical Mr are likely to correspond to thiscategory. Segregation data would definitely help to identifyallelic variants (reviewed in [70]).
(ii) Translated gene products from different paralogs of amultigene family (see [71] for a review of the role of prote-omics in unravelling gene families). Indeed, the complexgenome of poplar is expected to contain multiple copies formany genes as recently reported by Tuskan et al. [2].
(iii) Isoforms with different signal or targeting sequencespresenting shifts in pI and Mr [48].
(iv) Presence of dimeric and monomeric forms of a pro-tein that can be easily recognized, since the Mr of a dimer isexpected to be twice the Mr of the corresponding monomer,as reported by Porubleva et al. [63].
(v) in vivo proteolysis or in vitro protein degradation(including chemical modification of the proteins such ascarbamylation) during sample preparation. This is the casewhen different forms are found all over the gel with Mr sig-nificantly lower than predicted from the gene sequence anddifferent pI values as well (e.g. BSP precursor A in YFI: spot2901 50.8 kDa, spot 3525 24.3 kDa, spot 3560 22.7 kDa; eno-lase in DVB: spot 3481 45.5 kDa and spot 3845 26.1 kDa). Itis simply impossible at that stage to conclude whether thisvariability results from cellular process or sample prepara-tion.
4.3 Effect of drought on transcript and protein
abundance in roots and leaves
The molecular mechanisms underlying water-deficitresponses have been already well-described particularly inannual species [34, 72, 73]). In contrast, genomic studies ofdrought-stressed trees are still very scarce and have mainlytaken a transcriptomic approach (e.g. [74–77]). To understandthe major molecular mechanisms that poplar evokes to tol-erate drought stress, we investigated stress-induced generegulation at both the transcript and protein levels.
4.3.1 Up-regulated proteins in roots and leaves
In roots, drought-specific proteins included a 26S proteaseregulatory subunit 6A, a component of the 26S proteasomeinvolved in the ATP-dependent degradation of ubiquitinatedproteins [78] and a leucoanthocyanidin reductase (LAR), anenzyme implicated in the biosynthesis of catechin, the initi-ating unit of the polymeric flavonols proanthocyanidin [79].That these two spots were not detected in the irrigated con-trols does not imply that the proteins were not expressed, butcould merely be due to the fact that they remain below thedetection level of the staining procedure. Thus, the appear-ance of these spots could correspond to an increased synthe-sis of a pre-existing gene product, i.e. to a quantitative varia-tion. Other proteins up-regulated in roots included ananther-specific PRP (13.4-fold increase), an aminopeptidase2 (12.56), wound-responsive Pop3 protein (2.16) and aprotein with unknown function (3.26). This suggests thatprotein breakdown and recycling via the ubiquitin–protea-some pathway or proteolytic enzymes (e.g. aminopeptidase)are involved in the response to water stress in poplar roots.Protein degradation is a well-known response to water deficit[80], and aminopeptidases may target the proteins damagedby reactive oxygen species (ROS) for later hydrolysis [81]. Thestrong accumulation of LAR in drought-stressed roots sug-gests that flavonoid biosynthesis also increased. Accumula-tion of secondary metabolites such as phenolics, proantho-cyanidin and catechin has been reported as a sign of activateddefence mechanism in plants (e.g. [82–84]).
In leaves, ferredoxin-NADP reductase was detected onlyunder drought stress. Other strongly up-regulated proteinsin this tissue include a [Cu–Zn] SOD (16.8-fold increase), apolyphenol oxidase (3.86), two plastocyanins A (3.86and3.46), a 32 kDa BSP B precursor (3.26) and a glutaminesynthase (GS; 2.46). The increased accumulation of SOD (ascavenger of O2
2 radicals) and polyphenol oxidase (a copperprotein that catalyses the oxidation of hydroxyphenols totheir quinone derivatives) shows that both enzymatic (Halli-well Asada pathway) and nonenzymatic (based on anti-oxidant molecules) systems were actively stimulated in theleaves of drought-stressed plants. Similar results have beenreported in pine [85], sugar beet [86] and rice [87]. The accu-mulation of the thylakoid lumen protein plastocyanin A isalso worth noting. This protein is involved in light driven
© 2006 WILEY-VCH Verlag GmbH & Co. KGaA, Weinheim www.proteomics-journal.com

6524 C. Plomion et al. Proteomics 2006, 6, 6509–6527
electron flow between PSII and PSI, at the donor side of PSI[88, 89]. While the function and structure of this protein arewell known, the reason why drought induces an increase ofthis protein remains unclear.
In poplar, seasonal nitrogen storage involves the accu-mulation of a 32 kDa BSP in the inner bark parenchyma andxylem rays [47]. Seasonal N cycling is an adaptation of plantsto winter-cold seasonal climates in which nutrients are oftenconsidered to be the major growth limiting factor [46]. To thebest of our knowledge, the present study is the first reportingthat this vegetative storage protein also accumulates indrought-stressed leaves. Coleman et al. [90] suggested thatBSPs could be involved in short-term nitrogen storage dur-ing periods of excess nitrogen availability. We suggest thatthe storage of nitrogen from degraded proteins (Rubiscoamong others) in the form of BSPs is an active mechanism toface water shortage. This pool of stored nitrogen could thenbe rapidly remobilized for leaf growth once optimal growingconditions are restored, or else directly exported to roots, assuggested by the increase of below-ground biomass ofdroughted cuttings. Finally, the increase of a GS can berelated to a recent finding of El-Khatib et al. [91] who reportedthat ectopic overexpression of pine cytosolic GS enhancedphotorespiration during drought and could therefore con-tribute to the protection of photosynthesis.
4.3.2 Down-regulated proteins in roots and leaves
In roots, proteins specific to controls included an LAR (spot1178), a mitochondrial processing peptidase (MPP) beta sub-unit and a GST. Predicted pI and Mr of the LAR A. thalianahomologue (pI = 5.89, Mr = 37 881 Da) were very similar tothat observed for spot 578 induced by drought (6.04/35097),and very different to that observed for spot 1178 (pI = 5.28;MW = 20 913 Da). That these two spots presented oppositepatterns of expression (up- vs. down-regulation) suggests: (i)PTM of the same protein under drought-stress conditions asreported for twin calreticulin spots in GA3-treated leaf sheathin rice [92], (ii) regulation of different protein products eitherresulting from alternative splicing or allelic variants of thesame gene and (iii) differentially expressed members of amultigene family, e.g. [75] reported that clones with the sameannotation presented opposite expression patterns in drought-stressed pine. Given the notable differences both in terms of pIand Mr, the alternative splicing hypothesis seems more likely,but remains to be proved with more facts.
MPP is a bifunctional protein in plants [92], integratedinto the cytochrome bc1 complex of the respiratory chain,playing a structural role in electron transport and in proteinprocessing. That MPP was not detected in drought-stressedroots suggests a severe decrease of the respiration comparedto the well-watered condition.
Two MLPs (100- and 25-fold decrease, respectively),tubulin alpha chain (ten-fold) and peroxidase (3.3-fold) wereconstitutively expressed but strongly down-regulated duringdrought.
In leaves, only one protein (Elongation factor 1-beta0) wasspecific to controls. The other 25 proteins (SupplementaryTable S2) presented a 5.5- to 1.6-fold decrease. They includeseveral ribosomal proteins, chaperonins, proteins from car-bohydrate metabolism (malate dehydrogenase, glucan endo-1,3-beta-glucosidase, enolase, 2,3-bisphosphoglycerate-inde-pendent phosphoglycerate mutase, alpha-1,4-glucan-proteinsynthase and triosephosphate isomerase), AdoMet synthe-tase, ATP-synthase and tubulin (as in root). All togetherthese results provide a strong case that the biochemicalmechanisms associated with growth were reduced in theshoots.
4.3.3 Comparison between transcript and protein
expression profiles
Both transcriptional and protein expression profilesrevealed a general stress response of the plant which isconsistent with the physiological data. For example, mem-bers of the protein degradation machinery were induced atthe transcript level (i.e. 20S proteasome, polyubiquitin) aswell as the proteome level (26S protease regulatory sub-unit). However, only two drought-induced proteins (i.e. awound responsive protein in roots and a [CuZn]–SOD inleaves) showed an increased level of their transcripts. Theother proteins were not found within the set of drought-regulated transcripts. This limited overlap between drought-regulated proteins and drought-regulated transcripts likelyreflects the different physico-chemical properties of theinvestigated proteins. The restricted set of genes (i.e. 2500)represented on the cDNA arrays may also explain some ofthe observed discrepancies, although most sequenced pro-teins had a corresponding cDNA on the array. For eightproteins among the 13 (60%) identified as regulated bydrought stress in roots, and for 17 proteins among the 38(45%) identified in leaves, corresponding ESTs were presenton the cDNA array, but for most of them the transcript fold-change was not significant although the protein abundancewas modified, suggesting that the changes in protein con-centration are regulated by post-transcriptional processes[93, 94]. These differences could also result from differentturn-over rates between transcripts and polypeptides. Inaddition, several highly drought-regulated transcripts (Sup-plementary Table S1), such as type 2 metallothionein,aquaporins (PIP and TIP) and extensin, are coding for cellwall or membrane proteins. They cannot be detected by thepresent proteomic analysis restricted to soluble proteins.The current comparison confirmed that changes in proteinlevel occurred without any detectable change in transcriptabundance and vice versa. It demonstrates the com-plementarity of the transcriptomic and proteomic approa-ches, and the necessity to combine the two methods toreach full insights into molecular plasticity response todrought or any other environmental cues or developmentalprocess.
© 2006 WILEY-VCH Verlag GmbH & Co. KGaA, Weinheim www.proteomics-journal.com

Proteomics 2006, 6, 6509–6527 Plant Proteomics 6525
4.4 Molecular basis of physiological responses to
drought stress in poplar
Leaf water status, gas exchange and root growth of droughtedand irrigated poplar cuttings are documented in Table 3.Predawn water potential was not affected by drought prob-ably due to the hydraulic properties of the soil and the denserooting. Nevertheless, as indicated by the lowered mid-dayleaf water potential in the drought condition (20.21 MPa),plants suffered from limited water supply during the day-time. This lowered supply resulted in an almost completestomatal closure. Net CO2 assimilation rates (40% of thecontrol) were affected by water shortage mainly due to CO2
starvation induced by stomatal closure. The lack of signifi-cant change in the level of transcripts coding for carbonassimilation enzymes confirms that the observed decrease ofCO2 assimilation was probably independent of gene regula-tion and likely involved rapid allosteric enzyme regulation.In droughted plants, the increased abundance of plastocya-nin A and ferredoxin-NADP reductase, two electron trans-porters between Photosystems II and I had probably nodetectable effect on photosynthesis. Nevertheless, the declineof photosynthetic activity was paralleled by increased levelsof wound-induced protein, metallothionein type 2, CuZn–SOD, peroxidase, at the transcript and/or protein level,which corresponds to a general response to stress and to theneed for increased free radical scavenging during drought.
At root level, we recorded a drastic increase in root elon-gation in response to drought. Similar effects had alreadybeen reported in other studies and thought to involve anincrease in cell wall plasticity [95–97]. Changes in wall prop-erties likely imply an alteration in protein patterns (e.g. XETs,expansins [98]). However, since less than 10% of the har-vested root tissue were actually growing, modifications oftranscript concentration or protein abundance could hardlybe detected.
Despite the striking morphological and ecophysiologicalresponses observed at the whole plant level, only a limitednumber of drought-responsive transcripts and proteins weredetected. This suggests that the early stages of drought stressonly induce limited changes in gene expression. The primaryresponses to moderate drought are stomatal closure andgrowth cessation that require no or limited changes in geneexpression. Photosynthesis under very low CO2 supplyrequires overexpressed protective systems as detected here.
5 Conclusion
The very high protein identification success rate reportedhere indicates that identification based on MS/MS sequenceinformation and EST database search is not a limiting factorin the advancement of poplar proteomics. Rather, to developpoplar proteomics to its full potential, future efforts shouldconcentrate in the revelation and identification of more pro-teins than were detected here. First, the use of a more sensi-
tive staining protocol (e.g. fluorescent SyproRuby stain) and/or very narrow (1 pH unit) gradients will enable many moreproteins to be visualized and resolved [99]. In addition, pro-tocols have been optimized for the extraction and solubiliza-tion of proteins after subfractionation according to cell typeand subcellular compartments, e.g. cell wall, plasma mem-brane, vacuolar membrane, ER, golgi apparatus, mitochon-drion and chloroplasts (reviewed in [100]). It is foreseen thatthe study of ‘subproteomes’ will contribute on the one handto the recovery of more proteins than usually revealed byclassical proteomic experiments, and on the other hand toclarify members of multiple gene family, since proteinswithin a family often accumulate at different subcellularlocations. To resolve low abundance proteins (e.g. regulatoryproteins, signal transduction proteins and receptors), pro-teins with extreme pI and Mr, and integral membrane pro-teins, progress in sample preparation [101] and separationtechniques such as multidimensional LC [102]) should alsobe developed. Beyond the simple cataloguing of proteins,delineation of protein–protein interactions (the interactome)and the study of PTMs constitute other important challengesthat are being developed in far more advanced functionalgenomic projects such as Human [103] and Yeast [104].These advances will certainly pave the way for poplar toaddress biological questions that are either unique orimportant to trees. Together with the genome sequence andtranscriptome data [41, 105–107], large-scale identification ofpoplar proteins should result in discoveries about the cell’sprotein machinery that could yield important applications inforestry, as exemplified here for drought-stress response.Such basic knowledge will contribute to the understandingof the molecular basis of wood formation, reproductivedevelopment, juvenility and maturity, carbon allocation andpartitioning, and interaction of perennial plants with theirenvironment, and provide reliable expressional candidategenes that might provide useful biomarkers for the manage-ment of genetic resources.
This study also allowed the characterization of severaldrought-stress responsive genes/proteins in young poplartrees. Whether these results can be extrapolated to maturetrees is yet to be proved. A second problem lies in discoveringwhich molecular variations really matter, i.e. affect pheno-typic variations in natural populations. By bringing togetherecologists, molecular biologists and population geneticists,we hope to identify functionally important genes and vali-date mutations of adaptive values from their associationswith the phenotypic variation of adaptive traits related towater use efficiency, and eventually understand why and howcertain genotypes cope successfully under reduced wateravailability while others do not.
This research was supported by grants from ANR (ECOGERINTERPOPGER: Interactions entre peupleraies naturelles etcultivées et pressions évolutives liées à leurs modes de gestion) andINRA EFPA. The ‘Pôle protéomique’ and the ‘Centre de Bioin-
© 2006 WILEY-VCH Verlag GmbH & Co. KGaA, Weinheim www.proteomics-journal.com
6526 C. Plomion et al. Proteomics 2006, 6, 6509–6527
formatique’ of Bordeaux belong to the ‘Plate-forme GénomiqueFonctionnelle Bordeaux’ (http://www.pgfb.u-bordeaux2.fr/eng/index.html), which is supported by Région Aquitaine(grant no. 20030304002FA) and the Fonds Européens de Dével-oppement Régional (FEDER no. 2003227). D. J. was placed atthe disposal of the Centre de Bioinformatique de Bordeaux by theInstitut Fédérateur de Recherches IFR103. The research utilizedin part the Functional Genomics Facilities at INRA-Nancyfinanced by INRA, Région Lorraine and the European Commis-sion through the Institut Fédérateur de Recherche IFR110. Wethank Gerald Tuskan (Oak Ridge National Laboratory) for pro-viding us with the first version of the annotated poplar genome.
6 References
[1] Strauss, S. H., Martin, F. M., New Phytol. 2004, 164, 1–4.
[2] Tuskan, G., Chapman, J., Chen, G., Cunningham, R. et al.,Science 2006, 313, 1596–1604.
[3] Schrader, J., Nilsson, J., Mellerowicz, E., Berglund, A. et al.,Plant Cell 2004, 16, 2278–2292.
[4] Wilkins, M. R., Sanchez, J. C., Gooley, A. A., Apel, R. D. et al.,Biotechnol. Genet. Eng. Rev. 1995, 13, 19–50.
[5] Gallardo, K., Job, C., Groot, S. P. C., Puype, M. et al., PlantPhysiol. 2002, 129, 823–837.
[6] Brugière, S., Kowalski, S., Ferro, M., Seigneurin-Berny, D. etal., Phytochemistry 2004, 65, 1693–1707.
[7] Ferro, M., Salvi, D., Brugière, S., Miras, S. et al., Mol. Cell.Proteomics 2003, 2, 325–345.
[8] Giavalisco, P., Eckhard, N., Kreitler, T., Klöppel, K-D., et al.,Proteomics 2005, 7, 1902–1913.
[9] Rakwal, R., Agrawal, G. K., Electrophoresis 2003, 24, 3378–3389.
[10] Watson, B. S., Asirvathan, V. S., Wang, L., Sumner, L. W.,Plant Physiol. 2003, 131, 1104–1123.
[11] Mathesius, U., Keijzers, G., Natera, S. H. A., Winman, J. J. etal., Proteomics 2001, 1, 1424–1440.
[12] Lei, Z., Elmer, A. M., Watson, B. S., Dixon, R. A. et al., Mol.Cell. Proteomics 2005, 4, 1812–1825.
[13] Donnelly, B. E., Madden, R. D., Ayoubi, P., Porter, D. R., Dill-with, J. W., Proteomics 2005, 5, 1624–1633.
[14] Bahrman, N., Le Gouis, J., Negroni, L., Amilhat, L. et al.,Proteomics 2004, 4, 709–719.
[15] Hajduch, M., Ganapathy, A., Stein, J. W., Thelen, J. J., PlantPhysiol. 2005, 137, 1397–1419.
[16] Schiltz, S., Gallardo, K., Huart, M., Negroni, L. et al., PlantPhysiol. 2004, 135, 2241–2260.
[17] Méchin, V., Balliau, T., Chateau-Joubert, S., Davanture, M. etal., Phytochemistry 2004, 65, 1609–1618.
[18] Costa, P., Pionneau, C., Bauw, G., Dubos, C. et al., Electro-phoresis 1999, 20, 1098–1108.
[19] Gion, J. M., Lalanne, C., Le Provost, G., Ferry-Dumazet, H. etal., Proteomics 2005, 5, 3731–3751.
[20] Lippert, D., Zhuang, J., Ralph, S., Ellis, D. et al., Proteomics2005, 5, 461–473.
[21] Jorge, I., Navarro, R. M., Lenz, C., Ariza, D., Jorrín, J., Prote-omics 2006, 6, S207–S214.
[22] Jorge, I., Navarro, R. M., Lenz, C., Ariza, D. et al., Proteomics2005, 5, 222–234.
[23] Ferreira, S., Hjerno, K., Larsen, M., Wingsle, G. et al., Ann.Bot. 2006, DOI: .
[24] Churkina, G., Running, S. W., Schloss, A. L., Glob. ChangeBiol. 1999, 5, 46–55.
[25] Landmann, G., Becker, M., Delatour, C., Dreyer, E., Dupouey,J. L., Rundgespräche der Kommission für Ökologie Bd.1993, vol. 5, pp. 97–114.
[26] Roeckner, E., J. Exp. Bot. 1992, 43, 1097–1109.
[27] Brendel, O., Pot, D., Plomion, C., Rozenberg, P., Guehl, J.-M.,Plant Cell Environ. 2002, 25, 945–953.
[28] Monclus, R., Dreyer, E., Delmotte, F. M., Villar, M. et al., NewPhytol. 2005, 167, 915–919.
[29] Blake, T. J., Sperry, J. S., Tschaplinski, T. J., in: Stettler, R. F.,Bradshaw, H. D., Jr, Heilman, P. E., Hinckley, T. M. (Eds.), Bi-ology of Populus and Its Implications for Management andConservation, NRC-CNRC, Ottawa 1996, pp. 401–422.
[30] Marron, N., Dreyer, E., Boudouresque, E., Delay, D. et al.,Tree Physiol. 2003, 23, 1225–1235.
[31] Tschaplinski, T. J., Tuskan, G. A., Gunderson, C. A., Can. J.For. Res. 1994, 24, 364–371.
[32] Tschaplinski, T. J., Tuskan, G. A., Gebre, G. M., Todd, D. E.,Tree Physiol. 1998, 18, 653–658.
[33] Monclus, R., Dreyer, E., Villar, M., Delmotte, F. M. et al., NewPhytol. 2006, 169, 765–777.
[34] Chaves, M. M., Maroco, J. P., Pereira, J. S., Funct. Plant Biol.2003, 30, 239–264.
[35] Vinocur, B., Altman, A., Curr. Opin. Biotechnol. 2005, 16, 1–10.
[36] Ferry-Dumazet, H., Houel, G., Montalent, P., Moreau, L. et al.,Proteomics 2005, 5, 2069–2081.
[37] Damerval, C., de Vienne, D., Zivy, M., Thiellement, H., Elec-trophoresis 1986, 7, 52–54.
[38] Ramagli, L., Rodriguez, L., Electrophoresis 1985, 6, 559–563.
[39] Rice, P., Longden, I., Bleasby, A., Trends Genet. 2000, 16,276–277.
[40] Kohler, A., Blaudez, D., Chalot, M., Martin, F., New Phythol.2004, 164, 83–93.
[41] Kohler, A., Delaruelle, C., Martin, D., Encelot, N., Martin, F.,FEBS Lett. 2003, 542, 37–41.
[42] Lacourt, I., Duplessis, S., Abba, S., Bonfante, P., Martin, F.,Appl. Environ. Microb. 2002, 68, 4574–4582.
[43] Long, A. D., Mangalam, H. J., Chan, B. Y. P., Tolleri, L. et al., J.Biol. Chem. 2001, 276, 19937–19944.
[44] Fowler, T. J., Bernhardt, C., Tierney, M. L., Plant Physiol.1999, 121, 1081–1091.
[45] Stépien, V., Sauter, J. J., Martin, F., Plant Physiol. Biochem.1994, 32, 185–192.
[46] Cooke, J. E. K., Weih, M., New Phytol. 2005, 167, 19–30.
[47] Coleman, G. D., in: Arora, R. (Ed.), Adaptations and Respon-ses of Woody Plants to Environmental Stresses, Food Prod-ucts Press, Binghamton, NY, USA 2004, pp. 237–259.
[48] de Vienne, D., Burstin, J., Gerber, S., Leonardi, A. et al., Her-edity 1996, 76, 166–177.
[49] Reiter, W. D., Vanzin, G. F., Plant Mol. Biol. 2001, 47, 95–113.
[50] Delmer, D. P., Haigler, C. H., Metab. Eng. 2002, 4, 22–28.
© 2006 WILEY-VCH Verlag GmbH & Co. KGaA, Weinheim www.proteomics-journal.com
Proteomics 2006, 6, 6509–6527 Plant Proteomics 6527
[51] Pilate, G., Déjardin, A., Laurans, F., Leplé, J. C., New Phytol.2004, 164, 63–72.
[52] Chaffey, N., Cytoskeleton, Cell Walls and Cambium: NewInsights into Secondary Xylem Differenciation, in: Cell andMolecular Biology of Wood Formation, Bios Scientific pub-lisher, Oxford 2000.
[53] Christensen, J. H., Baucher, M., O’Connell, A., Van Montagu,M., Boerjan, W., in: Jain S. M., Minocha S. C. (Eds.), Controlof Lignin Biosynthesis, Molecular Biology of Woody Plants,Kluwer Academic publishers, The Netherlands 2000, Vol. 1,pp. 227–266.
[54] Derory, J., Léger, P., Garcia, V., Schaeffer, J. et al., New Phy-tol. 2006, 170, 723–738.
[55] Wang, S. Y., Jiao, H. J., Faust, M., Physiol. Plant. 1991, 82,231–236.
[56] Nessler, C. L., Burnett, R. J., Plant Mol. Biol. 1992, 20, 749–752.
[57] Stromvik, M. V., Sundararaman, V. P., Vodkin, L. O., PlantMol. Biol. 1999, 41, 217–231.
[58] Cannon, S. B., Mitra, A., Baumgarten, A., Young, N. D., May,G., BMC Plant Biol. 2004, 4, 1–21.
[59] Tschaplinski, T. J., Blake, T. J., Can. J. Bot. 1989, 67, 1681–1688.
[60] Blanc, J. F., Lalanne, C., Plomion, C., Schmitter, J.-M. et al.,Proteomics 2005, 5, 3778–3789.
[61] Kim, S. I., Kim, J. Y., Kim, E. A., Kwon, K. H. et al., Proteomics2003, 3, 2379–2392.
[62] Hochholdinger, F., Ling Guo, P., Schnable, S., Plant J. 2004,37, 199–208.
[63] Porubleva, L., Vander Velden, K., Kothari, S., Livier, D. J.,Chitnis, P. R., Electrophoresis 2001, 22, 1724–1738.
[64] Lonosky, P. M., Zhang, X., Honavar, V. G., Dobbs, D. L. et al.,Plant Physiol. 2004, 134, 560–574.
[65] Parker, K. C., Garrels, J. I., Hines, W., Butler, E. M. et al.,Electrophoresis 1998, 19, 1920–1932.
[66] Sun, N., Jang, J., Lee, S., Kim, S. et al., Proteomics 2005, 5,1574–1579.
[67] Giometti, C. S., Reich, C., Tollaksen, S., Babnigg, G. et al., J.Chromatogr. B 2002, 782, 227–243.
[68] Link, A. J., Hays, L. G., Carmack, E. B.,Yates, J. R. III, Electro-phoresis 1997, 18, 1314–1334.
[69] Hernandez, R., Nombela, C., Diez-Orejas, R., Gil, C., Prote-omics 2004, 4, 374–382.
[70] Thiellement, H., Bahrman, N., Damerval, C., Plomion, C. etal., Electrophoresis 1999, 20, 2013–2026.
[71] Sappl, P. G., Heazlewood, J. L., Millar, A. H., Phytochemistry2004, 65, 1517–1530.
[72] Bray, E. A., Trends Plant Sci. 1997, 2, 48–54.
[73] Shinozaki, K., Yamaguchi-Shinozaki, K., in: Shinozaki, K.,Yamaguchi-Shinozaki, K. (Eds.), Molecular Responses toCold, Drought, Heat and Salt Stress in Higher Plants, R. G.Landes, Austin, TX 1999, pp. 11–28.
[74] Watkinson, J. I., Sioson, A. A., Vasquez-Robinet, C., Shukla,M. et al., Plant Physiol. 2003, 133, 1702–1716.
[75] Dubos, C., Le Provost, G., Pot, D., Salin, F., Lalanne, C. et al.Tree Physiol. 2003, 23, 169–179.
[76] Dubos, C., Plomion, C., Plant Mol. Biol. 2003, 51, 249–262.
[77] Nanjo, T., Futamura, N., Nishiguchi, M., Igasaki, T. et al.,Plant Cell Physiol. 2004, 45, 1738–1748.
[78] Smalle, J., Vierstra, R. D., Ann. Rev. Plant Biol. 2004, 55,555–590.
[79] Tanner, G. J., Francki, K. T., Abrahams, S., Watson, J. M. etal., J. Biol. Chem. 2003, 278, 31647–31656.
[80] Inzé, D., van Montagu, M., Curr. Opin. Biotechnol. 1995, 6,153–158.
[81] Chao, W. S., Gu, Y. Q., Pautot, V., Bray, E. A., Walling, L. L.,Plant Physiol. 1999, 120, 979–992.
[82] Brooker, F. L., Anttonen, S., Heagle, A. S., New Phytol. 1996,132, 483–492.
[83] Pääkkönen, E., Günthardt-Goerg, M. S., Holopainen, T,Ann. Bot. 1998, 82, 49–59.
[84] Jaakola, L., Maatta-Riihinen, K., Karenlampi, S., Hohtola,A., Planta 2004, 218, 721–728.
[85] Costa, P., Bahrman, N., Frigerio, J. M., Kremer, A., Plomion,C., Plant Mol. Biol. 1998, 38, 587–596.
[86] Hajheidari, M., Abdollahian-Noghabi, M., Askari, H., Hei-dari, M., Sadeghian, S. Y., Proteomics 2004, 5, 950–960.
[87] Salekdeh, G. H., Siopongco, J., Ghareyazie, B., Bennett, J.,Proteomics 2002, 2, 1131–1145.
[88] Gupta, R., He, Z., Luan, S., Nature 2002, 417, 567–571.
[89] De la Rosa, M. A., Navarro, J. A., Diaz-Quintana, A., de laCerda, B. et al., Bioelectrochemistry 2002, 55, 41–45.
[90] Coleman, G. D., Pilar Bañados, M., Chen, T. H. H., PlantPhysiol. 1994, 106, 211–215.
[91] El-Khatib, R. T., Hamerlynck, E. P., Gallardo, F., Kirby, E. G.,Tree Physiol. 2004, 24, 729–736.
[92] Braun, H. P., Schmitz, U. K., Trends Biochem. Sci. 1995, 20,171–175.
[93] Kawaguchi, R., Williams, A. J., Bray, E. A., Bailey-Serres, J.,Plant Cell Environ. 2003, 26, 221–229.
[94] Kawaguchi, R., Girke, T., Bray, E. A., Bailey-Serres, J., PlantJ. 2004, 38, 823–839.
[95] Sharp, R. E., Davies, W. J., Planta 1979, 147, 43–49.
[96] N’Guyen, A., Lamant, A., Tree Physiol. 1989, 5, 123–133.
[97] Triboulot, M. B., Pritchard, J., Tomos, D., New Phytol. 1995,130, 169–75.
[98] Wu, Y. J., Cosgrove, D. J., J. Exp. Bot. 2000, 51, 1543–1553.
[99] Herbert, B. R., Harry, J. L., Packer, N. H., Gooley, A. A. et al.,Trends Biotechnol. 2001, 19, S3–S9.
[100] Millar, H., Funct. Plant. Biol. 2004, 31, 563–571.
[101] Kim, S. T., Cho, K. S., Jang, Y. S., Kang, K. Y., Electrophore-sis 2001, 22, 2103–2109.
[102] Washburn, M. P., Wolters, D., Yates, J. R., Nat. Biotechnol.2001, 19, 242–246.
[103] Lehner, B., Fraser, A., Genome Biol. 2004, 5, R63.
[104] von Mering, C., Krause, R., Snel, B., Cornell, M. et al., Na-ture 2002, 417, 399–403.
[105] Smith, C., Rodriguez-Buey, M., Karlsson, J., Campbell, M.,New Phytol. 2004, 164, 123–136.
[106] Taylor, G., Nathaniel, R., Tricker, P. J., Sjödin, A. et al., NewPhytol. 2005, 167, 143–154.
[107] Schrader, J., Nilsson, J., Mellerowicz, E., Berglund, A. et al.,Plant Cell 2004, 16, 2278–2292.
© 2006 WILEY-VCH Verlag GmbH & Co. KGaA, Weinheim www.proteomics-journal.com