mapping the substrate-binding site of a human class .mu. glutathione transferase using nuclear...
TRANSCRIPT
2912 Biochemistry 1992, 31, 2912-2920
Mapping the Substrate-Binding Site of a Human Class Mu Glutathione Transferase Using Nuclear Magnetic Resonance Spectroscopy+
Christopher J. Penington and Gordon S. Rule* Department of Biochemistry, Box 440, Jordan Hall, University of Virginia, Charlottesville, Virginia 22908
Received September 3, 1991; Revised Manuscript Received December 30, 1991
ABSTRACT: The substrate-binding site of a human muscle class mu glutathione transferase has been characterized using high-resolution nuclear magnetic resonance spectroscopy. Isotopic labeling has been used to simplify one-dimensional proton N M R spectra of the Tyr and His residues in the enzyme and two-dimensional carbon-proton spectra of the Ala and Met residues in the enzyme. The resonance lines from 8 of the 12 Tyr residues have been assigned using site-directed mutagenesis. Replacement of Tyr7 with Phe reduced the activity of the enzyme 100-fold. The proximity of His, Tyr, Ala, and Met residues to the active site has been determined using a nitroxide-labeled substrate analogue. This substrate analogue binds with high affinit (K = lo6 M-l) to the enzyme and is a competitive inhibitor. None of the His residues are within 17 of &e active site. Three of the assigned Tyr residues are greater than 17 8, from the active site. Quantitative measurement of paramagnetic line broadening of five additional Tyr residues places them within 13-17 8, from the active site. Broadening of the Ala and Met resonance lines by the spin-labeled substrate indicates that three Ala residues are 9-16 8, from the nitroxide, three Met residues are less than 9 8, from the nitroxide, and two Met residues are 9-16 8, from the nitroxide. These data indicate that the active site region of this class mu glutathione transferase is in a location similar to that found for the class pi enzyme as described by Reinemer et al. [Reinemer, P., Dirr, H. W., Ladenstein, R., Schaffer, J., Gallay, O., & Huber, R. (1991) EMBO J. 10, 1997-20051.
x e glutathione transferases (EC 2.5.1.18) are a family of detoxification proteins (Mannervik & Danielson, 1988; Arm- strong, 1991). They catalyze nucleophilic attack by the thio group of glutathione on electrophilic compounds. The soluble glutathione transferase enzymes have been grouped into four classes based on protein sequence similarity and antibody cross-reactivity: alpha, mu, pi, and theta (Mannervik & Danielson, 1988; Meyer et al., 1991). Members of the same class share 75-9576 protein sequence identity, while interclass alignments show 25-30% sequence identity.
Glutathione transferases detoxify chemical carcinogens. Compounds which induce elevated levels of glutathione transferases have been shown to protect mice from tumor induction by benzanthracene (Wattenberg, 1972). Within the human population, the deletion of a class mu transferase in certain individuals has been correlated with an increased in- cidence of lung cancer (Seidegard et al., 1988) and of ade- nocarcinoma of the stomach and colon (Strange et al., 1991). Glutathione transferases have also been implicated in the inactivation of chemotherapeutic drugs by some tumors (Smith et al., 1989).
Substrate specificities have been shown to vary both within a particular class and between the different classes. Several glutathione transferases have been cloned and expressed in Escherichia coli. Expression of these enzymes in E . coli has provided homogeneous sources of enzyme for studies on sub- strate specificity and kinetic mechanism and has facilitated the construction of mutant proteins (Board & Mannervik, 1991; Stenberg et al., 1991; Wang et al., 1991; Zhang & Armstrong, 1990).
The structure of a porcine class pi glutathione transferase has recently been reported (Reinemer et al., 1991). The
This work was supported by a University of Virginia biomedical research grant (RR-05431) and by a grant from the American Cancer Society (BC-703).
* To whom correspondence should be addressed.
0006-2960/92/043 1-29 12$03.00/0
protein was crystallized in the presence of glutathione sulfo- nate, and a binding site for the glutathione has been identified. The tertiary structure has several interesting features. The dimer contains a single Cz symmetry axis, placing both glu- tathione sulfonates at one "end" of the structure. Each mo- nomeric unit can be divided into two domains. The domain which binds the glutathione sulfonate is composed of helices and /3-sheets and contains the N-terminus of the protein. The other domain is predominantly helical. The binding site for the second substrate could not be localized in the crystal be- cause of the nature of the substrate analogue used. The crystal structure of the porcine enzyme suggests a role for Tyr7 in the catalytic cycle; the {-OH group of Tyr7 forms a hydrogen bond with the sulfur of the bound glutathione.
At present, the relationship between primary sequence and substrate specificity of glutathione transferases is not clear. The structure of the porcine class pi enzyme provides a framework that can be used to examine the relationship be- tween primary structure and substrate specificity for gluta- thione transferases. However, this structure did not identify the hydrophobic substrate-binding site on the enzyme. Pho- toaffinity labeling of a class alpha enzyme has demonstrated that this site lies somewhere near the carboxy terminus of the protein (Hoesch & Boyer, 1989). An understanding of the relationship between structure and substrate specificity will require detailed information on the residues present in the binding site and the effects of substrate binding on their mobility.
High-resolution NMR is an excellent technique to acquire information on the solution structure and dynamics of proteins. To obtain information about the active site of an enzyme using NMR, three criteria must be met: resonance lines must be resolved and assigned to specific amino acid residues in the protein and the spatial relationship of these residues with respect to the active site must be determined. These criteria are easily met for small (< lo kDa) proteins using standard homonuclear NMR techniques (Wuthrich, 1986). However,
0 1992 American Chemical Society
NMR Studies of Glutathione Transferase Biochemistry, Vol. 31, No. 1 1 , 1992 2913
the Xc1857 gene into an aroE strain and was obtained from Dr. R. Kadner (University of Virginia). For isotopic labeling, the cells were grown in a modified minimal medium containing vitamins and trace metals. The composition of the medium was derived from a technical bulletin obtained from the New Brunswick Scientific Co. (Shevitz et al., 1989) and is available on request. We used 1% succinate instead of glucose as the carbon source because 2-3-fold more protein is obtained in the presence of succinate. The amino acid content of the medium was 125 mg/L of each amino acid except for Tyr (45 mg/L), Phe (45 mg/L), and Trp (30 mg/L). The medium was also supplemented with D-biotin (10 pg/mL). For growth of the aromatic auxotroph, p-aminobenzoic acid (2 pg/mL), dihydroxybenzoic acid (2 pg/mL), and phydroxybenzoic acid (2 pg/mL) were also added to the medium. The labeled analogue was substituted for the unlabeled amino acid throughout the growth period.
Glutathione transferase expression was induced when the cells reached an optical density of 1.0 (550 nm) by raising the temperature of the culture from 32 to 42 OC. The cells were allowed to grow for an additional 7 h at 40 "C and then were harvested. The purification procedure was essentially as given by Vorachek et al. (1991), with the exception that the cellular lysate was ultracentrifuged for 30 min instead of 15 min. The supernatant from the centrifugation was loaded directly onto the hexylglutathione affinity column and eluted as described previously. No further purification was necessary for the NMR experiments. For measurements of specific activity, the enzyme was purified further by gel filtration. Estimates of purity are 90% after the affinity column and 99% after the gel filtration column. Typical yields from 1 L of culture were 20-50 mg of isotopically labeled protein.
Enzymatic activity was measured using CDNB as the substrate (Habig & Jakoby, 1981). The specific activity of GST-4 on this substrate is 196 pmol of CDNB/min.mg (Vorachek et al., 1991). Protein concentration was estimated spectrophotometrically using an extinction coefficient of 35 500 L/cmmol at 280 nm. The concentration of sl-GSH solutions was verified by developing spots on a silica gel thin layer chromatography plate with ninhydrin. Spots of glutathione were used as standards.
Site-Directed Mutagenesis. The entire coding sequence of GST-4 was cloned into the single-stranded M13 phage mp18 (Yanish-Perron & Messing, 1985). Site-directed mutagenesis was performed using the technique described by Kunkel (1985), except that the repair reaction was performed at 14 OC for 12 h and the treatment with uracil-N-glycosylase was omitted. We used oligonucleotides which would convert the Tyr codon to a Phe codon. Potential mutants were screened by DNA seqencing. Typical efficiencies of mutagenesis ranged from 5% to 60%. The altered genes were cloned into the same expression vector as that used for the wild-type gene. Mutant proteins were purified using the same protocol as the wild-type protein. The yield of the mutant proteins was similar to that of the wild-type protein.
NMR Spectroscopy. Protein samples for NMR were con- centrated to 10 mg/mL using Centricon (Amicon Co.) fil- tration units. The buffer conditions for NMR were 10 mM phosphate and 50 mM NaCl in D20. This was obtained by repeated cycles of concentration followed by dilution. The protein concentration in the NMR samples was 100-400 pM (active sites) for one-dimensional proton NMR and 0.8-1.2 mM (active sites) for two-dimensional NMR. The half-life of the protein under the conditions used for the NMR ex- periments was 2 weeks. NMR spectra were obtained at 25
the application of NMR techniques to glutathione transferases is a formidable task because of the large size of the dimeric form of the enzyme (50 kDa). Multidimensional homonuclear studies of large proteins are of low sensitivity and resolution because of the short spinspin relaxation time of the protons.
To obtain information on the active site of glutathione transferases using NMR, we have adopted the following general strategy. The most important aspect of this strategy is the use of a spin-labeled product analogue to determine the spatial proximity of residues with respect to the active site. The paramagnetic center on the nitroxide group enhances the dipolar relaxation rate of nuclear spins. The increase in line width can be used to calculate the distances between the un- paired electron and the nuclei. This technique has been used with a number of large proteins (Krugh, 1976). Extensive isotopic labeling of the protein is used to simplify the NMR spectra. Deuterated aromatic amino acids are used to produce resolved resonance lines from aromatic residues in the protein. This technique has been used to simplify the NMR spectra of numerous large proteins, including the Fab fragment of immunoglobulins (Anglister et al., 1984). Information from additional residues within the enzyme can be obtained by the incorporation of 13C-labeled amino acids. Incorporation of 13C facilitates sensitive reverse-detected proton-carbon cor- related spectroscopy. Assignments of resonance lines to specific residues can be accomplished by mutagenesis (Jarema et al., 1981; Rule et al., 1987).
In this report we describe the application of the above strategy to a class mu glutathione transferase from human muscle, GST-4. This protein is an ideal candidate for NMR studies for a number of reasons. First, we have expressed a cDNA encoding this enzyme in E. coli to very high levels (Vorachek et al., 1991). Consequently, it is possible to produce large amounts of isotopically labeled wild-type and mutant proteins. Second, the protein is soluble in millimolar con- centrations and is sufficiently stable for extended NMR studies.
MATERIALS AND METHODS Reagents. [35S]dATPaS was purchased from New England
Nuclear. Recombinant DNA enzymes were purchased from New England Biolabs, GIBCO/BRL, Promega, and Boeh- ringer-Mannheim Biochemicals. Oligonucleotides were pre- pared by the University of Virginia Sequencing Center. The structure of the conjugate between the spin-label, iodoacet- amido-proxyl, and GSH (sl-GSH)' can be found in Schramm et al. (1984). It was synthesized according to the method given by Schramm et al. (1984) and estimated to be 95-98% pure by thin-layer chromatography on silica gel plates [butanol/ acetic acid/ethyl acetate/water (12:3:3:6); detection of free amino groups with ninhydrin and free thiol groups with 5,5'-dithiobis(2-nitrobenzoic acid)], The proton NMR spec- trum of reduced sl-GSH was consistent with the expected structure. Stable isotopes were purchased from either Merck or Cambridge Isotope, Inc. The methyl groups of Ala and Met were labeled with 13C.
Protein Purification. E. coli strain N4830 (F his ilv rpsL Xc1857) was used for the host strain for labeling with [I3C]Met and -Ala. The host strain for labeling with aromatic amino acids was constructed from N4830 using P1 transduction of
I Abbreviations: GSH, glutathione; CDNB, 1-chloro-2.4-dinitro- benzene; sl-GSH, conjugate between glutathione and iodoacetamido- proxyl; TOCSY, total correlation spectroscopy; HMQC, heteronuclear multiple-quantum correlation.
2914 Biochemistry, Vol. 31, No. 11, 1992
OC on a General-Electric Omega system operating at 500.13 MHz (proton).
For one-dimensional proton spectra, a simple one-pulse sequence was used with a relaxation delay of 1.5 s. The total number of scans ranged from 2000 to 5000. The free induction decays were multiplied by an exponential function which broadened the lines by an additional 1 Hz. A spectral width of 8000 Hz was used with a digital resolution of 1 Hz/point. Chemical shifts are referenced to the HDO line at 4.8 ppm.
Two-dimensional Hartmann-Hahn homonuclear protein- protein correlation spectra (TOCSY) were obtained using a z-filtered pulse sequence described by Rance (1987). A MLEV- 17 mixing scheme was used to effect isotropic mixing of the transverse magnetization. The 90° pulse of the spin-lock field was 28 ps, giving a spin-lock field of 9.25 KHz. A 60’ pulse was used for the 17th pulse to compensate for phase errors of the MLEV sequence. A 1-ms delay was used for the z-filters. A spectral width of 6006 Hz was used, and 256 t l slices were collected. The total measurement time was 14 h. The free induction decays in both dimensions were multiplied by a 75O-shifted sine-squared bell. The data in the t , di- mension were zero-filled to generate a final digital resolution of 5.9 Hz/point in t l and 2.9 Hz/point in t 2 . Quadrature detection in t l was obtained using the hypercomplex method as described by States et al. (1982). Specifically, the first pulse was shifted by 90’ to obtain magnetization which was sine modulated in tl.
Two-dimensional proton-carbon correlated spectra were obtained using the heteronuclear multiple-quantum coherence (HMQC) pulse sequence as described by Bax et al. (1990). A dual channel reverse probe was used. The proton pulse width was 20 ps, and the carbon pulse width was 24 ps. Decoupling of the carbons was accomplished with a garpl-1 sequence with a decoupler field of 3000 Hz centered at 20 ppm. The spectral width in the proton dimension was 5000 Hz, resulting in a digital resolution of 2.44 Hz/point. The spectral width in the carbon dimension was 8000 Hz. A total of 32 or 64 scans were collected for each t l spectrum. The number of t l slices collected varied from 160 to 256. The t , slices were zero-filled twice to give a final digital resolution of 7.8 Hz/point. A phase-shifted sine-squared bell (phase shift = 90°) was used in both the t l and t 2 dimensions to remove “sinc wiggles” from the resonance lines. Carbon chemical shifts are referenced to methanol at 49 ppm. Quadrature detection was obtained by phase shifting the first carbon pulse by 90°.
Data Analysis and Presentation. All processing was per- formed on a SUN sparc 1 station using FELK (Hare Research, Inc.). Quantitative information on the distance between the Tyr residues and the nitroxide group was obtained by simu- lation of the one-dimensional spectra obtained in the presence of varying concentrations of sl-GSH (see Figure 4). The spectra were simulated by first fitting the spectrum obtained in the absence of sl-GSH. This spectrum was fitted by gen- erating Lorentzian lines for all of the sharp lines in the spectra. A residual spectrum was calculated, and this residual spectrum was used to defined additional lines buried under the sharper lines. A total of 20 Lorentzian lines were sufficient to account for most of the intensity in the experimental spectrum. The widths and intensities of these lines were adjusted to minimize the residual spectrum. The spectra obtained in the presence of sl-GSH were then simulated using the same Lorentzian lines. The widths of these lines were adjusted to minimize the calculated residual spectrum.
Penington and Rule
The line widths obtained from the spectral simulations were used to determine a distance between the Tyr protons and the nitroxide. These line widths are dependent on the amount of bound ligand. Under conditions of fast exchange, the line width is a weighted average of the liganded and unliganded line widths. When the occupancy of the active site is less than 30% the paramagnetic induced broadening is linear with re- spect to the occupancy. At occupancies greater than 30%, the number of glutathione transferase dimers which contain two bound sl-GSH becomes significant. If a Tyr residue is suf- ficiently close to both binding sites, the relationship between occupancy and paramagnetic line broadening becomes non- linear. Consequently, we only used the line width data ob- tained at occupancies of 30% or less for the distance deter- minations. Note that even when a dimer contains a single bound sl-GSH, it is possible to observe broadening of an NMR line from a residue which is on the monomer without the bound sl-GSH (see Discussion). The dependence of the paramagnetic broadening on the distance between the proton and the un- paired electron was calculated using the equation given by Kosen (1989). A correlation time of 20 ns was assumed for this calculation. The paramagnetic line broadening depends on the inverse sixth power of the proton-nitroxide distance. The standard error associated with measurement of this line broadening was found to be on the order of 30%. This error includes errors associated with the measurement of the oc- cupancy of the active site for those resonances whose line widths have to be measured under nonsaturating conditions (e.g., Y116). Since the nuclei-electron distance is proportional to the sixth root of the line broadening, the contribution of the error in the line width measurements to the error in the distance is less than 1 A. The major source of error is the estimation of the rotational correlation time of the Tyr side chain. Depending on the internal motion of the Tyr ring, the effective correlation time may be 2-3-fold shorter than the overall correlation time of the enzyme. This will cause an error of approximately 20% in the distance measurement, or 2.5 A for a 12 A proton-electron distance. An experimental com- parison of distances determined by paramagnetic broadening to distances obtained by X-ray crystallography has been done for an anti-dinitrophenyl Fab fragment (Theriault et al., 1991). It was found that the distances obtained from paramagnetic broadening showed an average deviation of 1.4 when com- pared to distances obtained from the X-ray crystallographic structure. This indicates that the internal mobility of the Tyr residue affects the distance measurement, but the effect is sufficiently small that meaningful distances can be obtained using this technique.
In situations where titrations with sl-GSH were not per- formed, the distance was estimated by measuring t5e line width under conditions of saturating sl-GSH. For proton spectral lines, it is possible to measure distances in the range of 11-1 7 A. For carbon spectral lines, the distance range is from 6 to 11 A.
The two-dimensional difference maps (Figures 3, 5, and 6) were calculated from the processed spectra. The scaling factor for the subtraction was obtained by using a cross-peak which had the same line width in the spectrum obtained in the presence or absence of sl-GSH. The scaling factor was ad- justed until this line was canceled in the difference spectra.
RESULTS Characterization of the Binding of sl-GSH to GST-4
The experiments described in this section utilize the para- magnetic broadening effect of sl-GSH to obtain information
NMR Studies of Glutathione Transferase Biochemistry, Vol. 31, No. 11, 1992 2915
on the proximity of residues to the active site. The validity of these measurements depends on three factors. First, the sl-GSH must bind to the active site of the enzyme. Second, the binding of sl-GSH to one monomer must not display positive cooperativity. Otherwise, the number of dimers containing two sl-GSH becomes enhanced, and the para- magnetic broadening may arise from two paramagnetic cen- ters. Third, the sl-GSH must be immobilized when bound. Otherwise the distance obtained is heavily weighted by the closest approach of the nitroxide to the magnetic nucleus. In addition, it is useful if the bound sl-GSH is in fast exchange with free sl-GSH. This attenuates the observed broadening such that closer distances can be detected.
Inhibition studies (data not shown) show that sl-GSH is a competitive inhibitor of GST-4. The binding affinity of sl- GSH to GST-4 was measured using fluorescence quenching. The nitroxide group on the sl-GSH efficiently quenches one or more of the four Trp residues found in GST-4. A Stern- Volmer plot (Lakowicz, 1983) of the fluorescence quenching is linear up to saturating concentrations of the sl-GSH (data not shown). This indicates that the quenching is static and the slope of the Stern-Volmer plot can be used to obtain an affinity constant for sl-GSH. An affinity of 1.5 X lo6 M-' was obtained from the slope. The linearity of the Stern- Volmer plot indicates either a lack of cooperativity between the two sites or half-site reactivity by the dimer. The results shown in Figure 4 indicate that a single dimer is capable of binding two molecules of sl-GSH because additional line broadening of NMR resonances is observed at occupancies above 50%.
The degree of immobilization of the nitroxide moiety when the sl-GSH is bound to the enzyme was investigated using electron spin resonance. The addition of a 50-fold excess of GST-4 to a sample of sl-GSH resulted in the complete dis- appearance of the narrow electron spin resonance line from unbound sl-GSH, indicating that the nitroxide is immobilized when bound to the enzyme.
The off-rate of sl-GSH from the binding site was not measured directly. However, the exchange must be in the fast exchange limit because the line shape is observed to be Lor- entzian under conditions of partial occupancy of the enzyme with sl-GSH. This can be seen quite clearly in Figure 4. The peak at 6.3 ppm has a line width of 15 Hz in the absence of sl-GSH. The width of this peak is 110 Hz when the enzyme is fully saturated with sl-GSH. When the enzyme is half- saturated with enzyme, the spectral line is Lorentzian with a line width of 60 Hz. This line width is very close to the width expected at an occupancy of 50%.
NMR Studies of GST-4 Proton NMR Spectra of GST-4. Three different samples
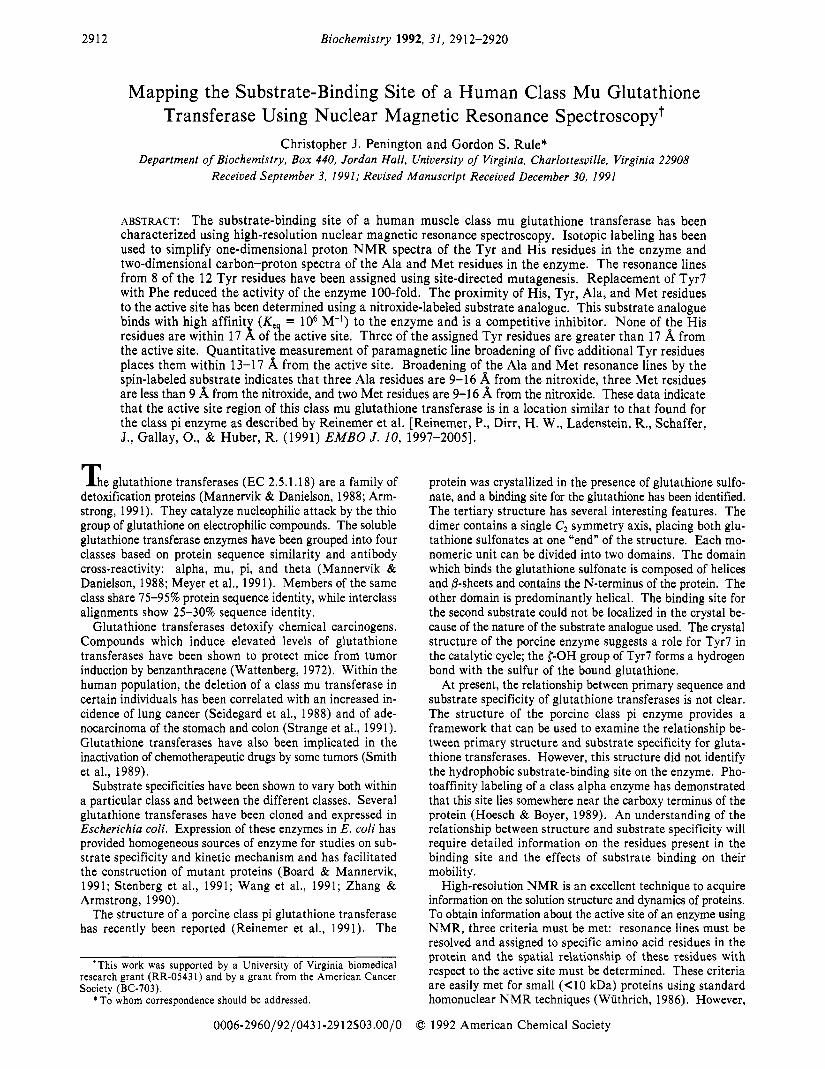
of GST-4 were prepared for the initial proton NMR studies. All three samples contained perdeuterated Phe and Trp. The first sample contained perdeuterated Tyr, the second sample contained Tyr-3,5-dz, and the third sample contained Tyr- 2,6-dz. Figure 1 (A-C) shows representative NMR spectra obtained from these samples. The spectra in Figure 1A-C all show resonance lines from His residues and nonex- changeable amide protons. The spectrum in Figure 1A is of GST-4 labeled with perdeuterated Tyr and does not show any additional resonance lines. The spectrum in Figure 1B is of Tyr-3,5-d2-labeled protein and shows additional resonance lines from the 2,6-protons of Tyr. The spectrum in Figure 1C is of Tyr-2,6-dz-labeled protein and shows additional resonance lines from the 3,5-protons of Tyr. The spectrum obtained with Tyr-2,6-d2-labeled GST-4 contained somewhat sharper reso-
8.0 7 . 5 7.0 6.5 6.0 PPm
FIGURE 1 : Proton N M R spectra of GST-4. Spectrum A is the proton N M R spectrum of GST-4 labeled with perdeuterated Phe, Tyr, and Trp. Spectrum B is GST-4 labeled with perdeuterated Phe and Trp and T ~ r - 3 J - d ~ . Spectrum C is GST-4 labeled with perdeuterated Phe and Trp and with Tyr-2,6-d2. Spectrum D is the same sample as that shown in spectrum C with the addition of sl-GSH to a con- centration of 2 mM (5-fold excess over the protein concentration). Spectrum E is the same sample as that shown in D with the addition of ascorbic acid to give a final concentration of 20 mM. Spectrum F is the difference spectrum calculated from spectra C and D.
nance lines than that obtained with the Tyr-3,5-d2-labeled sample. In addition, there is less overlap of the Tyr-3,5-H proton resonance lines with those arising from the His and nonexchangeable amide protons. Accordingly, Tyr-2,6-dz labeling was used for all of the subsequent proton NMR ex- periments. Figure 1D shows the effect of binding of sl-GSH to Tyr-2,6-dz-labeled GST-4 on the aromatic region of the spectrum. A number of resonance lines broaden due to paramagnetic broadening effects from the nitroxide group. This spectrum clearly shows that none of the three His residues (7.3-7.7 ppm) in GST-4 are within 17 8, of the nitroxide group. Figure 1E shows that the broadening effect can be reversed by the addition of ascorbic acid. The ascorbate re- duces the nitroxide moiety and destroys the paramagnetism (Kornberg & McConnell, 1971). The lines which are broadened by the sl-GSH can be more easily visualized by calculating the difference between the spectra taken in the absence of sl-GSH and in the presence of sl-GSH. The sixth spectrum (Figure 1F) shows the difference spectrum calculated from the spectra in Figure 1C,D. This difference spectrum contains a number of positive and negative features. The positive features represent NMR signals which arise from residues which are within 16 8, of the nitroxide group. The negative features arise from those residues which are further than 17 8, from the active site but undergo a change in chemical environment, and thus a change in chemical shift, due to the binding of sl-GSH.
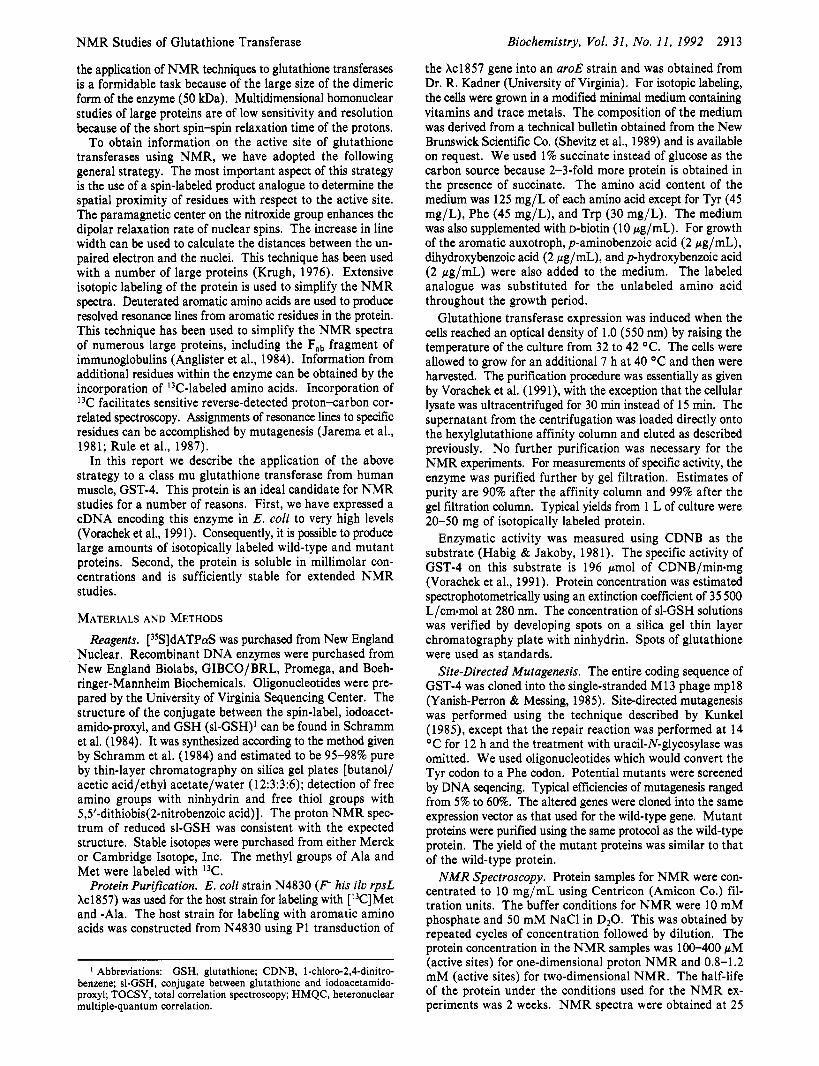
The Tyr resonances were assigned by generating a series of mutant proteins, each of which had a single Tyr replaced with a Phe residue. The specific activities against CDNB for all 12 mutants are given in Table I. With the single exception of Tyr7, these activities were found to be similar to that of the wild-type enzyme. Proton NMR spectra of each mutant protein, labeled to observe the Tyr 3,5-protons, were obtained in the absence of sl-GSH. The proton NMR spectra of all 12 mutant proteins are shown in Figure 2. In 8 of the 12 spectra of the mutant proteins, it is clear that a single line is absent from the NMR spectra (indicated by a solid arrow). For the most part, in each of these eight spectra, the remaining
2916 Biochemistry, Vol. 31, No. 11, 1992
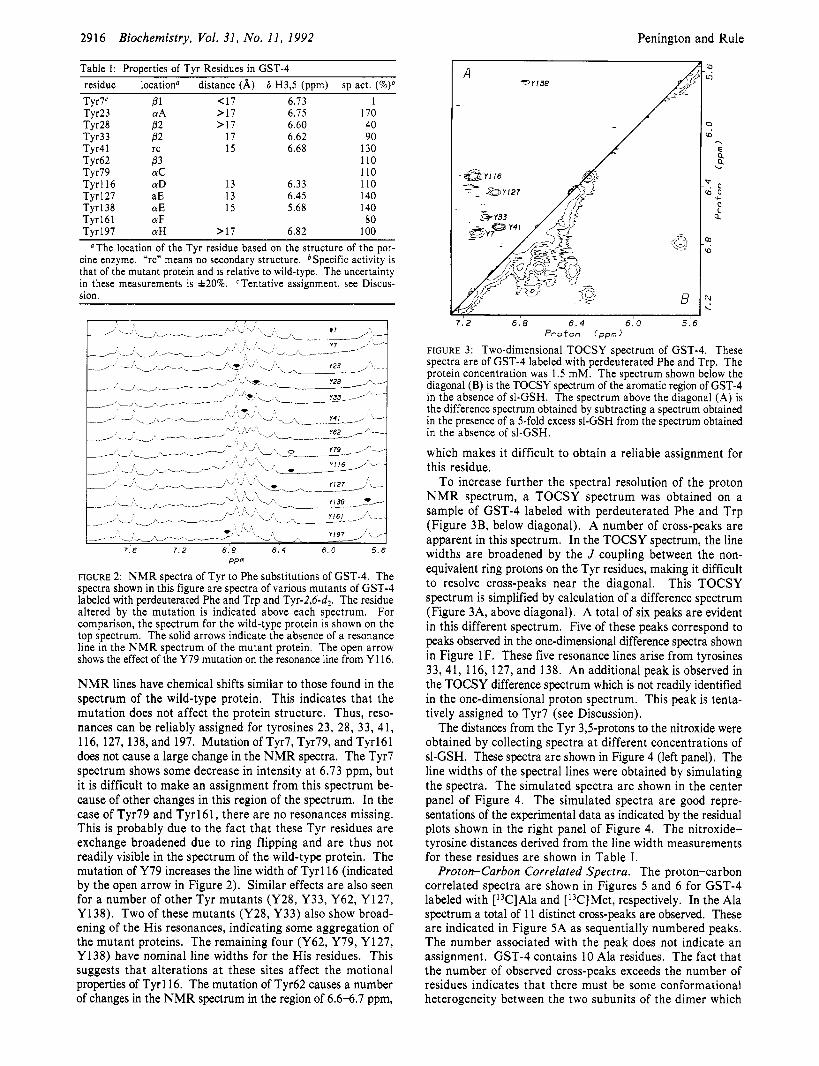
Table I: ProDerties of Tvr Residues in GST-4
Penington and Rule
residue Tyr7' Tyr23 Tyr28 Tyr33 Tyr41 Tyr62 Tyrl9 Tyrll6 Tyr 127 Tyr 138 Tyrl61 Tyr197
location" Pl CYA P2 62 rc P3 CYC CYD aE CYE CYF CYH
distance (A) 6 H3,5 (ppm) sp act. <17 6.73 1 >17 6.75 170 >17 6.60 40
17 6.62 90 15 6.68 130
110 110
13 6.33 110 13 6.45 140 15 5.68 140
80 >17 6.82 100
"The location of the Tyr residue based on the structure of the por- cine enzyme. *rcn means no secondary structure. *Specific activity is that of the mutant protein and is relative to wild-type. The uncertainty in these measurements is f20%. Tentative assignment, see Discus- sion.
- " k c Y V b-4- A
7 6 7.2 6.8 6 . 4 6 0 5 . 6 PPm
FIGURE 2: NMR spectra of Tyr to Phe substitutions of GST-4. The spectra shown in this figure are spectra of various mutants of GST-4 labeled with perdeuterated Phe and Trp and Tyr-2,6-d2. The residue altered by the mutation is indicated above each spectrum. For comparison, the spectrum for the wild-type protein is shown on the top spectrum. The solid arrows indicate the absence of a resonance line in the N M R spectrum of the mutant protein. The open arrow shows the effect of the Y79 mutation on the resonance line from Y116.
NMR lines have chemical shifts similar to those found in the spectrum of the wild-type protein. This indicates that the mutation does not affect the protein structure. Thus, reso- nances can be reliably assigned for tyrosines 23, 28, 33, 41, 116, 127, 138, and 197. Mutation of Tyr7, Tyr79, and Tyrl61 does not cause a large change in the NMR spectra. The Tyr7 spectrum shows some decrease in intensity at 6.73 ppm, but it is difficult to make an assignment from this spectrum be- cause of other changes in this region of the spectrum. In the case of Tyr79 and Tyrl61, there are no resonances missing. This is probably due to the fact that these Tyr residues are exchange broadened due to ring flipping and are thus not readily visible in the spectrum of the wild-type protein. The mutation of Y79 increases the line width of Tyrll6 (indicated by the open arrow in Figure 2). Similar effects are also seen for a number of other Tyr mutants (Y28, Y33, Y62, Y127, Y138). Two of these mutants (Y28, Y33) also show broad- ening of the His resonances, indicating some aggregation of the mutant proteins. The remaining four (Y62, Y79, Y127, Y138) have nominal line widths for the His residues. This suggests that alterations at these sites affect the motional properties of Tyrll6. The mutation of Tyr62 causes a number of changes in the NMR spectrum in the region of 6.6-6.7 ppm,
A e Y I 3 8
a
B
7.2 6.8 6.4 6.0 5 . 6 P r o t o n (ppm)
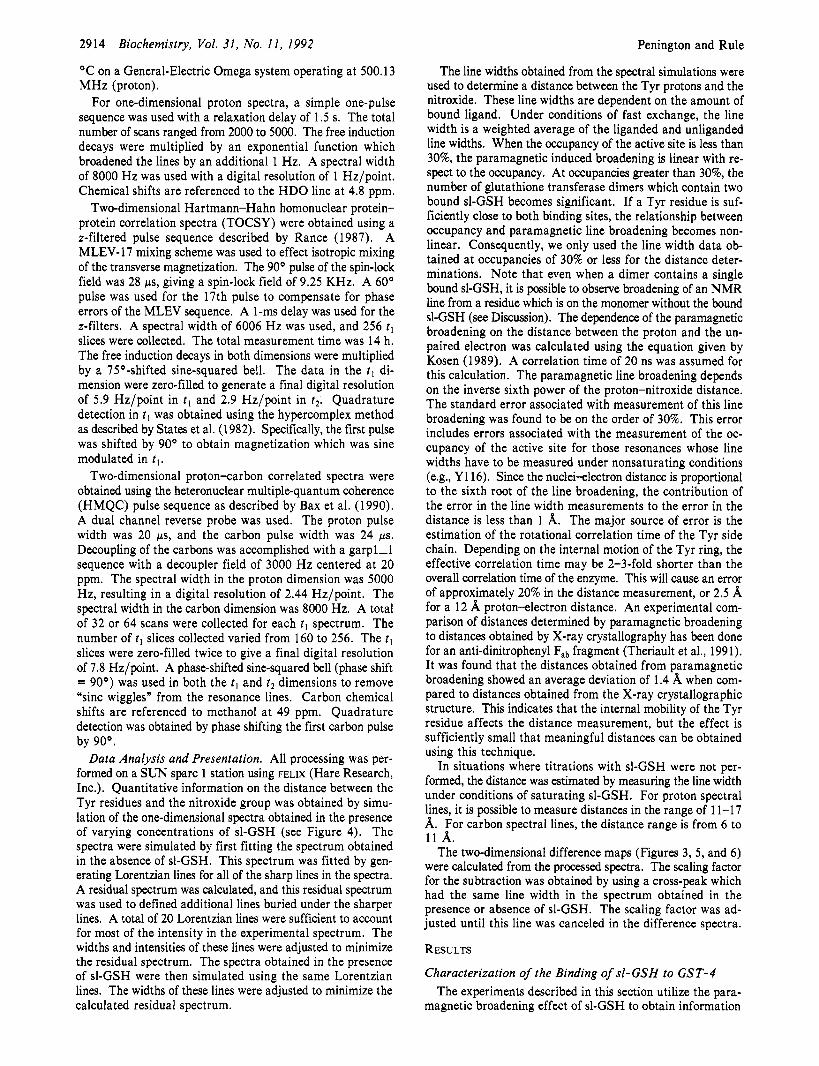
FIGURE 3: Two-dimensional TOCSY spectrum of GST-4. These spectra are of GST-4 labeled with perdeuterated Phe and Trp. The protein concentration was 1.5 mM. The spectrum shown below the diagonal (B) is the TOCSY spectrum of the aromatic region of GST-4 in the absence of sl-GSH. The spectrum above the diagonal (A) is the difference spectrum obtained by subtracting a spectrum obtained in the presence of a 5-fold excess SI-GSH from the spectrum obtained in the absence of SI-GSH.
which makes it difficult to obtain a reliable assignment for this residue.
To increase further the spectral resolution of the proton NMR spectrum, a TOCSY spectrum was obtained on a sample of GST-4 labeled with perdeuterated Phe and Trp (Figure 3B, below diagonal). A number of cross-peaks are apparent in this spectrum. In the TOCSY spectrum, the line widths are broadened by the J coupling between the non- equivalent ring protons on the Tyr residues, making it difficult to resolve cross-peaks near the diagonal. This TOCSY spectrum is simplified by calculation of a difference spectrum (Figure 3A, above diagonal). A total of six peaks are evident in this different spectrum. Five of these peaks correspond to peaks observed in the one-dimensional difference spectra shown in Figure 1 F. These five resonance lines arise from tyrosines 33, 41, 116, 127, and 138. An additional peak is observed in the TOCSY difference spectrum which is not readily identified in the one-dimensional proton spectrum. This peak is tenta- tively assigned to Tyr7 (see Discussion).
The distances from the Tyr 3,5-protons to the nitroxide were obtained by collecting spectra at different concentrations of sl-GSH. These spectra are shown in Figure 4 (left panel). The line widths of the spectral lines were obtained by simulating the spectra. The simulated spectra are shown in the center panel of Figure 4. The simulated spectra are good repre- sentations of the experimental data as indicated by the residual plots shown in the right panel of Figure 4. The nitroxide- tyrosine distances derived from the line width measurements for these residues are shown in Table I .
Proton-Carbon Correlated Spectra. The proton-carbon correlated spectra are shown in Figures 5 and 6 for GST-4 labeled with [13C]Ala and [13C]Met, respectively. In the Ala spectrum a total of 11 distinct cross-peaks are observed. These are indicated in Figure 5A as sequentially numbered peaks. The number associated with the peak does not indicate an assignment. GST-4 contains 10 Ala residues. The fact that the number of observed cross-peaks exceeds the number of residues indicates that there must be some conformational heterogeneity between the two subunits of the dimer which
NMR Studies of Glutathione Transferase Biochemistry, Vol. 31, No. 11, I992 2917
P P m
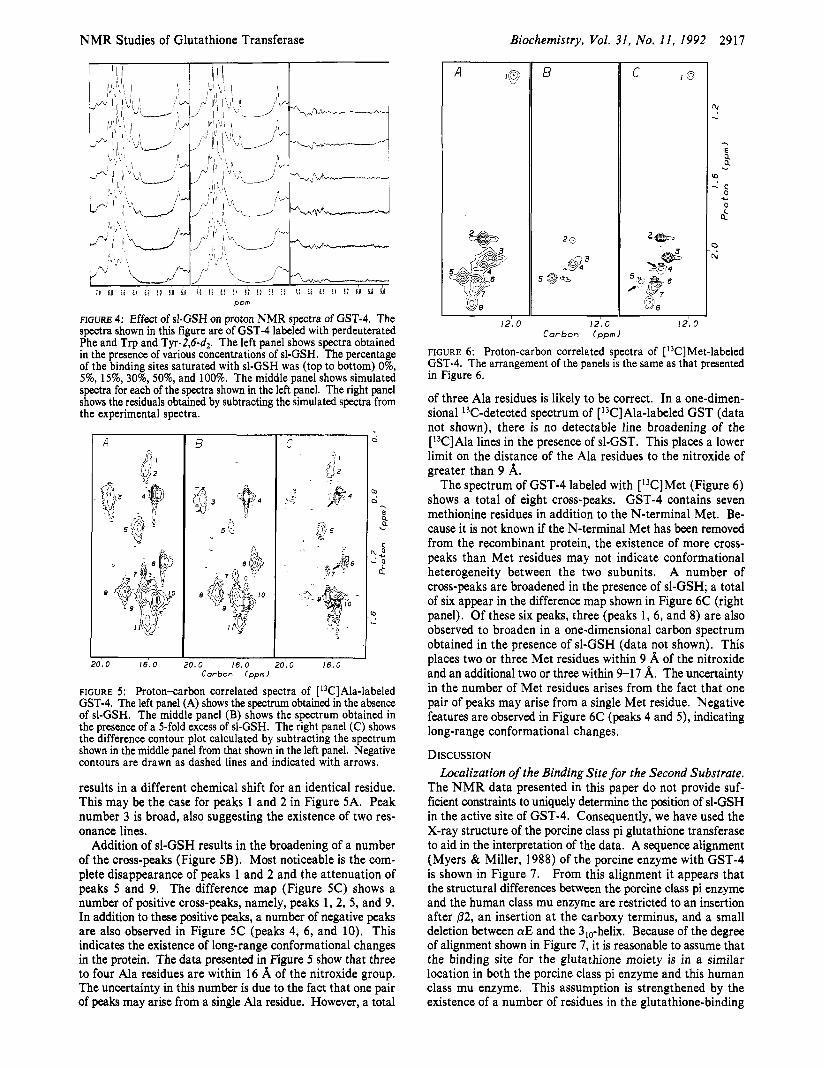
FIGURE 4: Effect of sl-GSH on proton NMR spectra of GST-4. The spectra shown in this figure are of GST-4 labeled with perdeuterated Phe and Trp and Tyr-2,6-d2. The left panel shows spectra obtained in the presence of various concentrations of sl-GSH. The percentage of the binding sites saturated with sl-GSH was (top to bottom) 0%, 5%, 15%, 30%, 50%, and 100%. The middle panel shows simulated spectra for each of the spectra shown in the left panel. The right panel shows the residuals obtained by subtracting the simulated spectra from the experimental spectra.
A
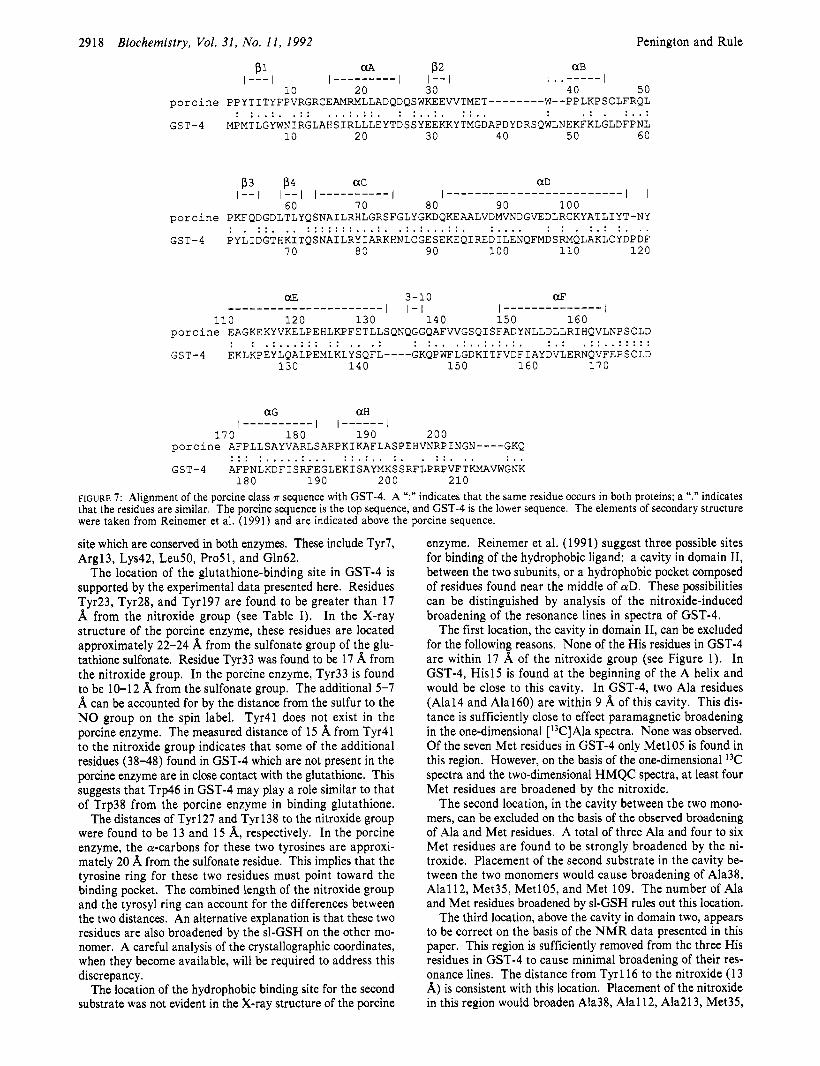
1.0 16.0 ).O 16.0 20.0 16.0 Corbon Ippm)
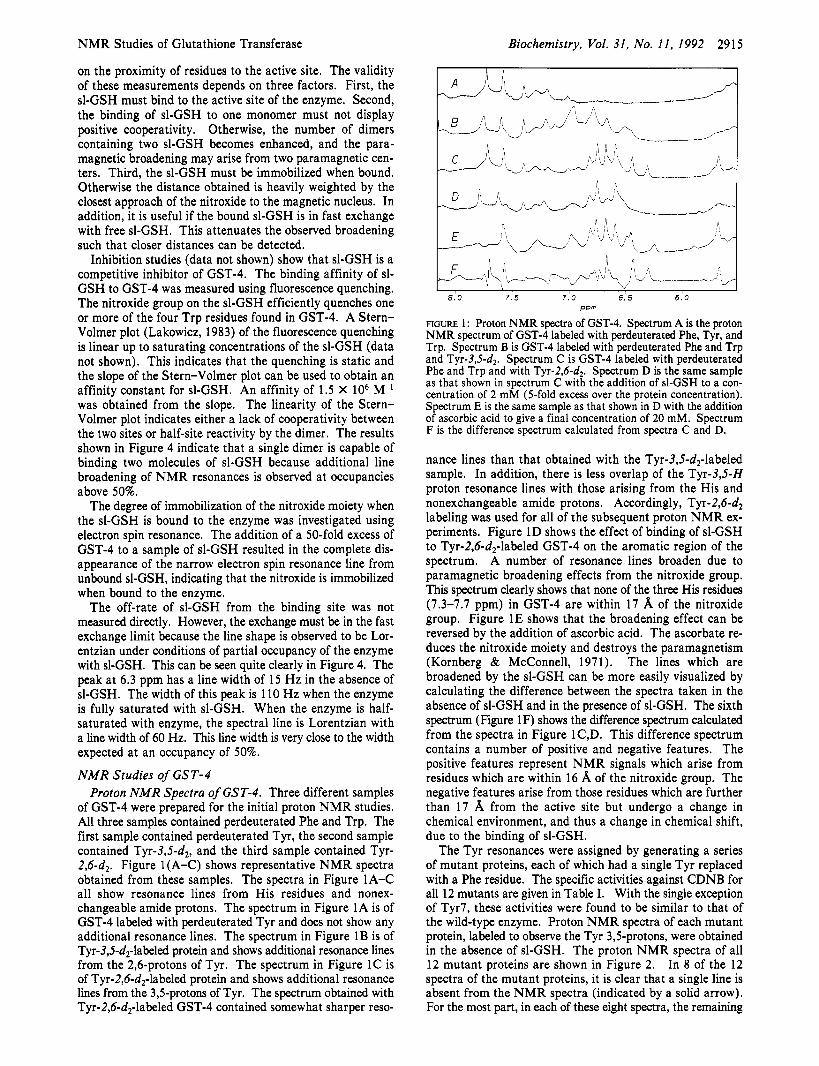
FIGURE 5 : Proton-carbon correlated spectra of [ 13C]Ala-labeled GST-4. The left panel (A) shows the spectrum obtained in the absence of sl-GSH. The middle panel (B) shows the spectrum obtained in the presence of a 5-fold excess of sl-GSH. The right panel (C) shows the difference contour plot calculated by subtracting the spectrum shown in the middle panel from that shown in the left panel. Negative contours are drawn as dashed lines and indicated with arrows.
results in a different chemical shift for an identical residue. This may be the case for peaks 1 and 2 in Figure 5A. Peak number 3 is broad, also suggesting the existence of two res- onance lines.
Addition of sl-GSH results in the broadening of a number of the cross-peaks (Figure 5B). Most noticeable is the com- plete disappearance of peaks 1 and 2 and the attenuation of peaks 5 and 9. The difference map (Figure 5C) shows a number of positive cross-peaks, namely, peaks 1, 2, 5 , and 9. In addition to these positive peaks, a number of negative peaks are also observed in Figure 5C (peaks 4, 6 , and 10). This indicates the existence of long-range conformational changes in the protein. The data presented in Figure 5 show that three to four Ala residues are within 16 A of the nitroxide group. The uncertainty in this number is due to the fact that one pair of peaks may arise from a single Ala residue. However, a total
A 18 C I @
5
/
12'. 0 12.0 I 2 , O Carbon (ppm)
FIGURE 6: Proton-carbon correlated spectra of [ 13C]Met-labeled GST-4. The arrangement of the panels is the same as that presented in Figure 6.
of three Ala residues is likely to be correct. In a one-dimen- sional 13C-detected spectrum of [ 13C]Ala-labeled GST (data not shown), there is no detectable line broadening of the [13C]Ala lines in the presence of sl-GST. This places a lower limit on the distance of the Ala residues to the nitroxide of greater than 9 A.
The spectrum of GST-4 labeled with [13C]Met (Figure 6 ) shows a total of eight cross-peaks. GST-4 contains seven methionine residues in addition to the N-terminal Met. Be- cause it is not known if the N-terminal Met has been removed from the recombinant protein, the existence of more cross- peaks than Met residues may not indicate conformational heterogeneity between the two subunits. A number of cross-peaks are broadened in the presence of sl-GSH; a total of six appear in the difference map shown in Figure 6C (right panel). Of these six peaks, three (peaks 1, 6, and 8) are also observed to broaden in a one-dimensional carbon spectrum obtained in the presence of sl-GSH (data not shown). This places two or three Met residues within 9 A of the nitroxide and an additional two or three within 9-17 A. The uncertainty in the number of Met residues arises from the fact that one pair of peaks may arise from a single Met residue. Negative features are observed in Figure 6C (peaks 4 and 5 ) , indicating long-range conformational changes.
DISCUSSION Localization of the Binding Site for the Second Substrate.
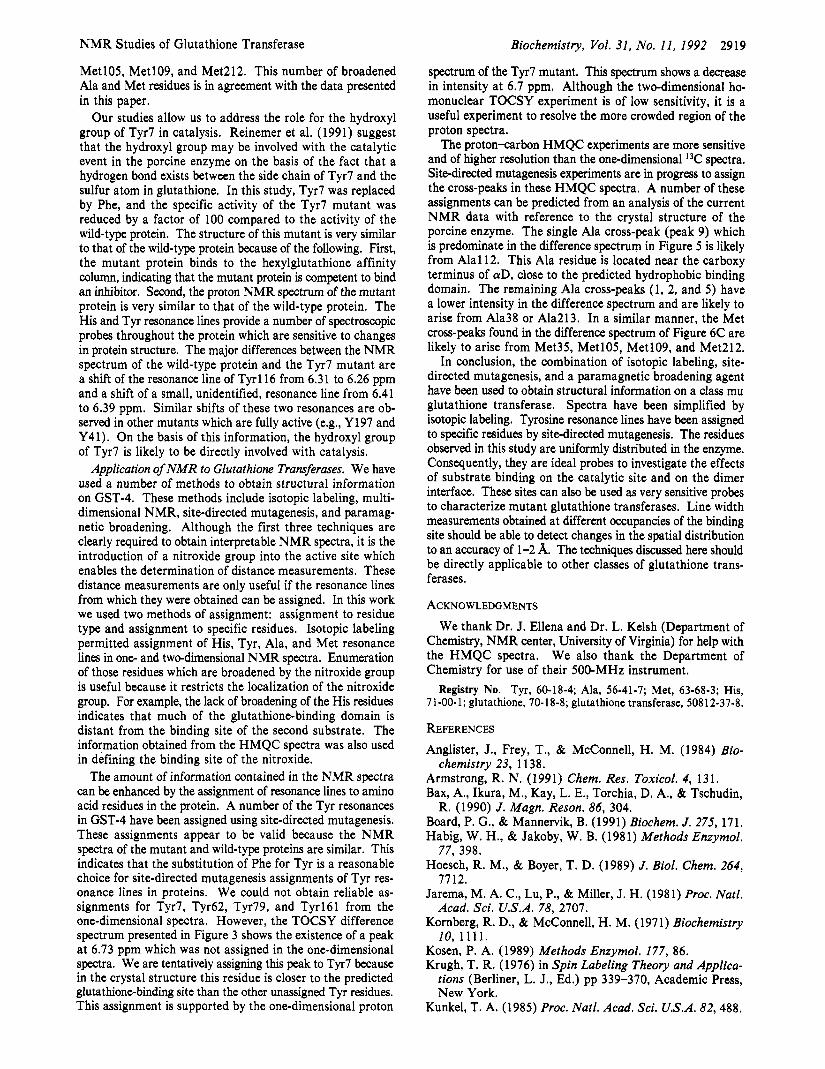
The NMR data presented in this paper do not provide suf- ficient constraints to uniquely determine the position of sl-GSH in the active site of GST-4. Consequently, we have used the X-ray structure of the porcine class pi glutathione transferase to aid in the interpretation of the data. A sequence alignment (Myers & Miller, 1988) of the porcine enzyme with GST-4 is shown in Figure 7. From this alignment it appears that the structural differences between the porcine class pi enzyme and the human class mu enzyme are restricted to an insertion after p2, an insertion at the carboxy terminus, and a small deletion between aE and the 3,,-helix. Because of the degree of alignment shown in Figure 7, it is reasonable to assume that the binding site for the glutathione moiety is in a similar location in both the porcine class pi enzyme and this human class mu enzyme. This assumption is strengthened by the existence of a number of residues in the glutathione-binding
2918 Biochemistry, Vol. 31, No. 11, I992 Penington and Rule
aB I 1 , . - - - - - M P2
I _ _ _ - - _ - _ - ) I -- I P I
I --- I 10 20 30 40 50
p o r c i n e PPYTITYFPVRGRCEAMRMLLADQDQSWKEEVVTMET--------W--PPLKPSCLFRQL
GST-4 MPMTLGYWNIRGLAHSIRLLLEYTDSSYEEKKYTMGDAPDYDRSQWLNEKFKLGLDFPNL . . . . . . . . . . . . . . . . . . . . . . . . . . . . . . . . . . . . . . . . . . . . . . . . .
10 20 30 40 50 60
C?C aD I _ _ _ _ _ _ _ _ _ _ _ _ _ _ _ _ _ _ _ _ _ _ _ _ _ I 1
P3 I34 / - _ I [ - - I 1 _ _ _ _ _ _ - - _ _ 1 60 70 8 0 90 100
p o r c i n e PKFQDGDLTLYQSNAILRHLGRSFGLYGKDQKEAALVDMVNDGVEDLRCKYATLIYT-NY . . . . . . . . . . . . . . . . . . . . . . . . . . . . . . . . . . . . . . . . . . . . . . . . . . . . . . . . . . . . . . GST-4 PYLIDGTHKITQSNAILRYIARKHNLCGESEKEQIREDILENQFMDS~QLAKLCYDPDF
IO 80 90 100 110 120
aE 3-10 aF I 1 - 1 ( _ _ _ _ _ _ _ _ _ _ _ _ _ _ I ___________--_-___----
110 120 130 140 150 160 p o r c i n e EAGKEKYVKELPEHLKPFETLLSQNQGGQAFVVGSQISFADYNLLDLLRIHQVLNPSCLD
GST-4 EKLKPEYLQALPEMLKLYSQFL----GKQPWFLGDKITFVDFIAYDVLERNQVFEPSCLD . . . . . . . . . . * e . . . . . . . . . . . . . . . . . . . . . . . . . . . . . . . . . . . . . . . . . . . . . . . . . . . . . .
130 140 150 160 1 1 0
aG aH / _ _ _ _ _ _ _ _ _ _ I 1 _ - _ _ _ - 1
170 180 190 2 0 0 p o r c i n e AFPLLSAYVARLSARPKIKAFLASPEHVNRPINGN----GKQ . . . . . . . . . . . . . . . . . . . . . . . . . . . . . . . . . . . . . . . GST-4 AFPNLKDFISRFEGLEKISAYMKSSRFLPRPVFTKMAVWGNK
180 190 200 210 FIGURE 7: Alignment of the porcine class A sequence with GST-4. A ":" indicates that the same residue occurs in both proteins; a "." indicates that the residues are similar. The porcine sequence is the top sequence, and GST-4 is the lower sequence. The elements of secondary structure were taken from Reinemer et al. (1991) and are indicated above the porcine sequence.
site which are conserved in both enzymes. These include Tyr7, Argl3, Lys42, Leu50, Pro51, and Gln62.
The location of the glutathione-binding site in GST-4 is supported by the experimental data presented here. Residues Tyr23, Tyr28, and Tyr197 are found to be greater than 17 8, from the nitroxide group (see Table I). In the X-ray structure of the porcine enzyme, these residues are located approximately 22-24 8, from the sulfonate group of the glu- tathione sulfonate. Residue Tyr33 was found to be 17 8, from the nitroxide group. In the porcine enzyme, Tyr33 is found to be 10-12 8, from the sulfonate group. The additional 5-7 8, can be accounted for by the distance from the sulfur to the NO group on the spin label. Tyr41 does not exist in the porcine enzyme. The measured distance of 15 8, from Tyr41 to the nitroxide group indicates that some of the additional residues (38-48) found in GST-4 which are not present in the porcine enzyme are in close contact with the glutathione. This suggests that Trp46 in GST-4 may play a role similar to that of Trp38 from the porcine enzyme in binding glutathione.
The distances of Tyr127 and Tyr138 to the nitroxide group were found to be 13 and 15 A, respectively. In the porcine enzyme, the a-carbons for these two tyrosines are approxi- mately 20 8, from the sulfonate residue. This implies that the tyrosine ring for these two residues must point toward the binding pocket. The combined length of the nitroxide group and the tyrosyl ring can account for the differences between the two distances. An alternative explanation is that these two residues are also broadened by the sl-GSH on the other mo- nomer. A careful analysis of the crystallographic coordinates, when they become available, will be required to address this discrepancy.
The location of the hydrophobic binding site for the second substrate was not evident in the X-ray structure of the porcine
enzyme. Reinemer et al. (1991) suggest three possible sites for binding of the hydrophobic ligand: a cavity in domain 11, between the two subunits, or a hydrophobic pocket composed of residues found near the middle of aD. These possibilities can be distinguished by analysis of the nitroxide-induced broadening of the resonance lines in spectra of GST-4.
The first location, the cavity in domain 11, can be excluded for the following reasons. None of the His residues in GST-4 are within 17 8, of the nitroxide group (see Figure 1). In GST-4, His15 is found at the beginning of the A helix and would be close to this cavity. In GST-4, two Ala residues (Ala14 and Ala160) are within 9 8, of this cavity. This dis- tance is sufficiently close to effect paramagnetic broadening in the one-dimensional [I3C]Ala spectra. None was observed. Of the seven Met residues in GST-4 only Met105 is found in this region. However, on the basis of the one-dimensional 13C spectra and the two-dimensional HMQC spectra, at least four Met residues are broadened by the nitroxide.
The second location, in the cavity between the two mono- mers, can be excluded on the basis of the observed broadening of Ala and Met residues. A total of three Ala and four to six Met residues are found to be strongly broadened by the ni- troxide. Placement of the second substrate in the cavity be- tween the two monomers would cause broadening of Ala38, Alal 12, Met35, MetlO5, and Met 109. The number of Ala and Met residues broadened by sl-GSH rules out this location.
The third location, above the cavity in domain two, appears to be correct on the basis of the NMR data presented in this paper. This region is sufficiently removed from the three His residues in GST-4 to cause minimal broadening of their res- onance lines. The distance from Tyr 1 16 to the nitroxide (1 3 A) is consistent with this location. Placement of the nitroxide in this region would broaden Ala38, Alal 12, Ala213, Met35,
NMR Studies of Glutathione Transferase
MetlO5, Metl09, and Met212. This number of broadened Ala and Met residues is in agreement with the data presented in this paper.
Our studies allow us to address the role for the hydroxyl group of Tyr7 in catalysis. Reinemer et al. (1991) suggest that the hydroxyl group may be involved with the catalytic event in the porcine enzyme on the basis of the fact that a hydrogen bond exists between the side chain of Tyr7 and the sulfur atom in glutathione. In this study, Tyr7 was replaced by Phe, and the specific activity of the Tyr7 mutant was reduced by a factor of 100 compared to the activity of the wild-type protein. The structure of this mutant is very similar to that of the wild-type protein because of the following. First, the mutant protein binds to the hexylglutathione affinity column, indicating that the mutant protein is competent to bind an inhibitor. Second, the proton NMR spectrum of the mutant protein is very similar to that of the wild-type protein. The His and Tyr resonance lines provide a number of spectroscopic probes throughout the protein which are sensitive to changes in protein structure. The major differences between the NMR spectrum of the wild-type protein and the Tyr7 mutant are a shift of the resonance line of Tyrl l6 from 6.31 to 6.26 ppm and a shift of a small, unidentified, resonance line from 6.41 to 6.39 ppm. Similar shifts of these two resonances are ob- served in other mutants which are fully active (e.g., Y197 and Y41). On the basis of this information, the hydroxyl group of Tyr7 is likely to be directly involved with catalysis.
Application of NMR to Glutathione Transferases. We have used a number of methods to obtain structural information on GST-4. These methods include isotopic labeling, multi- dimensional NMR, site-directed mutagenesis, and paramag- netic broadening. Although the first three techniques are clearly required to obtain interpretable NMR spectra, it is the introduction of a nitroxide group into the active site which enables the determination of distance measurements. These distance measurements are only useful if the resonance lines from which they were obtained can be assigned. In this work we used two methods of assignment: assignment to residue type and assignment to specific residues. Isotopic labeling permitted assignment of His, Tyr, Ala, and Met resonance lines in one- and two-dimensional NMR spectra. Enumeration of those residues which are broadened by the nitroxide group is useful because it restricts the localization of the nitroxide group. For example, the lack of broadening of the His residues indicates that much of the glutathione-binding domain is distant from the binding site of the second substrate. The information obtained from the HMQC spectra was also used in defining the binding site of the nitroxide.
The amount of information contained in the NMR spectra can be enhanced by the assignment of resonance lines to amino acid residues in the protein. A number of the Tyr resonances in GST-4 have been assigned using site-directed mutagenesis. These assignments appear to be valid because the NMR spectra of the mutant and wild-type proteins are similar. This indicates that the substitution of Phe for Tyr is a reasonable choice for site-directed mutagenesis assignments of Tyr res- onance lines in proteins. We could not obtain reliable as- signments for Tyr7, Tyr62, Tyr79, and Tyrl61 from the one-dimensional spectra. However, the TOCSY difference spectrum presented in Figure 3 shows the existence of a peak at 6.73 ppm which was not assigned in the one-dimensional spectra. We are tentatively assigning this peak to Tyr7 because in the crystal structure this residue is closer to the predicted glutathione-binding site than the other unassigned Tyr residues. This assignment is supported by the one-dimensional proton
Biochemistry, Vol. 31, No. 11, 1992 2919
spectrum of the Tyr7 mutant. This spectrum shows a decrease in intensity a t 6.7 ppm. Although the two-dimensional ho- monuclear TOCSY experiment is of low sensitivity, it is a useful experiment to resolve the more crowded region of the proton spectra.
The proton-carbon HMQC experiments are more sensitive and of higher resolution than the one-dimensional 13C spectra. Site-directed mutagenesis experiments are in progress to assign the cross-peaks in these HMQC spectra. A number of these assignments can be predicted from an analysis of the current NMR data with reference to the crystal structure of the porcine enzyme. The single Ala cross-peak (peak 9) which is predominate in the difference spectrum in Figure 5 is likely from Ala1 12. This Ala residue is located near the carboxy terminus of aD, close to the predicted hydrophobic binding domain. The remaining Ala cross-peaks (1, 2, and 5 ) have a lower intensity in the difference spectrum and are likely to arise from Ala38 or Ala213. In a similar manner, the Met cross-peaks found in the difference spectrum of Figure 6C are likely to arise from Met35, MetlO5, Metl09, and Met212.
In conclusion, the combination of isotopic labeling, site- directed mutagenesis, and a paramagnetic broadening agent have been used to obtain structural information on a class mu glutathione transferase. Spectra have been simplified by isotopic labeling. Tyrosine resonance lines have been assigned to specific residues by site-directed mutagenesis. The residues observed in this study are uniformly distributed in the enzyme. Consequently, they are ideal probes to investigate the effects of substrate binding on the catalytic site and on the dimer interface. These sites can also be used as very sensitive probes to characterize mutant glutathione transferases. Line width measurements obtained at different occupancies of the binding site should be able to detect changes in the spatial distribution to an accuracy of 1-2 A. The techniques discussed here should be directly applicable to other classes of glutathione trans- ferases.
ACKNOWLEDGMENTS We thank Dr. J. Ellena and Dr. L. Kelsh (Department of
Chemistry, NMR center, University of Virginia) for help with the HMQC spectra. We also thank the Department of Chemistry for use of their 500-MHz instrument.
Registry No. Tyr, 60-18-4; Ala, 56-41-7; Met, 63-68-3; His, 71-00-1; glutathione, 70-18-8; glutathione transferase, 50812-37-8.
REFERENCES Anglister, J., Frey, T., & McConnell, H. M. (1984) Bio-
Armstrong, R. N. (1991) Chem. Res. Toxicol. 4, 131. Bax, A., Ikura, M., Kay, L. E., Torchia, D. A., & Tschudin,
Board, P. G., & Mannervik, B. (1991) Biochem. J . 275, 171. Habig, W. H., & Jakoby, W. B. (1981) Methods Enzymol.
Hoesch, R. M., & Boyer, T. D. (1989) J . Biol. Chem. 264,
Jarema, M. A. C., Lu, P., & Miller, J. H. (1981) Proc. Natl.
Kornberg, R. D., & McConnell, H. M. (197 1) Biochemistry
Kosen, P. A. (1989) Methods Enzymol. 177, 86. Krugh, T. R. (1976) in Spin Labeling Theory and Applica-
tions (Berliner, L. J., Ed.) pp 339-370, Academic Press, New York.
Kunkel, T. A. (1985) Proc. Natl. Acad. Sci. U.S.A. 82,488.
chemistry 23, 1138.
R. (1990) J . Magn. Reson. 86, 304.
77, 398.
7712.
Acad. Sci. U.S.A. 78, 2107.
10, 1111.
2920 Biochemistry 1992, 31, 2920-2926
Lakowicz, J . R. (1983) Principles of Fluorescence Spectros-
Mannervik, B., & Danielson, U. H. (1988) CRC Crit. Rev.
Meyer, D. J., Coles, B., Pemble, S. E., Kilmore, K. S. , Fraser,
Myers, E. & Miller, W. (1988) in Optimal Alignments in
Rance, M. (1987) J . Magn. Reson. 74, 557. Reinemer, P., Dirr, H. W., Ladenstein, R., Schaffer, J., Gallay,
O., & Huber, R. (1991) EMBO J. 10, 1997. Rule, G. S . , Pratt, E. A,, Simplaceanu, V., & Ho, C. (1987)
Biochemistry 26, 549. Schramm, V. L., McCluskey, R., Emig, F. A,, & Litwack, G.
(1984) J. Biol. Chem. 259, 714. Seidegard, J., Vorachek, W. R., Pero, R. W., & Pearson, W.
R. (1988) Proc. Natl. Acad. Sci. U.S.A. 85, 7293. Shevitz, J., Eppstein, L., & Yang, X.-M. (1989) Application
report of increased biomass production in a 2.5 liter Biojlo 111 benchtop fermentor, New Brunswick Scientific Co., Edison, NJ.
copy, Plenum Press, New York.
Biochem. 23, 283.
G. H., & Ketterer, B. (1991) Biochem. J. 274, 409.
Linear Space, Comput. Appl. Biosci. 4, 11.
Smith, M. T., Evans, C. G., Doane-Setzer, P., Castro, V. M., Tahir, M. K., & Mannervik, B. (1989) Cancer Res. 49, 2621.
States, D. J., Haberkorn, R. A., & Ruben, D. J. (1982) J. Magn. Reson. 48, 286.
Stenberg, G., Board, P. G., Carlberg, I, & Mannervik, B. (1991) Biochem. J. 274, 549.
Strange, R. C., Matharoo, B., Fanlder, G. C., Jones, P., Cotton, W., Elder, J . B., & Deakin, M. (1991) Carcino- genesis 12, 25.
Theriault, T. P., Leahy, D. J., Levitt, M., McConnell, H. M., & Rule, G. S . (1991) J. Mol. Biol. 221, 257.
Vorachek, W. R., Pearson, W. R., & Rule, G. S . (1991) Proc. Natl. Acad. Sci. U.S.A. 88, 4443.
Wang, R. W., Newton, D. J., Pickett, C. B., & Lu, A. Y. H. (1991) Arch. Biochem. Biophys. 286, 574.
Wattenberg, L. W. (1972) J. Natl. Cancer Inst. 48, 1425. Wiithrich, K. (1986) N M R of Proteins and Nucleic Acids,
Yanisch-Perron, C., & Messing, J. (1985) Gene 33, 103. Zhang, P., & Armstrong, R. N. (1990) Biopolymers 29, 159.
Wiley, New York.
A Retinyl Ester Hydrolase Activity Intrinsic to the Brush Border Membrane of Rat Small Intestine?
Kevin M. Rigtrup and David E. Ong* Department of Biochemistry, Vanderbilt University, Nashville, Tennessee 37232
Received October 31, 1991; Revised Manuscript Received January 6, 1992
ABSTRACT: Retinol esterified with long-chain fatty acids is a common dietary source of vitamin A. Hydrolysis of these esters in the lumen of the small intestine is required prior to absorption. Bile salt-stimulated retinyl esterase activity was present with purified rat intestinal brush border membrane, with the maximum rate of ester hydrolysis a t approximately pH 8, the physiological luminal pH. Taurocholate, a trihydroxy bile salt, stimulated hydrolysis of short-chain fatty acyl retinyl esters more than hydrolysis of long-chain fatty acyl esters. Deoxycholate, a dihydroxy bile salt, primarily stimulated hydrolysis of long-chain esters. Calculated K,s of 0.74 pM for retinyl palmitate (16:O) hydrolysis and 9.6 pM for retinyl caproate (6:O) hydrolysis suggested the presence of two separate activities. Consistent with that, the activity responsible for retinyl caproate hydrolysis could be inactivated to a greater degree than retinyl palmitate hydrolysis by preincubation of the brush border membrane a t 37 OC for extended times. Brush border membrane from animals who had undergone common duct ligation 48 h prior to tissue collection showed little ability to hydrolyze retinyl caproate but retained 70% of retinyl palmitate hydrolytic activity, compared to sham-operated controls. Thus, two distinguishable retinyl esterase activities were recovered with purified brush border membranes. One apparently originated from the pancreas, was stimulated by trihydroxy bile salts, and preferentially hydrolyzed short-chain retinyl esters, properties similar to cholesterol ester hydrolase, known to bind to the brush border. The other was intrinsic to the brush border, stimulated by both trihydroxy and dihydroxy bile salts, and preferentially hydrolyzed long-chain retinyl esters, providing the majority of activity of the brush border against dietary retinyl esters.
I t a m i n A is a fat-soluble vitamin required for normal vision (Morton, 1972), spermatogenesis (Mason, 1933), and dif- ferentiation of epithelial cells (Wolbach & Howe, 1925). Vitamin A is found in the diet either as provitamin carotenes from plants or as fatty acyl esters of retinol (vitamin A alcohol) from animal tissue. P-Carotene appears to be absorbed intact by passive diffusion at the intestinal brush border (Hollander & Ruble, 1978), but retinyl esters cannot be absorbed as such. In vitro and in vivo studies with rats have shown that hydrolysis
'This work was supported by NIH Grant DK32642.
of retinyl esters to fatty acid and retinol is necessary in order for absorption to occur (Mahadevan et al., 1963a,b). Retinol then crosses the brush border membrane of the absorptive cell (enterocyte) by what is thought to be carrier-mediated passive diffusion (Hollander & Muraldihara, 1977; Said et al., 1988).
This necessary hydrolysis of retinyl esters is generally as- sumed to be carried out in the lumen of the small intestine by pancreatic enzymes [reviewed in Goodman and Blaner (1984)l. Two enzymes that can hydrolyze retinyl esters have been identified in rat pancreatic juice (Erlanson & Borgstrom, 1968). One of these activities was bile salt stimulated and was
0006-2960/92/043 1-2920$03.00/0 0 1992 American Chemical Society