maps map projections types of maps. map projections what is the most accurate representation of the...
TRANSCRIPT
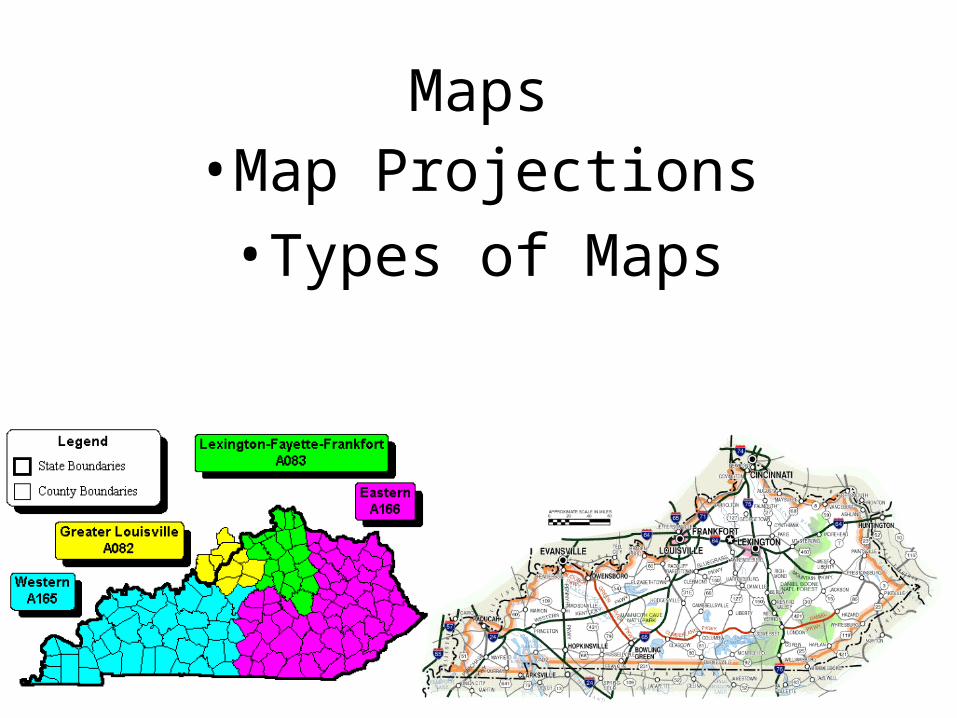
Maps•Map Projections•Types of Maps
Map Projections
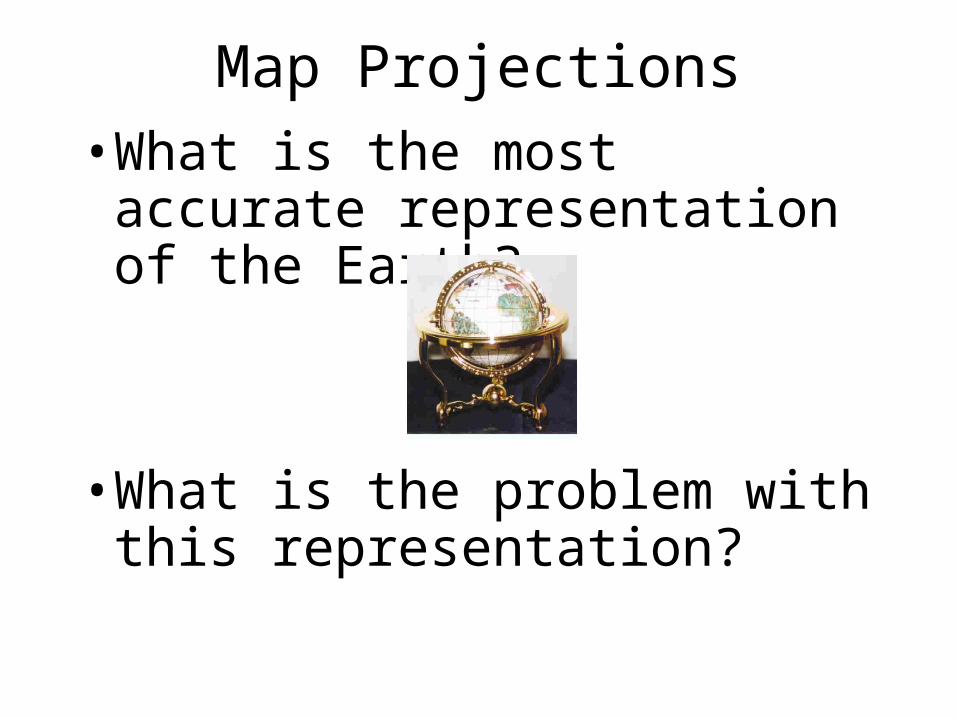
•What is the most accurate representation of the Earth?
•What is the problem with this representation?
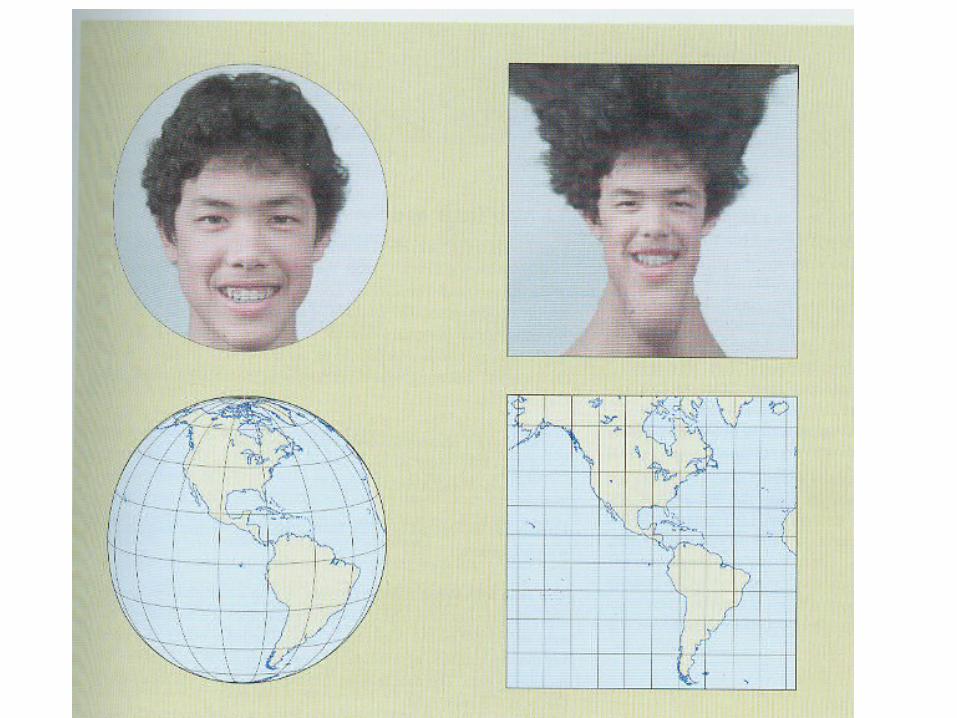
•Map projections-ways of showing round Earth on flat maps.
•Using a flat map causes distortion—usually size, shapes, distance.

Types of Projections
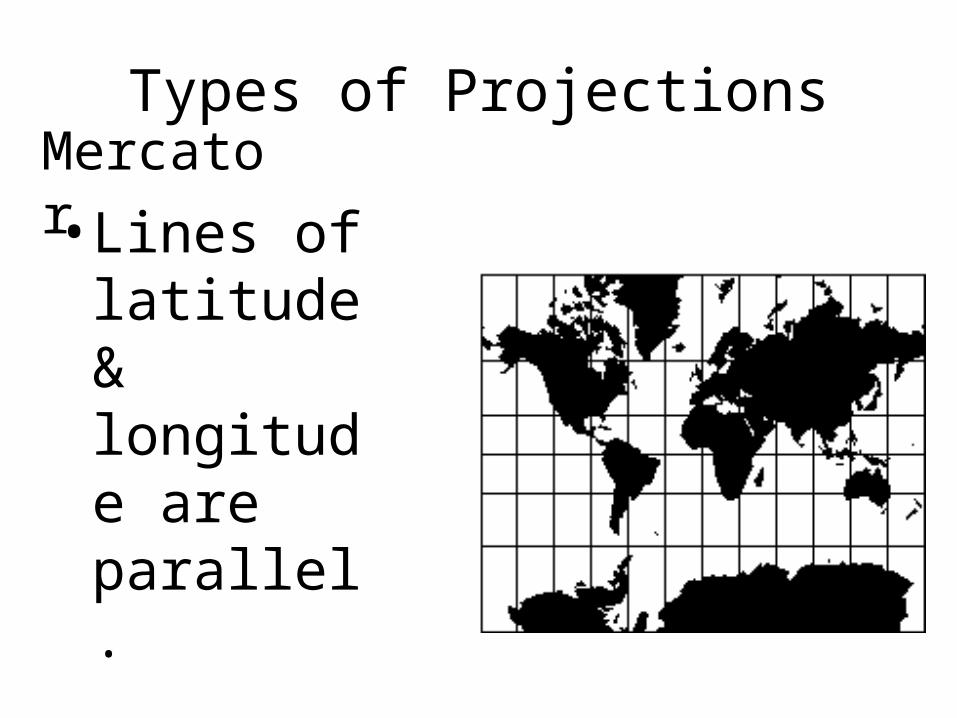
•Lines of latitude & longitude are parallel.
Mercator

•Cylindrical Projection-•Useful for navigation because it shows true direction
•Disadvantages-landmasses near poles look larger than they are
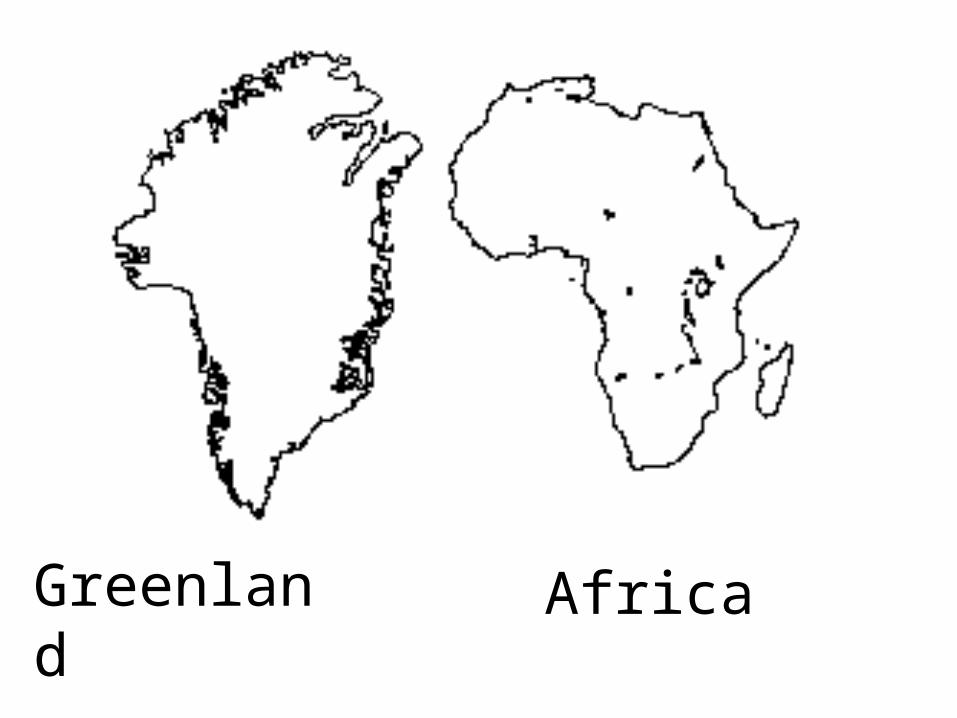
Greenland
Africa
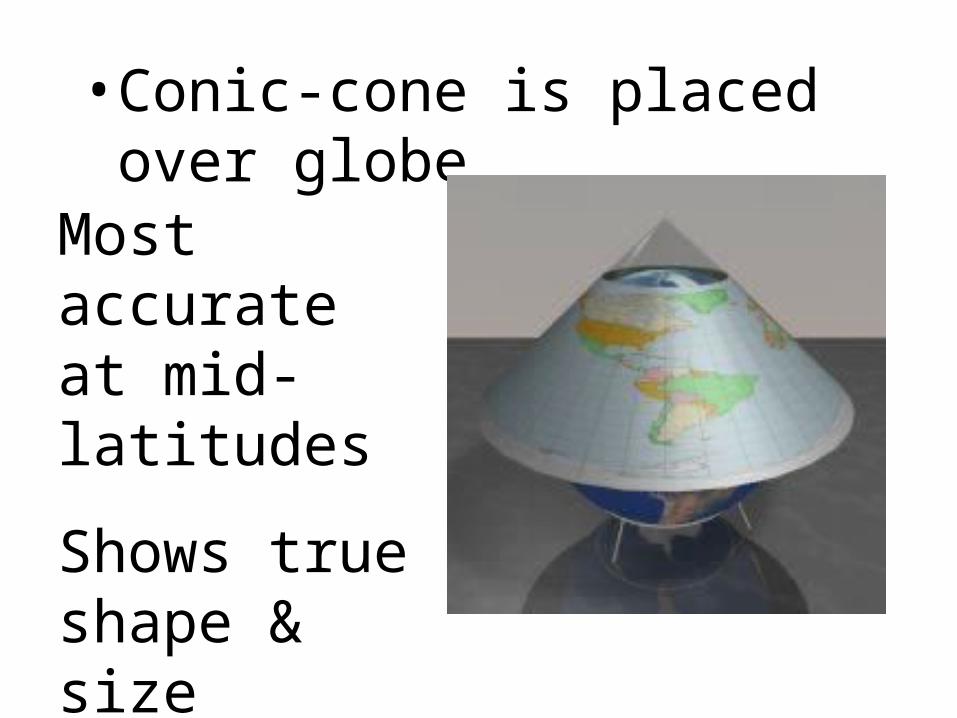
•Conic-cone is placed over globe
Most accurate at mid-latitudes
Shows true shape & size

•Used to show east/west orientation
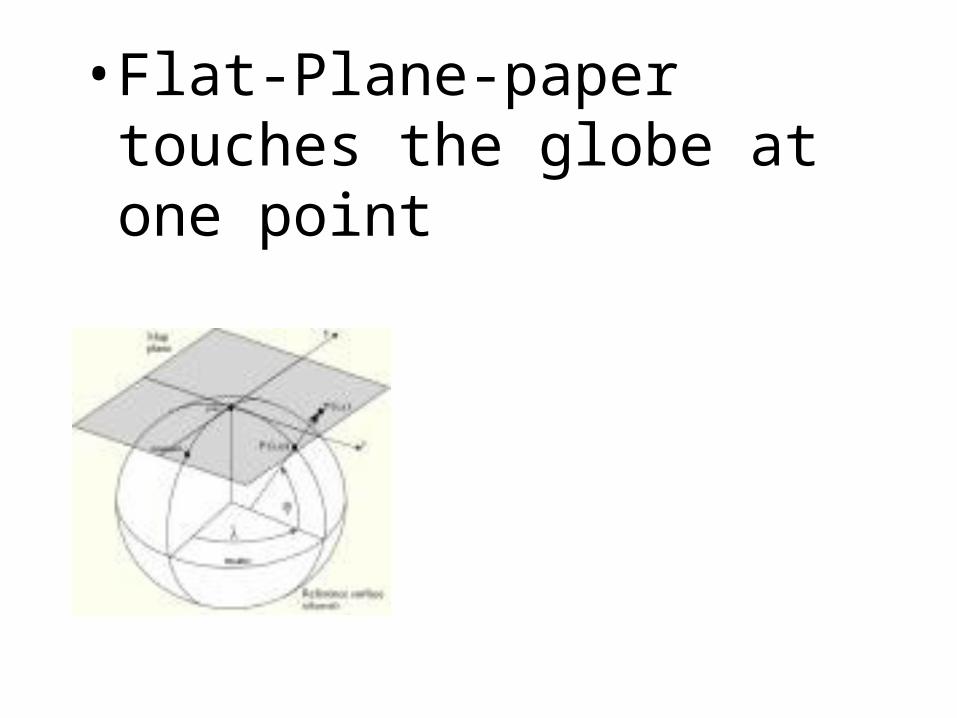
•Flat-Plane-paper touches the globe at one point
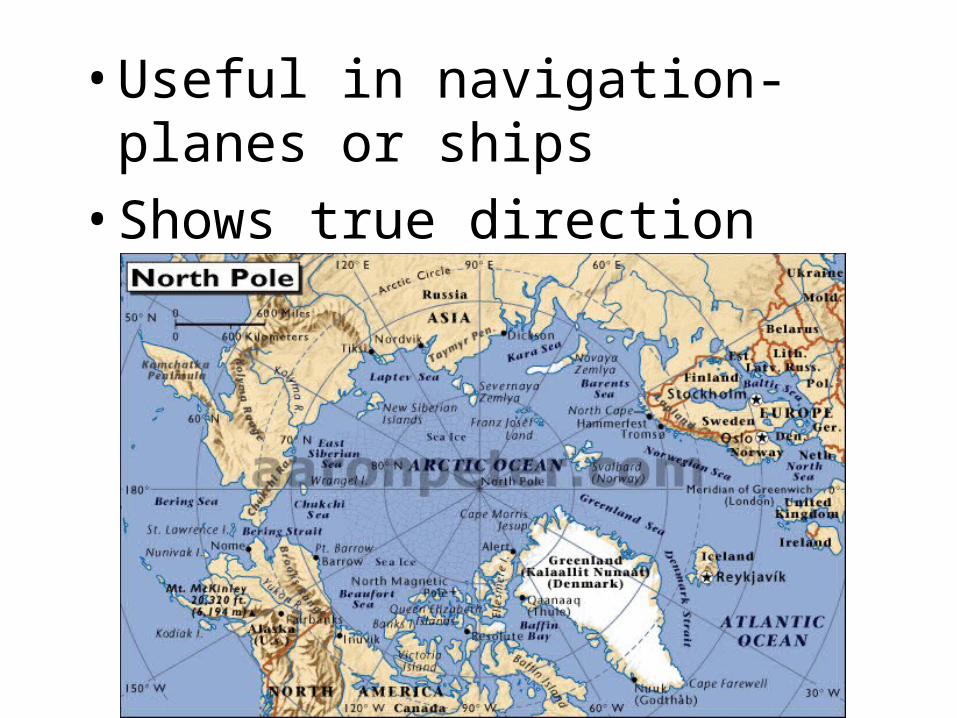
•Useful in navigation-planes or ships
•Shows true direction

• Gall-Peters Projection
•Sizes of landmasses are accurate
•Shapes look odd•Used by the United Nations
•Distances are not accurate
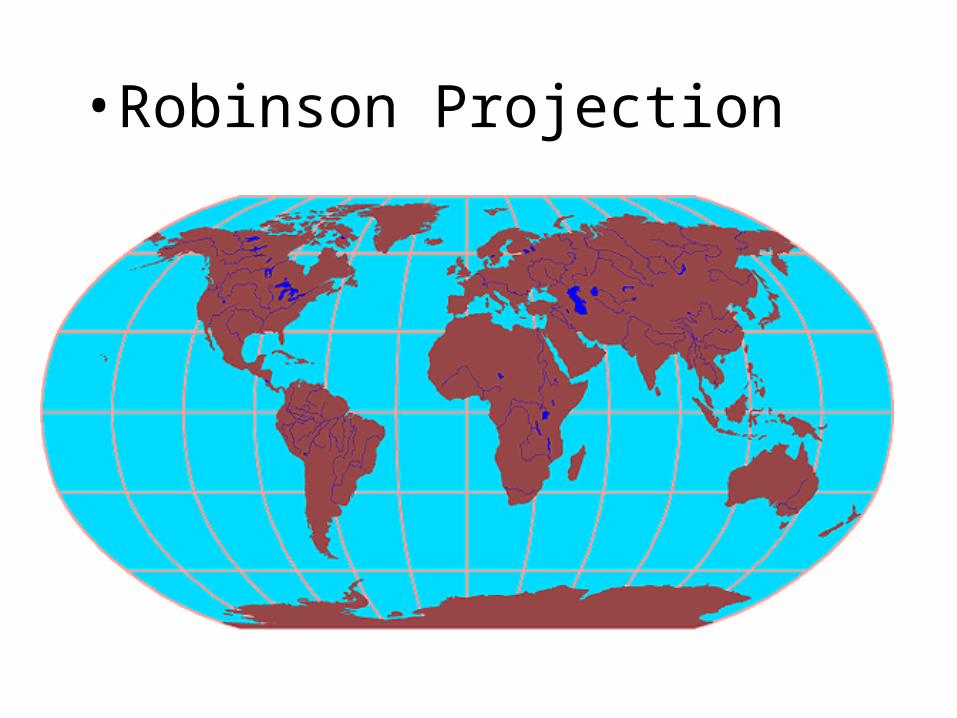
•Robinson Projection
•Lines of longitude converge at the poles
•Reduces distortions of Mercator
•Poles are not same length as equator
What is a map?
A map is a representation, usually on a flat surface, of the features of an area of the earth or a portion of the heavens, showing them in their respective forms, sizes, and relationships according to some convention of representation.
Now what does that mean?
A map is a representation, A map is a drawing or model
usually on a flat surface, of a round Earth on a flat surface,
of the features of an area of the earth that shows the landforms (mountains, rivers, etc.)
or a portion of the heavens, or part of the sky in a particular region,
showing them in their respective forms, sizes, and relationships
drawn to scale
according to some convention of representation.using an accepted form of drawing or model.
Types of Maps
There are three basic types of maps:
PHYSICAL POLITICAL
and THEMATIC.
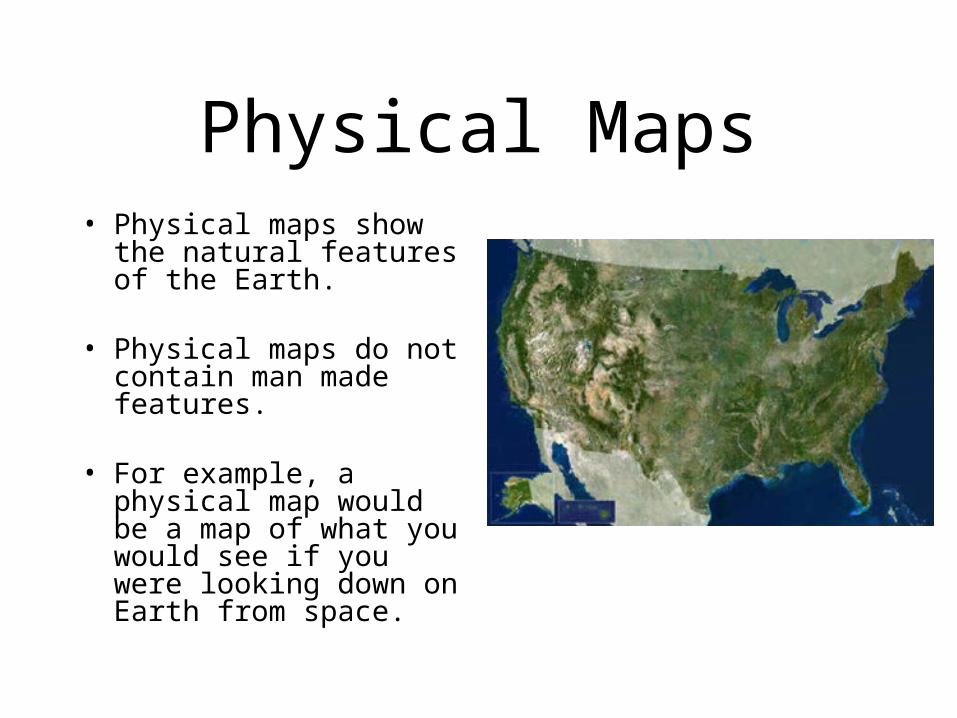
Physical Maps• Physical maps show
the natural features of the Earth.
• Physical maps do not contain man made features.
• For example, a
physical map would be a map of what you would see if you were looking down on Earth from space.
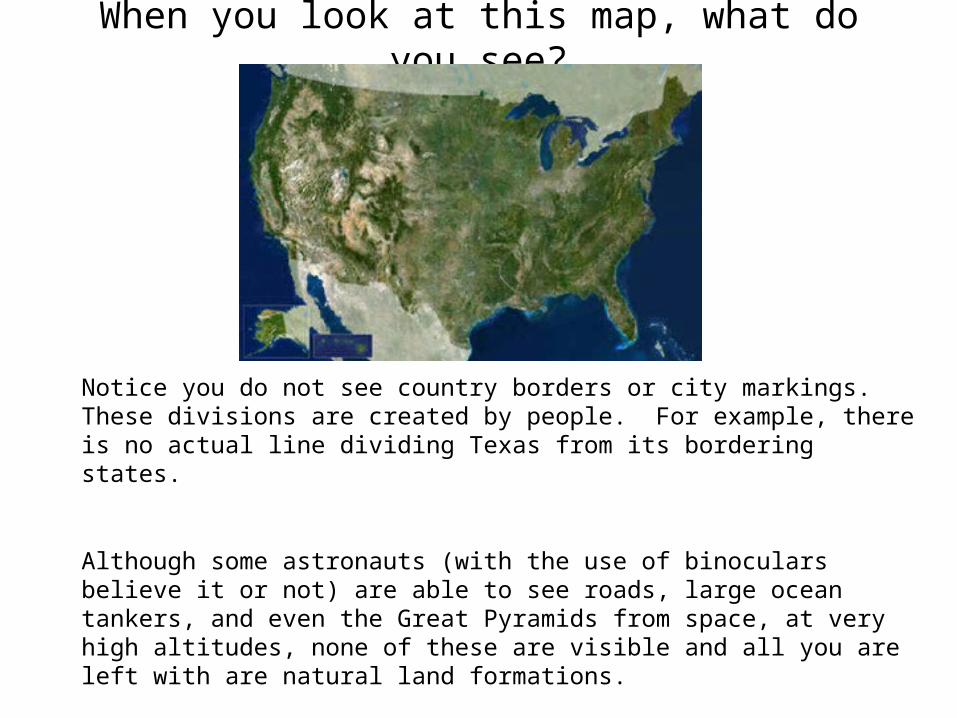
When you look at this map, what do you see?
Notice you do not see country borders or city markings. These divisions are created by people. For example, there is no actual line dividing Texas from its bordering states.
Although some astronauts (with the use of binoculars believe it or not) are able to see roads, large ocean tankers, and even the Great Pyramids from space, at very high altitudes, none of these are visible and all you are left with are natural land formations.
Political MapsUnlike physical maps, political maps show how humans have impacted the landscape. For example, city names, roads, country borders, etc. are all part of political maps.
Political maps change frequently (physical maps change very, very slowly through geologic processes) and must be redrawn often. A political map of the world that is 50 years old is no longer accurate.
Wars and ethnic conflict are two major causes political maps change.
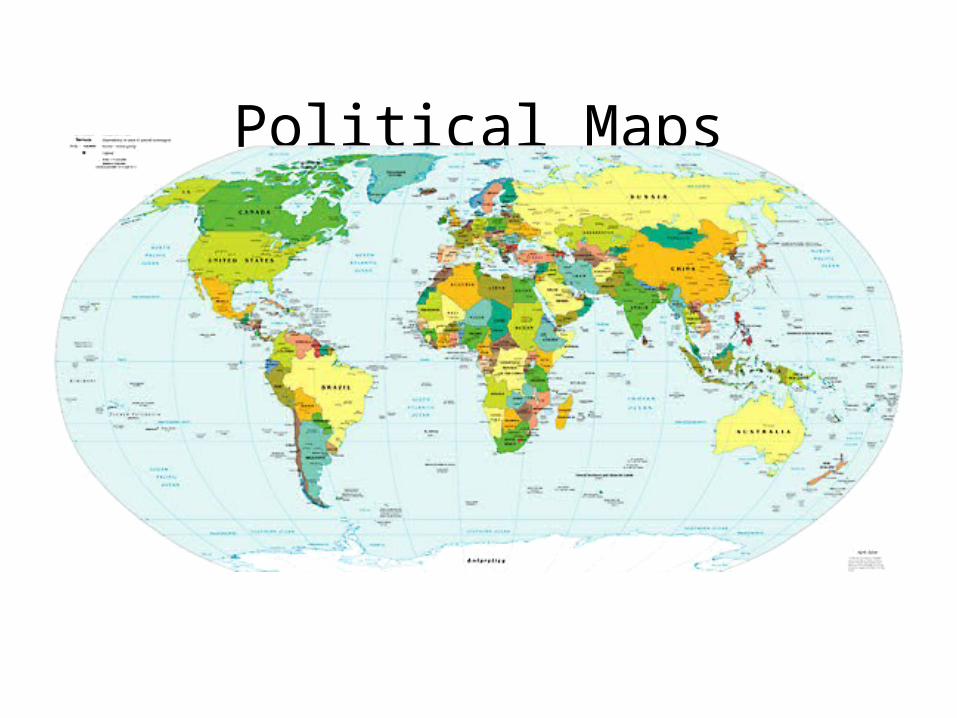
Political Maps

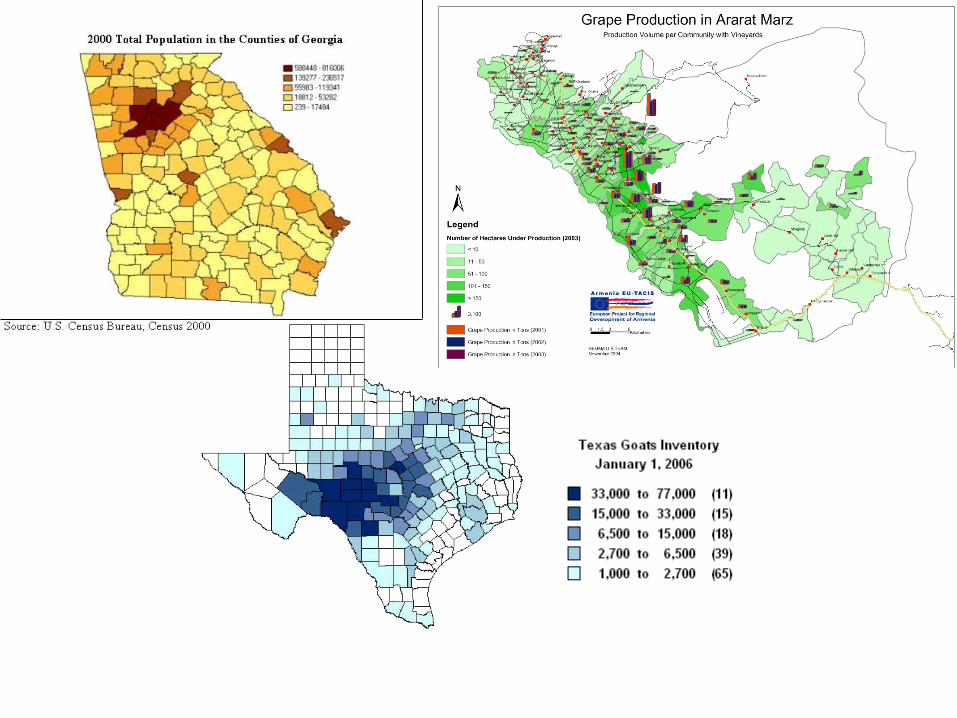
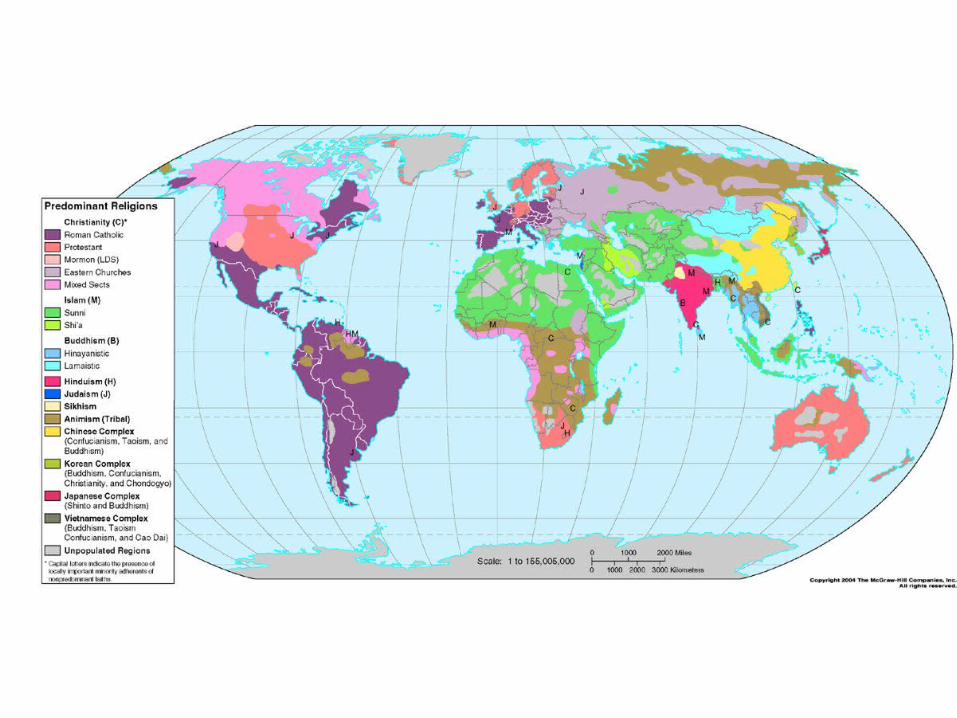
Thematic Maps
• Thematic maps can represent a variety of information including things like climate, precipitation, vegetation, elevation, population, life expectancy, etc.
• Thematic maps are generally used when you are looking at a single piece of information.
Creating a Thematic Map• You are now going to create a thematic map.
• You will now choose the information you will represent on your thematic map. You may choose to take a poll of favorite subjects, types of music, sports, birth months, etc. Choose something you are interested in learning about.
BE CREATIVE!
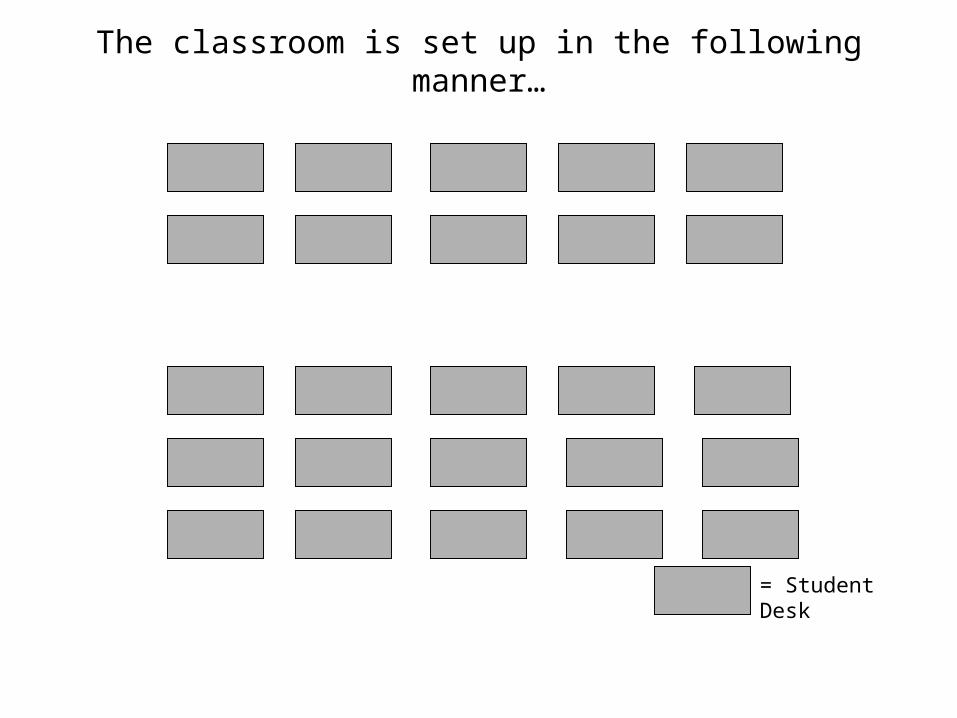
The classroom is set up in the following manner…
= Student Desk
Now choose what you want to know…
• Ex. I would like to know which pizza toppings students prefer to eat from the following list:
Pepperoni, Hamburger, Cheese, or Sausage.
• I would then ask the students to choose from this list of toppings and record the results.
Now you must choose a way to represent the information you
have gathered. I have chosen to use different colors so that we
may see the distribution of topping preferences.
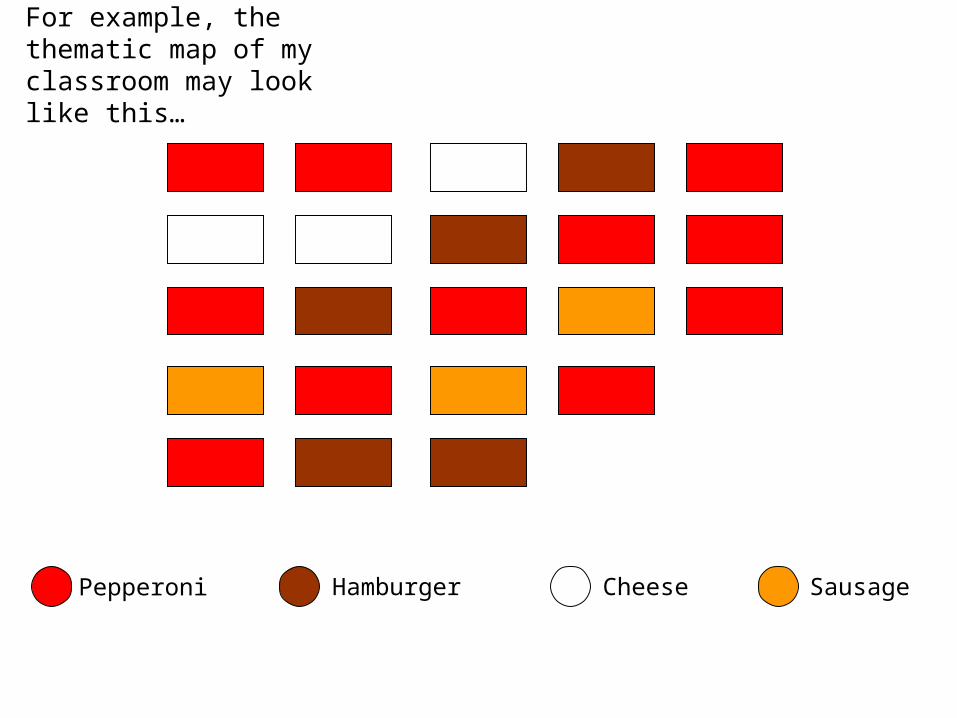
For example, the thematic map of my classroom may look like this…
Pepperoni Hamburger Cheese Sausage
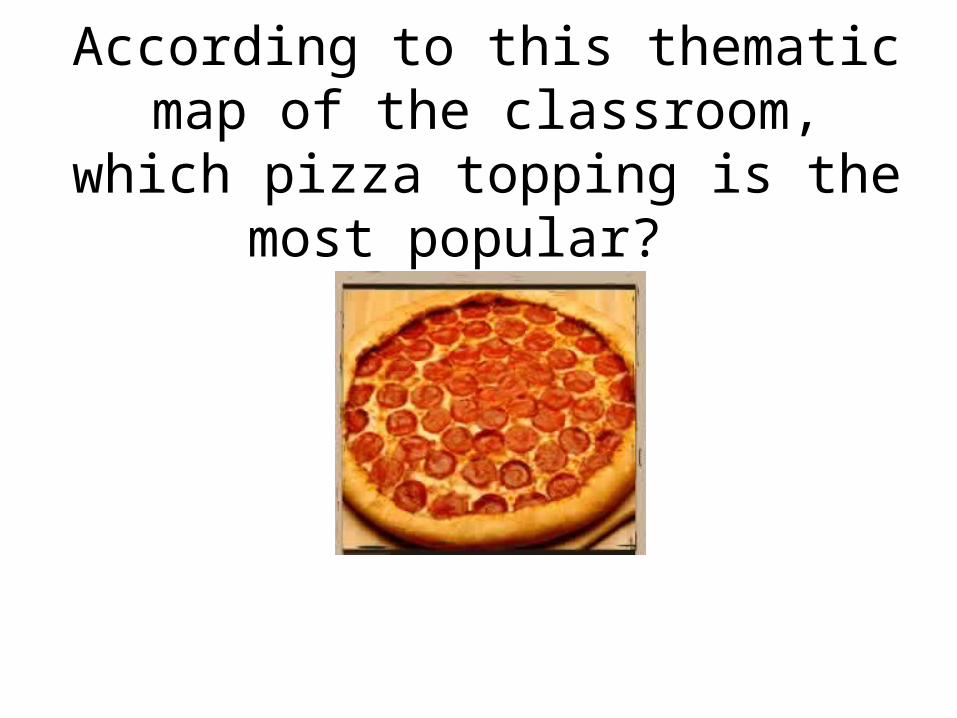
According to this thematic map of the classroom, which pizza topping is the most popular?

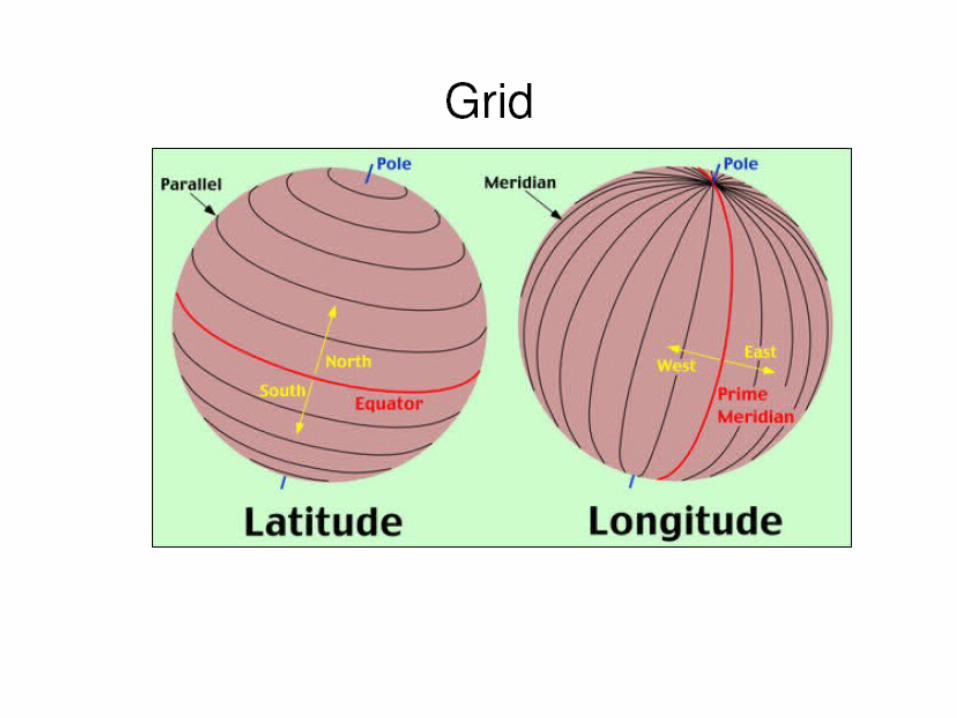
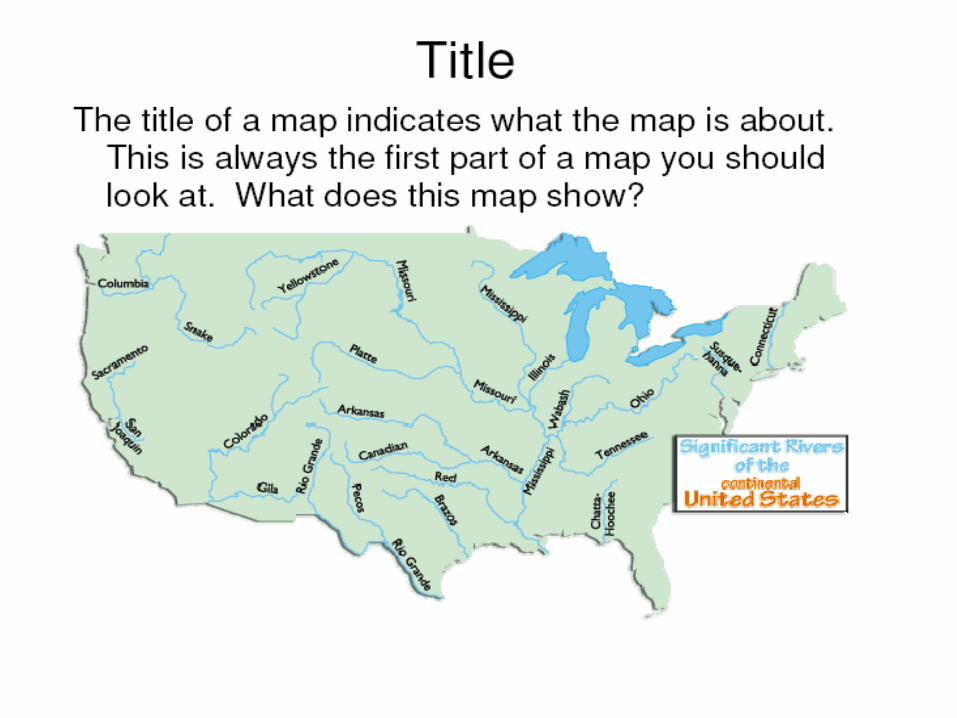
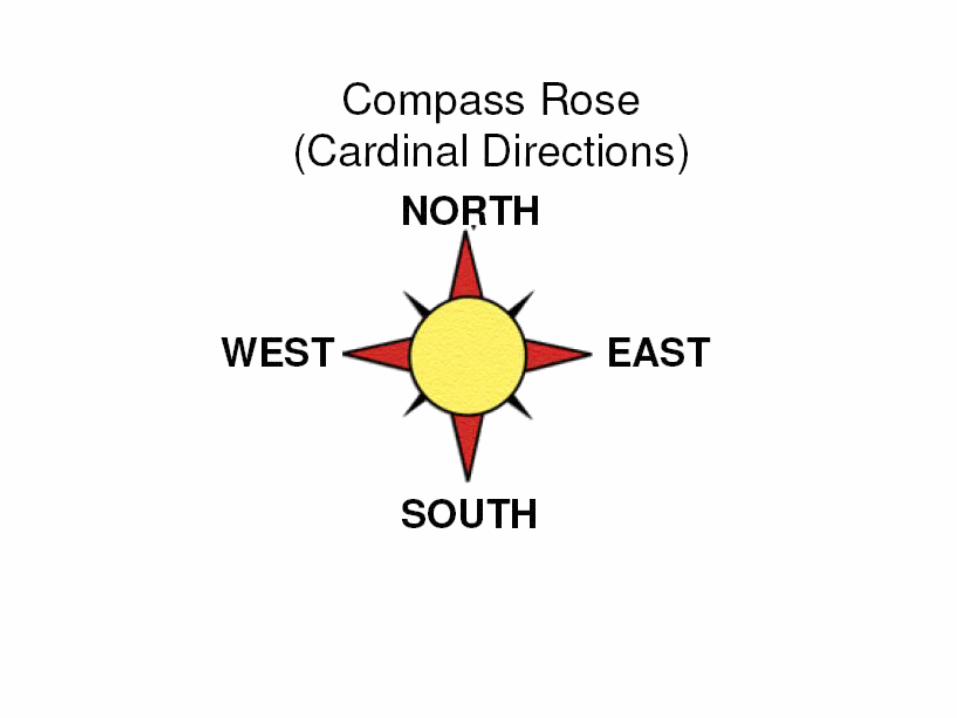
Map ComponentsTitleGrid
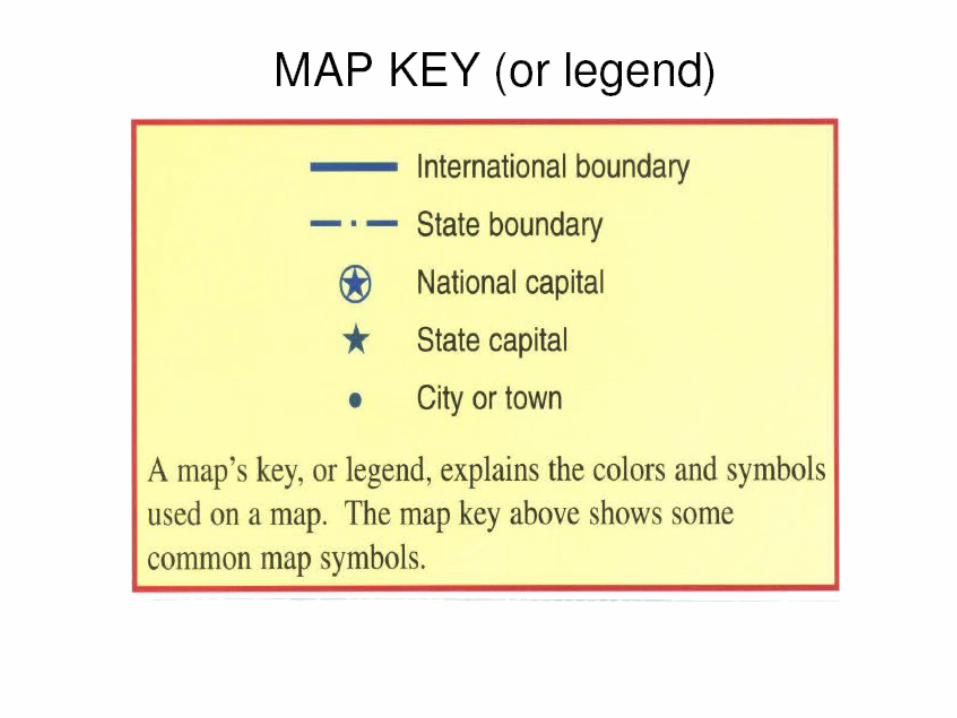
CompassKey or Legend
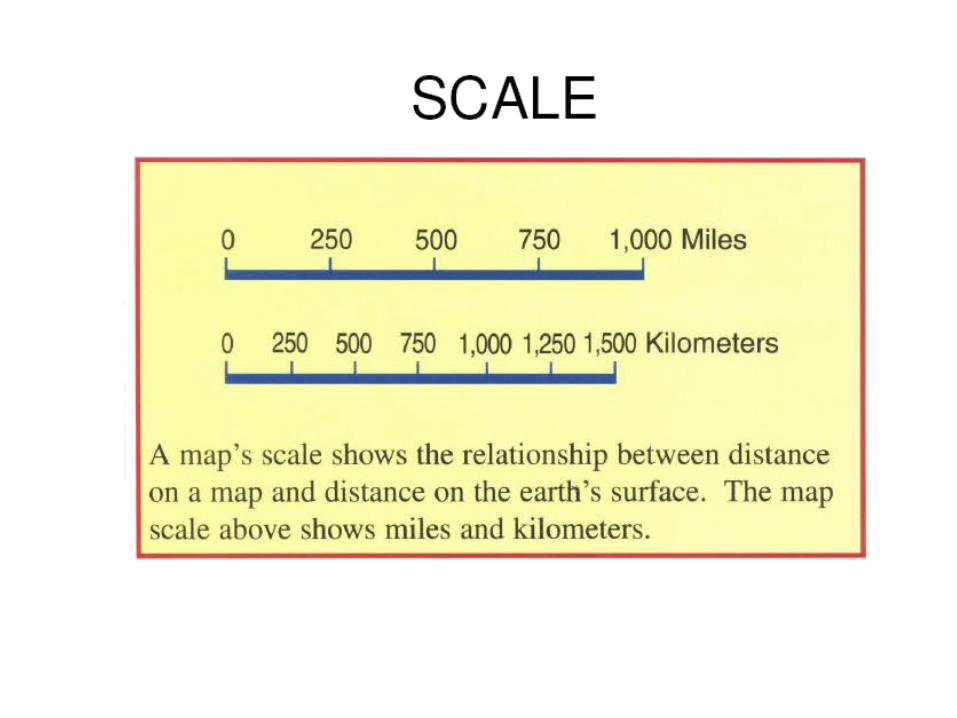
Scale
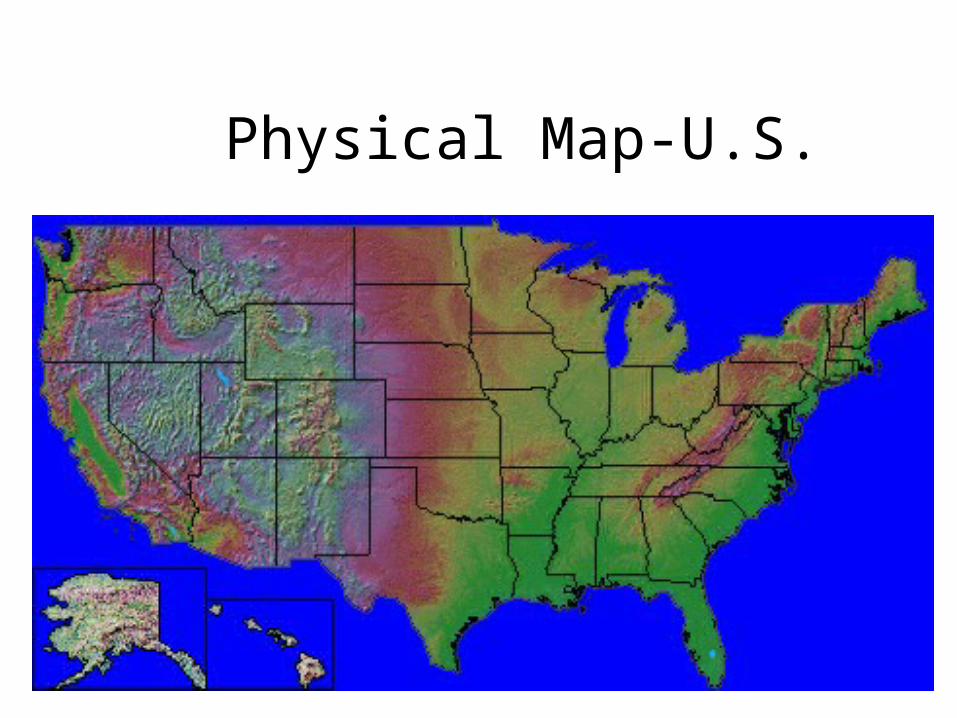
Physical Map-U.S.
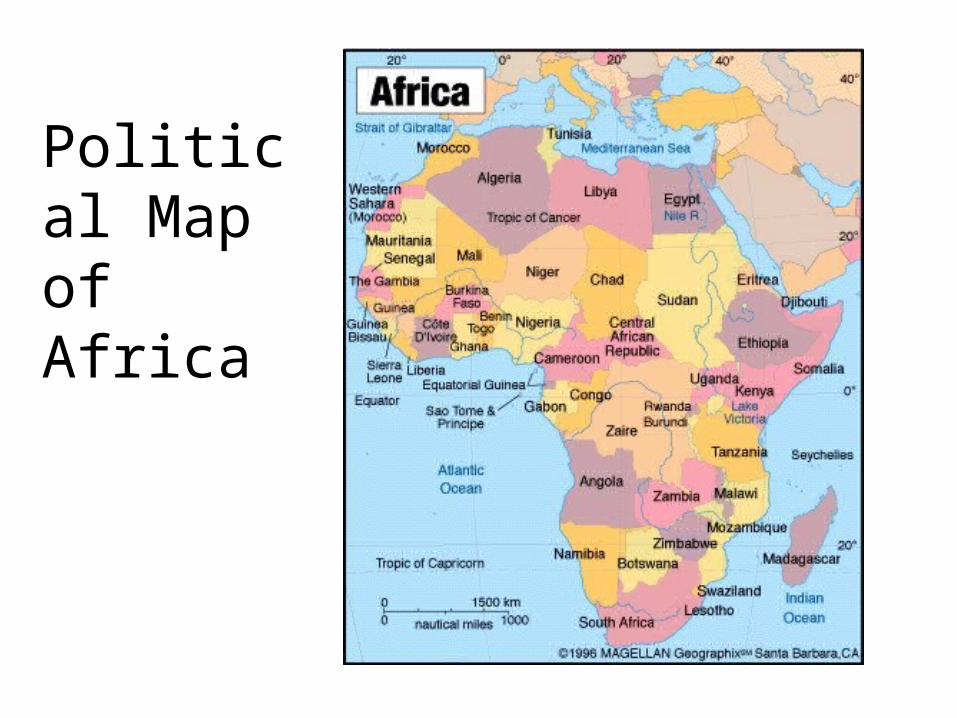
Political Map of Africa

Databases
•Not maps but analyze physical and human features of Earth
•Ex. Search engines, phone books, weather records
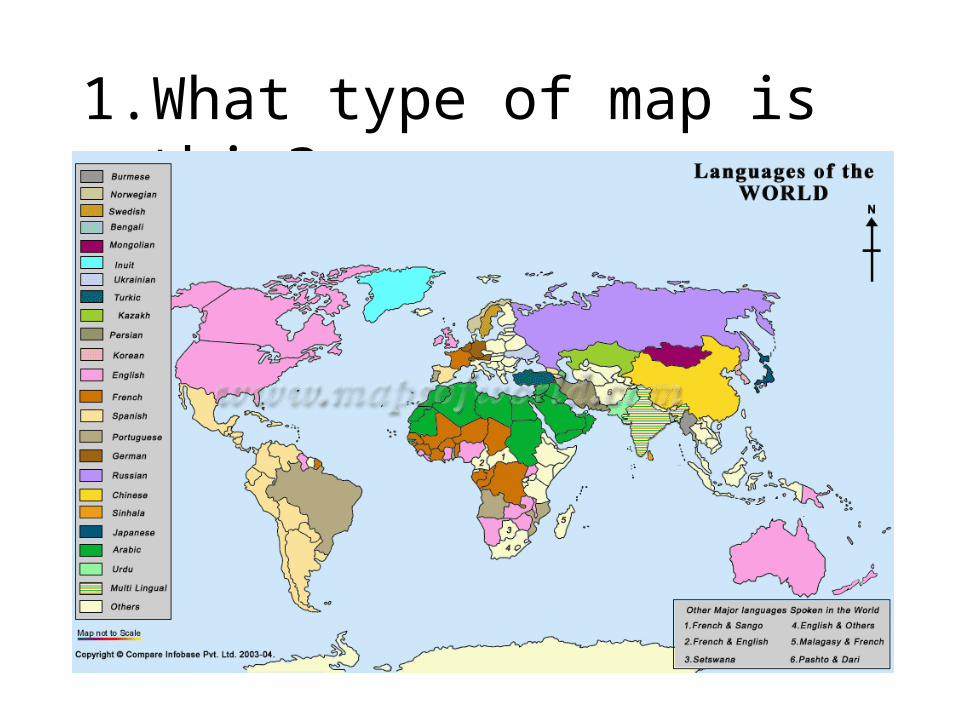
1.What type of map is this?
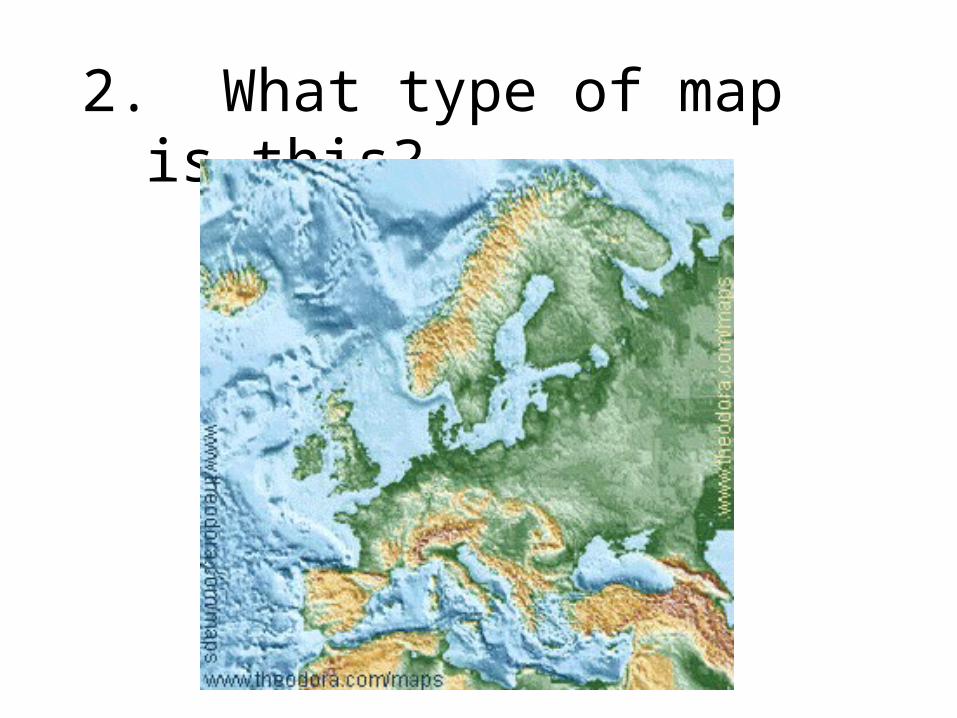
2. What type of map is this?
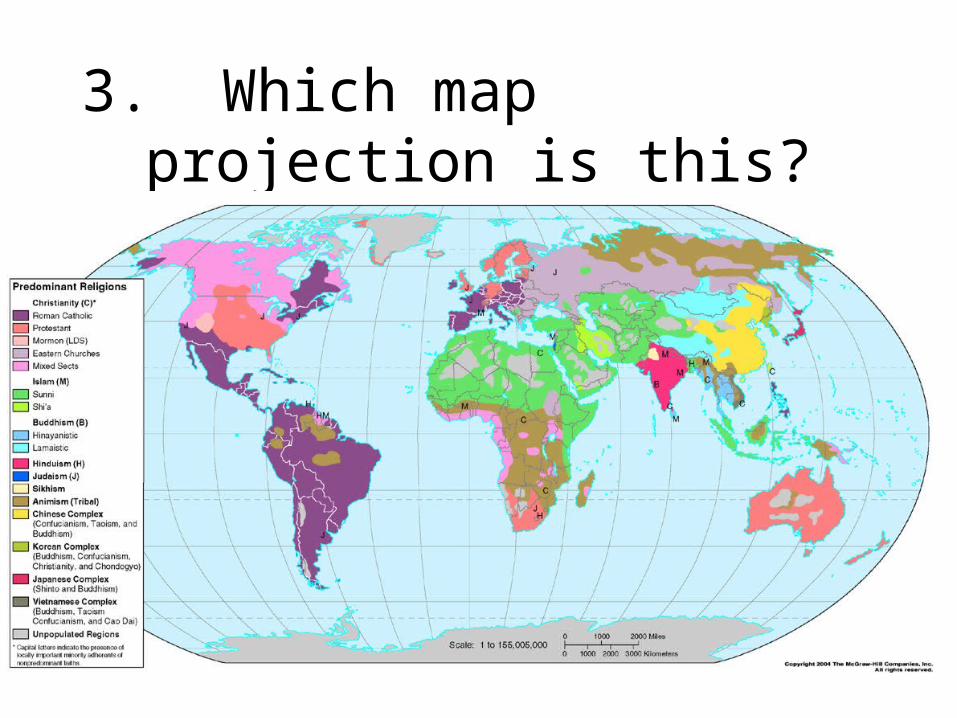
3. Which map projection is this?
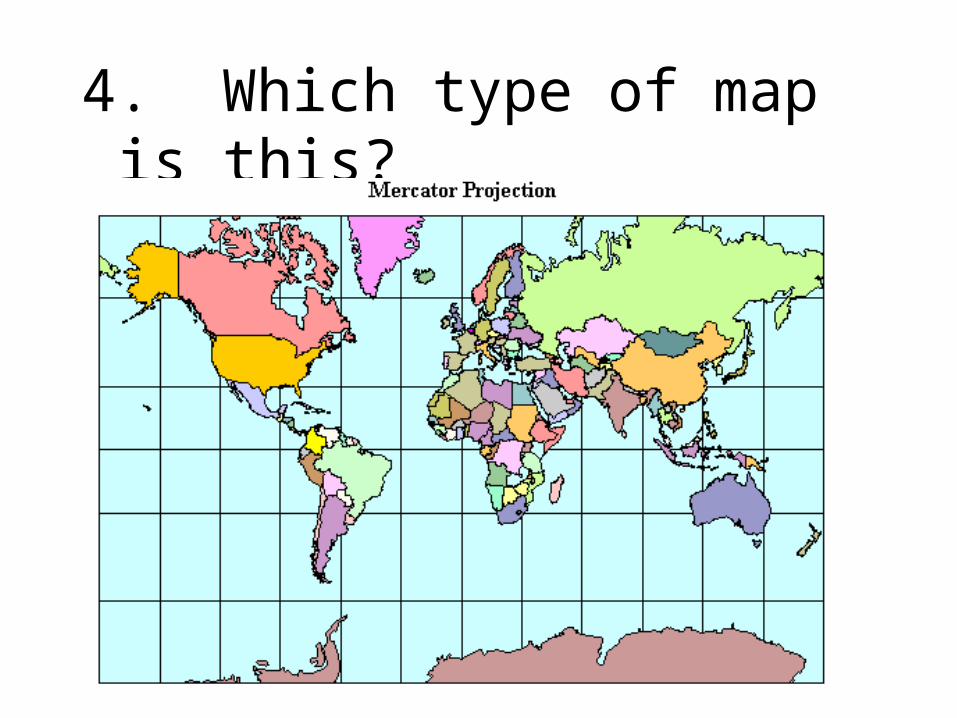
4. Which type of map is this?