marc global insight - rbc dominion securities insight-2015-03-e.pdf · rise if confidence improves...
TRANSCRIPT
P E R S P E C T I V E S F R O M T H E G L O B A L P O R T F O L I O A D V I S O R Y C O M M I T T E E
MARCH 2015
I N T H I S I S S U E > >
GLOBAL EQUITYEQUITY FRIENDLY
GLOBAL FIXED INCOMETO EXTEND, OR NOT TO EXTEND
COMMODITIESFEWER OIL DRILL BITS TURNING
For Important and Required Non-U.S. Analyst Disclosures, see page 19.
R B C W E A L T H M A N A G E M E N T
GLOBAL INSIGHT
CURRENCIESEURO: COOLER HEADS PREVAIL
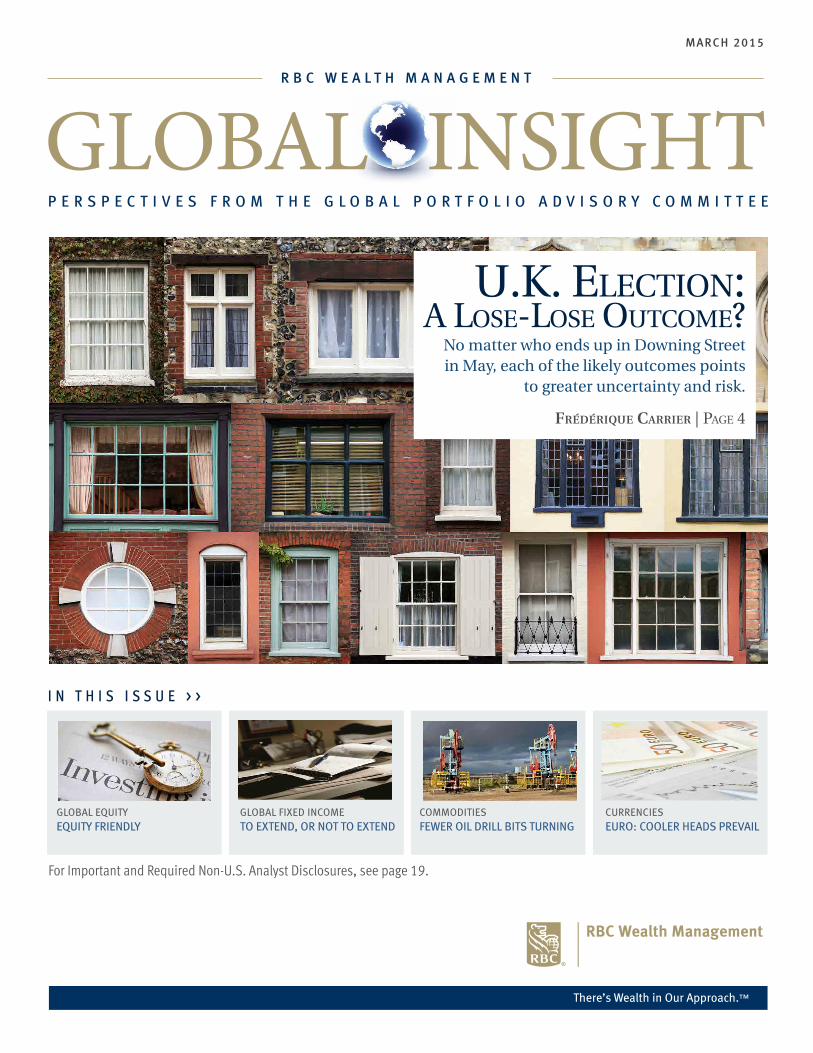
U.K. ElEction:A losE-losE oUtcomE?
No matter who ends up in Downing Street in May, each of the likely outcomes points
to greater uncertainty and risk.
Frédérique Carrier | PAgE 4
2 GLOBAL INSIGHT | March 2015
tAblE of contEnts
4 U.K. ElEction: A losE-losE oUtcomE? In the May general election no party is likely to emerge as the clear-cut winner. With its traditional political structure fractured and a possible referendum on EU membership in the cards, economic uncertainty appears to be the election’s most likely outcome.
9 GlobAl EqUity: EqUity FriEndly
As 2015 settles in, many markets have posted or approached new highs. The main reason for optimism—self-sustaining U.S. growth—appears firmly in place. A full, benchmark weighting in global equities remains appropriate.
12 GlobAl FixEd incomE: to ExtEnd, or not to ExtEnd
With central bank policy divergence a key theme in 2015, a short duration strategy may not insulate against market volatility. Selectively extending duration may best serve portfolios.
Inside the Markets
3 Rbc’s invEstmEnt stAncE
9 globAl EqUity
12 globAl fixEd incomE
14 commoditiEs
15 cURREnciEs
16 KEy foREcAsts
17 mARKEt scoREcARd
Global InsightMarch 2015
All values in U.S. dollars and priced as of February 27, 2015, market close, EST, unless otherwise noted.
3 GLOBAL INSIGHT | March 2015
Global Asset Class View
Rbc’s invEstmEnt stAncE
Views Explanation (+/=/–) represents the Global Portfolio Advisory Committee’s (GPAC) view over a 12-month investment time horizon.
+ Positive implies the potential for better-than-average performance for the asset class or for the region relative to other asset classes or regions.
= In-line implies the potential for average performance for the asset class or for the region relative to other asset classes or regions.
– Negative implies the potential for below-average performance for the asset class or for the region relative to other asset classes or regions.
Global Asset Views
Source - RBC Wealth Management
Asset Class
View
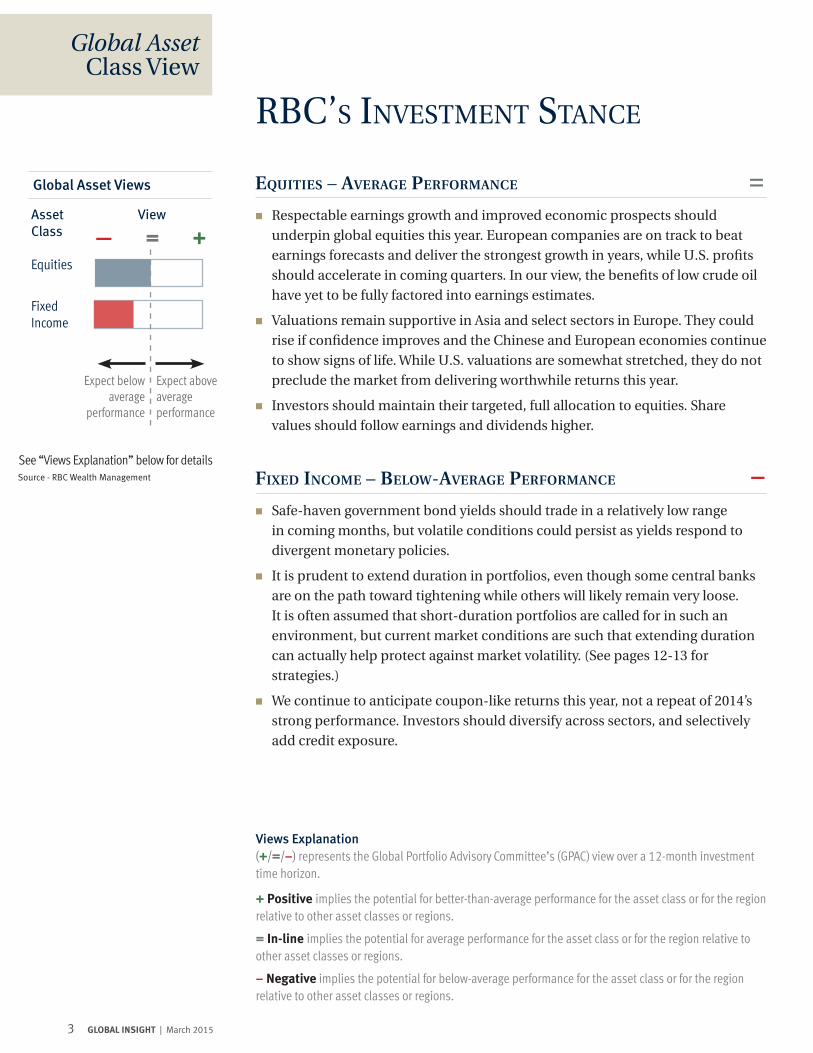
— = +Equities
Fixed Income
See “Views Explanation” below for details
Expect below average
performance
Expect above average performance
equities – average PerFormanCe =�� Respectable earnings growth and improved economic prospects should
underpin global equities this year. European companies are on track to beat
earnings forecasts and deliver the strongest growth in years, while U.S. profits
should accelerate in coming quarters. In our view, the benefits of low crude oil
have yet to be fully factored into earnings estimates.
�� Valuations remain supportive in Asia and select sectors in Europe. They could
rise if confidence improves and the Chinese and European economies continue
to show signs of life. While U.S. valuations are somewhat stretched, they do not
preclude the market from delivering worthwhile returns this year.
�� Investors should maintain their targeted, full allocation to equities. Share
values should follow earnings and dividends higher.
Fixed inCome – Below-average PerFormanCe –�� Safe-haven government bond yields should trade in a relatively low range
in coming months, but volatile conditions could persist as yields respond to
divergent monetary policies.
�� It is prudent to extend duration in portfolios, even though some central banks
are on the path toward tightening while others will likely remain very loose.
It is often assumed that short-duration portfolios are called for in such an
environment, but current market conditions are such that extending duration
can actually help protect against market volatility. (See pages 12-13 for
strategies.)
�� We continue to anticipate coupon-like returns this year, not a repeat of 2014’s
strong performance. Investors should diversify across sectors, and selectively
add credit exposure.
4 GLOBAL INSIGHT | March 2015
U.K. ElEction: losE-losE oUtcomE?The rise of “minority parties” has turned the May UK general election into a complicated horse race. Britain’s continued membership in the European Union could become an open question and raise economic uncertainty in the UK and on the continent. This would almost assuredly catch the attention of global financial markets, which have yet to price in the risks, in our view.
Focus Article
Frederique Carrier London, England frédé[email protected]
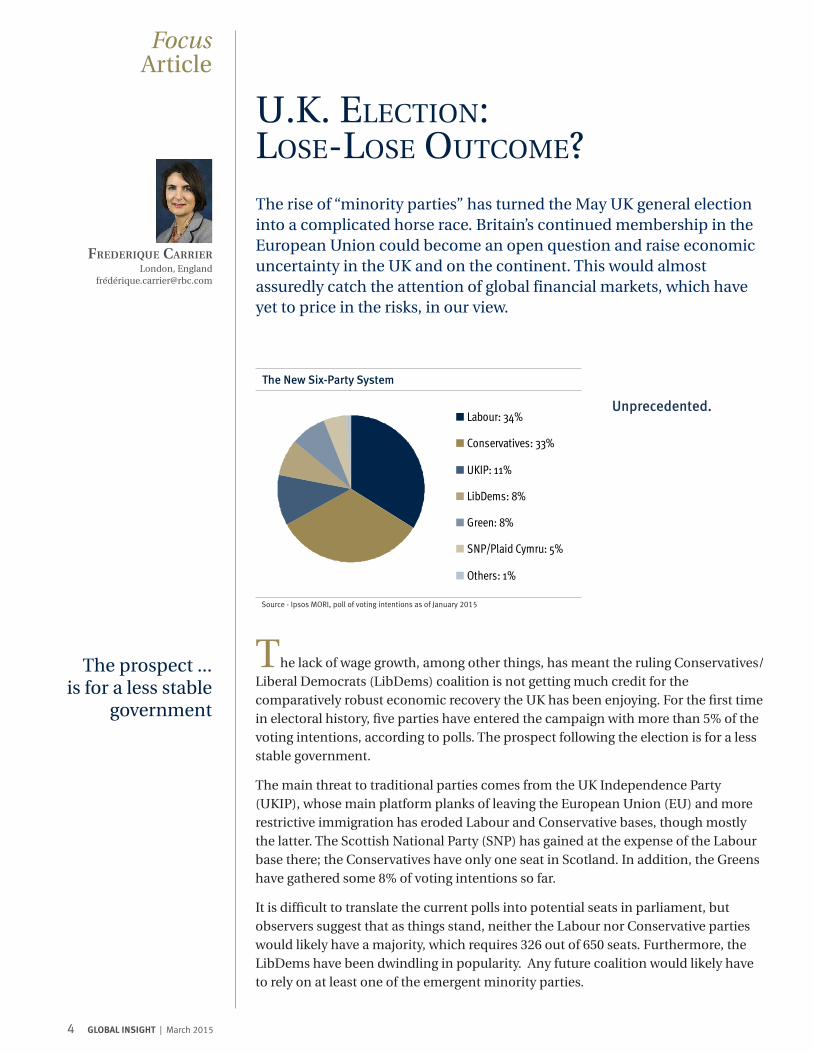
The New Six-Party System
Labour: 34%
Conservatives: 33%
UKIP: 11%
LibDems: 8%
Green: 8%
SNP/Plaid Cymru: 5%
Others: 1%
Source - Ipsos MORI, poll of voting intentions as of January 2015
Unprecedented.
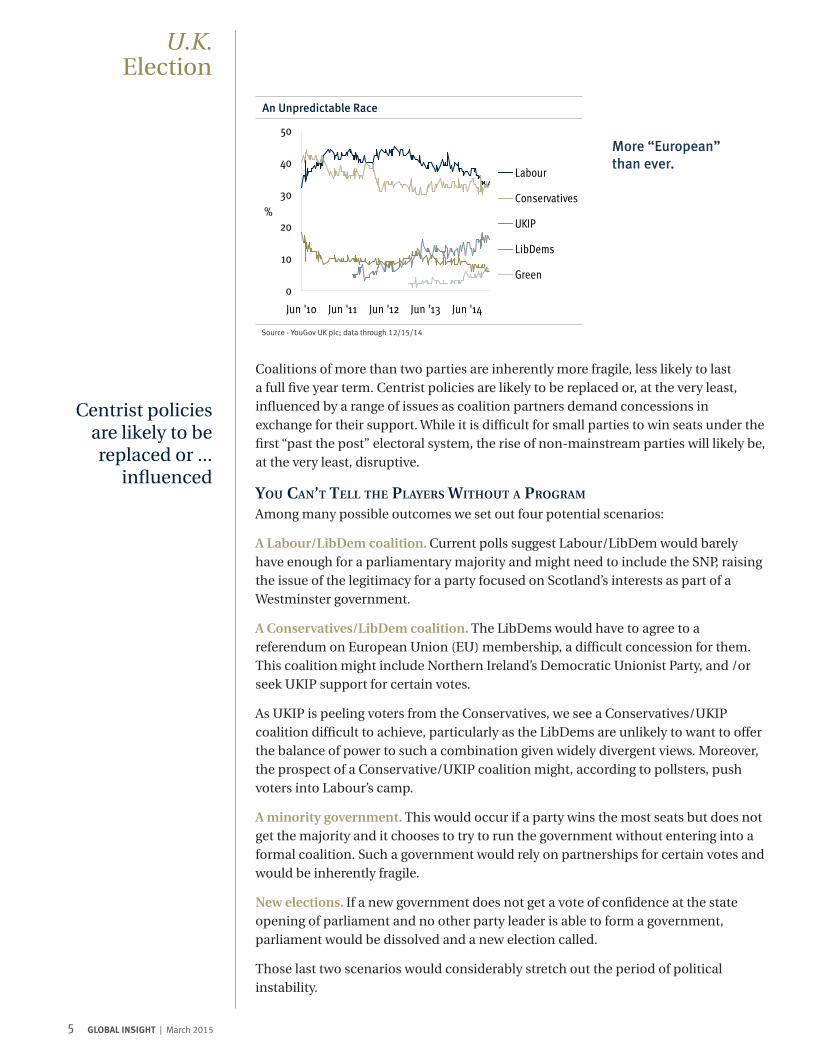
The lack of wage growth, among other things, has meant the ruling Conservatives/Liberal Democrats (LibDems) coalition is not getting much credit for the comparatively robust economic recovery the UK has been enjoying. For the first time in electoral history, five parties have entered the campaign with more than 5% of the voting intentions, according to polls. The prospect following the election is for a less stable government.
The main threat to traditional parties comes from the UK Independence Party (UKIP), whose main platform planks of leaving the European Union (EU) and more restrictive immigration has eroded Labour and Conservative bases, though mostly the latter. The Scottish National Party (SNP) has gained at the expense of the Labour base there; the Conservatives have only one seat in Scotland. In addition, the Greens have gathered some 8% of voting intentions so far.
It is difficult to translate the current polls into potential seats in parliament, but observers suggest that as things stand, neither the Labour nor Conservative parties would likely have a majority, which requires 326 out of 650 seats. Furthermore, the LibDems have been dwindling in popularity. Any future coalition would likely have to rely on at least one of the emergent minority parties.
The prospect ... is for a less stable
government
5 GLOBAL INSIGHT | March 2015
U.K. Election
Coalitions of more than two parties are inherently more fragile, less likely to last a full five year term. Centrist policies are likely to be replaced or, at the very least, influenced by a range of issues as coalition partners demand concessions in exchange for their support. While it is difficult for small parties to win seats under the first “past the post” electoral system, the rise of non-mainstream parties will likely be, at the very least, disruptive.
You Can’t tell the PlaYers without a Program
Among many possible outcomes we set out four potential scenarios:
A Labour/LibDem coalition. Current polls suggest Labour/LibDem would barely have enough for a parliamentary majority and might need to include the SNP, raising the issue of the legitimacy for a party focused on Scotland’s interests as part of a Westminster government.
A Conservatives/LibDem coalition. The LibDems would have to agree to a referendum on European Union (EU) membership, a difficult concession for them. This coalition might include Northern Ireland’s Democratic Unionist Party, and /or seek UKIP support for certain votes.
As UKIP is peeling voters from the Conservatives, we see a Conservatives/UKIP coalition difficult to achieve, particularly as the LibDems are unlikely to want to offer the balance of power to such a combination given widely divergent views. Moreover, the prospect of a Conservative/UKIP coalition might, according to pollsters, push voters into Labour’s camp.
A minority government. This would occur if a party wins the most seats but does not get the majority and it chooses to try to run the government without entering into a formal coalition. Such a government would rely on partnerships for certain votes and would be inherently fragile.
New elections. If a new government does not get a vote of confidence at the state opening of parliament and no other party leader is able to form a government, parliament would be dissolved and a new election called.
Those last two scenarios would considerably stretch out the period of political instability.
Centrist policies are likely to be replaced or ...
influenced
An Unpredictable Race
Source - YouGov UK plc; data through 12/15/14
More “European” than ever.
0
10
20
30
40
50
Jun '10 Jun '11 Jun '12 Jun '13 Jun '14
%
Labour
Conservatives
UKIP
LibDems
Green
6 GLOBAL INSIGHT | March 2015
U.K. Election
As polls stand today, the most likely outcome is a Labour-led coalition. Changes in opinion are possible, including the potential influence of upcoming live TV debates and unfolding macro-economic data.
no good outCome? Party manifestos are not out yet, so definitive policies can only be inferred from party leaders’ speeches and conferences. Broadly, a Labour-led government would dent the UK’s reputation as a relatively low tax, business friendly economy. By contrast, a Conservative-led government would raise the spectre of the U.K. exiting the EU. The party has committed to an in/out referendum on British membership by 2017. The prospect would likely weigh on household and business confidence, at a cost to economic momentum.
“Brexit” risks Not Priced iN
To fend off UKIP, Conservative Prime Minister David Cameron has adopted a tougher stance on the EU. His vision is to renegotiate the terms of the UK’s relationship with Europe. He aims for increased cooperation on foreign policy and less burdensome red tape, and would like the UK to have more say over its own affairs. He recently suggested a cap on EU immigration and has promised to hold a referendum by the end of 2017 on whether the UK should remain a member of the EU under new renegotiated terms.
The UK may be well placed to cope with some degree of political disruption thanks to the comparative strength of its economic recovery. However, the uncertainty of a referendum could affect economic prospects markedly.
Uncertainty would weigh on investment sentiment in the two-year run up to the promised vote. We would expect a loss of economic momentum as businesses and households become more cautious, as well as pressure on asset prices and the currency. In turn, this may lead the Bank of England to adopt a more accommodative monetary policy.
Were the UK to depart the EU, those UK companies no longer regarded as compliant with EU standards and regulation would lose preferred access to the EU market. Trade would suffer, particularly if the EU develops its planned single market for services. The UK’s attractiveness as a trade partner and as a destination for foreign investment would diminish if its access to EU becomes constrained. Any such a scenario would likely have repercussions for the labour market.
Reassuringly, a recent YouGov poll showed 43% of people would vote to stay in the EU in a referendum, while 38% would vote to leave, based on the current relationship. Should PM Cameron negotiate better terms with Brussels, a tall order given existing privileges the UK enjoys, support for the EU may well increase further. However, sentiment on this issue has been volatile and could be eroded by renewed eurozone instability.
HigHer taxes A Labour-led government would likely negatively affect corporate profitability and the environment in which certain industries operate. Labour would prefer to reduce the stubbornly high fiscal deficit through targeted tax increases, as opposed to spending cuts. The key for the economy is whether these potential increases would inhibit future job creation and the rate of economic growth.
“... The uncertainty of [an EU
membership] referendum could
affect economic prospects”
7 GLOBAL INSIGHT | March 2015
U.K. Election
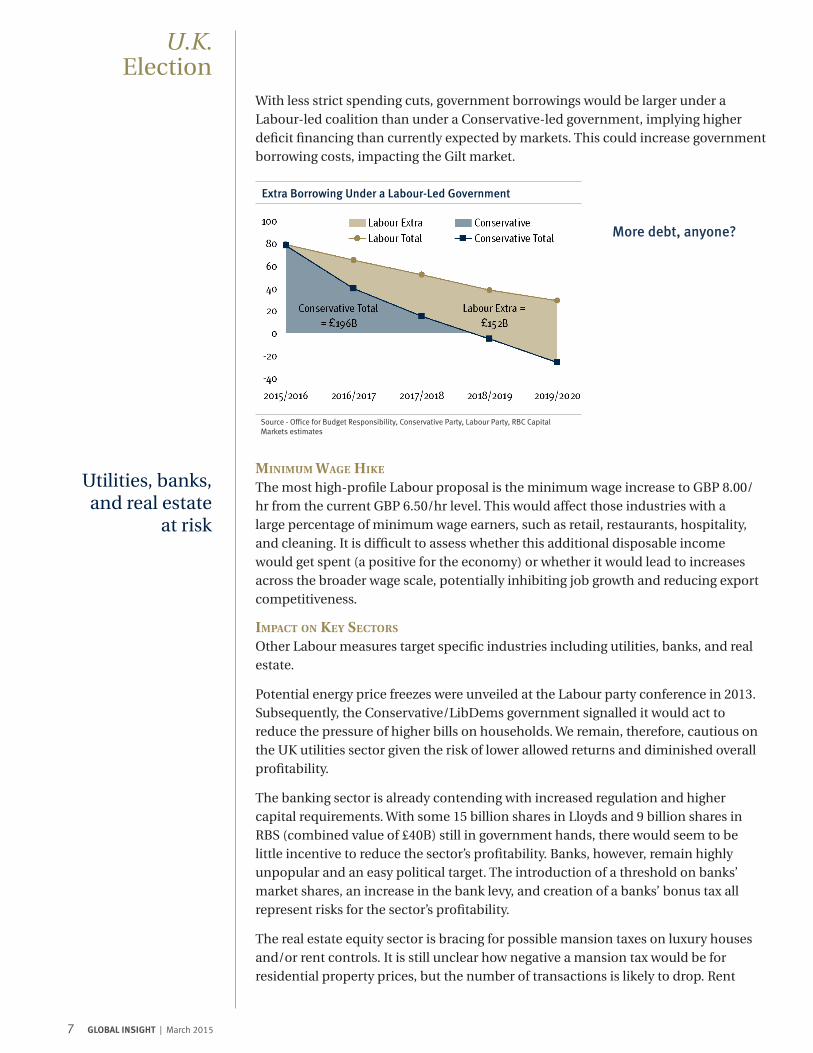
With less strict spending cuts, government borrowings would be larger under a Labour-led coalition than under a Conservative-led government, implying higher deficit financing than currently expected by markets. This could increase government borrowing costs, impacting the Gilt market.
Source - Office for Budget Responsibility, Conservative Party, Labour Party, RBC Capital Markets estimates
More debt, anyone?
Extra Borrowing Under a Labour-Led Government
MiNiMuM Wage Hike
The most high-profile Labour proposal is the minimum wage increase to GBP 8.00/hr from the current GBP 6.50/hr level. This would affect those industries with a large percentage of minimum wage earners, such as retail, restaurants, hospitality, and cleaning. It is difficult to assess whether this additional disposable income would get spent (a positive for the economy) or whether it would lead to increases across the broader wage scale, potentially inhibiting job growth and reducing export competitiveness.
iMPact oN key sectors
Other Labour measures target specific industries including utilities, banks, and real estate.
Potential energy price freezes were unveiled at the Labour party conference in 2013. Subsequently, the Conservative/LibDems government signalled it would act to reduce the pressure of higher bills on households. We remain, therefore, cautious on the UK utilities sector given the risk of lower allowed returns and diminished overall profitability.
The banking sector is already contending with increased regulation and higher capital requirements. With some 15 billion shares in Lloyds and 9 billion shares in RBS (combined value of £40B) still in government hands, there would seem to be little incentive to reduce the sector’s profitability. Banks, however, remain highly unpopular and an easy political target. The introduction of a threshold on banks’ market shares, an increase in the bank levy, and creation of a banks’ bonus tax all represent risks for the sector’s profitability.
The real estate equity sector is bracing for possible mansion taxes on luxury houses and/or rent controls. It is still unclear how negative a mansion tax would be for residential property prices, but the number of transactions is likely to drop. Rent
Utilities, banks, and real estate
at risk

8 GLOBAL INSIGHT | March 2015
U.K. Election
controls would not improve the housing supply problem but do represent a risk for UK real estate investment trusts.
volatilitY ahead
The uncertain outcome of the UK elections is likely to increase volatility of the FTSE 100 equity index and of sectors that could be the target of political parties’ campaigns. Other sectors, however, have low operational and sales exposure to the UK, and some stocks could present attractive entry points were all UK stocks to correct in response to a hung parliament or weak coalition.
All the likely outcomes may present challenges for the UK economy and financial markets, but, in our judgment, the prospect of an EU referendum in the event of a Conservative-led government poses a threat for the equity market and in particular for sectors highly exposed to European revenues that is not yet discounted in share prices.
9 GLOBAL INSIGHT | March 2015
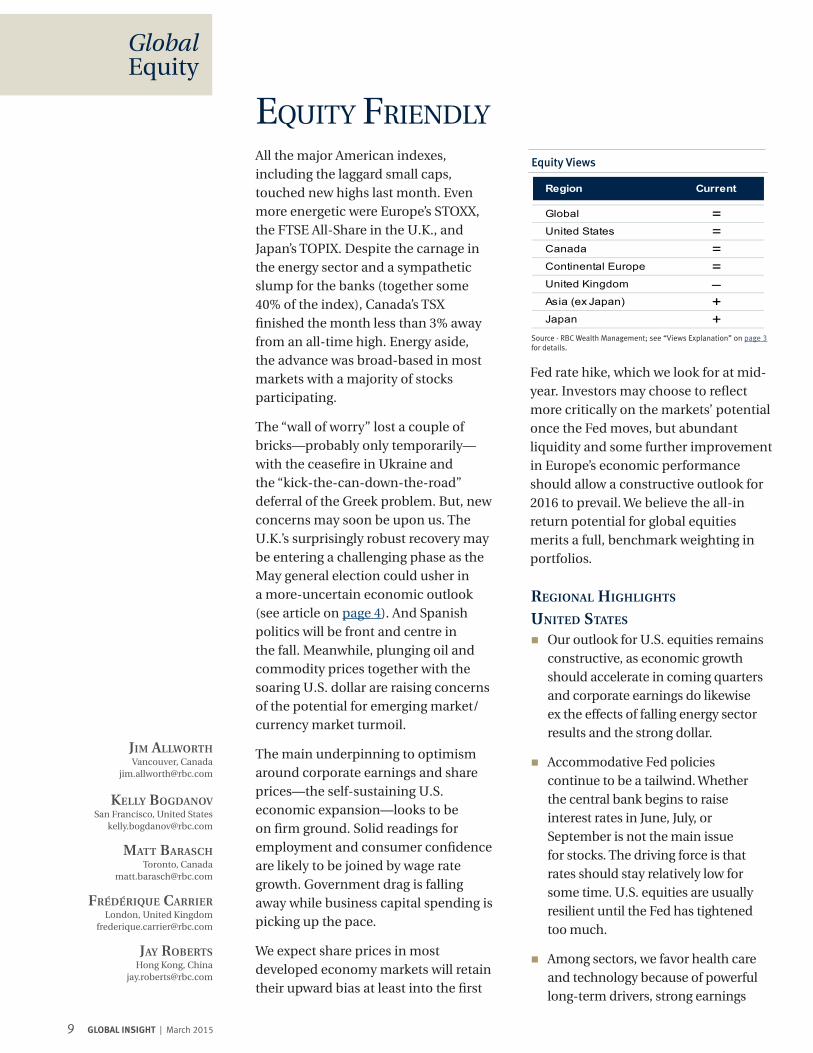
EqUity fRiEndlyAll the major American indexes, including the laggard small caps, touched new highs last month. Even more energetic were Europe’s STOXX, the FTSE All-Share in the U.K., and Japan’s TOPIX. Despite the carnage in the energy sector and a sympathetic slump for the banks (together some 40% of the index), Canada’s TSX finished the month less than 3% away from an all-time high. Energy aside, the advance was broad-based in most markets with a majority of stocks participating.
The “wall of worry” lost a couple of bricks—probably only temporarily—with the ceasefire in Ukraine and the “kick-the-can-down-the-road” deferral of the Greek problem. But, new concerns may soon be upon us. The U.K.’s surprisingly robust recovery may be entering a challenging phase as the May general election could usher in a more-uncertain economic outlook (see article on page 4). And Spanish politics will be front and centre in the fall. Meanwhile, plunging oil and commodity prices together with the soaring U.S. dollar are raising concerns of the potential for emerging market/currency market turmoil.
The main underpinning to optimism around corporate earnings and share prices—the self-sustaining U.S. economic expansion—looks to be on firm ground. Solid readings for employment and consumer confidence are likely to be joined by wage rate growth. Government drag is falling away while business capital spending is picking up the pace.
We expect share prices in most developed economy markets will retain their upward bias at least into the first
Global Equity
Jim allworth Vancouver, Canada [email protected]
KellY Bogdanov San Francisco, United States [email protected]
matt BarasCh Toronto, Canada [email protected]
Frédérique Carrier London, United Kingdom [email protected]
JaY roBerts Hong Kong, China [email protected]
Source - RBC Wealth Management; see “Views Explanation” on page 3 for details.
Fed rate hike, which we look for at mid-year. Investors may choose to reflect more critically on the markets’ potential once the Fed moves, but abundant liquidity and some further improvement in Europe’s economic performance should allow a constructive outlook for 2016 to prevail. We believe the all-in return potential for global equities merits a full, benchmark weighting in portfolios.
Equity Views
Region Current
Global =United States =Canada =Continental Europe =United Kingdom –Asia (ex Japan) +Japan +
regional highlights
united states
�� Our outlook for U.S. equities remains constructive, as economic growth should accelerate in coming quarters and corporate earnings do likewise ex the effects of falling energy sector results and the strong dollar.
�� Accommodative Fed policies continue to be a tailwind. Whether the central bank begins to raise interest rates in June, July, or September is not the main issue for stocks. The driving force is that rates should stay relatively low for some time. U.S. equities are usually resilient until the Fed has tightened too much.
�� Among sectors, we favor health care and technology because of powerful long-term drivers, strong earnings
10 GLOBAL INSIGHT | March 2015
Global Equity
losses stemming from energy sector turmoil, the valuation readjustment for the group may have some time to run. Life insurance companies need higher rates to drive profitability growth.
�� As for the commodity complex, the supply readjustment process has begun with significant curtailments to capital expenditures already announced and many more likely to come. Demand has picked up as consumers have begun to respond to low prices. Some meaningful production curtailments would be welcome but have not yet materialised. These forces should combine to eventually bring the oil market into balance; however, the adjustment period could take months if not years, as new supply sources can be brought back on line very quickly.
asia
�� The MSCI Asia ex-Japan Index rose by 5% in the first two months of 2015. Lower energy prices are a tailwind as many Asian countries are net importers of oil. Chinese equities have consolidated, but still have the potential to continue to re-rate on looser policy and domestic reforms. Further deceleration in global growth would be a risk to our positive view.
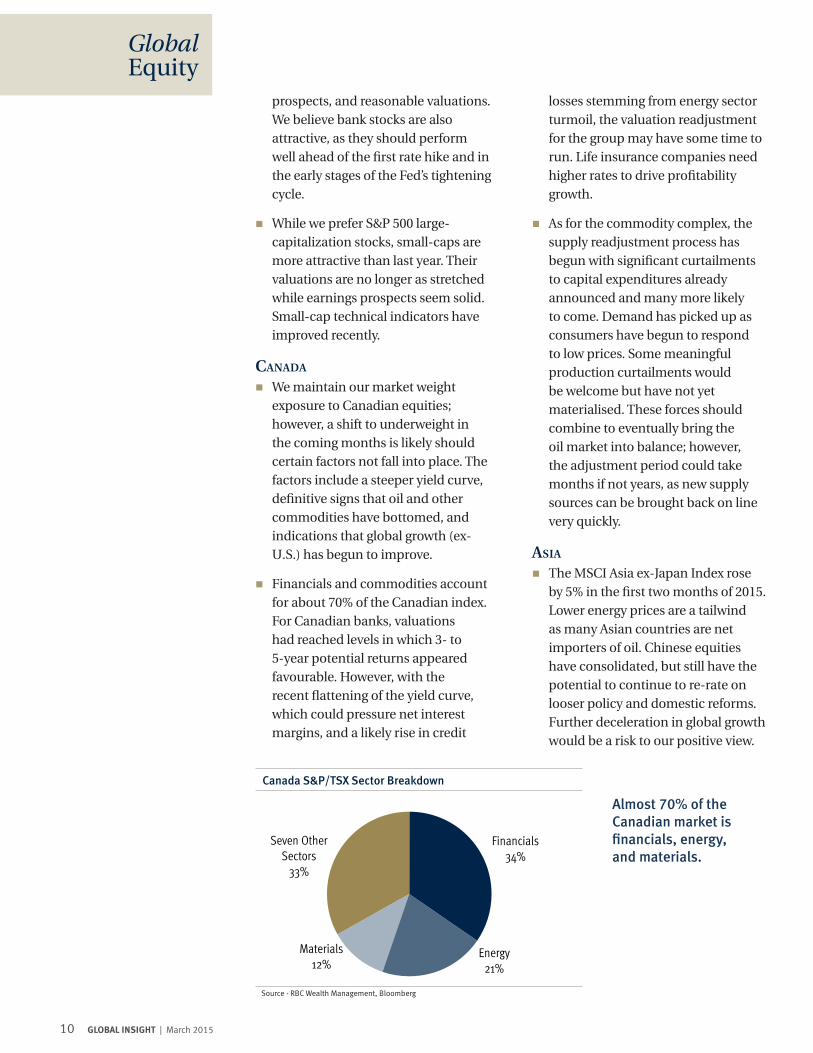
Canada S&P/TSX Sector Breakdown
Financials34%
Energy21%
Materials12%
Seven Other Sectors
33%
Source - RBC Wealth Management, Bloomberg
Almost 70% of the Canadian market is financials, energy, and materials.
prospects, and reasonable valuations. We believe bank stocks are also attractive, as they should perform well ahead of the first rate hike and in the early stages of the Fed’s tightening cycle.
�� While we prefer S&P 500 large-capitalization stocks, small-caps are more attractive than last year. Their valuations are no longer as stretched while earnings prospects seem solid. Small-cap technical indicators have improved recently.
Canada
�� We maintain our market weight exposure to Canadian equities; however, a shift to underweight in the coming months is likely should certain factors not fall into place. The factors include a steeper yield curve, definitive signs that oil and other commodities have bottomed, and indications that global growth (ex-U.S.) has begun to improve.
�� Financials and commodities account for about 70% of the Canadian index. For Canadian banks, valuations had reached levels in which 3- to 5-year potential returns appeared favourable. However, with the recent flattening of the yield curve, which could pressure net interest margins, and a likely rise in credit
11 GLOBAL INSIGHT | March 2015
Global Equity
�� Japan’s TOPIX Index, our preferred benchmark, has risen above 1,500, to its highest level since 2007. The TOPIX remains well below its highest level of that year, despite a similar level of index earnings. A surprising element of this year’s rally has been the stable yen. This is a good sign, in our view. Although the valuation multiple for the TOPIX has crept higher, to 14.5x consensus forward earnings forecasts, we still view this as reasonably attractive against the consensus forecast of 12% earnings growth.
Continental euroPe & u.K.�� European equity markets continued
to climb higher despite the ongoing backdrop of tense and inconclusive negotiations between the new left wing Greek government and its creditors. The consensus was entrenched in its view that both sides had too much to lose and would come to a compromise, setting aside worries of a possible exit by Greece from the eurozone, a view that has been borne out in the short term (see update below).
�� Notwithstanding this issue, and the conflict between Ukraine and Russia, we believe prospects for European equity markets are better than they have been for some time. The weaker euro is fuelling growth, and earnings have been upgraded for the first time in several years, aided in part by the decline in oil prices. We believe quality, resilient companies with some scope beyond Europe should remain core holdings in a European portfolio. However, we are also able to find attractive value among domestic cyclical stocks.
greece uPdate: Bailout exteNsioNs aNd Next stePs Recently, the Eurogroup and the Greek government struck a tentative agreement to extend the current bailout
programme until the end of June. The Greek government finally gave in and accepted the conditions to the current bailout.
This move may have been imposed by increasing deposit outflows, which accelerated and reached €3B the week of February 15, or a total of €25B so far this year. If that pace were to be sustained, Greek banks would run out of collateral for new loans by springtime.
The Greek government also proposed reforms including the tackling of tax evasion and corruption, improving the efficiency of the public sector, and accepting Troika supervision of the budget. In a face-saving move, the government gave no firm commitment to new privatisations, will push through a gradual increase of the minimum wage, and will not implement cuts in pension payments.
Despite some shortfalls, the reforms package was approved by the eurozone finance ministers. Overall, if implemented, the reforms could have a large impact on the economy, even though effort around labour market flexibility and tax reforms is lacking. The success of the reforms will depend on how well they are implemented; Greece does not have a good track record in that regard. The big question is, will the coalition government hold in the face of this U-turn on austerity?
For now, the tensions over Greece should abate; however, the saga is not over. The formal approval of a four-month bailout extension should take place by the end of next month when Greece is scheduled to present details and legislation of the planned reforms. If that is successful, negotiations on the third bailout package would likely get underway and tensions could re-emerge.
12 GLOBAL INSIGHT | March 2015
to ExtEnd, oR not to ExtEnd
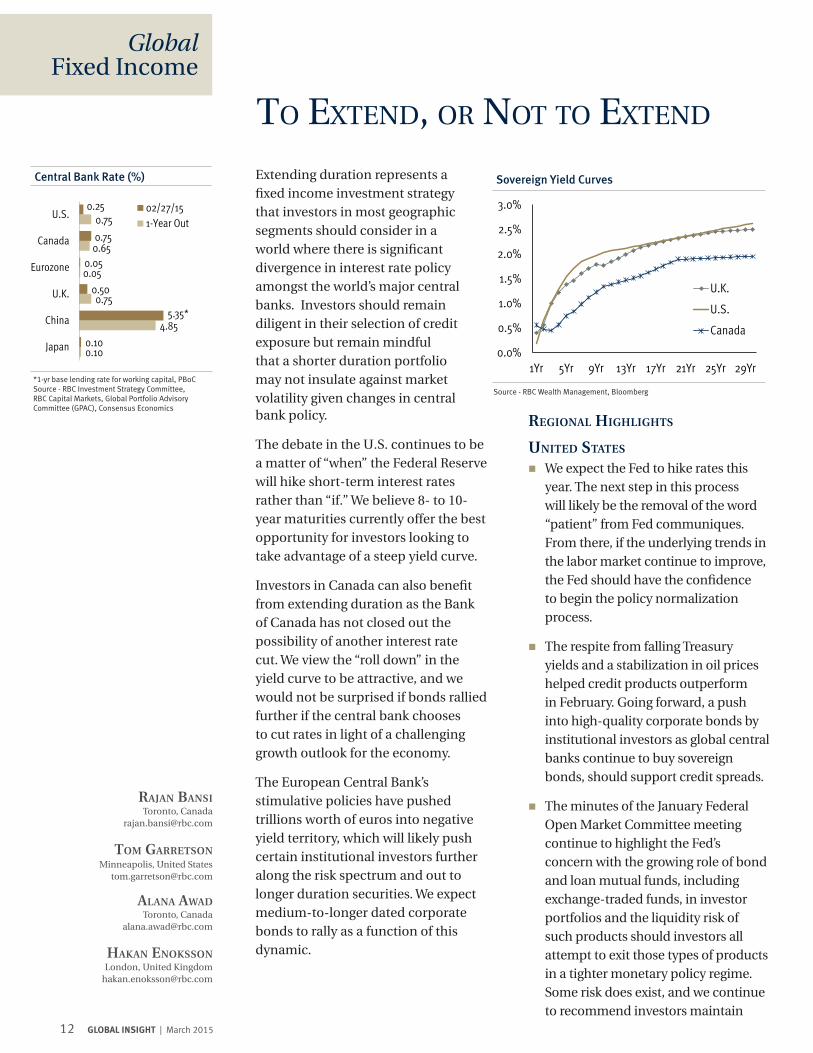
Extending duration represents a fixed income investment strategy that investors in most geographic segments should consider in a world where there is significant divergence in interest rate policy amongst the world’s major central banks. Investors should remain diligent in their selection of credit exposure but remain mindful that a shorter duration portfolio may not insulate against market volatility given changes in central bank policy.
The debate in the U.S. continues to be a matter of “when” the Federal Reserve will hike short-term interest rates rather than “if.” We believe 8- to 10-year maturities currently offer the best opportunity for investors looking to take advantage of a steep yield curve.
Investors in Canada can also benefit from extending duration as the Bank of Canada has not closed out the possibility of another interest rate cut. We view the “roll down” in the yield curve to be attractive, and we would not be surprised if bonds rallied further if the central bank chooses to cut rates in light of a challenging growth outlook for the economy.
The European Central Bank’s stimulative policies have pushed trillions worth of euros into negative yield territory, which will likely push certain institutional investors further along the risk spectrum and out to longer duration securities. We expect medium-to-longer dated corporate bonds to rally as a function of this dynamic.
Sovereign Yield Curves
Source - RBC Wealth Management, Bloomberg
0.0%
0.5%
1.0%
1.5%
2.0%
2.5%
3.0%
1Yr 5Yr 9Yr 13Yr 17Yr 21Yr 25Yr 29Yr
U.K.
U.S.
Canada
raJan Bansi
Toronto, Canada [email protected]
tom garretson Minneapolis, United States [email protected]
alana awad Toronto, Canada [email protected]
haKan enoKsson London, United Kingdom [email protected]
Global Fixed Income
*1-yr base lending rate for working capital, PBoC Source - RBC Investment Strategy Committee, RBC Capital Markets, Global Portfolio Advisory Committee (GPAC), Consensus Economics
Central Bank Rate (%)
0.10
4.85
0.75
0.05
0.65
0.75
0.10
5.35*
0.50
0.05
0.75
0.25
Japan
China
U.K.
Eurozone
Canada
U.S.02/27/151-Year Out
regional highlights
united states
�� We expect the Fed to hike rates this year. The next step in this process will likely be the removal of the word “patient” from Fed communiques. From there, if the underlying trends in the labor market continue to improve, the Fed should have the confidence to begin the policy normalization process.
�� The respite from falling Treasury yields and a stabilization in oil prices helped credit products outperform in February. Going forward, a push into high-quality corporate bonds by institutional investors as global central banks continue to buy sovereign bonds, should support credit spreads.
�� The minutes of the January Federal Open Market Committee meeting continue to highlight the Fed’s concern with the growing role of bond and loan mutual funds, including exchange-traded funds, in investor portfolios and the liquidity risk of such products should investors all attempt to exit those types of products in a tighter monetary policy regime. Some risk does exist, and we continue to recommend investors maintain
13 GLOBAL INSIGHT | March 2015
Global Fixed Income
0.50
NA
2.25
0.70
2.00
2.50
0.35
3.40
1.80
0.35
1.35
2.00
Japan
China
U.K.
Eurozone*
Canada
U.S.
02/27/151-Year Out
10-Year Rate (%)
*Eurozone utilizes German bunds.Source - RBC Investment Strategy Committee, RBC Capital Markets, GPAC
diversified portfolios, making this a prudent time to assess allocations to such products.
Canada
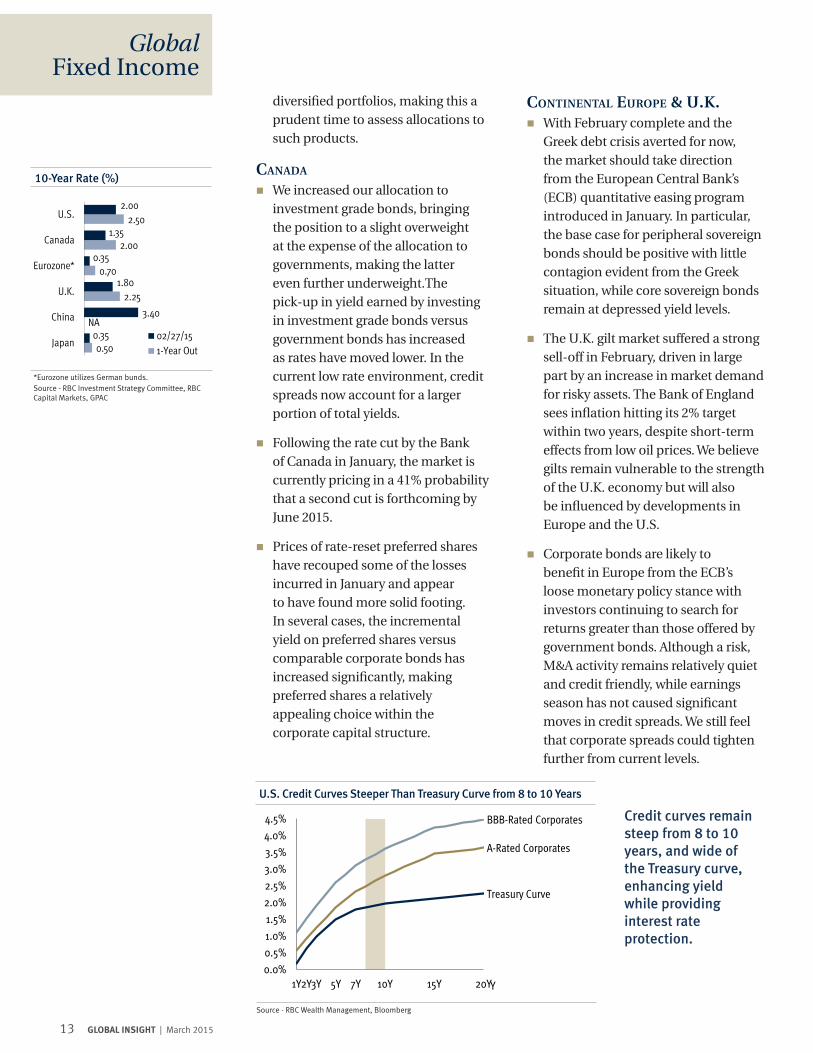
�� We increased our allocation to investment grade bonds, bringing the position to a slight overweight at the expense of the allocation to governments, making the latter even further underweight.The pick-up in yield earned by investing in investment grade bonds versus government bonds has increased as rates have moved lower. In the current low rate environment, credit spreads now account for a larger portion of total yields.
�� Following the rate cut by the Bank of Canada in January, the market is currently pricing in a 41% probability that a second cut is forthcoming by June 2015.
�� Prices of rate-reset preferred shares have recouped some of the losses incurred in January and appear to have found more solid footing. In several cases, the incremental yield on preferred shares versus comparable corporate bonds has increased significantly, making preferred shares a relatively appealing choice within the corporate capital structure.
Continental euroPe & u.K.�� With February complete and the
Greek debt crisis averted for now, the market should take direction from the European Central Bank’s (ECB) quantitative easing program introduced in January. In particular, the base case for peripheral sovereign bonds should be positive with little contagion evident from the Greek situation, while core sovereign bonds remain at depressed yield levels.
�� The U.K. gilt market suffered a strong sell-off in February, driven in large part by an increase in market demand for risky assets. The Bank of England sees inflation hitting its 2% target within two years, despite short-term effects from low oil prices. We believe gilts remain vulnerable to the strength of the U.K. economy but will also be influenced by developments in Europe and the U.S.
�� Corporate bonds are likely to benefit in Europe from the ECB’s loose monetary policy stance with investors continuing to search for returns greater than those offered by government bonds. Although a risk, M&A activity remains relatively quiet and credit friendly, while earnings season has not caused significant moves in credit spreads. We still feel that corporate spreads could tighten further from current levels.
Source - RBC Wealth Management, Bloomberg
U.S. Credit Curves Steeper Than Treasury Curve from 8 to 10 Years
0
0.2
0.4
0.6
0.8
1
0.0%
0.5%
1.0%
1.5%
2.0%
2.5%
3.0%
3.5%
4.0%
4.5%
1Y2Y3Y 5Y 7Y 10Y 15Y 20Y
BBB-Rated Corporates
A-Rated Corporates
Treasury Curve
Y
Credit curves remain steep from 8 to 10 years, and wide of the Treasury curve, enhancing yield while providing interest rate protection.
14 GLOBAL INSIGHT | March 2015
marK allen Toronto, Canada [email protected]
2015E 2016E
Oil (WTI $/bbl) 53.00 77.00
Natural Gas ($/mmBtu) 3.25 4.00
Gold ($/oz) 1,250 1,300
Copper ($/lb) 3.00 3.25
Corn ($/bu) 4.06 4.32
Wheat ($/bu) 5.31 5.58
Source - RBC Capital Markets forecasts (oil, natural gas, gold, and copper), Bloomberg consensus forecasts (corn and wheat).
Commodities
Commodity Forecasts
gold
�� Bar and coin investment was up q/q in Q4 2014, but is well below prior-year levels. Physical demand may be improving following the end of India’s 80:20 re-export rule in December. Demand from central banks is steady. ETF holdings are up modestly in early 2015, but remain low.
�� Mine supply was flat in 2014 as compared to the robust 2013 level.
�� Gold prices have traded at $1,150–$1,400/oz over the last 20 months. Lacking catalysts, this sideways pattern should continue near term.
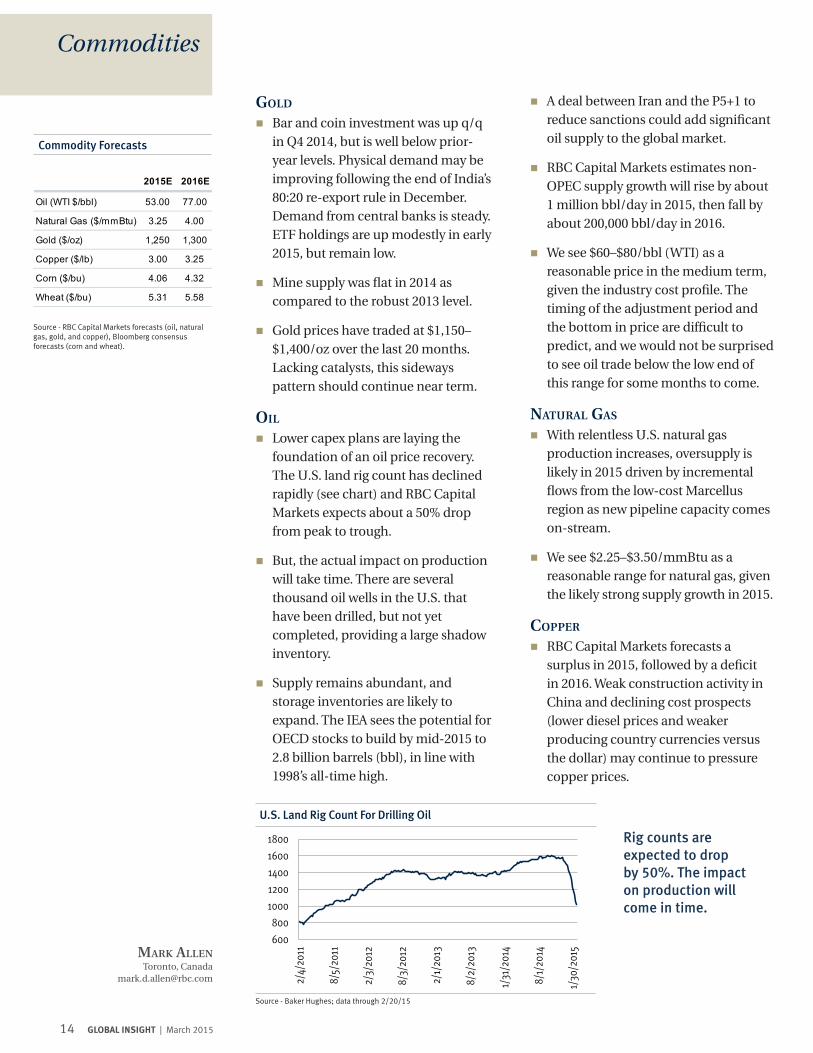
oil �� Lower capex plans are laying the
foundation of an oil price recovery. The U.S. land rig count has declined rapidly (see chart) and RBC Capital Markets expects about a 50% drop from peak to trough.
�� But, the actual impact on production will take time. There are several thousand oil wells in the U.S. that have been drilled, but not yet completed, providing a large shadow inventory.
�� Supply remains abundant, and storage inventories are likely to expand. The IEA sees the potential for OECD stocks to build by mid-2015 to 2.8 billion barrels (bbl), in line with 1998’s all-time high.
Source - Baker Hughes; data through 2/20/15
U.S. Land Rig Count For Drilling Oil
600
800
1000
1200
1400
1600
1800
2/4/
2011
8/5/
2011
2/3/
2012
8/3/
2012
2/1/
2013
8/2/
2013
1/31
/201
4
8/1/
2014
1/30
/201
5
Rig counts are expected to drop by 50%. The impact on production will come in time.
�� A deal between Iran and the P5+1 to reduce sanctions could add significant oil supply to the global market.
�� RBC Capital Markets estimates non-OPEC supply growth will rise by about 1 million bbl/day in 2015, then fall by about 200,000 bbl/day in 2016.
�� We see $60–$80/bbl (WTI) as a reasonable price in the medium term, given the industry cost profile. The timing of the adjustment period and the bottom in price are difficult to predict, and we would not be surprised to see oil trade below the low end of this range for some months to come.
natural gas �� With relentless U.S. natural gas
production increases, oversupply is likely in 2015 driven by incremental flows from the low-cost Marcellus region as new pipeline capacity comes on-stream.
�� We see $2.25–$3.50/mmBtu as a reasonable range for natural gas, given the likely strong supply growth in 2015.
CoPPer �� RBC Capital Markets forecasts a
surplus in 2015, followed by a deficit in 2016. Weak construction activity in China and declining cost prospects (lower diesel prices and weaker producing country currencies versus the dollar) may continue to pressure copper prices.
15 GLOBAL INSIGHT | March 2015
alan roBinson Seattle, United States [email protected]
u.s. dollar �� We expect the dollar rally to continue,
albeit at a slower pace than that seen in 2014. Our view is that foreign interest rates are unlikely to go much lower, and gradual Fed tightening is now the consensus view, which should limit the dollar to single-digit gains against most major currencies.
�� Although the strength of the dollar was mentioned in the most recent Fed minutes, we don’t think this will derail rate hikes. The U.S. economy is relatively unaffected by currency swings and can shoulder a stronger currency.
euro �� The euro fell to a 12-year low against
the dollar the day after the Greek election, and negotiations around debt restructuring continue to impact the currency. We believe a Greek exit from the single currency would be bad for all parties involved, and this realization seems to have stabilized the euro as traders view compromise as the only solution.
�� European economic data has picked up, the effect of quantitative easing (QE) has improved sentiment, and corporate earnings have benefitted from the weak euro. We believe these
factors have temporarily halted the decline of the currency, but with deflation still a threat to the eurozone, we expect the euro to move closer to parity against the dollar before partially recovering in 2016.
Canadian dollar �� The impact of lower oil prices on the
Canadian economy is likely to extend the monetary policy divergence between Canada and the U.S., and put further pressure on the loonie.
�� In addition, speculative short futures positions against the Canadian dollar are not as extreme as for other currencies, implying the recent pause may give way to further weakness.
�� Oil remains a wild card for the Canadian dollar, as a sudden recovery would likely bolster the loonie.
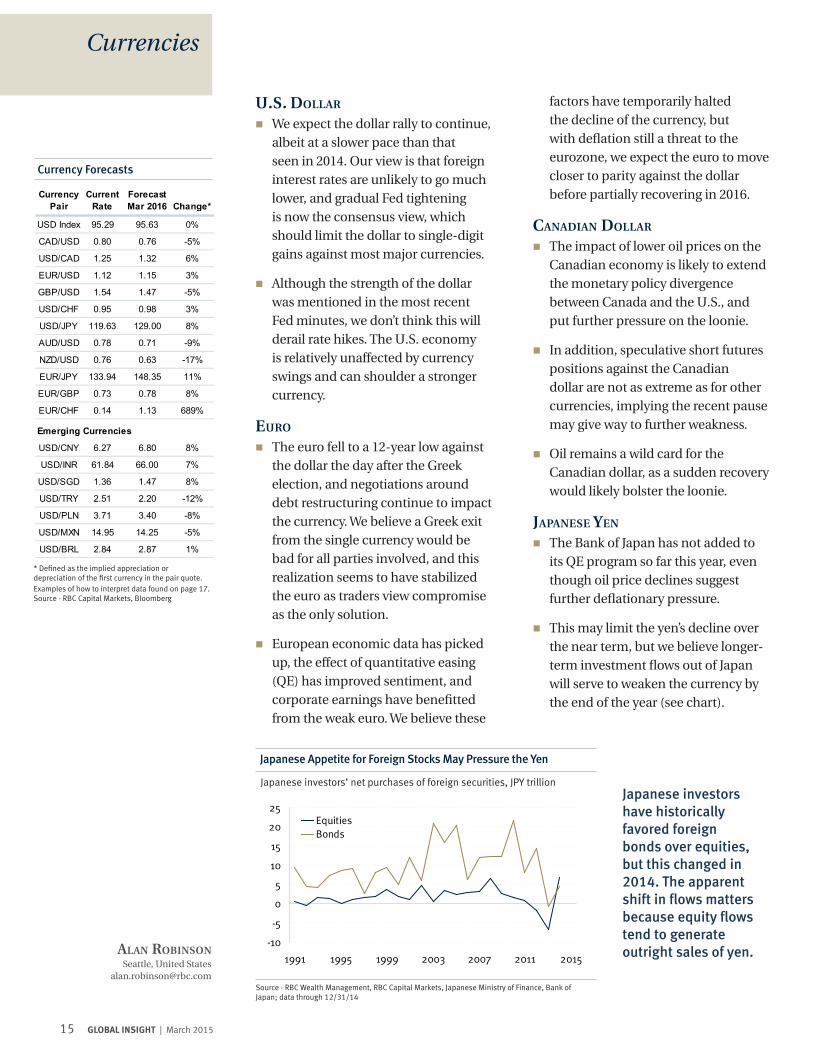
JaPanese Yen �� The Bank of Japan has not added to
its QE program so far this year, even though oil price declines suggest further deflationary pressure.
�� This may limit the yen’s decline over the near term, but we believe longer-term investment flows out of Japan will serve to weaken the currency by the end of the year (see chart).
Currency Pair
Current Rate
Forecast Mar 2016 Change*
USD Index 95.29 95.63 0%
CAD/USD 0.80 0.76 -5%
USD/CAD 1.25 1.32 6%
EUR/USD 1.12 1.15 3%
GBP/USD 1.54 1.47 -5%
USD/CHF 0.95 0.98 3%
USD/JPY 119.63 129.00 8%
AUD/USD 0.78 0.71 -9%
NZD/USD 0.76 0.63 -17%
EUR/JPY 133.94 148.35 11%
EUR/GBP 0.73 0.78 8%
EUR/CHF 0.14 1.13 689%
Emerging Currencies
USD/CNY 6.27 6.80 8%
USD/INR 61.84 66.00 7%
USD/SGD 1.36 1.47 8%
USD/TRY 2.51 2.20 -12%
USD/PLN 3.71 3.40 -8%
USD/MXN 14.95 14.25 -5%
USD/BRL 2.84 2.87 1%
* Defined as the implied appreciation or depreciation of the first currency in the pair quote. Examples of how to interpret data found on page 17. Source - RBC Capital Markets, Bloomberg
Currency Forecasts
Currencies
Source - RBC Wealth Management, RBC Capital Markets, Japanese Ministry of Finance, Bank of Japan; data through 12/31/14
Japanese Appetite for Foreign Stocks May Pressure the Yen
-10
-5
0
5
10
15
20
25
1991 1995 1999 2003 2007 2011 2015
EquitiesBonds
Japanese investors have historically favored foreign bonds over equities, but this changed in 2014. The apparent shift in flows matters because equity flows tend to generate outright sales of yen.
Japanese investors’ net purchases of foreign securities, JPY trillion
16 GLOBAL INSIGHT | March 2015
Canada — Energy Weakness�� After strong Q3, growth weakened in Q4 as oil
troubles hit employment and confidence ... RBC Canadian PMI has fallen 3 mos. running to Feb. Now below 50. New orders off highs.
�� Mfg. unfilled orders still elevated and rising. Housing construction steady. Energy capital spending plans down sharply.
Eurozone — Improving�� Q4 the 6th successive quarter of positive growth,
improved on Q3. Spain ahead of estimates, its 6th quarter running of expansion. Germany, Netherlands solid. France, Italy lagging. Bank private sector lending up first time in 2 years.
�� Regional PMIs suggest improvement for 2015, led by services. Germany and Spain positive. France, Italy still soft. Russia, Greece weighing on outlook.
United Kingdom — Solid�� Q4 GDP up (8th in a row) but softer than expected.
Services strong, construction and business capex weak. Unemployment lowest since Aug. 2008. PMI up again in Feb., suggesting good start to 2015. Production and new orders up, but export orders weak.
�� Growth pace sustainable for 2015, but potentially vulnerable to parliamentary elections in May.
China — Stabilising�� Q4 GDP at 7.3% slightly better than expected.
But, manufacturing PMI below 50 and weak LEIs, confidence suggest slowdown not over. New orders have weakened. Trade stronger into lunar new year.
�� Loan growth up again in latest month, still running faster than GDP growth. House prices and construction weaker on balance, car sales strong. Government has cut rates twice since November, more to come.
Japan — Volatile�� GDP growth rate looks to have rebounded in Q4.
Leading indicators and PMI better. New orders improving as are corporate earnings and business confidence.
�� Consumer confident, but not yet spending. Construction spending picking up. Falling oil prices putting inflation targets in jeopardy.
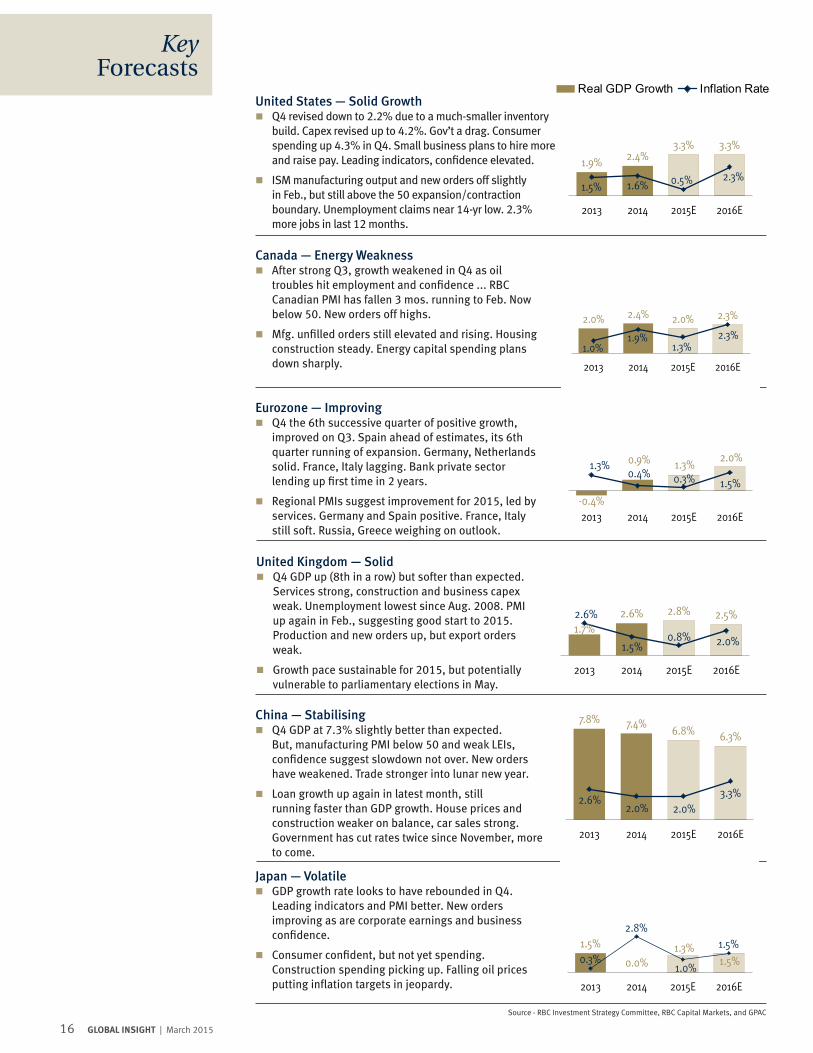
United States — Solid Growth�� Q4 revised down to 2.2% due to a much-smaller inventory
build. Capex revised up to 4.2%. Gov’t a drag. Consumer spending up 4.3% in Q4. Small business plans to hire more and raise pay. Leading indicators, confidence elevated.
�� ISM manufacturing output and new orders off slightly in Feb., but still above the 50 expansion/contraction boundary. Unemployment claims near 14-yr low. 2.3% more jobs in last 12 months.
1.9% 2.4%3.3% 3.3%
1.5% 1.6% 0.5% 2.3%
2013 2014 2015E 2016E
2.2% 1.9% 3.2% 3.2%1.8%1.8%1.5%1.7%2012 2013 2014E 2015E
Real GDP Growth Inflation Rate
(
2.0% 2.4% 2.0% 2.3%
1.0%1.9%
1.3%2.3%
2013 2014 2015E 2016E
1.7%2.6% 2.8% 2.5%2.6%
1.5%0.8% 2.0%
2013 2014 2015E 2016E
7.8% 7.4%6.8% 6.3%
2.6%2.0% 2.0%
3.3%
2013 2014 2015E 2016E
-0.4%
0.9% 1.3%2.0%
1.3%0.4% 0.3% 1.5%
2013 2014 2015E 2016E
1.5%
0.0%1.3%
1.5%0.3%
2.8%
1.0%
1.5%
2013 2014 2015E 2016E
Source - RBC Investment Strategy Committee, RBC Capital Markets, and GPAC
Key Forecasts
17 GLOBAL INSIGHT | March 2015
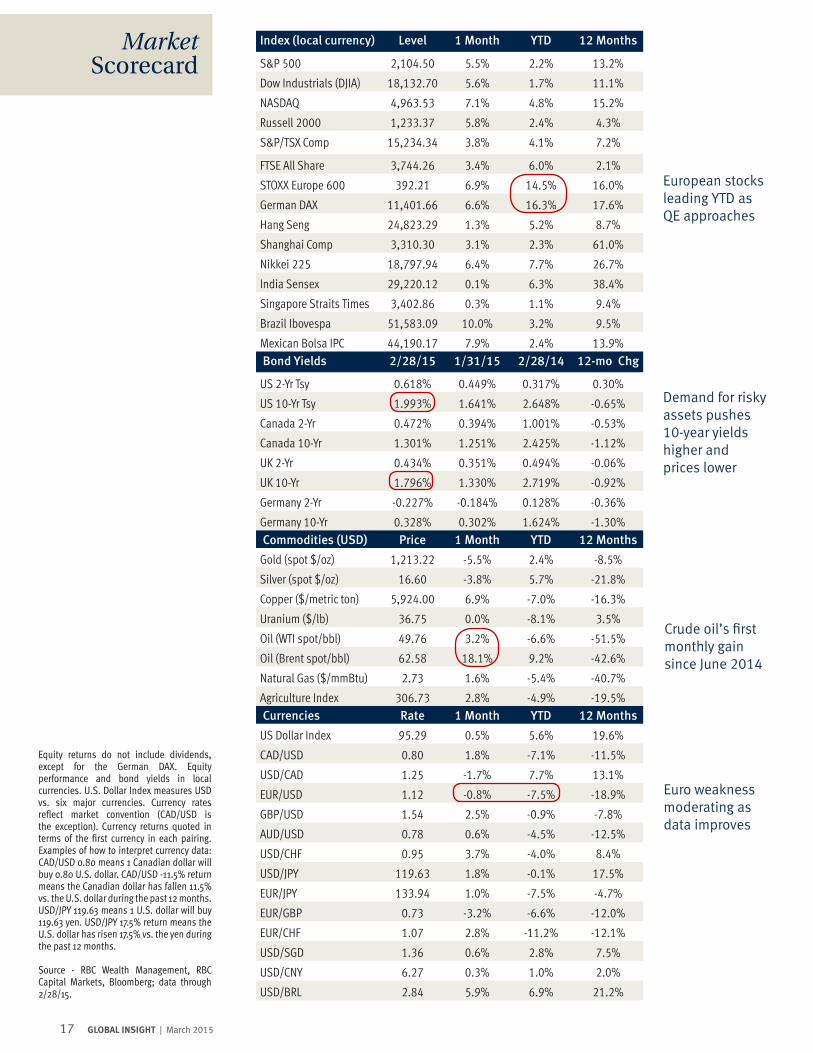
Index (local currency) Level 1 Month YTD 12 Months
S&P 500 2,104.50 5.5% 2.2% 13.2%
Dow Industrials (DJIA) 18,132.70 5.6% 1.7% 11.1%
NASDAQ 4,963.53 7.1% 4.8% 15.2%
Russell 2000 1,233.37 5.8% 2.4% 4.3%
S&P/TSX Comp 15,234.34 3.8% 4.1% 7.2%
FTSE All Share 3,744.26 3.4% 6.0% 2.1%
STOXX Europe 600 392.21 6.9% 14.5% 16.0%
German DAX 11,401.66 6.6% 16.3% 17.6%
Hang Seng 24,823.29 1.3% 5.2% 8.7%
Shanghai Comp 3,310.30 3.1% 2.3% 61.0%
Nikkei 225 18,797.94 6.4% 7.7% 26.7%
India Sensex 29,220.12 0.1% 6.3% 38.4%
Singapore Straits Times 3,402.86 0.3% 1.1% 9.4%
Brazil Ibovespa 51,583.09 10.0% 3.2% 9.5%
Mexican Bolsa IPC 44,190.17 7.9% 2.4% 13.9% Bond Yields 2/28/15 1/31/15 2/28/14 12-mo Chg
US 2-Yr Tsy 0.618% 0.449% 0.317% 0.30%
US 10-Yr Tsy 1.993% 1.641% 2.648% -0.65%
Canada 2-Yr 0.472% 0.394% 1.001% -0.53%
Canada 10-Yr 1.301% 1.251% 2.425% -1.12%
UK 2-Yr 0.434% 0.351% 0.494% -0.06%
UK 10-Yr 1.796% 1.330% 2.719% -0.92%
Germany 2-Yr -0.227% -0.184% 0.128% -0.36%
Germany 10-Yr 0.328% 0.302% 1.624% -1.30% Commodities (USD) Price 1 Month YTD 12 Months
Gold (spot $/oz) 1,213.22 -5.5% 2.4% -8.5%
Silver (spot $/oz) 16.60 -3.8% 5.7% -21.8%
Copper ($/metric ton) 5,924.00 6.9% -7.0% -16.3%
Uranium ($/lb) 36.75 0.0% -8.1% 3.5%
Oil (WTI spot/bbl) 49.76 3.2% -6.6% -51.5%
Oil (Brent spot/bbl) 62.58 18.1% 9.2% -42.6%
Natural Gas ($/mmBtu) 2.73 1.6% -5.4% -40.7%
Agriculture Index 306.73 2.8% -4.9% -19.5% Currencies Rate 1 Month YTD 12 Months
US Dollar Index 95.29 0.5% 5.6% 19.6%
CAD/USD 0.80 1.8% -7.1% -11.5%
USD/CAD 1.25 -1.7% 7.7% 13.1%
EUR/USD 1.12 -0.8% -7.5% -18.9%
GBP/USD 1.54 2.5% -0.9% -7.8%
AUD/USD 0.78 0.6% -4.5% -12.5%
USD/CHF 0.95 3.7% -4.0% 8.4%
USD/JPY 119.63 1.8% -0.1% 17.5%
EUR/JPY 133.94 1.0% -7.5% -4.7%
EUR/GBP 0.73 -3.2% -6.6% -12.0%
EUR/CHF 1.07 2.8% -11.2% -12.1%
USD/SGD 1.36 0.6% 2.8% 7.5%
USD/CNY 6.27 0.3% 1.0% 2.0%
USD/BRL 2.84 5.9% 6.9% 21.2%
Equity returns do not include dividends, except for the German DAX. Equity performance and bond yields in local currencies. U.S. Dollar Index measures USD vs. six major currencies. Currency rates reflect market convention (CAD/USD is the exception). Currency returns quoted in terms of the first currency in each pairing. Examples of how to interpret currency data: CAD/USD 0.80 means 1 Canadian dollar will buy 0.80 U.S. dollar. CAD/USD -11.5% return means the Canadian dollar has fallen 11.5% vs. the U.S. dollar during the past 12 months. USD/JPY 119.63 means 1 U.S. dollar will buy 119.63 yen. USD/JPY 17.5% return means the U.S. dollar has risen 17.5% vs. the yen during the past 12 months.
Source - RBC Wealth Management, RBC Capital Markets, Bloomberg; data through 2/28/15.
Market Scorecard
Euro weakness moderating as data improves
European stocks leading YTD as QE approaches
Demand for risky assets pushes 10-year yields higher and prices lower
Crude oil’s first monthly gain since June 2014

18 GLOBAL INSIGHT | March 2015
This document is produced by the Global Portfolio Advisory Committee within RBC Wealth Management’s Portfolio Advisory Group. The RBC Wealth Management Portfolio Advisory Group provides support related to asset allocation and portfolio construction for the firm’s Investment Advisors / Financial Advisors who are engaged in assembling portfolios incorporating individual marketable securities. The Committee leverages the broad market outlook as developed by the RBC Investment Strategy Committee, providing additional tactical and thematic support utilizing research from the RBC Investment Strategy Committee, RBC Capital Markets, and third-party resources.
Global Portfolio Advisory Committee members: Janet Engels – Co-chair; Head of U.S. Equities, RBC Wealth Management Portfolio Advisory Group, RBC Capital Markets, LLC
Jim Allworth – Co-chair; Investment Strategist, RBC Dominion Securities Inc.
Maarten Jansen – Head, Investments & Trading, RBC Wealth Management Global Wealth Services Group, RBC Dominion Securities Inc.
Mark Allen – Portfolio Advisor, RBC Wealth Management Portfolio Advisory Group, RBC Dominion Securities Inc.
Rajan Bansi – Head of Fixed Income Strategies, RBC Wealth Management Portfolio Advisory Group, RBC Dominion Securities Inc.
Matt Barasch – Head of Canadian Equities, RBC Wealth Management Portfolio Advisory Group, RBC Dominion Securities Inc.
Craig Bishop – Lead Strategist, U.S. Fixed Income Strategies Group, RBC Wealth Management Portfolio Advisory Group, RBC Capital Markets, LLC
Kelly Bogdanov – Portfolio Analyst, RBC Wealth Management Portfolio Advisory Group, RBC Capital Markets, LLC
Frédérique Carrier – Director, European Equities, Royal Bank of Canada Investment Management (U.K.) Ltd.
George King IV – Head of Portfolio Strategy, Royal Bank of Canada Investment Management (U.K.) Ltd.
René Morgenthaler – Head of Investment, RBC (Suisse) SA, RBC International Wealth Management
Alan Robinson – Portfolio Advisor, RBC Wealth Management Portfolio Advisory Group, RBC Capital Markets, LLC
Jay Roberts – Head of Equity Advisory, Wealth Management Hong Kong, RBC Dominion Securities Inc.
The RBC Investment Strategy Committee (RISC), consists of senior investment professionals drawn from individual, client-focused business units within RBC, including the Portfolio Advisory Group. The RBC Investment Strategy Committee builds a broad global investment outlook and develops specific guidelines that can be used to manage portfolios. RISC is chaired by Daniel Chornous, CFA, Chief Investment Officer of RBC Global Asset Management Inc.
REsEARch REsoURcEs
19 GLOBAL INSIGHT | March 2015
REqUiREd disclosUREsAnalyst Certification All of the views expressed in this report accurately reflect the personal views of the responsible analyst(s) about any and all of the subject securities or issuers. No part of the compensation of the responsible analyst(s) named herein is, or will be, directly or indirectly, related to the specific recommendations or views expressed by the responsible analyst(s) in this report.
Important DisclosuresIn the U.S., RBC Wealth Management operates as a division of RBC Capital Mar-kets, LLC. In Canada, RBC Wealth Management includes, without limitation, RBC Dominion Securities Inc., which is a foreign affiliate of RBC Capital Markets, LLC. This report has been prepared by RBC Capital Markets, LLC which is an indirect wholly-owned subsidiary of the Royal Bank of Canada and, as such, is a related issuer of Royal Bank of Canada.
Non-U.S. Analyst Disclosure: Mark Allen, Jim Allworth, Alana Awad, Rajan Bansi, Matt Barasch, and Jay Roberts, employees of RBC Wealth Management USA’s foreign affiliate RBC Dominion Securities Inc.; and Frédérique Carrier, and Hakan Enoksson, employees of RBC Wealth Management USA’s foreign affiliate Royal Bank of Canada Investment Management (UK) Limited; contributed to the preparation of this publication. These individuals are not registered with or qualified as research analysts with the U.S. Financial Industry Regulatory Authority (“FINRA”) and, since they are not associated persons of RBC Wealth Management, they may not be subject to NASD Rule 2711 and Incorporated NYSE Rule 472 governing communications with subject companies, the mak-ing of public appearances, and the trading of securities in accounts held by research analysts.
In the event that this is a compendium report (covers six or more companies), RBC Wealth Management may choose to provide important disclosure informa-tion by reference. To access current disclosures, clients should refer to http://www.rbccm.com/GLDisclosure/PublicWeb/DisclosureLookup.aspx?EntityID=2 to view disclosures regarding RBC Wealth Management and its affiliated firms. Such information is also available upon request to RBC Wealth Management Publishing, 60 South Sixth St, Minneapolis, MN 55402.
References to a Recommended List in the recommendation history chart may include one or more recommended lists or model portfolios maintained by RBC Wealth Management or one of its affiliates. RBC Wealth Management recom-mended lists include the Guided Portfolio: Prime Income (RL 6), the Guided Portfolio: Large Cap (RL 7), the Guided Portfolio: Dividend Growth (RL 8), the Guided Portfolio: Midcap 111 (RL9), the Guided Portfolio: ADR (RL 10), and the Guided Portfolio: Global Equity (U.S.) (RL 11). RBC Capital Markets recommend-ed lists include the Strategy Focus List and the Fundamental Equity Weightings (FEW) portfolios. The abbreviation ‘RL On’ means the date a security was placed on a Recommended List. The abbreviation ‘RL Off’ means the date a security was removed from a Recommended List.
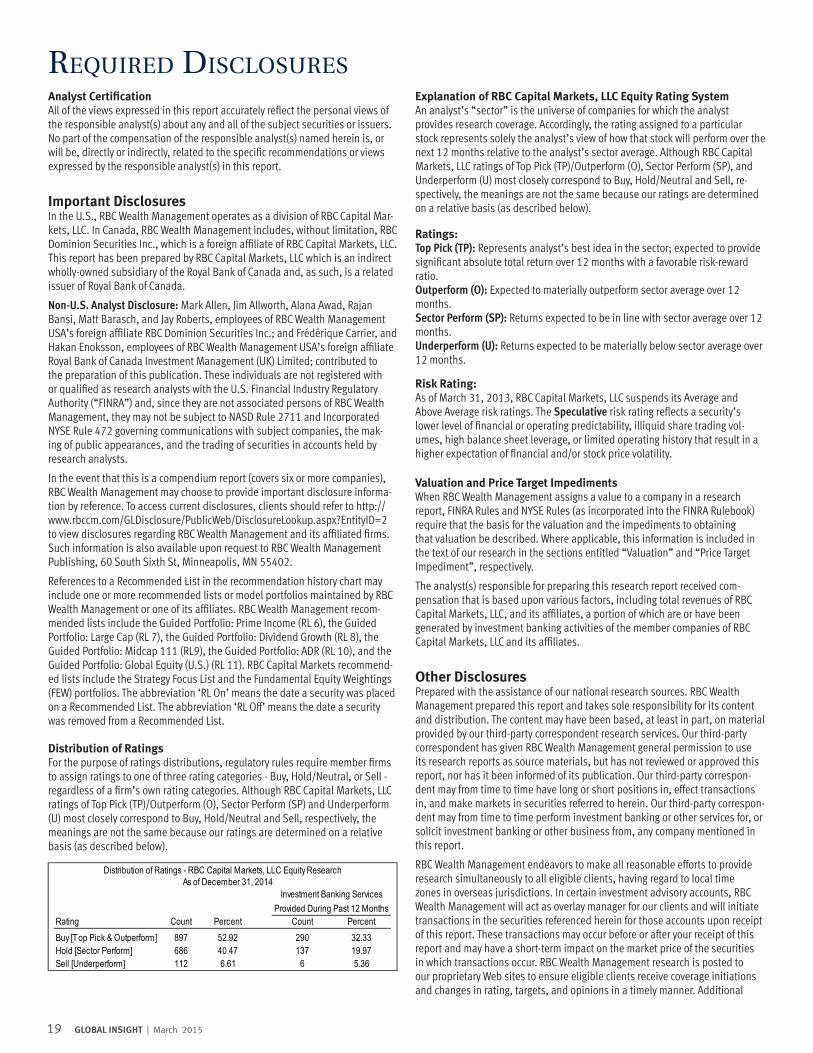
Distribution of RatingsFor the purpose of ratings distributions, regulatory rules require member firms to assign ratings to one of three rating categories - Buy, Hold/Neutral, or Sell - regardless of a firm’s own rating categories. Although RBC Capital Markets, LLC ratings of Top Pick (TP)/Outperform (O), Sector Perform (SP) and Underperform (U) most closely correspond to Buy, Hold/Neutral and Sell, respectively, the meanings are not the same because our ratings are determined on a relative basis (as described below).
Explanation of RBC Capital Markets, LLC Equity Rating SystemAn analyst’s “sector” is the universe of companies for which the analyst provides research coverage. Accordingly, the rating assigned to a particular stock represents solely the analyst’s view of how that stock will perform over the next 12 months relative to the analyst’s sector average. Although RBC Capital Markets, LLC ratings of Top Pick (TP)/Outperform (O), Sector Perform (SP), and Underperform (U) most closely correspond to Buy, Hold/Neutral and Sell, re-spectively, the meanings are not the same because our ratings are determined on a relative basis (as described below).
Ratings:Top Pick (TP): Represents analyst’s best idea in the sector; expected to provide significant absolute total return over 12 months with a favorable risk-reward ratio.Outperform (O): Expected to materially outperform sector average over 12 months.Sector Perform (SP): Returns expected to be in line with sector average over 12 months.Underperform (U): Returns expected to be materially below sector average over 12 months.
Risk Rating:As of March 31, 2013, RBC Capital Markets, LLC suspends its Average and Above Average risk ratings. The Speculative risk rating reflects a security’s lower level of financial or operating predictability, illiquid share trading vol-umes, high balance sheet leverage, or limited operating history that result in a higher expectation of financial and/or stock price volatility.
Valuation and Price Target ImpedimentsWhen RBC Wealth Management assigns a value to a company in a research report, FINRA Rules and NYSE Rules (as incorporated into the FINRA Rulebook) require that the basis for the valuation and the impediments to obtaining that valuation be described. Where applicable, this information is included in the text of our research in the sections entitled “Valuation” and “Price Target Impediment”, respectively.
The analyst(s) responsible for preparing this research report received com-pensation that is based upon various factors, including total revenues of RBC Capital Markets, LLC, and its affiliates, a portion of which are or have been generated by investment banking activities of the member companies of RBC Capital Markets, LLC and its affiliates.
Other DisclosuresPrepared with the assistance of our national research sources. RBC Wealth Management prepared this report and takes sole responsibility for its content and distribution. The content may have been based, at least in part, on material provided by our third-party correspondent research services. Our third-party correspondent has given RBC Wealth Management general permission to use its research reports as source materials, but has not reviewed or approved this report, nor has it been informed of its publication. Our third-party correspon-dent may from time to time have long or short positions in, effect transactions in, and make markets in securities referred to herein. Our third-party correspon-dent may from time to time perform investment banking or other services for, or solicit investment banking or other business from, any company mentioned in this report.
RBC Wealth Management endeavors to make all reasonable efforts to provide research simultaneously to all eligible clients, having regard to local time zones in overseas jurisdictions. In certain investment advisory accounts, RBC Wealth Management will act as overlay manager for our clients and will initiate transactions in the securities referenced herein for those accounts upon receipt of this report. These transactions may occur before or after your receipt of this report and may have a short-term impact on the market price of the securities in which transactions occur. RBC Wealth Management research is posted to our proprietary Web sites to ensure eligible clients receive coverage initiations and changes in rating, targets, and opinions in a timely manner. Additional
As of December 31, 2014
Rating Count Percent Count PercentBuy [Top Pick & Outperform] 897 52.92 290 32.33Hold [Sector Perform] 686 40.47 137 19.97Sell [Underperform] 112 6.61 6 5.36
Investment Banking Services Provided During Past 12 Months
Distribution of Ratings - RBC Capital Markets, LLC Equity Research
20 GLOBAL INSIGHT | March 2015
distribution may be done by sales personnel via e-mail, fax, or regular mail. Clients may also receive our research via third-party vendors. Please contact your RBC Wealth Management Financial Advisor for more information regarding RBC Wealth Management research.
Conflicts Disclosure: RBC Wealth Management is registered with the Securi-ties and Exchange Commission as a broker/dealer and an investment adviser, offering both brokerage and investment advisory services. RBC Wealth Man-agement’s Policy for Managing Conflicts of Interest in Relation to Investment Research is available from us on our Web site at http://www.rbccm.com/GLDis-closure/PublicWeb/DisclosureLookup.aspx?EntityID=2. Conflicts of interests related to our investment advisory business can be found in Part II of the Firm’s Form ADV or the Investment Advisor Group Disclosure Document. Copies of any of these documents are available upon request through your Financial Advisor. We reserve the right to amend or supplement this policy, Part II of the ADV, or Disclosure Document at any time.
The authors are employed by one of the following entities: RBC Wealth Manage-ment USA, a division of RBC Capital Markets, LLC, a securities broker-dealer with principal offices located in Minnesota and New York, USA; by RBC Dominion Securities Inc., a securities broker-dealer with principal offices located in Toronto, Canada; by RBC Investment Services (Asia) Limited, a subsidiary of RBC Dominion Securities Inc., a securities broker-dealer with principal offices located in Hong Kong, China; and by Royal Bank of Canada Investment Manage-ment (U.K.) Limited, an investment management company with principal offices located in London, United Kingdom.
The Global Industry Classification Standard (“GICS”) was developed by and is the exclu-sive property and a service mark of MSCI Inc. (“MSCI”) and Standard & Poor’s Financial Services LLC (“S&P”) and is licensed for use by RBC. Neither MSCI, S&P, nor any other party involved in making or compiling the GICS or any GICS classifications makes any express or implied warranties or representations with respect to such standard or clas-sification (or the results to be obtained by the use thereof), and all such parties hereby expressly disclaim all warranties of originality, accuracy, completeness, merchantability and fitness for a particular purpose with respect to any of such standard or classification. Without limiting any of the foregoing, in no event shall MSCI, S&P, any of their affiliates or any third party involved in making or compiling the GICS or any GICS classifications have any liability for any direct, indirect, special, punitive, consequential or any other damages (including lost profits) even if notified of the possibility of such damages.
DisclaimerThe information contained in this report has been compiled by RBC Wealth Management, a division of RBC Capital Markets, LLC, from sources believed to be reliable, but no representation or warranty, express or implied, is made by Royal Bank of Canada, RBC Wealth Management, its affiliates or any other person as to its accuracy, completeness or correctness. All opinions and estimates contained in this report constitute RBC Wealth Management’s judg-ment as of the date of this report, are subject to change without notice and are provided in good faith but without legal responsibility. Past performance is not a guide to future performance, future returns are not guaranteed, and a loss of original capital may occur. Every province in Canada, state in the U.S., and most countries throughout the world have their own laws regulating the types of securities and other investment products which may be offered to their residents, as well as the process for doing so. As a result, the securities discussed in this report may not be eligible for sale in some jurisdictions. This report is not, and under no circumstances should be construed as, a solicitation to act as securities broker or dealer in any jurisdiction by any person or company that is not legally permitted to carry on the business of a securities broker or dealer in that jurisdiction. Nothing in this report constitutes legal, accounting or tax advice or individually tailored investment advice. This material is prepared for general circulation to clients, including clients who are affiliates of Royal Bank of Canada, and does not have regard to the particular circumstances or needs of any specific person who may read it. The investments or services contained in this report may not be suitable for you and it is recommended that you consult an independent investment advisor if you are in doubt about the suitability of such investments or services. To the full extent permitted by law neither Royal Bank of Canada nor any of its affiliates, nor any other person, accepts any liability whatsoever for any direct or consequential loss arising from any use of this report or the information contained herein. No matter contained
in this document may be reproduced or copied by any means without the prior consent of Royal Bank of Canada. In the U.S., RBC Wealth Management operates as a division of RBC Capital Markets, LLC. In Canada, RBC Wealth Management includes, without limitation, RBC Dominion Securities Inc., which is a foreign af-filiate of RBC Capital Markets, LLC. This report has been prepared by RBC Capital Markets, LLC. Additional information is available upon request.
To U.S. Residents: This publication has been approved by RBC Capital Markets, LLC, Member NYSE/FINRA/SIPC, which is a U.S. registered broker-dealer and which accepts responsibility for this report and its dissemination in the United States. RBC Capital Markets, LLC, is an indirect wholly-owned subsidiary of the Royal Bank of Canada and, as such, is a related issuer of Royal Bank of Canada. Any U.S. recipient of this report that is not a registered broker-dealer or a bank acting in a broker or dealer capacity and that wishes further information regard-ing, or to effect any transaction in, any of the securities discussed in this report, should contact and place orders with RBC Capital Markets, LLC. International investing involves risks not typically associated with U.S. investing, including currency fluctuation, foreign taxation, political instability and different account-ing standards.
To Canadian Residents: This publication has been approved by RBC Dominion Securities Inc. RBC Dominion Securities Inc.* and Royal Bank of Canada are separate corporate entities which are affiliated. *Member-Canadian Investor Protection Fund. ®Registered trademark of Royal Bank of Canada. Used under license. RBC Wealth Management is a registered trademark of Royal Bank of Canada. Used under license.
To European Residents: Clients of United Kingdom subsidiaries may be entitled to compensation from the UK Financial Services Compensation Scheme if any of these entities cannot meet its obligations. This depends on the type of busi-ness and the circumstances of the claim. Most types of investment business are covered for up to a total of £50,000. The Channel Islands subsidiaries are not covered by the UK Financial Services Compensation Scheme; the offices of Royal Bank of Canada (Channel Islands) Limited in Guernsey and Jersey are covered by the respective compensation schemes in these jurisdictions for deposit taking business only.
To Hong Kong Residents: This publication is distributed in Hong Kong by RBC Investment Services (Asia) Limited and RBC Investment Management (Asia) Limited, licensed corporations under the Securities and Futures Ordinance or, by Royal Bank of Canada, Hong Kong Branch, a registered institution under the Securities and Futures Ordinance. This material has been prepared for general circulation and does not take into account the objectives, financial situation, or needs of any recipient. Hong Kong persons wishing to obtain further informa-tion on any of the securities mentioned in this publication should contact RBC Investment Services (Asia) Limited, RBC Investment Management (Asia) Limited or Royal Bank of Canada, Hong Kong Branch at 17/Floor, Cheung Kong Center, 2 Queen’s Road Central, Hong Kong (telephone number is 2848-1388).
To Singapore Residents: This publication is distributed in Singapore by RBC (Singapore Branch) and RBC (Asia) Limited, registered entities granted offshore bank status by the Monetary Authority of Singapore. This material has been prepared for general circulation and does not take into account the objectives, financial situation, or needs of any recipient. You are advised to seek indepen-dent advice from a financial adviser before purchasing any product. If you do not obtain independent advice, you should consider whether the product is suitable for you. Past performance is not indicative of future performance.
Copyright © RBC Capital Markets, LLC 2015 - Member NYSE/FINRA/SIPCCopyright © RBC Dominion Securities Inc. 2015 - Member CIPF Copyright © RBC Europe Limited 2015Copyright © Royal Bank of Canada 2015All rights reserved