marc j. assael, leandros ch. paschalidis, george p ...zlist.webd.pl/eaot/2015/02/001.pdf ·...
TRANSCRIPT

THE ARCHIVES OF TRANSPORT ISSN (print): 0866-9546
Volume 34, Issue 2, 2015 e-ISSN (online): 2300-8830
DOI: 10.5604/08669546.1169206
7
EVALUATION OF THE EFFECTS OF FIRES AND EXPLOSIONS IN THE TRANSPORT
OF HAZARDOUS MATERIALS
Marc J. Assael, Leandros Ch. Paschalidis, George P. Sakellaropoulos1
Aristotle University of Thessaloniki, Faculty of Engineering, Department of Chemical
Engineering, Thessaloniki, Greece 1e-mail: [email protected]
Abstract: Transportation of liquid and gaseous fuels and chemicals, albeit not frequent, can lead to serious
dangers for humans, the environment and property due to fires and explosions. The two most common
transportation modes on land are tanker trucks and pipelines. The effects of fires and explosions in such
transportations can be modelled successfully to describe observed damages, as discussed here for three
different types of accidents, namely tanker trucks carrying liquefied natural gas (LNG) or liquefied petroleum
gas (LPG), and a gas pipeline, resulting in ignition and explosion. The effects of overpressure due to
explosion and of radiated heat by fires are effectively modelled. The methodology and the developed e-
platform are valuable teaching tools for engineers and civic personnel in order to foresee and assess risk and
accident consequences near inhabited areas, and/or to predict alternate routes.
Key words: hazardous materials, fires, explosions, road transport, ADR vehicles, pipelines
1. Introduction
Hazardous goods include all fuels (solid, liquid or
gas), chemicals which are flammable, toxic,
poisonous, oxidizing and explosive, materials that
are radioactive or corrosive, etc. Transportation of
such dangerous materials by road, rail, sea, inland
waterways, or air are regulated by the corresponding
international treaties ADR (European Agreement
concerning the International Carriage of Dangerous
Goods by Road), RID (European Agreements
Concerning the International Carriage of Dangerous
Goods by Rail), IMDG (International Maritime
Dangerous Goods Code), ADN (European
Agreement concerning the International Carriage of
Dangerous Goods by Inland Waterways), and ICAO
(International Civil Aviation Organization),
respectively, which have been endorsed by almost
all European countries.
Although a number of databases provide some
information on the transportation of goods, their
analyses on dangerous materials and the impact of
related accidents are often incomplete. For the
movements of hazardous materials in the USA, a
good source is the annual reports of the National
Transportation Board (NTSB, 2014). In 2004, over
1.5 billion tons of hazardous materials were shipped
by truck, rail, water, and air in the USA. Reports on
accidental releases numbered about 13 fatalities, 289
injuries and $52.6 million in reported damages
(NTSB, 2014).
For the UK, a corresponding good source of
information on the road transportation of hazardous
materials is given in Transport Statistics Great
Britain 2014 an annual report published by the
Department of Transport (2014). In the UK,
historical records show that the transportation of
hazardous chemicals by road is not a real problem.
Kletz (1986) showed that from 1970 to 1982, an
average of 1.2 people per year were killed by road
accidents involving the transportation of chemicals
or gasoline. Though this is a 1.2 too many, it has to
be compared with 6,000 deaths per year from road
accidents of all sorts. However, incidents killing
many people have happened in many other countries
(Sinton, 1983 and Lees, 2003).
An alternative to road transport for the high volumes
of petroleum, natural gas and liquid or gaseous
chemicals is pipeline transport. Only for the
transmission of natural gas in 2014, EU has a
pipeline network of 143 000 km, up to 120 cm in
diameter, with an incident rate of 0.33 per year and
1000 km (EGIG, 2015). Pipeline accidents can be
devastating, with scores of fatalities and injuries.
and high property damage costs.
In assessing the risk of accidents involving
dangerous materials, a vital step is the evaluation of
the hazard nature and zone analysis

Marc J. Assael, Leandros Ch. Paschalidis, George P. Sakellaropoulos
Evaluation of the effects of fires and explosions in the transport of hazardous materials
8
(Sakellaropoulos et al., 2014; Assael and
Kakosimos, 2010b). This paper addresses the
accidents occurring during the transport by road or
pipeline, and concentrates on the evaluation of the
effects of fires and explosions in the case of
hazardous materials. It is our intention to show that
today one can relatively easily calculate such effects
on humans and property, train engineers and civic
personnel to evaluate alternatives and minimize
probable losses.
In the following sections first a brief description of
the quantification of hazardous effect of fires and
explosions will be presented. Following this,
accidents related to road and pipeline transport will
be discussed in turn, each described with a typical
case study.
2. Quantifying Hazardous Effects
In order to quantify the hazardous effects of leaks
from tanker trucks carrying fuels or from a pipeline
we examine below the possible development of fire
or explosion following a leak. A risk assessment
procedure involves the following steps:
1. Hazard identification
2. Failure case definition
3. Failure frequency
4. Hazard zone analysis
5. Public risk quantification
6. Risk Assessment (acceptable risk values)
An event tree analysis followed by statistical data of
previous accidents and suitable algorithms permits
the evaluation of the consequences of such events.
Figure 1 shows the probable consequences resulting
from a gas or liquid fuel leak from a tank truck (or
road tanker in the UK), or a pipeline. With the
exception of the flash fire (sudden ignition of a cloud
of flammable gases, where the flame is not
accelerated by the presence of obstacles or turbulent
dispersion), the effects from the other three type of
fires and from explosions can be calculated.
Fig. 1. Probable consequences resulting from a gas or liquid fuel leak
Source: Assael and Kakosimos (2010b).

AoT Vol. 34/Issue 2 2015
9
In the case of fires, damages are a direct
consequence of the generated heat flux. There are
many models to calculate the generated heat flux.
However, the solid-flame model is the most widely
used today, as it can, with care, easily be applied in
most cases. In the “solid-flame” approach the flame
is treated as a solid object that radiates heat from its
visible surface. The heat flux q’ (W/m2) in a certain
distance, is obtained from:
act view α'q SEP F (1)
where, SEPact (W/m2) denotes the actual surface
emitting power, Fview (-), the view factor, and τα (-)
the atmospheric transmissivity. In the above
relation, the surface emitting power is calculated
empirically as a function of the burning rate and
takes into consideration the fraction of the flame
covered by soot, while the view factor depends upon
the shape of the flame, the presence of wind and the
distance of the receptor from the external flame
surface. Finally, the atmospheric transmissivity
takes into consideration the part of the heat flux
absorbed by the air which is between the flame and
the receptor of the radiation. Having obtained the
heat flux as a function of the distance, empirical
probit functions are employed (Assael and
Kakosimos, 2010b) to calculate the probability of
injury or death and the effects of radiation on
materials.
While in the case of fires, one calculates the heat flux
as a function of distance, in explosions one
calculates the resulting overpressure as a
function of distance. A simplified method usually
employed to characterize the power of an explosion,
is the Equivalent TNT Method. According to this
method, the power of the explosion equates to an
equivalent mass of TNT (tri-nitrotoluene) that would
produce the same explosive power. First, the mass
of the flammable gas in the cloud with
concentrations between the lower and the upper
flammability limits is estimated. This mass is
consequently multiplied by the heat of combustion
to obtain the total available energy of combustion.
This energy is multiplied by a parameter (0 to 1) that
accounts for the non-ideality of the explosion, and
then divided with the heat of combustion of TNT, in
order to calculate the equivalent TNT mass. The
equivalent TNT mass is employed for the
calculation of the shock wave in a specific distance
from the source.
Unconfined vapor cloud explosions (VCE), are
usually calculated by the Multi Energy Method
(Assael and Kakosimos, 2010b). The method
assumes that the VCE is composed of a number of
subexplosions taking place inside the cloud. Initially
the dimensions of the cloud, based upon the amount
of leaked flammable gas, is estimated, and the
probable explosion sources are identified. Following
this, a series of empirical criteria are employed in
order to identify the obstructed regions, to calculate
the volume they occupy and thus to obtain the space
left free for the vapor cloud to spread.
Consequently the energy of the explosion is calcula-
ted, and thus from empirical expressions the
resulting overpressure in specific distances from the
explosion center, as well as the duration of the
positive phase, are obtained. The calculation of the
overpressure is directly dependent upon the type of
region where the explosion took place, i.e., if it is an
obstructed region or not. From the overpressure, the
effects to humans or material damages can easily be
calculated with the use of probit functions.
3. Road Transport of Dangerous Goods
Road transport of dangerous goods in European Union amounted to 78.7 Bt∙km in 2010, or 4.5% of
the total goods traffic (1775 Bt∙km). Only in
Germany road transport of dangerous goods in 2010
led to 8 deaths and 159 injuries, representing 0.9%
and 0.5%, respectively, of total deaths and injuries
in goods transportation (Kirchnawy, 2012).
In Asian and African countries, 13 accidents were
reported in 2012 related to truck transport of fuels or
chemicals with 375 persons killed and 156 injured.
In China, accidents related to hazardous materials
transport involved 708 tanker trucks, between 2004
and 2011, with 55.5% leading only to a spill, 7.7%
releases leading to fire and 2.5% to an explosion
(Shen et al., 2014).
Three recent accidents in Greece with LPG carrying
tanker trucks, fortunately without fatalities, show the
importance of proper training of drivers and civic
personnel.
On April 22, 2013 an LPG truck, unloading to a
hotel storage tank in Grete, exploded resulting in
severe burns of the driver.
On May 15, 2014 an LPG truck skidded in a
country road close Ioannina, resulting in a leak

Marc J. Assael, Leandros Ch. Paschalidis, George P. Sakellaropoulos
Evaluation of the effects of fires and explosions in the transport of hazardous materials
10
which was combated by firefighters from a
dangerously close distance of 3-5 meters. The road
was closed for several hours.
On May 26, 2014 an LPG truck was irresponsibly
parked on a densely populated village road close
Trikala. A leak developed and police and
firefighters tried to isolate the area and move the
truck.
It is only by luck that these incidents did not develop
to major disasters with fatalities, injuries and
property damage, as had happened 15 years before
on a main Greek highway.
Consider the following two cases:
CASE 1. Explosion of a road tanker containing
liquefied natural gas (LNG)
Natural gas (NG) is the second most important
energy source in Europe, after oil, representing 23%
of total energy content. Most NG reaches Europe via
pipelines (86%), as discussed in Section 4. However,
more than 14% is transported by ships and stored as
liquefied natural gas (LNG) (Eurogas, 2014). LNG
is transported to end users by tanker trucks as a
cryogenic liquid (at -162 oC) or as a compressed gas
(CNG). The former is preferable since its volumetric
energy density is about 2.5 times that of CNG. Both
LNG and CNG are used, among others, to power
light and heavy duty vehicles and buses. It is
noteworthy that the natural-gas vehicle (NGV) fleet
is steadily growing to over 20 million NGV
worldwide. Major players in NGV are the Asian and
South American countries, where such vehicles
exceed 15 million. Europe had a total of 1.2 million
NGVs in 2014, of which 22100 were medium and
heavy duty vehicles and buses. Italy had the largest
share, with 885000 NGVs (NGVA, 2015). Many
countries, including Italy, France, Spain, Poland and
Greece, have significant fleets of municipal buses
operating on CNG or LNG to reduce city pollution
by conventional diesel engines.
Transportation of LNG by tanker trucks complies
with the ADR International treaty. Tankers are
insulated or double-walled, to protect liquid
methane from boiling off. Because of the relatively
low number of LNG tanker trucks and the infrequent
catastrophic rupture of such vessels, relevant data
are limited. On October 7, 2012, a tanker carrying
20 tons LNG exploded on a Chang Ji highway in
China, killing 5 people, including 3 firemen, and
causing the destruction of 7 cars. On October 20,
2011 and on June 22, 2002 the Spanish
transportation industry suffered two major incidents
involving LNG tankers, with fires, explosions and
death of drivers, while another 12 accidents between
1999 and 2012 led to leaks and property damage.
Buses operating on LNG or CNG have had
occasional minor accidents, usually during
maintenance, due to improper handling. The June
22, 2002 accident will be evaluated below as an
accident analysis example.
The accident took place at 13:30, on June 22, 2002,
on the C-44 road near Tivissa, Catalonia, Spain. A
tanker containing natural gas, lost control on a
downhill section of the road, probably due to high
speed. It turned over, tipped on its left side and
stopped besides a sandy slope. Full description is
given by Planas-Cuchi et al. (2004). Immediately
very high flames appeared between the cabin and the
trailer (see Fig. 2). The flames could be fed by the
diesel oil from the truck tank or by a broken pipe to
the LNG. Approximately 20 min after the road
accident, the tank exploded giving rise to a fireball.
The driver died, and two persons that were in a
distance of about 200 m were injured (burned).
The tanker, built 28 months earlier, was made of
AISI 304, in cylindrical shape and insulated, and it
was designed for a working pressure of 7 bar. It had
a volume of 56 m3, 85% of it was filled with liquid
LNG at a temperature slightly below -160 oC and the
pressure slightly below 1 bar. There were five safety
valves all connected to a discharge pipe located at
the top of the vessel. The truck had a 0.5 m3
aluminium diesel oil tank.
Fig. 2. The tanker 2 min after the road accident The
car was left by one of the witnesses that ran
away
Source: Planas-Cuchi et al. (2004).

AoT Vol. 34/Issue 2 2015
11
Initial flames
The initial flames most likely are attributed to the
puncture of the 0.5 m3 aluminium diesel oil tank. A
pool lake was probably formed. Assuming a typical
pool depth of 2 cm, this will give a pool diameter, D,
of about 5.6 m. Since the burning rate, m’, of diesel
fuel is about 0.055 kg·m-2·s-1, the height of flames,
L, generated can be obtained by (Thomas, 1963):
0.61
air42 '/ ( )L D m g D = 11 m (2)
In the above relation, ρair (1.21 kg/m3), is the air
density and g (9.81 m/s2), the acceleration due to
gravity. The pool diameter of 5.6 m and the flame
height of 11 m, seem logical according to
observations.
Overpressure estimation
The explosion was very violent, breaking the tank
and tanker into several pieces, ejecting them into
large distance and causing a pressure wave. As not
enough information is available to consider it as a
BLEVE, an easy way to get a good idea of the extent
of the pressure wave is to deduce it from the effects
observed. There was a house at a distance of 125 m,
where the glass windows remained intact. Hence at
125 m, the maximum pressure wave would have to
be less than 0.03 bars (Assael and Kakosimos,
2010b). Employing this constraint to a TNT
equivalent curve or equation, and since the enthalpy
of combustion, ΔΗc, is approximately 55 MJ/kg, one
can easily calculate that this corresponds to a 60 kg
TNT equivalent mass. Hence the full overpressure
vs distance curve can be calculated (see Fig. 3). It
should be remembered that for buildings
destruction, an overpressure of 1 to 2.6 bars is
necessary, while for deaths an overpressure higher
than 3 bars is required (Assael and Kakosimos,
2010b).
Thermal effects
Assuming that all the mass initially contained in the
tank was involved in the fireball, results in a mass
M = 20,000 kg (density of 421 kg/m3, at about 113
K and say 10 bar pressure in the tank before
explosion). ΤΝΟ (2005) proposed that the maximum
diameter, Dmax (m), and the total time duration, tmax
(s), of the fire ball can be calculated from the
following empirical expressions:
0.325max 4D c M and 0.26
max 5t c M (3)
where, c4 = 6.48 m·kg-0.325 and c5 = 0.852 s·kg-0.26.
Fig. 3. Estimated overpressure as function of
distance
Thus the maximum diameter and time duration of
the resulting fireball is Dmax = 162 m, and tmax = 11 s.
Finally, the height of the fire ball center from the
ground, Η (m), is usually considered equal to the
maximum diameter, Dmax, and therefore, H = 162 m.
The heat flux, q΄ (kW/m2), in a specific distance
from the center of the fire (the distance enters the
calculations through the view factor and the
atmospheric transmissivity), is calculated according
to the solid-flame model (Assael and Kakosimos,
2010b; TNO, 2005), from the product of the actual
surface emitting power, SEPact (kW/m2), the view
factor, Fview (-), and the atmospheric transmissivity,
τα (-), as:
act view a'q SEP F (4)
a) The actual Surface Emitting Power can be
obtained (ΤΝΟ, 2005) from:
act s c'SEP F m H (5)
where the radiation fraction, Fs (-), is given by
(ΤΝΟ, 2005):
0.32s 6 svF c P (6)
where c6 = 0.00325 Pa-0.32, and Psv (Pa), denotes the
vapor pressure inside the vessel. The burning rate,
m΄ (kg/m2s), can be calculated as a function of the
Marc J. Assael, Leandros Ch. Paschalidis, George P. Sakellaropoulos
Evaluation of the effects of fires and explosions in the transport of hazardous materials
12
mass, Μ (kg), of the flammable substance and the
total fire ball duration, tmax (s), as:
2max max
'(0.888 )
Mm
D t (7)
where 2max(0.888 )D is the time-average surface of
the fire ball sphere.
Assuming that the pressure before the explosion rose
to 10 bars, and that for LNG, ΔHc = 55 MJ/kg, by
substituting in the above expressions we obtain,
m’ = 0.025 kg·m-2·s-1, Fs = 0.27, and SEPact = 371
kW/m2.
b) In the case of a fireball, it can easily be shown
(Assael and Kakosimos, 2010b) that the view
factor, Fview (-) that a receptor, standing at a distance
X (m) from the center of the explosion, faces, can be
calculated from:
2
2 2view /F R X H (8)
c) Finally, for the calculation of atmospheric
transmissivity, τα (-), the following empirical
expression (Bagster and Pittblado, 1989) can be
employed:
0.09
a 7 w ( )c P X R
(9)
In the above expression, Pw (Pa), denotes the partial
water vapor pressure in air (usually about 1620 Pa),
while Χ (m) is the distance of the receptor from the
center of the fire of radius R (m) (meaningful only
for X > R). The constant c7 is equal to 2.02
Pa0.09m0.09.
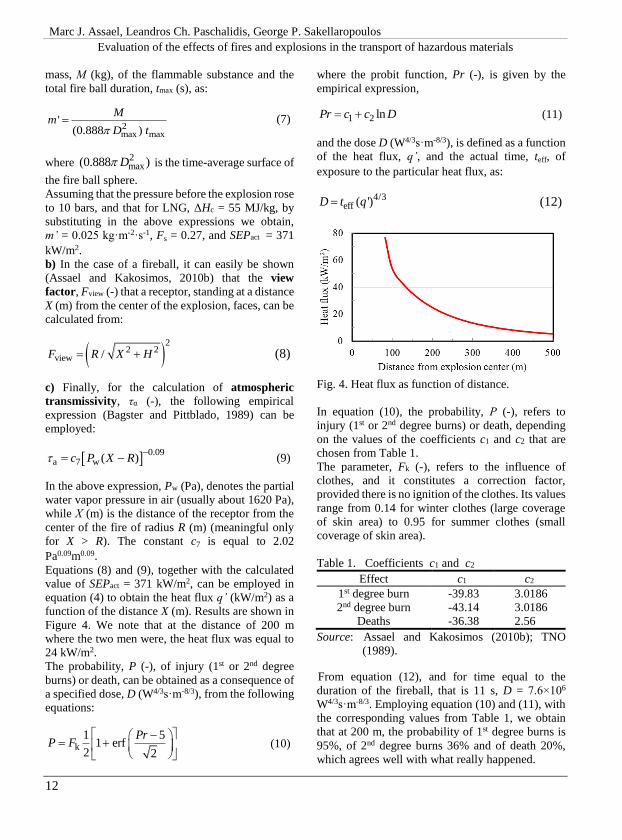
Equations (8) and (9), together with the calculated
value of SEPact = 371 kW/m2, can be employed in
equation (4) to obtain the heat flux q’ (kW/m2) as a
function of the distance X (m). Results are shown in
Figure 4. We note that at the distance of 200 m
where the two men were, the heat flux was equal to
24 kW/m2.
The probability, P (-), of injury (1st or 2nd degree
burns) or death, can be obtained as a consequence of
a specified dose, D (W4/3s·m-8/3), from the following
equations:
k
1 51 erf
2 2
PrP F
(10)
where the probit function, Pr (-), is given by the
empirical expression,
1 2 lnPr c c D (11)
and the dose D (W4/3s·m-8/3), is defined as a function
of the heat flux, q’, and the actual time, teff, of
exposure to the particular heat flux, as:
4/3eff ( ')D t q (12)
Fig. 4. Heat flux as function of distance.
In equation (10), the probability, Ρ (-), refers to
injury (1st or 2nd degree burns) or death, depending
on the values of the coefficients c1 and c2 that are
chosen from Table 1.
The parameter, Fk (-), refers to the influence of
clothes, and it constitutes a correction factor,
provided there is no ignition of the clothes. Its values
range from 0.14 for winter clothes (large coverage
of skin area) to 0.95 for summer clothes (small
coverage of skin area).
Table 1. Coefficients c1 and c2
Effect c1 c2
1st degree burn -39.83 3.0186
2nd degree burn -43.14 3.0186
Deaths -36.38 2.56
Source: Assael and Kakosimos (2010b); TNO
(1989).
From equation (12), and for time equal to the
duration of the fireball, that is 11 s, D = 7.6×10⁶
W4/3s·m-8/3. Employing equation (10) and (11), with
the corresponding values from Table 1, we obtain
that at 200 m, the probability of 1st degree burns is
95%, of 2nd degree burns 36% and of death 20%,
which agrees well with what really happened.

AoT Vol. 34/Issue 2 2015
13
In Figure 5, equations 10 to 12 are plotted. For a
particular effective time and heat flux, the
probability of death can easily be found.
Fig. 5. Probability of death as a function of the actual
exposure for different heat fluxes (Fk =0.95).
The frequency of a rupture and fuel release is 1×10-
8 incidents/km yr (EIA, 2006). If this tanker operates
in a city for 5 days per week, on a 100 km route
daily, and say 10% of such accidents are
catastrophic, the estimated frequency of such a fire
is (1×10-8 ×0.1×5×52×100 =) 26×10-6 incidents/yr.
This number of fatalities is unacceptable in most
countries, with an upper risk limit of 10-6
fatalities/yr.
CASE 2. Vapor Cloud Explosion from a leak in a
road tanker containing LPG
The case of vapor cloud explosion can be
exemplified by a leak of a tanker truck carrying
liquefied petroleum gas (LPG), usually propane.
LPG is derived from petroleum refining (53% in
EU) or natural gas processing (47%) (Argus
Consulting Services, 2013). About 50% of LPG is
used as an energy source in the private and public
sector and 25% for light duty vehicles and cars. For
instance, Poland has one of the largest fleets of about
2.5 M LPG driven cars, with 5700 filling stations
state-wide. Italy is also a major player in LPG driven
vehicles with about 1.8 M cars and 3000 stations.
Although the fraction of LPG cars is currently small
(~4% in EU, or 10M vehicles), it is expected to
increase to 10% by 2020, because of the
insignificant emissions of particulates and NOx, the
reduced CO2 emissions and the low fuel cost (about
half) compared with gasoline or diesel.
LPG is usually delivered to private or industrial
premises and to filling stations by tanker trucks;
Poland is a major producer of such vehicles.
Statistically (Caumont and Ponthieu, 2000), leaks
occur primarily during the loading/unloading of the
tanker, and albeit rare, they lead to 20% jet or pool
fires which can turn to an explosion (VCE, 24% and
BLEVE 36%). Only 20% of gas leaks do not ignite.
Next, we consider the rupture of a 5 ton LPG truck,
resulting in the formation of a vapor cloud and a
VCE. Assuming that 3,000 kg of propane are
released, and a heat of combustion of 46 MJ/kg, one
can calculate that a cloud volume of 32,200 m3 will
be formed, resulting in an energy of explosion of 140
GJ. Hence in say, 50 m the overpressure will be
approximately 0.3 MPa and its positive phase time
duration will be 50 ms. Following an equivalent
analysis employing probit functions as in Case 1,
these numbers will result in 100% probability of
fatality of people in that distance, and major
structural damages to two-floor houses.
Vapor release from an LPG tanker truck during
loading or unloading can result to an explosion if the
gas is trapped in partly enclosed spaces. A ‘flame
return’ can result in a BLEVE. If an LPG truck like
the one above delivers fuel to 10 customers per day
on a route of 500 km per week, we can estimate the
probability of gas release with subsequent ignition
and explosion to be: (500×52×2.4×10-9) = 6.24×10-
5 incidents/yr, and for BLEVE’s 7.0×10⁻⁸
incidents/yr, using the incident rates given in Table
2 (OGP, 2010).
Table 2. LPG Incidents
Phenomenon
%
Release
frequency
per km∙yr
Gas phase leak/No ignition 20 2.6×10⁻⁹
Jet or pool fire 20 2.1×10⁻⁹
Vapor cloud explosion 24 2.4×10⁻⁹
BLEVE 36 2.7×10⁻¹²
Failure Type %
Tanker component 18
Hose/Coupler/Connection 21
Human error 18
Other 43
Source: Caumont and Ponthieu (2000), OGP (2010).

Marc J. Assael, Leandros Ch. Paschalidis, George P. Sakellaropoulos
Evaluation of the effects of fires and explosions in the transport of hazardous materials
14
4. Pipeline Transport of Natural Gas
For the bulk transportation of gases, liquids or
chemicals over long distances, pipeline transport is
a very effective and economic way. The world wide
network of pipelines in 2014 exceeded 3.5 Mkm in
120 countries, with USA, Russia and Canada in the
first three positions. Although oil pipelines are the
longest and have a high percentage of spills and
accidents, natural gas pipeline incidents lead to more
destructive effects. Therefore, in this section we
outline possible accidents and their impact involving
gas pipelines, especially in Europe.
Table 3. Pipeline Distribution Network Length
per Country (in km)
Country Length
(km) Country
Length
(km)
Austria 37,495 Norway 125
Belgium 69,687 Poland 125,800
Czech Rep. 72,868 Portugal 16,296
Denmark 18,175 Romania 17,218
France 203,092 Slovakia 33,079
Finland 1,911 Slovenia 4,342
Germany 371,000 Spain 64,115
Greece 6,087 Switzerland 18,762
Italy 249,180 Turkey 69,800
Ireland 11,137 UK 126,335
Netherlands 124,073
TOTAL=1,640,577
Source: Marcogaz (2013).
The European Union has an extensive network of
pipelines for the transmission and distribution of
natural gas. Some typical characteristics are given in
Table 3 for selected countries that participate in the
Technical Association of the European Natural Gas
Industry, Marcogaz (2013), totaling 1.64 Mkm of
pipelines and 115 M consumers.
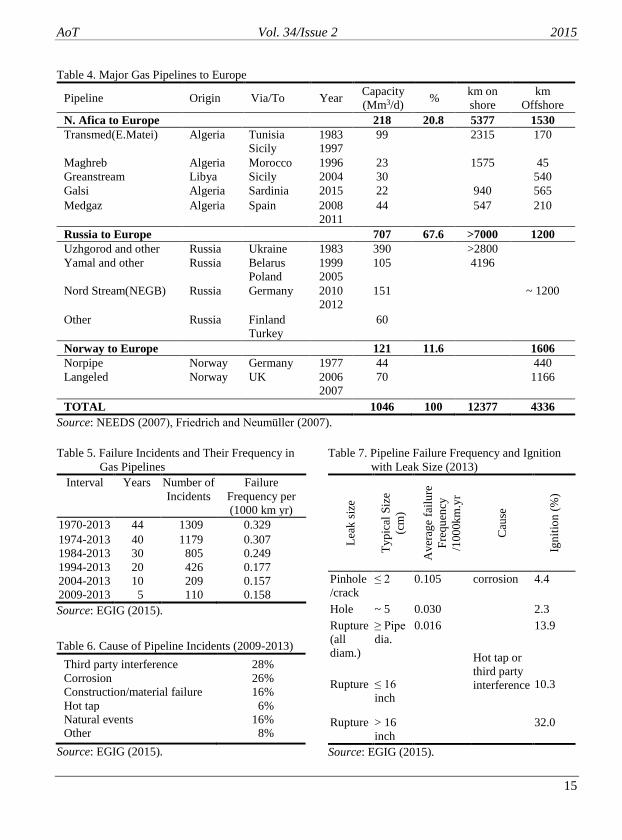
Table 4 shows the network of major gas pipelines to
Europe (NEEDS, 2007; Friedrich and Neumüller,
2007). Natural gas imports from the Russian
pipelines in 2013 were 39% of total, for EU-28, with
Norway and Algeria having a 34% and 13% share,
respectively (Pongas et al., 2014). Sixteen EU
countries depend over 90% on Russian imports.
The dependence of EU on imports of natural gas, the
shear length of the pipeline network, the aging of
Russian and European pipelines and the geopolitical
instability in some of the major supply routes make
gas transmission quite sensitive to accidents, with
tens of release or fire or explosion incidents per year.
Fig 6. Ratio of accidents/injuries/fatalities to 1
million customers for each year from 1995
to 2011
Source: Marcogaz (2013).
The Marcogaz Association (Marcogaz, 2013)
reports 20-25 accidents per million customers per
year (or 150 accidents per 1000 km per year), with
1.42 fatalities per million customers (or 9.3 fatalities
per 1000 km per year), see Figure 6. These numbers
refer to all pipeline grades.
For steel pipelines, see Table 5 (EGIG, 2015), the
incident frequency is 22/yr in the last 5 years or 0.158 failures/1000 km∙yr. However, large pipelines
(> 40 cm diameter) have a very high probability of
32% to ignite and explode, with occasionally
devastating effects.
Tables 6-8 give some typical failure types and their
frequency or percent of occurrence and percent of
fatalities or injuries (EGIG, 2015). Small size cracks
or pinholes less than 2 cm in diameter occur most
frequently, primarily due to metal corrosion, but
they are not capable to give rise to a jet fire. Larger
holes and pipe rupture are usually the result of third
party interferrences (e.g. digging, maintenance,
arsony etc). Although such events are 30 times less
frequent than pinholes, they have a higher frequency
of ignition; especially large diameter ruptures in
pipelines over 40 cm in diameter lead to 32%
ignition and subsequent explosion. In even larger
diameter pipelines such as the ones used in the major
networks feeding EU countries, the very limited,
statistically, incident frequency shows almost sure
ignition in the case of rupture.
AoT Vol. 34/Issue 2 2015
15
Table 4. Major Gas Pipelines to Europe
Pipeline Origin Via/To Year Capacity
(Mm3/d) %
km on
shore
km
Offshore
N. Afica to Europe 218 20.8 5377 1530
Transmed(E.Matei) Algeria Tunisia
Sicily
1983
1997
99 2315 170
Maghreb Algeria Morocco 1996 23 1575 45
Greanstream Libya Sicily 2004 30 540
Galsi Algeria Sardinia 2015 22 940 565
Medgaz Algeria Spain 2008
2011
44 547 210
Russia to Europe 707 67.6 >7000 1200
Uzhgorod and other Russia Ukraine 1983 390 >2800
Yamal and other Russia Belarus
Poland
1999
2005
105 4196
Nord Stream(NEGB) Russia Germany 2010
2012
151 ~ 1200
Other Russia Finland
Turkey
60
Norway to Europe 121 11.6 1606
Norpipe Norway Germany 1977 44 440
Langeled Norway UK 2006
2007
70 1166
TOTAL 1046 100 12377 4336
Source: NEEDS (2007), Friedrich and Neumüller (2007).
Table 5. Failure Incidents and Their Frequency in
Gas Pipelines
Interval Years Number of
Incidents
Failure
Frequency per
(1000 km yr)
1970-2013 44 1309 0.329
1974-2013 40 1179 0.307
1984-2013 30 805 0.249
1994-2013 20 426 0.177
2004-2013 10 209 0.157
2009-2013 5 110 0.158
Source: EGIG (2015).
Table 6. Cause of Pipeline Incidents (2009-2013)
Third party interference 28%
Corrosion 26%
Construction/material failure 16%
Hot tap 6%
Natural events 16% Other 8%
Source: EGIG (2015).
Table 7. Pipeline Failure Frequency and Ignition
with Leak Size (2013)
Lea
k s
ize
Ty
pic
al S
ize
(cm
)
Av
erag
e fa
ilu
re
Fre
qu
ency
/100
0k
m.y
r
Cau
se
Ign
itio
n (
%)
Pinhole
/crack
≤ 2 0.105 corrosion 4.4
Hole ~ 5 0.030
Hot tap or
third party
interference
2.3
Rupture
(all
diam.)
≥ Pipe
dia.
0.016 13.9
Rupture ≤ 16
inch
10.3
Rupture > 16
inch
32.0
Source: EGIG (2015).

Marc J. Assael, Leandros Ch. Paschalidis, George P. Sakellaropoulos
Evaluation of the effects of fires and explosions in the transport of hazardous materials
16
Table 8. Fatalities and Injuries from Pipeline
Incidents (EGIG, 2015)
Personnel Injuries
(%)
Fatalities*
(%)
Employee/Contractors 0.08 0.08
Personnel causing
incident
0.61 0.46
Fighting personnel 0.15 0.08 Public 0.23 0.15
* Mostly from pipe rupture
Source: EGIG (2015).
Before analyzing gas pipeline explosions we report
some recent incidents in EU.
In October 2014 a pipeline feeding gas to a BASF
plant exploded in the city of Ludwigshaffen,
Germany, with one person killed, 26 injured, 7
seriously, and 25 buildings damaged at a distance
of 100m.
In April 2014, a high pressure pipeline 2.2 m in
diameter was ruptured in Cerville, France,
creating a crater of 4m diameter and 1.5 deep,
without injuries.
In December 2007, a 63 mm dia. pipeline at Noisy
le Sec, France, leaked natural gas, followed by two
explosions 45 minutes later, leading to 8 injuries
and 36 apartments destroyed (ARIA Database,
2015).
In June 2014 two explosions occurred in the
largest gas pipeline from Russia to Europe through
Ukraine (EEGA, 2015). A 20 km section was
sealed off. The aging pipeline had four such
accidents in the last 10 years. However the
incident rates per 1000 km and year are 0.120 -
0.180, similar to European pipelines.
In November 2013, an “empty” gas pipeline under
maintenance exploded in the village of Jankow
Przygodzki, Poland, killing three and injuring 13
more, some seriously. A dozen houses were
destroyed by the flames.
Major gas leak accidents have occurred also in other
continents.
In July 2014, 32 people died and 321 were injured
in an explosion in Kaohsiung, China, from a leak
of gas in the sewer system of the city.
In June 2014, a gas pipeline exploded in Nagaran
India, killing 16 persons and destroying scores of
houses.
In September 2011, a high pressure, 76 cm dia.
pipeline exploded in San Bruno, San Francisco,
USA, killing 8 persons, injuring 58 and destroying
35 houses.
One of the most serious industrial disasters occurred
in a pipeline near the city of Ghislenghien, Belgium,
in July 2004 (ARIA Database, 2004). We can
examine this in more details as CASE 3 below.
CASE 3. Rupture and ignition of a gas pipeline in
Ghislenghien, Belgium (ARIA
Database, 2004).
The accident took place on July 30th, 2004. A 70 bar,
100 cm diameter pipeline of 1.6 million m3/h
flowrate, was damaged during excavation resulting
in the following chronological sequence of events:
8:15 to 9:00 in the morning a gas leak appeared.
9:00 the gas exploded creating a crater of 10 m
diameter and 4 m deep.
9:02 further ignition of the gas from a pipe section,
resulted in a fireball.
A jet fire was consequently formed, with flames
rising to 150-200 m, lasting for twenty min until
the gas supply was shut off.
Twenty four persons died, including 5 firefighters, 1
police officer and 5 employees, 132 persons were
injured, and an industrial zone in a 200 m radius
sustained total devastation. Molten plastic material
on cars was observed even at a distance of 400 m. A
calculation based on the volume of gas contained in
the damaged pipe section of 15 km long, estimated
the gas quantity lost to about 700 tons (i.e. a volume
of approximately 1 million m3 of natural gas). The
accident was qualified as Belgium’s most serious
industrial disaster in half a century.
Modelling of the accident will be based upon the
small amount of facts available.
Jet fire
All observations indicated a flame height of 150-200
m. Assael and Kakosimos (2010b) described a full
step by step procedure to model a jet flame. The
main parameter that influences the flame’s height, is
the gas flowrate. To produce an average flame
length of 175 m, the quantity of natural gas required
is about 300 kg/s – which corresponds to a total gas
quantity for the 20 minutes leak equal to 360 tons of
natural gas. Such a jet flame will produce a heat flux
of 2.4 kW/m2 even at 150 m, which also agrees with
observations of damages.

AoT Vol. 34/Issue 2 2015
17
Explosion Overpressure estimation
The gas exploded creating a crater of 10 m diameter
and 4 m deep. Observations of damages showed
overpressure of 20 mbar at 390 m, and 10 mbar at
890 m (Zarea, 2006). If one employs the Multi
Energy technique or the TNT equivalent (Assael and
Kakosimos, 2010b), with the mass as unknown, and
tries to calculate the observed overpressure, a mass
of about 5,000 kg of natural gas (or a 2,000 kg TNT
equivalent mass) is calculated to produce the
observed overpressure.
Fire ball
The accident report estimated that the total mass of
gas contained in the sealed section of the pipeline
was about 700 tons. We have already calculated that
360 tons were burnt in the jet fire and 5 tons in the
explosion. It is thus most probable that the
remaining 335 tons were burnt in the fireball.
Employing equations (3) we obtain that the
maximum diameter and time duration of the
resulting fireball is Dmax = 400 m, and tmax = 23 s.
The height of the fire ball center from the ground, Η
(m), is usually considered equal to the maximum
diameter, Dmax, and therefore, H = 400 m. This
explains why there was total devastation in a 200 m
zone, with so many people dying, and car plastic
material melting at a distance of 400 m.
In conclusion, the approximate calculations indicate
that the fireball and the resulting jet fire created the
major damages, mostly due to the very large amount
of natural gas involved. If the initial gas leak had
been detected earlier from the pressure loss, and the
gas supply was restricted immediately, the large
human and property damages would have been
prevented.
5. Conclusions
Effects from fires and explosions can today, easily
be calculated. This knowledge is very valuable in
designing alternative transport paths across the
country or through inhabitant places. If we can
model a disaster, we can also predict how to avoid
it.
The field of Risk Assessment requires holistic
engineers whose understanding of the process
phenomena is coupled by a knowledge of
assessment techniques and models, and who are
themselves also actively involved in the assessment
procedure (Kletz, 2003). This latter characteristic is
quite significant for educators, since it is hard to
quantify and teach it.
Thus in order to attract students and engineers to an
otherwise sidelined area of study, we developed a
course applying a more modern pedagogical
approach, using a wide range of multimedia teaching
tools, videos and in-class exercises. In a recent paper
(Assael and Kakosimos, 2010a) the development of
a course on Risk Assessment aiming to enhance
awareness and comprehension of the procedures was
described; it was also intended to make the subject
attractive and enjoyable to students and engineers.
Extra care was undertaken to employ multimedia
tools and videos during the teaching of the course. A
new multimedia e-platform was developed, which
includes all teaching material that encompasses
Hazard Identification - Event Frequency, Outflow,
Effects and Consequences Analysis and Probable
Causes of Destruction. The feedback was very
positive for both the method of teaching and delivery
(e-platform) and the peer assessed project, which
indicates that in many respects the aims have been
achieved. In addition, the authors recently had the
opportunity to discuss the details of the course itself
in the “European Workshop on Teaching Safety in
Chemical Engineering (Kakosimos and Mihailidi,
2010), where again the overall comments were very
positive.
References
[1] ARGUS CONSULTING SERVICES, 2013.
LPG Consumption in Europe.
[2] ARIA DATABASE, 2004. Rupture and
ignition of a gas pipeline. Ghislenghien,
Belgium. No. 27681. French Ministry for
Sustainable Development - DGPR / SRT /
BARPI.
[3] ARIA DATABASE, ARIA database, France.
Available: http://www.aria-database.com/
[2015].
[4] ASSAEL, M.J. and KAKOSIMOS, K.E.,
2010a. Can a course on the calculation of the
effects of fires, explosions and toxic gas
dispersions, be topical, enjoyable and
meaningful? Education for Chemical
Engineers, 5(3), pp. e45-e53.
[5] ASSAEL, M.J. and KAKOSIMOS, K.E.,
2010b. Fires, explosions, and toxic gas
dispersions: effects calculation and risk
analysis. Boca Raton FL: CRC Press.

Marc J. Assael, Leandros Ch. Paschalidis, George P. Sakellaropoulos
Evaluation of the effects of fires and explosions in the transport of hazardous materials
18
[6] BAGSTER, D.F. and PITTBLADO, R.M.,
1989. Thermal hazards in the process industry.
Chemical Engineering Progress, 87, pp. 69-75.
[7] CAUMONT, M. and PONTHIEU, S., 2000.
Safety provisions and LPG, IChemE
Symposium series no. 147, April 4-6 2000, pp.
1-14.
[8] DEPARTMENT OF TRANSPORT, 2014.
Transport Statistics Great Britain. London HM
Stationary Office.
[9] EEGA, East European Gas Analysis. Available:
http://www.eegas.com/fsu.htm [2015].
[10] EGIG, 2015. 9th Report of the European Gas
Pipeline Incident Data Group. EGIG
14.R.0403.
[11] EIA, 2006. Liquefied Natural Gas (LNG)
Receiving Terminal and Associated
Facilities. Part 2 – South Soko, Sections 13-18.
ESB-126/2005. Environmental Resources
Management.
[12] EUROGAS, 2014. Statistical Report. Brussels.
[13] FRIEDRICH, S. and NEUMÜLLER, J., 2007.
North European Gas Pipeline. CIVPRO
Working Paper 2007:3.
[14] KAKOSIMOS, K. and MIHAILIDI, E., 2010.
European Workshop on Teaching Safety in
Chemical Engineering. Chemical Engineering
Research and Design, 88, pp. iii-iv.
[15] KIRCHNAWY, F., 2012. Gefahrguttransport:
was können die Vorschriften bewirken?
Chemikalien Sicher Transportieren 2012,
October 15-16 2012.
[16] KLETZ, T., 2003. Still going wrong!: case
histories of process plant disasters and how
they could have been avoided. Boston, USA:
Elsevier, Butterworth-Heinemann.
[17] KLETZ, T.A., 1986. Transportation of
hazardous substances: The UK scene.
Plant/Operations Progress, 5(3), pp. 160-164.
[18] LEES F.P, 2003. Loss Prevention in the Process
Industries. 2nd edn. Oxford: Butterworth
Heinemann.
[19] MARCOGAZ, 2013. Technical Statistics
Report. 01-01-2013. Technical Association of
the European Natural Gas Industry.
[20] NEEDS, Nov. 2007. Project Report. European
Union FP6.
[21] NGVA, Natural Gas and Biogas Vehicle
Association. Available:
http://www.ngvaeurope.eu/ [2015].
[22] NTSB, 2014. Annual Report to the Congress.
National Transportation Safety Board.
[23] OGP, 2010. Land transport accident statistics.
No. 434 – 9. International Association of Oil
and Gas Producers.
[24] PLANAS-CUCHI, E., GASULLA, N.,
VENTOSA, A. and CASAL, J., 2004.
Explosion of a road tanker containing liquified
natural gas. Journal of Loss Prevention in the
Process Industries, 17(4), pp. 315-321.
[25] PONGAS, E., TODOROVA, A. and
GAMBINI, G., 2014. Trade in energy
products: Statistical analysis of EU trade in
energy products, with focus on trade with the
Russian Federation. EUROSTAT Statistics in
focus, 13..
[26] SAKELLAROPOULOS, G.P., LULAS, M.,
SKODRAS, G. and NUNES, G., 2014. Safety
Management in the Transportation of
Dangerous and Sensitive Goods, D. PYZA, ed.
In: 7th Int. Conf. on Logistics Systems Theory
and Practice, September 2-5 2014.
[27] SHEN, X., YAN, Y., LI, X., XIE, C. and
WANG, L., 2014. Analysis on tank truck
accidents involved in road hazardous materials
transportation in China. Traffic injury
prevention, 15(7), pp. 762-768.
[28] STINTON, H., 1983. Spanish camp site
disaster. Journal of hazardous materials, 7(4),
pp. 393-401.
[29] THOMAS, P., 1963. The size of flames from
natural fires, Symposium (International) on
Combustion 1963, Elsevier, pp. 844-859.
[30] TNO, 1989. Methods for the Determination of
Possible Damage to People and Objects
Resulting from Releases of Hazardous
Materials, Roos A.J. (Ed), Green book, Report
CPR 16E, Chapter 1.
[31] TNO, 2005. Methods for the Calculation of
Physical Effects due to Releases of Hazardous
Materials (Liquids and Gases), van den Bosch
C.J.H, Weterings R.A.P.M. (Eds), Yellow
book. Report CPR 14E. 3rd edn. Director-
General of Labour.
[32] ZAREA, M., 2006. Mechanical Damage: How
big is the problem? A European Perspective.
Mechanical Damage Workshop February 29th -
March 1st 2006.