dawn march 2017 audited report.pdf · page 2 introduction dawn manufactures, sources, distributes...
TRANSCRIPT
D A W NDistribution & Warehousing Network
AUDITED SUMMARY CONSOLIDATED FINANCIAL RESULTSfor the year ended 31 March 2017
(Incorporated in the Republic of South Africa) (Registration number 1984/008265/06)
(“DAWN” or “the group” or “the company”) Alpha code: DAW
ISIN: ZAE000018834 E-mail: [email protected]
REGISTERED OFFICE: Cnr Barlow Road and Cavaleros Drive, Jupiter Ext 3, Germiston, 1401
DIRECTORS: Diederik Fouché (chairman), Stephen Connelly (deputy executive chairman), Lou Alberts ^ (lead independent director) , Edwin Hewitt (chief executive officer), Chris Booyens (chief financial officer and financial director),
Akhter Moosa ^, Dinga Mncube ^, Veli Mokoena*, George Nakos*, René Roos
* Non-executive ^ Independent non-executive
PREPARER: Prepared by Yolandi van den Berg (CA(SA)), senior group financial accountant, under the supervision of Hanré Bester (CA(SA)), group financial manager, and Chris Booyens (CA(SA)), chief financial officer and
financial director
COMPANY SECRETARY: iThemba Governance and Statutory Solutions (Pty) Ltd
TRANSFER SECRETARIES:Computershare Investor Services (Pty) Ltd, Rosebank Towers, 15 Biermann Avenue, Rosebank, 2196
(PO Box 61051, Marshalltown, 2107)
SPONSOR: Deloitte & Touche Sponsor Services (Pty) Ltd
www.dawnltd.co.za
D A W NDistribution & Warehousing Network
Page 1
Distribution & Warehousing Network Limited | | Audited summary consolidated financial results for the year ended 31 March 2017
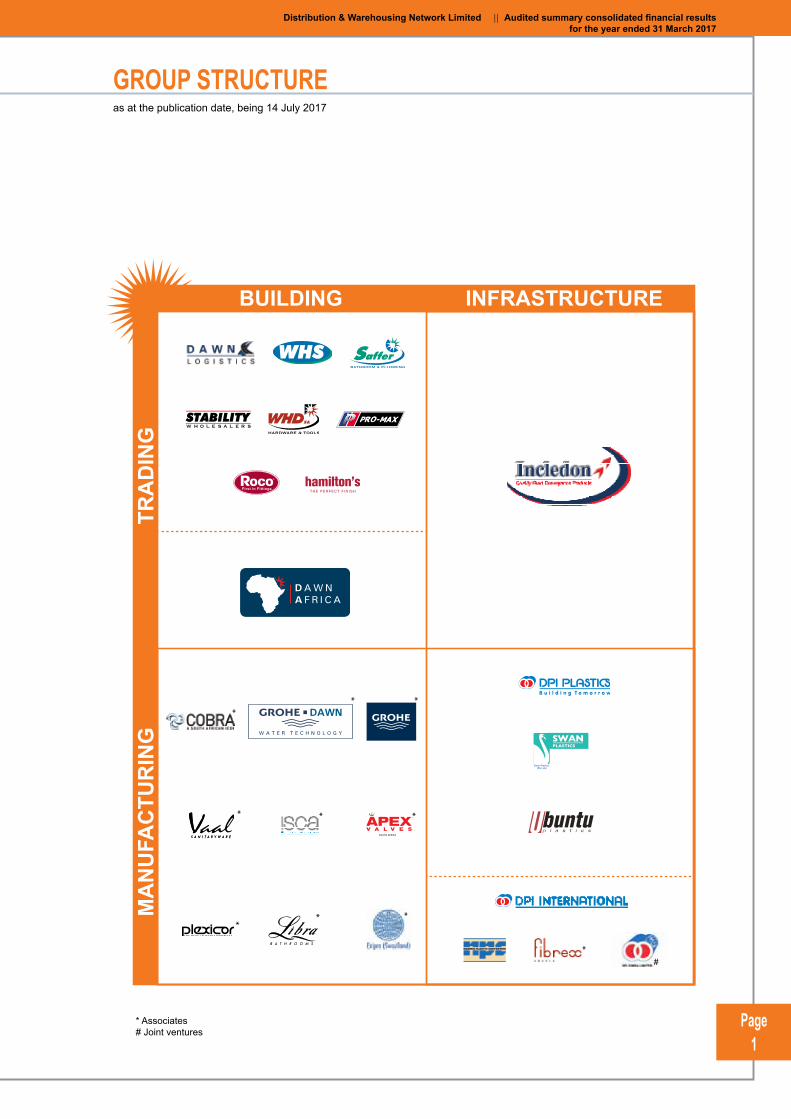
GROUP STRUCTUREas at the publication date, being 14 July 2017
MA
NU
FAC
TUR
ING
TRA
DIN
G
BUILDING INFRASTRUCTURE
SOUTH AFRICA
#
* Associates# Joint ventures

Page 2
INTRODUCTIONDAWN manufactures, sources, distributes and wholesales selected materials and hardware used in building and the creation of infrastructure.
Results summaryAs committed to the market in F2016, the focus during F2017 was on downsizing, closing and consolidating businesses in the group to put DAWN on a stronger footing to turn its operations around to profitability in the lower revenue reality imposed by the deteriorating South African economy. The first part of the turnaround plan has been executed.
The current results were significantly affected by these rightsizing costs, as well as the continued challenging market conditions, the impact of the widespread drought in South Africa and poor operating performance of the group. The results to 31 March 2017 were therefore very disappointing. Although the loss per share of 269,2 cents was a reduction from the loss of 318,3 cents in F2016, the headline loss per share was sharply higher at 240,5 cents (2016: headline loss per share of 65,6 cents).
The rightsizing of the group resulted in a number of write-downs and impairments. After-tax write-downs and impairments of R352,2 million were recorded in F2017, which played a large role in the total group attributable loss of R637,4 million.
Management and the board recognise that focused action must be taken to reverse the declining trend in revenue. This ac-tion has been given further momentum under the new management team, as outlined in the prospects section of this report.
The group’s cash flow and statement of financial position were also under severe pressure in F2017, resulting in the need for a R358 million rights issue. The proceeds were received after year-end on 12 April 2017.
Summary of results based on the historic reporting structure (as at 31 March 2017)
Building segment
Revenue from the building segment declined by 10,9% from R2,5 billion to R2,3 billion, mainly attributable to significantly lower volumes in WHS.
The building segment delivered an operational loss of R54,5 million compared to an operational profit of R16,0 million in F2016 and a loss before interest and taxation (LBIT) of R244,0 million, with an operating margin of -10,8%. This was substantially worse than the loss of R464,5 million and margin of -18,4% in F2016.
Infrastructure segment
Revenue from the infrastructure segment declined by 18,5% from R2,4 billion to R2,0 billion, mainly attributable to lower income streams in Incledon and Sangio.
The infrastructure segment delivered an operational loss of R60,4 million compared to an operational profit of R33,7 million in F2016, an LBIT of R124,5 million, with an operating margin of -6,3% as a result of losses incurred in Sangio and DPI Plastics, slightly offset by Swan Plastics’ profit. Although this was an improvement from the loss of R158,5 million and the margin of -6,5% in F2016, it was still too far below budget.
Solutions segment
The solutions segment’s revenue declined by 3,1% from R571,4 million to R553,7 million. An LBIT of R42,7 million (F2016: R61,2 million) was incurred.
New reporting structureDAWN’s reporting structure was simplified at the end of F2017 for two reasons:
1. The integration of DAWN Solutions into the underlying businesses to reduce the group’s permanent cost base.
2. To better reflect the group’s operations. Rather than reporting on the contribution of the building, infrastructure and solutions segments to group results, DAWN now reports on the contributions of the trading and manufacturing segments.
RESULTS COMMENTARY for the year ended 31 March 2017
Page 3
Distribution & Warehousing Network Limited | | Audited summary consolidated financial results for the year ended 31 March 2017
The trading segment sells a comprehensive range of products, primarily sourced in South Africa from the group’s manufacturing segment and other manufacturers. The trading segment comprises WHS, Incledon and the smaller businesses of DAWN Africa Trading (DAT), Kitchen (Roco) and Hamilton’s.
The manufacturing segment manufactures mainly PVC and HDPE pipes and fittings. The manufacturing segment comprises DPI Plastics, Swan Plastics (51%-held), GDW (49%-held) and the smaller businesses of Ubuntu Plastics (51%-held) and DPI International.
In the interests of full disclosure, like-for-like results are available in the notes to the audited summary consolidated financial statements under ‘Audited consolidated segmental analysis’.
Income statementRevenue in F2017 was impacted mainly by two occurrences. The first was the steady decline in economic growth, culminating in the negative gross domestic product (GDP) growth reported by Stats SA for the first quarter of calendar 2017 and a smaller, very competitive market. The second was DAWN’s temporary loss of master distributor status due to underserviced clients and unbalanced stock, which impacted volumes sold. Master distributor status is crucial, as it ensures the volumes necessary for the successful functioning of DAWN’s business model. One of the key issues for F2018 will be to regain lost market share.
Group revenue decreased by 13,9% from R5,0 billion to R4,3 billion for the reasons outlined above. Revenue from the trading segment declined by 18,6% from R3,9 billion to R3,1 billion, mainly attributable to significantly lower volumes in WHS. Revenue from the manufacturing segment declined by 10,3% from R1,6 billion to R1,5 billion as a result of losses incurred in Sangio and DPI Plastics, slightly offset by Swan Plastics’ profit.
Group headcount was reduced by 643 employees in F2017. Year-on-year normalised operating expenses decreased by 5,0% (F2016: 0,4% decrease), and reflect the group’s strong focus on expense reduction. However, the group’s expense to revenue ratio deteriorated from 21,5% in F2016 to 24,9% in F2017, affected by lower revenue levels. The main expense drivers remain employment costs, vehicle transportation expenditure and building occupancy costs.
DAWN posted R119,8 million in operational losses (F2016: operational profit of R58,1 million) and an LBIT of R468,8 million, representing an operating margin of -10,9%. Although this result was an improvement on the LBIT of R661,4 million and margin of -13,2% achieved in F2016, it is still unacceptable to management and the board.
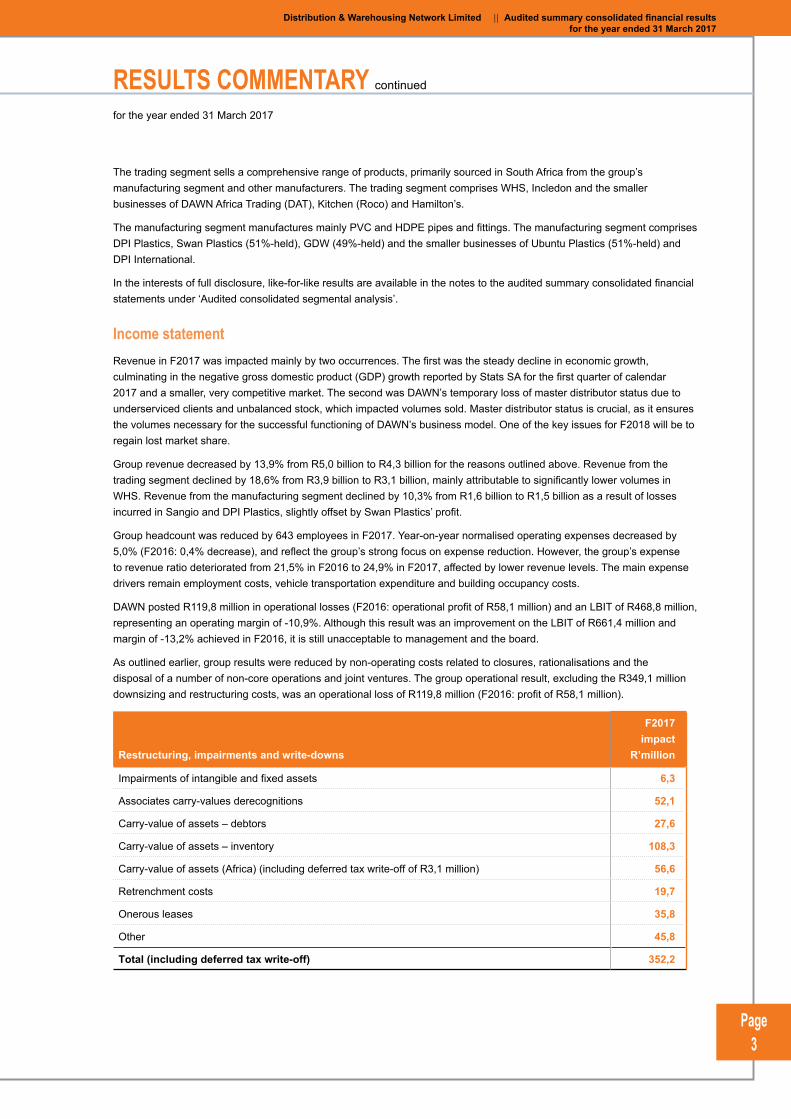
As outlined earlier, group results were reduced by non-operating costs related to closures, rationalisations and the disposal of a number of non-core operations and joint ventures. The group operational result, excluding the R349,1 million downsizing and restructuring costs, was an operational loss of R119,8 million (F2016: profit of R58,1 million).
Restructuring, impairments and write-downs
F2017 impact
R’million
Impairments of intangible and fixed assets 6,3
Associates carry-values derecognitions 52,1
Carry-value of assets – debtors 27,6
Carry-value of assets – inventory 108,3
Carry-value of assets (Africa) (including deferred tax write-off of R3,1 million) 56,6
Retrenchment costs 19,7
Onerous leases 35,8
Other 45,8
Total (including deferred tax write-off) 352,2
RESULTS COMMENTARY continued
for the year ended 31 March 2017
Page 4
The trading segment delivered an operational loss of R108,1 million compared to a loss of R11,7 million in F2016 and an LBIT of R325,6 million, with an operating margin of -10,4%. This was substantially worse than the loss of R209,4 million and margin of -5,4% in F2016. This was largely attributable to the performances of WHS and Incledon. WHS incurred a large operational loss on the back of significantly lower volumes, but is currently at breakeven. Incledon also incurred a large operational loss, mainly due to the lack of government and municipal spend on water infrastructure in the first half of F2017. Incledon has reached breakeven post year-end.
The manufacturing segment delivered an operational loss of R10,5 million compared to a profit of R52,9 million in F2016, an LBIT of R89 million, with an operating margin of -6,1%. Although this was a strong improvement from the loss of R436,2 million and the margin of -26,8% in F2016, it was still too far below budget. Although Swan Plastics continued to produce a pleasing profit, the large loss at Sangio and DPI Plastics took this segment into the red. DPI Plastics has moved back into a breakeven position post year-end. Notwithstanding strong factory intervention from Lixil Japan, GDW made a large loss for the year. GDW is also now back at breakeven. Post year-end, the group entered into a non-binding memorandum of understanding with GDW’s controlling shareholders to dispose of DAWN’s 49% shareholding in GDW to Lixil. Refer to the ‘Events after the reporting date’ for further information.
Net finance charges amounted to R58,6 million, compared to R71,1 million in F2016, mainly due to the R34,0 million raised on the Swan Plastics put option in F2016 not repeating to the same extent in F2017. Transaction costs relating to bridging finance and deal costs amounted to R11,4 million, classified as finance expenses. Interest paid to financiers of R46,0 million increased by 24%. This was attributable both to increased borrowing and an increase in interest rates.
The effective tax rate was 9,8% (F2016: 2,6%). This was mainly due to a prudent approach adopted in terms of the raising of deferred tax assets, assessed tax losses and impairments.
DAWN therefore reduced its loss per share for F2017 to 269,2 cents compared to the loss of 318,3 cents for F2016. However, the headline loss per share increased to 240,5 cents compared to a loss of 65,6 cents for the comparable period.
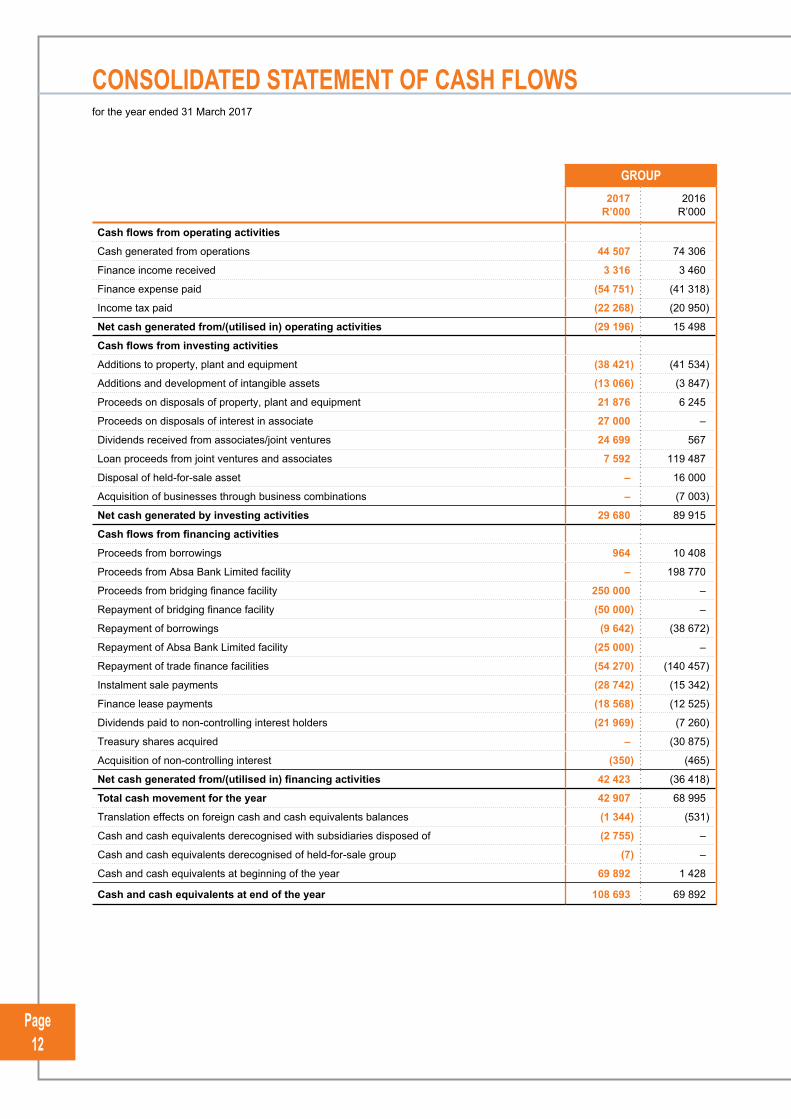
Cash flow statementAs earnings before interest, taxation, depreciation and amortisation (EBITDA) came under increasing pressure in F2017, the group’s cash flow position deteriorated accordingly.
The group absorbed R371,6 million (F2016: R49,0 million generated) cash from operations before working capital enhancements of R416,1 million (H1 F2016: R25,3 million). Pleasingly, gross working capital (before impairments) showed a net inflow of R93,9 million (F2016: R43,2 million), despite a smaller improvement in the second half compared to the first. Although creditor payments deteriorated by R196,3 million, they are now back up to date. Debtors saw a R70 million reduction in overdues for the period under review and, most importantly, stock before impairments and write-downs showed a sound improvement, improving by R156,9 million.
This resulted in a net cash outflow of R29,2 million (F2016: R15,5 million net inflow) after settlement of taxation liabilities of R22,3 million (F2016: R21,0 million) and net interest of R51,4 million (F2016: R37,9 million).
Investing activities and remaining cash movements generated R68,0 million (F2016: R53,0 million utilised).
Net investing activities generated R29,7 million (F2016: R29,6 million outflow), with a net contribution from property, plant and equipment on disposals of R21,9 million and proceeds from the Heunis Steel disposal of R50 million. Although Heunis Steel continued to perform strongly, the need for liquidity necessitated a decision to sell the business. DAWN’s 49% was sold for R50 million in January 2017. Investment in capital expenditure on enterprise resource planning (ERP) software, generators, fleet, plant and equipment amounted to R51,5 million (F2016: R45,4 million invested).
Financing activities and remaining cash movements generated R38,2 million (F2016: R82,6 million). This consisted of a net debt inflow of R175,0 million (including a R200 million new bridging facility, less a R25 million repayment to Absa Bank Limited) (F2016: R120,8 million) net debt flows consisting of a R206,7 million inflow and an outflow of R85,9 million. A dividend payment of R22,0 million (F2016: R7,3 million) was made, representing dividend payments to non-controlling interests, partly to manage the group’s cash flow facilities.
This resulted in a net closing cash balance of R108,7 million (F2016: R69,9 million).
RESULTS COMMENTARY continued
for the year ended 31 March 2017
Page 5
Distribution & Warehousing Network Limited | | Audited summary consolidated financial results for the year ended 31 March 2017
Statement of financial positionThe group’s statement of financial position for F2017 was concerning, with 86,8% net gearing ratio (F2016: 29,5%) and a net cash balance of R108,7 million (F2016: R69,9 million).
It became clear that the sustained poor operating performance due to tough markets, combined with debt repayment obligations, would render the group unable to conduct its business. This resulted in DAWN approaching shareholders for a rights issue of R358 million, the proceeds of which were received post year-end on 12 April 2017. R200 million was used to repay bridging finance, R75 million to repay Absa Bank Limited and the balance to fund future operations.
PROSPECTS
The second part of the turnaround plan focuses on restoring fundamentals from both a strategic and an operational perspective.
Operational focus areas include:
• The focus in the manufacturing segment will be on actively improving efficiencies, to re-engineer the operations for lower factory breakeven points and to significantly rationalise the product spread.
• In the trading segment, it will be crucial to reclaim the master distributor status. Customers and suppliers require DAWN to fulfil the master distributor role. The team will also focus on addressing its on-time-in-full delivery, just-in-time delivery, re-energising staff, restoring supplier and customer relationships and actively manage volume-related term agreements.
Strategic focus areas include:
• Implementing the decentralisation of the business structure, with an emphasis on authority and accountability.
• Driving cross-selling to regain market share.
• Transforming the business and implementing further rightsizing to operate successfully in a tough economy.
The management team is mindful that they have to meet the bank covenants on EBITDA and working capital, with these areas receiving particular attention.
The restructuring and improvements already made, together with the key strategic and operating initiatives, have ensured that the group is doing all it can to return the business to sustainable profitability. Care has been taken to retain the group footprint to ensure that, when growth returns to the group’s markets, it is well positioned to capitalise on the opportunities which will arise.
DAWN is not anticipating any meaningful improvement in the economy in F2018. This will result in the group continuing to experience difficult trading conditions in a very competitive environment. As a management team, the focus is firmly on delivering on the short-term action plan and to complete the turnaround and achieve at least a breakeven position in F2018, provided there will be no further significant weakening of the economy. The second half is also seasonally weaker. Wage negotiations have started in July which, at times in the past, have led to strike action if not successfully concluded.
As outlined in the trading update published on SENS on 12 July 2017, although the board believes the group is solvent and liquid for the 12 months following the date of the auditors signing of this year’s results on 14 July 2017, certain potential events and conditions give rise to a material uncertainty that may cast significant doubt on the group’s ability to continue as a going concern based on cash flow forecasts prepared against the backdrop of available facilities. Refer to note 1 ‘Basis of preparation’ for the section on ‘Going concern assessment’.
Management is actively addressing the group’s short-term challenges, with actions including corporate restructuring activities and alternative funding options.
Over the medium-term, the group will focus on achieving profitability in F2019 and meeting profit before interest and tax target margins in F2020 of 5% in the trading segment and 12% in the manufacturing segment.
Any forward-looking statement has not been reviewed or reported on by the company’s auditors.
RESULTS COMMENTARY continued
for the year ended 31 March 2017
Page 6
CHANGES TO THE BOARD Changes at executive level
During the period under review, Derek Tod retired as CEO, effective 31 May 2016, and Stephen Connelly was appointed as the interim CEO on 1 June 2016. With the appointment of a permanent CEO on 1 April 2017, Stephen was appointed as the executive deputy chairman of the group until December 2017. The board would like to thank him for the significant role he has played in his interim CEO capacity in starting to bring the group back to stability and in managing relationships with key stakeholder groups. His continued involvement with the group is greatly valued.
Post year-end, Edwin Hewitt was appointed as permanent CEO of DAWN on 1 April 2017. Edwin brings valuable skills to this role. He has a wealth of experience in senior executive roles in listed environments. He also has a proven track record of successful turnarounds of a number of companies. Most recently, he was appointed by PPC, working with four major banks, as chief restructuring officer. DAWN appointed him in February 2017 as chief restructuring officer, working with a major bank, where he again played a significant role in finalising a recapitalisation programme. Previously, Edwin was CEO of Capital Africa Steel (Pty) Ltd and of the fabrication and the manufacturing division of the Murray & Roberts group.
During the period under review, the previous CFO, Dries Ferreira, and risk and compliance officer, Jan Beukes, both resigned on 14 July 2016, effective 31 October 2016. David Austin was appointed as CFO on 18 November 2016. David resigned on 17 March 2017, effective 30 June 2017. Chris Booyens was appointed post year-end as the new chief financial officer and financial director of the company on 1 May 2017, following David’s resignation. Chris is a qualified Chartered Accountant South Africa (CA(SA)) and a member of the South African Institute of Chartered Accountants. Chris has enjoyed several years’ experience in the building and materials supply industry as group financial director of Iliad Africa Limited. He also served as financial executive and executive director at various Tiger Brands subsidiaries.
The board is confident that the new CEO and his executive team, which has also been bolstered with strong new appointments at executive committee level, will be successful in leading DAWN back to a growth path and regaining the confidence of all stakeholders.
Non-executive director changes Saleh Mayet resigned as an independent non-executive director and chairman of the audit and risk committee on 20 February 2017.
On 28 March 2017, the board welcomed the appointment of Akhter Moosa as an independent non-executive director and chairman of the audit and risk committee. Akhter completed his BComm at the University of Durban, Westville, and qualified as a chartered accountant in 1978. He has extensive experience at board level and is currently a member of the disciplinary committee of the Independent Regulatory Board of Auditors. He acts as advisor to the audit committee of SANRAL Limited and is a member of the audit and risk committee of the Competition Tribunal.
Changes to the duties of directorsIn compliance with the JSE Limited Listings Requirements, shareholders are advised of the following changes to the duties of the following directors on the DAWN board of directors:
• Akhter Moosa, an independent non-executive director and chairman of the audit and risk committee, has also been appointed as a member of the remuneration and nomination committees, effective 14 July 2017;
• Edwin Hewitt, chief executive director, has been appointed as a member of the social, ethics and transformation committee, effective 14 July 2017; and
• Lou Alberts, an independent non-executive director, has been appointed as lead independent director on the board, effective 14 July 2017.
RESULTS COMMENTARY continued
for the year ended 31 March 2017
Page 7
Distribution & Warehousing Network Limited | | Audited summary consolidated financial results for the year ended 31 March 2017
OTHER MATTERS
During the year reportable irregularities were reported by the external auditors to the Independent Regulatory Board of Auditors with respect to the transactions relating to an operating lease liability and the Swan Plastics written put. The external auditors have confirmed to the Independent Regulatory Board of Auditors that these irregularities are not continuing. Full disclosure on the matter was made in the 2016 annual financial statements.
DIVIDENDNo dividend has been proposed or declared. Resumption of dividend payments is dependent on the board’s future views of when the majority of DAWN’s underlying businesses will be firmly in profit.
For and on behalf of the board of directors
Diederik Fouché Edwin Hewitt Chris Booyens Independent non-executive chairman Chief executive officer Chief financial officer
Germiston 14 July 2017
RESULTS COMMENTARY continued
for the year ended 31 March 2017
Page 8
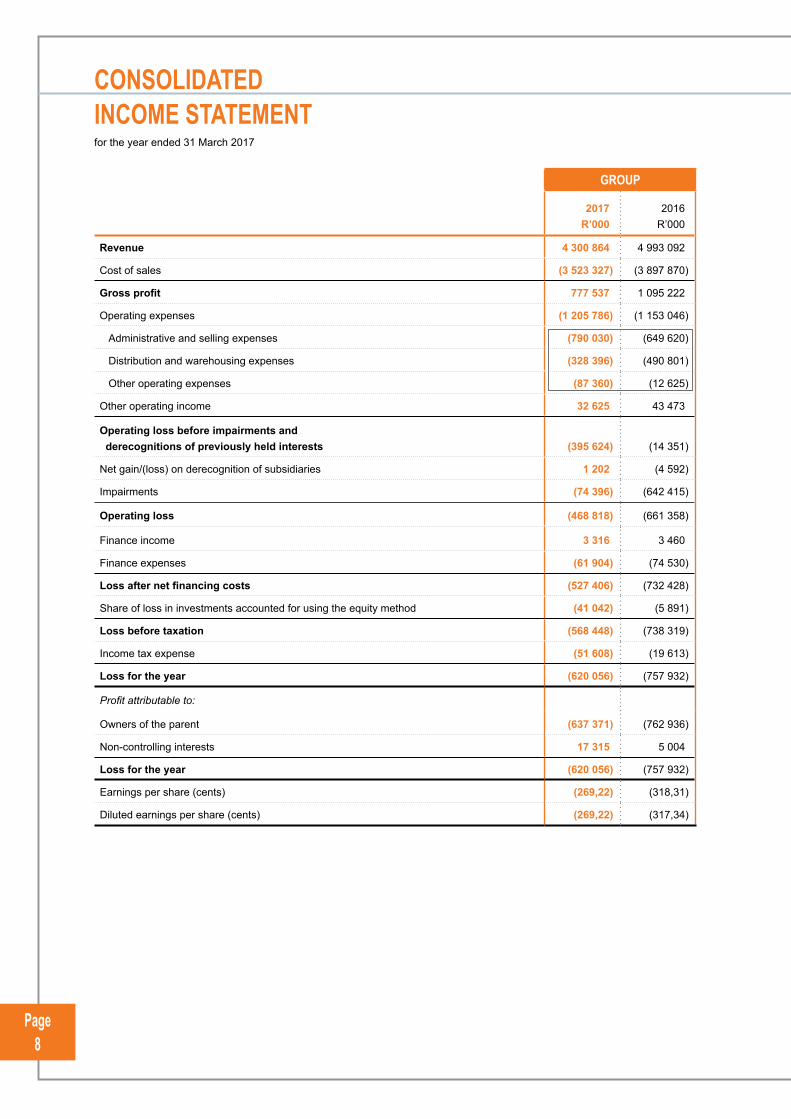
CONSOLIDATED INCOME STATEMENTfor the year ended 31 March 2017
GROUP
2017R’000
2016R’000
Revenue 4 300 864 4 993 092
Cost of sales (3 523 327) (3 897 870)
Gross profit 777 537 1 095 222
Operating expenses (1 205 786) (1 153 046)
Administrative and selling expenses (790 030) (649 620)
Distribution and warehousing expenses (328 396) (490 801)
Other operating expenses (87 360) (12 625)
Other operating income 32 625 43 473
Operating loss before impairments and derecognitions of previously held interests (395 624) (14 351)
Net gain/(loss) on derecognition of subsidiaries 1 202 (4 592)
Impairments (74 396) (642 415)
Operating loss (468 818) (661 358)
Finance income 3 316 3 460
Finance expenses (61 904) (74 530)
Loss after net financing costs (527 406) (732 428)
Share of loss in investments accounted for using the equity method (41 042) (5 891)
Loss before taxation (568 448) (738 319)
Income tax expense (51 608) (19 613)
Loss for the year (620 056) (757 932)
Profit attributable to:
Owners of the parent (637 371) (762 936)
Non-controlling interests 17 315 5 004
Loss for the year (620 056) (757 932)
Earnings per share (cents) (269,22) (318,31)
Diluted earnings per share (cents) (269,22) (317,34)
Page 9
Distribution & Warehousing Network Limited | | Audited summary consolidated financial results for the year ended 31 March 2017
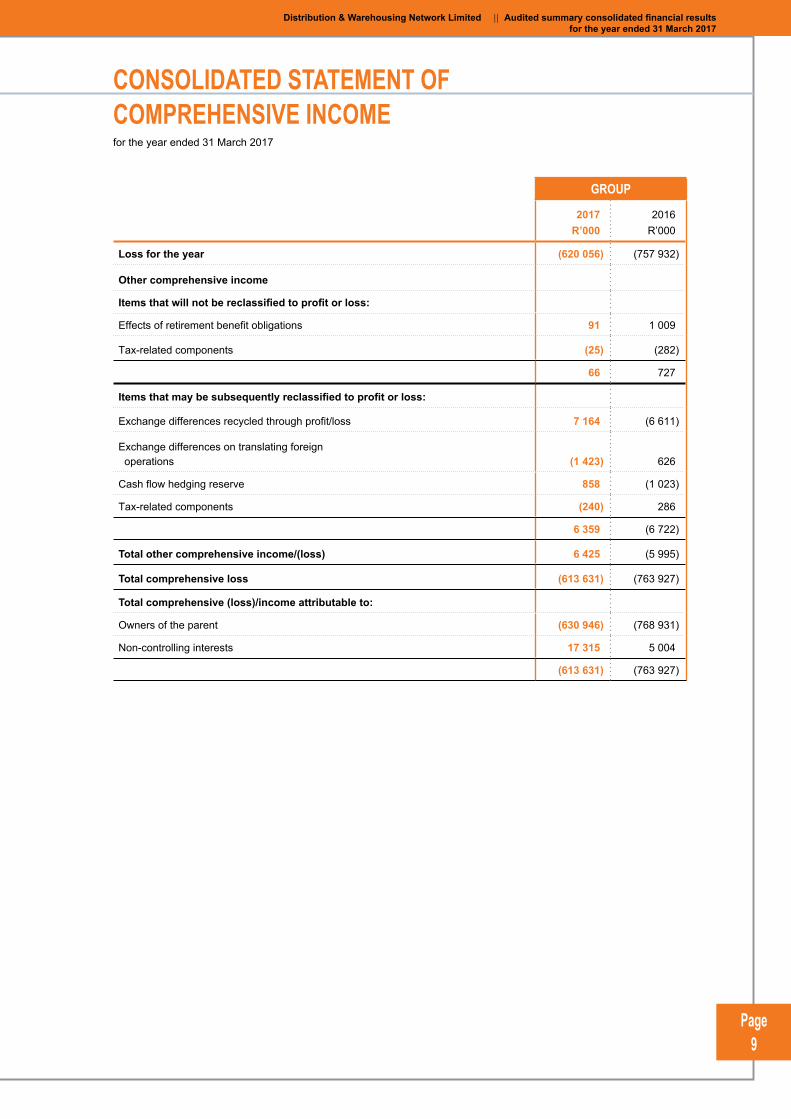
CONSOLIDATED STATEMENT OF COMPREHENSIVE INCOMEfor the year ended 31 March 2017
GROUP
2017R’000
2016R’000
Loss for the year (620 056) (757 932)
Other comprehensive income
Items that will not be reclassified to profit or loss:
Effects of retirement benefit obligations 91 1 009
Tax-related components (25) (282)
66 727
Items that may be subsequently reclassified to profit or loss:
Exchange differences recycled through profit/loss 7 164 (6 611)
Exchange differences on translating foreign operations (1 423) 626
Cash flow hedging reserve 858 (1 023)
Tax-related components (240) 286
6 359 (6 722)
Total other comprehensive income/(loss) 6 425 (5 995)
Total comprehensive loss (613 631) (763 927)
Total comprehensive (loss)/income attributable to:
Owners of the parent (630 946) (768 931)
Non-controlling interests 17 315 5 004
(613 631) (763 927)
Page 10
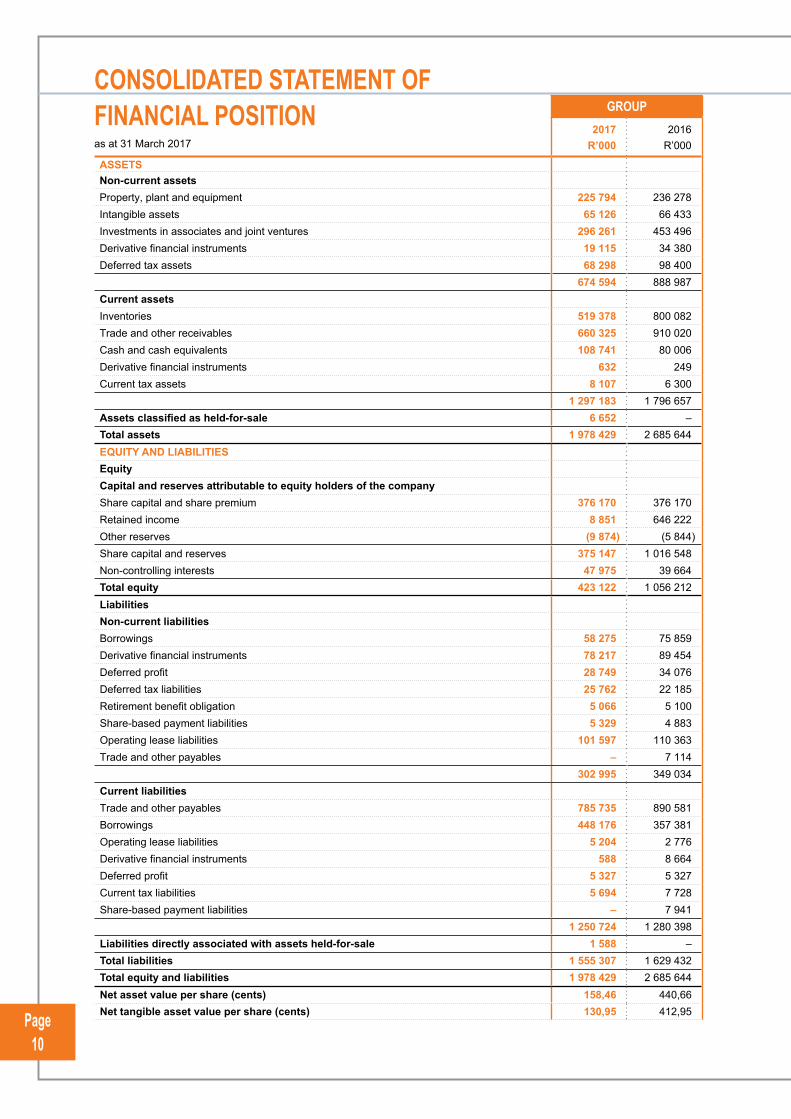
CONSOLIDATED STATEMENT OF FINANCIAL POSITIONas at 31 March 2017
GROUP2017
R’0002016
R’000
ASSETSNon-current assetsProperty, plant and equipment 225 794 236 278 Intangible assets 65 126 66 433 Investments in associates and joint ventures 296 261 453 496 Derivative financial instruments 19 115 34 380 Deferred tax assets 68 298 98 400
674 594 888 987 Current assetsInventories 519 378 800 082 Trade and other receivables 660 325 910 020 Cash and cash equivalents 108 741 80 006 Derivative financial instruments 632 249 Current tax assets 8 107 6 300
1 297 183 1 796 657Assets classified as held-for-sale 6 652 –Total assets 1 978 429 2 685 644 EQUITY AND LIABILITIESEquityCapital and reserves attributable to equity holders of the companyShare capital and share premium 376 170 376 170Retained income 8 851 646 222 Other reserves (9 874) (5 844)Share capital and reserves 375 147 1 016 548 Non-controlling interests 47 975 39 664 Total equity 423 122 1 056 212 LiabilitiesNon-current liabilitiesBorrowings 58 275 75 859 Derivative financial instruments 78 217 89 454 Deferred profit 28 749 34 076 Deferred tax liabilities 25 762 22 185 Retirement benefit obligation 5 066 5 100 Share-based payment liabilities 5 329 4 883 Operating lease liabilities 101 597 110 363 Trade and other payables – 7 114
302 995 349 034 Current liabilitiesTrade and other payables 785 735 890 581 Borrowings 448 176 357 381 Operating lease liabilities 5 204 2 776 Derivative financial instruments 588 8 664 Deferred profit 5 327 5 327 Current tax liabilities 5 694 7 728 Share-based payment liabilities – 7 941
1 250 724 1 280 398 Liabilities directly associated with assets held-for-sale 1 588 –Total liabilities 1 555 307 1 629 432 Total equity and liabilities 1 978 429 2 685 644 Net asset value per share (cents) 158,46 440,66Net tangible asset value per share (cents) 130,95 412,95
Page 11
Distribution & Warehousing Network Limited | | Audited summary consolidated financial results for the year ended 31 March 2017
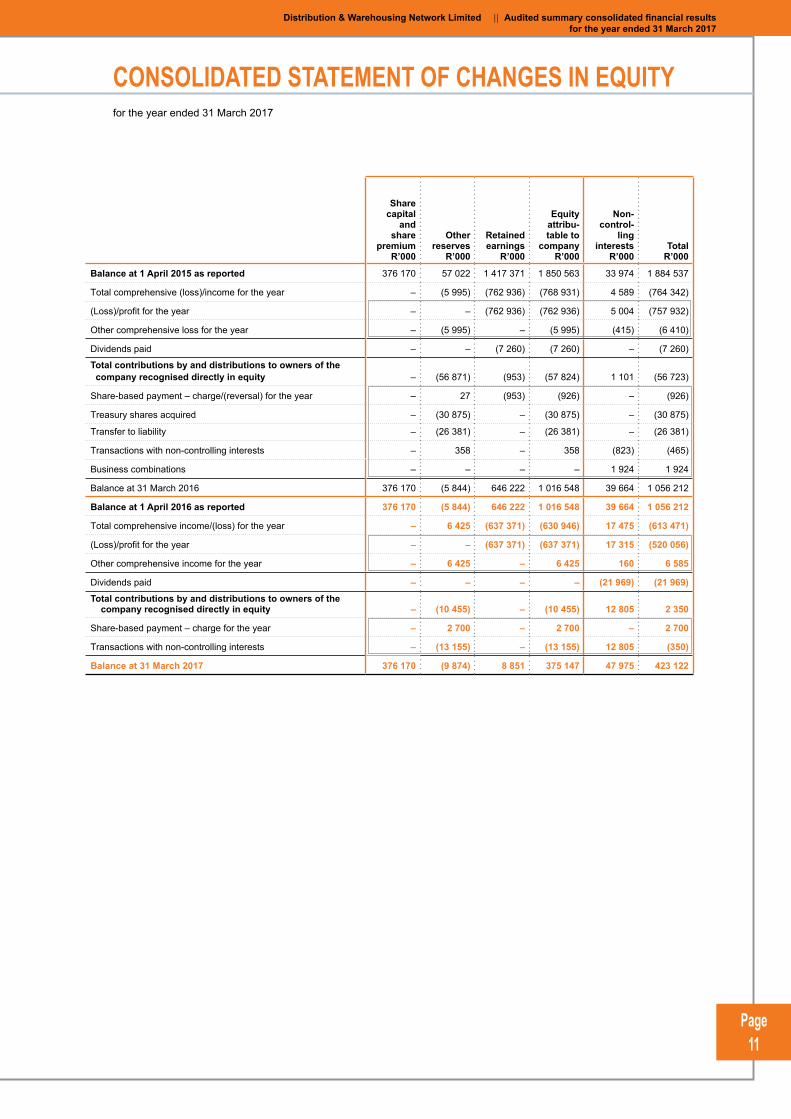
CONSOLIDATED STATEMENT OF CHANGES IN EQUITYfor the year ended 31 March 2017
Sharecapital
and share
premiumR’000
Otherreserves
R’000
Retainedearnings
R’000
Equityattribu-table to
companyR’000
Non-control-
linginterests
R’000Total
R’000
Balance at 1 April 2015 as reported 376 170 57 022 1 417 371 1 850 563 33 974 1 884 537
Total comprehensive (loss)/income for the year – (5 995) (762 936) (768 931) 4 589 (764 342)
(Loss)/profit for the year – – (762 936) (762 936) 5 004 (757 932)
Other comprehensive loss for the year – (5 995) – (5 995) (415) (6 410)
Dividends paid – – (7 260) (7 260) – (7 260)
Total contributions by and distributions to owners of the company recognised directly in equity – (56 871) (953) (57 824) 1 101 (56 723)
Share-based payment – charge/(reversal) for the year – 27 (953) (926) – (926)
Treasury shares acquired – (30 875) – (30 875) – (30 875)
Transfer to liability – (26 381) – (26 381) – (26 381)
Transactions with non-controlling interests – 358 – 358 (823) (465)
Business combinations – – – – 1 924 1 924
Balance at 31 March 2016 376 170 (5 844) 646 222 1 016 548 39 664 1 056 212
Balance at 1 April 2016 as reported 376 170 (5 844) 646 222 1 016 548 39 664 1 056 212
Total comprehensive income/(loss) for the year – 6 425 (637 371) (630 946) 17 475 (613 471)
(Loss)/profit for the year – – (637 371) (637 371) 17 315 (520 056)
Other comprehensive income for the year – 6 425 – 6 425 160 6 585
Dividends paid – – – – (21 969) (21 969)Total contributions by and distributions to owners of the company recognised directly in equity – (10 455) – (10 455) 12 805 2 350
Share-based payment – charge for the year – 2 700 – 2 700 – 2 700
Transactions with non-controlling interests – (13 155) – (13 155) 12 805 (350)
Balance at 31 March 2017 376 170 (9 874) 8 851 375 147 47 975 423 122
Page 12
CONSOLIDATED STATEMENT OF CASH FLOWSfor the year ended 31 March 2017
GROUP2017
R’0002016
R’000
Cash flows from operating activities
Cash generated from operations 44 507 74 306
Finance income received 3 316 3 460
Finance expense paid (54 751) (41 318)
Income tax paid (22 268) (20 950)
Net cash generated from/(utilised in) operating activities (29 196) 15 498
Cash flows from investing activities
Additions to property, plant and equipment (38 421) (41 534)
Additions and development of intangible assets (13 066) (3 847)
Proceeds on disposals of property, plant and equipment 21 876 6 245
Proceeds on disposals of interest in associate 27 000 –
Dividends received from associates/joint ventures 24 699 567
Loan proceeds from joint ventures and associates 7 592 119 487
Disposal of held-for-sale asset – 16 000
Acquisition of businesses through business combinations – (7 003)
Net cash generated by investing activities 29 680 89 915
Cash flows from financing activities
Proceeds from borrowings 964 10 408
Proceeds from Absa Bank Limited facility – 198 770
Proceeds from bridging finance facility 250 000 –
Repayment of bridging finance facility (50 000) –
Repayment of borrowings (9 642) (38 672)
Repayment of Absa Bank Limited facility (25 000) –
Repayment of trade finance facilities (54 270) (140 457)
Instalment sale payments (28 742) (15 342)
Finance lease payments (18 568) (12 525)
Dividends paid to non-controlling interest holders (21 969) (7 260)
Treasury shares acquired – (30 875)
Acquisition of non-controlling interest (350) (465)
Net cash generated from/(utilised in) financing activities 42 423 (36 418)
Total cash movement for the year 42 907 68 995
Translation effects on foreign cash and cash equivalents balances (1 344) (531)
Cash and cash equivalents derecognised with subsidiaries disposed of (2 755) –
Cash and cash equivalents derecognised of held-for-sale group (7) –
Cash and cash equivalents at beginning of the year 69 892 1 428
Cash and cash equivalents at end of the year 108 693 69 892
Page 13
Distribution & Warehousing Network Limited | | Audited summary consolidated financial results for the year ended 31 March 2017
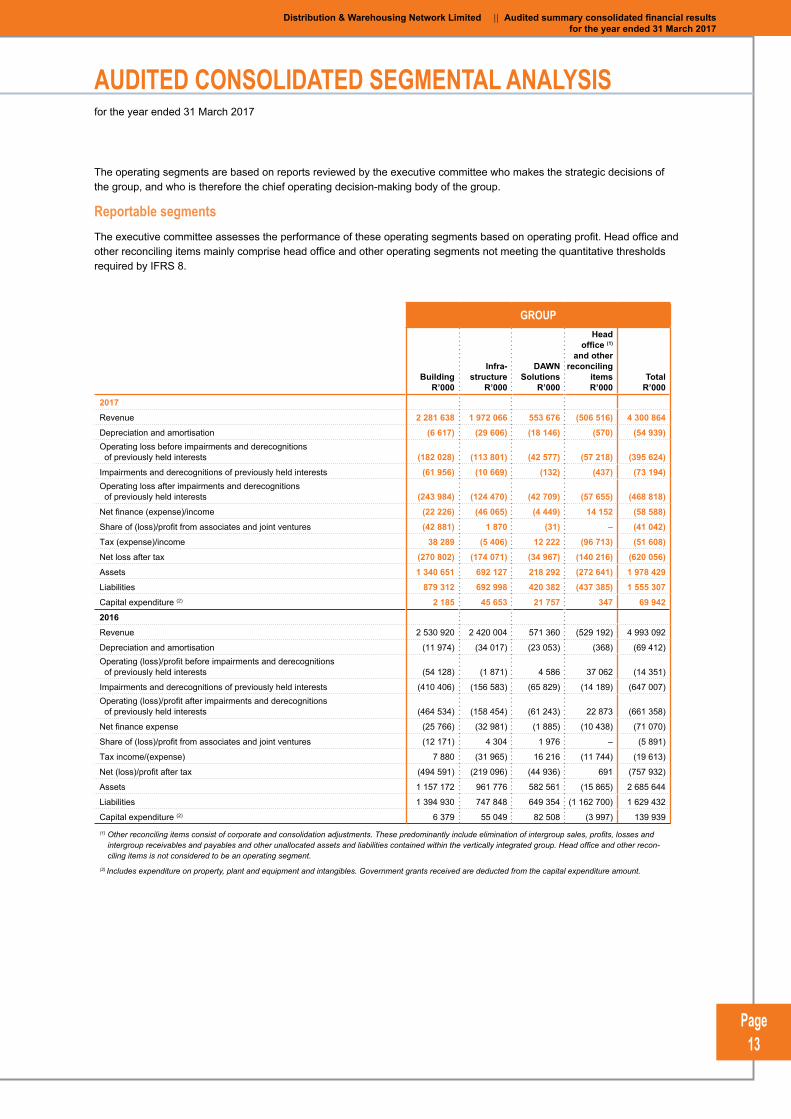
The operating segments are based on reports reviewed by the executive committee who makes the strategic decisions of the group, and who is therefore the chief operating decision-making body of the group.
Reportable segmentsThe executive committee assesses the performance of these operating segments based on operating profit. Head office and other reconciling items mainly comprise head office and other operating segments not meeting the quantitative thresholds required by IFRS 8.
GROUP
BuildingR’000
Infra-structure
R’000
DAWNSolutions
R’000
Head office (1)
and otherreconciling
itemsR’000
Total R’000
2017
Revenue 2 281 638 1 972 066 553 676 (506 516) 4 300 864
Depreciation and amortisation (6 617) (29 606) (18 146) (570) (54 939) Operating loss before impairments and derecognitions of previously held interests (182 028) (113 801) (42 577) (57 218) (395 624)
Impairments and derecognitions of previously held interests (61 956) (10 669) (132) (437) (73 194)Operating loss after impairments and derecognitions of previously held interests (243 984) (124 470) (42 709) (57 655) (468 818)
Net finance (expense)/income (22 226) (46 065) (4 449) 14 152 (58 588)
Share of (loss)/profit from associates and joint ventures (42 881) 1 870 (31) – (41 042)
Tax (expense)/income 38 289 (5 406) 12 222 (96 713) (51 608)
Net loss after tax (270 802) (174 071) (34 967) (140 216) (620 056)
Assets 1 340 651 692 127 218 292 (272 641) 1 978 429
Liabilities 879 312 692 998 420 382 (437 385) 1 555 307
Capital expenditure (2) 2 185 45 653 21 757 347 69 942
2016
Revenue 2 530 920 2 420 004 571 360 (529 192) 4 993 092
Depreciation and amortisation (11 974) (34 017) (23 053) (368) (69 412)Operating (loss)/profit before impairments and derecognitions of previously held interests (54 128) (1 871) 4 586 37 062 (14 351)
Impairments and derecognitions of previously held interests (410 406) (156 583) (65 829) (14 189) (647 007) Operating (loss)/profit after impairments and derecognitions of previously held interests (464 534) (158 454) (61 243) 22 873 (661 358)
Net finance expense (25 766) (32 981) (1 885) (10 438) (71 070)
Share of (loss)/profit from associates and joint ventures (12 171) 4 304 1 976 – (5 891)
Tax income/(expense) 7 880 (31 965) 16 216 (11 744) (19 613)
Net (loss)/profit after tax (494 591) (219 096) (44 936) 691 (757 932)
Assets 1 157 172 961 776 582 561 (15 865) 2 685 644
Liabilities 1 394 930 747 848 649 354 (1 162 700) 1 629 432
Capital expenditure (2) 6 379 55 049 82 508 (3 997) 139 939
(1) Other reconciling items consist of corporate and consolidation adjustments. These predominantly include elimination of intergroup sales, profits, losses and intergroup receivables and payables and other unallocated assets and liabilities contained within the vertically integrated group. Head office and other recon-ciling items is not considered to be an operating segment.
(2) Includes expenditure on property, plant and equipment and intangibles. Government grants received are deducted from the capital expenditure amount.
AUDITED CONSOLIDATED SEGMENTAL ANALYSISfor the year ended 31 March 2017
Page 14
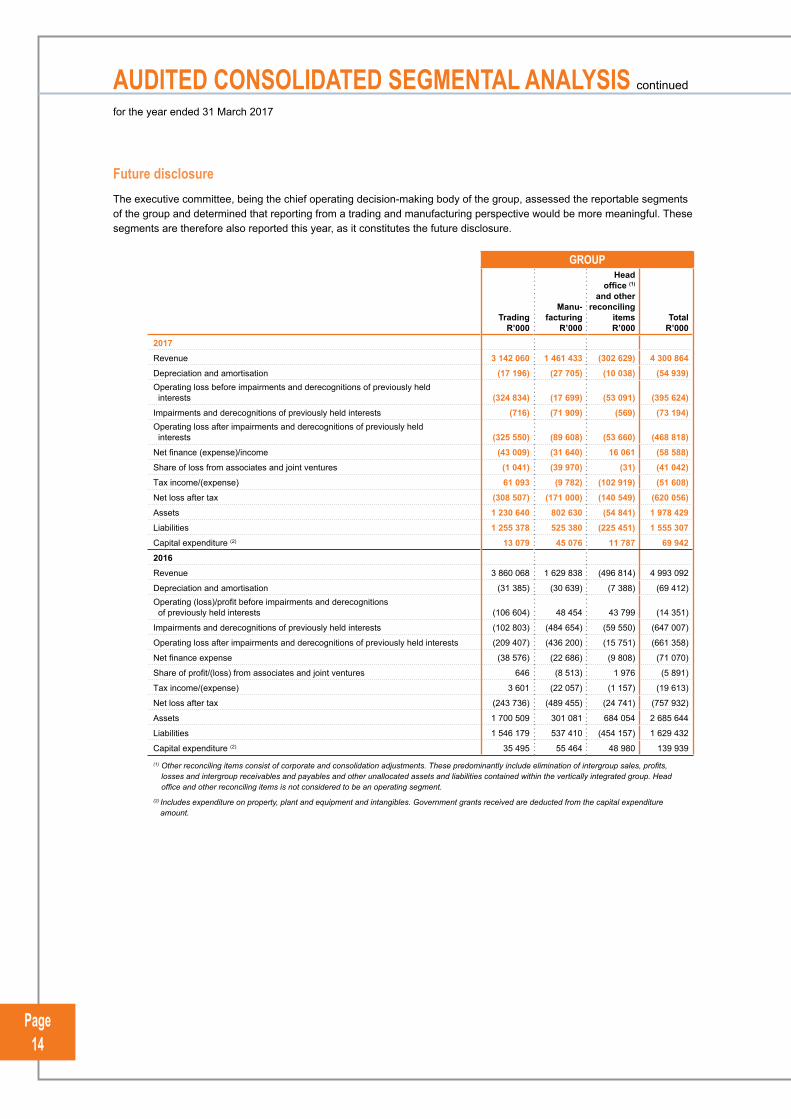
Future disclosureThe executive committee, being the chief operating decision-making body of the group, assessed the reportable segments of the group and determined that reporting from a trading and manufacturing perspective would be more meaningful. These segments are therefore also reported this year, as it constitutes the future disclosure.
GROUP
TradingR’000
Manu-facturing
R’000
Head office (1)
and otherreconciling
itemsR’000
Total R’000
2017
Revenue 3 142 060 1 461 433 (302 629) 4 300 864
Depreciation and amortisation (17 196) (27 705) (10 038) (54 939) Operating loss before impairments and derecognitions of previously held interests (324 834) (17 699) (53 091) (395 624)
Impairments and derecognitions of previously held interests (716) (71 909) (569) (73 194)Operating loss after impairments and derecognitions of previously held interests (325 550) (89 608) (53 660) (468 818)
Net finance (expense)/income (43 009) (31 640) 16 061 (58 588)
Share of loss from associates and joint ventures (1 041) (39 970) (31) (41 042)
Tax income/(expense) 61 093 (9 782) (102 919) (51 608)
Net loss after tax (308 507) (171 000) (140 549) (620 056)
Assets 1 230 640 802 630 (54 841) 1 978 429
Liabilities 1 255 378 525 380 (225 451) 1 555 307
Capital expenditure (2) 13 079 45 076 11 787 69 942
2016
Revenue 3 860 068 1 629 838 (496 814) 4 993 092
Depreciation and amortisation (31 385) (30 639) (7 388) (69 412)Operating (loss)/profit before impairments and derecognitions of previously held interests (106 604) 48 454 43 799 (14 351)
Impairments and derecognitions of previously held interests (102 803) (484 654) (59 550) (647 007)
Operating loss after impairments and derecognitions of previously held interests (209 407) (436 200) (15 751) (661 358)
Net finance expense (38 576) (22 686) (9 808) (71 070)
Share of profit/(loss) from associates and joint ventures 646 (8 513) 1 976 (5 891)
Tax income/(expense) 3 601 (22 057) (1 157) (19 613)
Net loss after tax (243 736) (489 455) (24 741) (757 932)
Assets 1 700 509 301 081 684 054 2 685 644
Liabilities 1 546 179 537 410 (454 157) 1 629 432
Capital expenditure (2) 35 495 55 464 48 980 139 939
(1) Other reconciling items consist of corporate and consolidation adjustments. These predominantly include elimination of intergroup sales, profits, losses and intergroup receivables and payables and other unallocated assets and liabilities contained within the vertically integrated group. Head office and other reconciling items is not considered to be an operating segment.
(2) Includes expenditure on property, plant and equipment and intangibles. Government grants received are deducted from the capital expenditure amount.
AUDITED CONSOLIDATED SEGMENTAL ANALYSIS continued
for the year ended 31 March 2017
Page 15
Distribution & Warehousing Network Limited | | Audited summary consolidated financial results for the year ended 31 March 2017
1. BASIS OF PREPARATION These consolidated annual financial statements comprise a summary of the audited consolidated financial
statements of the group for 12 months ended 31 March 2017 that was approved by the board on 12 July 2017.
The summary consolidated financial statements are prepared in accordance with the requirements of the JSE Limited’s (JSE) Listings Requirements for summary financial statements and the requirements of the Companies Act applicable to summary financial statements. The JSE requires summary financial statements to be prepared in accordance with the framework concepts, the measurement and recognition requirements of International Financial Reporting Standards (IFRS), the SAICA Financial Reporting Guides as issued by the Accounting Practices Committee and Financial Reporting Pronouncements as issued by the Financial Reporting Standards Council and must also, as a minimum, contain the information required by IAS 34 Interim Financial Reporting. The accounting policies applied in the preparation of the consolidated financial statements from which the summary consolidated financial statements were derived are in terms of IFRS and are consistent with the accounting policies applied in the preparation of the previous consolidated annual financial statements, with the exception of derivative financial instruments, available-for-sale assets and retirement benefit obligations.
The preparation of the summary consolidated annual financial statements by Yolandi van den Berg (CA(SA)), senior group financial accountant, has been supervised by the group financial manager, Hanré Bester (CA(SA)) and the chief financial officer and financial director, Chris Booyens CA(SA)).
The directors take full responsibility for the preparation of the provisional report and that the financial information has been correctly extracted from the underlying annual financial statements.
Going concern assessment DAWN posted losses for both the years ended 31 March 2016 and 2017 of R762,9 million and R637,4 million,
respectively. In determining the appropriate basis of preparation of the annual financial statements, the directors are required to consider whether the group can continue to operate as a going concern for the foreseeable future, to 14 July 2018.
After the rights issue in April 2017, DAWN had banking facilities available of R200 million, comprising a R100 million revolving credit and a R100 million general banking facility. To determine if the group will be a going concern for the next financial year and up to 14 July 2018, management prepared cash flow forecasts for each of the material subsidiaries. These forecasts were subjected to further sensitivity tests and included the estimated intra-month peak funding requirements. Management also considered the businesses’ ability to meet its financial obligations for the 12 months following approval of the annual financial statements. The analysis considered the current challenging market conditions, which negatively affects the performance of the group and management’s turnaround plan being executed including a return to sustainable profitability, further cost reductions and optimisation of working capital. The resulting cash flow projections were compared to available funding facilities. The forecast profitability and the ability of the underlying business to meet the forecasts is an area of uncertainty.
The effect of a further deterioration in the economic outlook and its potential impact on the group’s cash flow and funding facilities were also considered as an uncertainty.
The group’s ability to fund its short-term liquidity requirements is dependent on adequate funding facilities. The forecasts indicate that the covenants on the facilities are expected to be breached. Management is seeking clarification from their bankers in this regard. Breaching covenants creates a risk for the group of losing its facilities.
Part of management’s plans to address this include the corporate restructuring activities and alternative funding options, which are being considered.
These events and conditions give rise to a material uncertainty that may cast significant doubt about the group’s ability to continue as a going concern and, therefore, that it may be unable to realise its assets and discharge its liabilities in the normal course of business.
NOTES TO THE AUDITED SUMMARY CONSOLIDATED FINANCIAL STATEMENTSfor the year ended 31 March 2017
Page 16
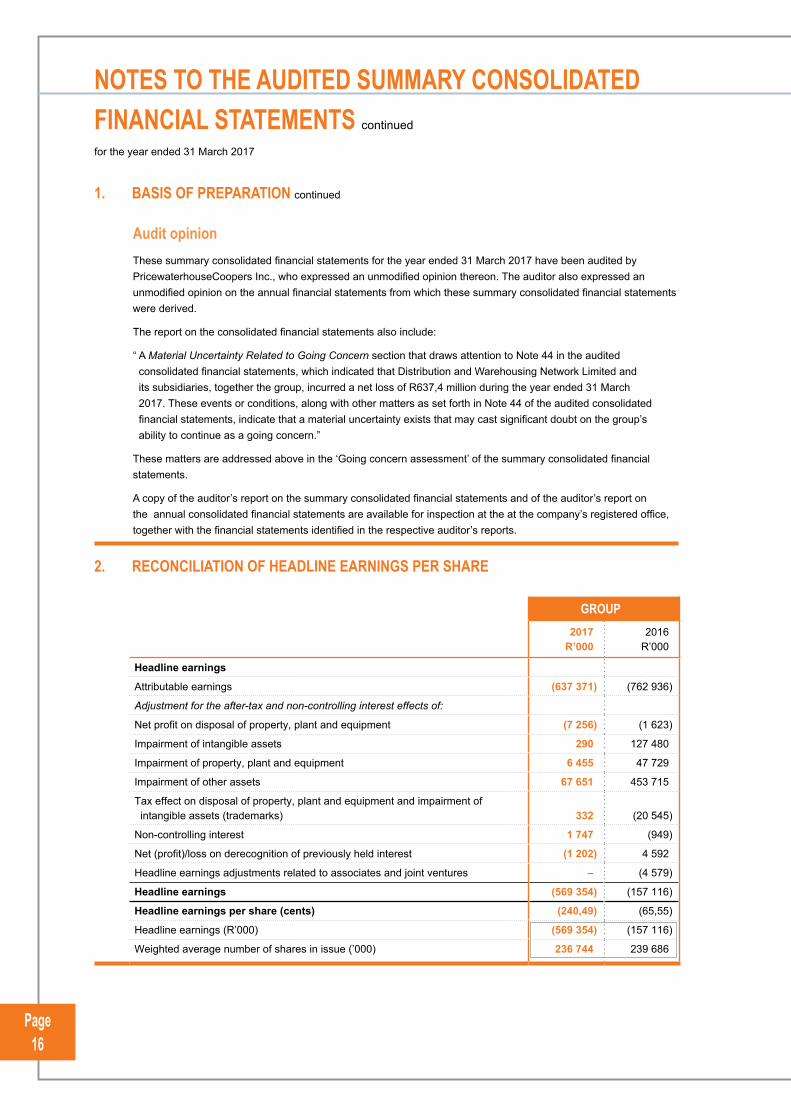
1. BASIS OF PREPARATION continued
Audit opinion These summary consolidated financial statements for the year ended 31 March 2017 have been audited by
PricewaterhouseCoopers Inc., who expressed an unmodified opinion thereon. The auditor also expressed an unmodified opinion on the annual financial statements from which these summary consolidated financial statements were derived.
The report on the consolidated financial statements also include:
“ A Material Uncertainty Related to Going Concern section that draws attention to Note 44 in the audited consolidated financial statements, which indicated that Distribution and Warehousing Network Limited and its subsidiaries, together the group, incurred a net loss of R637,4 million during the year ended 31 March 2017. These events or conditions, along with other matters as set forth in Note 44 of the audited consolidated financial statements, indicate that a material uncertainty exists that may cast significant doubt on the group’s ability to continue as a going concern.”
These matters are addressed above in the ‘Going concern assessment’ of the summary consolidated financial statements.
A copy of the auditor’s report on the summary consolidated financial statements and of the auditor’s report on the annual consolidated financial statements are available for inspection at the at the company’s registered office, together with the financial statements identified in the respective auditor’s reports.
2. RECONCILIATION OF HEADLINE EARNINGS PER SHARE
GR GROUP OUP
2017R’000
2016R’000
Headline earnings
Attributable earnings (637 371) (762 936)
Adjustment for the after-tax and non-controlling interest effects of:
Net profit on disposal of property, plant and equipment (7 256) (1 623)
Impairment of intangible assets 290 127 480
Impairment of property, plant and equipment 6 455 47 729
Impairment of other assets 67 651 453 715
Tax effect on disposal of property, plant and equipment and impairment of intangible assets (trademarks) 332 (20 545)
Non-controlling interest 1 747 (949)
Net (profit)/loss on derecognition of previously held interest (1 202) 4 592
Headline earnings adjustments related to associates and joint ventures – (4 579)
Headline earnings (569 354) (157 116)
Headline earnings per share (cents) (240,49) (65,55)
Headline earnings (R’000) (569 354) (157 116)
Weighted average number of shares in issue (’000) 236 744 239 686
NOTES TO THE AUDITED SUMMARY CONSOLIDATED FINANCIAL STATEMENTS continued
for the year ended 31 March 2017
Page 17
Distribution & Warehousing Network Limited | | Audited summary consolidated financial results for the year ended 31 March 2017
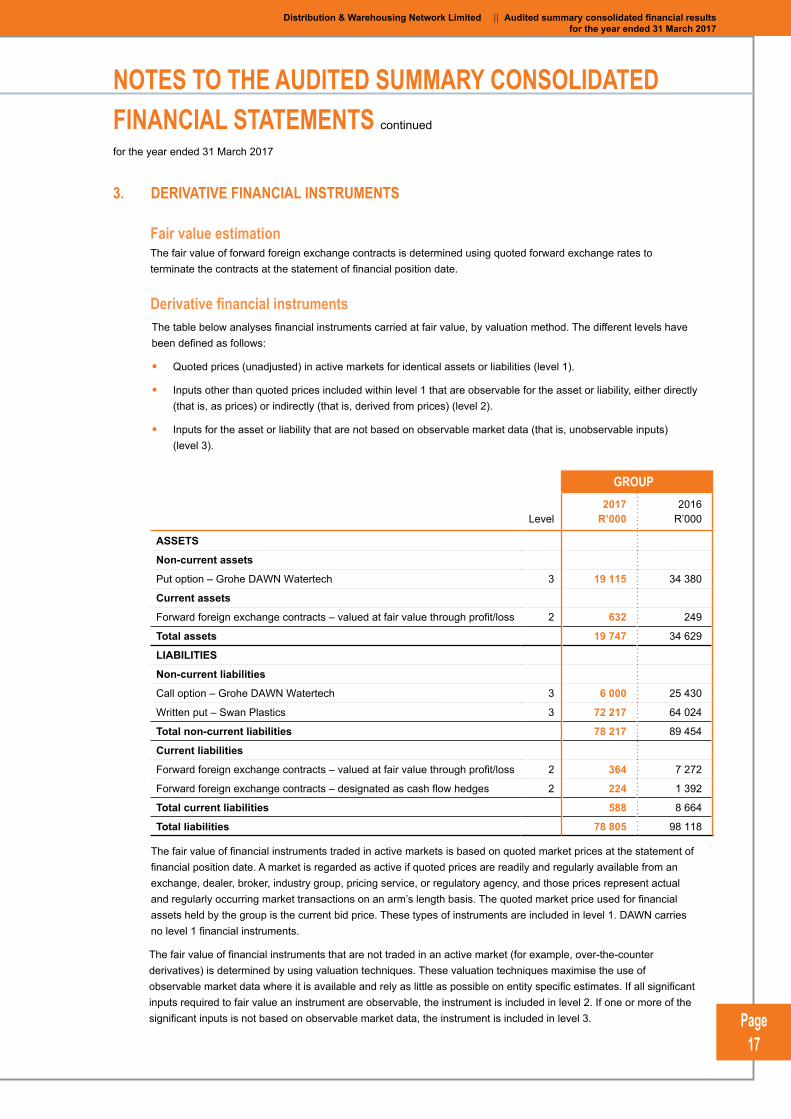
3. DERIVATIVE FINANCIAL INSTRUMENTS
Fair value estimation The fair value of forward foreign exchange contracts is determined using quoted forward exchange rates to
terminate the contracts at the statement of financial position date.
Derivative financial instruments The table below analyses financial instruments carried at fair value, by valuation method. The different levels have
been defined as follows:
• Quoted prices (unadjusted) in active markets for identical assets or liabilities (level 1).
• Inputs other than quoted prices included within level 1 that are observable for the asset or liability, either directly (that is, as prices) or indirectly (that is, derived from prices) (level 2).
• Inputs for the asset or liability that are not based on observable market data (that is, unobservable inputs) (level 3).
GR GROUP OUP
Level2017
R’0002016
R’000
ASSETS
Non-current assets
Put option – Grohe DAWN Watertech 3 19 115 34 380
Current assets
Forward foreign exchange contracts – valued at fair value through profit/loss 2 632 249
Total assets 19 747 34 629
LIABILITIES
Non-current liabilities
Call option – Grohe DAWN Watertech 3 6 000 25 430
Written put – Swan Plastics 3 72 217 64 024
Total non-current liabilities 78 217 89 454
Current liabilities
Forward foreign exchange contracts – valued at fair value through profit/loss 2 364 7 272
Forward foreign exchange contracts – designated as cash flow hedges 2 224 1 392
Total current liabilities 588 8 664
Total liabilities 78 805 98 118
The fair value of financial instruments traded in active markets is based on quoted market prices at the statement of financial position date. A market is regarded as active if quoted prices are readily and regularly available from an exchange, dealer, broker, industry group, pricing service, or regulatory agency, and those prices represent actual and regularly occurring market transactions on an arm’s length basis. The quoted market price used for financial assets held by the group is the current bid price. These types of instruments are included in level 1. DAWN carries no level 1 financial instruments.
The fair value of financial instruments that are not traded in an active market (for example, over-the-counter derivatives) is determined by using valuation techniques. These valuation techniques maximise the use of observable market data where it is available and rely as little as possible on entity specific estimates. If all significant inputs required to fair value an instrument are observable, the instrument is included in level 2. If one or more of the significant inputs is not based on observable market data, the instrument is included in level 3.
NOTES TO THE AUDITED SUMMARY CONSOLIDATED FINANCIAL STATEMENTS continued
for the year ended 31 March 2017
Page 18
3. DERIVATIVE FINANCIAL INSTRUMENTS continued
Specific valuation techniques used to value financial instruments include:
• Quoted market prices or dealer quotes for similar instruments.
• The fair value of interest rate swaps is calculated as the present value of the estimated future cash flows based on observable yield curves.
• The fair value of forward foreign exchange contracts is determined using forward exchange rates at the statement of financial position date, with the resulting value discounted back to present value.
• Other techniques, such as discounted cash flow analysis, are used to determine fair value for the remaining financial instruments.
All of the resulting fair value estimates are included in level 2.
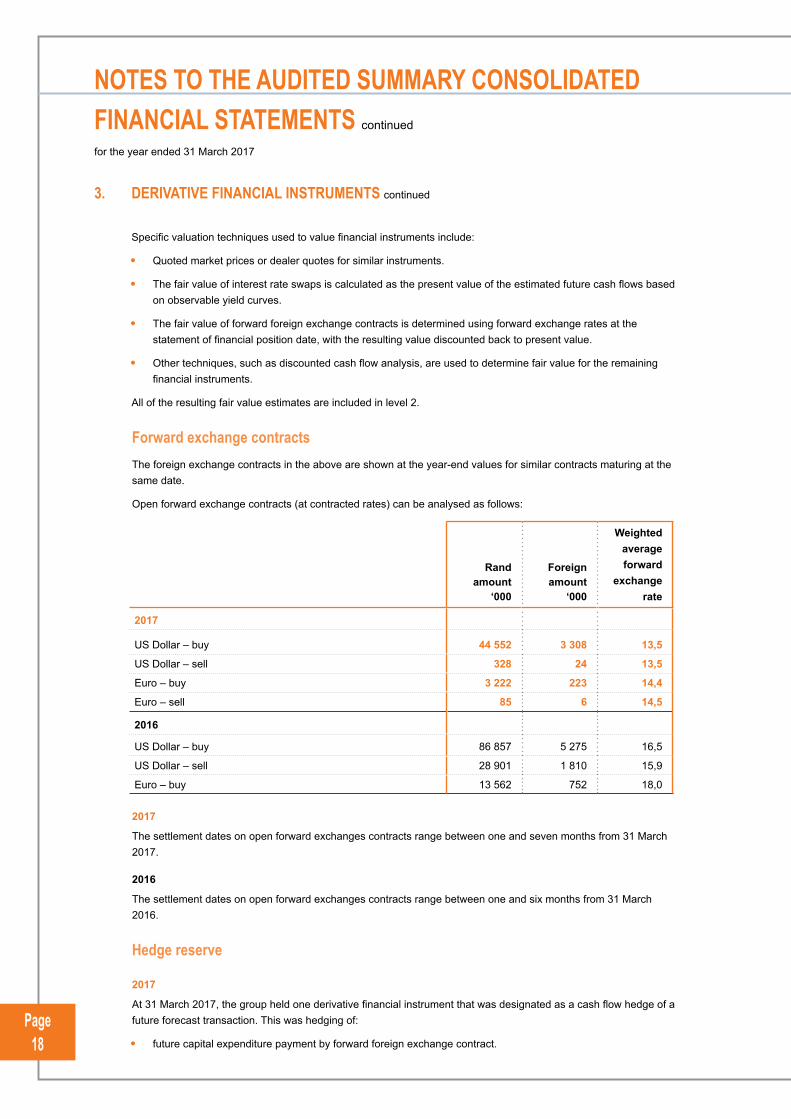
Forward exchange contracts The foreign exchange contracts in the above are shown at the year-end values for similar contracts maturing at the
same date.
Open forward exchange contracts (at contracted rates) can be analysed as follows:
Rand amount
‘000
Foreign amount ‘000
Weighted average forward
exchange rate
2017
US Dollar – buy 44 552 3 308 13,5
US Dollar – sell 328 24 13,5
Euro – buy 3 222 223 14,4
Euro – sell 85 6 14,5
2016
US Dollar – buy 86 857 5 275 16,5
US Dollar – sell 28 901 1 810 15,9
Euro – buy 13 562 752 18,0
2017
The settlement dates on open forward exchanges contracts range between one and seven months from 31 March 2017.
2016
The settlement dates on open forward exchanges contracts range between one and six months from 31 March 2016.
Hedge reserve
2017
At 31 March 2017, the group held one derivative financial instrument that was designated as a cash flow hedge of a future forecast transaction. This was hedging of:
• future capital expenditure payment by forward foreign exchange contract.
NOTES TO THE AUDITED SUMMARY CONSOLIDATED FINANCIAL STATEMENTS continued
for the year ended 31 March 2017
Page 19
Distribution & Warehousing Network Limited | | Audited summary consolidated financial results for the year ended 31 March 2017
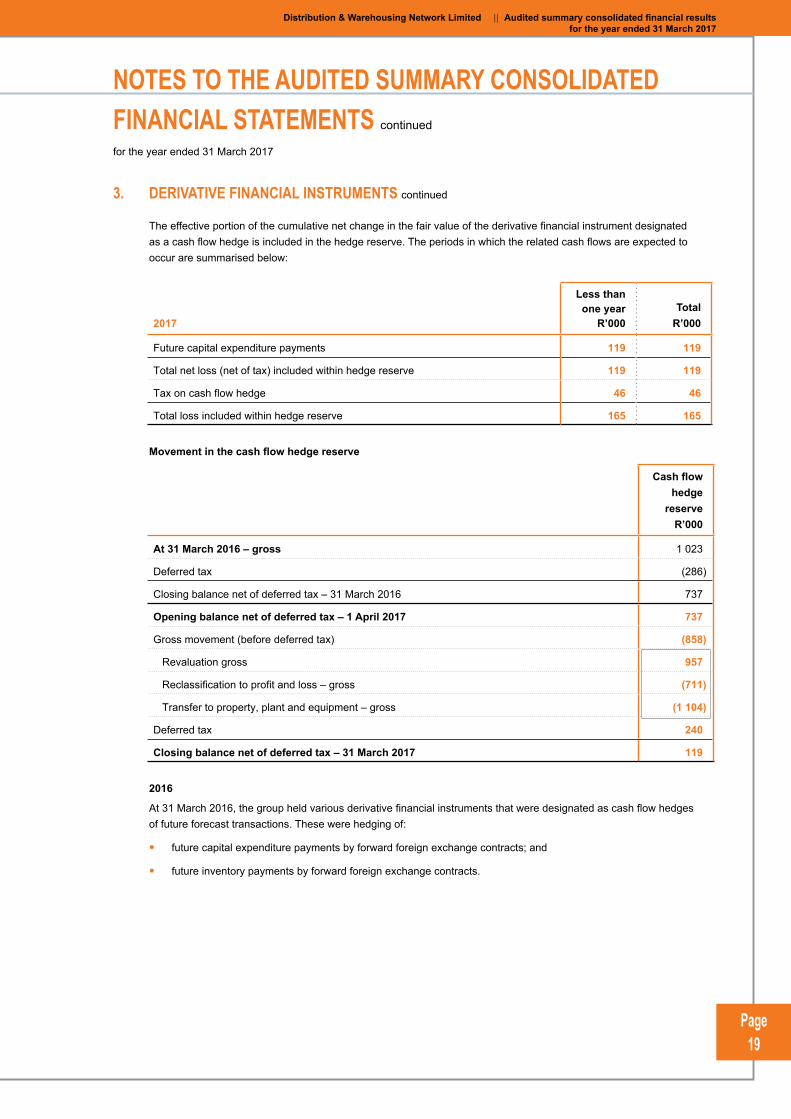
3. DERIVATIVE FINANCIAL INSTRUMENTS continued
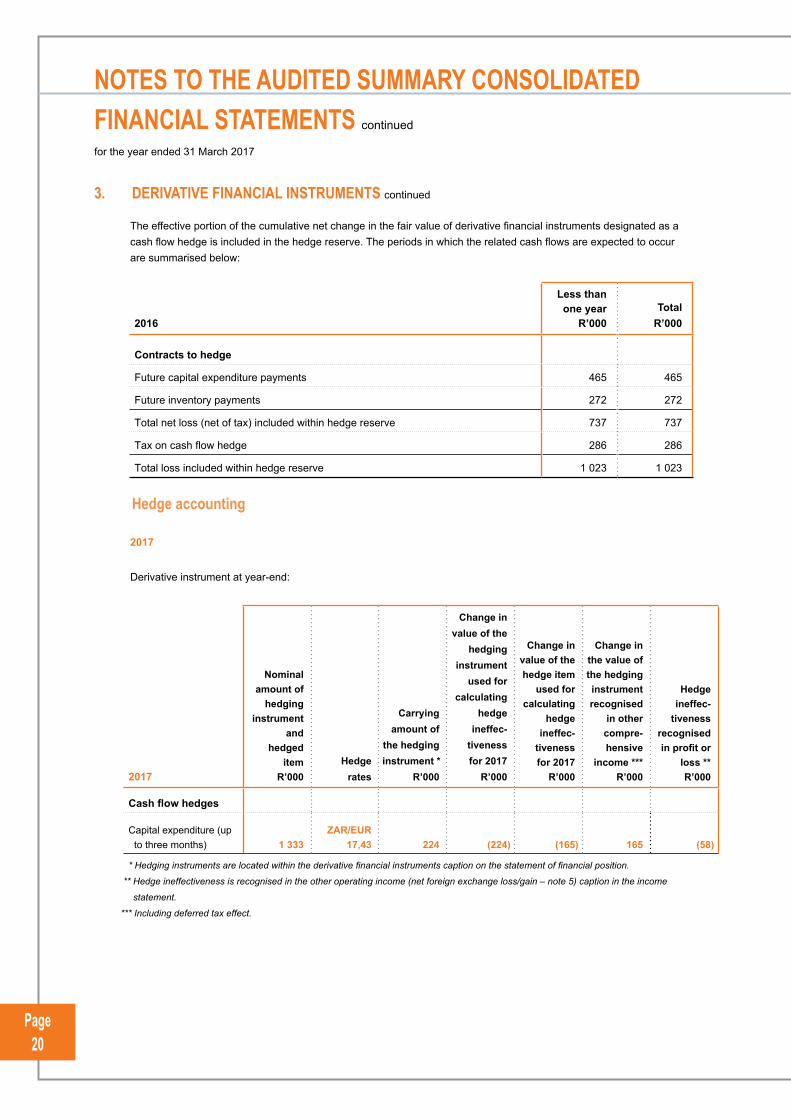
The effective portion of the cumulative net change in the fair value of the derivative financial instrument designated as a cash flow hedge is included in the hedge reserve. The periods in which the related cash flows are expected to occur are summarised below:
2017
Less than one year
R’000 Total R’000
Future capital expenditure payments 119 119
Total net loss (net of tax) included within hedge reserve 119 119
Tax on cash flow hedge 46 46
Total loss included within hedge reserve 165 165
Movement in the cash flow hedge reserve
Cash flow hedge
reserve R’000
At 31 March 2016 – gross 1 023
Deferred tax (286)
Closing balance net of deferred tax – 31 March 2016 737
Opening balance net of deferred tax – 1 April 2017 737
Gross movement (before deferred tax) (858)
Revaluation gross 957
Reclassification to profit and loss – gross (711)
Transfer to property, plant and equipment – gross (1 104)
Deferred tax 240
Closing balance net of deferred tax – 31 March 2017 119
2016
At 31 March 2016, the group held various derivative financial instruments that were designated as cash flow hedges of future forecast transactions. These were hedging of:
• future capital expenditure payments by forward foreign exchange contracts; and
• future inventory payments by forward foreign exchange contracts.
NOTES TO THE AUDITED SUMMARY CONSOLIDATED FINANCIAL STATEMENTS continued
for the year ended 31 March 2017
Page 20
3. DERIVATIVE FINANCIAL INSTRUMENTS continued
The effective portion of the cumulative net change in the fair value of derivative financial instruments designated as a cash flow hedge is included in the hedge reserve. The periods in which the related cash flows are expected to occur are summarised below:
2016
Less than one year
R’000 Total R’000
Contracts to hedge
Future capital expenditure payments 465 465
Future inventory payments 272 272
Total net loss (net of tax) included within hedge reserve 737 737
Tax on cash flow hedge 286 286
Total loss included within hedge reserve 1 023 1 023
Hedge accounting
2017
Derivative instrument at year-end:
2017
Nominal amount of
hedging instrument
and hedged
item R’000
Hedge rates
Carrying amount of
the hedging instrument *
R’000
Change in value of the
hedging instrument
used for calculating
hedgeineffec-
tivenessfor 2017
R’000
Change in value of the hedge item
used for calculating
hedgeineffec-
tivenessfor 2017
R’000
Change in the value of the hedging instrument recognised
in other compre-hensive
income ***R’000
Hedge ineffec-
tivenessrecognisedin profit or
loss **R’000
Cash flow hedges
Capital expenditure (up to three months) 1 333
ZAR/EUR17,43 224 (224) (165) 165 (58)
* Hedging instruments are located within the derivative financial instruments caption on the statement of financial position.
** Hedge ineffectiveness is recognised in the other operating income (net foreign exchange loss/gain – note 5) caption in the income
statement.
*** Including deferred tax effect.
NOTES TO THE AUDITED SUMMARY CONSOLIDATED FINANCIAL STATEMENTS continued
for the year ended 31 March 2017
Page 21
Distribution & Warehousing Network Limited | | Audited summary consolidated financial results for the year ended 31 March 2017
3. DERIVATIVE FINANCIAL INSTRUMENTS continued
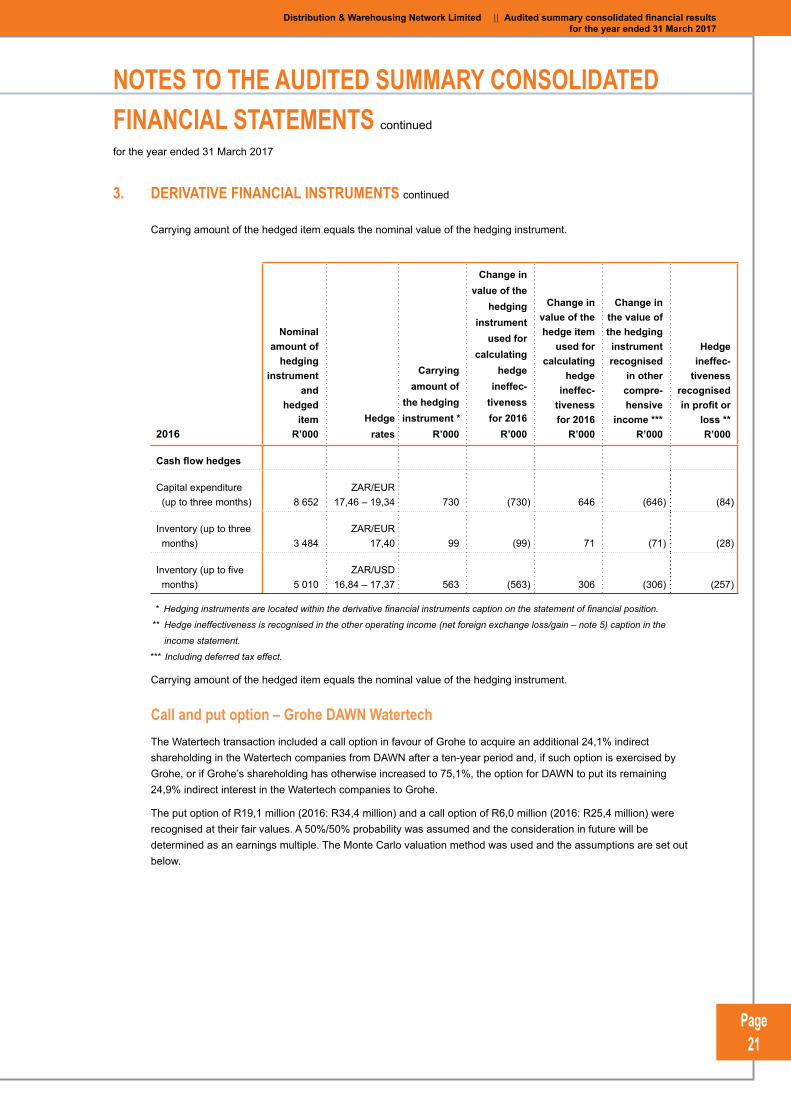
Carrying amount of the hedged item equals the nominal value of the hedging instrument.
2016
Nominal amount of
hedging instrument
and hedged
item R’000
Hedge rates
Carrying amount of
the hedging instrument *
R’000
Change in value of the
hedging instrument
used for calculating
hedgeineffec-
tivenessfor 2016
R’000
Change in value of the hedge item
used for calculating
hedgeineffec-
tivenessfor 2016
R’000
Change in the value of the hedging instrument recognised
in other compre-hensive
income ***R’000
Hedge ineffec-
tivenessrecognisedin profit or
loss **R’000
Cash flow hedges
Capital expenditure (up to three months) 8 652
ZAR/EUR 17,46 – 19,34 730 (730) 646 (646) (84)
Inventory (up to three months) 3 484
ZAR/EUR 17,40 99 (99) 71 (71) (28)
Inventory (up to five months) 5 010
ZAR/USD 16,84 – 17,37 563 (563) 306 (306) (257)
* Hedging instruments are located within the derivative financial instruments caption on the statement of financial position.
** Hedge ineffectiveness is recognised in the other operating income (net foreign exchange loss/gain – note 5) caption in the
income statement.
*** Including deferred tax effect.
Carrying amount of the hedged item equals the nominal value of the hedging instrument.
Call and put option – Grohe DAWN Watertech The Watertech transaction included a call option in favour of Grohe to acquire an additional 24,1% indirect
shareholding in the Watertech companies from DAWN after a ten-year period and, if such option is exercised by Grohe, or if Grohe’s shareholding has otherwise increased to 75,1%, the option for DAWN to put its remaining 24,9% indirect interest in the Watertech companies to Grohe.
The put option of R19,1 million (2016: R34,4 million) and a call option of R6,0 million (2016: R25,4 million) were recognised at their fair values. A 50%/50% probability was assumed and the consideration in future will be determined as an earnings multiple. The Monte Carlo valuation method was used and the assumptions are set out below.
NOTES TO THE AUDITED SUMMARY CONSOLIDATED FINANCIAL STATEMENTS continued
for the year ended 31 March 2017
Page 22
3. DERIVATIVE FINANCIAL INSTRUMENTS continued
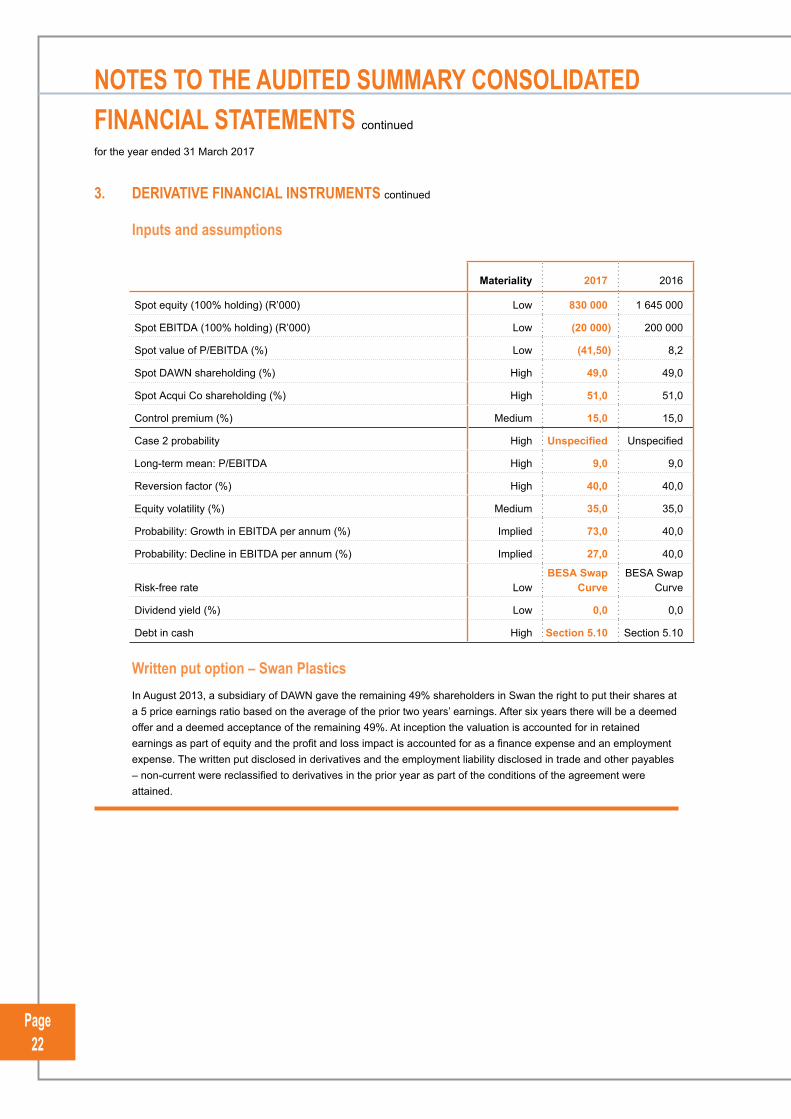
Inputs and assumptions
Materiality 2017 2016
Spot equity (100% holding) (R’000) Low 830 000 1 645 000
Spot EBITDA (100% holding) (R’000) Low (20 000) 200 000
Spot value of P/EBITDA (%) Low (41,50) 8,2
Spot DAWN shareholding (%) High 49,0 49,0
Spot Acqui Co shareholding (%) High 51,0 51,0
Control premium (%) Medium 15,0 15,0
Case 2 probability High Unspecified Unspecified
Long-term mean: P/EBITDA High 9,0 9,0
Reversion factor (%) High 40,0 40,0
Equity volatility (%) Medium 35,0 35,0
Probability: Growth in EBITDA per annum (%) Implied 73,0 40,0
Probability: Decline in EBITDA per annum (%) Implied 27,0 40,0
Risk-free rate LowBESA Swap
CurveBESA Swap
Curve
Dividend yield (%) Low 0,0 0,0
Debt in cash High Section 5.10 Section 5.10
Written put option – Swan Plastics In August 2013, a subsidiary of DAWN gave the remaining 49% shareholders in Swan the right to put their shares at
a 5 price earnings ratio based on the average of the prior two years’ earnings. After six years there will be a deemed offer and a deemed acceptance of the remaining 49%. At inception the valuation is accounted for in retained earnings as part of equity and the profit and loss impact is accounted for as a finance expense and an employment expense. The written put disclosed in derivatives and the employment liability disclosed in trade and other payables – non-current were reclassified to derivatives in the prior year as part of the conditions of the agreement were attained.
NOTES TO THE AUDITED SUMMARY CONSOLIDATED FINANCIAL STATEMENTS continued
for the year ended 31 March 2017
Page 23
Distribution & Warehousing Network Limited | | Audited summary consolidated financial results for the year ended 31 March 2017
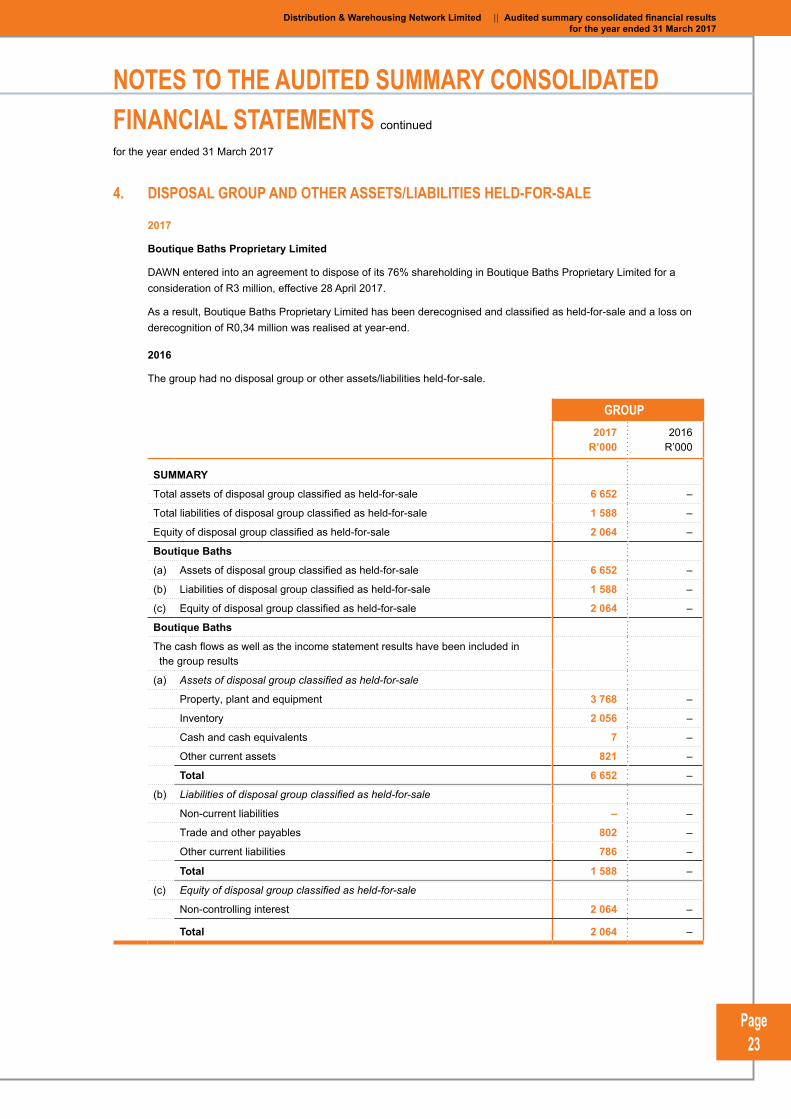
4. DISPOSAL GROUP AND OTHER ASSETS/LIABILITIES HELD-FOR-SALE
2017
Boutique Baths Proprietary Limited
DAWN entered into an agreement to dispose of its 76% shareholding in Boutique Baths Proprietary Limited for a consideration of R3 million, effective 28 April 2017.
As a result, Boutique Baths Proprietary Limited has been derecognised and classified as held-for-sale and a loss on derecognition of R0,34 million was realised at year-end.
2016
The group had no disposal group or other assets/liabilities held-for-sale.
GR GROUP OUP
2017R’000
2016R’000
SUMMARY
Total assets of disposal group classified as held-for-sale 6 652 –
Total liabilities of disposal group classified as held-for-sale 1 588 –
Equity of disposal group classified as held-for-sale 2 064 –
Boutique Baths
(a) Assets of disposal group classified as held-for-sale 6 652 –
(b) Liabilities of disposal group classified as held-for-sale 1 588 –
(c) Equity of disposal group classified as held-for-sale 2 064 –
Boutique Baths
The cash flows as well as the income statement results have been included in the group results
(a) Assets of disposal group classified as held-for-sale
Property, plant and equipment 3 768 –
Inventory 2 056 –
Cash and cash equivalents 7 –
Other current assets 821 –
Total 6 652 –
(b) Liabilities of disposal group classified as held-for-sale
Non-current liabilities – –
Trade and other payables 802 –
Other current liabilities 786 –
Total 1 588 –
(c) Equity of disposal group classified as held-for-sale
Non-controlling interest 2 064 –
Total 2 064 –
NOTES TO THE AUDITED SUMMARY CONSOLIDATED FINANCIAL STATEMENTS continued
for the year ended 31 March 2017
Page 24
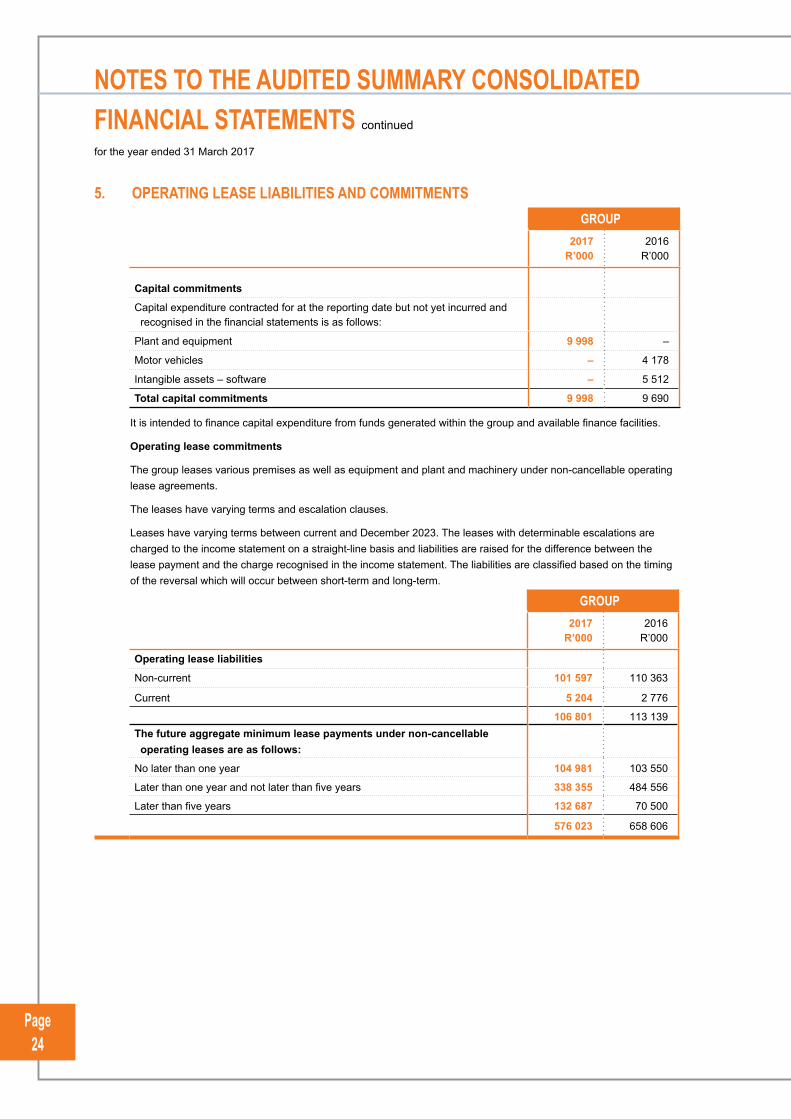
5. OPERATING LEASE LIABILITIES AND COMMITMENTSGR GROUP OUP
2017R’000
2016R’000
Capital commitments
Capital expenditure contracted for at the reporting date but not yet incurred and recognised in the financial statements is as follows:
Plant and equipment 9 998 –
Motor vehicles – 4 178
Intangible assets – software – 5 512
Total capital commitments 9 998 9 690
It is intended to finance capital expenditure from funds generated within the group and available finance facilities.
Operating lease commitments
The group leases various premises as well as equipment and plant and machinery under non-cancellable operating lease agreements.
The leases have varying terms and escalation clauses.
Leases have varying terms between current and December 2023. The leases with determinable escalations are charged to the income statement on a straight-line basis and liabilities are raised for the difference between the lease payment and the charge recognised in the income statement. The liabilities are classified based on the timing of the reversal which will occur between short-term and long-term.
GR GROUP OUP
2017R’000
2016R’000
Operating lease liabilities
Non-current 101 597 110 363
Current 5 204 2 776
106 801 113 139 The future aggregate minimum lease payments under non-cancellable operating leases are as follows:
No later than one year 104 981 103 550
Later than one year and not later than five years 338 355 484 556
Later than five years 132 687 70 500
576 023 658 606
NOTES TO THE AUDITED SUMMARY CONSOLIDATED FINANCIAL STATEMENTS continued
for the year ended 31 March 2017
Page 25
Distribution & Warehousing Network Limited | | Audited summary consolidated financial results for the year ended 31 March 2017
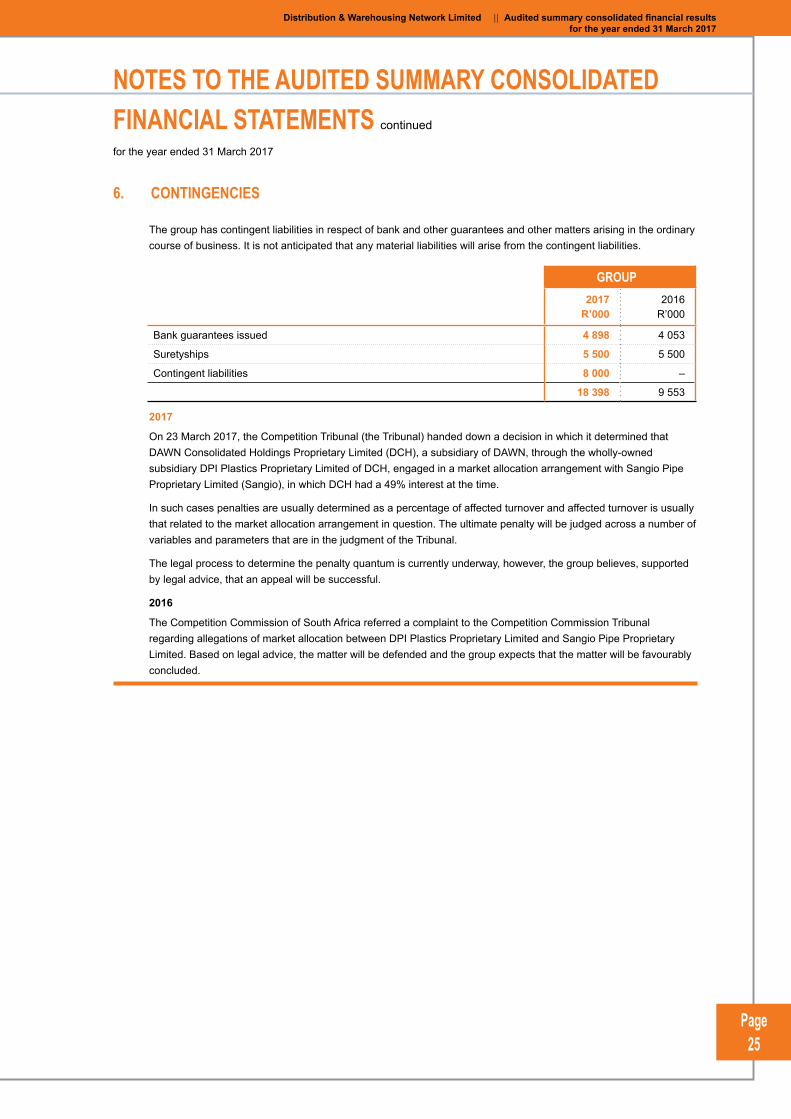
6. CONTINGENCIES
The group has contingent liabilities in respect of bank and other guarantees and other matters arising in the ordinary course of business. It is not anticipated that any material liabilities will arise from the contingent liabilities.
GR GROUP OUP
2017R’000
2016R’000
Bank guarantees issued 4 898 4 053
Suretyships 5 500 5 500
Contingent liabilities 8 000 –
18 398 9 553
2017
On 23 March 2017, the Competition Tribunal (the Tribunal) handed down a decision in which it determined that DAWN Consolidated Holdings Proprietary Limited (DCH), a subsidiary of DAWN, through the wholly-owned subsidiary DPI Plastics Proprietary Limited of DCH, engaged in a market allocation arrangement with Sangio Pipe Proprietary Limited (Sangio), in which DCH had a 49% interest at the time.
In such cases penalties are usually determined as a percentage of affected turnover and affected turnover is usually that related to the market allocation arrangement in question. The ultimate penalty will be judged across a number of variables and parameters that are in the judgment of the Tribunal.
The legal process to determine the penalty quantum is currently underway, however, the group believes, supported by legal advice, that an appeal will be successful.
2016
The Competition Commission of South Africa referred a complaint to the Competition Commission Tribunal regarding allegations of market allocation between DPI Plastics Proprietary Limited and Sangio Pipe Proprietary Limited. Based on legal advice, the matter will be defended and the group expects that the matter will be favourably concluded.
NOTES TO THE AUDITED SUMMARY CONSOLIDATED FINANCIAL STATEMENTS continued
for the year ended 31 March 2017
Page 26
7. EVENTS AFTER THE REPORTING DATE
Rights offer DAWN shareholders are referred to the circular dated Monday, 20 March 2017 regarding the renounceable rights
offer for up to R358 million, which concluded on 12 April 2017.
The rights offer consisted of an offer of 358 129 576 million ordinary shares in the ratio of 147,8 rights offer shares for every 100 ordinary shares held by shareholders on the record date of the rights offer, at a subscription price of R1,00 per rights offer share.
Following the conclusion of the rights offer, the total issued share capital of the company increased to 600 372 480 shares.
Borrowings Revolving credit facility
On 15 October 2015, Absa Bank Limited granted the group a revolving credit facility of R200 million. This facility ended on 7 October 2016 and was re-negotiated to 7 October 2017. The new facility had similar characteristics, but had a quarterly step-down of R25 million per quarter in respect of the revolving credit facility, which started on 7 October 2016 and would have concluded on 7 July 2017. This agreement was re-negotiated and signed in December 2016 for a reduced facility of R175 million after a R25 million repayment was made in October 2016. A further repayment of R75 million was made on 12 April 2017 to reduce the facility to R100 million. The facility extends until 31 March 2018. Accounts receivable have been ceded and a general notarial bond has been registered over inventory.
Bridging finance facility
On 23 December 2016, DAWN received R50 million bridging finance from Absa Bank Limited, which amount was repaid on 31 January 2017, after obtaining the proceeds from the sale of Heunis Steel Proprietary Limited.
DAWN received R200 million funding from Investec as bridging finance through an unsecured facility. Two R100 million tranches were received on 24 February 2017 and 6 March 2017, respectively. The full R200 million was repaid on 18 April 2017 from the proceeds of the rights offer.
Disposals Boutique Baths Proprietary Limited
DAWN entered into an agreement to dispose of its 76% shareholding in Boutique Baths Proprietary Limited for a consideration of R3 million, effective 28 April 2017.
As a result, Boutique Baths Proprietary Limited has been derecognised and classified as held-for-sale and a loss on derecognition of R0,34 million was realised at year-end.
Aqualia DPI Proprietary Limited
DAWN entered into an agreement to dispose of its 50% interest in the joint venture with Aqualia DPI Proprietary Limited, incorporating Aqua Science Proprietary Limited, for a consideration of 1 Mauritian Rupee, effective 30 June 2017.
NOTES TO THE AUDITED SUMMARY CONSOLIDATED FINANCIAL STATEMENTS continued
for the year ended 31 March 2017
Page 27
Distribution & Warehousing Network Limited | | Audited summary consolidated financial results for the year ended 31 March 2017
7. EVENTS AFTER THE REPORTING DATE continued
Fibrex – Fabrica deArt.DE.F.B. Sinteticas, S.A.R.L. (Fibrex)
On 1 April 2017, the group entered into an agreement for the acquisition of the remaining 51% shareholding from the majority shareholder in Plastic Investments International Limited, of which Fibrex is a wholly-owned subsidiary, under obligation. Defalcation on the part of the majority shareholder enabled DAWN to acquire the shareholding for a consideration of Rnil, as the shareholder surrendered his shares to DAWN. The provisional amount of net assets acquired amounted to R10,0 million.
On 15 June 2017, the board of directors of DAWN resolved to dispose of Fibrex in its entirety during F2018 in an effort to recover the losses incurred by the business.
Grohe DAWN Watertech (GDW)
As announced on SENS on 11 July 2017, the group has concluded a non-binding memorandum of understanding with the controlling shareholders of GDW for the potential disposal of DAWN’s 49% holding in the company to that shareholder. No price has been agreed for the transaction as yet. There is no certainty that the negotiations will lead to definitive and binding agreements and therefore no certainty that the transaction will ultimately be concluded and implemented.
The intention of both parties is that DAWN remains the long-term master distributor for the GDW product range in southern Africa. It is the view of the DAWN board that this transaction would be a positive step in the turnaround process of the group.
NOTES TO THE AUDITED SUMMARY CONSOLIDATED FINANCIAL STATEMENTS continued
for the year ended 31 March 2017
D A W NDistribution & Warehousing Network
Cnr Barlow Road & Cavaleros Drive, Jupiter Ext 3, GermistonPostnet Suite No. 100, Private Bag X1037, Germiston, 1400
Tel: +27 11 323 0000 Fax: +27 11 323 0466
www.dawnltd.co.za