march 2018 draft long island sound blue plan resource and ... 2018 draft long island sound blue plan...
TRANSCRIPT

Report by the: Long Island Sound Inventory and Science Subcommittee of the
Blue Plan Advisory Committee
2018
Long Island Sound Resource and Use
Inventory

Long Island Sound Resource and
Use Inventory
Report by the:
Long Island Sound Inventory and Science Subcommittee
of the Blue Plan Advisory Committee
Version 1.1
March 2018

2
Suggested Citation:
Long Island Sound Inventory and Science Subcommittee of the Blue Plan Advisory Committee.
(2018). Long Island Sound Resource and Use Inventory. Groton, CT: University of Connecticut
Avery Point.

3
Acknowledgments
The Long Island Sound Inventory and Science Subcommittee of the Blue Plan Advisory
Committee would like to thank the contributing authors, reviewers, and editors for their help in
preparing this report.
Contributing Authors:
** NOTE: This list is not necessarily complete and may be filled out or further refined in future
versions of the Inventory **
Bruce Beebe
David Blatt
David Carey
Sylvain De Guise
Catherine Finneran
Christian Fox
Nathan Frohling
Bill Gardella
Emily Hall
Hannah Hauptman
Sid Holbrook
Robert Klee
Corey Leamy
Evan Matthews
Kevin O’Brien
Tom Robben
Leah Schmaltz
Emily Shumchenia
Mike Theiler
Brian Thompson
Ian Yue
Reviewers:
** NOTE: This list is not necessarily complete and may be filled out or further refined in future
versions of the Inventory **
Melanie Bachman
Daniel Forrest
David Leslie
Jerry “Captain” Morgan
Deb Pacileo
Mark Pappalardo
Christina Walsh

4
Editors and Copy Editors:
** NOTE: This list is not necessarily complete and may be filled out or further refined in future
versions of the Inventory **
Emily Hall
Ian Yue
The Subcommittee would also like to recognize the following individuals and organizations, not
already acknowledged above, who went above and beyond to provide data or help facilitate data
review for the Inventory.
Other Contributors:
** NOTE: This list is not necessarily complete and may be filled out or further refined in future
versions of the Inventory **
LTJG Shannon Andrew
Kathleen Atwood
Kathleen Burns
Bowen Chang
Jack Conway
DeWitt Davies
Bart DiFiore
Emily Farr
Susan Filipowich
Anne Hannan
Brian Jones
Eric Kretsch
Sarah Nahabedian
Ryan Patrylak
Valerie Pinkerton
Mike Pirri
Alan Rios
August Ruckdeschel
Susan Ryan
Geoffrey Steadman
Andrea Watson
Adam Wright
Connecticut State Historic Preservation Office staff
New London fishermen
New York State Historic Preservation Office staff
Southern New England Fishermen’s and Lobstermen’s Association

5
The Subcommittee would furthermore like to thank and recognize all ecological experts and
stakeholders for their valuable contributions to this Resource and Use Inventory. This document
would not have been possible without their input, feedback, and support. For further information
about stakeholder groups specifically engaged throughout the Inventory process, please see the
appendices of each sector-specific Inventory chapter.
Funding Sources:
De Guise, S (PI), Frohling, N (co-PI). Using strategic engagement to achieve management and
protection goals of the Long Island Sound Blue Plan. National Fish & Wildlife Foundation.
$34,997. 10/1/16-12/31/17.
De Guise, S (PI), Frohling, N (co-PI). Support marine spatial planning in Long Island Sound: the
Blue Plan. EPA Long Island Sound Study. $200,000. 10/1/17-9/30/19.
Frohling, N (PI). Initial planning steps towards development of a science-based marine spatial
plan for Long Island Sound. Gordon and Betty Moore Foundation. $60,000. 2/1/17-2/28/18.

6
Summary Table of Contents
Acronyms and Abbreviations ...................................................................................................... 7 List of Figures and Tables .......................................................................................................... 11 Introduction ................................................................................................................................. 12 Ecological Characterization of Long Island Sound ................................................................. 15
Chapter 1. Ecological Characterization Process ................................................................. 16 Plants
Chapter 2. Phytoplankton, Macroalgae, Eelgrass, and Submerged Aquatic Vegetation ..... 19 Animals
Chapter 3. Marine Mammals ................................................................................................ 28 Chapter 4. Sea Turtles .......................................................................................................... 37 Chapter 5. Birds .................................................................................................................... 42
Chapter 6. Fish, Pelagic Invertebrates, Shellfish, and Zooplankton .................................... 51
Chapter 7. Benthic Invertebrates .......................................................................................... 63 Habitats
Chapter 8. Coastal Wetlands ................................................................................................ 70
Chapter 9. Bathymetry and Seafloor Complexity ................................................................. 75 Chapter 10. Sediments and Geochemistry ............................................................................ 81
Chapter 11. Physical Oceanography, Meteorology, and Water Quality .............................. 89 Chapter 12. Ecologically Notable Places and Ecological Marine Units ............................. 98
Ecologically Significant Areas
Chapter 13. Ecologically Significant Areas........................................................................ 104
Human Use Characterization of Long Island Sound............................................................. 107 Chapter 14. Human Use Characterization Process ........................................................... 108
Fish and Shellfish Activities
Chapter 15. Aquaculture ..................................................................................................... 111 Chapter 16. Commercial Fishing ....................................................................................... 125
Chapter 17. Recreational Fishing....................................................................................... 142 Chapter 18. Charter/Party Boat Fishing ............................................................................ 155
Recreation and Tourism Chapter 19. Recreational Boating and Sailing ................................................................... 164
Chapter 20. Harbors and Marinas ..................................................................................... 178 Chapter 21. Non-Consumptive Recreation ......................................................................... 191 Chapter 22. Waterfowl Hunting .......................................................................................... 206
Cultural Resources and Education Chapter 23. Historic and Archaeological Marine and Coastal Cultural Resources ......... 214
Chapter 24. Research, Monitoring, and Education ............................................................ 230
Marine Transportation, Infrastructure, and Security
Chapter 25. Marine Transportation, Navigation, and Infrastructure ................................ 247 Chapter 26. Energy and Telecommunications .................................................................... 257 Chapter 27. National Security ............................................................................................ 284

7
Acronyms and Abbreviations
Figures
** NOTE: This list is not necessarily complete and may be filled out or further refined in future
versions of the Inventory **
AC Alternating Current
AIS Automatic Identification Systems
AMAPPS Atlantic Marine Assessment Program for Protected Species
AMI Association of Marina Industries
ASMFC Atlantic States Marine Fisheries Commission
AWOIS Automatic Wreck and Obstructions Information System
BEACON Beach Advisory and Closing Online Notification
BOEM Bureau of Ocean Energy Management
B.P. Before Present
BRAC Base Realignment and Closure
CAD Confined Aquatic Disposal
CBC Christmas Bird Counts
CCBPA Connecticut Chart and Party Boat Association
CCMA Connecticut Coastal Management Act
CDF Cumulative Distribution Function
CFE Connecticut Fund for the Environment
CFR (U.S.) Code of Federal Regulations
CGS Connecticut General Statutes
CHMA Connecticut Harbor Management Association
CLEAR Center for Land Use Education and Research
CMC Connecticut Maritime Coalition
CMECS Coastal and Marine Ecological Classification Scheme
CMTA Connecticut Marine Trades Association
COA Connecticut Ornithological Association
CPA Connecticut Port Authority
CRESLI Coastal Research and Education Society of Long Island
CRM Coastal Relief Model
CSCC Cross Sound Cable Company
CT Connecticut
CT DA/BA Connecticut Department of Agriculture Bureau of Aquaculture
CT DEEP Connecticut Department of Energy and Environmental Protection
DAS Day at Sea
DEC Department of Environmental Conservation
DMMP Dredged Material Management Plan
DSCRTP Deep Sea Coral Research and Technology Program
EB Electric Boat
EFH Essential Fish Habitat
EMU Ecological Marine Units
ENC Electronic Navigational Chart
ENOW Economics: National Ocean Watch

8
ENP Ecologically Notable Place
EPA (U.S.) Environmental Protection Agency
ESA Ecologically Significant Area
ESI Environmental Sensitivity Index
FARM Farm Aquaculture Resource Management
FEMA Federal Emergency Management Agency
FLAG Fiber-optic Link Around the Globe
FMP Fishery Management Plan
FOSTER Ferry-based Observations for Science Targeting Estuarine Research
GARFO Greater Atlantic Fisheries Regional Office
GIS Geographic Information System
HIFLD Homeland Infrastructure Foundation-Level Data
HUDS Human Use Data Synthesis
HVDC High-Voltage Direct Current
IBA Important Bird Area
LILCO Long Island Lighting Company
LIPA Long Island Power Authority
LIS Long Island Sound
LISEA Long Island Sound Ecological Assessment
LISICOS Long Island Sound Integrated Coastal Observing System
LISS Long Island Sound Study
LISTS Long Island Sound Trawl Survey
LNG Liquefied Natural Gas
LNM Local Notice to Mariners
MARCO Mid-Atlantic Regional Council on the Ocean
MGEL Marine Geospatial Ecology Lab
MLW Mean Low Water
MOU Memorandum of Understanding
MRIP Marine Recreational Information Program
NAMERA Northwest Atlantic Marine Ecological Assessment
NARWC North Atlantic Right Whale Consortium
NCCA National Coastal Condition Assessment
NCCOS National Center for Coastal Ocean Science
NCR Non-Consumptive Recreation
NE Northeast
NEOP National Ocean Economics Program
NGA National Geospatial-Intelligence Agency
NGVD National Geodetic Vertical Datum
NMFS National Marine Fisheries Service
NOAA National Oceanic and Atmospheric Administration
NODP Northeast Ocean Data Portal
NOS National Ocean Service
NRC (U.S.) Nuclear Regulatory Commission
NRCS Natural Resources Conservation Service
NREL National Renewable Energy Laboratory
NROC Northeast Regional Ocean Council

9
NS&T National Status and Trends
NUWC Naval Undersea Warfare Center
NWI National Wetlands Inventory
NY New York
NYDOS New York Department of State
NYGIG New York Geographic Information Gateway
NYPA New York Power Authority
NYS New York State
OBIS-SEAMAP Ocean Biogeographic Information System Spatial Ecological Analysis of
Megavertebrate Populations
OLE Office of Law Enforcement
OSAMP Ocean Special Area Management Plan
OST Office of Science and Technology
PSEG Public Service Enterprise Group
RI Rhode Island
RME Research, Monitoring, and Education
RNC Raster Navigational Chart
ROAP Regional Ocean Action Plan
RPS ASA Rural Planning Services Applied Science Associates
SAV Submerged Aquatic Vegetation
SCORP Statewide Comprehensive Outdoor Recreation Plan
SCUBA Self-Contained Underwater Breathing Apparatus
SECONN South East Connecticut
SHARP Saltmarsh Habitat Avian Research Program
SHPO State Historic Preservation Office
SGCN Species of Greatest Conservation Need
STORET Storage and Retrieval (Database)
SUA Significant Use Area
SUNY State University of New York
SUP Stand-Up Paddleboarding
TMAUA Temporary Marine Area Use Assignments
TMDL Total Maximum Daily Load
TNC The Nature Conservancy
TSS Total Suspended Solids
US (or U.S.) United States
USA United States of America
USACE U.S. Army Corps of Engineers
U.S.C. U.S. Code
USDA U.S. Department of Agriculture
USFWS U.S. Fish and Wildlife Service
USGS U.S. Geological Survey
VLCC Very Large Crude Carriers
VMS Vessel Monitoring System
VTR Vessel Trip Report
WQ Water Quality

10
Abbreviations
MassAudubon Massachusetts Audubon Society
MYSound Monitoring Your Sound
UConn University of Connecticut

11
List of Figures and Tables
Figures
** NOTE: This section will be completed in Inventory version 1.2 **
Tables
** NOTE: This section will be completed in Inventory version 1.2 **

12
Introduction
Long Island Sound hosts diverse uses including recreation, aquaculture, commercial and
recreational fishing and boating, marine trades and transportation, and habitats for fish, shellfish,
birds, marine mammals, and plants. Protecting offshore and coastal resources, traditional uses,
and community character while simultaneously considering changing environmental conditions
and proposals for new offshore activities presents a complex set of challenges. Comprehensive,
coordinated, and proactive planning is needed to improve the Sound’s ability to support thriving
habitats, abundant wildlife, and sustainable and resilient communities.
Agencies at federal, state, and local levels increasingly need to work together along with
stakeholders to address these challenges. Decisions need to be informed by a consistent
ecological and socioeconomic context and an understanding of the various interactions between
offshore and coastal resources and activities. In the case of Long Island Sound, effective
decision-making requires access to regional scale data and information, guidance for using the
data, and opportunities for government agencies and stakeholders to improve collaboration
around the use of data to inform management of coastal and offshore resources and activities.
In May of 2015, the CT legislature passed Public Act 15-66, the “Blue Plan” legislation -
launching an official marine spatial planning process for Long Island Sound. Under existing
authorities, the Blue Plan seeks to create a comprehensive, coordinated and proactive approach
to help protect traditional uses, natural resources, and environmental quality relative to potential
new uses that may or may not be compatible. Marine spatial planning is a science-based planning
process that uses credible data and information along with public and stakeholder engagement to
identify and sustain environmental resources and existing human uses recognized during the
planning process. Marine spatial planning can also identify areas appropriate for new uses and
resolve conflicts between uses among other management objectives. It is therefore not surprising
that the Blue Plan legislation calls for the “completion of a Long Island Sound Resource and Use
Inventory by a Long Island Sound Inventory and Science subcommittee”, and that “such
resource and use inventory shall be comprised of the best available information and data
regarding the natural resources within Long Island Sound and the uses of Long Island Sound”.
In order to fulfill this requirement, the Inventory and Science subcommittee secured some
outside funding to secure some of the necessary capacity (cover some new staff time) and
mobilized sector-relevant members of the Blue Plan Advisory Committee and staff members to
gather and review relevant information. The Data and Information work group undertook efforts
to identify existing potentially relevant datasets and map products, and undergo an initial review
of those datasets for technical quality. The relevant datasets and map products of acceptable
technical quality were then grouped by sector and used to engage sector-specific experts and
stakeholders in a review of the accuracy, representativeness, and relevance of the existing map
products for the Blue Plan (i.e., do the maps we present to you represent what you know of Long
Island Sound), and help identify significant data gaps, along with the existence of datasets not
yet identified by the Blue Plan team that would help address such data gaps.
The Long Island Sound Resource and Use Inventory therefore presents objective and
stakeholder/expert reviewed information summarized to the extent possible through a series of

13
maps, along with a narrative, and a historical and socio-economic context, to “tell a story” about
a given sector. Further, each chapter presents an assessment of the “quality” of the data,
including the technical quality of the data and its accuracy, representativeness, and relevance,
according to the stakeholders and experts who reviewed the information. Data gaps and potential
source of additional data to address those gaps are also identified with input from experts and
stakeholders. The information gathered is presented in this Inventory, which is divided into two
major sections, the ecological characterization and human use characterization, each containing a
series of chapters grouped by thematic relevance. A short introductory section will highlight the
specifics of the approaches used for those sections.
It should be noted that the Inventory is focused on geospatial information. The experts and
stakeholders actively engaged to identify and review the information in each of the chapters were
selected among a large number of potentially interested parties, with input from the Blue Plan
Advisory Committee as well as the various sub-committees and work groups involved in the
development of the Inventory. We recognize that a large number of potentially interested parties
exist that would not necessarily have geospatial data to contribute directly to the inventory, but
who will be interested in the use of those data in the development of the Blue Plan. These parties
were not necessarily included in the chapter-focused Inventory efforts, but parallel engagement
efforts were undertaken to reach out broadly via a series of public events focused on presenting
the general concepts and approaches considered in the development of the Blue Plan.
It is important to understand what the Inventory is not. The Inventory is meant to focus on
objective data, and we purposefully attempted to exclude attributions or personal opinions that
could at times be contradictory. Instead, we focused on assessing the “quality” of the information
and noted when there was not strong agreement, without naming parties or conflicting positions.
The Inventory is not a plan. It does not include judgement on some areas or uses relative to
others. It does not contain new regulations, but may refer to existing regulations when relevant to
spatial data or specific aspects of human uses.
This objective information, gathered across sectors, represents the initial attempt to collect,
summarize and synthesize the best available information that will serve as the basis for the
development of a forward looking plan. We recognize that this initial version of the Inventory is
not perfect. Per the intent of the Blue Plan legislation, it is based on existing information, and is
limited by the timing for the development of the plan, as well as capacity and funding available.
The Blue Plan legislation clearly states that the development of the Blue Plan, including the
Inventory, is to be performed “within existing resources”, that is the task comes with no
associated funding; we were however successful at securing modest funding from outside
sources for the development of the inventory. We recognize that the quantity and quality of
information varies across sectors. Further, the data gaps identified are sometimes significant, and
there is not always existing data that exist that would address such data gaps. However, the
requirement for a Blue Plan to be delivered by March 2018 required an initial version of the
Inventory on which to base the planning process. Further, if resources and capacity exist, we will
continue to improve this initial version of the Inventory over time as new data become available.
Finally, just as there were opportunities to review and comment on the information included in
each of the chapters, the Inventory as a whole will undergo a multi-stage review process to

14
identify inaccuracies and address suggestions for improvement. The Inventory will be shared
broadly with parties who contributed to the discussions leading to the drafting of the chapters as
well as with other parties with potential general interest in the Blue Plan process, including
members of the general public.
So far, the full Inventory has gone through the following stages of review:
February 23 – March 2, 2018: Initial comment by the Blue Plan Advisory Committee
(Inventory version 1.0)

15
Ecological Characterization of Long Island Sound

16
Chapter 1. Ecological Characterization Process
According to the Blue Plan legislation (Public Act No. 15-66, Section 1(b)), the Long Island
Sound (LIS) Resource and Use Inventory should be comprised of the best available information
and data regarding “all plants, animals, habitats, and ecologically significant areas” in nearshore
and offshore waters of Long Island Sound. This Inventory describes existing data and map
products pertinent to plants, animals, and habitats, and will provide the basis for an Ecological
Characterization and subsequent identification of Ecologically Significant Areas. Using this
Inventory document as a starting point, the Ecological Characterization and Ecologically
Significant Areas are to be developed by Blue Plan teams and an Ecological Experts group.
The first step in the Ecological Characterization was a Rapid Assessment. In early 2017, a Rapid
Assessment of ecological data was conducted. All available (digital) datasets and map products
pertaining to the plants, animals, and habitats of LIS were assembled in a database with example
data templates. Data came from local and regional data portals, as well as existing databases and
online publications belonging to various agencies, researchers, and other groups. The Rapid
Assessment did not include archived, non-digital, non-spatial data, or an extensive literature
review of scientific publications. For each ecological dataset, a “data template” was created
which provided example maps and essential metadata that could be used to assess its relevance,
representativeness, and accuracy.
The second step in the Ecological Characterization was to obtain expert feedback on the data
templates produced for the Rapid Assessment. Data templates were organized by the three main
data groups (plants, animals, and habitats), and a number of subgroups were identified and
organized to more fully represent the variety of data and ecosystem components. Webinars that
combined some subgroups into related topics were held to obtain expert/technical feedback
(Table 1). Prior to each webinar, experts were given access to the data templates pertinent to
each webinar topic in the form of a map book. At least 60 experts contributed across the five
webinars, some joining multiple webinar sessions.
Table 1. Focal Topics of the Five Ecological Expert Webinars
Webinar topic Date Approximate number
of participants
Birds September 27, 2017 17
Marine Mammals and Sea Turtles October 2, 2017 12
Benthic Physical Habitat
Bathymetry
Seafloor Complexity
Sediments and Geochemistry
Physical Oceanography
Water Quality
Meteorology
Phytoplankton
October 16, 2017 20

17
Ecological Marine Units
Ecologically Notable Places
Benthic Biological Habitat
Water Quality
Macroalgae
Eelgrass and other Submerged
Aquatic Vegetation
Coastal Wetlands
Benthic Invertebrates
Ecological Marine Units
Ecologically Notable Places
October 24, 2017 31
Fish
Fish and Invertebrates
Zooplankton
Shellfish
October 27, 2017 23
During each webinar, experts reviewed and discussed the data templates in the map book.
Experts also suggested additional datasets and contributed their knowledge and experience on
each topic. Expert feedback included recommendations to keep or discard datasets in the Rapid
Assessment, as well as recommendations to include additional datasets.
The third step in the Ecological Characterization was to document and interpret the expert
feedback. Each webinar was recorded and can be viewed or downloaded on the Blue Plan
website (CT DEEP, 2017). The website also contains links to the map books for each webinar.
Detailed expert feedback was captured in spreadsheets that noted the expert’s name, the dataset
they referred to, and any links or references they could provide for obtaining the data. This
spreadsheet was used to prioritize data and map products to further describe in this Inventory.
The fourth step in the Ecological Characterization was to develop this Ecological Inventory. The
purpose of this Inventory is to assemble datasets that are relevant, representative and accurate in
conveying the ecology of Long Island Sound. This Inventory describes datasets within each of
the three main data topics identified in the Blue Plan legislation. The “plants” topic is covered in
one chapter. The “animals” topic is further subdivided into chapters for each major taxonomic
group: Marine mammals, sea turtles, birds, fish and shellfish, and benthic invertebrates. The
“habitats” topic is further subdivided into chapters for each major data category: coastal
wetlands, bathymetry and seafloor complexity, sediments and geochemistry, physical
oceanography including water quality and meteorology, and ecologically notable places and
ecological marine units.
This Inventory represents datasets that have been obtained by the Blue Plan team (or are
scheduled to be obtained in the immediate future) and are available to be used to support an
Ecological Characterization process. Data from the Inventory that are carried forward to support
the Ecological Characterization are potentially also applicable to identifying Ecologically
Significant Areas (ESAs), depending on the approach chosen.

18
References
CT DEEP. (2017). Long Island Sound Blue Plan Webinars. Retrieved from Connecticut
Department of Energy and Environmental Protection (CT DEEP):
http://www.ct.gov/deep/cwp/view.asp?a=2705&q=593814&deepNav_GID=1635
Plants

19
Chapter 2. Phytoplankton, Macroalgae, Eelgrass, and Submerged Aquatic Vegetation
Chapter Table of Contents
2.1 Key Data and Map Products .................................................................................................. 19 2.2 Assessment of Data Quality ................................................................................................... 21
2.2.1 Sources of Data and Metadata ..................................................................................... 21 2.2.2 Accuracy, Representativeness, and Relevance of Map Products ................................. 22
2.2.3 Data Gaps and Availability of Data to Address Gaps .................................................. 23 2.3 Additional Context ................................................................................................................. 23 2.4 References .............................................................................................................................. 24 2.5 Appendices ............................................................................................................................. 25
2.5.1 List of Maps Used to Inform the Chapter ..................................................................... 25
2.5.2 Notes on Ecological Expert Input ................................................................................. 27
2.1 Key Data and Map Products
This chapter describes datasets relating to plants (e.g., submerged aquatic vegetation [SAV]) in
Long Island Sound, as well as other photosynthetic organisms such as phytoplankton and
macroalgae. Coastal wetland vegetation data are described in Error! Reference source not f
ound. Coastal Wetlands.
Phytoplankton
The spatial and temporal patterns of phytoplankton have been studied in LIS for decades (Lopez,
et al., 2014). Chlorophyll-a concentrations are a proxy for phytoplankton biomass, and vary
seasonally and over longer timescales. LIS has typically shown chlorophyll maxima occurring in
spring, minima in summer, and smaller peaks in fall (Lopez, et al., 2014). Chlorophyll
concentrations are linked with nutrient (dissolved inorganic nitrogen) concentrations in LIS,
except between 2000 and 2007 when chlorophyll concentrations increased and remained high
despite little change in nutrient concentrations (Lopez, et al., 2014). Presently, chlorophyll
concentrations are measured every month year-round and biweekly in the summer at between 17
and 48 stations covering LIS. These stations are sampled as part of the CT DEEP Long Island
Sound Water Quality Monitoring Program (CT DEEP, 2017) (Figure 1; and see Chapter 11.
Physical Oceanography, Meteorology, and Water Quality for more information about this
program). Collaborations between the Connecticut Department of Energy and Environmental
Protection (CT DEEP), the National Oceanic and Atmospheric Administration (NOAA) Milford
Lab (NOAA, 2017), and the University of Connecticut (UConn) (Lin, 2018) have been
established to advance the analysis and interpretation of these phytoplankton data.
Chlorophyll-a concentrations are also measured by satellite, and the available datasets usually
cover areas much broader than LIS. A few of these regional-scale datasets are available via the
Northeast Ocean Data Portal (Northeast Ocean Data Working Group, 2018) and the Mid-Atlantic
Ocean Data Portal (MARCO, 2018).

20
Macroalgae
A review of predominant macroalgae species and spatial patterns is provided in Long Island
Sound: Prospects for the Urban Sea (Lopez, et al., 2014). This resource notes that perennial
macroalgal species (e.g., brown fucoid algae) are primarily found in intertidal hard bottom areas
of LIS. Kelps, which are found in deeper waters on hard bottoms, are biennial in LIS, and they
begin to degenerate in August. There are warm-season peaks in abundance of hard bottom or
floating red (e.g., Irish moss) and green algae (e.g., Ulva spp.) and also an influx of southern
species that have been entrained in Gulf Stream waters. There are different macroalgae species
associated with soft bottoms (e.g., Polysiphonia subtilissima), and some of these also epiphytize
salt marsh grasses.
Eelgrass and Submerged Aquatic Vegetation (SAV)
Eelgrass (Zostera marina) and widgeon grass (Ruppia maritima) are the two SAV species
present in LIS. The focus of most of the research and monitoring of SAV has been on eelgrass,
which is the dominant species (Lopez, et al., 2014). While eelgrass was once found throughout
LIS, it is now only observed in the eastern parts of the Sound (Lopez, et al., 2014). The most
current eelgrass coverage dataset represents eelgrass coverage as of August of 2012 (Tiner,
McGuckin, & MacLachlan, 2012 Eelgrass Survey for Eastern Long Island Sound, Connecticut
and New York, 2013) (Figure 2).
Figure 1. Phytoplankton Data. Station locations for the CT DEEP Long Island Sound Water
Quality Monitoring Program, which measures phytoplankton biomass and community structure
through proxies such as chlorophyll-a concentrations and phytopigments (CT DEEP, 2017).

21
Figure 2. Eelgrass. The 2012 eelgrass coverage dataset from the USFWS National Wetlands
Inventory dataset (Tiner, McGuckin, & MacLachlan, 2012 Eelgrass Survey for Eastern Long
Island Sound, Connecticut and New York, 2013), as displayed in the Connecticut Aquaculture
Mapping Atlas (UConn CLEAR, 2018).
2.2 Assessment of Data Quality
2.2.1 Sources of Data and Metadata
Phytoplankton
The CT DEEP Long Island Sound Water Quality Monitoring Program is an authoritative source
for phytoplankton data at the scale of Long Island Sound. The data, methods, and map of stations
are described on a CT DEEP website (CT DEEP, 2017). The website provides several example
maps, analyses, fact sheets and reports using the data. Some of the raw data can be downloaded
from the Long Island Sound Coastal Observatory (LISICOS, 2018).
Macroalgae
General patterns in macroalgae distribution and abundance in LIS are known by experts and
recorded in decades of targeted research, as summarized by Lopez et al. (2014). Some of this

22
research includes published papers with maps (Egan & Yarish, 1990; Kim, Kraemer, & Yarish,
2014; Kim, Kraemer, & Yarish, 2015; Pedersen, Kraemer, & Yarish, 2008), but to date, no
digital spatial data are available. The most temporally extensive quantitative macroalgal dataset
is held by the Millstone Environmental Laboratory as part of their monitoring of the effects of
the nuclear power plant’s thermal plume on the rocky intertidal ecosystem, eelgrass, lobster,
benthic infauna, and fish in the area near the Dominion power plant (Millstone Environmental
Laboratory, 2017).
Eelgrass and other SAVs
The 2012 dataset was derived from aerial photography collected by the USFWS as part of the
National Wetlands Inventory in August of that year. Aerial photos were ground-truthed in
October 2012. The methods and results of this survey are summarized in a technical report
(Tiner, McGuckin, & MacLachlan, 2012 Eelgrass Survey for Eastern Long Island Sound,
Connecticut and New York, 2013). The map outputs describe eelgrass coverage as high,
medium, or low (Figure 2). The spatial data and metadata are downloadable from the CT DEEP
geographic information system (GIS) data website. Datasets representing the results of previous
eelgrass surveys are also available for download (i.e., 2002, 2006, 2009). A web map of the 2012
data is accessible via the Connecticut Aquaculture Mapping Atlas (UConn CLEAR, 2018).
2.2.2 Accuracy, Representativeness, and Relevance of Map Products
All of the datasets discussed above are relevant to the Blue Plan effort. The accuracy and
representativeness of the data depend on the scale of interpretation.
Phytoplankton
The CT DEEP Long Island Sound Water Quality Monitoring phytoplankton data are likely
accurate and representative at the Sound-wide scale. Based on interpretation and discussion by
Lopez et al. (2014), a high degree of inter-annual variability is expected in this dataset.
Regardless, these data represent a relatively high spatial and temporal sampling frequency with
even spatial coverage across the Sound.
Macroalgae
The only quantitative dataset for macroalgae is limited to a small area in eastern LIS near the
Dominion power plant, in the rocky intertidal zone. Therefore, despite the accuracy of these data,
they are not representative of LIS-wide patterns of macroalgae distribution and abundance.
Eelgrass and SAVs
The USFWS eelgrass data are likely accurate and representative at the Sound-wide scale. A
relatively high degree of inter-annual variability is expected in each of these biological datasets,
a characteristic that requires long-term records if trends are to be described.

23
2.2.3 Data Gaps and Availability of Data to Address Gaps
Phytoplankton
At the time of this draft, there are no apparent major gaps in phytoplankton data.
Macroalgae
Quantitative and comprehensive Sound-wide macroalgae distribution and abundance data
represent a data gap in this chapter. Qualitative descriptions of expected macroalgal species
distribution and abundance can be obtained from the resources noted in Section 2.2.1 Source of
Data and Metadata. Expert knowledge and experience will be important for supplementing and
interpreting these available data. Specifically, there is relatively little known about soft-sediment
algal communities and drift algae species when compared with studies of rocky intertidal
macroalgae communities. Expert judgment could also be used to inform Blue Plan efforts if
qualitative data are insufficient or not specific enough (i.e., do not relate to a specific area or time
period).
Eelgrass and SAVs
At the time of this draft, there are no apparent major gaps in eelgrass data. It is understood that
eelgrass is currently limited in extent to eastern LIS, however, systematic surveys are only
conducted in eastern LIS. Therefore, the research and/or conservation community would need to
inform the team that conducts the surveys if it is suspected that eelgrass extent has expanded
beyond eastern LIS at any point in the future. Since the US Fish and Wildlife Service has
conducted eelgrass surveys in eastern LIS since 2002, it is assumed that surveys will continue in
the future.
The lack of Sound-wide spatial data for widgeon grass (Ruppia maritima) or other SAV
coverage is an existing data gap. Detecting widgeon grass or other SAV species in future surveys
may require altering existing monitoring protocols.
2.3 Additional Context
Phytoplankton
Other phytoplankton datasets are available for subsets of LIS or are prepared at broader scales by
other groups/institutions. For example, the Interstate Environmental Commission holds
chlorophyll-a data for the western basin of LIS available via the EPA Storage and Retrieval
(STORET) database (US EPA, 2018). The NOAA Northeast Fisheries Science Center prepares
seasonal chlorophyll-a concentration maps for the Northeast U.S. Continental Shelf Ecosystem,
hosted by the Northeast Ocean Data Portal (Northeast Ocean Data Working Group, 2018).

24
Macroalgae
In recent years, interest in and implementation of kelp aquaculture in LIS has grown. The
Connecticut Bureau of Aquaculture maintains records of where macroalgae is grown and
harvested. Additional resources and publications of research conducted in LIS on patterns in
macroalgae distribution and abundance are included in Section 2.5.1 List of Maps Used to Inform
the Chapter.
Eelgrass and SAVs
There are several “historical” eelgrass datasets that may be used to assess change over time, or
better understand the location of historical eelgrass beds. One recent analysis examined data
from 2002, 2006, and 2009 (Tiner, et al., 2010). Other work to understand potential eelgrass
habitat culminated in a habitat suitability index model for eelgrass in LIS, including factors such
as minimum light requirements and nutrient levels (Vaudrey, Eddings, Pickerell, Brousseau, &
Yarish, 2013). Additional eelgrass datasets are listed in Section 2.5.1 List of Maps Used to
Inform the Chapter.
2.4 References
CT DEEP. (2017, May 2). Long Island Sound Water Quality Monitoring Program and
Information. Retrieved Feb 5, 2018, from Connecticut Department of Energy and
Environmental Protection (CT DEEP):
http://www.ct.gov/deep/cwp/view.asp?a=2719&q=325570&deepNav_GID=1635
CT DEEP. (2018, February). Long Island Sound Blue Plan Webinars. Retrieved from
Connecticut Department of Energy and Environmental Protection (CT DEEP):
http://www.ct.gov/deep/cwp/view.asp?a=2705&q=593814&deepNav_GID=1635
Egan, B., & Yarish, C. (1990). Productivity and the life history of Laminaria longicruris at its
southern limit in the Western Atlantic Ocean. Marine Ecology Progress Series, 67, 263-273.
Kim, J. K., Kraemer, G. P., & Yarish, C. (2014). Field scale evaluation of seaweed aquaculture
as a nutrient bioextraction strategy in Long Island Sound and the Brox River Estuary.
Aquaculture, 443, 148-156.
Kim, J. K., Kraemer, G. P., & Yarish, C. (2015). Use of sugar kelp aquaculture in Long Island
Sound and the Bronx River Estuary for nutrient bioextraction. Marine Ecology Progress
Series, 531, 155-166.
Lin, S. (2018, February). Molecular Ecology of Phytoplankton: Long Island Sound Research.
Retrieved from University of Connecticut: https://phytoplankton.uconn.edu/long-island-
sound-research/
LISICOS. (2018, February). Long Island Sound Integrated Coastal Observing System
(LISICOS). Retrieved from University of Connecticut: http://lisicos.uconn.edu/
Lopez, G., Carey, D., Carlton, J. T., Cerrato, R., Dam, H., DiGiovanni, R., . . . Shumway. (2014).
Biology and Ecology of Long Island Sound. In J. S. Latimer, M. A. Tedesco, R. L. Swanson,
C. Yarish, P. E. Stacey, & C. Garza, Long Island Sound: Prospects for the Urban Sea (p.
558). New York: Springer.

25
MARCO. (2018, February). Mid-Atlantic Ocean Data Portal. Retrieved from Mid-Atlantic
Regional Council on the Ocean (MARCO): http://portal.midatlanticocean.org
Millstone Environmental Laboratory. (2017). Executive Summary - 2015 Environmental
Monitoring Annual Report. Dominion Nuclear Connecticut, Millstone Environmental
Laboratory. Washington DC: US Nuclear Regulatory Commission.
NOAA. (2017, December 7). Milford Lab: Environmental Research. Retrieved February 5,
2018, from National Ocean and Atmospheric Administration (NOAA) Northeast Fisheries
Science Center: https://www.nefsc.noaa.gov/nefsc/Milford/environment.html
Northeast Ocean Data Working Group. (2018). Northeast Ocean Data Portal. Retrieved from
www.northeastoceandata.org
NYS DOS OPD. (2018, February). New York Geographic Information Gateway (NYGIG).
Retrieved from New York State Department of State, Office of Planning and Development
(NYS DOS OPD): http://opdgig.dos.ny.gov/
Pedersen, A., Kraemer, G., & Yarish, C. (2008). Seaweed of the littoral zone at Cove Island in
Long Island Sound: annual variation and impact of environmental factors. Journal of Applied
Phycology, 20(5), 869-882.
Tiner, R., McGuckin, K., & MacLachlan, A. (2013). 2012 Eelgrass Survey for Eastern Long
Island Sound, Connecticut and New York. National Wetlands Inventory Report. Hadley, MA:
U.S. Fish and Wildlife Service.
Tiner, R., McGuckin, K., Fields, M., Fuhrman, N., Halavik, T., & MacLachlan, A. (2010). 2009
Eelgrass Survey for Eastern Long Island Sound, Connecticut and New York. National
Wetlands Inventory Report. Hadley, MA: U.S. Fish and Wildlife Service.
UConn CLEAR. (2018, February). Connecticut Aquaculture Mapping Atlas. Retrieved from
University of Connecticut Center for Land Use Education and Research (CLEAR),
Connecticut Sea Grant, and Connecticut Department of Agriculture Bureau of Aquaculture
DA/BA: https://clear3.uconn.edu/aquaculture/
US EPA. (2018, February). STORET Central Warehouse. Retrieved from U.S. Environmental
Protection Agency (US EPA): https://ofmpub.epa.gov/storpubl/dw_pages.querycriteria
Vaudrey, J. M., Eddings, J., Pickerell, C., Brousseau, L., & Yarish, C. (2013). Development and
application of a GIS-based Long Island Sound eelgrass habitat suitability index model. New
England Interstate Water Pollution Control Commission; Long Island Sound Study.
http://digitalcommons.uconn.edu/marine_sci.
2.5 Appendices
2.5.1 List of Maps Used to Inform the Chapter
Data highlighted in grey are included in the Inventory and were discussed during expert
webinars. In addition to the links provided below, each grey dataset is accompanied by a
reference, citation, or link within the text in the Inventory.
The un-highlighted (white) data rows were also discussed during expert webinars. These data
were either identified in the Rapid Assessment or mentioned by experts as credible sources of
data that may not be relevant to the Blue Plan effort. Example reasons include the older age of
the dataset, limited overall availability, lack of spatial data products, too limited or too broad

26
spatial/temporal scope, or that other LIS datasets were preferred. Many of these un-highlighted
datasets are described in Section 2.3 Additional Context, and most are described further in the
Benthic Biological Habitat Map Book and Benthic Physical Habitat Map Books, which were
used to for discussion purposes in the expert webinars (CT DEEP, 2018). Not all products
showcased in the map book may be utilized to inform the final Blue Plan.
Table 2. Plant Datasets Used to Inform the Chapter or Discussed During Expert Webinars
CATEGORY DATASET/LAYER ADVANCED
FROM RAPID
ASSESSMENT
TO
INVENTORY
ADDED TO
INVENTORY
FROM
EXPERT
REVIEW
Phytoplankton Net primary productivity 2013,
seasonal maximums, Mid-Atlantic
Ocean Data Portal (MARCO, 2018)
X
Phytoplankton CT DEEP Water quality monitoring
program, phytoplankton (CT DEEP,
2017)
X
Phytoplankton UConn phytoplankton analysis (Lin,
2018) X
Phytoplankton NOAA Milford lab phytoplankton
data/analysis (NOAA, 2017) X
Phytoplankton NYS DEC chlorophyll-a dataset
Phytoplankton Interstate Environmental Commission
chlorophyll-a data in western basin
Phytoplankton Predicted concentration, chlorophyll-a
(NYS DOS OPD, 2018)
Phytoplankton Chlorophyll-a seasonal medians
(Northeast Ocean Data Working
Group, 2018)
Macroalgae LIS Prospects for the Urban Sea –
macroalgae description
(Lopez, et al., 2014)
X
Macroalgae Millstone Environmental Lab benthic
seaweed community data, 2014-2016
reports
Macroalgae Egan & Yarish, 1990: Productivity
and the life history of Laminaria
longicruris at its southern limit in the
Western Atlantic Ocean. Marine
Ecology Progress Series 67:263-273.
Kim, et al., 2014: Field scale
evaluation of seaweed aquaculture as
a nutrient bioextraction strategy in

27
CATEGORY DATASET/LAYER ADVANCED
FROM RAPID
ASSESSMENT
TO
INVENTORY
ADDED TO
INVENTORY
FROM
EXPERT
REVIEW
Long Island Sound and the Bronx
River Estuary. Aquaculture 443:148-
156.
Kim, et al., 2015: Use of sugar kelp
aquaculture in Long Island Sound and
the Bronx River Estuary for nutrient
bioextraction. Marine Ecology
Progress Series 531:155-166.
Pedersen, et al., 2008: Seaweed of the
littoral zone at Cove Island in Long
Island Sound: annual variation and
impact of environmental factors.
Journal of Applied Phycology 20(5):
869-882.
Macroalgae CT DEEP report on benthic algal
communities
Macroalgae LIS cable fund kelp characterization –
in progress
Eelgrass and
SAVs
USFWS eelgrass (National Wetlnds
Inventory), 2012
(Tiner, McGuckin, & MacLachlan,
2013)
X
Eelgrass and
SAVs
Northeast regional eelgrass beds
(Northeast Ocean Data Working
Group, 2018)
Eelgrass and
SAVs
Historical eelgrass data (various
sources)
Eelgrass and
SAVs
Long Island Sound Study eelgrass
habitat suitability model
Eelgrass and
SAVs
Long Island Sound Ecological
Assessment seagrass map, 2006 data
2.5.2 Notes on Ecological Expert Input
Expert input was obtained on phytoplankton datasets during the “Benthic Physical Habitat”
expert webinar, and input on macroalgae, eelgrass, and SAVs was obtained during the “Benthic
Biological Habitat” expert webinar. The map books used for discussion in each webinar, and
links to webinar recordings, can be found on the Long Island Sound Blue Plan website (CT
DEEP, 2018).

28
Animals
Chapter 3. Marine Mammals
Chapter Table of Contents
3.1 Key Data and Map Products .................................................................................................. 28 3.2 Assessment of Data Quality ................................................................................................... 32
3.2.1 Sources of Data and Metadata ..................................................................................... 32 3.2.2 Accuracy, Representativeness, and Relevance of Map Products ................................. 33 3.2.3 Data Gaps and Availability of Data to Address Gaps .................................................. 34
3.3 Additional Context ................................................................................................................. 34
3.4 References .............................................................................................................................. 34 3.5 Appendices ............................................................................................................................. 35
3.5.1 List of Maps Used to Inform the Chapter ..................................................................... 35
3.5.2 Notes on Ecological Expert Input ................................................................................. 36
3.1 Key Data and Map Products
Marine mammals in LIS include whales, dolphins, and porpoises (together called cetaceans) and
several seal species (pinnipeds).
Cetaceans
Cetacean data products and datasets in LIS come from several different sources. In mid-2018, the
Marine Geospatial Ecology Lab (MGEL) at Duke University (MGEL, 2018) will release model
results representing predicted cetacean density along the entire Atlantic coast, and including LIS
for 10 individual species or species guilds (Table 1). Existing map products produced by this
group do not include LIS (Figure 1). The new modeled outputs will integrate cetacean
observations in LIS from the NOAA Atlantic Marine Assessment Program for Protected Species
(AMAPPS) with local environmental predictors, but are also influenced by cetacean observations
and environmental predictor variables throughout the entire Atlantic coast study area (NOAA
NEFSC, 2018). These data products represent the most comprehensive estimates of cetacean
distribution and abundance in LIS.
Other cetacean datasets include stranding data from the Mystic Aquarium (Smith, 2018), a
limited number of cetacean sightings in the Ocean Biogeographic Information System Spatial
Ecological Analysis of Megavertebrate Populations (OBIS-SEAMAP) global scientific database
(Halpin, et al., 2009), an interactive map of opportunistic sightings data of North Atlantic right
whales maintained by the NOAA Northeast Fisheries Science Center and Protected Species
Division (Figure 2) (NOAA NEFSC, 2018), and the marine mammal habitat layer within the
NOAA Environmental Sensitivity Index (ESI) dataset (NOAA ORR, 2018).

29
Table 1. Species for which predicted density map products with coverage in LIS will be released
in early 2018.
Cetacean species or species guild
Fin whale
Humpback whale
Minke whale
North Atlantic right whale
Sei whale
Pilot whales (two species modeled as a guild)
Cuvier’s beaked whale
Mesoplodont beaked whales (all species modeled as a guild)
Unidentified beaked whales
Harbor porpoise
Pinnipeds
Pinniped species found on Long Island (including outside LIS) include Harbor, Grey, Harp,
Hooded, and Ringed seals (CRESLI, 2018). The most extensive seal distribution and abundance
data for seals consists of the locations of known haul-out areas on the coastline. Separate seal
haul-out datasets are maintained by the Riverhead Foundation for Marine Research and
Preservation (Riverhead, 2017), the Coastal Research and Education Society of Long Island
(CRESLI) (CRESLI, 2018), and the NOAA through the Environmental Sensitivity Index
(NOAA ORR, 2018). The OBIS-SEAMAP repository also holds several additional seal
occurrence observations in LIS (Figure 3) (Halpin, et al., 2009).

30
Figure 1. Predicted marine mammal density map. Example map of North Atlantic Right Whale
predicted density from the Duke Marine Geospatial Ecology Lab’s existing 2015 cetacean
density model outputs (MGEL, 2018).

31
Figure 2. North Atlantic right whale observations. Interactive map of opportunistic North
Atlantic right whale sightings maintained by the NOAA Northeast Fisheries Science Center
(NOAA NEFSC, 2018).

32
Figure 3. Seal observations. Map showing observations of all seal species available in the OBIS-
SEAMAP global database (Halpin, et al., 2009).
3.2 Assessment of Data Quality
3.2.1 Sources of Data and Metadata
Cetaceans
Modeled outputs of cetacean use of LIS will be available digitally, with metadata, through the
Northeast Ocean Data Portal (Northeast Regional Planning Body, 2018) and Mid-Atlantic Ocean
Data Portal (Mid-Atlantic Regional Planning Body, 2018) in mid-2018.
The Mystic Aquarium stranding data are currently available from the OBIS-SEAMAP
repository, with metadata, but only for the years between 1976 and 2011 (Smith, 2018).
Additional data/years can be requested from Mystic Aquarium directly.
The interactive map of North Atlantic right whale sightings (NOAA NEFSC, 2018) is derived
from the North Atlantic Right Whale Consortium (NARWC) sightings database. These data can
be requested from NARWC directly.
A map of the marine mammal habitat layer from the NOAA ESI (NOAA ORR, 2018) is
available via the New York Geographic Information Gateway (New York Geographic
Information Gateway, 2018). The underlying data are also downloadable via the ESI website.

33
Pinnipeds
Seal haul-out location information is maintained by the Riverhead Foundation (Riverhead, 2017)
and CRESLI (CRESLI, 2018). Some of these data may have been contributed to the NOAA ESI
database containing seal-haul out areas (NOAA ORR, 2018). OBIS-SEAMAP seal observations
data are available digitally on the web (Halpin, et al., 2009).
3.2.2 Accuracy, Representativeness, and Relevance of Map Products
Cetaceans
The cetacean model outputs, stranding data, and opportunistic sightings data are all relevant to
the Blue Plan effort. The degree of accuracy and representativeness differs depending on the
dataset.
Each of the cetacean model outputs will be accompanied by multiple uncertainty layers (e.g.,
coefficient of variation, standard error) that will help the user to assess model performance and
accuracy (for examples, see (MGEL, 2018)). Since these models generate predictions in LIS
using a broader set of data (i.e., observations from along the entire Atlantic coast), their
representativeness of LIS may not be optimal, but is still likely more robust than what could be
produced with other datasets.
Stranding data collected by Mystic Aquarium can be considered accurate and likely
representative of cetacean strandings, since the Aquarium is well-known in the area and is
usually called upon to respond to these events. Stranding data alone, however, are obviously not
representative of living cetacean distribution and abundance in LIS.
OBIS-SEAMAP sightings for cetaceans are likely accurate and accompanied by robust metadata.
Consideration should be given to whether or not cetacean observations can be effort-corrected.
Pinnipeds
The seal haul-out datasets are likely accurate and representative of patterns in LIS, but expert
knowledge and experience will be needed to interpret the data and assess representativeness. For
example, it is currently unknown to what extent the three available seal haul-out datasets overlap
(i.e., whether the NOAA ESI data already contain the observations and information from the
other two locally-generated datasets).
The OBIS-SEAMAP seal observation data may contain some open-water observations of seals,
in addition to coastal/land observations (Halpin, et al., 2009). These data should be interpreted
with caution since it is difficult to identify seals in open water (see Marine Mammals and Sea
Turtles Expert Webinar (CT DEEP, 2018)).
In general, the distribution and abundance of seals is a topic where expert knowledge and
experience will be important for supplementing and interpreting the available data.

34
3.2.3 Data Gaps and Availability of Data to Address Gaps
Cetaceans
The available cetacean data are fairly comprehensive for Long Island Sound, although there are
several (and growing) efforts to observe cetaceans in and near the Sound by local conservation
groups, whale-watching businesses, and others. These observations are not captured in any of the
datasets described in this chapter. The interactive map of North Atlantic right whale sightings
(NOAA NEFSC, 2018) is one example of data that have not been effort corrected (i.e., see the
disclaimer at the top of the NEFSC website).
Pinnipeds
Data gaps for pinnipeds relate to certain behaviors and times of year. For example, the majority
of the data discussed in this chapter represents seals on the coast. There is very little if any
dependable data representing seals in the open waters of LIS, due to the difficulty seeing and
identifying individuals.
3.3 Additional Context
As with most marine life, change over time and responses to environmental change are important
in understanding distribution and abundance of marine mammals. For example, the number of
seals in LIS during the winter has increased from hundreds in the 1990s to thousands in 2011,
and more animals are staying in the Sound year-round (Lopez, G et al., 2014). Experts described
similar general patterns for cetaceans: sightings in LIS of whales, and dolphins and porpoises
especially, have increased in the last few decades.
Exploratory modeling of seal distribution and abundance has been attempted by MGEL at Duke
University, but final map products are not anticipated in 2018.
Because all marine mammal species are protected under the Marine Mammal Protection Act, the
NOAA Protected Resources Division (NOAA GARFO, 2018) is a source of data for species
presence information, maps of species ranges and critical habitats, as well as relevant mapping
tools.
3.4 References
CRESLI. (2018, February 6). Pinnipeds. Retrieved from Coastal Research and Education Society
of Long Island, Inc.: http://www.cresli.org/cresli/seals/pinnipeds.html
CT DEEP. (2018, February 5). Long Island Sound Blue Plan Webinars. Retrieved from
Connecticut Department of Energy and Environmental Protection:
http://www.ct.gov/deep/cwp/view.asp?a=2705&q=593814&deepNav_GID=1635

35
Halpin, P. N., Read, A. J., Fujioka, E., Best, B. D., Donnelly, B., Hazen, L. J., . . . Hyrenbach, K.
D. (2009). OBIS-SEAMAP: The world data center for marine mammal, sea bird, and sea
turtle distributions. Oceanography, 22(2), 104-115.
Lopez, G et al. (2014). Biology and Ecology of Long Island Sound. In J. S. Latimer, M. A.
Tedesco, R. L. Swanson, C. Yarish, P. E. Stacey, & C. Garza, Long Island Sound:
Prospects for the Urban Sea (p. 558). New York: Springer.
MGEL. (2018, February 6). OBIS-SEAMAP Model Repository. Retrieved from Duke University
Marine Geospatial Ecology Lab: http://seamap.env.duke.edu/models/
Mid-Atlantic Regional Planning Body. (2018). Mid-Atlantic Ocean Data Portal. Retrieved from
portal.midatlanticocean.org
NOAA GARFO. (2018, February 6). Protected Resources Division. Retrieved from NOAA
Greater Atlantic Region Fisheries Office:
https://www.greateratlantic.fisheries.noaa.gov/protected/
NOAA NEFSC. (2018, February 6). Atlantic Marine Assessment Program for Protected Species
(AMAPPS). Retrieved from NOAA Northeast Fisheries Science Center:
https://www.nefsc.noaa.gov/psb/AMAPPS/
NOAA NEFSC. (2018, February 6). Interactive North Atlantic Right Whale Sightings Map.
Retrieved from NOAA Northeast Fisheries Science Center Protected Species Division:
https://www.nefsc.noaa.gov/psb/surveys/
NOAA ORR. (2018, February 5). Environmental Sensitivity Index (ESI) Maps. Retrieved from
NOAA Office of Response and Restoration: https://response.restoration.noaa.gov/maps-
and-spatial-data/environmental-sensitivity-index-esi-maps.html
Northeast Regional Planning Body. (2018). Northeast Ocean Data Portal. Retrieved from
www.northeastoceandata.org
Riverhead. (2017, December 31). The Riverhead Foundation for Marine Research and
Preservation. Retrieved from Research - Tracking Maps:
http://www.riverheadfoundation.org/
Smith, A. (2018, February 6). Mystic Aquarium marine mammal and sea turtle stranding data
1976-2011. Retrieved from Mystic Aquarium: http://seamap.env.duke.edu/dataset/945
3.5 Appendices
3.5.1 List of Maps Used to Inform the Chapter
Data highlighted in grey are included in the Inventory and were discussed during expert
webinars. In addition to the links provided below, each grey dataset is accompanied by a
reference, citation, or link within the text in the Inventory.
The un-highlighted (white) data rows were also discussed during expert webinars. These data
were either identified in the Rapid Assessment or mentioned by experts as credible sources of
data that may not be relevant to the Blue Plan effort. Example reasons include the older age of
the dataset, limited overall availability, lack of spatial data products, too limited or too broad
spatial/temporal scope, or that other LIS datasets were preferred. Many of these un-highlighted
datasets are described in Section 3.3 Additional Context, and most are described further in the
map books associated with the expert webinars (CT DEEP, 2018).

36
CATEGORY DATASET/LAYER ADVANCED
FROM RAPID
ASSESSMENT
TO
INVENTORY
ADDED TO
INVENTORY
FROM
EXPERT
REVIEW
Marine mammals Cetacean predicted density
models, forthcoming 2018 version
(MGEL, 2018) (Northeast Regional
Planning Body, 2018) (Mid-Atlantic
Regional Planning Body, 2018)
X
Marine mammals Mystic Aquarium cetacean and
pinniped stranding data (Smith,
2018)
X
Marine mammals OBIS-SEAMAP cetacean and
pinniped data (Halpin, et al., 2009) X
Marine mammals NOAA Northeast Fisheries Science
Center opportunistic North
Atlantic right whale sightings
(NOAA NEFSC, 2018)
X
Marine mammals NOAA Environmental Sensitivity
Index marine mammals habitat
(NOAA ORR, 2018)
X
Marine mammals NOAA Protected Resources
Division – maps and information
(NOAA GARFO, 2018)
X
Marine mammals Local databases of seal haul-
out/concentration areas (CRESLI,
2018) (NOAA ORR, 2018)
(Riverhead, 2017)
X
Marine mammals Analysis of Mystic Aquarium
stranding data, 1990-2011; Smith
Master’s thesis, data in OBIS-
SEAMAP
Marine mammals Unpublished draft pinniped models
from Duke University
3.5.2 Notes on Ecological Expert Input
Expert input was obtained on cetacean and pinniped datasets during the “Marine Mammals and
Sea Turtles” expert webinar. Map books for each webinar and links to webinar recordings can be
found on the Long Island Sound Blue Plan website (CT DEEP, 2018).
37
Chapter 4. Sea Turtles
Chapter Table of Contents
4.1 Key Data and Map Products .................................................................................................. 37 4.2 Assessment of Data Quality ................................................................................................... 38
4.2.1 Sources of Data and Metadata ..................................................................................... 38 4.2.2 Accuracy, Representativeness, and Relevance of Map Products ................................. 38
4.2.3 Data Gaps and Availability of Data to Address Gaps .................................................. 39 4.3 Additional Context ................................................................................................................. 39 4.4 References .............................................................................................................................. 39 4.5 Appendices ............................................................................................................................. 40
4.5.1 List of Maps Used to Inform the Chapter ..................................................................... 40
4.5.2 Notes on Ecological Expert Input ................................................................................. 41
4.1 Key Data and Map Products
A partial picture of sea turtle use of LIS can be obtained from the available data which include
stranding records and opportunistic sightings. Three sea turtle species (Loggerhead, Kemp’s
ridley, and Atlantic green) use LIS as foraging grounds in the warmer months, and there are no
known sea turtle nesting sites in LIS (Lopez, G et al., 2014). Limited recent tracking data suggest
that sea turtles regularly use LIS waters (Lopez, G et al., 2014).
The primary source for stranding records is the Mystic Aquarium, which has collected these data
since 1975 (Smith, 2018). Records of stranded/injured/dead animals may also be compiled in
databases of opportunistic sightings. These databases also provide a way for mariners and
citizens to report live animals. The Sea Turtle Sighting Hotline, established in 2002 and
maintained by the Massachusetts Audubon Society (MassAudubon), is the primary sightings
database that includes LIS (MassAudubon, 2018). This website displays a map of thousands of
records that can be sorted by date, species, and status (i.e., alive or dead) throughout southern
New England (Figure 1).
A smaller number of sea turtle sightings data are available via OBIS-SEAMAP, a global
scientific repository (Halpin, et al., 2009). Since the scope of that database is global, there are
likely relatively few data relevant to LIS, but the accuracy of the data and associated
documentation are robust.

38
Figure 1. Sea Turtle observations. Example map of sea turtle sightings data from the Sea Turtle
Sighting Hotline (MassAudubon, 2018).
4.2 Assessment of Data Quality
4.2.1 Sources of Data and Metadata
The Mystic Aquarium stranding data are currently available from the OBIS-SEAMAP
repository, with metadata, but only for the years between 1976 and 2011 (Smith, 2018).
Additional data/years can be requested from Mystic Aquarium directly.
The Sea Turtle Sighting Hotline website includes an interactive map, but the underlying data and
metadata likely need to be requested from MassAudubon directly (MassAudubon, 2018).
OBIS-SEAMAP sea turtle observations data are available digitally on the web (Halpin, et al.,
2009).
4.2.2 Accuracy, Representativeness, and Relevance of Map Products
The stranding and sightings data are all relevant to the Blue Plan effort. However, the particular
characteristics of each dataset may influence any assessments of accuracy and
representativeness.

39
Stranding data collected by Mystic Aquarium can be considered accurate and likely
representative of sea turtle strandings, since the Aquarium is well-known in the area and is
usually called upon to respond to these events. Stranding data alone, however, are not
representative of sea turtle distribution and abundance in LIS, especially since actively foraging
turtles in LIS are not found on beaches. Instead, stranding data represent sick or cold-shocked
animals. Sightings of live animals (e.g., from the Sea Turtle Sighting Hotline) could be used to
fill this gap.
However, the Sea Turtle Sighting Hotline could include some inaccurate sea turtle identifications
because sightings are reported by non-experts (MassAudubon, 2018). Additionally, these data
are opportunistic (i.e., cannot be effort-corrected) and not focused solely on LIS. The quantity
and quality of metadata accompanying each observation in the Sea Turtle Sighting Hotline is
unknown.
Overall, the available data pertinent to healthy sea turtle distribution and abundance is of limited
quality and quantity. Expert knowledge and experience will be important for supplementing and
interpreting the available sea turtle data.
4.2.3 Data Gaps and Availability of Data to Address Gaps
Long Island Sound-wide spatial data derived from scientific surveys of live, healthy sea turtles
represents a data gap. The opportunistic and non-expert sightings, combined with sea turtle
stranding data provide an incomplete picture of sea turtle use of LIS.
4.3 Additional Context
Because all species of sea turtles are endangered or threatened, the NOAA Protected Resources
Division (NOAA GARFO, 2018) is a source of data for species presence information, maps of
species ranges and critical habitats, as well as relevant mapping tools.
The Army Corps of Engineers maintains some record of sea turtle observations, although at the
time of this draft, the URL to their website was not functional.
4.4 References
CT DEEP. (2018, February 5). Long Island Sound Blue Plan Webinars. Retrieved from
Connecticut Department of Energy and Environmental Protection:
http://www.ct.gov/deep/cwp/view.asp?a=2705&q=593814&deepNav_GID=1635
Halpin, P. N., Read, A. J., Fujioka, E., Best, B. D., Donnelly, B., Hazen, L. J., . . . Hyrenbach, K.
D. (2009). OBIS-SEAMAP: The world data center for marine mammal, sea bird, and sea
turtle distributions. Oceanography, 22(2), 104-115.

40
Lopez, G et al. (2014). Biology and Ecology of Long Island Sound. In J. S. Latimer, M. A.
Tedesco, R. L. Swanson, C. Yarish, P. E. Stacey, & C. Garza, Long Island Sound:
Prospects for the Urban Sea (p. 558). New York: Springer.
MassAudubon. (2018, February 6). Sea Turtle Sighting Hotline for Southern New England
Boaters. Retrieved from MassAudubon Wellfleet Bay Wildlife Sanctuary:
http://www.seaturtlesightings.org/index.html
NOAA GARFO. (2018, February 6). Protected Resources Division. Retrieved from NOAA
Greater Atlantic Region Fisheries Office:
https://www.greateratlantic.fisheries.noaa.gov/protected/
Smith, A. (2018, February 6). Mystic Aquarium marine mammal and sea turtle stranding data
1976-2011. Retrieved from Mystic Aquarium: http://seamap.env.duke.edu/dataset/945
4.5 Appendices
4.5.1 List of Maps Used to Inform the Chapter
Data highlighted in grey are included in the Inventory and were discussed during expert
webinars. In addition to the links provided below, each grey dataset is accompanied by a
reference, citation, or link within the text in the Inventory.
The un-highlighted (white) data rows were also discussed during expert webinars. These data
were either identified in the Rapid Assessment or mentioned by experts as credible sources of
data that may not be relevant to the Blue Plan effort. Example reasons include the older age of
the dataset, limited overall availability, lack of spatial data products, too limited or too broad
spatial/temporal scope, or that other LIS datasets were preferred. Many of these un-highlighted
datasets are described in Section 4.3 Additional Context, and most are described further in the
map books associated with the expert webinars (CT DEEP, 2018).
CATEGORY DATASET/LAYER ADVANCED
FROM RAPID
ASSESSMENT
TO
INVENTORY
ADDED TO
INVENTORY
FROM
EXPERT
REVIEW
Sea turtles Mystic Aquarium sea turtle
stranding data (Smith, 2018) X
Sea turtles Sea Turtle Sighting Hotline
(MassAudubon, 2018) X
Sea turtles OBIS-SEAMAP sea turtle
observations (Halpin, et al., 2009) X
Sea turtles NOAA Protected Resources
Division – maps and information
(NOAA GARFO, 2018)
X
Sea turtles Sea Turtle Sightings Per Unit Effort
(leatherback, loggerhead, green),
Northeast Ocean Data Portal

41
CATEGORY DATASET/LAYER ADVANCED
FROM RAPID
ASSESSMENT
TO
INVENTORY
ADDED TO
INVENTORY
FROM
EXPERT
REVIEW
Sea turtles NOAA Atlantic Marine Assessment
Program for Protected Species aerials
surveys in LIS – also in OBIS-
SEAMAP
Sea turtles Seaturtle.org observations – also in
OBIS-SEAMAP
Sea turtles US Army Corps of Engineers sea
turtle opportunistic sightings
Sea turtles Diamondback terrapin data
4.5.2 Notes on Ecological Expert Input
Expert input was obtained on sea turtle datasets during the “Marine Mammals and Sea Turtles”
expert webinar. Map books for each webinar and links to webinar recordings can be found on the
Long Island Sound Blue Plan website (CT DEEP, 2018).

42
Chapter 5. Birds
Chapter Table of Contents
5.1 Key Data and Map Products .................................................................................................. 42 5.2 Assessment of Data Quality ................................................................................................... 45
5.2.1 Sources of Data and Metadata ..................................................................................... 45 5.2.2 Accuracy, Representativeness, and Relevance of Map Products ................................. 46
5.2.3 Data Gaps and Availability of Data to Address Gaps .................................................. 46 5.3 Additional Context ................................................................................................................. 47 5.4 References .............................................................................................................................. 47 5.5 Appendices ............................................................................................................................. 49
5.5.1 List of Maps Used to Inform the Chapter ..................................................................... 49
5.5.2 Notes on Ecological Expert Input ................................................................................. 50
5.1 Key Data and Map Products
There are three available data products that each describe areas that are important to birds, and
one dataset that provides quantitative information about the distribution and abundance of
individuals.
Each of the three “important area” data products integrate information from a variety of sources,
including scientific surveys and expert knowledge, to identify these areas. In other words,
experts used scientific observations and experience to highlight areas on a map important to birds
for different life stages and behaviors. This inventory acknowledges and leverages the existence
of those underlying data by incorporating the three integrative datasets (described in detail
below).
First, CT DEEP maintains a dataset of migratory waterfowl concentration areas for
approximately 20 species (e.g., including bufflehead, mallard, common scoter) derived from a
report on significant coastal habitats in Southern New England (Figure 1) (CT DEEP, 2017)
(USFWS, 1991).
Second, the NOAA Environmental Sensitivity Index (ESI) delineates “special use areas”,
including migratory or wintering areas, nesting sites, concentration areas, roosting areas, and
vulnerable occurrences for many types of birds (e.g., alcids, diving birds, gulls, terns, passerines,
pelagic birds, raptors, shorebirds, wading birds, and waterfowl) (NOAA ORR, 2018). Each of
these two datasets were developed specifically to support oil spill response or other coastal
disasters.
Lastly, Audubon Important Bird Areas (IBAs) is the third data product that describes whole
areas relevant to a variety of bird species (Audubon, 2018). IBAs are identified by one or more
criteria developed by Bird Life International: (1) the site is known or thought to regularly hold
significant numbers of a globally threatened species; (2) the site is known or thought to hold a
significant component of a group of species whose breeding distributions define an Endemic

43
Bird Area or Secondary Area; (3) the site is known or thought to hold a significant component of
the group of species whose distributions are largely or wholly confined to one biome (4) the site
is known or thought to hold congregations of ≥ 1% of the global population of one or more
species on a regular or predictable basis. There are several state- and global-scale IBAs on both
shores of LIS.
The distribution and abundance of individual birds and bird species within LIS can be described
from an online citizen-based repository, eBird (Figure 2) (Sullivan, et al., 2009). The eBird
database includes thousands of opportunistic (i.e., not effort-corrected) observations of birds,
including the species, the numbers of individuals, the location, and the timing of each sighting.
eBird contains discrete observations from many individual scientists/birders as well as from
coordinated local survey efforts in LIS such as Super Seawatch. There is likely overlap between
data contained in eBird and the individual datasets noted in the expert webinar mapbooks and
discussion (some of which are also listed in Section 5.5.1 List of Maps Used to Inform the
Chapter), since many of the data collectors routinely enter their data into eBird (CT DEEP,
2018). By using eBird to access these and other data, sightings can be compiled, filtered, and
analyzed holistically.
Finally, state-maintained lists of Species of Greatest Conservation Need (SGCN) for Connecticut
and New York, endangered species, threatened species, and other species of concern also provide
additional qualitative information about bird species in LIS with conservation, management, or
regulatory relevance (CT DEEP, 2015; NYDEC, 2015). These lists can be used to prioritize the
acquisition and/or development of individual species maps.

44
Figure 1. Migratory waterfowl concentration areas. A map of waterfowl concentration areas
(USFWS, 1991). Access available via the Connecticut Aquaculture Mapping Atlas (Aquaculture
Mapping Atlas, 2017).

45
Figure 2. Bird observation data. A map showing the number of species observed at each
location, according to the observations cataloged in the eBird database (Sullivan, et al., 2009).
5.2 Assessment of Data Quality
5.2.1 Sources of Data and Metadata
The CT DEEP migratory waterfowl concentration areas and NOAA ESI bird special use areas
are maintained by a state and federal agency, respectively (NOAA ORR, 2018; USFWS, 1991).
Each of these data products and their metadata are downloadable from agency websites.
A map of Audubon IBAs can be explored on their website (Audubon, 2018), and is also
displayed on the Northeast Ocean Data Portal (Northeast Regional Planning Body, Northeast
Ocean Data Portal, 2018). The Northeast Ocean Data Portal map includes a link to metadata.

46
The eBird website displays raw species observations on a map and a map of bird “hotspots”
(Sullivan, et al., 2009). The eBird database can be queried by state and county, and all raw
observations can be obtained digitally, in a spreadsheet format. Maps can then be developed
using the geospatial information tied to each observation. For application in the Blue Plan effort,
queries would need to be conducted for both Connecticut and New York coastal counties, and
filtered by proximity to the coastline or open water.
Lists of SGCN are both maintained by state agencies. The most updated reports and resources
are available on the web (CT DEEP, 2015; NYDEC, 2015).
5.2.2 Accuracy, Representativeness, and Relevance of Map Products
The CT DEEP waterfowl concentration areas (USFWS, 1991), NOAA ESI birds special use
areas (NOAA ORR, 2018), and Audubon IBAs (Audubon, 2018) are accurate, representative,
and relevant to the Blue Plan. These three datasets also overlap thematically, and may highlight
the same or similar areas. The age of the underlying information supporting these data products
(e.g., scientific surveys, other sightings) is of some concern – in some cases (e.g., waterfowl
concentration areas), the data are many decades old.
The eBird database is maintained by a consortium led by the Cornell Lab of Ornithology and
Audubon, but bird observations can be entered into the database by any user. Some of the
observations in eBird have more documentation and metadata than others. Although eBird data
encompass a much broader area than LIS, the data can be easily subset to LIS, and so they are
extremely relevant. The accuracy and representativeness of the eBird data can be assessed
through exploratory data analyses, and by seeking expert guidance and input.
5.2.3 Data Gaps and Availability of Data to Address Gaps
Open-water areas of LIS are not as well-represented as coastal areas in the suite of bird datasets
described here. Systematic bird surveys of offshore and open-water species are “largely lacking”,
with a few exceptions (Lopez, G et al., 2014). For this reason, information on pelagic seabird
species is lacking relative to the information available for waterfowl and other coastal birds.
Pelagic and open-water seabird species distribution and abundance have been mapped at the
regional scale by a few recent efforts, including through NOAA’s Atlantic Marine Assessment
Program for Protected Species (AMAPPS) (NOAA NEFSC, 2018). These and other data have
been integrated into Atlantic-scale map products by the NOAA National Center for Coastal
Ocean Science (NCCOS) (Kinlan, Winship, White, & Christensen, 2016). However, neither of
these efforts has produced map products for seabirds that cover LIS, to-date. A previous NCCOS
effort to map seabirds in the NY Bight (Menza, Kinlan, Dorfman, Poti, & Caldow, 2012)
produced products with LIS coverage, but experts advised against using these maps for the Blue
Plan effort, as they included few underlying observations within LIS.

47
The available bird datasets may also characterize certain species adequately, but less completely
for other species. For these cases and in general, there is an abundance of expert knowledge and
experience that can be used to supplement and assist in interpreting the available data for birds in
LIS.
5.3 Additional Context
There are several other bird datasets relevant to LIS that are limited in scope, extent, or
availability. These datasets were discussed during the expert webinars (CT DEEP, 2018), and
many are also noted in Section 5.5.1 List of Maps Used to Inform the Chapter. Some of these
datasets are also in the eBird database. Notable examples include the broad-scale Christmas Bird
Counts (Audubon, 2018), datasets targeting individual threatened or endangered species (e.g.,
piping plover nesting data maintained by CT DEEP (CT CEQ, 2011)), ongoing shorebird and
seabird tracking data collected by USFWS and Bureau of Ocean Energy Management (BOEM)
(USFWS and BOEM, 2018), and ongoing research and data product development for salt marsh
birds (the Saltmarsh Habitat Avian Research Program [SHARP] (SHARP, 2018)).
In addition to SGCN lists, the states of Connecticut and New York each maintain lists of
endangered species, threatened species, and species of concern (CT DEEP, 2017; NYDEC,
2015). These lists can be used together to prioritize future data development and identify data
gaps.
The bird datasets reviewed for this inventory indicate that environmental change over time is an
important factor in understanding bird distribution, abundance, and use of LIS. These changes
include habitat loss due to coastal development (historical and recent), as well as climate change
effects such as flooding of nesting sites and wading habitat due to sea level rise (Lopez, G et al.,
2014).
For more information on human involvement in waterfowl hunting in Connecticut in relation to
bird distribution please see the Chapter 22 Waterfowl Hunting.
5.4 References
Aquaculture Mapping Atlas. (2017). Retrieved from Aquaculture Mapping Atlas :
https://clear3.uconn.edu/aquaculture/
Audubon. (2018, February 6). Audubon Christmas Bird Count Results. Retrieved from Audubon
Christmas Bird Count: http://netapp.audubon.org/CBCObservation/
Audubon. (2018, February 6). Important Bird Areas. Retrieved from Audubon:
http://www.audubon.org/important-bird-areas
CT CEQ. (2011). Piping Plovers on the Beach. Retrieved February 6, 2018, from Environmental
Quality in Connecticut: http://www.ct.gov/ceq/cwp/view.asp?a=4050&q=473846
CT DEEP. (2015). Connecticut's Wildlife Action Plan, 2015 Revision. Connecticut Department
of Energy and Environmental Protection. State of Connecticut.

48
CT DEEP. (2017, June 27). Endangered, Threatened and Special Concern Species in
Connecticut. Retrieved from Connecticut Department of Energy and Environmental
Protection: http://www.ct.gov/deep/cwp/view.asp?a=2702&q=323486
CT DEEP. (2017). GIS Data. Retrieved from Connecticut Department of Energy and
Environmental Protection:
http://www.ct.gov/deep/cwp/view.asp?a=2698&q=322898&deepNav_GID=1707
CT DEEP. (2018, February 5). Long Island Sound Blue Plan Webinars. Retrieved from
Connecticut Department of Energy and Environmental Protection:
http://www.ct.gov/deep/cwp/view.asp?a=2705&q=593814&deepNav_GID=1635
Kinlan, B. P., Winship, A. J., White, T. P., & Christensen, J. (2016). Modeling at-sea occurrence
and abundance of marine birds to support Atlantic marine renewable energy planning:
Phase 1 report. Sterling, VA: OCS Study BOEM 2016-039.
Lopez, G et al. (2014). Biology and Ecology of Long Island Sound. In J. S. Latimer, M. A.
Tedesco, R. L. Swanson, C. Yarish, P. E. Stacey, & C. Garza, Long Island Sound:
Prospects for the Urban Sea (p. 558). New York: Springer.
Menza, C., Kinlan, B. P., Dorfman, D. S., Poti, M., & Caldow, C. (2012). A Biogeographic
Assessment of Seabirds, Deep Sea Corals, and Ocean Habitats of the New York Bight:
Science to Support Offshore Spatial Planning. Silver Spring: NOAA Technical
Memorandum NOS NCCOS 141.
NOAA NEFSC. (2018, February 6). Atlantic Marine Assessment Program for Protected Species
(AMAPPS). Retrieved from NOAA Northeast Fisheries Science Center:
https://www.nefsc.noaa.gov/psb/AMAPPS/
NOAA ORR. (2018, February 5). Environmental Sensitivity Index (ESI) Maps. Retrieved from
NOAA Office of Response and Restoration: https://response.restoration.noaa.gov/maps-
and-spatial-data/environmental-sensitivity-index-esi-maps.html
Northeast Regional Planning Body. (2018). Northeast Ocean Data Portal. Retrieved from
www.northeastoceandata.org
NYDEC. (2015, May 4). List of Endangered, Threatened and Special Concern Fish & Wildlife
Species of New York State. Retrieved from New York State Department of Environmental
Conservation: http://www.dec.ny.gov/animals/7494.html
NYDEC. (2015). New York State Wildlife Action Plan. New York Department of Environmental
Conservation. State of New York.
SHARP. (2018, February 6). Saltmarsh Habitat & Avian Research Program. Retrieved from
https://www.tidalmarshbirds.org/
Sullivan, B. L., Wood, C. L., Iliff, M. J., Bonney, R. E., Fink, D., & Kelling, S. (2009). eBird: a
citizen-based bird observation network in the biological sciences. Biological
Conservation, 142, 2282-2292.
USFWS. (1991). Northeast Coastal Areas Study: Significant Coastal Habitats of Southern New
England and Portions of Long Island, New York. US Fish and Wildlife Service, Southern
New England - Long Island Sound Coastal and Estuary Office. Charlestown RI: USFWS.
USFWS and BOEM. (2018). Pilot study tracking offshore occurrence of Common Terns and
American Oystercatchers with VHF - extended to include Roseate Terns and Piping
Plovers. US Fish and Wildlife Service. BOEM.

49
5.5 Appendices
5.5.1 List of Maps Used to Inform the Chapter
Data highlighted in grey are included in the Inventory and were discussed during expert
webinars. In addition to the links provided below, each grey dataset is accompanied by a
reference, citation, or link within the text in the Inventory.
The un-highlighted (white) data rows were also discussed during expert webinars. These data
were either identified in the Rapid Assessment or mentioned by experts as credible sources of
data that may not be relevant to the Blue Plan effort. Example reasons include the older age of
the dataset, limited overall availability, lack of spatial data products, too limited or too broad
spatial/temporal scope, or that other LIS datasets were preferred. Many of these un-highlighted
datasets are described in Section 5.3 Additional Context, and most are described further in the
map books associated with the expert webinars (CT DEEP, 2018).
CATEGORY DATASET/LAYER ADVANCED
FROM RAPID
ASSESSMENT
TO
INVENTORY
ADDED TO
INVENTORY
FROM
EXPERT
REVIEW
Birds CT DEEP migratory waterfowl
concentration areas (USFWS, 1991) X
Birds NOAA Environmental Sensitivity
Index bird habitat, nest sites,
concentration areas (NOAA ORR,
2018)
X
Birds Audubon Important Bird Areas
(Audubon, 2018) X
Birds eBird (Sullivan, et al., 2009) X
Birds State lists – Species of Greatest
Conservation Need; Endangered,
Threatened, Species of Concern (CT
DEEP, 2015) (CT DEEP, 2017)
(NYDEC, 2015) (NYDEC, 2015)
X
Birds LIS SuperSeaWatch (included in
eBird)
Birds Predicted abundance of seabird
species, NY offshore biogeographic
assessment, New York Geographic
Information Gateway (NYGIG)
Birds Atlantic Offshore Seabird Dataset
Catalog
Birds CT DEEP Piping Plover data
Birds CT DEEP or RI DEM Roseate tern
foraging areas

50
CATEGORY DATASET/LAYER ADVANCED
FROM RAPID
ASSESSMENT
TO
INVENTORY
ADDED TO
INVENTORY
FROM
EXPERT
REVIEW
Birds Audubon American oystercatcher
nesting areas
Birds Christmas Bird Count Data (some in
eBird)
Birds Theses and USFWS work on
endangered shorebirds, Loring,
Spendelow
Birds CT Ornithological Association
summer bird count data
Birds SHARP spatial data, Elphick at
UConn and others
Birds North Atlantic Landscape
Conservation Cooperative datasets
Birds NYC Aubudon wading bird nesting
data
Birds NYC Parks winter waterfowl data
Birds OBIS-SEAMAP bird observations
5.5.2 Notes on Ecological Expert Input
Expert input was obtained on bird datasets during the “Birds” expert webinar. Map books for
each webinar and links to webinar recordings can be found on the Long Island Sound Blue Plan
website (CT DEEP, 2018).

51
Chapter 6. Fish, Pelagic Invertebrates, Shellfish, and Zooplankton
Chapter Table of Contents
6.1 Key Data and Map Products .................................................................................................. 51 6.2 Assessment of Data Quality ................................................................................................... 56
6.2.1 Sources of Data and Metadata ..................................................................................... 56 6.2.2 Accuracy, Representativeness, and Relevance of Map Products ................................. 56
6.2.3 Data Gaps and Availability of Data to Address Gaps .................................................. 57 6.3 Additional Context ................................................................................................................. 57 6.4 References .............................................................................................................................. 58 6.5 Appendices ............................................................................................................................. 59
6.5.1 List of Maps Used to Inform the Chapter ..................................................................... 59
6.5.2 Notes on Ecological Expert Input ................................................................................. 62
6.1 Key Data and Map Products
This inventory category encompasses vertebrate and invertebrate animals living in the water
column or in close association with the seafloor. Information pertinent to fish, pelagic
invertebrates, shellfish, and zooplankton is available in three basic forms: (1) raw survey data,
(2) indices, other syntheses, or tools integrating various data, and (3) places or areas relevant to
these species or their management.
Raw survey data
The CT DEEP Marine Fisheries Division has conducted the Long Island Sound Trawl Survey
(LISTS) since 1984 (Gottschall, Johnson, & Simpson, 2000). The LISTS data are pertinent to
fish, pelagic invertebrates, and some benthic invertebrates (Table 1). It is a stratified random
survey with 12 combinations of three bottom types and four depth intervals conducted in spring
and fall. Biomass has been recorded since 1992. The survey has resulted in a robust LIS-wide
database that can be represented a number of ways: tow-level data can be mapped by individual
species (see Table 1), by season, by year, and for species groups of interest (e.g., benthic and
pelagic, commercial and recreational). For some species, age and length are also recorded (e.g.,
scup, flounder, tautog, bluefish, weakfish). In addition to LISTS, CT DEEP Marine Fisheries
Division also conducts an estuarine seine survey in LIS (CT DEEP, 2016).
Although spatially restricted, there are two relatively long-term fish trawl survey datasets held by
the Norwalk Aquarium (Maritime Aquarium, 2018) and Harbor Watch in the Norwalk River
Estuary (Harris, Fraboni, Cantatore, & Cooper, 2014).
The New York State Department of Environmental Conservation (NYS DEC) maintains
horseshoe crab survey data (Cornell Cooperative Extension, 2018).

52
Zooplankton abundance or biomass data are held by the CT DEEP Water Quality Monitoring
Program (CT DEEP, 2017) and by researchers at the University of Connecticut (e.g., Rice, Dam,
& Stewart (2014); Tamura, Katz, & McManus (2011)).
Table 1. Fish and invertebrate species caught in more than 5 fall tows (1992-2014) in the CT
DEEP Long Island Sound Trawl Survey. *pelagic invertebrate; **benthic invertebrate
Species common name
Alewife
American lobster**
American shad
Atlantic croaker
Atlantic herring
Atlantic mackerel
Atlantic menhaden
Atlantic sturgeon
Bay anchovy
Bigeye scad
Black sea bass
Blue runner
Blueback herring
Bluefish
Butterfish
Clearnose skate
Conger eel
Crevalle jack
Cunner
Fourbeard rockling
Fourspot flounder
Gizzard shad
Glasseye snapper
Hickory shad
Hogchoker
Horseshoe crab**
Inshore lizardfish
Little skate
Longfin squid*
Mackerel shad
Moonfish
Northern kingfish
Northern pipefish
Northern puffer
Northern searobin
Northern sennet
Oyster toadfish
Planehead filefish
Red goatfish
Red hake
Rough scad
Roughtail stingray
Round herring
Round scad
Scup
Short bigeye
Silver hake
Smallmouth flounder
Smooth dogfish
Spanish mackerel
Spiny dogfish
Spot
Spotted hake
Striped anchovy
Striped bass
Striped sea robin
Summer flounder
Tautog
Weakfish
Windowpane
Winter flounder
Winter skate
Yellow jack

53
Figure 1. Fish biomass data. A map from the Northeast Ocean Data Portal showing the biomass
of fish species from the CT DEEP Long Island Sound Trawl Survey (Gottschall, Johnson, &
Simpson, 2000).
Figure 2. Coastal fish trawl footprints. A map showing the grids used for fish trawl surveys
conducted by Harbor Watch (Harris, Fraboni, Cantatore, & Cooper, 2014).

54
Indices, other syntheses, and integrative tools
Several individual efforts have taken raw datasets mentioned above (or other sources) and
developed interpretive products, syntheses, or tools to make the data useful for various purposes.
Examples include some of the indices developed for the Long Island Sound Study (LISS), such
as the warm water/cold water fish index and the open water forage fish index (LISS, 2018).
CT DEEP has also developed several Saltwater Fishing Resource Maps that can provide
additional information about fish distribution and abundance (CT DEEP, 2017).
Using beach characteristics and horseshoe crab abundance data, researchers at UConn and CT
DEEP mapped predicted spawning sites for horseshoe crabs on the CT coast of LIS (Landi,
Vokoun, Howell, & Auster, 2014).
The Nature Conservancy’s Long Island Sound Ecological Assessment (LISEA) used the LISTS
data to develop a series of maps representing individual species persistence, weighted
persistence, persistence areas, and total species richness (Anderson & Frohling, 2015). The maps
produced relate to individual species, species groups, and functional groups (e.g., Atlantic cod
demersal fish, Gaddids), as well as macroinvertebrate species caught in the trawl (e.g., American
lobster, blue crab, bobtail squid). Other details about this project are discussed in Chapter 12
Ecologically Notable Places and Ecological Marine Units.
The Stevens Institute of Technology, in partnership with CT DEEP and NOAA, recently
modeled past and future bottom temperatures in LIS on the same sampling grid used by the
LISTS survey (Stevens Institute, 2018). The resulting maps examine changes in the distribution
and abundance of warm- or cold-water adapted species.
A recent project used LIS and winter flounder as a pilot study for modeling estuarine fish habitat
(Clingerman, Petty, & Boettner, 2015). The project used CT DEEP LISTS data for winter
flounder and produced a Fish Habitat Decision Support Tool (NALCC, 2016).

55
Figure 3. Fish species richness. This map was derived from the CT DEEP Long Island Sound
Trawl Survey data and compiled in the Long Island Sound Ecological Assessment (Anderson &
Frohling, 2015).
Places or areas
Datasets representing places or areas integrate information from a variety of sources, including
scientific surveys and expert knowledge. In some cases, areas are based on management schemes
or designations. These data include:
NOAA Environmental Sensitivity Index (NOAA ORR, 2018)
NOAA Essential Fish Habitat (NOAA NMFS, 2018)
NOAA groundfish management areas, available via the Northeast Ocean Data Portal
(Northeast Regional Planning Body, Northeast Ocean Data Portal, 2018)
NOAA scallop management areas, available via the Northeast Ocean Data Portal
(Northeast Regional Planning Body, 2018)
Designated natural shellfish beds, available via the CT Aquaculture Atlas (UConn
CLEAR, 2018)

56
6.2 Assessment of Data Quality
6.2.1 Sources of Data and Metadata
Raw survey data
The LISTS data, estuarine seine data, and zooplankton data collected as part of the Water
Quality Monitoring Program are both held by CT DEEP. Some of the LISTS data are also
displayed on the Northeast Ocean Data Portal (Figure 1) (Northeast Regional Planning Body,
Northeast Ocean Data Portal, 2018). Metadata descriptions are available via the Northeast Ocean
Data Portal as well.
Maps, reports, and some data for the Norwalk-area fish trawls are available on the Norwalk
Aquarium (Maritime Aquarium, 2018) and Harbor Watch (Harris, Fraboni, Cantatore, & Cooper,
2014) websites.
A map of horseshoe crab monitoring sites and reports are available on the New York Horseshoe
Crab Monitoring Network website (Cornell Cooperative Extension, 2018).
Indices, other syntheses, and integrative tools
All of the data in this category are readily available, either on the web or by partner entities. The
predicted horseshoe crab spawning sites data (Landi, Vokoun, Howell, & Auster, 2014) is held
by CT DEEP.
Places or areas
All of the data in this category are readily available, either on the web or by partner entities. Data
are housed on federal agency websites and regional data portals (e.g., the Northeast Ocean Data
Portal) (Northeast Regional Planning Body, Northeast Ocean Data Portal, 2018). If housed on
the Northeast Ocean Data Portal, metadata descriptions are available.
6.2.2 Accuracy, Representativeness, and Relevance of Map Products
Raw survey data
All raw survey data described above are relevant to LIS, and since they are derived from existing
and ongoing programs at state agencies and by local scientific groups, their results can be
considered to be accurate as well.
In term of representativeness, bottom trawl datasets are limited in their ability to represent the
complete fish community in an area. Certain species are more well-caught than others (e.g.,
demersal fish), and trawl gear cannot be towed over certain habitat types. For example, the
LISTS data does not adequately survey shoals, reefs, trenches, and areas like The Race. For other
datasets, more exploratory work needs to be done in order to assess representativeness.

57
Indices, other syntheses, and integrative tools
All of these more synthesized datasets focus on LIS and so they are relevant to the Blue Plan
effort. The accuracy and representativeness of each of these outputs depends on the input data
and the methods used to product the products. For efforts where the data collectors have
provided input on the methods and outputs, those outputs will be more likely to be accepted as
accurate and representative. Outputs that are derived from predictions, interpolations, or models
may require additional consideration and interpretation prior to use – ideally in consultation with
data collectors, analysts, and other experts.
Places or areas
Since all of these data come from federal and state agencies, they can be considered to be
accurate. Because each dataset has coverage in LIS, they are relevant to the Blue Plan effort.
Each likely differs in its representativeness, however, since the NOAA datasets pertain to a much
broader area than LIS.
Each dataset is also derived for a specific management purpose, and so the products should be
interpreted in that context. For example, the NOAA ESI data were developed to support oil spill
response, and so these data may focus on coastal and nearshore species. The NOAA EFH maps
are very broad scale and coarse resolution. The EFH spatial units would be inadequate for
mapping related to the Blue Plan, but information imbedded in this dataset (e.g., species habitat
preferences, life stage information) may be extremely pertinent. The two management areas
datasets pertain only to areas sensitive to a subset of species and only for sensitive life history
stages.
The CT designated natural shellfish beds data represent beds that are used for the purposes of
providing seed for aquaculture, and do not necessarily represent all natural shellfish beds in LIS.
6.2.3 Data Gaps and Availability of Data to Address Gaps
Overall, data gaps exist for any species not well-caught in bottom trawl surveys, and for species
with affinities for complex and rocky habitats. The LISTS survey also does not cover the entire
Sound; trawl coverage is sparser in the eastern and western ends of LIS. The estuarine seine data
and other nearshore trawls (Harris, Fraboni, Cantatore, & Cooper, 2014) (Maritime Aquarium,
2018) could be used to help partially fill these gaps.
There is also relatively little data describing pelagic invertebrates, shellfish, and zooplankton,
when compared with vertebrate fish (and especially commercially important species).
6.3 Additional Context
The NOAA Protected Resources Division maintains maps and information on endangered
species presence and critical habitat (NOAA GARFO, 2018). The Atlantic Sturgeon is an

58
endangered fish species found in LIS. Atlantic Sturgeon critical habitat maps are available on the
NOAA Protected Resources Division Atlantic Sturgeon Recovery Program website (NOAA
GARFO, 2018).
In addition to LISTS and the seine survey, CT DEEP Marine Fisheries Division also conducts
various other targeted surveys for specific species or purposes at different times of year or in
response to particular events.
6.4 References
Anderson, M., & Frohling, N. (2015). The Long Island Sound Ecological Assessment. The
Nature Conservancy.
Clingerman, J., Petty, T., & Boettner, F. (2015). Estuarine Fish Habitat Assessment: A general
framework and winter flounder pilot studies. Downstream Strategies, West Virginia
University. North Atlantic LCC.
Cornell Cooperative Extension. (2018). New York Horseshoe Crab Monitoring Network.
Retrieved from Cornell University Cooperative Extension of Suffolk County:
http://nyhorseshoecrab.org/NY_Horseshoe_Crab/Home.html
CT DEEP. (2016). A study of marine recreational fisheries in Connecticut. Connecticut
Department of Energy and Environmental Protection, Marine Fisheries Program.
CT DEEP. (2017, May 2). Long Island Sound Water Quality Monitoring Program and
Information. Retrieved Feb 5, 2018, from Connecticut Department of Energy and
Environmental Protection:
http://www.ct.gov/deep/cwp/view.asp?a=2719&q=325570&deepNav_GID=1635
CT DEEP. (2017, March 17). Saltwater (Marine) Fishing. Retrieved from Connecticut
Department of Energy and Environmental Protection:
http://www.ct.gov/deep/cwp/view.asp?a=2696&q=322744&deepNav_GID=1647
CT DEEP. (2018, February 5). Long Island Sound Blue Plan Webinars. Retrieved from
Connecticut Department of Energy and Environmental Protection:
http://www.ct.gov/deep/cwp/view.asp?a=2705&q=593814&deepNav_GID=1635
Gottschall, K. F., Johnson, M. W., & Simpson, D. G. (2000). The Distribution and Size
Composition of Finfish, American Lobster, and Long-Finned Squid in Long Island Sound
Based on the Connecticut Fisheries Division Bottom Trawl Survey, 1984–1994. NOAA
National Marine Fisheries Service. Seattle, WA: NOAA Technical Report NMFS 148.
Harris, R., Fraboni, P., Cantatore, N., & Cooper, J. (2014). Harbor Watch, a Program of
Earthplace Report on Norwalk Harbor Juvenile Benthic Marine Fish May through
October 2014. Harbor Watch.
Landi, A. A., Vokoun, J. C., Howell, P., & Auster, P. (2014). Predicting use of habitat patches by
spawning horseshoe crabs (Limulus polyphemus) along a complex coastline with field
surveys and geospatial analyses. Aquatic Conservation: Marine and Freshwater
Ecosystems, 25, 380-395.
LISS. (2018). Status and Trends: LISS Environmental Indicators. Retrieved from Long Island
Sound Study: http://longislandsoundstudy.net/?indicator_categories=marine-and-coastal-
animals

59
Lopez, G et al. (2014). Biology and Ecology of Long Island Sound. In J. S. Latimer, M. A.
Tedesco, R. L. Swanson, C. Yarish, P. E. Stacey, & C. Garza, Long Island Sound:
Prospects for the Urban Sea (p. 558). New York: Springer.
Maritime Aquarium. (2018). The Long Island Sound Biodiversity Database. Retrieved from The
Maritime Aquarium: https://www.maritimeaquarium.org/biodiversity
NALCC. (2016). Fish Habitat Decision Support Tool. Retrieved from
http://www.fishhabitattool.org/home.html
NOAA GARFO. (2018). Atlantic Sturgeon Recovery Program. Retrieved from NOAA Greater
Atlantic Region Fisheries Office:
https://www.greateratlantic.fisheries.noaa.gov/protected/atlsturgeon/index.html
NOAA GARFO. (2018, February 6). Protected Resources Division. Retrieved from NOAA
Greater Atlantic Region Fisheries Office:
https://www.greateratlantic.fisheries.noaa.gov/protected/
NOAA NMFS. (2018, February 6). Essential Fish Habitat Mapper. Retrieved from NOAA
National Marine Fisheries Service, Habitat Conservation, Habitat Protection:
https://www.habitat.noaa.gov/protection/efh/efhmapper/
NOAA ORR. (2018, February 5). Environmental Sensitivity Index (ESI) Maps. Retrieved from
NOAA Office of Response and Restoration: https://response.restoration.noaa.gov/maps-
and-spatial-data/environmental-sensitivity-index-esi-maps.html
Northeast Regional Planning Body. (2018). Northeast Ocean Data Portal. Retrieved from
www.northeastoceandata.org
Rice, E., Dam, H. G., & Stewart, G. (2014). Impact of climate change on estuarine zooplankton:
Surface water warming in Long Island Sound is associated with changes in copepod size
and community structure. Estuaries and Coasts, 38, 13-23.
Stevens Institute. (2018). Analyzing history to project and manage the future: Simulating the
effects of climate on Long Island Sound's physical environment and living marine
resources. Retrieved from Ocean Climate Reconstruction for Fisheries:
https://www.stevens.edu/research-entrepreneurship/research-centers-labs/davidson-
laboratory/research-projects/ocean-climate-reconstruction-fisheries
Tamura, M., Katz, L. A., & McManus, G. B. (2011). Distribution and diversity of Oligotrich and
Choreotrich ciliates in a large temperate estuary. Aquatic Microbial Ecology, 64, 51-67.
UConn CLEAR. (2018, February 5). Connecticut Aquaculture Mapping Atlas. Retrieved from
UConn CLEAR, CT Sea Grant, CT DA/BA: https://clear3.uconn.edu/aquaculture/
6.5 Appendices
6.5.1 List of Maps Used to Inform the Chapter
Data highlighted in grey are included in the Inventory and were discussed during expert
webinars. In addition to the links provided below, each grey dataset is accompanied by a
reference, citation, or link within the text in the Inventory.
The un-highlighted (white) data rows were also discussed during expert webinars. These data
were either identified in the Rapid Assessment or mentioned by experts as credible sources of
data that may not be relevant to the Blue Plan effort. Example reasons include the older age of
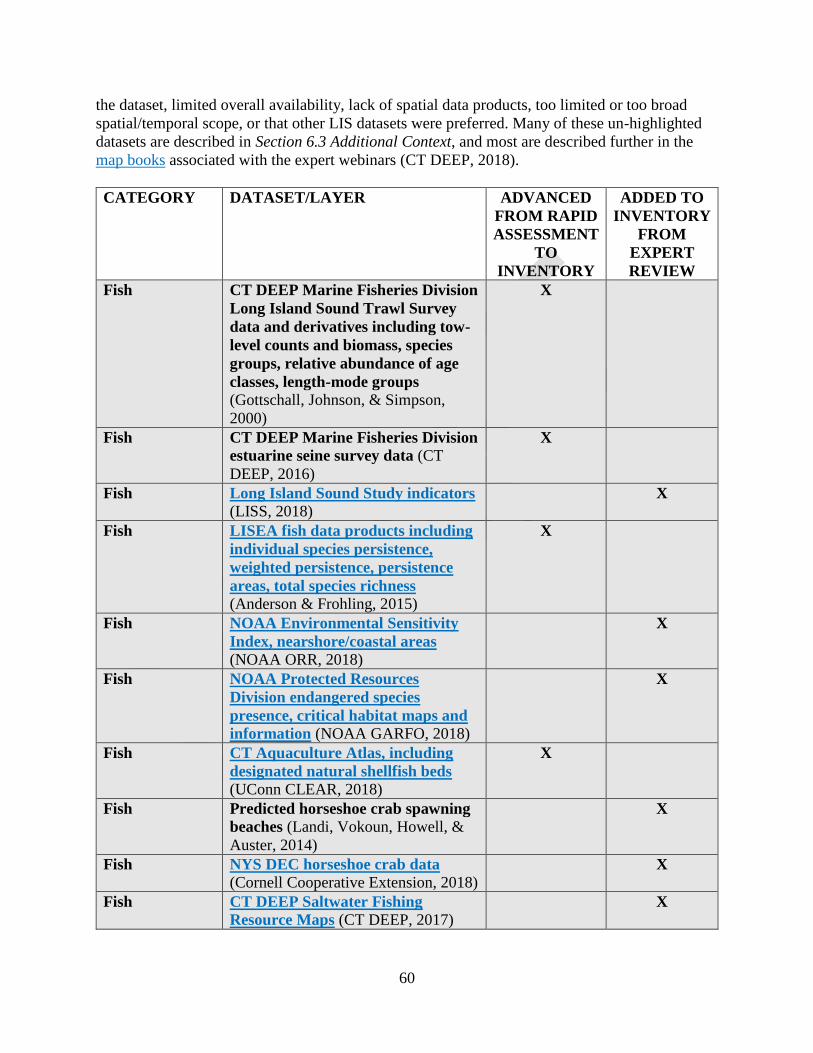
60
the dataset, limited overall availability, lack of spatial data products, too limited or too broad
spatial/temporal scope, or that other LIS datasets were preferred. Many of these un-highlighted
datasets are described in Section 6.3 Additional Context, and most are described further in the
map books associated with the expert webinars (CT DEEP, 2018).
CATEGORY DATASET/LAYER ADVANCED
FROM RAPID
ASSESSMENT
TO
INVENTORY
ADDED TO
INVENTORY
FROM
EXPERT
REVIEW
Fish CT DEEP Marine Fisheries Division
Long Island Sound Trawl Survey
data and derivatives including tow-
level counts and biomass, species
groups, relative abundance of age
classes, length-mode groups
(Gottschall, Johnson, & Simpson,
2000)
X
Fish CT DEEP Marine Fisheries Division
estuarine seine survey data (CT
DEEP, 2016)
X
Fish Long Island Sound Study indicators
(LISS, 2018) X
Fish LISEA fish data products including
individual species persistence,
weighted persistence, persistence
areas, total species richness
(Anderson & Frohling, 2015)
X
Fish NOAA Environmental Sensitivity
Index, nearshore/coastal areas
(NOAA ORR, 2018)
X
Fish NOAA Protected Resources
Division endangered species
presence, critical habitat maps and
information (NOAA GARFO, 2018)
X
Fish CT Aquaculture Atlas, including
designated natural shellfish beds
(UConn CLEAR, 2018)
X
Fish Predicted horseshoe crab spawning
beaches (Landi, Vokoun, Howell, &
Auster, 2014)
X
Fish NYS DEC horseshoe crab data
(Cornell Cooperative Extension, 2018) X
Fish CT DEEP Saltwater Fishing
Resource Maps (CT DEEP, 2017) X

61
CATEGORY DATASET/LAYER ADVANCED
FROM RAPID
ASSESSMENT
TO
INVENTORY
ADDED TO
INVENTORY
FROM
EXPERT
REVIEW
Fish Stevens Institute of Technology
climate change impacts on fish
habitats (Stevens Institute, 2018)
X
Fish Norwalk Aquarium (Maritime
Aquarium, 2018) and Harbor Watch
(Harris, Fraboni, Cantatore, & Cooper,
2014) trawl datasets
X
Fish USFWS/NALCC/TNC Winter
flounder habitat decision tool
(Clingerman, Petty, & Boettner, 2015)
X
Fish NOAA Essential Fish Habitat
Mapper (NOAA NMFS, 2018) X
Fish NOAA Groundfish management
areas, Northeast Ocean Data Portal
(Northeast Regional Planning Body,
Northeast Ocean Data Portal, 2018)
X
Fish Scallop management areas,
Northeast Ocean Data Portal
(Northeast Regional Planning Body,
Northeast Ocean Data Portal, 2018)
X
Fish CT DEEP Water Quality
Monitoring Program, zooplankton
X
Fish UConn zooplankton research
(Tamura, Katz, & McManus, 2011)
(Rice, Dam, & Stewart, 2014)
X
Fish Zooplankton predicted biomass,
seasons, NYGIG
Fish US Atlantic Coast Fishing Atlas
(NMFS)
Fish NOAA Milford lab surf clam data
Fish CT Department of Agriculture Bureau
of Aquaculture landings data
Fish Cedar Island Marina trawling data
Fish Coast Guard Academy Thames River
trawling data
Fish CT DEEP Marine Fisheries Division
short-term surveys including summer
surveys, lobster mortality event tows,
etc.
Fish NYS DEC Western LIS annual striped
bass survey
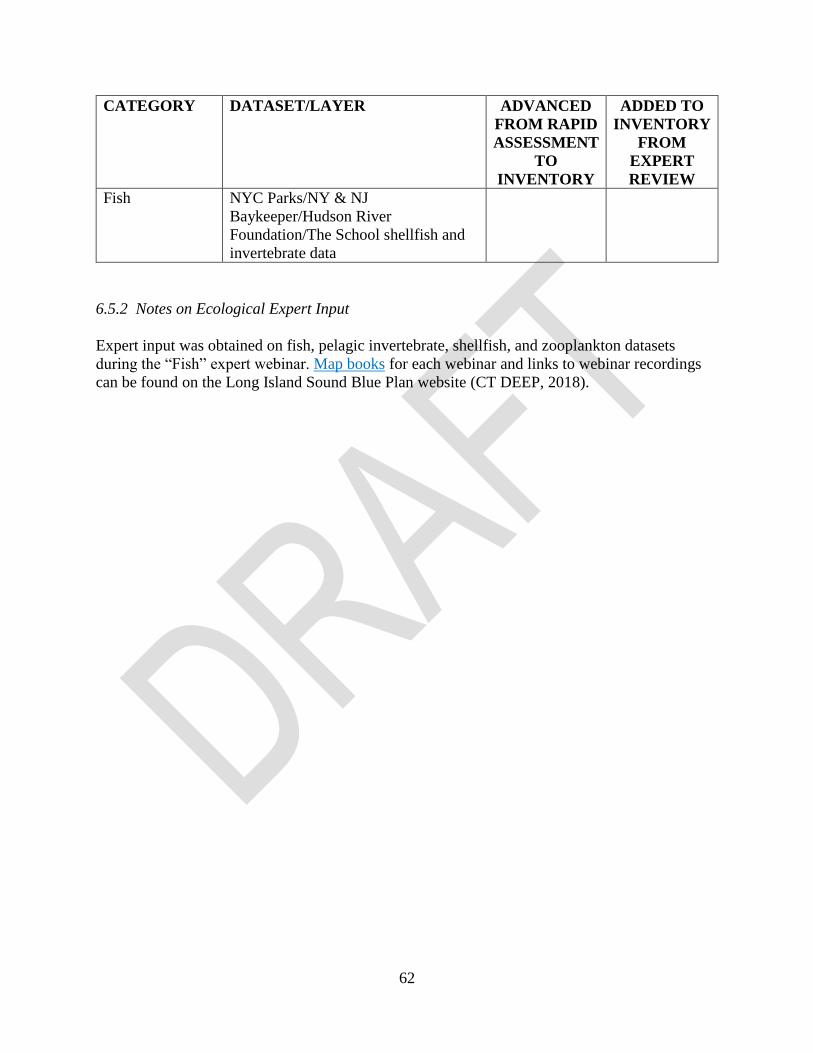
62
CATEGORY DATASET/LAYER ADVANCED
FROM RAPID
ASSESSMENT
TO
INVENTORY
ADDED TO
INVENTORY
FROM
EXPERT
REVIEW
Fish NYC Parks/NY & NJ
Baykeeper/Hudson River
Foundation/The School shellfish and
invertebrate data
6.5.2 Notes on Ecological Expert Input
Expert input was obtained on fish, pelagic invertebrate, shellfish, and zooplankton datasets
during the “Fish” expert webinar. Map books for each webinar and links to webinar recordings
can be found on the Long Island Sound Blue Plan website (CT DEEP, 2018).

63
Chapter 7. Benthic Invertebrates
Chapter Table of Contents
7.1 Key Data and Map Products .................................................................................................. 63 7.2 Assessment of Data Quality ................................................................................................... 65
7.2.1 Sources of Data and Metadata ..................................................................................... 65 7.2.2 Accuracy, Representativeness, and Relevance of Map Products ................................. 66
7.2.3 Data Gaps and Availability of Data to Address Gaps .................................................. 66 7.3 Additional Context ................................................................................................................. 67 7.4 References .............................................................................................................................. 67 7.5 Appendices ............................................................................................................................. 68
7.5.1 List of Maps Used to Inform the Chapter ..................................................................... 68
7.5.2 Notes on Ecological Expert Input ................................................................................. 69
7.1 Key Data and Map Products
Benthic invertebrates include benthic epifauna and infauna (i.e., macrofauna). Datasets pertinent
to mega-invertebrates like American lobster, Horseshoe crab, and other shellfish are described in
Chapter 6 Fish, Pelagic Invertebrates, Shellfish, and Zooplankton.
There are no recent LIS-wide datasets describing the distribution and abundance of benthic
invertebrates using uniform methods (Anderson & Frohling, 2015). The most recent data (2012,
2013) are derived from the Long Island Sound Mapping and Research Collaborative (“Cable
Fund”), which has focused on collecting data at a few targeted locations within LIS (Long Island
Sound Cable Fund Steering Committee, 2015). The data collected and mapped were thematically
extensive and included epifaunal and infaunal species richness, diversity (see Figure 1), and
community clusters. Branching sponges, cold-water coral, and other structural epifauna were
observed at Stratford Shoal as a part of this project (Stefaniak, Auster, & Babb, 2014).
The most recent and closest data product to a LIS-wide characterization of benthic invertebrates
was produced for the Long Island Sound Ecological Assessment (LISEA) (Anderson & Frohling,
2015). The LISEA effort integrated data from Reid and coauthors collected in 1972 (Reid,
Frame, & Draxler, 1979), Pelligrino and Hubbard collected in 1981-1982 (see Figure 1)
(Pelligrino & Hubbard, 1983), NOAA NMFS data collected between the 1950s and 1990s, and
Cerrato and coauthors collected between 2001-2008 (Wigley & Theroux, 1981) (Theroux &
Wigley, 1998). Zajac et al. provide a detailed overview and some synthesis of many of these
datasets and their relationship to other benthic data in all of LIS (2000). The LISEA project used
the benthic invertebrate communities identified in these datasets to define ecologically-
meaningful (i.e., statistically defined) thresholds in depth, sediment type, and seabed forms. The
resulting map of Ecological Marine Units represents physical habitats that are likely to have
distinct biota, but it is not a map of individual benthic communities. More detail on Ecological
Marine Units and example maps are included in Chapter 12 Ecologically Notable Places and
Ecological Marine Units.

64
Lastly, cold-water or “deep sea” (i.e., non-reef-building) corals are known to be found in LIS
(e.g., Stefaniak, Auster, & Babb, 2014) and the NOAA Deep Sea Coral Research and
Technology Program (DSCRTP) maintains a dataset of known coral and sponge observations
nationwide, including LIS (NOAA DSCRTP, 2018).
Figure 1. Benthic communities sample locations (blue dots) and epifauna biogenic feature
Shannon diversity (multi-colored circles). Two example benthic invertebrate data layers
pertinent to benthic invertebrates that are available on the NY Geographic Information Gateway
(NYDOS, 2018).

65
Figure 2. Observations of cold-water (deep sea) corals in Long Island Sound. A single
observation of coral is visible in north-central LIS in this map of the NOAA Deep Sea Coral
database observations on the Mid-Atlantic Ocean Data Porta (Mid-Atlantic Regional Planning
Body, Mid-Atlantic Ocean Data Portal, 2018).
7.2 Assessment of Data Quality
7.2.1 Sources of Data and Metadata
All of the data layers derived from the Cable Fund project are available for download, with
metadata, on the Long Island Sound Study online repository (MGDS, 2018). Maps of some of
these data products are available on the New York Geographic Information Gateway (NYDOS,
2018).

66
All of the Long Island Sound Ecological Assessment (LISEA) data and map products are
available via the report and the GIS dataset is available from The Nature Conservancy via the
web link above (Anderson & Frohling, 2015).
Observations of cold-water corals in the NOAA Deep Sea Coral Research and Technology
Program (DSCRTP) database are viewable online through the DSCRTP portal (NOAA
DSCRTP, 2018) and the Mid-Atlantic Ocean Data Portal (Mid-Atlantic Regional Planning Body,
Mid-Atlantic Ocean Data Portal, 2018).
7.2.2 Accuracy, Representativeness, and Relevance of Map Products
All of the benthic invertebrate datasets described above are relevant to LIS. A typical problem in
assembling benthic invertebrate data is limited spatial coverage and temporal mismatch, and LIS
datasets are no exception. In combining datasets to achieve broader spatial and temporal
coverage, different collection and/or analysis methods often complicate the interpretation. The
Cable Fund data were collected and analyzed with consistent methods, but for a geographically
small area – including Stratford Shoal and Bridgeport (Long Island Sound Cable Fund Steering
Committee, 2015). Therefore, the Cable Fund data are likely accurate but perhaps not
representative of the variety of benthic invertebrate communities in LIS. Conversely, the LISEA
maps have better spatial coverage (i.e., are perhaps more representative) but are limited in their
ability to clearly convey benthic community information because the methods used to collect
each of the underlying invertebrate datasets were different.
The NOAA DSCRTP database presently contains one observation in LIS, and one in nearby
Block Island Sound (NOAA DSCRTP, 2018). Very recent (within the last 5 years) coral and
sponge observations in Southern New England are not yet reflected in this database.
7.2.3 Data Gaps and Availability of Data to Address Gaps
There are spatial and temporal gaps in benthic invertebrate data. Benthic invertebrate
communities are heterogeneous, and the datasets described above likely do not capture the finest
scales of that heterogeneity. Similarly, benthic communities fluctuate seasonally, with
disturbances, and naturally on longer time scales. According to Lopez et al., “there have been no
studies of…benthic communities [in LIS] that have assessed seasonal and year to year changes
for periods greater than 2 years, nor studies that have assessed recovery following disturbance
for more than that time span.” (Lopez, G et al., 2014).
Corals, sponges, and their habitats are a notable data gap for LIS. As noted above, the national
dataset only contains a few observations of corals in LIS. Observations of these organisms
recorded in the Cable Fund data can be used to fill this gap but only for the areas around
Stratford Shoals
For this category of data – especially the distribution and abundance of corals and sponges –
expert experience and judgement could be used to supplement the available datasets.

67
7.3 Additional Context
Notable additional datasets that were discussed on the expert webinars (CT DEEP, 2018) include
the U.S. Geological Survey’s (USGS) work in LIS (USGS, 2014), which has been integrated
with other habitat characterization efforts, and the EPA National Coastal Condition Assessment
2010, 2005/2006, and its precursors, which characterizes benthic habitat quality at the national
scale (with coverage in LIS) using benthic invertebrate community measures (US EPA, 2015).
It should also be noted that there have been a range of approaches used to map benthic biological
resources in the Northeast region, including LIS. The Northeast Ocean Data Portal includes a
comprehensive resource, Habitat mapping and classification in the Northeast USA, that explains
the various methods and tools used by different mapping entities in New England (Northeast
Regional Planning Body, Northeast Ocean Data Portal, 2018). Some of the issues discussed
include how to integrate biological and geological (e.g., sediment) data to create an integrated
map (e.g., Zajac, 2008) and efforts to apply the national NOAA Coastal and Marine Ecological
Classification Scheme (CMECS) to data in the Northeast Region (FGDC, 2012).
7.4 References
Anderson, M., & Frohling, N. (2015). The Long Island Sound Ecological Assessment. The
Nature Conservancy.
CT DEEP. (2018, February 5). Long Island Sound Blue Plan Webinars. Retrieved from
Connecticut Department of Energy and Environmental Protection:
http://www.ct.gov/deep/cwp/view.asp?a=2705&q=593814&deepNav_GID=1635
FGDC. (2012). Coastal and Marine Ecological Classification Standard. Federal Geographic
Data Committee, Marine and Coastal Spatial Data Subcommittee. FGDC-STD-018-2012.
Long Island Sound Cable Fund Steering Committee. (2015). Seafloor mapping of Long Island
Sound - Final report: Phase 1 Pilot Project. Stamford, CT: US Environmental Protection
Agency Long Island Sound Study.
Lopez, G et al. (2014). Biology and Ecology of Long Island Sound. In J. S. Latimer, M. A.
Tedesco, R. L. Swanson, C. Yarish, P. E. Stacey, & C. Garza, Long Island Sound:
Prospects for the Urban Sea (p. 558). New York: Springer.
MGDS. (2018). Long Island Sound Study Funded/Related Data. Retrieved from Marine
Geoscience Data System: http://www.marine-
geo.org/tools/new_search/index.php?&a=1&funding=LISS&output_info_all=on
Mid-Atlantic Regional Planning Body. (2018). Mid-Atlantic Ocean Data Portal. Retrieved from
portal.midatlanticocean.org
NOAA DSCRTP. (2018, February 7). NOAA Deep Sea Coral Data Portal. Retrieved from
NOAA Deep Sea Coral Data: https://deepseacoraldata.noaa.gov/
Northeast Regional Planning Body. (2018). Northeast Ocean Data Portal. Retrieved from
www.northeastoceandata.org
NYDOS. (2018). New York Geographic Information Gateway. Retrieved from New York
Department of State Office of Planning and Development:
http://opdgig.dos.ny.gov/#/home

68
Pelligrino, P., & Hubbard, W. (1983). Baseline shellfish data for the assessment of potential
environmental impacts associated with energy activities in Connecticut’s coastal zone:
volumes I & II. Hartford, CT: Report to the State of Connecticut. Department of
Agriculture, Aquaculture Division.
Reid, R. N., Frame, A. B., & Draxler, A. F. (1979). Environmental baselines in Long Island
Sound. 1972-1973. NOAA Technical Report. NMFS-SSRF738.
Stefaniak, L. M., Auster, P. J., & Babb, I. G. (2014). Loss of an erect sponge on a rock reef in
Long Island Sound (north-west Atlantic). Marine Biodiversity Records, 7, e115.
Theroux, R. B., & Wigley, R. L. (1998). Quantitative composition and distribution of the
macrobenthic invertebrate fauna of the continental shelf ecosystems of the northeastern
United States. US Dept of Commerce. NOAA Technical Report NMFS 140.
US EPA. (2015). National Coastal Condition Assessment 2010. US Environmental Protection
Agency, Office of Water and Office of Research and Development. Washington, DC:
EPA 841-R-15-006.
USGS. (2014, December 10). US Geological Survey Studies in Long Island Sound: Geology,
Contaminants, and Environmental Issues. Retrieved from Woods Hole Coastal and
Marine Science Center: https://woodshole.er.usgs.gov/project-pages/longislandsound/
Wigley, R. L., & Theroux, R. B. (1981). Atlantic continental shelf and slope of faunal
composition and quantitative distribution. US Geological Survey Professional Paper 529-
N.
Zajac, R. N. (2008). Challenges in marine, soft-sediment benthoscape ecology. Landscape
Ecology, 23, 7-18.
Zajac, R. N., Lewis, R. S., Poppe, L. J., Twichell, D. C., Vozarik, J., & DiGiacomo-Cohen, M. L.
(2000). Relationships among sea-floor structure and benthic communities in Long Island
Sound at regional and benthoscape scales. Journal of Coastal Research, 16, 627-640.
7.5 Appendices
7.5.1 List of Maps Used to Inform the Chapter
Data highlighted in grey are included in the Inventory and were discussed during expert
webinars. In addition to the links provided below, each grey dataset is accompanied by a
reference, citation, or link within the text in the Inventory.
The un-highlighted (white) data rows were also discussed during expert webinars. These data
were either identified in the Rapid Assessment or mentioned by experts as credible sources of
data that may not be relevant to the Blue Plan effort. Example reasons include the older age of
the dataset, limited overall availability, lack of spatial data products, too limited or too broad
spatial/temporal scope, or that other LIS datasets were preferred. Many of these un-highlighted
datasets are described in Section 7.3 Additional Context, and most are described further in the
map books associated with the expert webinars (CT DEEP, 2018).

69
CATEGORY DATASET/LAYER ADVANCED
FROM RAPID
ASSESSMENT
TO
INVENTORY
ADDED TO
INVENTORY
FROM
EXPERT
REVIEW
Benthic
invertebrates
Long Island Sound Cable Fund
epifauna and infauna data and
maps (Long Island Sound Cable Fund
Steering Committee, 2015)
X
Benthic
invertebrates
LISEA invertebrate species
richness, weighted persistence,
persistence areas (Anderson &
Frohling, 2015)
X
Benthic
invertebrates
Observed cold water corals (Mid-
Atlantic Regional Planning Body,
Mid-Atlantic Ocean Data Portal,
2018)
X
Benthic
invertebrates
NOAA Milford lab infaunal
community clusters data
Benthic
invertebrates
Benthic community data layers for
LIS: Zajac, Lewis, Poppe (USGS pub
and maps)
Benthic
invertebrates
EPA National Coastal Condition
Assessment data (US EPA, 2015)
Benthic
invertebrates
NYS DEC macroinvertebrate data
(e.g., lobster trap contents)
Benthic
invertebrates
LIS Integrated Coastal Observing
System: 45 year time series analysis
of benthic invertebrate (and other)
data; UConn Snyder thesis
7.5.2 Notes on Ecological Expert Input
Expert input was obtained on benthic invertebrate datasets primarily during the “Benthic
Biological Habitat” expert webinar, but also during the “Benthic Physical Habitat” expert
webinar. Map books for each webinar and links to webinar recordings can be found on the Long
Island Sound Blue Plan website (CT DEEP, 2018).
Habitats

70
Chapter 8. Coastal Wetlands
Chapter Table of Contents
8.1 Key Data and Map Products .................................................................................................. 70 8.2 Assessment of Data Quality ................................................................................................... 71
8.2.1 Sources of Data and Metadata ..................................................................................... 71 8.2.2 Accuracy, Representativeness, and Relevance of Map Products ................................. 71
8.2.3 Data Gaps and Availability of Data to Address Gaps .................................................. 72 8.3 Additional Context ................................................................................................................. 72 8.4 References .............................................................................................................................. 72 8.5 Appendices ............................................................................................................................. 73
8.5.1 List of Maps Used to Inform the Chapter ..................................................................... 73
8.5.2 Notes on Ecological Expert Input ................................................................................. 74
8.1 Key Data and Map Products
Because of their proximity to land, historical delineation on topographic maps, and visibility in
aerial photos, coastal wetlands have been mapped in Long Island Sound repeatedly through the
years. According to the first 130-year assessment of tidal wetland change for the entire Long
Island Sound area, there has been an overall 31% loss of tidal wetlands, 27% in Connecticut and
48% in New York (Basso, O'Brien, Albino Hegeman, & O'Neill, 2015). Coastal wetland loss can
be attributed to many factors, including coastal development, invasive species, pollution, and sea
level rise.
Coastal wetlands data relate to estuarine and marine marsh or wetland vegetation, and in some
cases, sensitive species found in those habitats. The datasets described below pertain to intertidal
and subtidal habitats, but may also relate to freshwater wetlands. Coastal wetlands are delineated
by two national datasets, a Connecticut dataset, and a New York dataset:
The NOAA ESI includes delineations of “intermittent coastal wetlands”, and
“rare/terrestrial/native” plants along all shorelines (NOAA ORR, 2018).
The NWI maps estuarine and marine wetlands (USFWS, 2018).
The Connecticut critical habitats dataset includes delineations of a subset of important wildlife
habitats identified in the Connecticut Comprehensive Wildlife Conservation Strategy, including
intertidal marsh (CT DEEP, 2009).
The NYS DEC tidal wetland areas data are derived from aerial infrared vertical photographs
obtained in 1974 (NYDEC, 1974).

71
Figure 1. Connecticut critical habitats. Map showing Connecticut critical habitats data,
including intertidal marsh, available in the Connecticut Aquaculture Mapping Atlas (CT DEEP,
2009) (UConn CLEAR, 2018).
8.2 Assessment of Data Quality
8.2.1 Sources of Data and Metadata
All of the coastal wetlands data and metadata can be accessed via the Connecticut Aquaculture
Mapping Atlas (UConn CLEAR, 2018), with the exception of the New York tidal wetlands area
data, which can be accessed and downloaded via the New York Geographic Information
Gateway (NYDOS, 2018).
The ESI and NWI data and metadata can also be downloaded directly from each project’s
website (NOAA ORR, 2018; USFWS, 2018). The Connecticut critical coastal habitats data and
metadata can be downloaded from the CT DEEP GIS page (CT DEEP, 2009).
8.2.2 Accuracy, Representativeness, and Relevance of Map Products
For example, the ESI data were developed specifically to support oil spill/disaster response, and
it and the NWI datasets pertain to areas larger than LIS (NOAA ORR, 2018; USFWS, 2018).

72
Therefore, those national datasets may not adequately represent the spatial and temporal
scale/variability within LIS. Furthermore, the ESI maps show areas where the most sensitive
species/habitats exist, and don’t necessarily show the entire area where a species/habitat exists
(NOAA ORR, 2018).
The metadata for the Connecticut critical habitats layer notes that there is variation in the
accuracy and completeness of each community type presented in the data (CT DEEP, 2009).
Lastly, the primary concern with accuracy and representativeness for the New York tidal
wetlands data is its age (i.e., > 40 years). Tidal wetland area has likely changed since this survey.
8.2.3 Data Gaps and Availability of Data to Address Gaps
There do not appear to be significant data gaps for coastal wetlands in the Long Island Sound
area.
8.3 Additional Context
The recent report on tidal marsh change in the Long Island Sound area provides excellent
additional context for this topic (Basso, O'Brien, Albino Hegeman, & O'Neill, 2015). This report
takes a historical perspective and uses maps of wetlands dating to the 1880s to analyze change
over time. There is also an extensive discussion of the strengths and weaknesses of each
wetlands dataset examined, for example, which areas of LIS may have been excluded in certain
surveys, and differences in thematic resolution between datasets (Basso, O'Brien, Albino
Hegeman, & O'Neill, 2015).
8.4 References
Basso, G., O'Brien, K., Albino Hegeman, M., & O'Neill, V. (2015). Status and trends of
wetlands in the Long Island Sound Area: 130 year assessment. US Department of the
Interior, Fish and Wildlife Service.
CT DEEP. (2009). Connecticut Critical Habitats. (D. o. State of Connecticut, Producer)
Retrieved from
http://www.cteco.uconn.edu/metadata/dep/document/CRITICAL_HABITAT_POLY_FG
DC_Plus.htm
CT DEEP. (2018, February 5). Long Island Sound Blue Plan Webinars. Retrieved from
Connecticut Department of Energy and Environmental Protection:
http://www.ct.gov/deep/cwp/view.asp?a=2705&q=593814&deepNav_GID=1635
NOAA ORR. (2018, February 5). Environmental Sensitivity Index (ESI) Maps. Retrieved from
NOAA Office of Response and Restoration: https://response.restoration.noaa.gov/maps-
and-spatial-data/environmental-sensitivity-index-esi-maps.html

73
NYDEC. (1974). DEC Tidal Wetland Areas. (N. Y. Conservation, Producer) Retrieved from
http://opdgig.dos.ny.gov/geoportal/catalog/search/resource/detailsnoheader.page?uuid=%
7bE8B21766-F7F6-49B0-8346-58E71A8B3DF8%7d
NYDOS. (2018). New York Geographic Information Gateway. Retrieved from New York
Department of State Office of Planning and Development:
http://opdgig.dos.ny.gov/#/home
UConn CLEAR. (2018, February 5). Connecticut Aquaculture Mapping Atlas. Retrieved from
UConn CLEAR, CT Sea Grant, CT DA/BA: https://clear3.uconn.edu/aquaculture/
USFWS. (2018, February 1). National Wetlands Inventory. Retrieved from US Fish and Wildlife
Service: https://www.fws.gov/wetlands/
8.5 Appendices
8.5.1 List of Maps Used to Inform the Chapter
Data highlighted in grey are included in the Inventory and were discussed during expert
webinars. In addition to the links provided below, each grey dataset is accompanied by a
reference, citation, or link within the text in the Inventory.
The un-highlighted (white) data rows were also discussed during expert webinars. These data
were either identified in the Rapid Assessment or mentioned by experts as credible sources of
data that may not be relevant to the Blue Plan effort. Example reasons include the older age of
the dataset, limited overall availability, lack of spatial data products, too limited or too broad
spatial/temporal scope, or that other LIS datasets were preferred. Many of these un-highlighted
datasets are described in Section 8.3 Additional Context, and most are described further in the
map books associated with the expert webinars (CT DEEP, 2018).
CATEGORY DATASET/LAYER ADVANCED
FROM RAPID
ASSESSMENT
TO
INVENTORY
ADDED TO
INVENTORY
FROM
EXPERT
REVIEW
Coastal
wetlands
NOAA ESI (NOAA ORR, 2018) X
Coastal
wetlands
Connecticut critical habitats (CT
DEEP, 2009) X
Coastal
wetlands
NY DEC Tidal wetland areas
(NYDEC, 1974) X
Coastal
wetlands
National Wetlands Inventory (NWI)
(USFWS, 2018) X
Coastal wetlands Northeast coastal wetlands, Northeast
Ocean Data Portal
Coastal wetlands NY DEC Regulatory tidal wetland
map index

74
8.5.2 Notes on Ecological Expert Input
Expert input was obtained on coastal wetlands data during the “Benthic Biological Habitat”
expert webinar. Map books for each webinar and links to webinar recordings can be found on the
Long Island Sound Blue Plan website (CT DEEP, 2018).

75
Chapter 9. Bathymetry and Seafloor Complexity
Chapter Table of Contents
9.1 Key Data and Map Products .................................................................................................. 75 9.2 Assessment of Data Quality ................................................................................................... 77
9.2.1 Sources of Data and Metadata ..................................................................................... 77 9.2.2 Accuracy, Representativeness, and Relevance of Map Products ................................. 78
9.2.3 Data Gaps and Availability of Data to Address Gaps .................................................. 78 9.3 Additional Context ................................................................................................................. 78 9.4 References .............................................................................................................................. 79 9.5 Appendices ............................................................................................................................. 79
9.5.1 List of Maps Used to Inform the Chapter ..................................................................... 79
9.5.2 Notes on Ecological Expert Input ................................................................................. 80
9.1 Key Data and Map Products
Bathymetry and seafloor complexity data provide information about the structure and shape of
subtidal habitats. Seafloor complexity metrics are often derived from bathymetry data, so these
datasets contain similar or overlapping information. Important factors to consider are spatial
coverage and resolution, which can present a trade-off: broad spatial coverage is usually
available at a coarser resolution than smaller patches of high-resolution data. Regardless,
seafloor complexity metrics (including measures like slope and ruggedness) are relatively
straightforward to generate from any existing bathymetry datasets. The following datasets relate
to bathymetry and seafloor complexity in LIS:
Table 1. Available data and some metadata for characterizing bathymetry and seafloor
complexity.
Dataset LIS coverage, resolution or type
NOAA National Ocean Service (NOS) hydrographic
survey data (NOAA NCEI, 2016)
Patchy, 0.5 – 2 m resolution
Mid-Atlantic region bathymetry (Mid-Atlantic
Regional Planning Body, Mid-Atlantic Ocean Data
Portal, 2018)
Full coverage, approx. 100 m
resolution
Long Island Sound Ecological Assessment (LISEA)
products (Anderson & Frohling, 2015)
Depth classes
Landscape Position Index
Slope
Standard deviation of slope (“bathymetric
complexity”)
Full coverage, 83 m resolution
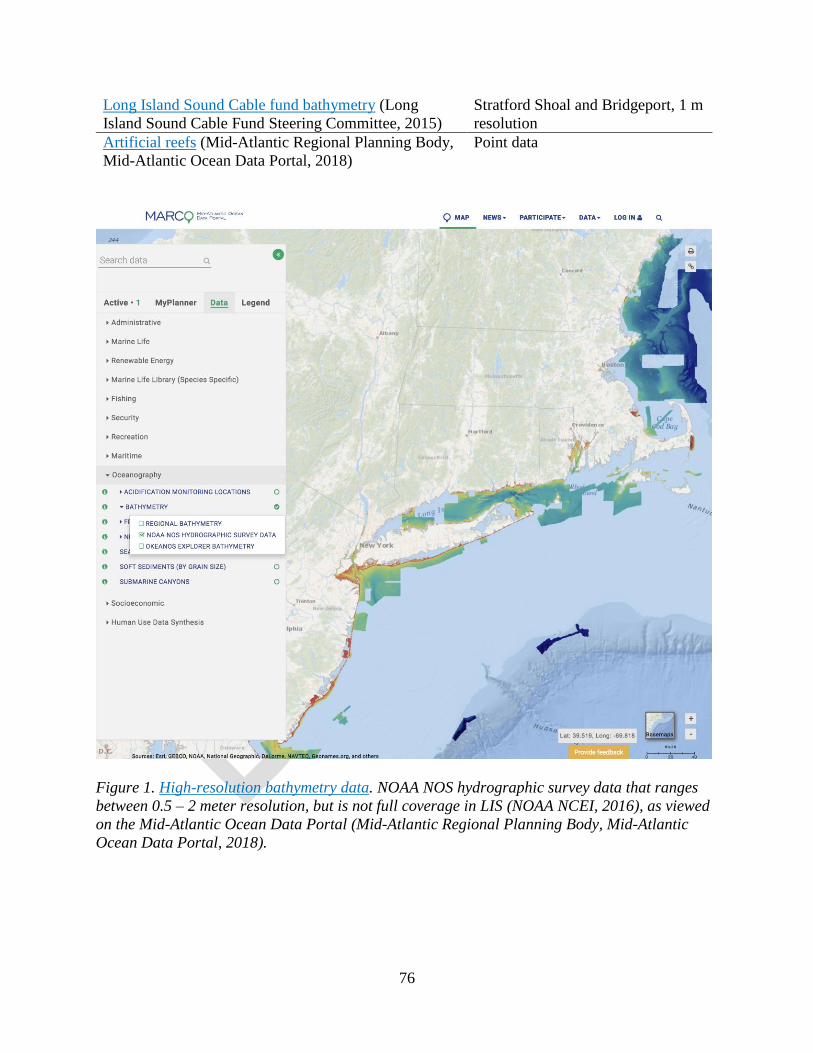
76
Long Island Sound Cable fund bathymetry (Long
Island Sound Cable Fund Steering Committee, 2015)
Stratford Shoal and Bridgeport, 1 m
resolution
Artificial reefs (Mid-Atlantic Regional Planning Body,
Mid-Atlantic Ocean Data Portal, 2018)
Point data
Figure 1. High-resolution bathymetry data. NOAA NOS hydrographic survey data that ranges
between 0.5 – 2 meter resolution, but is not full coverage in LIS (NOAA NCEI, 2016), as viewed
on the Mid-Atlantic Ocean Data Portal (Mid-Atlantic Regional Planning Body, Mid-Atlantic
Ocean Data Portal, 2018).

77
Figure 2. Lower-resolution bathymetry data. Mid-Atlantic regional bathymetry data with ~100
meter resolution and full coverage in LIS, as viewed on the Mid-Atlantic Ocean Data Portal
(Mid-Atlantic Regional Planning Body, 2018).
9.2 Assessment of Data Quality
9.2.1 Sources of Data and Metadata
The NOAA NOS hydrographic survey data, Mid-Atlantic region bathymetry data, and Artificial
reef data are all available, with metadata, on the Mid-Atlantic Ocean Data Portal (Mid-Atlantic
Regional Planning Body, Mid-Atlantic Ocean Data Portal, 2018).

78
All of the Long Island Sound Ecological Assessment (LISEA) data and map products are
available via the report and the GIS dataset is available from The Nature Conservancy via the
web link above (Anderson & Frohling, 2015).
9.2.2 Accuracy, Representativeness, and Relevance of Map Products
All of the bathymetry and seafloor complexity datasets described above are relevant to the Blue
Plan effort. The primary considerations for accuracy and representativeness for these datasets
relate to resolution, coverage, and scale. In general, bathymetry metadata include robust
estimates of instrumental and methodological accuracy, and each dataset’s documentation should
be consulted for that detailed information.
The finest resolution data are the NOAA NOS data (NOAA NCEI, 2016). Because the coverage
is patchy, these data aren’t representative of the entire LIS, but they are high-quality data.
The Cable Fund data are also very high resolution (1 m), but cover only very small parts of LIS
(Long Island Sound Cable Fund Steering Committee, 2015).
Both the Mid-Atlantic regional bathymetry data and the LISEA products are derived from the
NOAA Coastal Relief Model (CRM) and present full-coverage of LIS (NOAA NCEI, 1999).
The Mid-Atlantic regional bathymetry data integrates additional datasets in the region, and used
a lower overall resolution for the final product.
The LISEA products used the NOAA CRM data to develop derived products, all of which are
simple mathematical calculations based on a spatial assessment window. For example, the
Landscape Position Index search radius was 100 cells, or 8,300 m (Anderson & Frohling, 2015).
Users should be aware of the analytical steps and choices applied to the development of these
types of derived products.
9.2.3 Data Gaps and Availability of Data to Address Gaps
For the coarsest resolution datasets, there are no gaps in Long Island Sound. However, for the
finest resolution datasets, several gaps exist (see Figure 2). If an area of interest overlaps with
one of the gaps in high-resolution data, the lower resolution data could be used.
9.3 Additional Context
Depending on the intended use of bathymetry dataset, the age of the data should be considered.
For example, high resolution data will often reveal dynamic seafloor features that can be located
elsewhere or gone completely in subsequent surveys.

79
9.4 References
Anderson, M., & Frohling, N. (2015). The Long Island Sound Ecological Assessment. The
Nature Conservancy.
CT DEEP. (2018, February 5). Long Island Sound Blue Plan Webinars. Retrieved from
Connecticut Department of Energy and Environmental Protection:
http://www.ct.gov/deep/cwp/view.asp?a=2705&q=593814&deepNav_GID=1635
Long Island Sound Cable Fund Steering Committee. (2015). Seafloor mapping of Long Island
Sound - Final report: Phase 1 Pilot Project. Stamford, CT: US Environmental Protection
Agency Long Island Sound Study.
Mid-Atlantic Regional Planning Body. (2018). Mid-Atlantic Ocean Data Portal. Retrieved from
portal.midatlanticocean.org
NOAA NCEI. (1999). US Coastal Relief Model - Northeast Atlantic. Retrieved from NOAA
National Centers for Environmental Information:
https://www.ngdc.noaa.gov/mgg/coastal/grddas01/grddas01.htm
NOAA NCEI. (2016). NOS Hydrographic Surveys Collection. Retrieved from NOAA National
Centers for Environmental Information:
https://www.ngdc.noaa.gov/docucomp/page?xml=NOAA/NESDIS/NGDC/Collection/iso
/xml/NOS_Hydrographic_Survey_Collection.xml&view=xml2text/xml-to-text-ISO
9.5 Appendices
9.5.1 List of Maps Used to Inform the Chapter
Data highlighted in grey are included in the Inventory and were discussed during expert
webinars. In addition to the links provided below, each grey dataset is accompanied by a
reference, citation, or link within the text in the Inventory.
The un-highlighted (white) data rows were also discussed during expert webinars. These data
were either identified in the Rapid Assessment or mentioned by experts as credible sources of
data that may not be relevant to the Blue Plan effort. Example reasons include the older age of
the dataset, limited overall availability, lack of spatial data products, too limited or too broad
spatial/temporal scope, or that other LIS datasets were preferred. Many of these un-highlighted
datasets are described in Section 9.3 Additional Context, and most are described further in the
map books associated with the expert webinars (CT DEEP, 2018).
CATEGORY DATASET/LAYER ADVANCED
FROM RAPID
ASSESSMENT
TO
INVENTORY
ADDED TO
INVENTORY
FROM
EXPERT
REVIEW
Bathymetry and
seafloor
complexity
NOAA National Ocean Service
(NOS) hydrographic survey data (NOAA NCEI, 2016)
X

80
CATEGORY DATASET/LAYER ADVANCED
FROM RAPID
ASSESSMENT
TO
INVENTORY
ADDED TO
INVENTORY
FROM
EXPERT
REVIEW
Bathymetry and
seafloor
complexity
Mid-Atlantic region bathymetry (Mid-Atlantic Regional Planning
Body, Mid-Atlantic Ocean Data
Portal, 2018)
X
Bathymetry and
seafloor
complexity
LISEA depth classes, seafloor
complexity, hard bottom areas,
seafloor complexity components,
slope, seabed forms, seafloor
structure (Anderson & Frohling,
2015)
X
Bathymetry and
seafloor
complexity
Artificial reefs (Mid-Atlantic
Regional Planning Body, Mid-
Atlantic Ocean Data Portal, 2018)
X
Bathymetry and
seafloor
complexity
High resolution bathymetry from
LIS cable fund studies (Long Island
Sound Cable Fund Steering
Committee, 2015)
X
9.5.2 Notes on Ecological Expert Input
Expert input was obtained on bathymetry and seafloor complexity datasets during the “Benthic
Physical Habitat” expert webinar. Map books for each webinar and links to webinar recordings
can be found on the Long Island Sound Blue Plan website (CT DEEP, 2018).

81
Chapter 10. Sediments and Geochemistry
Chapter Table of Contents
10.1 Key Data and Map Products ................................................................................................ 81 10.2 Assessment of Data Quality ................................................................................................. 84
10.2.1 Sources of Data and Metadata ................................................................................... 84 10.2.2 Accuracy, Representativeness, and Relevance of Map Products ............................... 85
10.2.3 Data Gaps and Availability of Data to Address Gaps ................................................ 85 10.3 Additional Context ............................................................................................................... 85 10.4 References ............................................................................................................................ 85 10.5 Appendices ........................................................................................................................... 86
10.5.1 List of Maps Used to Inform the Chapter ................................................................... 86
10.5.2 Notes on Ecological Expert Input ............................................................................... 88
10.1 Key Data and Map Products
Datasets relevant to sediment and geochemistry include raw data from sampling points as well as
some interpreted map products (i.e., polygons) in LIS. The sediments and geochemistry of LIS
are well-studied and there is data available for most of the entire Sound.
Because of the quantity of data, each source is described in Table 1. Briefly, two types of data
are listed: sediment grain size data and geochemistry data. Sediment grain size data include
sediment classifications for point data and interpreted polygons depicting the composition of
sediments. There is also a USGS foraminifera dataset included because these data are obtained
from sediment samples, and their distribution and abundance in sediments indicates
environmental conditions (Thomas, Gapotchenko, Varekamp, Mecray, & Buchholtz ten Brink,
2000). Geochemical parameters include naturally occurring and contaminant compounds. For
example, most projects measure total organic carbon and metals concentrations together as a way
to assess contaminant bioavailability.
Table 1. Available data and some metadata for characterizing sediment grain size and
geochemistry
Dataset LIS coverage, resolution or type
SEDIMENT GRAIN SIZE DATA
NOAA Environmental Sensitivity Index (ESI) shoreline
type (NOAA ORR, 2018)
e.g., exposed rocky shore, gravel beach, sheltered tidal
flat
CT and NY shore, polygons
LIS Cable Fund samples (Long Island Sound Cable Fund
Steering Committee, 2015)
% gravel
Stratford Shoal

82
Dataset LIS coverage, resolution or type
% mud
% sand
sediment matrix density
Texture – Folk classification
Texture – Shepard classification
USGS post glacial deposit sediment thickness
(DiGiacomo-Cohen & Lewis, 2000)
Full coverage
USGS foraminifera samples (Thomas, Gapotchenko,
Varekamp, Mecray, & Buchholtz ten Brink, 2000)
Transects, point data
USGS sediment samples (Poppe, Knebel, Seekins, &
Hastings, 2000)
Full coverage, point data
USGS sediment polygon maps (Poppe, Knebel, Seekins,
& Hastings, 2000)
Full coverage, polygon
Long Island Sound Ecological Assessment (LISEA)
(Anderson & Frohling, 2015)
Sediment thresholds – determined by benthic
community structure
Hard bottom locations
Soft sediment maps
Seabed forms
Full coverage
USGS/NOAA backscatter interpretations (USGS, 2014) Patchy
LIS Cable Fund ecognition acoustic patches (Long Island
Sound Cable Fund Steering Committee, 2015)
Stratford Shoal
GEOCHEMISTRY
LIS Cable Fund samples (Long Island Sound Cable Fund
Steering Committee, 2015)
% carbon
% nitrogen
Copper concentration
Zinc concentration
Lead concentration
Stratford Shoal
USGS chemical and contaminant data (Mecray,
Buchholz ten Brink, & Shah, 2000)
Total organic carbon, trace metals (Ag, Ba, Cd, Cr, Cu,
Hg, Ni, Pb, V, Zn and Zr), major metals (Al, Fe, Mn, Ca,
and Ti), mercury
Full coverage, point data
EPA National Coastal Condition Assessment (NCCA) –
1999-2001/2004-2006, 2010 (US EPA, 2015)
National coverage, point data

83
Dataset LIS coverage, resolution or type
Total organic carbon
Metals concentration
Mercury concentration
PAHs concentration
PCBs concentration
Organochlorine pesticides concentration
Sediment toxicity (survival of amphipods)
Sediment quality index
NOAA National Status and Trends (NS&T) (Wolfe,
Bricker, Long, John Scott, & Thursby, 1994)
Sediment toxicity (amphipods, clam larvae, microbial
bioluminescence)
Heavy metals
PAHs
PCBs
Chlorinated pesticides
Primarily coastal bays of LIS,
point data (most recent data is
1996)
Metals, organic compounds, and nutrients in Long Island
Sound: Sources, magnitudes, trends, and impacts. In:
Long Island Sound: Prospects for the Urban Sea
(Varekamp, McElroy, Mullaney, & Breslin, 2014)
Full coverage, includes maps and
analyses of USGS, NCCA, NS&T,
and other datasets
Figure 1. Surficial sediments of Long Island Sound. This map appears in (Poppe, Knebel,
Seekins, & Hastings, 2000) and in the Long Island Sound Thematic Section of the Journal of
Coastal Research (Poppe, Knebel, Mlodzinska, Hastings, & Seekins, 2000).

84
Figure 2. Lead concentrations in the sediments of LIS. This map appears in (Mecray, Buchholz
ten Brink, & Shah, 2000) and in the Long Island Sound Thematic Section of the Journal of
Coastal Research (Mecray & Buchholz ten Brink, 2000).
10.2 Assessment of Data Quality
10.2.1 Sources of Data and Metadata
All of the data in Table 1 are available on the web for download, viewing, or both.
NOAA ESI data are downloadable from the ESI website and viewable on the CT Aquaculture
Mapping Atlas (UConn CLEAR, 2018).
The LIS Cable Fund sediment data are downloadable from the Long Island Sound Study
repository (Long Island Sound Cable Fund Steering Committee, 2015).
All USGS data are available for download from their Studies in Long Island Sound page (USGS,
2014), and many are visible as maps in the New York Geographic Information Gateway
(NYDOS, 2018).
EPA NCCA and NOAA NS&T data are each downloadable from the web. The EPA NCCA data
can be downloaded by survey (“coastal”) and by indicator (“sediment chemistry” and “sediment
toxicity”). The NOAA NS&T data can be downloaded by geographic location, specific to Long
Island Sound (Wolfe, Bricker, Long, John Scott, & Thursby, 1994).
All of the Long Island Sound Ecological Assessment (LISEA) data and map products are
available via the report and the GIS dataset is available from The Nature Conservancy via the
web link above (Anderson & Frohling, 2015).

85
10.2.2 Accuracy, Representativeness, and Relevance of Map Products
All of the sediment and geochemistry data described above are relevant to LIS. Because many of
these data and products are comprehensive in their coverage of LIS, they can be considered to be
representative as well. Exceptions would be the Cable Fund data which are only pertinent to the
Stratford Shoal area.
Two additional considerations for accuracy and representativeness of these data would be age
and scale. Some of the geochemistry data are on the order of decades old, and the concentration
and/or bioavailability of some contaminants may have changed since they were last measured.
Relative to scale, some of these data (e.g., USGS sediment polygon maps, Figure 1) may have
been drawn at scales broader than the finest scales of sediment heterogeneity, and so do not
adequately represent very fine-scale features.
10.2.3 Data Gaps and Availability of Data to Address Gaps
Overall there are no comprehensive data gaps in sediment and geochemistry data for Long Island
Sound. If an area of interest overlaps with one of the gaps in the finest-resolution data, the lower
resolution data could be used.
10.3 Additional Context
The full coverage, “interpretive” maps were developed using different approaches to extrapolate
point data and other information into broad-scale features covering LIS. For example, the USGS
sediment polygons were interpreted using a combination of geophysical data (e.g., bathymetry,
backscatter) and grain size samples, whereas the thresholds between sediment types in the
LISEA data were determined from benthic community analysis of 1,321 benthic grab samples
(see Chapter 12 for more information). These differences in methodology could affect
interpretation and application, and so they should be understood and considered by potential
users.
10.4 References
Anderson, M., & Frohling, N. (2015). The Long Island Sound Ecological Assessment. The
Nature Conservancy.
CT DEEP. (2018, February 5). Long Island Sound Blue Plan Webinars. Retrieved from
Connecticut Department of Energy and Environmental Protection:
http://www.ct.gov/deep/cwp/view.asp?a=2705&q=593814&deepNav_GID=1635
DiGiacomo-Cohen, M. L., & Lewis, R. S. (2000). Chapter 1: MAPS SHOWING THE SHAPE
OF THE MARINE TRANSGRESSIVE SURFACE AND THE THICKNESS OF
POSTGLACIAL SEDIMENTS IN LONG ISLAND SOUND. In V. F. Paskevich, & L. J.
Poppe, Georeferenced seafloor mapping and bottom photography in Long Island Sound.
Woods Hole, MA: USGS Open ile Report 00-304.

86
Long Island Sound Cable Fund Steering Committee. (2015). Seafloor mapping of Long Island
Sound - Final report: Phase 1 Pilot Project. Stamford, CT: US Environmental Protection
Agency Long Island Sound Study.
Mecray, E. L., & Buchholz ten Brink, M. R. (2000). Contaminant distribution and accumulation
in the surface sediments of Long Island Sound. Journal of Coastal Research, 16(3), 575-
590.
Mecray, E. L., Buchholz ten Brink, M. R., & Shah, S. (2000). METALS IN THE SURFACE
SEDIMENTS OF LONG ISLAND SOUND. In V. F. Paskevich, & L. J. Poppe,
Georeferenced seafloor mapping and bottom photography in Long Island Sound. Woods
Hole, MA: USGS Open File Report 00-304.
NOAA ORR. (2018, February 5). Environmental Sensitivity Index (ESI) Maps. Retrieved from
NOAA Office of Response and Restoration: https://response.restoration.noaa.gov/maps-
and-spatial-data/environmental-sensitivity-index-esi-maps.html
NYDOS. (2018). New York Geographic Information Gateway. Retrieved from New York
Department of State Office of Planning and Development:
http://opdgig.dos.ny.gov/#/home
Poppe, L. J., Knebel, H. J., Mlodzinska, Z. J., Hastings, M. E., & Seekins, B. A. (2000).
Distribution of surficial sediment in Long Island Sound and adjacent waters: Texture and
total organic carbon. Journal of Coastal Research, 16(3), 567-574.
Poppe, L. J., Knebel, H. J., Seekins, B. A., & Hastings, M. E. (2000). MAP SHOWING THE
DISTRIBUTION OF SURFICIAL SEDIMENTS IN LONG ISLAND SOUND. In V. F.
Paskevich, & L. J. Poppe, Georeferenced seafloor mapping and bottom photography in
Long Island Sound. Woods Hole, MA: USGS Open File Report 00-304.
10.5 Appendices
10.5.1 List of Maps Used to Inform the Chapter
Data highlighted in grey are included in the Inventory and were discussed during expert
webinars. In addition to the links provided below, each grey dataset is accompanied by a
reference, citation, or link within the text in the Inventory.
The un-highlighted (white) data rows were also discussed during expert webinars. These data
were either identified in the Rapid Assessment or mentioned by experts as credible sources of
data that may not be relevant to the Blue Plan effort. Example reasons include the older age of
the dataset, limited overall availability, lack of spatial data products, too limited or too broad
spatial/temporal scope, or that other LIS datasets were preferred. Many of these un-highlighted
datasets are described in Section 10.3 Additional Context, and most are described further in the
map books associated with the expert webinars (CT DEEP, 2018).

87
CATEGORY DATASET/LAYER ADVANCED
FROM RAPID
ASSESSMENT
TO
INVENTORY
ADDED TO
INVENTORY
FROM
EXPERT
REVIEW
Sediments and
geochemistry
NOAA Environmental Sensitivity
Index (ESI) shoreline type (NOAA
ORR, 2018)
X
Sediments and
geochemistry
LIS Cable Fund samples (Long
Island Sound Cable Fund Steering
Committee, 2015)
X
Sediments and
geochemistry
USGS post glacial deposit sediment
thickness (DiGiacomo-Cohen &
Lewis, 2000)
X
Sediments and
geochemistry
USGS foraminifera samples (Thomas, Gapotchenko, Varekamp,
Mecray, & Buchholtz ten Brink, 2000)
X
Sediments and
geochemistry
USGS sediment samples (Poppe,
Knebel, Seekins, & Hastings, 2000) X
Sediments and
geochemistry
USGS sediment polygon maps (Poppe, Knebel, Seekins, & Hastings,
2000)
X
Sediments and
geochemistry
Long Island Sound Ecological
Assessment (LISEA) sediment
thresholds, hard bottom locations
soft sediment maps, seabed forms
(Anderson & Frohling, 2015)
X
Sediments and
geochemistry
LIS Cable Fund ecognition acoustic
patches (Long Island Sound Cable
Fund Steering Committee, 2015)
X
Sediments and
geochemistry
USGS/NOAA backscatter
interpretations (USGS, 2014) X
Sediments and
geochemistry
EPA National Coastal Condition
Assessment (NCCA) (US EPA, 2015) X
Sediments and
geochemistry
NOAA National Status and Trends
(NS&T) (Wolfe, Bricker, Long, John
Scott, & Thursby, 1994)
X
Sediments and
geochemistry
LIS Prospects for the Urban Sea –
chapter on organic contaminants
(Varekamp, McElroy, Mullaney, &
Breslin, 2014)
X
Sediments and
geochemistry
Journal of Coastal Research special
volume on LIS, organic contaminants
Sediments and
geochemistry
U.S. Department of Agriculture
(USDA) Natural Resources

88
CATEGORY DATASET/LAYER ADVANCED
FROM RAPID
ASSESSMENT
TO
INVENTORY
ADDED TO
INVENTORY
FROM
EXPERT
REVIEW
Conservation Service (NRCS)
subaqueous soils dataset
Sediments and
geochemistry
usSEABED Atlantic Coast Offshore
Surficial Sediment database
Sediments and
geochemistry
TNC Northwest Atlantic Marine
Ecoregional Assessment, soft
sediments by grain size, seafloor
habitats
10.5.2 Notes on Ecological Expert Input
Expert input was obtained on sediments and geochemistry datasets primarily during the “Benthic
Physical Habitat” expert webinar. Map books for each webinar and links to webinar recordings
can be found on the Long Island Sound Blue Plan website (CT DEEP, 2018).

89
Chapter 11. Physical Oceanography, Meteorology, and Water Quality
Chapter Table of Contents
11.1 Key Data and Map Products ................................................................................................ 89 11.2 Assessment of Data Quality ................................................................................................. 92
11.2.1 Sources of Data and Metadata ................................................................................... 92 11.2.2 Accuracy, Representativeness, and Relevance of Map Products ............................... 92
11.2.3 Data Gaps and Availability of Data to Address Gaps ................................................ 93 11.3 Additional Context ............................................................................................................... 93 11.4 References ............................................................................................................................ 93 11.5 Appendices ........................................................................................................................... 95
11.5.1 List of Maps Used to Inform the Chapter ................................................................... 95
11.5.2 Notes on Ecological Expert Input ............................................................................... 97
11.1 Key Data and Map Products
Physical processes in LIS influence water quality, geochemistry, and ecology. Chapter 3 in Long
Island Sound: Prospects for the Urban Sea, “The physical oceanography of Long Island Sound”,
provides a comprehensive overview, including several maps, of physical oceanographic
processes in LIS (O'Donnell, et al., 2014).
In this chapter, three main data types are discussed: 1) continuous maps of
oceanographic/meteorological variables; 2) water quality monitoring data; and 3) water quality
management units or areas.
Oceanographic/meteorological variables
There are several existing continuous maps of oceanography and meteorological variables with
coverage in LIS that are derived from regional- or broader-scale datasets (e.g., satellite data)
and/or models. Many of these products represent long-term averages of seasonal patterns, annual
patterns, or longer. One exception is for sea surface temperature front products that represent a
single season of data in a single year (Rutgers University, 2016).
Sea surface temperature – long-term average (spring, summer, fall, winter) (NOAA
NCCOS, 2014)
Water column stratification – long-term average (spring, summer, fall, winter) (NOAA
NCCOS, 2014)
Turbidity – long-term average (spring, summer, fall, winter) (NOAA NCCOS, 2014)
Sea surface temperature fronts – 2012, 2013 maximum (spring, summer, fall winter)
(Rutgers University, 2016)

90
Surface and bottom current speed – long-term average (Northeast Ocean Data Portal,
2016)
Ocean wave resource potential (Electric Power Resource Institute, 2014)
Tidal stream resource potential – mean current and mean power density (USDOE, 2014)
Annual mean offshore wind speed – long-term average (Schwartz, Heimiller, Haymes, &
Musial, 2010)
Water quality monitoring data
The authoritative source for water quality monitoring data in the Sound is the CT DEEP Long
Island Sound Water Quality Monitoring Program (CT DEEP, 2017). The program was
established in 1994 with 48 permanent sampling stations to monitor hypoxia during the summer
months of June, July, August, and September. There are currently 47 active stations. Seventeen
stations are also sampled year-round as part of the monthly water quality monitoring program.
Originally sampling was aimed at evaluating the effects of dissolved oxygen concentrations on
fish abundance and determining the temporal and spatial extent of hypoxia (Figure 1). Sampling
stations were selected randomly with more sites concentrated in the western Sound where
hypoxia was generally more severe. Variables measured as a part of this program are listed in
Table 1.
Table 1. Variables measured as part of the CT DEEP Long Island Sound Water Quality
Monitoring Program. * = surface and bottom measurements.
Variable type Measurement
In-situ Dissolved oxygen (% saturation)*
Temperature*
Salinity*
Conductivity
Depth
Photosynthetic Active Radiation
Chemical Dissolved silica*
Particulate silica*
Particulate carbon
Dissolved inorganic carbon
Dissolved nitrogen*
Particulate nitrogen*
Ammonia
Nitrate
Nitrite
Particulate phosphorus
Total dissolved phosphorus
Orthophosphate
Chlorophyll-a*

91
Variable type Measurement
Total suspended solids*
Winkler DO
Biological Biological Oxygen Demand
Zooplankton
Phytoplankton
Phytoplankton photopigments via HPLC
The University of Connecticut, Department of Marine Sciences, also maintains a network of
additional Monitoring Your Sound (MYSound) monitoring buoys to provide comprehensive,
real-time water quality, weather and wave data from Long Island Sound, its harbors and estuaries
(UConn, 2018).
Figure 1. Frequency of hypoxia in Long Island Sound over a 21-year span. This map was
developed from CT DEEP Long Island Sound Water Quality Monitoring Program data (CT
DEEP, 2017).
Water quality management units and areas
The third type of water quality information is conveyed via maps of management units or areas.
This information is developed and maintained by the US EPA and includes impaired rivers or
coastline, impaired water bodies, Total Maximum Daily Load (TMDL) rivers or coastline,
TMDL water bodies, and wastewater discharges (USEPA Office of Water, 2015). An additional
92
layer showing no discharge zones in the Northeast region was developed and is maintained by
the Northeast Ocean Data Portal (Northeast Ocean Data Portal, 2014).
11.2 Assessment of Data Quality
11.2.1 Sources of Data and Metadata
Oceanographic/meteorological variables
All of the Oceanographic/meteorological variables are available for viewing and as web services
on the New York Geographic Information Gateway (NYDOS, 2018), the Northeast Ocean Data
Portal (Northeast Regional Planning Body, Northeast Ocean Data Portal, 2018), and the Mid-
Atlantic Ocean Data Portal (Mid-Atlantic Regional Planning Body, Mid-Atlantic Ocean Data
Portal, 2018) (each hyperlink opens a map of all variables available on each portal).
Water quality monitoring data
Water quality data are available directly from CT DEEP (CT DEEP, 2017). On the CT DEEP
Long Island Sound Water Quality Monitoring Program and Information website, several data
products are viewable, including a map of sampling stations, summer hypoxia maps for each
year from 1991-2017, and graphs of surface/bottom temperature. The website also contains fact
sheets on water quality monitoring, hypoxia, zooplankton, and phytoplankton.
Water quality data are posted real-time to the MYSound website as “provisional”, and longer
term and historical data are available to download via FTP (UConn, 2018).
Water quality management units and areas
All of the water quality management units and areas datasets are visible on the Northeast Ocean
Data Portal (Northeast Regional Planning Body, 2018).
11.2.2 Accuracy, Representativeness, and Relevance of Map Products
All of the datasets described above are relevant to the Blue Plan effort. The accuracy and
representativeness of each dataset differs depending on the purpose of the data collection and
analysis efforts. It is important to understand the underlying scale of each set of observations
because these datasets inherently vary on multiple spatial and temporal scales.
Spatial representation is good, with all products having full coverage of LIS. However, several of
the datasets pertain to areas larger than LIS (e.g., the oceanographic and meteorological data),
and may not accurately represent the spatial variability within LIS.
Temporal representation is also good in the underlying raw data, e.g., there are multi-decade
records of water quality variables readily available. However, some of the existing map products

93
represent discrete time periods in the form of seasonal or annual long-term averages. These
products may not accurately represent the temporal variability within LIS.
Lastly, some of the available maps use underlying datasets that do not represent or integrate the
most current information available (e.g., the hypoxia map shown in Figure 1 is 5 years old).
11.2.3 Data Gaps and Availability of Data to Address Gaps
Overall, there are no major gaps in the coverage and extent of physical oceanography and water
quality data in Long Island Sound.
However, according to some expert input, there may be gaps within the suite of existing
completed map products that use these data. The existing map products have been developed for
specific purposes (e.g., to support monitoring and management of hypoxia conditions), and may
not reflect all of the needs of the Blue Plan effort. For example, the maps of oceanographic
variables are regional in scale (i.e., broader than LIS) and do not adequately represent fine-scale
patterns in LIS. Experts indicated that they would prefer maps scaled-down to LIS. To address
these types of gaps, the CT DEEP Long Island Sound Water Quality Monitoring data could be
used to map these variables (e.g., temperature) on spatial and temporal scales more appropriate
to LIS and the Blue Plan effort.
11.3 Additional Context
Water quality characteristics drive patterns in LIS habitats, organisms, and their variability in
space and time. It could be useful to examine spatial and temporal patterns in the biology and
habitats of LIS to determine the scale(s) useful for portraying physical oceanography,
meteorology, and water quality parameters.
Long-term records in oceanographic, meteorological, and water quality data likely reflect the
changing climate. These patterns, and climate in general as a driver, should also be considered
when interpreting the available data or developing new map products.
11.4 References
CT DEEP. (2017, May 2). Long Island Sound Water Quality Monitoring Program and
Information. Retrieved Feb 5, 2018, from Connecticut Department of Energy and
Environmental Protection:
http://www.ct.gov/deep/cwp/view.asp?a=2719&q=325570&deepNav_GID=1635
CT DEEP. (2018, February 5). Long Island Sound Blue Plan Webinars. Retrieved from
Connecticut Department of Energy and Environmental Protection:
http://www.ct.gov/deep/cwp/view.asp?a=2705&q=593814&deepNav_GID=1635
Electric Power Resource Institute. (2014). Ocean wave resource potential. Retrieved from
NYGIG metadata:

94
http://opdgig.dos.ny.gov/geoportal/catalog/search/resource/detailsnoheader.page?uuid=%
7b052C3538-9155-4095-9975-C06B5550093C%7d
Mid-Atlantic Regional Planning Body. (2018). Mid-Atlantic Ocean Data Portal. Retrieved from
portal.midatlanticocean.org
NOAA NCCOS. (2014). Sea surface temperature - long-term average. Retrieved from NYGIG
metadata:
http://opdgig.dos.ny.gov/geoportal/catalog/search/resource/detailsnoheader.page?uuid=%
7b4B45E078-63D1-478D-A165-CBE3DCB14ED9%7d
NOAA NCCOS. (2014). Turbidity - Long-term average. Retrieved from NYGIG metadata:
http://opdgig.dos.ny.gov/geoportal/catalog/search/resource/detailsnoheader.page?uuid={0
7288051-B16F-4CE9-A6EA-76F9D276DB8C}
NOAA NCCOS. (2014). Water column stratification - Long-term average. Retrieved from
NYGIG metadata:
http://opdgig.dos.ny.gov/geoportal/catalog/search/resource/detailsnoheader.page?uuid=%
7b3646B9FF-5F1E-407A-89C7-412740C1B3D8%7d
Northeast Ocean Data Portal. (2014). No Discharge Zones. Retrieved from Northeast Ocean
Data Portal metadata:
http://www.northeastoceandata.org/files/metadata/Themes/WaterQuality/NoDischargeZo
nes.pdf
Northeast Ocean Data Portal. (2016). FVCOM Annual Climatology for Temperature,
Stratification, and Currents (1978-2013) Northeast United States. Retrieved from
Northeast Ocean Data Portal metadata:
http://www.northeastoceandata.org/files/metadata/Themes/Habitat/FVCOMAnnualClima
tology.pdf
Northeast Regional Planning Body. (2018). Northeast Ocean Data Portal. Retrieved from
www.northeastoceandata.org
NYDOS. (2018). New York Geographic Information Gateway. Retrieved from New York
Department of State Office of Planning and Development:
http://opdgig.dos.ny.gov/#/home
O'Donnell, J., Wilson, R. E., Lwiza, K., Whitney, M., Frank Bohlen, W., Codiga, D., . . .
Varekamp, J. (2014). The physical oceanography of Long Island Sound. In J. S. Latimer,
M. A. Tedesco, R. Lawrence Swanson, C. Yarish, P. E. Stacey, & C. Garza, Long Island
Sound: Prospects for the urban sea (p. 558). New York: Springer.
Rutgers University. (2016). Fronts: Seasonal max values. Retrieved from Mid-Atlantic Ocean
Data Portal Metadata:
http://portal.midatlanticocean.org/static/data_manager/metadata/html/Fronts_SeasonalMa
x.html
Schwartz, M., Heimiller, D., Haymes, S., & Musial, W. (2010). Assessment of offshore wind
energy resources for the United States. NREL Technical Report TP-500-45889.
UConn. (2018). Monitoring Your Sound. Retrieved from University of Connecticut Department
of Marine Sciences: http://www.mysound.uconn.edu/index.html
USDOE. (2014). Tidal stream resource potential - mean current. Retrieved from NYGIG
metadata:
http://opdgig.dos.ny.gov/geoportal/catalog/search/resource/detailsnoheader.page?uuid=%
7b286FAA27-CF09-475A-A608-9AABA22D80C7%7d

95
USEPA Office of Water. (2015). TMDLs on impaired waters NHDPlus indexed dataset; 303(d)
Listed impaired waters NHDPlus indexed dataset; Wastewater discharges. Retrieved
from EPA EDG:
https://edg.epa.gov/metadata/catalog/search/resource/details.page?uuid=%7B88E53742-
CF0D-443C-94AF-8139C09471F9%7D
11.5 Appendices
11.5.1 List of Maps Used to Inform the Chapter
Data highlighted in grey are included in the Inventory and were discussed during expert
webinars. In addition to the links provided below, each grey dataset is accompanied by a
reference, citation, or link within the text in the Inventory.
The un-highlighted (white) data rows were also discussed during expert webinars. These data
were either identified in the Rapid Assessment or mentioned by experts as credible sources of
data that may not be relevant to the Blue Plan effort. Example reasons include the older age of
the dataset, limited overall availability, lack of spatial data products, too limited or too broad
spatial/temporal scope, or that other LIS datasets were preferred. Many of these un-highlighted
datasets are described in Section 11.3 Additional Context, and most are described further in the
map books associated with the expert webinars (CT DEEP, 2018).
CATEGORY DATASET/LAYER ADVANCED
FROM RAPID
ASSESSMENT
TO
INVENTORY
ADDED TO
INVENTORY
FROM
EXPERT
REVIEW
Physical
oceanography,
including water
quality and
meteorology
CT DEEP Water quality
monitoring program data (CT
DEEP, 2017)
X
Physical
oceanography,
including water
quality and
meteorology
CT DEEP Hypoxia frequency 1991-
2012 (CT DEEP, 2017) X
Physical
oceanography,
including water
quality and
meteorology
Sea surface temperature,
stratification, and turbidity: long-
term average (spring, summer, fall,
winter) (NOAA NCCOS, 2014)
(NOAA NCCOS, 2014) (NOAA
NCCOS, 2014)
X
Physical
oceanography,
including water
Sea surface temperature fronts,
season max (Rutgers University,
2016)
X

96
CATEGORY DATASET/LAYER ADVANCED
FROM RAPID
ASSESSMENT
TO
INVENTORY
ADDED TO
INVENTORY
FROM
EXPERT
REVIEW
quality and
meteorology
Physical
oceanography,
including water
quality and
meteorology
Surface and bottom current speed,
long-term average (Northeast Ocean
Data Portal, 2016)
X
Physical
oceanography,
including water
quality and
meteorology
Ocean wave resource potential
(Electric Power Resource Institute,
2014)
X
Physical
oceanography,
including water
quality and
meteorology
Tidal stream resource potential,
mean current and mean power
density (USDOE, 2014)
X
Physical
oceanography,
including water
quality and
meteorology
Annual mean offshore wind speed
(Schwartz, Heimiller, Haymes, &
Musial, 2010)
X
Physical
oceanography,
including water
quality and
meteorology
Impaired rivers or coastline,
Impaired water bodies, TMDL
rivers or coastline, TMDL water
bodies, Wastewater discharges
(USEPA Office of Water, 2015)
X
Physical
oceanography,
including water
quality and
meteorology
No discharge zones (Northeast
Ocean Data Portal, 2014)
Physical
oceanography,
including water
quality and
meteorology
CT DEEP Water quality and
hypoxia maps (CT DEEP, 2017) X
Physical
oceanography,
including water
CT DEEP Water quality summary
in LIS Prospects for the Urban Sea
(O'Donnell, et al., 2014)
X

97
CATEGORY DATASET/LAYER ADVANCED
FROM RAPID
ASSESSMENT
TO
INVENTORY
ADDED TO
INVENTORY
FROM
EXPERT
REVIEW
quality and
meteorology
Physical
oceanography,
including water
quality and
meteorology
Bottom stress: UConn, O’Donnell
Physical
oceanography,
including water
quality and
meteorology
Capriulo et al. 2002. The planktonic
food web structure of a temperate
zone estuary, and its alteration due to
eutrophication. Hydrobiologia
475/476: 263-333.
11.5.2 Notes on Ecological Expert Input
Because of the importance of this topic to both physical and biological processes in LIS, expert
input was obtained on physical oceanography, meteorology, and water quality datasets during the
“Benthic Physical Habitat” and “Benthic Biological Habitat” expert webinars. Map books for
each webinar and links to webinar recordings can be found on the Long Island Sound Blue Plan
website (CT DEEP, 2018).
98
Chapter 12. Ecologically Notable Places and Ecological Marine Units
Chapter Table of Contents
12.1 Key Data and Map Products ................................................................................................ 98 12.2 Assessment of Data Quality ............................................................................................... 100
12.2.1 Sources of Data and Metadata ................................................................................. 100 12.2.2 Accuracy, Representativeness, and Relevance of Map Products ............................. 101
12.2.3 Data Gaps and Availability of Data to Address Gaps .............................................. 101 12.3 Additional Context ............................................................................................................. 101 12.4 References .......................................................................................................................... 102 12.5 Appendices ......................................................................................................................... 102
12.5.1 List of Maps Used to Inform the Chapter ................................................................. 102
12.5.2 Notes on Ecological Expert Input ............................................................................. 103
12.1 Key Data and Map Products
The data described in this chapter are somewhat different from datasets described in other
chapters of the Ecological Inventory in that these data and map products represent syntheses of
many different types of ecological data, some previously discussed.
The map products discussed here were assembled and integrated by a team at The Nature
Conservancy (TNC) for a project called the Long Island Sound Ecological Assessment (LISEA)
(Anderson & Frohling, 2015). The TNC team worked with scientists in the region to obtain and
understand datasets relating to the ecology of LIS. The purpose of LISEA was to enhance the
understanding of ecologically notable places in LIS and the surrounding waters of Block Island
Sound and the Peconic Estuary, to support the conservation of ecologically and biological
significant resources in LIS, and to contribute to the growing body of methods and approaches
for identifying ecologically significant resources within estuaries. The major outputs of LISEA
are summarized below, but the full report should be consulted for detail about the methods and
underlying data (Anderson & Frohling, 2015).
“Ecologically Notable Places” (ENPs) are defined by TNC according to four criteria, any
number of which may be met in order to be considered an ENP: 1) geographic areas with
sustained levels of marine diversity (species persistence); 2) geographic areas of diverse and
complex bottom habitat types (seafloor complexity); 3) geographic areas that perform or serve
notable ecological functions (e.g., seagrass); 4) geographic areas with usual or rare species
and/or habitats.
LISEA had two major results. The first was the identification of ENPs, through the assessment of
biological data (fisheries, using CT DEEP survey data, 1984-2009) plus areas of seafloor
complexity. LISEA adopted the 1x2 minute rectangle assessment units used by CT DEEP for
their analysis of species persistence. Data were grouped into 8- or 9-year intervals and corrected
for survey effort and catchability. For each species, each rectangle was scored based on
persistence for each time interval. A metric of weighted persistence was developed to describe

99
persistence while accounting for the relative level of detection not explained by survey effort.
There were 114 species examined in this way. Maps of weighted persistence were developed and
interpreted by groups for demersal fish, pelagic fish, diadromous fish, and invertebrates to
identify ENPs. ENPs were rectangles where the number of species in a group with high weighted
persistence relative to other rectangles were 1 standard deviation above the mean or greater.
Pelagic and diadromous fish ENPs (“water column portfolio”) were overlaid with delineations of
seafloor complexity, seagrass, and demersal and invertebrate ENPs (“seafloor portfolio”) to
create an integrated portfolio of ENPs in LIS (Figure 1).
Figure 1. Ecologically Notable Places (ENPs) in Long Island Sound. This map from the LISEA
report shows persistence areas for pelagic and diadromous fish species (“water column
portfolio”) with delineations of seafloor complexity, seagrass, and demersal and invertebrate
ENPs (“seafloor portfolio”) (Anderson & Frohling, 2015).
The second major result of LISEA was the identification of seafloor habitats described as
Ecological Marine Units (EMUs). EMUs are a combination of depth (NOAA coastal relief
model (CRM), 83 m resolution), sediment type (USGS and Stony Brook University data) and
seabed forms. Depth and sediment thresholds were defined by benthic community analysis of
1,321 benthic grab samples (data from Theroux and Wigley, Pelligrino and Hubbard, Cerrato and

100
Maher, Cerrato et al.) (Anderson & Frohling, 2015). Seabed forms were delineated using the
Landscape Position Index and slope of the NOAA CRM. The final EMU map shows 14 classes.
With the EMU layer, TNC overlaid sediment types (silt, sand, gravel), areas of known hard
bottom, and areas of predicted hard bottom (Figure 2).
Figure 2. Ecological Marine Units (EMUs) in Long Island Sound. The 14 types of EMUs are
combinations of depth and sediment type (with threshold defined by benthic communities), and
seabed forms. Sediment types and hard bottom locations are also shown (Anderson & Frohling,
2015).
12.2 Assessment of Data Quality
12.2.1 Sources of Data and Metadata
All of the Long Island Sound Ecological Assessment (LISEA) data, metadata, and map products
are available via the report and the GIS dataset is available from The Nature Conservancy via the
web link above (Anderson & Frohling, 2015). The report describes the methods used to develop
the map products in detail.

101
12.2.2 Accuracy, Representativeness, and Relevance of Map Products
The LISEA datasets described above are relevant to the Blue Plan effort. The LISEA outputs are
completed map products that integrate multiple individual datasets in an interpretive way for a
specific purpose. As such, these products should also be examined to understand the underlying
source data and methods that may influence the assessment of their accuracy and
representativeness. In addition, some of these syntheses use underlying datasets that do not
represent the most current information available (e.g., LISEA uses 2006 eelgrass data).
12.2.3 Data Gaps and Availability of Data to Address Gaps
Some of high-level data gaps in the LISEA outputs are described in the report. For example,
nearshore marine life in general, but also plankton, salt marsh, migratory or diving birds, marine
mammals, shellfish and other habitat-forming species, and migratory corridors were not included
in the assessment and delineation of ENPs (Anderson & Frohling, 2015). Other datasets in this
inventory could be used to complement the LISEA products and at least partly address these
gaps.
The gaps and limitations of the LISTS fish trawl dataset used in the identification of ENPs are
described in Chapter 6. Briefly, that survey does not sample the entire LIS and especially does
not adequately sample complex habitat and some pelagic species, so the resulting ENPs can be
considered to reflect gaps in those species/habitats as well. Estuarine seine data and coastal
trawls could be used to help fill these gaps (CT DEEP, 2016; Harris, Fraboni, Cantatore, &
Cooper, 2014; Maritime Aquarium, 2018).
Finally, LISEA was not able to include at least 4 rare species in their analyses (Anderson &
Frohling, 2015).
12.3 Additional Context
LISEA data products were also discussed in Chapter 6 Fish, Pelagic Invertebrates, Shellfish, and
Zooplankton; Chapter 7 Benthic Invertebrates; Chapter 9 Bathymetry and Seafloor Complexity;
and Chapter 10 Sediments and Geochemistry.
The LISEA effort was modeled after the methods and approaches of the TNC Northwest Atlantic
Marine Ecological Assessment (NAMERA) (Greene, Anderson, Odell, & Steinberg, 2010). Both
of these projects represent one way to integrate a variety of physical and biological information
into a set of ecological map products. As discussed in other chapters (e.g., Chapter 7 Benthic
Invertebrates), there have been several different approaches used in the Northeast region to
integrate ecological data to represent habitats or areas spatially. The Habitat mapping and
classification in the Northeast USA StoryMap on the Northeast Ocean Data Portal provides a
broad overview of the approaches in the region (Northeast Regional Planning Body, Northeast
Ocean Data Portal, 2018).

102
12.4 References
Anderson, M., & Frohling, N. (2015). The Long Island Sound Ecological Assessment. The
Nature Conservancy.
CT DEEP. (2016). A study of marine recreational fisheries in Connecticut. Connecticut
Department of Energy and Environmental Protection, Marine Fisheries Program.
CT DEEP. (2018, February 5). Long Island Sound Blue Plan Webinars. Retrieved from
Connecticut Department of Energy and Environmental Protection:
http://www.ct.gov/deep/cwp/view.asp?a=2705&q=593814&deepNav_GID=1635
Greene, J. K., Anderson, M. G., Odell, J., & Steinberg, N. (2010). The Northwest Atlantic
Marine Ecoregional Assessment: Species, Habitats and Ecosystems. Phase One. .
Boston, MA: The Nature Conservancy, Eastern Division.
Harris, R., Fraboni, P., Cantatore, N., & Cooper, J. (2014). Harbor Watch, a Program of
Earthplace Report on Norwalk Harbor Juvenile Benthic Marine Fish May through
October 2014. Harbor Watch.
Maritime Aquarium. (2018). The Long Island Sound Biodiversity Database. Retrieved from The
Maritime Aquarium: https://www.maritimeaquarium.org/biodiversity
Northeast Regional Planning Body. (2018). Northeast Ocean Data Portal. Retrieved
from www.northeastoceandata.org
12.5 Appendices
12.5.1 List of Maps Used to Inform the Chapter
Data highlighted in grey are included in the Inventory and were discussed during expert
webinars. In addition to the links provided below, each grey dataset is accompanied by a
reference, citation, or link within the text in the Inventory.
The un-highlighted (white) data rows were also discussed during expert webinars. These data
were either identified in the Rapid Assessment or mentioned by experts as credible sources of
data that may not be relevant to the Blue Plan effort. Example reasons include the older age of
the dataset, limited overall availability, lack of spatial data products, too limited or too broad
spatial/temporal scope, or that other LIS datasets were preferred. Many of these un-highlighted
datasets are described in Section 12.3 Additional Context, and most are described further in the
map books associated with the expert webinars (CT DEEP, 2018).
CATEGORY DATASET/LAYER ADVANCED
FROM RAPID
ASSESSMENT
TO
INVENTORY
ADDED TO
INVENTORY
FROM
EXPERT
REVIEW
Ecological
Marine Units
LISEA Ecological Marine Units X

103
CATEGORY DATASET/LAYER ADVANCED
FROM RAPID
ASSESSMENT
TO
INVENTORY
ADDED TO
INVENTORY
FROM
EXPERT
REVIEW
Ecologically
Notable Places
Ecologically Notable Places: water
column portfolio, seafloor portfolio,
integrated portfolio
X
12.5.2 Notes on Ecological Expert Input
Expert input was obtained on Ecologically Notable Places and Ecological Marine Units during
the “Benthic Physical Habitat” and “Benthic Biological Habitat” expert webinars. Elements of
LISEA outputs (e.g., fish persistence products) were also discussed in the “Fish” expert webinar.
Map books for each webinar and links to webinar recordings can be found on the Long Island
Sound Blue Plan website (CT DEEP, 2018).
Ecologically Significant Areas

104
Chapter 13. Ecologically Significant Areas
The fourth category of natural resources listed in the Blue Plan legislation (Public Act No. 15-66,
Section 1(b)), is “ecologically significant areas”. Ecologically Significant Areas (ESAs) were not
included in this inventory because as of February 2018, because they have yet to be defined.
However, this inventory represents the data that could eventually be used – or built on - to define
them.
The Blue Plan Ecological Characterization Work Team and technical experts agree that a
collaborative, technical, and science-based approach to characterizing ESAs is needed.
The process could begin by considering the data described in this Ecological Inventory. An
Ecological Experts group would review the Inventory and potentially recommend any data
development tasks that would be needed to improve existing map products, or generate new map
products from existing data, that would enable a more complete Long Island Sound Ecological
Characterization.
Considering the results of the Ecological Characterization, the Ecological Characterization Work
Team and the Ecological Experts group could then work together to develop a definition of
Ecologically Significant Areas. Next, a number of approaches for characterizing ESAs could be
considered, with continued guidance from the Ecological Experts group. For example, a Delphic
or more informal process could be established with the Ecological Experts where spatial
information is produced directly from the experts (e.g., via participatory mapping exercises)
about what they consider to be “ecologically significant” in LIS. Once ESAs are identified, their
descriptions and methods used to characterize them can be added to the Ecological Inventory
(Figure 1).
Several of the maps and data products discussed in this inventory are already the result of expert-
and data-driven collaborative processes. For example, NOAA Environmental Sensitivity Index
(ESI) maps were developed by assembling many different data sources and experts’ input to
products that “show where…most sensitive species, life stages, and locations exist (NOAA
ORR, 2018).” The resulting maps identify areas that are generally vulnerable to oil spills and
other coastal hazards. ESI map products are discussed throughout this inventory, as they pertain
to multiple ecosystem components. Another example is the Audubon Important Bird Areas
(IBAs) dataset, the development of which was guided by and IBA Technical Committee who
developed the four IBA criteria and provide technical guidance on the identification of IBAs
(Audubon, 2018). The criteria focus on species’ conservation status, range, and vulnerabilities
due to habitat needs or behaviors. The IBA dataset and criteria are further discussed in Chapter 5.
A final example of an expert- and data-driven process to delineate important areas is the NOAA
Essential Fish Habitat (EFH) dataset (NOAA NMFS, 2018). The EFH delineation process used
several sources of data on fish presence/absence, density, growth, reproduction, survival, and
production, in addition to expert judgment and experience. The result is a series of areas
important to various species and life stages of fish, which can be used for fishery management
and conservation (NOAA NMFS, 2018). EFH maps are included in the discussion of fish dataset
in Chapter 6 Fish, Pelagic Invertebrates, Shellfish, and Zooplankton. These examples
demonstrate the usefulness of a process that combines data with expert knowledge and
experience to develop spatial products and tools.

105
Figure 1. A diagram showing the process by which ecological information has been and could
continue to be integrated into the Ecological Inventory, and the process by which Ecologically
Significant Areas could be included.
References
Audubon. (2018, February 6). Important Bird Areas. Retrieved from Audubon:
http://www.audubon.org/important-bird-areas

106
NOAA NMFS. (2018, February 6). Essential Fish Habitat Mapper. Retrieved from NOAA
National Marine Fisheries Service, Habitat Conservation, Habitat Protection:
https://www.habitat.noaa.gov/protection/efh/efhmapper/
NOAA ORR. (2018, February 5). Environmental Sensitivity Index (ESI) Maps. Retrieved from
NOAA Office of Response and Restoration: https://response.restoration.noaa.gov/maps-
and-spatial-data/environmental-sensitivity-index-esi-maps.html

107
Human Use Characterization of Long Island Sound

108
Chapter 14. Human Use Characterization Process
Regardless of its ecological attributes, Long Island Sound would not need a Blue Plan if it were
not heavily used by humans. The Sound’s coastal communities are also home to more than 4
million people, and the Sound’s watershed includes nearly 9 million people. The Sound is used
by ferries, ships, and barges to transport people and goods into deep water harbors. Commercial
and recreational fishers and shellfishers are active throughout the Sound, as are boaters,
birdwatchers and many other use sectors. All human activities in the Sound generate about $9.4
billion annually (adjusted for inflation in 2015 dollars) in the regional economy. With the uses it
serves and the recreational opportunities it provides, Long Island Sound is among the most
important and valuable estuaries in the nation. In 1987, Congress designated Long Island Sound
an Estuary of National Significance.
Accordingly, the Blue Plan legislation (Public Act No. 15-66, Section 1(b)), required the
resource and use inventory to be comprised of the best available information and data regarding
“uses of [Long Island Sound] waters and substrates, including, but not limited to: (i) Recreational
and commercial boating, (ii) recreational and commercial fishing, (iii) waterfowl hunting, (iv)
shellfish beds, (v) aquaculture facilities, (vi) shipping corridors, (vii) energy facilities, and (viii)
electric power line, gas pipeline and telecommunications crossings.”
While considerable Human Use data is available from sources such as the Northeast Ocean Data
Portal and the CT Aquaculture Atlas, the data tend not to be as organized or accessible as the
more scientific ecological data, and much information resides within the personal knowledge of
users and stakeholders. As a first step in accessing this knowledge base, Sea Grant intern Ariana
Spawn coordinated a compilation of contacts for a wide variety of use sectors, groups and
organizations. This master list of contacts included over 600 names or points of contact, making
it somewhat unwieldy as a tool for data gathering. However, further development of such a large
list would be difficult.
As such, the Human Use Characterization Work Team applied its sector-based knowledge and
experience to refine the master list into a priority list of users, grouped according to sector. Each
sector or group of sectors was assigned to a member of the Blue Plan Advisory Committee who
represented or was familiar with that sector, supported by staff from one of the Blue Plan partner
organizations. Rather than scheduling a series of webinars from the outset, each sector was
engaged through a targeted approach based on the numbers of participants, the nature and
sensitivity of the issues associated with each group. For some sectors with larger numbers of
participants, such as recreational fishing, webinars were employed and supplemented with more
direct contacts; but other sectors with smaller numbers of participants such as shipping and
national security relied on in-person meetings and direct communications.
For each use sector, a “data template” was created which provided example maps and essential
metadata that could be used to assess its relevance, representativeness, and accuracy. Unlike the
ecological data, human use data is more likely to be developed according to political boundaries,
so that many data sources are specific to Connecticut or New York. This situation has created
some inconsistencies and data gaps which are discussed in each chapter.

109
For purposes of the Inventory, the primary human use sectors were grouped into five main
topics. As shown below, stakeholder and user feedback was obtained via webinars and other
methods (Table 1). At least 60 experts contributed across the five webinars, some being
contacted for multiple sectors.
Table 1. Human Use Sector Topic Areas, Outreach Methods, and Stakeholders Engaged
Human Use Sector Topic Area Outreach Methods
Approximate
Number of
Stakeholders Who
Reviewed Spatial
Data
Fish and Shellfish Activities
Aquaculture
Commercial Fishing
Recreational Fishing
Charter/Party Boat Fishing
Personal interviews,
meetings, webinar,
newsletter notice
45
**To be verified**
Recreation and Tourism
Recreational Boating and Sailing
Harbors and Marinas
Non-Consumptive Recreation
Waterfowl Hunting
Personal interviews,
meetings, webinars
82
**To be verified**
Cultural Resources and Education
Historic and Archaeological
Marine and Coastal Cultural
Resources
Research and Education
Personal interviews,
meetings, conferences,
emails
18
**To be verified**
Benthic Biological Habitat
Marine Transportation,
Navigation, and Infrastructure
Energy and Telecommunications
National Security
Personal interviews,
meetings, webinars
53
**To be verified**
Users and stakeholders reviewed and discussed the data templates that were prepared and
distributed as Map Books prior to the applicable webinar or meeting. Sector experts also
suggested additional spatial and non-spatial datasets and contributed their knowledge and
experience on each topic.
The purpose of this Inventory is to assemble datasets that are relevant, representative and
accurate in conveying the human uses of Long Island Sound. The Inventory represents datasets
that have been obtained by the Blue Plan team (or are scheduled to be obtained in the immediate
future), and are available to be used to support a Human Use Characterization process. Data from

110
the inventory that are carried forward to support the Human Use Characterization are potentially
also applicable to identifying Significant Use Areas (SUAs), depending on the approach chosen.

111
Fish and Shellf ish Activities
Chapter 15. Aquaculture
Chapter Table of Contents
15.1 Key Data and Map Products .............................................................................................. 111 15.2 Assessment of Data Quality ............................................................................................... 119
15.2.1 Sources of Data and Metadata ................................................................................. 119 15.2.2 Accuracy, Representativeness, and Relevance of Map Products ............................. 120 15.2.3 Data Gaps and Availability of Data to Address Gaps .............................................. 121
15.3 Relevance ........................................................................................................................... 121
15.3.1 Relative Historical Importance ................................................................................. 121 15.3.2 Socio-Economic Context ........................................................................................... 121 15.3.3 Other Notes ............................................................................................................... 122
15.4 References .......................................................................................................................... 122 15.5 Appendices ......................................................................................................................... 123
15.5.1 List of Maps Used to Inform the Chapter ................................................................. 123
15.5.2 Notes on Stakeholder Engagement ........................................................................... 124
15.1 Key Data and Map Products
Shellfish have been harvested from Long Island Sound since pre-colonial periods, and their
culture now constitute an important economic and cultural sector in Long Island Sound. The
following sections will document geospatial information and tools important to the sectors and
its management.
The Aquaculture Mapping Atlas seems to capture most of the relevant geospatial information on
shellfish aquaculture in CT, including state and town commercial leases, aquaculture gear sites,
shellfish classifications areas, water quality sampling sites for classification, summarizing on one
site the information relevant to the shellfish aquaculture. Some examples of relevant maps are
presented in Figures 1 and 2.
Figure 1. Map of Connecticut commercial shellfish beds in municipal and state waters, along
with designated natural shellfish beds. Accessible via the Aquaculture Mapping Atlas.

112
In 1881 a line was established, referred to as the Commissioners line that divides the waters of
the state into a northern and southern section. All beds south of this line are State beds and most
beds north of this line are town beds (Figure 3). The Connecticut Department of Agriculture
Bureau of Aquaculture (DA/BA) still controls all the licensing and regulations north and south of
this line, for example DA/BA determines when an area will be closed to shellfishing due to a
change in water quality and what licenses are need to do certain work. All the beds under state
jurisdiction were mapped using longitude/latitude data from a DA/BA access database (Figure
1). These coordinates were taken from converted sextant angles.
(a)
(b)
Figure 2. Map of Connecticut water quality sampling stations (a) to determine classification
areas (b) for shellfish harvest in municipal and state waters. Accessible via the Aquaculture
Mapping Atlas.

113
Figure 3. Map of the 1881 East-West “Commissioners line” separating jurisdiction over
Connecticut municipal beds (north of the line) and state beds (south of the line). The inset
demonstrates how the “Commissioners line” joins adjacent ends of bays to delineate bays into
municipal beds. Accessible via the Aquaculture Mapping Atlas.
Town beds are simply leased, owned or managed through the local shellfish commission. Towns
may require additional local permits to work in waters under local jurisdiction. The beds north of
the line in Westport, Milford, West Haven, and New Haven are exceptions to this as they are
under state control. The sources of data for the town managed beds layer were quite varied. The
sources included longitude/latitude data and maps from DA/BA, maps and longitude/latitude
provided by local shellfish commissions and longitude/latitude data and maps obtained from
private operations. Additionally, a few towns provided maps of their beds in an electronic format
such as a CAD file or shapefile.
Natural beds get their name from the fact that shellfish, especially oyster, naturally inhabited the
area. These areas tend to be closer to shore and more often than not are at the mouth of a river.
Natural beds have specific regulations concerning their use, including licensing and harvesting
methods. They are predominately seed beds that cannot be mechanically harvested. Use of the
natural beds requires a Relay/Transplant License I or II and/or Seed Oyster Harvesting License.
Any person assisting in the harvesting of seed oysters must have a Helper's License. These beds
cannot be leased or subdivided; they are to remain open to any properly licensed shellfisherman.
A complete listing of regulations is available from DA/BA.
State natural beds are simply natural beds south of the Commissioners line. Descriptions of these
beds can be found in section 3295 of the Connecticut General Statutes (CGS), revision of 1918.
Not all of the beds listed in section 3295 were mapped. Many of the natural beds in state waters

114
off of Greenwich are now covered with leases. The town natural beds were defined by law under
section 2326 of the CGS of 1888. Each town had the opportunity to map areas that they wanted
to be considered natural bed. The documents, written descriptions and maps, were submitted to
the Superior Court that had jurisdiction for that town. Several towns did not avail themselves of
this opportunity. Some areas such as in Westport have been changed in recent court decisions.
There are some areas that may have been declared natural bed that now have leases on them.
Since a significant proportion of the shellfish aquaculture industry relies on sets in natural beds,
the Atlas includes information on natural shellfish beds, information is also available for the
location of natural shellfish beds (Figure 1). It should be noted that “natural beds” in CT are a
unique classification of seafloor set aside for natural recruitment of Eastern Oyster, and should
not be confused with wild beds that may exist outside of natural bed designated areas.
Connecticut Department of Agriculture Bureau of Aquaculture water quality monitoring station
locations are used for the purpose of shellfish growing area classification (Figure 2). Connecticut
Department of Agriculture Bureau of Aquaculture classifies all tidal waters of Long Island
Sound located along the coast of Connecticut. All shellfish growing areas are classified in
accordance with the National Shellfish Sanitation Program Model Ordinance. These
classifications, established to minimize health risks, may restrict the taking and use of shellfish
from some areas. No fresh water areas are classified for the harvesting of shellfish. Any shellfish
area, regardless of classification, may be temporarily closed to all activities when a potential
public health emergency exists as a result of a storm event, flooding, sewage, chemical, or
petroleum discharges, or a hazardous algal bloom. Classifications are briefly summarized below:
APPROVED AREA: Is a classification used to identify a growing area that is safe for the
direct marketing or consumption of shellfish.
CONDITIONALLY APPROVED AREA: Is a classification used to identify a growing
area that is safe for the direct marketing or consumption of shellfish when the area is in
the open status. The area must meet the criteria for Approved classification when the area
is in the open status, and meets the criteria for the restricted classification in the closed
status.
CONDITIONALLY APPROVED SEASONAL AREA: same as above, but may be
closed under certain seasonal conditions.
CONDITIONALLY RESTRICTED: Is a classification used to identify a growing area
where a sanitary survey has found that the area meets the criteria for Restricted
classification when the area is in the open status and meets the criteria for Prohibited
classification when the area is in the closed status. Shellfish may only be harvested from
Conditionally Restricted areas by special license, and may not be directly harvested for
market or consumption.
PROHIBITED: Is a classification used to identify a growing area where there has been no
current sanitary survey or where a sanitary survey has found that the area is adjacent to a
sewage treatment plant or other point source outfall with public health significance;

115
pollution sources may unpredictably contaminate the growing area; the growing area is
contaminated with fecal waste so that the shellfish may be vectors for disease
microorganisms; and/or that the concentration of biotoxin is sufficient to cause a public
health risk. Shellfish may not be harvested from Prohibited areas except for seed
oystering or depletion of the areas.
The Aquaculture Mapping Atlas also includes information on recreational shellfish beds (Figure
4, more detailed information is also provided in Chapter 17 Recreational Fishing), as well as
other relevant and complementary layers of information such as aids to navigation, coastal access
sites, bathymetry, and anchorage areas.
Figure 4. Map of Connecticut recreational shellfish beds, accessible via the Aquaculture
Mapping Atlas.
Comparatively, there is relatively little spatially explicit information on shellfish aquaculture in
NY. However, it should be noted that commercial shellfish activity in NY is mostly focused on
wild harvest, with only a small percentage of grounds cultivated under leases. One notable
exception is a large lease-based aquaculture company that operates in Oyster Bay, in NY LIS
waters. Publically available maps documenting the spatial location of these leases were not
found.
While not prevalent, there are temporary leases located in NY LIS state waters that permit off-
bottom aquaculture, called Temporary Marine Area Use Assignments (TMAUAs). We were able
to secure information on the location of these TMAUAs from NY DEC (Figure 5). At this point
we have not been able to verify if these are the only leased or deeded areas of seafloor in NY LIS
state waters.

116
Figure 5. Map of New York Temporary Marine Area Use Assignments in Long Island Sound. The
dots represent the center point of 5-acre circular assignments. A radius of 250’ defines the outer
boundary of each site. The map was created using data provided by NY DEC.
We also found evidence of spatially explicit data held by individual townships along the north
shore of Long Island. NY DEC does not control lease areas in town waters, and maps are kept by
the individual towns. We have not been able to determine if these lease maps have been
digitized.
Interviews identified the existence of a series of maps that delineate the shellfish classification
for each township on Long Island, based on data held by NY DEC. These maps delineate areas
that are uncertified (similar to CT “prohibited” classification), certified, seasonally certified, or
subject to holiday closures (for example Figure 6).
Since wild harvesters in NY are required to document the harvest areas where they captured
shellfish, we used NY DEC spatially explicit information on landings by shellfish species and
year to construct a new shapefile that represents mean and total shellfish landings in NY LIS
waters by species and summed across species (Figure 7). While not necessarily precise and
strictly related to aquaculture, such a map may provide useful spatial information on the relative
intensity of activities related to shellfish in the NY waters of LIS, which seem to mostly take
place in the western portion of the Sound.

117
Figure 6. Map of shellfish closures for Northport Bay, Northport Harbor, Centerport Harbor.
The map was obtained from NY DEC.

118
Figure 7. Map of total shellfish landings by value from 2011-2015 delineated by NY DEC
shellfish harvest areas. The map was created using data provided by NY DEC.
While shellfish is the largest aquaculture sector in Long Island Sound, it should be noted that
there is a new and growing seaweed aquaculture industry that is developing in CT, using long
lines. A compilation of locations for kelp aquaculture activities authorized by CT DEEP, Land
and Water Resources Division as of November 2017 provides spatial information based on data
taken from approved permit documents. Points were used to generally represent area-based
locations. Currently, data represents 12 distinct locations spanning 8 different authorizations.
Locations are Sound-wide, with concentrations in Norwalk, Branford, and Groton/Stonington.
All activities are long-line based, with various lengths and groupings. A map of the currently
permitted sites is presented in Figure 8. It should be noted that seaweed aquaculture is often
associated with shellfish aquaculture efforts (in terms of location and individuals), and that it is a
seasonal effort, with kelp mostly grown over winter, and to a lesser extent Gracillaria grown
over the summer season.

119
Figure 8. Kelp aquaculture activity based on permitted sites, from CT DEEP permitting data as
of November 2017. Data are not currently publicly available, but can be obtained from CT
DEEP.
To the best of our knowledge, there is no significant marine fish aquaculture in Long Island
Sound. It should however be noted that there is a new land-based company, Great American
Aquaculture LLC, growing marine fish in Waterbury, CT.
15.2 Assessment of Data Quality
15.2.1 Sources of Data and Metadata
While some map products from other portals document pieces of information sometimes relevant
to aquaculture in Long Island Sound, it appeared clear that the Aquaculture Mapping Atlas
represents the most comprehensive and authoritative source of information relevant to the
aquaculture industry in Connecticut. The source of data is clearly described in the accompanying
user guide, along with a link to the original datasets. Further, a link to the technical
characteristics of the datasets is provided in the viewer that allows the user to select data layers.
The project includes representation from entities knowledgeable and respected in the aquaculture
field as well as technical GIS expertise, resulting appropriately vetted and relevant data and
meta-data, displayed in a user-friendly interface.
Interviews identified the existence state and individual Long Island north shore townships leases
for the culture of shellfish, along with a series of maps that delineate the shellfish classification
for each township on Long Island, based on data held by NY DEC. It is uncertain if these maps
have been digitized, and if they have, we were unable to locate the shape files that compose these
maps, along with associated metadata, and therefore unable to assess the technical quality of the
data.

120
A compilation of locations for kelp aquaculture activities authorized by CT DEEP, Land and
Water Resources Division as of November 2017 provides spatial information based on data
taken from approved permit documents. Points were used to generally represent area-based
locations.
15.2.2 Accuracy, Representativeness, and Relevance of Map Products
CT stakeholders generally responded positively to maps that included information of lease
boundaries, shellfish classifications, and natural oyster bed areas, adding that they regularly use
the Atlas (and its data) in their day to day operations. This is not surprising since the Atlas was
created for use by the aquaculture industry and allows users to overlay lease boundaries with
shellfish area classifications. This suggests that the data served through the Aquaculture
Mapping Atlas provided data that are accurate and representative of the hands on knowledge of
the industry. The data accessed from the Atlas also seemed relevant to the Blue Plan planning
process, with particular relevance associated with state and municipal commercial shellfish beds
(leased, franchised, and deeded ground), natural beds, shellfish classification areas, recreational
beds and town jurisdiction lines. There was also interest in the relevance of inclusion of relevant
data layers associated with estuarine habitat (particularly salt marshes, discussed further in
Chapter 8 Coastal Wetlands), eelgrass beds (discussed further in Chapter 2 Phytoplankton,
Macroalgae, Eelgrass, and Submerged Aquatic Vegetation), sewage treatment plants (addressed
in Chapter 25 Marine Transportation, Navigation, and Infrastructure), and underwater cables and
pipelines (discussed further in Chapter 26 Energy and Telecommunications). However, growers
generally resisted the idea of sharing information about their practices that they deemed
proprietary, including how shellfish are moved within a leased area, to help support planning
purposes. It was agreed that such data would not be requested for the purpose of the inventory,
and that objective information at the level of documented leases would be sufficient for the needs
of the Blue Plan.
Since we have not yet been able to obtain the data, metadata and series of maps that document
state and individual Long Island north shore townships leases for the culture of shellfish, along
with maps that delineate the shellfish classification for each township on Long Island, based on
data held by NY DEC, we were unable to obtain stakeholder vetting of those maps. However, the
accuracy of those maps should be trusted as they are issued by the state agency and townships
with relevant authority and jurisdiction. Landing maps such as the one depicted in Figure 7 may
carry some inaccuracy based on the availability of data. Further, they are not necessarily precise
and strictly related to aquaculture, but may provide useful spatial information on relative
shellfish-related activity. We were unable to discuss representativeness and relevance with
stakeholders since we did not have those maps to present for discussions.
Data on the locations for kelp aquaculture activities in Connecticut is deemed reliable as it is
extracted from the permits authorized by CT DEEP, Land and Water Resources Division. It
should however be noted that there is a rapid expansion of this novel industry, and that the data
shown in Figure 8 are subject to frequent changes as new permit applications are approved.

121
15.2.3 Data Gaps and Availability of Data to Address Gaps
Perhaps the most significant data gap is the absence of systematic and comprehensive spatially
explicit data documenting shellfish aquaculture activities in New York waters. We understand
that maps exist that document state and individual Long Island north shore townships leases for
the culture of shellfish, along with maps that delineate the shellfish classification for each
township on Long Island. Locating the shape files for those maps, if they have been digitized,
along with associated metadata, would allow to fill an important gap relevant to the Blue Plan,
and complement similar datasets in CT.
Also, since there are still possibilities to prospect for new leases, there would be value in getting
good maps of shellfish habitats to inform the suitability and potential productivity of new lease
grounds. Additional relevant information can be found in sections Chapter 6 Fish, Pelagic
Invertebrates, Shellfish, and Zooplankton; Chapter 9 Bathymetry and Geochemistry; and
Chapter 10 Sediments and Geochemistry, focusing on characterization of natural resources. It
should be noted that research efforts have been undertaken to adapt models of shellfish
aquaculture such as the farm aquaculture resource management (FARM) model to give
indications of how well shellfish would grow in a region, and try to inform site selection
processes for new and expanding shellfish farms (Bricker, 2016).
15.3 Relevance
15.3.1 Relative Historical Importance
Shellfish aquaculture is central to the economy, culture, and ecosystems of Long Island Sound.
There is evidence that shellfish harvesting is in fact a pre-colonial activity in Long Island Sound,
and records of transplanting shellfish seeds (small shellfish) from natural beds in Connecticut or
Virginia to cultivated bay bottoms that became oyster farms as early as the 1830s (Weigold,
2014).
15.3.2 Socio-Economic Context
Shellfish, including oysters and hard clams, generate over $30 million in farm-gate sales between
New York and Connecticut (Figure 9). In Connecticut, the shellfish industry employs more than
300 individuals and more than 70,000 acres of seafloor are under cultivation (CT Department of
Aquaculture, 2017). Not only are shellfish a critical economic resource, they are essential to the
LIS ecosystem. Shellfish, particularly the Eastern Oyster, Crassostrea virginica, provide
biogenic habitat that supports diverse marine communities and filters pollutants and sediments
from the water column, cleansing the waters of LIS.

122
Figure 9. Economic value of oyster and hard clam landings in CT and NY from 1990-2010.
There was a significant natural oyster die-off due to disease that occurred in 1998-1999. The
largest cultivated acreage producer failed to report harvest statistics from 2008 to 2010. As a
result, the overall average harvest growth rate was factored into the last reported figures by the
company to obtain an estimate for 2010 harvest numbers. However, no growth rate was factored
for 2008 harvest numbers. Data from CT DA/BA and the Long Island Sound Study.
15.3.3 Other Notes
Regulations and management according to classification are important factors in the
management of shellfish aquaculture. Natural beds (which may be in rivers) are important as a
source of seed shellfish for use in aquaculture. Some stakeholders argued that current
classifications are necessary to maintain sustainable stocks. In particular they believed that
prohibited areas were crucial to promoting sustainable harvest. Other growers argued for
downgrading classifications from prohibited to conditionally approved or conditionally approved
to approved in particular areas, due to perceptions of improved water quality.
15.4 References
Bricker, S. B. (2016). Integration of ecosystem-based models into an existing interactive web-
based tool for improved aquaculture decision-making. . Aquaculture, 453, 135-146.

123
CT Department of Aquaculture. . (2017, April 1). Shellfish Industry Profile and Economic
Impact. Retrieved from http://www.ct.gov/doag/cwp/view.asp?a=3768&q=458588
15.5 Appendices
15.5.1 List of Maps Used to Inform the Chapter
Below is a list of all maps used to inform this chapter, including maps presented above in the
narrative and additional maps used to support chapter findings. Maps listed below are organized
by the online data portal on which they are hosted (URL links to data portals are noted in Section
15.4 References above). Map products not accessible by online data portal are also noted below.
The Aquaculture Mapping Atlas
Aquaculture Gear Sites
Commercial Shellfish Beds (Municipal Waters) 2014
Commercial Shellfish Beds (State Waters) 2014
Recreational Shellfish Beds
Designated Natural Shellfish Beds 2014
Shellfish Area Jurisdiction Line
Shellfish Classification Lines
Shellfish Classification Areas
Town Jurisdiction
Northeast Ocean Data Portal
Commercial Shellfish Beds (Municipal Waters) 2014
Commercial Shellfish Beds (State Waters) 2014
Recreational Shellfish Beds
Non-Portal Map Products
Map of shellfish closures for Northport Bay, Northport Harbor, Centerport Harbor (NY
DEC)
Map of New York Temporary Marine Area Use Assignments in Long Island Sound.
(created using data provided by NY DEC)
Map of total shellfish landings by value from 2011-2015 delineated by NY DEC shellfish
harvest areas (created using data provided by NY DEC)
Map of kelp aquaculture activity, based on permitted sites, from CT DEEP permitting
data as of November 2017
More information on some of the map products presented in this chapter, including URL links to
data and metadata, can be found in the Commercial Fishing Map Book (CT DEEP, 2017) ***
Not yet live *** Not all products showcased in the map book may be addressed in this chapter or
utilized to inform the final Blue Plan.

124
15.5.2 Notes on Stakeholder Engagement
The stakeholder community engaged includes commercial and recreational harvesters,
producers, aquaculturists, industry experts, biologists, ecologists, and regulators.
In addition to engaging relevant regulators and other sector experts, we had individual in person
or phone interviews to seven shellfishermen in Connecticut and eight shellfishermen in New
York. Some groups are not represented, however, including small scale leaseholders in
Connecticut, and large-scale aquaculturists in New York. We gained the stakeholders’ contact
information mostly through referral from experts and, later on, through referral by the
shellfishermen themselves. This process may magnify a certain subset of views and neglect
others, as stakeholders may preferentially refer people with similar opinions and interests.
Our stakeholder engagement in New York differed markedly from Connecticut. Compared with
CT, NY has very little spatially explicit information related to shellfish. This is largely a function
of the differences in the shellfish industries between the two states. In the NY waters of LIS,
shellfish are harvested through both wild fisheries and cultivation on leased grounds. The vast
majority of seafloor is open to wild-harvest with only a small percentage of grounds cultivated
under leases. Due to this discrepancy, we engaged stakeholders using nautical charts and asked
them to discuss productive areas, compared to discussing data layers mostly from the
Aquaculture Mapping Atlas in CT. We were unable to meet with representatives from the main
lease-based aquaculture company in NY LIS waters.
Stakeholders were engaged starting with background questions about the nature of each
individual’s shellfishing activities before speaking more specifically about the Blue Plan.
Participants were provided with information about the goals and implications of the Blue Plan.
At what we deemed an appropriate moment in the conversation, we brought out printed nautical
maps of the Sound, as well as maps depicting lease boundaries and shellfish classifications from
the Connecticut Shellfish Atlas to redirect the conversation to questions of a spatial nature. The
conversations were designed to be informal in nature and generally free-flowing, we did try to
steer the topics around several key topics and broad themes, including questions such as:
What type of shellfishing are you engaged in?
Do existing map products match your view and knowledge of shellfishing grounds?
What spatial information would you like to see considered in the Blue Plan?
Are there additional sources of spatial data that you use?
What are your concerns about the Blue Plan process?
How would you prefer to engage with the Blue Plan process?
Outreach that informed this chapter occurred in the spring of 2017. While engaging a likely
representative cross-section of stakeholders, not all potential interested parties were engaged in
the review of relevant data, although the Connecticut shellfish has been briefed about the overall
Blue Plan process by De Guise at a mandatory meeting of the Connecticut Shellfish Harvesters
convened by the Bureau of Aquaculture on May 30, 2017. We will further present the content of
this chapter of the Inventory at upcoming relevant industry meetings.

125
Chapter 16. Commercial Fishing
Chapter Table of Contents
16.1 Key Data and Map Products .............................................................................................. 125 16.2 Assessment of Data Quality ............................................................................................... 134
16.2.1 Sources of Data and Metadata ................................................................................. 134 16.2.2 Accuracy, Representativeness, and Relevance of Map Products ............................. 137
16.2.3 Data Gaps and Availability of Data to Address Gaps .............................................. 138 16.3 Relevance ........................................................................................................................... 138
16.3.1 Relative Historical Importance ................................................................................. 138 16.3.2 Socio-Economic Context ........................................................................................... 138 16.3.3 Other Notes ............................................................................................................... 138
16.4 References .......................................................................................................................... 139 16.5 Appendices ......................................................................................................................... 140
16.5.1 List of Maps Used to Inform the Chapter ................................................................. 140 16.5.2 Notes on Stakeholder Engagement ........................................................................... 141
16.1 Key Data and Map Products
Commercial fishing is a hallmark of the social and cultural fabric of New England It is important
in terms of sustaining a traditional livelihood in communities, in addition to creating significant
economic impact through sales of seafood and supporting direct and indirect employment.
Commercial fishing is closely regulated by federal and state agencies, directly affecting fishing
activities in different locations. The following sections will document geospatial information and
tools important to the commercial fishing and its management in Long Island Sound.
While several maps document commercial fishing activities at the regional scale, National
Marine Fisheries Service (NMFS) landing estimates may be the best estimate of fishing efforts in
Long Island Sound, although the scale is coarse and less that adequate for planning purposes.
Fishing Effort
The Northeast Ocean Data Portal includes abundant map products that document commercial
fishing at the Northeast scale (Northeast Ocean Data Portal, 2017). An example is provided in
Figure 1. The data can be displayed as clustered, multi-species activity or broken down into
individual species and can be refined to display vessels operating at less than 4 kn (as shown in
Figure 1, to reduce the likelihood of misinterpreting a vessel underway to fishing grounds for one
actually fishing. These map products are also served by the New York Geographic Information
Gateway (NY Geographic Information Gateway, 2017).
It should be noted that most of the data on fishing effort served through the Northeast Ocean
Data Portal are based on the Vessel Monitoring System (VMS). In general, vessels holding
permits in certain fisheries are required to use VMS (see 8` for more details). The National
Marine Fisheries Service (NMFS) describes VMS as “a satellite surveillance system primarily

126
used to monitor the location and movement of commercial fishing vessels in the U.S.” (NOAA
Fisheries, 2017b). These data are from vessels operating in certain fishery management plans and
certain programs within those plans. The maps do not distinguish between fishing activity, vessel
transit, or other vessel activities (although efforts to distinguish between vessels underway to
fishing grounds and vessels actually fishing are made by including the potential to sort the data
by vessels operating at a speed below 4 kn, suggesting actual fishing). The most accurate
interpretation of these maps is that they indicate relative levels of vessel presence. For most of
the VMS-based map products displayed through the Northeast Ocean Data Portal, there appears
to be little to no commercial fishing activity in Long Island Sound. It should be noted that these
maps do not discriminate between no data and no fishing. It is also important to note that there
are many New England fisheries not described through any VMS-derived maps.
Operators of NOAA Fisheries Greater Atlantic Region permitted vessels are required to submit a
vessel trip report (VTR) for every fishing trip regardless of where the fishing occurs or what
species are targeted, with the exception of those vessels that possess only a lobster permit. VTRs
are required in order to provide information on when and where catch occurred. Operators of all
federally permitted vessels must complete a VTR prior to landing. Communities at Sea maps link
fishing communities to specific resource areas in the ocean. They are developed by linking VTR
data to vessel permit data, and represent diverse map products by gear type in the Mid-Atlantic
and Northeast, served by the New York Geographic Information Gateway (NY Geographic
Information Gateway, 2017). These include maps of fishing activities for ground fish (for vessels
less than 65 ft and more than 65 ft), gillnet, dredge, long line and lobster. The data can be
displayed for individual types of fishing activity or sectors can be grouped. A map of all sectors
combined is presented in Figure 2. Once again, for most of the Communities at Sea VTR-based
map products displayed, there appears to be little to no commercial fishing activity in Long
Island Sound. It should be noted that these maps do not discriminate between no data and no
fishing.

127
Figure 1. Commercial Fishing: Vessel Activity. Commercial fishing at the Northeast scale. The
data are based on the Vessel Monitoring System (VMS). In general, vessels holding permits in
certain fisheries are required to use VMS (see Section 16.3.1 Source of Data and Metadata for
more details). The relative amount of vessel activity is indicated qualitatively from high (red) to
low (blue), and can be refined to display vessels operating at less than 4 kn (as shown here), to
reduce the likelihood of misinterpreting a vessel underway to fishing grounds for one actually
fishing. Access available via the Northeast Ocean Data Portal (Northeast Ocean Data Portal,
2017).
Landings
VTR data provided by the National Marine Fisheries Service were also used to quantify the total
amount of fish landed (measured in pounds) by federally permitted commercial fishing vessels
using different gear type between 2001 and 2010. Map products document landings using
traps/pots fishing gear (Figure 3), otter trawl fishing gear (Figure 4), gillnet fishing gear (Figure
5), and seine fishing gear (Figure 6). Map products are also available to document total effort
(measured in days) made by federally permitted commercial fishing vessels using otter trawl
fishing gear between 2001 and 2010 (Figure 7). Atlantic fishing revenue intensity between 2007
and 2012 was estimated by BOEM using VTR data, with map products served through the
Marine Cadastre National Viewer (NOAA, 2017). Figure 8 displays a map product that includes
Long Island Sound. Overall, landings data generally suggest that catches in Long Island Sound
are less abundant than in waters outside of Long Island Sound, with generally more abundant
catches in the eastern portion of the Sound that in the western portion. However, it should be

128
noted that the scale of these datasets is very coarse and may not be adequate for planning
purposes.
Figure 2. Communities-at-Sea: Commercial Fishing Activity 2011-2013. Representation of
various commercial fishing activities in the Northeast and Mid-Atlantic. The data are based on
vessel trip report (VTR) through Communities at Sea maps that link VTR data to vessel permit
data, and represent diverse map products by gear type in the Mid-Atlantic and Northeast, The
figure above groups activities across all sectors. Access available via New York Geographic
Information Gateway (NY Geographic Information Gateway, 2017).

129
Figure 3. Pot Gear – Regional, Landings [lbs], 2001-2010. Total commercial fishing landings
between 2001 and 2010 using traps/pots. Data is based Vessel Trip Report (VTR) summaries
provided by the National Marine Fisheries Service (NMFS). Access available via New York
Geographic Information Gateway (NY Geographic Information Gateway, 2017).
Figure 4. Trawl Gear – Regional, Landings [lbs], 2001-2010. Total commercial fishing landings
between 2001 and 2010 using otter trawl gear. Data based on annual Vessel Trip Report (VTR)
summaries provided by the National Marine Fisheries Service (NMFS). Access available via
New York Geographic Information Gateway (NY Geographic Information Gateway, 2017).

130
Figure 5. Gillnet Gear – Regional, Landings [lbs], 2001-2010. Total commercial fishing
landings between 2001 and 2010 using gillnet fishing gear. Data based on annual Vessel Trip
Report (VTR) summaries provided by the National Marine Fisheries Service (NMFS). Access
available via the New York Geographic Information Gateway (NY Geographic Information
Gateway, 2017).
Figure 6. Seine Gear – Regional, Landings [lbs], 2001-2010. Total commercial fishing landings
between 2001 and 2010 using seine fishing gear. Data based on annual Vessel Trip Report
(VTR) summaries provided by the National Marine Fisheries Service (NMFS). Access available
via the New York Geographic Information Gateway (NY Geographic Information Gateway,
2017).

131
Figure 7. Trawl Gear – Regional, Effort [days], 2001-2010. This map depicts fishing effort
(measured in days) by federally permitted commercial fishing vessels using otter trawl fishing
gear between 2001 and 2010. Data based on annual Vessel Trip Report (VTR) summaries
provided by the National Marine Fisheries Service (NMFS). Access available via the New York
Geographic Information Gateway (NY Geographic Information Gateway, 2017).
Figure 8. Atlantic Fishing Revenue Intensity, 2007-2012. This map depicts fishing revenue
intensity between 2007 and 2012 in Long Island Sound, though the spatial extent of this dataset
encompasses the U.S. Atlantic coast through South Carolina. Values are calculated by BOEM
using Vessel Trip Reports (VTR) data. Access available via the Marine Cadastre National
Viewer (NOAA, 2017).
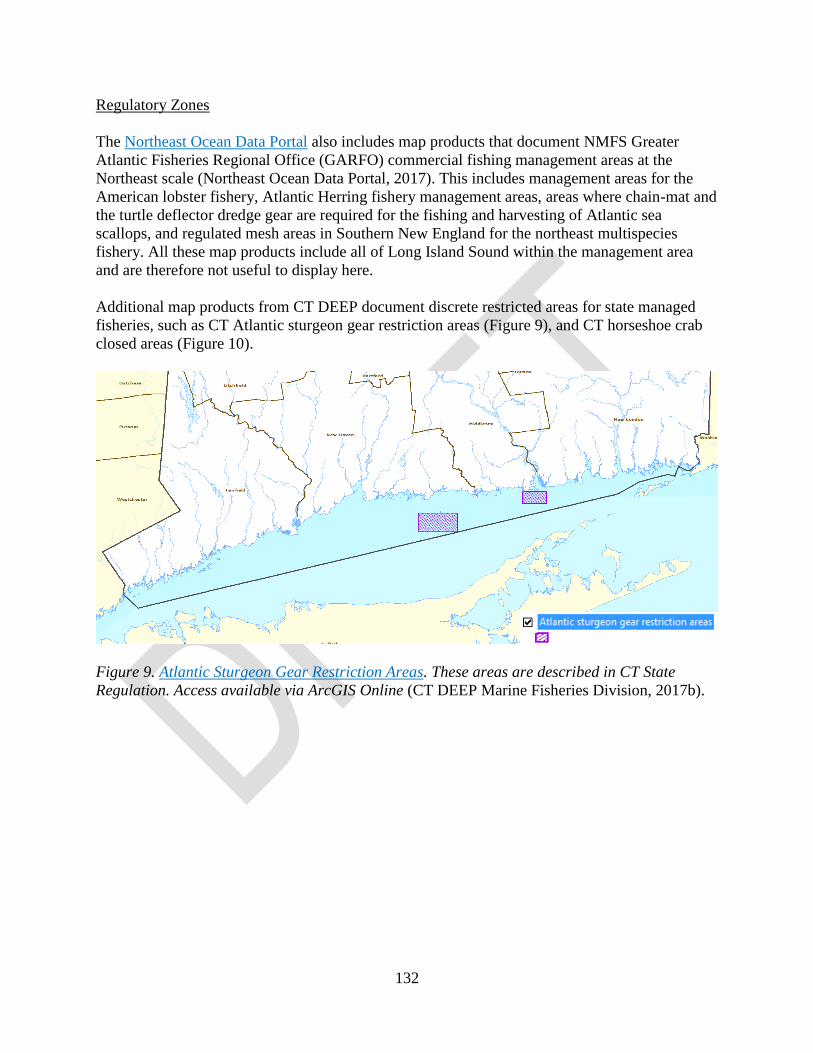
132
Regulatory Zones
The Northeast Ocean Data Portal also includes map products that document NMFS Greater
Atlantic Fisheries Regional Office (GARFO) commercial fishing management areas at the
Northeast scale (Northeast Ocean Data Portal, 2017). This includes management areas for the
American lobster fishery, Atlantic Herring fishery management areas, areas where chain-mat and
the turtle deflector dredge gear are required for the fishing and harvesting of Atlantic sea
scallops, and regulated mesh areas in Southern New England for the northeast multispecies
fishery. All these map products include all of Long Island Sound within the management area
and are therefore not useful to display here.
Additional map products from CT DEEP document discrete restricted areas for state managed
fisheries, such as CT Atlantic sturgeon gear restriction areas (Figure 9), and CT horseshoe crab
closed areas (Figure 10).
Figure 9. Atlantic Sturgeon Gear Restriction Areas. These areas are described in CT State
Regulation. Access available via ArcGIS Online (CT DEEP Marine Fisheries Division, 2017b).

133
Figure 10. Connecticut Horseshoe Crab Closed Areas. These areas are described in Connecticut
Regulation. Access available via ArcGIS Online (CT DEEP Marine Fisheries Division, 2017a).
Data Abundance
The Mid-Atlantic Regional Council on the Ocean (MARCO) synthesized spatial products
characterizing human use in the Mid-Atlantic region using existing data products. This includes a
data layer and map products summarizing the abundance of fishing data as well as the fishing use
intensity (Figure 11). While the resolution is relatively coarse, and it is unclear if data from CT
are included, the map product shows fishing use data intensity relatively low compared to the
south shore of Long Island, and generally higher in the eastern end of Long Island Sound
compared to the western portion.
Figure 11. Use Intensity – Fishing Data. Map of commercial fishing data use intensity in the
Mid-Atlantic planning region. Access available via Mid-Atlantic Ocean Data Portal (MARCO,
2017).
134
16.2 Assessment of Data Quality
16.2.1 Sources of Data and Metadata
The map products included in Section 16.1 Key Data and Map Products are available online via
a variety of data portals, including the Northeast Ocean Data Portal, Mid-Atlantic Ocean Data
Portal, New York Geographic Information Gateway, and Marine Cadastre National Viewer.
Additional map products created by CT DEEP are also hosted on ArcGIS Online. Metadata for
portal-based map products are also hosted on the portal. Metadata for CT DEEP-based map
products are available from CT DEEP Marine Fisheries Division. Specific information about
source data for individual map products is noted below.
In general, vessels holding permits in certain fisheries are required to use VMS. Additional
information can be found at NOAA Fisheries, Greater Atlantic Vessel Monitoring System
(VMS) Program site, including a link to federal regulations describing requirements for the use
of VMS (NOAA Fisheries, 2017a). Fisheries with vessels required to use VMS include: full-time
or part-time limited access scallop; limited access monkfish/occasional scallop or combination
permit electing to provide VMS notifications; limited access multispecies (groundfish; e.g., cod,
flounder species, haddock, pollock, plaice, halibut, redfish, ocean pout, hake) permit when
fishing on a category A or B day at sea (DAS); surfclam or ocean quahog open access permit;
Maine mahogany quahog limited access permit; limited access monkfish vessel electing to fish
in the Offshore Fishery Program; limited access herring permit; limited access squid permit;
limited access mackerel permit. These maps display data for vessels using VMS with a limited
access multispecies permit fishing under a Category A or B Days-at-Sea or catch regulated
species or ocean pout while on a sector trip, or those with a limited access Northeast (NE)
multispecies small vessel category or Handgear A permit that fish in multiple NE Multispecies
Broad Stock Areas (50 CFR 648.10).
It is important to note that these data include all trips using a NE Multispecies VMS code by
vessels with these permits, and as such, may include trips that target other fisheries but use a NE
Multispecies VMS declaration for another fishery as a management and reporting mechanism.
There are many New England fisheries not described through any VMS-derived maps.
VMS data is subject to strict confidentiality restrictions. Therefore, the map shows the density of
vessel locations following the removal of individually identifiable vessel positions. The process
of removing sensitive vessel locations followed the “rule of three” mandated by NMFS Office of
Law Enforcement (OLE) by using a screening grid to identify which grid cells contained three or
more VMS records. VMS records within cells that contain fewer than three VMS records were
not included in the analysis. A statistical method to normalize data was used on the subsequent
density grids and data values represent standard deviations. While legends are consistent across
products, values represent high or low areas of vessel activity specific to each dataset. Detailed
information on processing techniques is outlined in the metadata, which can be accessed through
the Northeast Ocean Data Portal.
Operators of NOAA Fisheries Greater Atlantic Region permitted vessels are required to submit a
VTR for every fishing trip regardless of where the fishing occurs or what species are targeted,
135
with the exception of those vessels that possess only a lobster permit. Communities at Sea maps
link fishing communities to specific resource areas in the ocean. They are developed by linking
VTR data to vessel permit data. VTRs include trip date, number of crew on board, species and
quantities caught, and trip locations, while the permit data includes a vessel's “principal port” as
well as other variables describing the vessel itself (e.g. length, horsepower, and age). By linking
the two, fishing communities can be categorized based on port and fishing gear group
combinations as a function of port of origin or major gear type used on the vessel. For example,
fishermen from Newport News, VA, and Montauk, NY, who fish using dredge gear can be
grouped and mapped as two separate communities. This set of maps was created by using trip
location point data as input to create density polygons representing visitation frequency
(“fisherdays”). The Communities at Sea maps show total labor including crew time and the time
spent in transit to and from fishing locations. They do not show other variables such as ex-vessel
value or number of pounds landed. The results can be interpreted as maps of “community
presence.” All data were aggregated to the “community” level, none of the resultant maps
represent a fishing area (i.e. “hot spot”) of any individual fisherman or fishing vessel. Draft maps
were reviewed and refined in consultation with diverse fishermen in several ports in each Mid-
Atlantic state.
VTR data were also used to quantify the total amount of fish landed (measured in pounds) by
federally permitted commercial fishing vessels using different gear type between 2001 and 2010.
The amount of landings is based on annual VTR summaries provided by the National Marine
Fisheries Service (NMFS). These summaries are aggregated by ten-minute square. VTRs are
required for most federally permitted fishing vessels. Please note that the use and analysis of
these geographic data are limited by the scale at which the data were collected and mapped; as a
regional analysis, these data are not intended for site level decisions.
Atlantic fishing revenue intensity between 2007 and 2012 was estimated by BOEM. This
represents a single data set from a larger study entitled “Socio-Economic Impact of Outer
Continental Shelf Wind Energy Development on Fishing in the U.S. Atlantic” (BOEM, 2017).
Each quarter square km (500 m) cell has been summed for the mean correlated economic value
over the six year period analyzed (2007-2012). This information was created for each state, gear
type, Fishery Management Plan (FMP), top 30 exposed ports and top 30 exposed species. This
was calculated using VTR, Cumulative Distribution Function (CDF) which estimates radial
distance within which fishing activity is likely to occur, and a 500 m raster cell output. The value
is in US dollars for 2012 representing the sum of the mean values for all six years, and then
classified into one of the 8 classes. The top 30 species included in this assessment are: Ocean
Quahog, Surf Clam, Little Skate, Squid (Illex & Loligo), Menhaden, Winter Skate, Channeled
Whelk, Red Grouper, Atlantic Herring, Vermillion Snapper, Atlantic Croaker, Jonah Crab, Red
Hake, Atlantic Mackerel, Silver Hake, King Mackerel, Butterfish, Yellowtail Founder, Winter
Flounder, Summer Flounder, Black Sea Bass, Monkfish, Bluefish, Lobster, Spiny Dogfish, Scup,
Skates, Cod, Sea Scallop. It should be noted that local and regionally important fisheries such as
shrimp are not included in this analysis so users should remember that the actual mean revenue if
all species were included may be much greater in some areas.
NOAA NMFS regulations and management areas vary by species. The American Lobster fishery
extends from Maine to Cape Hatteras, North Carolina. There are seven Lobster Conservation

136
Management Areas, which are labeled as Areas 1 to 6 (Area 6 covers LIS,) and Outer Cape Cod
Area. A permit holder had to demonstrate trap fishing history in a particular area to hold a permit
and continue fishing with traps in that area. Lobster does not require VMS, and the management
areas are included for lobster bycatch rules. The American lobster resource and fishery are
cooperatively managed by the states and the National Marine Fisheries Service under the
framework of the Atlantic States Marine Fisheries Commission. Herring is jointly managed in
state and federal waters by the Atlantic States Marine Fisheries Commission (ASMFC) and
NOAA National Marine Fisheries Service (NMFS). Fishing and harvesting of Atlantic sea
scallops includes area where chain-mat and the turtle deflector dredge gear are required. The
National Marine Fisheries Service (NMFS) requires the use of this type of gear to help reduce
mortality of endangered and threatened sea turtles from May 1 through November 30. The final
rule issued by NMFS clarifies where on the dredge the chain mat must be hung. The Northeast
Multispecies fishery includes Regulated Mesh Areas in Southern New England. Each mesh area
has certain requirements for minimum mesh size, gear, and methods, unless otherwise exempted
or prohibited. There are four regulated mesh areas for the Gulf of Maine, Georges Bank,
Southern New England, and the Mid-Atlantic. These datasets are from NMFS and represent
areas and regulations mandated in the U.S. Code of Federal Regulations (CFR).
Some species are also managed by states. Locations of Atlantic sturgeon gear restriction areas
are described in CT DEEP Notice to Commercial Fishermen dated 04/27/2012. In 2012,
polygons were created in ArcGIS by digitizing the areas described in the Notice of Declaration
of Regulation Change (12-08). Full text of the Declaration, including latitudinal and longitudinal
coordinates, can be found at the CT DEEP website (CT DEEP, 2017b). Locations of horseshoe
crab closed areas are described in CT State Regulation 26-159a-17(g). In 2007, polygons were
created in ArcGIS by visually digitizing areas using NOAA Nautical Charts for reference. Full
text of the regulation can be found at the CT DEEP website (under “Fishing” Title, select link to
Commercial and Sport Fishing in the Marine District) (CT DEEP, 2017a).
The Mid-Atlantic Regional Council on the Ocean (MARCO) contracted with Rural Planning
Services Applied Science Associates (RPS ASA) in partnership with SeaPlan to develop
synthesized spatial products characterizing human use in the Mid-Atlantic region using existing
data products. This project was referred to as the Human Use Data Synthesis (HUDS) in order to
promote ocean planning priorities and goals as laid out in the draft Regional Ocean Action Plan
(ROAP) Framework for the Mid-Atlantic region, defined as New York to Virginia from the coast
out to the Exclusive Economic Zone. RPS ASA and SeaPlan developed a human use mapping
approach that borrows from existing efforts while honoring the goals of MARCO and constraints
inherent to the available data. The MARCO web portal was the primary source of data
throughout the project, however additional data was incorporated from other sources such as the
Marine Cadastre, the U.S. Navy, and from the Northeast Regional Ocean Council’s (NROC)
parallel ocean planning efforts. All available data were mapped to a 10 km grid within the
region. One of the data products summarizes information specific to data use intensity for
fisheries. Each field accounts for variation in the distribution of data across cells by scaling data
presence from 0 to 1. This metric is based on selecting a pertinent attribute from each individual
layer (e.g. count of infrastructure points, length of lines), summing this attribute within each grid
cell, and scaling these summed values from 0-1 to allow for direct comparisons across layers.
The result is a more nuanced view of data presence. An additional set of fields tallies the total

137
use intensity per cell and the use intensity for various themes to better identify regional human
use trends. There are two sets of ‘total’ fields, one which sums the use intensity values, and one
which classifies use intensity into quantile breaks into categories (i.e. Very High, High, Medium,
Low, very Low) using the 20th, 40th, 60th, and 80th percentile.
16.2.2 Accuracy, Representativeness, and Relevance of Map Products
NMFS is an authoritative source of data related to fisheries management, and there is little
reason to doubt the technical quality of the data. Further, NMFS recognizes the limitations of the
data and their interpretation, namely that the most accurate interpretation of these maps based on
VMS is that they indicate relative levels of vessel presence rather than strict fishing activity and
that there are many New England fisheries not described through any VMS-derived maps.
Fishermen engaged with VMS-derived maps depicting little to no commercial fishing in Long
Island Sound were quick to point that these maps are neither accurate not representative of their
knowledge of commercial fishing activity in the Sound and should therefore not be used for
Long Island Sound planning purposes as there are not relevant to the sector. Fishermen further
pointed out that the few instances of commercial fishing representation in Long Island Sound
derived from VMS were more representative of routes to fishing grounds than fishing activities,
even when considering data filtered to include only activity at less than 4 kn (often showing
areas when they have to slow down because of sea conditions). Fishermen also pointed out that
several of the active fisheries in Long Island Sound are not monitored by VMS. VMS-derived
maps will in turn inevitably fail to accurately display such fishing activities.
Similarly, most of the Communities at Sea VTR-based map products displayed little to no
commercial fishing activity in Long Island Sound. It should be noted that these maps do not
discriminate between no data and no fishing. These maps, generated for regional scale planning
relevance in the Mid-Atlantic, are neither accurate not representative of fishermen’s knowledge
of commercial fishing activity in the Sound, and should therefore not be used for Long Island
Sound planning purposes as they are not relevant to the sector.
VTR-derived landing data for different gear types are likely accurate and may be more
representative of the existing commercial fisheries activities in Long Island Sound. However, it
should be noted that the scale of these datasets is very coarse and may not be adequate for
planning purposes, making them less than fully relevant to the Blue Plan.
Regulatory and management maps are defined by law and therefore inherently accurate,
representative of practices that should be observed, and relevant to the fishing sector. However,
the map products representing Federal regulations and management are not relevant to the Blue
Plan process as they are inclusive of all Long Island Sound. The state regulatory and
management map products, however, should be considered in the Blue Plan, although their
impact will likely be small given their relatively small footprint.
It is not clear if or how the map of commercial fishing data use intensity in the Mid-Atlantic
planning region provides additional information relevant to planning in Long Island Sound.

138
16.2.3 Data Gaps and Availability of Data to Address Gaps
The most significant data gap is the absence of systematic and comprehensive spatially explicit
data accurately documenting commercial fishing activities in Long Island Sound waters. There
are numerous maps that document commercial fishing effort at the Northeast regional scale, for
example through the Northeast Ocean Data Portal. However, these maps are based on VMS data
and fail to accurately represent Long Island Sound fishing activities because they either fail to
take into account fishing efforts for species not requiring VMS, or falsely documenting routes to
fishing grounds outside of Long Island Sound as fishing activities for species requiring VMS.
VTR-derived data documenting landings may be the most representative of fishing efforts, but
the scale is coarse and may not be relevant to planning in Long Island Sound.
Fishermen obviously know where they fish, but such information is often considered proprietary,
with reluctance to share considering potential competition and impacts of new regulations.
16.3 Relevance
16.3.1 Relative Historical Importance
Fishing has a long history in Long Island Sound, from the pre-colonial harvest of oysters to the
early European colonists netting of alewives and shad and the commercial harvest of fish for
local markets in the 18th century (Weigold, 2014). By the 19th century, commercial fishing
thrived in the region, with fish and shellfish sold across the country (Weigold, 2014). From the
abundant harvest of menhaden for oil in the second half of the 1800s to the later fishing for black
seabass, cod, bluefish, flounders and lobsters using different types of gear, the history of
commercial fishing in Long Island Sound is truly storied (Weigold, 2014).
16.3.2 Socio-Economic Context
Fishing is a hallmark of the social and cultural fabric of New England, including its tourism
industry. A recent assessment of the economic impact of agricultural sectors in CT suggest that
while the commercial value (measured as sales) of commercial fishing declined by
approximately 50% in CT between 2007 and 2015, mainly due to a decline in wild-caught fish,
the sector’s contribution to the statewide sales impacts was $22-24 million in 2015, supporting
250-550 jobs and wages totaling $7-11 million (Lopez, 2015). Commercial fishing is the second
most labor intensive agricultural sector in CT, with 16-35 jobs per million dollars in sales
generated (Lopez, 2015).
16.3.3 Other Notes
Regulations and management are important factors that influence commercial fishing. Fishermen
change their fishing habits in time (between seasons and among years) depending on changes in
regulations, success rates (e.g., in fulfilling a quota), changes in stock abundance and changes in

139
fish distribution. For example, decline in lobster stocks in the late 1990s has resulted in changes
in management practices (e.g., quotas, size limits, license buy-back programs), along with shifts
in fisheries to include other species, such as conch, which was not traditionally heavily targeted
for commercial purposes. This is important to consider for planning purposes.
16.4 References
BOEM. (2017). Socio-Economic Impact of Outer Continental Shelf Wind Energy Development
on Fisheries in the U.S. Atlantic. Woods Hole, MA: BOEM.
CT DEEP. (2017a). DEEP Regulations. Retrieved from Connecticut Department of Energy and
Environmental Protection: http://www.ct.gov/deep/cwp/view.asp?a=2704&q=323516
CT DEEP. (2017b). Notice to Commercial Fishermen: April 27, 2012. Retrieved from
Connecticut Department of Energy and Environmental Protection:
http://www.ct.gov/deep/cwp/view.asp?A=2588&Q=503242
CT DEEP Marine Fisheries Division. (2017a). horseshoe_crab_closed_areas. Retrieved from
ArcGIS Online:
https://www.arcgis.com/home/item.html?id=d6ea436966a54733b8a036b0e5dc3745
CT DEEP Marine Fisheries Division. (2017b). sturgeon_gear_restriction_areas. Retrieved from
ArcGIS Online:
https://www.arcgis.com/home/item.html?id=3de10accda7a4c78be4be59e0fc5d776
Lopez, R. B. (2015). Economic impact of Connecticut's agricultural industry, update 2015.
Storrs: Research report NO. 6, Zwick Center for Food and Resource Policy, Department
of Agriculturala nd Resource Economocs, University of Connecticut.
MARCO. (2017). Mid-Atlantic Ocean Data Portal. Retrieved from Mid-Atlantic Regional
Council on the Ocean: http://portal.midatlanticocean.org/visualize/
NOAA. (2017). Marine Cadastre National Viewer. Retrieved from
https://marinecadastre.gov/nationalviewer/
NOAA Fisheries. (2017a). Greater Atlantic Vessel Monitoring System (VMS) Program.
Retrieved from Greater Atlantic Fisheries:
https://www.greateratlantic.fisheries.noaa.gov/vms/regs/index.html
NOAA Fisheries. (2017b). Vessel Monitoring System Program. Retrieved from
http://www.nmfs.noaa.gov/ole/about/our_programs/vessel_monitoring.html
Northeast Ocean Data Portal. (2017). Northeast Ocean Data. Retrieved from
http://www.northeastoceandata.org/data-explorer/?commercial-fishing
NY Geographic Information Gateway. (2017). New York Geographic Information Gateway.
Retrieved from http://opdgig.dos.ny.gov/
Weigold, M. P. (2014). Long Island Sound: A Socioeconomic Perspective. In J. T. Latimer, Long
Island Sound: Prospects for the Urban Sea (pp. 1-46). New York, NY: Springer.

140
16.5 Appendices
16.5.1 List of Maps Used to Inform the Chapter
Below is a list of all maps used to inform this chapter, including maps presented above in the
narrative and additional maps used to support chapter findings. Maps listed below are organized
by the online data portal on which they are hosted (URL links to data portals are noted in Section
16.4 References above). Map products not accessible by online data portal are also noted below.
Northeast Ocean Data Portal
Commercial Fishing: Vessel Activity
New York Geographic Information Gateway
Communities-at-Sea: Longline Commercial Fishing Activity 2011-2013
Communities-at-Sea: Lobster Commercial Fishing Activity 2011-2013
Communities-at-Sea: Groundfish More than 65 ft Commercial Fishing Activity 2011-
2013
Communities-at-Sea: Groundfish Less than 65 ft Commercial Fishing Activity 2011-
2013
Communities-at-Sea: Gillnet Commercial Fishing Activity 2011-2013
Communities-at-Sea: Dredge Commercial Fishing Activity 2011-2013
Pot Gear – Regional, Landings [lbs], 2001-2010
Trawl Gear – Regional, Landings [lbs], 2001-2010
Gillnet Gear – Regional, Landings [lbs], 2001-2010
Seine Gear – Regional, Landings [lbs], 2001-2010
Trawl Gear – Regional, Effort [days], 2001-2010
Mid-Atlantic Ocean Data Portal
Use Intensity – Fishing Data
Marine Cadastre National Viewer
Atlantic Fishing Revenue Intensity, 2007-2012
Non-Portal Map Products
Atlantic Sturgeon Gear Restriction Areas
Connecticut Horseshoe Crab Closed Areas
More information on some of the map products presented in this chapter, including URL links to
data and metadata, can be found in the Commercial Fishing Map Book (CT DEEP, 2017)
***Not yet live*** Not all products showcased in the map book may be addressed in this chapter
or utilized to inform the final Blue Plan.

141
16.5.2 Notes on Stakeholder Engagement
The stakeholder engagement process has followed a multi-step approach, with a representative of
the fishing community appointed to the Blue Plan Advisory Committee (Mike Theiler) review of
the initial map products identified from different sources. Theiler and Sylvain De Guise met with
available fishermen in New London to discuss the Blue Plan and data on which it should be
based. Theiler further followed up with the Southern New England Fishermen’s and
Lobstermen’s Association for additional input on the map products. Outreach that informed this
chapter occurred in the fall of 2017.
Fishermen did not feel comfortable sharing information on where they fish, considering potential
competition and impacts of new regulations. They consider such information as personal and
proprietary. They would rather engage in specific conversations, individually or as a group, when
issues arise or are foreseen.

142
Chapter 17. Recreational Fishing
Chapter Table of Contents
17.1 Key Data and Map Products .............................................................................................. 142 17.2 Assessment of Data Quality ............................................................................................... 146
17.2.1 Sources of Data and Metadata ................................................................................. 146 17.2.2 Accuracy, Representativeness, and Relevance of Map Products ............................. 147
17.2.3 Data Gaps and Availability of Data to Address Gaps .............................................. 147 17.3 Relevance ........................................................................................................................... 148
17.3.1 Relative Historical Importance ................................................................................. 148 17.3.2 Socio-Economic Context ........................................................................................... 149 17.3.3 Other Notes ............................................................................................................... 152
17.4 References .......................................................................................................................... 152 17.5 Appendices ......................................................................................................................... 153
17.5.1 List of Maps Used to Inform the Chapter ................................................................. 153 17.5.2 Notes on Stakeholder Engagement ........................................................................... 154
17.1 Key Data and Map Products
Recreational fishing is a prominent and popular activity in Long Island Sound (Starbuck &
Lipsky, 2013). While the sport includes shellfishing (collection of several species of mollusk
and crustacean, including lobster), the vast majority of participants target finfish. Different
methodologies and fishing gear are used to catch various species, and participants may fish from
the shore, kayak, or boat. Take of nearly all species is regulated by catch restrictions based on
size, number of fish per angler per day, and fishing season (Connecticut Department of Energy
and Environmental Protection, 2017). These restrictions can differ between Connecticut and
New York, and are frequently revised (usually on an annual basis), based on changing fish stocks
due to natural variations, fishing pressure, and climate change.
Two data products exist that anglers feel partially represent the areas they utilize for recreational
fishing in Long Island Sound (LIS). These are the Popular Fishing Areas in the CT DEEP
Saltwater Fishing Resource Map interactive online viewer, and the 2012 Northeast Recreational
Boater Survey data broken down by target fish species and hosted on the Northeast Ocean Data
Portal (NODP). It must be reiterated that anglers feel these data are insufficient to adequately
represent their activities in LIS, and while they represent a good start to characterize their sport,
more detailed maps are required (see Data Gaps below).
Recreational fishing activity in LIS is described as “fluid,” by prominent local anglers, in that the
most heavily-used areas of the Sound are always changing. This is driven by many factors, both
natural and regulatory, such that anglers vary their target species, their gear, and their technique
on a day-to-day and seasonal basis. Anglers describe LIS as “one big nursery,” with bait such as
menhaden, shad, and squid traveling throughout the Sound, utilizing bottom structure, the open
water column, and tidal inlets. The larger sportfish follow these baitfish, and the fishermen, of
course, attempt to follow the sportfish.
143
Layered on top of this are State regulatory components. Black sea bass are a relatively new
target species, becoming popular in the last 10 years, and dominate the fishery during May and
June. Connecticut anglers seek these fish mid-Sound, where hundreds of boats cluster near the
CT-NY state border. Yet “Possession” limits, the number of fish of a given species per boat,
varies between the two states: a boat that legally caught its maximum in New York can be over
the allowable catch in Connecticut, and finable when it crosses in to CT waters. As summer
fades to fall and the tautog catch limit doubles in October (Connecticut Department of Energy
and Environmental Protection, 2017), many anglers move close to the rocky shore, frequently
fishing from kayaks in water less than 20 feet deep.
These are but a few anecdotes relayed by the recreational fishing community during the outreach
process, with the point of illustrating that to fully represent the majority of fishing activity a map
must include temporal as well as spatial elements, and should break out target fish by species or
guild as well.
The Connecticut Department of Energy and Environmental Protection (DEEP) maintains a
Saltwater Fishing Resource Map interactive online map viewer to assist Connecticut anglers in
locating bait and tackle shops, charter boat organizations (see Chapter 14, Charter Fishing), boat
launches, and Popular Fishing Areas in the Sound (Figure 1). The effort dedicated to developing
this tool has focused on locations important to Connecticut fishers; thus areas in other states’
waters are included if they support Connecticut-based angling. The Popular Fishing Areas data
set is compiled from direct areal observation of personal boats in 1986 and 1987 and DEEP
Marine Fisheries Program staff knowledge, updated most recently in 2016. This layer is
intended to include historical data as well, and is biased towards areas in the eastern Sound as
that is where most contributors recreate. Based on 1:25K to 1:100K scale maps, these maps are
generalizations and do not necessarily line up with charted features given the dynamic nature of
the Connecticut shoreline. These mapped areas were produced by DEEP in response to
“numerous requests for GIS map layers of areas in Long Island Sound that are important for
recreational fishing” (Resource Map metadata), and are recognized by the Marine Fisheries
Program to be an incomplete representation of recreational fishing activity in LIS. The polygons
may be filtered by target species using a widget within the map viewer (“Search Fishing Area by
Species”). The Saltwater Fishing Resource Map undergoes constant improvement; an additional
widget to filter areas by season is under development, as is a layer depicting recreational lobster
fishing.
In addition to the popular fishing polygons, the Saltwater Fishing Resource map also includes
known locations that offer crabbing access (for blue crab), shipwrecks/obstructions (complex
bottom often attracts numerous species of fish), and Enhanced Opportunity Fishing Sites where
regulations for shore-based anglers allow for keeping of smaller scup (porgy) and summer
flounder.

144
Figure 1. Popular Fishing Areas. Note that shipwrecks are not visible at this scale, but are
included as possible fishing locations in the online map viewer. Accessible on the Connecticut
DEEP Saltwater Fishing Resource Map (Connecticut Department of Energy and Environmental
Protection, n.d.).
The 2012 Northeast Recreational Boater Survey gathered information on recreational fishing
from personal pleasure craft. 1,940 eligible respondents from Connecticut and 1,766 from New
York participated in the survey, which asked about boat-based recreational activities.
Participants from both states, separately, declared 42% of points they placed in the study area as
fishing locations (Figure 2). The survey also addressed Target Fish Species, as a subcategory of
general fishing activity. Participants from Connecticut placed a total of 586 activity points,
while participants from New York placed 991 points, though not necessarily in LIS. Figure 3
shows a breakdown of targeted fish species based on location.
Figure 2. Target Fish Species. From 2012 Northeast Recreational Boater Survey. Note that
black sea bass were not available on the list of possible target species. Additionally,
“Flounder” is only summer founder, and “Tuna” is only bluefin tuna. Accessible on the NY
Geographic Information Gateway (NYS DOS OPD, 2017; Starbuck & Lipsky, 2013).

145
Figure 3. Target Fish Species activity points, from 2012 Northeast Recreational Boater Survey.
Angling in Long Island Sound, as with the rest of the Northeast, focuses predominantly on
striped bass. Note that black sea bass are absent from the list of target species (Starbuck &
Lipsky, 2013).
Recreational shellfishing in Connecticut targets primarily clam, along with a few other bivalve
species, and is managed by town governments through the shellfish commissions. Not all towns
maintain recreational shellfish beds (Getchis, 2004); those that do exist are represented in the CT
Aquaculture Mapping Atlas (Figure 4), which is considered the best information consolidated in
one place on the location of these beds. Shellfish commissions support themselves through the
issuance of permits and through partnerships with commercial growers in neighboring town- or
state-managed lease beds (see Chapter 15 Aquaculture). Historically, recreational shellfishing
and the shellfish commissions emerged in the late 1970s and early 1980s as beds closed in the
1960s were reopened based on a better scientific understanding of health standards and testing
developed. Recreational shellfish beds require both unfettered public access to the intertidal, as
well as water clean enough that the collected mollusks meet public health standards. The
necessity of both of these attributes means that many recreational beds are part of the “relay”
system of shellfish aquaculture in Connecticut, with bivalves transported from conditionally-
approved commercial areas to recreational beds where they are considered clean to harvest after
two weeks of filtering. Many towns that have shellfish commissions do not have recreational
beds: in these cases the commission is focused on managing aspects of commercial shellfish
aquaculture, such as seed beds (see Chapter 15 Aquaculture); in all cases, the shellfish
commission gives the town an additional voice and permitting power in the management of its
waterways.

146
Figure 4. Recreational Shellfish Areas in Connecticut. Note that the available town beds exist
nearshore and may be Approved, Conditional, or Seasonally open. Accessible on the CT
Aquaculture Mapping Atlas (University of Connecticut , 2014).
New York State manages recreational shellfishing by gear type, restrictions on minimum size
and maximum daily take, and by area closures based on health concerns (New York State ,
2017). While NY State does not require a permit to collect shellfish, certain towns do
(Rekemeyer, 2016). NY Department of Environmental Conservation maintains an online map
viewer displaying state closed locations (New York State , 2017).
Other recreational species, such as squid, lobster, whelk, and blue and Jonah crab, are managed
in Connecticut by DEEP Marine Fisheries Program. These species are fished with bait, jigs,
nets, or traps from shore or boat. Of these, only lobster, and whelk taken in more than half a
bushel per day, require a license to collect (Connecticut Department of Energy and
Environmental Protection, 2017). Likewise, New York only requires a permit for lobster, while
crab species and whelk are regulated by take limits (New York State, 2016). Lobster fishing
typically occurs in waters less than 30’ deep, with popular locations coinciding with complex
bottom structure: breakwaters, jetties, and nearshore rocky reefs.
17.2 Assessment of Data Quality
17.2.1 Sources of Data and Metadata
Maps from the Saltwater Fishing Resource Map are available online on the DEEP website; see
link in References below. Metadata is available on the DEEP Marine Fisheries Program ArcGIS
Online page, also in References below.

147
The 2012 Northeast Recreational Boater Survey targeted the activities of recreational boaters in
coastal Northeast counties. These surveys were administered online in monthly increments for
the boating season of 2012 and collected information on spatial use, economic information, and
additional relevant data (such as number of trips and primary activity). Map data from the
survey can be found on both the Northeast Ocean Data Portal and the New York Geographic
Information Gateway. All other data from the survey used in this Inventory come from the final
report itself.
Input to the narrative of recreational angling in LIS comes from feedback provided on the
Recreational Fishing and Hunting webinar held in November 2017 (see Section 17.5.2 Notes on
Stakeholder Engagement for more information). Much of this information was provided by a
prominent local angler and bait and tackle shop owner, who also contributes a weekly magazine
column and radio broadcast to the fishing community, as well as from the chair of the
Connecticut Fisheries Advisory Council.
17.2.2 Accuracy, Representativeness, and Relevance of Map Products
The map products from both the CT DEEP Marine Fisheries Program and the 2012 Northeast
Recreational Boater Survey are considered by stakeholders a good start but nowhere near
sufficient to accurately represent recreational fishing. While the content of both resources – the
discrete locations of the many fisheries of the Sound – is highly relevant to planning activity, the
data fall short of being completely representative the angling constituency. Other map products,
such as the location of bait and tackle shops, state and local boat ramps, and coastal access sites,
were not commented on during the webinar.
The main shortcomings of these map products, as discussed above, are that they do not show all
target species or seasonality of fishing effort throughout the Sound. Most notably, black sea bass
is not represented in the 2012 survey, and underrepresented in the CT DEEP data. As the 2012
survey was conducted in monthly increments over a season, it may be possible to distill the
information further to see what fish species Connecticut and New York anglers were targeting
each month, but this is likely to be not worth the effort, considering the data is already
considered insufficient.
17.2.3 Data Gaps and Availability of Data to Address Gaps
Anglers immediately identified data gaps in the existing map products, but also concluded that
correcting these gaps will not be a difficult endeavor. In summary, these gaps are:
1. Not all known important fishing areas, including shellfishing, are known or represented.
2. Seasonal changes of primary target fish not represented in data at all. These changes can
be driven by regulations (the opening and closing of fishing seasons) or simply by the

148
presence of a fish in LIS based on annual migration patterns.
3. Not all target fish species are represented in the existing data. While most species are
featured on the CT DEEP Marine Fisheries Program, they are not symbolized separately
but be selected by attribute using the built-in “Search Fishing Area by Species” widget.
The 2012 survey data omits at least one of the most important target fish in LIS (black
sea bass). Additionally, it was noted that not all bait and tackle shops are represented in
the viewer.
4. No mention of decadal changes in fisheries, whether driven by climate change, fishing
regulations, or changes in technique or preference. For example, black sea bass have
always been in LIS, but until 10 years ago (2007) they were not a primary target or
commonly caught. Now they are very common and sought after by many anglers.
In response to these gaps anglers suggested the addition of mapped areas to enhance the accuracy
of existing CT DEEP Marine Fisheries Program data to a level that will satisfactorily represent
the community. Stakeholder representatives present at the webinar were interested in creating
new polygons of heavily-used fishing areas to account for both seasonality and target fish species
or guild. At the time of this writing, CT DEEP is currently improving the Saltwater Fishing
Resource Map to include seasonality and popular lobster areas. It is also noted that the NOAA
information included in this chapter could be expanded by including the Marine Recreational
Information Program (MRIP) online data query page.
17.3 Relevance
17.3.1 Relative Historical Importance
Recreational fishing has been present in Connecticut for hundreds of years. While the first
saltwater fishing permits in the state were required in 2010, inland recreational fishing has been
managed since 1866 when the Fisheries Commission was created by state legislature
(Connecticut Department of Energy and Environmental Protection, 2016).
Any chronicling of recreational fishing in LIS would be remiss without a specific mention of
striped bass. While “stripers” are an Atlantic migratory species, Connecticut sees a few holdover
populations that remain in coastal waters year-round; in fact, successful ice fishing for stripers
was reported in January 2018. Federal and State regulation of striped bass has varied throughout
the decades, as stocks diminish and recover, directly impacting anglers. Despite this, stripers
remain overwhelmingly the most important sportfish in LIS, and indeed the entire Northeast
(Starbuck & Lipsky, 2013), as they have been since at least the early 1900s. As a prominent
local bait and tackle shop owner stated: “This one fish, in addition to menhaden [a common
baitfish] is the driving force [of recreational fishing in the Sound]. Bluefish are important, and
fun, but stripers bring people onto boats.”
Recreational lobster fishing in Connecticut was once a highly popular activity; in the 1980s the
DEEP issued over 3,300 individual-use lobster permits annually. However, in the late 1990s and

149
early 2000s the lobster population collapsed (Figure 5), due to a slight warming of the Sound and
deteriorating water quality conditions (Long Island Sound Study, 2018). Today the DEEP issues
under 300 licenses annually.
Figure 5. Lobster Landings in Long Island Sound. Annual pounds of lobster harvested
commercially on both shores of LIS. Note that since 2012 NY has not reported any landings
(Long Island Sound Study, 2018).
Lastly, a word must be said about the Atlantic shad, Connecticut’s state fish. This anadromous
fish runs through the Sound to spawn upstream in four rivers with significant LIS estuaries,
including the Connecticut itself. While it was once a significant commercial boon to nearby
communities, the shad now exists mostly as a seasonal recreational attraction, linking many
inland anglers, and tourists, to the ocean through its mid-April run (Woodside, n.d.). Numerous
conservation efforts exist to facilitate the recovery of the shad in Connecticut, though the
population still fluctuates annually.
17.3.2 Socio-Economic Context
Recreational fishing is a significant industry on both the Connecticut and Long Island shores of
the Sound, supporting business as diverse as bait and tackle shops (Figure 5), boat yards and
dealers, marinas, and even the publication industry. Through sales tax and boat registration fees,
anglers support both States’ governments, and the Marine Fishing License program in
Connecticut funds the state’s marine fisheries outreach programs, including enhanced
opportunity locations and the Saltwater Fishing Resource Map. New York State does not require
a fee, but does require that anglers enroll in the Recreational Marine Fishing Registry before
fishing in the State’s Marine and Coastal District Waters (New York State, 2016). Recent

150
anecdotal reports indicate that recreational fishing is continuing to grow in popularity, with many
millennials joining both the sport and industry.
NOAA’s Office of Science and Technology (OST) produces an annual report (NOAA Office of
Science and Technolgy, Economics and Social Analysis Division, 2017) examining the
commercial and recreational fisheries economics of each coastal state. The most recent edition,
published in May 2017, contains information gathered in 2015, summarized in Table 1. The
report includes a summary of fish species harvested and released, reprinted here as Table 2
(Connecticut) and Table 3 (New York). Note that, in all of these statistics, New York
numerations represent the State’s entire shoreline, not just LIS, and therefore are an unknown
degree larger than what the Sound alone supports. Connecticut statistics, however, are
exclusively for landings occurring in LIS waters. Please see the report for an explanation of
calculation methods.
Figure 5. Bait, Tackle, & Licensing locations, from DEEP Saltwater Fishing Resource Map.
Note that Long Island locations are not accounted for here (Connecticut Department of Energy
and Environmental Protection, n.d.).
Table 1. Economic contributions of recreational fishing in Connecticut and New York.
Summarized from NOAA OST 2015
Connecticut New York
Jobs Supported 255 698
Value Added (Not
including durable goods
sales)
$14.2 M $42.2 M
Total Value Added $248 M $586.8 M
Trip Expenditures $27.3 M $96.6 M
Trips Made (Not including
charter fishing) 1.3 M 2.7 M
Number of In-State
Anglers 252,000 555,000

151
Number of Out-of-State
Anglers 57,000 53,000
Table 2. Connecticut Fish Harvest and Release by Species, from NOAA OST 2015.
Table 3. New York Fish Harvest and Release by Species, from NOAA OST 2015.

152
17.3.3 Other Notes
Several stakeholders observed that New York management seasons differ from Connecticut
seasons; anglers wondered why there is not consensus on this point since the fish know no
political boundaries (Hladky, 2016). Cooperative management does exist through the ASMFC, a
group that was established to address the concerns and complications of managing coastal
migratory fish on a state-by-state basis. Through this venue there is much coordination between
Connecticut, New York, and Rhode Island, though each state is ultimately responsible for the
final regulations they adopt, though stocks are evaluated on a coast-wide, and in some cases, a
regional scale. Additionally, some species, such as Cod, are superseded by Federal regulations
(Atlantic States Marine Fisheries Commission, 2018).
17.4 References
Atlantic States Marine Fisheries Commission. (2018). Fisheries Managment. Retrieved from
http://www.asmfc.org/
Connecticut DEEP Marine Fisheries Devision. (n.d.). RecreationalFishingActivity. Retrieved
from https://www.arcgis.com/home/item.html?id=1414fb43e8234afbb10d94cba26625d3
Connecticut Department of Energy and Environmental Protection. (2016). Bureau of Natural
Resources Through the Years. Retrieved from Connecticut DEEP:
http://www.ct.gov/deep/cwp/view.asp?a=2723&q=572732
Connecticut Department of Energy and Environmental Protection. (2017, October). Marine
Fisheries Regulations. Retrieved from Fishing:
http://www.ct.gov/deep/cwp/view.asp?a=2696&q=322740&deepNav_GID=1647
Connecticut Department of Energy and Environmental Protection. (2017). Saltwater Anglers
Guide. Retrieved from Fishing:
http://www.ct.gov/deep/lib/deep/fishing/anglers_guide/anguide_part3.pdf
Connecticut Department of Energy and Environmental Protection. (n.d.). Saltwater Fishing
Resource Map. Retrieved from CT DEEP ArcGIS Homepage:
http://ctdeep.maps.arcgis.com/apps/webappviewer/index.html?id=4ac9ffcad5e34971a138
38bfaa7f5468
CT DEEP. (2017). Long Island Sound Blue Plan Webinars. Retrieved from Connecticut
Department of Energy and Environmental Protection:
http://www.ct.gov/deep/cwp/view.asp?a=2705&q=593814&deepNav_GID=1635
Getchis, T. (2004). Guide to Shellfishing Along the Coast of Connecticut. Retrieved from Town
of Branford Recreational Shellfishing: http://branford-
ct.gov/filestorage/285/562/583/shllfsh.pdf
Hladky, G. B. (2016, June 22). Long Island Sound Fishing Entangled in Conflicting Multi-State
Regulations. Hartford Courant.
Lapinski, T. (2017, November 13). Help Shape the use of Long Island Sound. The Fisherman.
Long Island Sound Study. (2018). Lobster. Retrieved from Ecosystem Indicators:
http://longislandsoundstudy.net/indicator/lobster-landings/
New York State . (2017, 13 December). NYSDEC Public Shellfish Mapper. Retrieved from
Department of Environmental Conservation:

153
https://nysdec.maps.arcgis.com/apps/webappviewer/index.html?id=d98abc91849f4ccf8c3
8dbb70f8a0042
New York State. (2016, June 23). Recreational Crab, Lobster & Whelk Limits. Retrieved from
Department of Environmental Conservation:
http://www.dec.ny.gov/docs/fish_marine_pdf/fishlimitscrabs.pdf
New York State. (2017, November 15). Shellfishing. Retrieved from Department of
Environmental Conservation: http://www.dec.ny.gov/outdoor/345.html
New York State. (n.d.). Recreational Marine Fishing Registry. Retrieved from Department of
Environmental Conservation: http://www.dec.ny.gov/permits/54950.html
NOAA Office of Science and Technolgy, Economics and Social Analysis Division. (2017).
Fisheries Economics of the United States 2015. Silver Spring, MD: National Marine
Fisheries Service.
NYS DOS OPD. (2017). New York Geographic Information Gateway. Retrieved from New York
State Department of State, Office of Planning and Development:
http://opdgig.dos.ny.gov/#/map
Rekemeyer, S. (2016, August). Digging For Burried Treasure - Clamming in New York's
Waters. Retrieved from New York Department of Environmental Conservation:
http://www.dec.ny.gov/docs/fish_marine_pdf/clammingcons0816.pdf
Starbuck, K., & Lipsky, A. (2013). 2012 Northeast Recreational Boater Sruvey: a
Socioeconomic and Spatial Characterization of Recreational Boating in Coastal and
Ocean Waters of the Northeast United States. Boston, MA: SeaPlan.
University of Connecticut . (2014). The Aquaculture Mapping Atlas. Retrieved from UConn
Center for Landuse Edcation and Research: https://clear3.uconn.edu/aquaculture/
Woodside, C. (n.d.). A Tale of Shad, the State Fish. Retrieved from ConnecticutHistory.org:
https://connecticuthistory.org/a-tale-of-shad-the-state-fish/
17.5 Appendices
17.5.1 List of Maps Used to Inform the Chapter
Below is a list of all maps used to inform this chapter, including maps presented above in the
narrative and additional maps used to support chapter findings. Maps listed below are organized
by the online data portal on which they are hosted (URL links to data portals are noted in Section
17.4 References above). Map products not accessible by online data portal are also noted below.
Northeast Ocean Data Portal
Boat Launches
New York Geographic Information Gateway
Boat Launches
Target Fish Species – Northeast Region, 2012
Connecticut DEEP Saltwater Fishing Resource Map
Popular Fishing Areas
Bait, Tackle, and Licensing
154
Boat Launches
Party and Charter Boat Locations
CT Aquaculture Mapping Atlas
Recreational Shellfish Areas
NYSDEC Public Shellfish Mapper
All Closures
More information on some of the map products presented in this chapter, including URL links to
data and metadata, can be found in the Recreational Fishing Map Book (CT DEEP, 2017) . Not
all products showcased in the map book may be addressed in this chapter or will be utilized to
inform the final Blue Plan.
17.5.2 Notes on Stakeholder Engagement
Initial email blasts in September and individual emails and calls in October to identified
stakeholder contacts introduced the Blue Plan and Resource and Use Inventory and invited
participation in the data-vetting webinar. However, this attempted contact returned very low
response. To reach as wide an audience of anglers as possible, a region-wide notice was
published in The Fisherman in early November. This notice was submitted by a prominent
member of the local fishing community who had been involved in the outreach process since
September, and is familiar with the community as a whole. The Fisherman is distributed
monthly, and weekly during the fishing season, and is widely read by anglers. Numerous
participants commented that this publication is the best possible way to reach the fishing
community, and the initial invite was referenced in another article several days after posting
(Lapinski, 2017). Yet, despite this, there were less than 10 participants in the webinar held
November 21, 2017.
This webinar included an overview of the Blue Plan and Inventory, presented the associated map
products the team had been able to assemble to potentially represent Recreational Fishing in LIS,
and provided an avenue for participants to discuss questions with team members. This webinar
also included material on Waterfowl Hunting in LIS, as anglers and hunters have similar modes
of access to LIS (boat and shore based) and thus, we assumed, similar concern about access and
regulation. See Chapter 22 Waterfowl Hunting for more information on this topic. Attending
participants representing Recreational Fishing included the Connecticut Fisheries Advisory
Council chair, the prominent community figure who published the notification, and active
anglers. Discussion with anglers during the webinar was exceedingly helpful in constructing the
characterizing of Recreational Fishing presented in this Inventory.
Representatives of the constituency note that if notice had been given about the event farther
ahead of time, attendance would probably have been much greater. Recent conversations via
phone and email with anglers have provided more detail to the context of recreational fishing in
the Sound, as well as focused on defining a means and method for improving maps of important
fishing areas.

155
Chapter 18. Charter/Party Boat Fishing
Chapter Table of Contents
18.1 Key Data and Map Products .............................................................................................. 155 18.2 Assessment of Data Quality ............................................................................................... 158
18.2.1 Sources of Data and Metadata ................................................................................. 158 18.2.2 Accuracy, Representativeness, and Relevance of Map Products ............................. 158
18.2.3 Data Gaps and Availability of Data to Address Gaps .............................................. 159 18.3 Relevance ........................................................................................................................... 160
18.3.1 Relative Historical Importance ................................................................................. 160 18.3.2 Socio-Economic Context ........................................................................................... 160 18.3.3 Other Notes ............................................................................................................... 161
18.4 References .......................................................................................................................... 162 18.5 Appendices ......................................................................................................................... 162
18.5.1 List of Maps Used to Inform the Chapter ................................................................. 162 18.5.2 Notes on Stakeholder Engagement ........................................................................... 163
18.1 Key Data and Map Products
Charter and Party Boats provide opportunities for saltwater fishing trips with experienced
captains & crew and represent an important and distinct component of the recreational and
commercial fishing sector for Long Island Sound. This for-hire industry in Connecticut
contributed 63 jobs, $5.7 million in income, $8.2 in value added, and $10.8 million in output in
2011 (Lovell, Steinback, & Hilger, 2011). There are multiple locations along the coast where
these vessels can be hired as indicated in Figure 1 below. This sector is a prime example of a
traditional human use that is water-dependent and part of the maritime culture of the Sound. It is
also a sector that likely depends on being able to access particular areas that are generally known
to be more productive on a cost/benefit basis. As such, we anticipate that the sector could be
directly affected by how and where spatial areas of the Sound are utilized in the future,
particularly in association with proposed new uses.
The maps shown below represent information that is publicly available re charter and party boat
fishing. Discussions are underway with the CT Charter and Party Boat Association about
completing “participatory mapping” exercises to more fully and specifically depict areas of
importance for charter and party boats for the Sound as-a-whole. These discussions include
inquiries about allowing participatory maps that currently exist for Eastern Long Island Sound to
be used for the Blue Plan.
In Figure 1 below, the names and locations of charter and party boat vendors are available. It
shows that there is generally widespread availability along the CT coast to these vendors.
This map only includes vendors that have asked to be represented in the data. Because this is
voluntary, it is not necessarily complete and the availability or viability of each vendor has not
been independently verified that we know of.

156
Practical limits on average excursion time suggests that fishing activity would likely be
conducted within reasonable proximity to the where the vendors are located and therefore,
because the vendors are spread out along the coast, likely throughout most of the Sound. This is
generally correlated by Figures 2 and 3 below that show boat trips (2000-2009) and landings in
pounds (2001-2010).
Figure 1. Party and Charter Boats. The locations of various, but not all, party and charter boat
operations surrounding Long Island Sound. Access available via the CT DEEP Saltwater Fishing
Resource Map (CT DEEP, 2017).
Figure 3 was created by the Nature Conservancy based on data provided by the National Marine
Fisheries Service. The number of trips information is based on vessel trip report records that
have been aggregated by ten-minute squares and have been screened for confidentiality. The
records to produce this dataset are for federally permitted party boats and charter boats only.
Vessel trip reports are submitted to the National Marine Fisheries Service by federally permitted
fishing vessels for all fishing trips. The screening process protects the identity of each individual
permitted commercial fishing vessel. Approximately 70% to 80% of all recorded of trips
between 2000 and 2009 are represented in this dataset.

157
Figure 2. Party and Charter Boat Trips (Total 2000 – 2009). Number of trips based on vessel
trip reports that have been aggregated by 10 minute squares. Access available via the Mid-
Atlantic Data Portal (MARCO, 2017).
The data for the Charter & Party Vessels Regional Landings (lbs) 2001-2010 shown in Figure 3
was provided by the National Marine Fisheries Service. This data product represents the total
amount of fish landed (measured in pounds) by federally permitted for-hire charter and party
vessels between 2001 and 2010. The amount of landings is based on annual Vessel Trip Report
(VTR) summaries provided by the National Marine Fisheries Service (NMFS). These summaries
are aggregated by ten minute square. VTRs are required for most federally permitted fishing
vessels. For this Regional Landings and Boat Trips layer (Figure 3), data collection is restricted
to a certain scale and method of collection, so this is not meant for site level discussions or to
represent all landings or trips. Nevertheless, it provides a relative sense of the presence and
importance of the charter and party boat sector.

158
Figure 3. Charter and Party Vessels – Regional, Landings [lbs], 2001 – 2010. Total amount of
fish landed (measured in pounds) by federally permitted for-hire charter and party vessels
between 2001 and 2010. Access available via New York Geographic Information Gateway (NY
Geographic Information Gateway, 2017).
18.2 Assessment of Data Quality
18.2.1 Sources of Data and Metadata
Data can be found on select online portals such as the CT DEEP Saltwater Fishing Resource
Map, Mid-Atlantic Ocean Data Portal, and NY Geographic Information Gateway. Links to
Metadata can be found on the NY and Mid Atlantic Gateways. Data collection methods included
VTR (Vessel Trip Reporting); where a vessel reports what they’ve caught, where they’ve caught
it and the gear type. More information on this technology can be found in Chapter 16
Commercial Fishing.
The Party & Charter Boat location map does not have one source of metadata but more
information can be found in the Anglers Guide and CT DEEP website. In the portal you can click
on the particular party boat organization and find information on the captain, dock location, and
contact information.
18.2.2 Accuracy, Representativeness, and Relevance of Map Products
There has been outreach to the CT Charter and Party Boat Association who has provided
information to other marine spatial planning efforts, however, at this time, the Association (or
other representatives of this sector) have not yet been able to provide additional information or
vetting of the data presented herein.

159
In terms of accuracy, although the CT DEEP Party Boat layer (Figure 1) only includes vendors
that have asked to be represented, it is generally assumed that the information presented is
reasonably accurate even if it may be incomplete. Within the Regional Landings and Boat Trips
layer (Figure 3), recognizing that data collection is restricted to a certain scale and method of
collection, the results are generally considered accurate for the scale represented based in part
on the credibility of the sources and also general nature of the information. Given consideration
of limits in scale (noted above) and methodology, the maps shown are generally considered to be
accurate for what they are depicting.
In terms of representativeness, the CT DEEP Party Boat layer (Figure 1) is only a partial listing
of party boat fishing vendors and may not reflect all vendors in Connecticut or on the North
Shore of Long Island. Additionally, the Charter and Party Boat Trips data (Figure 2) represents
approximately 70-80% of all recorded trips between 2000 and 2009. Although very helpful in
seeing the general size and distribution of this sector, it is important to recognize that this
information is relatively old and geospatially crude in being confined to 10-minute blocks. This
same concern also applies to the regional landings map.
The maps and associated data shown is directly relevant to marine spatial planning and the Blue
Plan in showing the relative presence and significance of the charter and party boat sector in
Long Island Sound. The maps also provide general spatial information about the sector. These
maps, however, do not provide specific geospatial data and mapping that more definitively show
the presence of the sector and the places of noted importance to the sector.
18.2.3 Data Gaps and Availability of Data to Address Gaps
The charter and party boat sector is a traditional, water-dependent use that exemplifies the type
of use the Blue Plan legislation is seeking to protect. Because this sector generally relies on the
suitability and availability of specific geospatial areas, there is a need to identify where these
areas are if the Blue Plan is to succeed in helping to protect this traditional use. Although
helpful, the data and maps provided in the Inventory at this time do not provide sufficient
geospatial specificity to identify these areas and as such this represents a data gap. As noted
above, discussions are underway with the CT Charter and Party Boat Association (CCPBA)
about completing participatory mapping exercises to depict important charter and party boat
areas for the Sound as-a-whole. If completed, these maps could help fill a significant data gap.
There may also need to be meetings with other representatives of the sector (e.g., New York
State) in order to complete a Sound-wide picture. During a meeting held with the CCPBA to
discuss the Blue plan and review data, their board leaders and members indicated a need for
better Charter & Party Boat catch information – information that is more representative &
accurate than currently collected by DEEP field staff and/or seasonal hires. It also appears that
the map and listing of charter and party boat vendors is incomplete with some names potentially
being out of date.

160
18.3 Relevance
18.3.1 Relative Historical Importance
Recreational fishing is considered a historically popular pastime and source of food for many
people (National Marine Fisheries Service, 2017). Charter, Party Boat, and For-Hire fishermen is
a profitable business industry that provides individuals and groups with the recreational fishing
experience. Charter and Party boat fishing in Long Island Sound has been around for decades.
Notes from stakeholder engagement efforts identify that charter boats still in operation date back
to the 1940s and there was likely a for-hire industry dating back even further. One source speaks
of a story of a World War II veteran that started his own party fishing business in 1946, on the
Frances Anne (Hel-Cat II, 2017).
For more historical information on the recreational fishing industry as a whole, please refer to the
Chapter 17 Recreational Fishing.
18.3.2 Socio-Economic Context
Along part of the Atlantic Coast, Maine to North Carolina, there were almost 1.6 million charter
or party boat recreational fishing passengers in 2011 (Steinback & Brinson, 2013). In 2012, the
average charter boat produced over $5.1 thousand in net income (Steinback & Brinson, 2013).
As an industry, in 2010, charter and party boats contributed approximately $334.0 million in
sales to businesses, $116.9 million in income, and over 7,000 jobs in the Northeast United States
(Steinback & Brinson, 2013). There is also a multiplier effect to the charter and party boat
industry, as other service (real estate, marinas, etc.), manufacturing (fishing gear, fuel, etc.), and
wholesale and retail industries (sporting goods, bait shops, etc.) can be dependent on for hire
fleets (Steinback & Brinson, 2013).
At $6.9 million in trip expenditures in 2011, the Connecticut charter and party boat fleet also has
a significant role in the Connecticut economy (Lovell, Steinback, & Hilger, 2011). The for-hire
industry in Connecticut also contributed 63 jobs, $5.7 million in income, $8.2 in value added,
and $10.8 million in output in 2011 (Lovell, Steinback, & Hilger, 2011). Residents of
Connecticut in 2011 had a mean trip expenditure of $164.96 per fishing trip, taking into
consideration items like auto fuel, charter fees, food from grocery stores, ice, crew tips, etc.
(Lovell, Steinback, & Hilger, 2011). Non-residents trip expenditures average was $144.57. In
total, residents of Connecticut spent $5.4 million on for-hire trips, while non-residents spent $1.5
million (Lovell, Steinback, & Hilger, 2011). Total impacts of for-hire, private boat, shore trips,
and durable expenses can be found in Figure 6.

161
Figure 4. Total Economic Impacts generated in Connecticut in 2011. Charter and party boats
create income, value-added benefits, outputs, and employment across the sector, including
through for-hire trips, private boats, shore trips, and durable expenses. (Lovell, Steinback, &
Hilger, 2011)
The industry has been known to fluctuate over time, aligning with the health of fish stocks and
the cost of regulatory fees. In 1981 there were 40 registered boats, 109 boats in 1992, 159 in
1999, 228 in 2002, 147 in 2005, 183 in 2010, and 148 in 2017 (CT DEEP Marine Fisheries,
2017). Stakeholders mentioned that stripe bass have been a catalyst for the charter and party boat
industry. If stocks of stripe bass go down, except for the consideration of blue fish, you will
likely see a drop in the for-hire sector. Due to the reliance and restrictions on stocks like stripe
bass, many for-hire vessels will diversify their target fish species so that the customer will get
more from the experience. In terms of fees, they have increased substantially over time. The first
fee in 1981 was $10, then rose to $25 in 1992, $250 in 2003, and $315 in 2010 (CT DEEP
Marine Fisheries, 2017).
18.3.3 Other Notes
Another note from stakeholder engagement efforts, is that varying regulation between states can
often be a hurdle for the charter fishing industry and their customers. For instance, different

162
species catch limits in New York, Connecticut, and Rhode Island can result in boats being fined
for having a catch that’s illegal in one state and not another. For more information, please refer
to Chapter 17 Recreational Fishing.
18.4 References
CT DEEP. (2017). Saltwater Fishing Resource Map. Retrieved from Connecticut Department of
Energy and Environmental Protection:
http://ctdeep.maps.arcgis.com/apps/webappviewer/index.html?id=4ac9ffcad5e34971a138
38bfaa7f5468
CT DEEP Marine Fisheries. (2017). Notes from Stakeholders . Connecticut .
Hel-Cat II. (2017). Pictorial History of Boats Past and Present. Retrieved from HelCat:
http://www.helcat.com/History.html
Lovell, S. J., Steinback, S., & Hilger, J. (2011). The Economic Contribution of Marine Angler
Expenditures in the United States. US Department of Commerce .
MARCO. (2017). Mid Atlantic Ocean Data Portal. Retrieved from
http://portal.midatlanticocean.org/ocean-stories/every-map-tells-a-story/
National Marine Fisheries Service. (2017). Ecology of the Northeast US Continental Shelf .
NY Geographic Information Gateway. (2017). New York Geographic Information Gateway.
Retrieved from http://opdgig.dos.ny.gov/
Steinback, S., & Brinson, A. (2013). The Economics of the Recreational For-hire Fishing
Industry in the Northeast United States, 2nd Edition. Northeast Fisheries Science Center.
18.5 Appendices
18.5.1 List of Maps Used to Inform the Chapter
Below is a list of all maps used to inform this chapter, including maps presented above in the
narrative and additional maps used to support chapter findings. Maps listed below are organized
by the online data portal on which they are hosted (URL links to data portals are noted in Section
18.4 References above). Map products not accessible by online data portal are also noted below.
New York Geographic Information Gateway
Charter & Party Vessels Regional Landings (lbs), 2001 – 2010
Mid-Atlantic Ocean Data Portal
Party & Charter Boat Trips (Total 2000-2009)
CT DEEP Saltwater Fishing Resource Map
Party & Charter Boats
More information on some of the map products presented in this chapter, including URL links to
data and metadata, can be found in the Charter/Party Fishing Map Book (CT DEEP, 2017)

163
***Not yet live*** Not all products showcased in the map book may be addressed in this chapter
or utilized to inform the final Blue Plan.
18.5.2 Notes on Stakeholder Engagement
The CT Charter and Party Boat Association has been the primary entity engaged to discuss this
sector. Staff working on the Blue Plan have had several conversations with officers of the
Association and met with members of the Association on December 2017. So far discussions
have focused on how the Blue Plan process works, what the policy results are expected to be and
addressing concerns expressed by some of the members who are skeptical. As noted above,
officers of the Association have interest in completing participatory mapping to reflect the sector
for Long Island Sound although that has yet to be scheduled. Captain Morgan from Captain
Morgan’s Bait and Tackle shop also contributed his valued insight and experience of the for-hire
fishing industry in Connecticut.
Recreation and Tourism

164
Chapter 19. Recreational Boating and Sailing
Chapter Table of Contents
19.1 Key Data and Map Products .............................................................................................. 164 19.2 Assessment of Data Quality ............................................................................................... 169
19.2.1 Sources of Data and Metadata ................................................................................. 169 19.2.2 Accuracy, Representativeness, and Relevance of Map Products ............................. 170
19.2.3 Data Gaps and Availability of Data to Address Gaps .............................................. 171 19.3 Relevance ........................................................................................................................... 173
19.3.1 Relative Historical Importance ................................................................................. 173 19.3.2 Socio-Economic Context ........................................................................................... 173 19.3.3 Other Notes ............................................................................................................... 174
19.4 References .......................................................................................................................... 174 19.5 Appendices ......................................................................................................................... 175
19.5.1 List of Maps Used to Inform the Chapter ................................................................. 175 19.5.2 Notes on Stakeholder Engagement ........................................................................... 176
19.1 Key Data and Map Products
The Recreational Sailing and Boating sector is a quintessential traditional water-dependent
human use of Long Island Sound. In addition to recreational boating itself, this broad sector
connects to marine trades and associated industries, to harbors and marinas – all of which have
geospatial connections – all of which may be affected by how and where new uses are located.
Recreational boating is a prime venue for the quality of life Long Island Sound offers to millions
of people in addition to being a source of thousands of jobs and economic activity. It is probably
the way the most people have access to offshore areas of the Sound, beyond beaches and other
shoreline areas.
Some of the geospatial areas of significance to this sector include navigational channels, special
areas of use (often unofficial or unmarked, such as locations of sailboat races, key fishing areas),
efficient and/or high use navigational courses (areas beyond navigational channels), and areas
that afford access to other recreational activities (e.g., scenic, swimming, wildlife viewing),
among others. The scenic attributes of Long Island Sound – however, these may be described or
mapped - can also be considered important to the quality of the recreational boating sector.
For this Inventory we have covered the various sectors associated with recreational boating in
this and other chapters. This chapter contains maps associated with recreational boating use and
density, boat launches, long distance and other sailboat racing, etc. Our own assessment along
with input from stakeholders suggests the need for more localized geospatial information that
better depicts the particular places that are important to this sector. There are many aspects of
recreational sailing and boating in the Sound that could potentially be mapped to help describe
this human use sector.

165
The first three maps below help illustrate the types of data and maps that currently exist in the
Inventory that best relate to Recreational Sailing and Boating. Figure 1 provides a Sound-wide
picture of recreational boating. This is useful for seeing how widespread and intense recreational
boating use is in the Sound and general distinctions between areas of high use and low use.
Although it doesn’t provide a fine-scale detailed understanding of specific geographies that are
important for recreational boating, it does show how important the Sound is for recreational
boating and that while not all areas are equal in terms of use, most of the Sound is highly used.
General areas of high use are spatially notable as indicated by the reddish colors.
The map was created based on results of the 2012 Northeast Recreational Boater Survey, which
was conducted by SeaPlan, the Northeast Regional Ocean Council (NROC), states’ coastal
agencies, marine trade associations composed of many private industry representatives, and the
First Coast Guard District. Both a random and supplemental sample of Northeast boaters plotted
their boating routes through the 2012 boating season using an online mapping application.
Figure 1. Recreational Boating Density. Density of recreational boating in Long Island Sound
based off of the 2012 Northeast Recreational Boater Survey. Access available via Northeast
Ocean Data Portal (Northeast Ocean Data Portal, 2017).
Figure 2 shows long distance sailboat races that occur over distinct tracks of the Sound. It shows
that there are multiple events and that they occur in a relatively common central area of the
Sound, branching off in the eastern portion. In addition to this type of sailboat race, there are
many races conducted closer to yacht clubs and marinas that this map doesn’t capture. The later
are often in the same relative area of the Sound. In addition to spatially depicting one type of
sailboat racing activity, the map makes the point that in addition to general recreational boating,
there are types of recreational boater use that may have specific spatial needs or characteristics.
The study that led to the map was conducted by SeaPlan, the Surfrider Foundation, and Point 97
under the direction of the Northeast Regional Planning Body. Routes were mapped using a
combination of outside research, leveraging existing data sources such as the Rhode Island

166
Ocean Special Area Management Plan (RI OSAMP), and gathering input from race organizers
and other industry experts through participatory mapping. For the purpose of characterizing
events for this dataset, a distance race is defined as (1) an offshore race starting at one port and
ending in another, or (2) an offshore race which begins at a port, has a turning point at a single
location, and ends at the same port.
Figure 2. Distance Sailing Races. Map shows the long distance sailing races that occur through
Long Island Sound. Access available via the Northeast Ocean Data Portal (Northeast Ocean
Data Portal, 2017).
Recreational boating emanates from multiple coastal locations including harbor anchorages and
marinas to boat launch sites. All these and more are spatially relevant for describing recreational
sailing and boating. Figure 3 is one of several that depict boat launch sites.
Boat launches shown in this map provide access to Long Island Sound. Town-owned and
privately owned boat launches are also included in this map. These listings come from the CT
Coastal Access Guide.

167
Figure 3. Boat Launches. Boat launches that provide access to Long Island Sound, including
town-owned and privately owned launches. Access available via the Saltwater Fishing Resource
Map (CT DEEP, 2017).
The next set of maps further illustrate relevant information for the recreational boating portion of
the Inventory. These include: 2013 Pleasure Craft Sailing Vessel Density, All Recreational
Boater Activities, and Recreational Boater Routes. A Sailing Race Landside Locations map is
shown under the “Data Gaps” section further below.
Figure 4 reveals an interesting contrast between sailing vessel use with the 2012 recreational
boating survey map (see above) in that the yellow line in central LIS is the most dominant, which
was not as clearly the case for recreational boating overall. Other routes of high sailing vessel
are connected to Port Jefferson NY, the mouth of the Lower Connecticut River and access points
associated with Fisher’s Island Sound while larger ports (Bridgeport and New Haven) do not
appear to be heavily used.

168
Figure 4. 2013 Pleasure Craft Sailing Vessel Density. Density of all pleasure craft and sailing
vessel traffic in 2013 with AIS transponders in 100 meter grid cells. Access available via the
New York Geographic Information Gateway (NY Geographic Information Gateway, 2017).
Figure 5 is helpful in distinguishing the types of use which is not shown in the density of use
depicted by the recreational boating map further above. It appears that the activities map here
focuses on particular points of interest whereas the density map above includes places of interest,
transport and boating movement in general. Fishing is the most prominent use here but may
show up this way in part as a function of being more site focused vs. sailing (presumably
captured in “Other”) is likely more focused on “movement.” Also notable is the high
concentrations of boater activity in Fisher’s Island Sound, just east and west of the Connecticut
River and the Western Sound in general.
Figure 5. All Recreational Boater Activities. Locations where participants in the 2012 Northeast
Recreational Boater Survey, engaged in various activities during their boating trips. Access
available via the Northeast Ocean Data Portal (Northeast Ocean Data Portal, 2017).

169
Figure 6 reveals the key role of distinct access points, particularly the passage between Plum
Island and the North Fork of Long Island, Port Jefferson, Huntington and Oyster Bays and to and
from multiple points on the CT coast. Similar to the recreational boating density map, while
there is intense use along virtually all of the CT coast, there is relatively less use along large
portions of the north shore of Long Island where there are few to no accessible harbors. It is
suggested that looking at these recreational boating survey maps together can provide further
insights in examining similarities and differences.
Figure 6. Recreational Boater Routes. Mapped routes from the 2012 Northeast Recreational
Boater Survey. Access available via the Northeast Ocean Data Portal (Northeast Ocean Data
Portal, 2017).
19.2 Assessment of Data Quality
19.2.1 Sources of Data and Metadata
Most data was available through the Northeast Ocean Data Portal, with a few data layers
collected from the CT DEEP Saltwater Fishing Resource Map (Boat Launches) and NY
Geographic Information Gateway (Pleasure Craft Sailing).
The full description of the meta-data is available through the online portals. For the Boat
Launches layer there isn’t one source of available meta-data but instead a series of information
including the CT Boaters Guide, CT DEEP website, and CT Coastal Access Guide. Some
sources of metadata are more descriptive, which others are summary.
Data was collected using a variety of methods including the AIS (Automatic Identification
Systems) data collection, participatory mapping, social science surveys, and outreach to industry
experts.
One particular study, the 2012 Northeast Recreational Boater Survey (conducted by Sea Plan),
produced the Recreational Boating Density, All Recreational Boater Activities, and Recreational

170
Boater Route data layers (SeaPlan, 2012). It should be noted that this survey maintained a
criteria for those eligible to take the survey including:
1. Registration with a Northeast state and/or registered with the US Coast Guard, with
hailing port in Northeast
2. Primary use of recreation
3. At least 10ft in length
4. Saltwater, if specified (only in Maine and New Hampshire)
5. Located in a coastal county, as in those bordering saltwater, or highlighted to contain
larger amount of saltwater boater activity.
Invites were sent out to ensure eligibility, including that the boat was used in saltwater, the boat
was used for recreational purposes, and the participant has access to internet with working email
address. A final 7,800 were found to meet final criteria, and 4,297 individual boaters completed a
least one monthly survey. The survey was also conducted from May to October 2012.
19.2.2 Accuracy, Representativeness, and Relevance of Map Products
In terms of accuracy, maps presented in this sector can be deemed accurate. For instance,
Recreational Boating density data was ensured to be accurate by using a mapping tool, reducing
error by only allowing the user to plot a start and end point to the route and only at a certain
scale. Additionally, AIS data is noted as being a good and accurate source of geographical data,
as it monitors the locations of vessels in real time.
In terms of representativeness, some maps may be dated and therefore may be missing new areas
of use or changes in use areas. For instance, the recreational boating density map is based on a
random sample survey on northeast recreational boaters from May 1 through October 31, 2012
(SeaPlan, 2012). Seasonality of data may also determine representativeness. The 2012 Northeast
Recreational Boater Survey occurred through May through October 31, 2012, missing data from
large portion of the year when boat traffic is far less frequent. However, because recreational
sailing and boating is largely confined to May through October, this survey can be deemed to be
representative.
An additional note on representativeness is that the 2012 Northeast Recreational Boater survey
had very selective criteria for their survey participants, and this could impact how representative
and accurate the data is.
The map products are deemed to be relevant because they depict recreational boating activity
spatially. However, the scale of the spatial information is generally broad making it difficult to
delineate important human use areas based on these maps alone. As such, while the maps are
relevant they may not be sufficient to provide or generate the geospatial products needed to fully
represent the sector in the policy of the Blue Plan.

171
19.2.3 Data Gaps and Availability of Data to Address Gaps
To be more representative of the recreational boating sector, there are a few data gaps that should
be pursued to be filled over time. First, more data from the New York side would be helpful,
including boat launches on the North Shore of Long Island and possibly New York City.
Additionally, there has been discussion that instead of cruising through Long Island Sound,
recreational boaters will tend to move around a certain area for different purposes. During the
November 2017 webinar with recreational boaters, we heard that local offshore areas used
consistently for regattas (and potentially other boating activities that are consistently held in the
same general area) are important to this sector and identifying these areas would be key if the
Blue Plan is to adequately represent information vital to the sector. There was also an interest in
contributing should such an effort like participatory mapping be undertaken to better identify
areas important to recreational boaters.
One source of information that may be able to help fill in this gap is the Characterization of
Coastal and Marine Recreational Activity in the US Northeast. This study analyzed some of the
smaller scale races in the Northeast and mapped sailing race landside locations (Figure 7). In
their analysis, they also found that there are clusters of regatta and sailing activity taking place
around New London and Mystic (Point 97, SeaPlan, and Surfrider, 2015). Participants in their
study also stressed that racing activity during the summer months takes places over the majority
of the Sound (Point 97, SeaPlan, and Surfrider, 2015). In this report Appendix H, provides a list
of known sailing event organizers and events that cover the Northeast; including Connecticut and
New York.
Figure 7 is notable as it begins to get at the significance of spatially specific local areas important
for boating, particularly sailboat races that are typically held in the same general area year after
year but as simple dots on a map, it misses the more specific geographic locations that may be
significant for the boating use.

172
Figure 7. Buoy Race Landside Locations. Map displaying the landside locations aligned with
smaller scale sailing races across the Northeast. Access available via the Characterization of
Coastal and Marine Recreational Activity in the US Northeast report (Point 97, SeaPlan, and
Surfrider, 2015).
A related but additional gap is a map that depicts where periodic boating related event areas (e.g.
SailFest, fireworks, airshows) occur. The data for filling this gap should be available through the
U.S. Coast Guard and their “Local Notice to Mariners.”
Another gap are anchoring areas, as some of these may be formal, recognized areas and others
less formal but spatially important (unofficial but established through repeated and extensive use:
transient mooring areas, e.g., Duck Island, Westbrook CT). Examples include mooring areas
near the coast where boaters have placed moorings, some of which may be registered with the
local town Harbor Management Commission and others may not be. It also includes areas where

173
yacht clubs have permanent moorings that have been recognized by State or other entities but
may not be on charts or other geospatial information (e.g., Sachem’s Head Yacht Club in
Guilford, CT). Outreach activities (e.g., meeting with the Coast Guard) indicated that it is
possible that many of these areas could be mapped with relative ease.
19.3 Relevance
19.3.1 Relative Historical Importance
Recreational sailing and boating has strong historical roots in Long Island Sound. Connecticut
holds yacht clubs dating back to the 1800s, the oldest being commissioned in 1887. Yacht clubs
were known as an area for community engagement and have been used for recreational boating
for hundreds of years. A column published in 1891 by The Rudder noted that, “…no yachtsman
in the vicinity will dispute the fact that the Sound has superior advantages over any other place in
New York City for yachting…” (City Island Nautical Museum, 2017). Another report in 1946
noted that, “waters along the Connecticut shore, including Long Island Sound, Fishers Island
Sound, the many indentations in the shoreline, and the many sheltered areas along the coast offer
and ideal area for pleasure boating and yachting of all types” (Parsons, Brinckerhoff, Hogan, &
MacDonald, 1946).
One particular location that has held great respect for yachting and shipbuilding in Long Island
Sound is City Island in New York City, which was most prominent in the 19th and 20th centuries
(City Island Nautical Museum , 2017). Images of the islands history and shipbuilding past can be
found at City Island: A Step Back in Time and City Island: Yacht Building (City Island Nautical
Museum, 2017).
Sailing races also have a historical role in Connecticut’s history. There have been a number of
races along the Atlantic coast, some through Long Island Sound (Figure 2), that date back to the
20th century and have important historical, cultural, and economic standing (Longley-Wood,
2015). Additionally, many of the America’s Cup defenders during the 1890s were serviced and
stored by City Island, at the far western edge of Long Island Sound (City Island Nautical
Museum , 2017).
19.3.2 Socio-Economic Context
Recreational boating in current times has tremendous economic impacts in the State of
Connecticut. The recreational boating industry, considering direct, indirect, and induced
spending, has an annual economic impact of more than $1.3 billion (National Marine
Manufacturers Association , 2016). Over 500 businesses and 7,000 jobs are supported by this
industry in Connecticut (National Marine Manufacturers Association , 2016). As a comparison,
the recreational boating industry supported over 10,000 jobs prior to the Great Recession and is
tied closely to economic health as a whole. Other industries like marinas and boatyards, boat and
yacht brokers, skilled technicians, equipment operators, sail making, finance and insurance, fuel
and dock staff, boat building, etc. is supported by the recreational boating industry.

174
Connecticut has over 90,000 registered boats in the state (National Marine Manufacturers
Association , 2016). Registered boats are primarily comprised of motor boats at 87%, followed
by personal watercraft at 9%, and sailboats at 4% (National Marine Manufacturers Association ,
2016).
According to the 2012 National Boating Survey, 31.9% of households participate in recreational
boating in Connecticut while 23.9% of households own a boat (United States Coast Guard,
2012). Individual participation in recreational boating is approximately 26.1%, with 26.5% of
adults participating and 25.2% of children (under 15) participating (United States Coast Guard,
2012). The top three most popular activities while boating are fishing, swimming, and
entertaining (National Marine Manufacturers Association , 2016). Further representation on
recreational boater activities can be found in Figure 5.
Recreational boaters from neighboring states, like New York and Rhode Island, also have a
significant economic impact in Long Island Sound. Boaters from New York and Rhode Island
add approximately $40 million in output to the State of Connecticut (SeaPlan, 2012).
Connecticut boaters also contributed to other states as they spend approximately $33 million in
New York, Rhode Island, or outside the region (SeaPlan, 2012).
Additionally, there were approximately 332,000 sailors in the New England region in 2016,
212,000 identified as casual sailors and 123,000 identified as core sailors (Helme, 2016).
Sailboat brokerage sales, in the United States dropped slightly from 2015-2016, with the largest
drop on boats larger than 56 ft (Helme, 2016). The market for sailboat builders has steadily
declined from 2007 to 2015, with a drop from 139 to 92 active North American sailboat builders
(Helme, 2016). This decline is also reflected in the number of fulltime employees building
sailboats in North America, dropping from 3,000 in 2007 to 1,073 in 2015 (Helme, 2016).
19.3.3 Other Notes
No other notes at this time.
19.4 References
City Island Nautical Museum . (2017). Boat Building. Retrieved from City Island Nautical
Museum: http://www.cityislandmuseum.org/boat-building.html
City Island Nautical Museum. (2017). Boat Building. Retrieved from City Island Nautical
Museum: http://www.cityislandmuseum.org/boat-building.html
CT DEEP. (2017). Long Island Sound Blue Plan Webinars. Retrieved from Connecticut
Department of Energy and Environmental Protection:
http://www.ct.gov/deep/cwp/view.asp?a=2705&q=593814&deepNav_GID=1635
CT DEEP. (2017). Saltwater Fishing Resource Map. Retrieved from Connecticut Department of
Energy and Environmental Protection:

175
http://ctdeep.maps.arcgis.com/apps/webappviewer/index.html?id=4ac9ffcad5e34971a138
38bfaa7f5468
Helme, S. (2016). The Sailing Market 2016: State of the Industry. Bonnier Corporation .
Longley-Wood, K. (2015). Distance Sailing Races, Northeast United States. Boston: Northeast
Regional Ocean Council.
National Marine Manufacturers Association . (2016). Recreational Boating: An American
Pastime & Economic Engine. Connecticut .
Northeast Ocean Data Portal. (2017). Northeast Ocean Data. Retrieved from
http://www.northeastoceandata.org/data-explorer/
NY Geographic Information Gateway. (2017). New York Geographic Information Gateway.
Retrieved from http://opdgig.dos.ny.gov/
Parsons, Brinckerhoff, Hogan, & MacDonald. (1946). An Economic and Engineering Survey of
all Navigable Waters in the State for the CT Port Survey Comission.
Point 97, SeaPlan, and Surfrider. (2015). Characterization of Coastal and Marine Recreational
Activity in the U.S. Northeast.
SeaPlan. (2012). 2012 Northeast Recreational Boater Survey: A Socioeconmic and Spatial
Characterization of Recreational Boating in Coastal and Ocean Waters of the Northeast
United States. Retrieved from
https://www.openchannels.org/sites/default/files/literature/2012%20Northeast%20Recrea
tional%20Boater%20Survey.pdf
United States Coast Guard. (2012). 2012 National Boating Survey.
19.5 Appendices
19.5.1 List of Maps Used to Inform the Chapter
Below is a list of all maps used to inform this chapter, including maps presented above in the
narrative and additional maps used to support chapter findings. Maps listed below are organized
by the online data portal on which they are hosted (URL links to data portals are noted in Section
19.4 References above). Map products not accessible by online data portal are also noted below.
Northeast Ocean Data Portal
Recreational Boating Density
Distance Sailing Races
All Recreational Boater Activities
Recreational Boater Routes
New York Geographic Information Gateway
2013 Pleasure Craft Sailing Vessel Density
CT DEEP Saltwater Fishing Resource Map
Boat Launches
Non-Portal Map Products
Buoy Race Landside Locations

176
More information on some of the map products presented in this chapter, including URL links to
data and metadata, can be found in the Recreational Boating Map Book (CT DEEP, 2017). Not
all products showcased in the map book may be addressed in this chapter or utilized to inform
the final Blue Plan.
19.5.2 Notes on Stakeholder Engagement
There are various entities that help represent the multiple facets of the recreational sailing and
boating sector. These include marine trades associations (e.g., CT Marine Trades Association)
and other maritime industry groups (e.g., CT Maritime Coalition), yacht clubs, power squadrons,
sailing and boating associations (e.g., Eastern Connecticut Sailing Association, Singles Under
Sail), and others. These groups are a source of information about recreational sailing and
boating in the Sound and are considered in other parts of the Inventory (e.g., Chapter 20 Harbors
and Marinas).
Stakeholder review of data and map products was important in preparing the Recreational
Sailing and Boating chapter of the Inventory. Maps were sent to stakeholders in “map books”
ahead of events and then presented and discussed at these events. The following chronicles the
events held:
Stakeholder Review and Input Events:
Connecticut Marine Trades Association: November 8, 2017, meeting of 12 Board
members and staff; presentation and discussion
Recreational Sailing and Boating Webinar: November 30, 2017; 25 attended. In addition
to many questions asked by attendees to better understand how the Blue Plan will work,
stakeholders at the webinar and meeting were focused on two issues: (1) being able to
better define local geospatial areas that capture places that boaters consistently use and
(2) there being a better, more complete map of marinas around the Sound.
Yacht clubs around LIS: The Eastern CT Sailing Association and Yacht Racing
Association of LIS were sent invitations/notifications of the November 30, 2017, webinar
to their email mailing list ahead of the webinar. These mailing lists are understood to
cover most if not all of the yacht clubs around LIS and were significant in accomplishing
broad access to the sailing contingent of the rec boating sector. It is assumed that many
of the attendees of the webinar resulted from these mailings as the mailings were one of
the principal methods of notifying the recreational boating sector. Another method
included working with individual yacht club leaders (e.g., Guilford Yacht Club) who
helped strategize how to reach the rec boating sector and also provided notice within their
immediate circles of potentially interested parties.

177
LIS Power squadrons: There was outreach to the leadership of Districts 1, 2 and 3 of the
LIS Power Squadrons to notify both the leaders and their members about the Blue Plan
and the November 30, 2017, webinar in particular. This took the form of working closely
with one of the squadron leaders ahead of the webinar to set up a process of reaching out
to her squadron district members and to the leadership of the other squadron districts.
The method of outreach was in the form of emails providing a brief explanation of the
Blue Plan, its relevance to the sector and an invitation to the webinar. There was not a
formal sign-up for the webinar so the exact number of power squadron attendees at the
webinar is uncertain.
Association of Marina Industries (AMI): Contact was made with an AMI representative
to discuss the Blue Plan in general and to invite the representative (and anyone else that
he recommended from AMI or other related entities) to the November 30, 2017,
Recreation Boating webinar. The representative attended the webinar.
Additional outreach is envisioned to these and other groups to continue the gathering and
development of additional data and information, particular regarding the identification of more
spatially explicit areas important for recreational boating.

178
Chapter 20. Harbors and Marinas
Chapter Table of Contents
20.1 Key Data and Map Products .............................................................................................. 178 20.2 Assessment of Data Quality ............................................................................................... 180
20.2.1 Sources of Data and Metadata ................................................................................. 180 20.2.2 Accuracy, Representativeness, and Relevance of Map Products ............................. 180
20.2.3 Data Gaps and Availability of Data to Address Gaps .............................................. 180 20.3 Relevance ........................................................................................................................... 182
20.3.1 Relative Historical Importance ................................................................................. 182 20.3.2 Socio-Economic Context ........................................................................................... 186 20.3.3 Other Notes ............................................................................................................... 188
20.4 References .......................................................................................................................... 189 20.5 Appendices ......................................................................................................................... 190
20.5.1 List of Maps Used to Inform the Chapter ................................................................. 190 20.5.2 Notes on Stakeholder Engagement ........................................................................... 190
20.1 Key Data and Map Products
Harbors and marinas are a defining feature for Long Island Sound – not only for coastal areas –
but as the points of origin for much of the activity and human use in the offshore areas of the
Sound – whether for recreation, commercial activity, research and education, jobs and much
more. Because these areas are hubs in the geospatial structure of human use in the Sound they
are particularly important to the information, data and mapping of the Blue Plan. These areas
also account for much of the economic activity of the maritime industries which have a
significant impact on the Sound’s economy. For Connecticut, maritime industries have over $5
billion dollars of impact according to a report of the CT Maritime Coalition in 2010 (CT
Maritime Coalition, 2010). Because of the close connection between harbors and marinas with
the maritime industry sector, we present information on all three. Although there is significant
information about these sectors there remains a need for greater geospatial information about
them. Several maps and charts are included in this chapter’s appendix which provide
information and context for harbors, marinas and the maritime industry sector.
Basic geospatial information about harbors can be found on traditional NOAA charts, examples
of which are shown immediately below. In addition to showing which and where all the harbors
are, these maps contain a wealth of other spatial information relevant to harbors and marinas
from depth, channel and navigational information to key landmarks and shoreside features –
including marinas.
Maps specifically showing the location of marinas in the Sound have not been completed, at least
not that are in the public domain. The maps below provide general information only. Figure 1
shows that New Haven County has notably less marinas than the other three CT coastal counties.
Each of these three, Fairfield, Middlesex and New London all had the same general number,
between 30 and 47. This is generally correlated with the recreational survey maps shown in the

179
Recreational Boating chapter. It is important to consider the Connecticut and Thames Rivers
which likely contribute to the total number of marinas in those respective counties relative to
New Haven County. Figure 2 provides greater detail but is incomplete as it is focused on those
marinas that have been classified as having “aquaculture purposes.”
Figure 1. Marinas by County, 2013. Estimated number of marinas serving the recreational
boating community. Access available via the Northeast Ocean Data Portal (Northeast Ocean
Data Portal, 2017).
Figure 2. Connecticut Marinas. Locations of marinas in Connecticut used for shellfish growing
area classification purposes. Access available via the Connecticut Aquaculture Mapping Atlas
(Aquaculture Mapping Atlas, 2017).

180
20.2 Assessment of Data Quality
20.2.1 Sources of Data and Metadata
Datasets presented above are available via the Northeast Ocean Data Portal and The Aquaculture
Mapping Atlas. A full report of the metadata for the Marinas by County, 2013 dataset can be
found through the Northeast Ocean Data portal. Results are from research for the Blue Economy
and NOAA’s 2013 Economics: National Ocean Watch (ENOW) database.
Connecticut Marinas data layer is sourced from the Connecticut Department of Agriculture,
Bureau of Aquaculture. A full description of the metadata is available through The Aquaculture
Mapping Atlas portal.
20.2.2 Accuracy, Representativeness, and Relevance of Map Products
In terms of accuracy, the information from the Marinas by County, 2013 (Figure 1) layer is
derived from the Bureau of Labor Statistics and Bureau of Economic Analysis; both of which are
considered authoritative sources. The metadata also describes that spots checks on the data were
conducted as fields were combined in GIS processing.
Because of the limited presentation of harbor and marina information, the larger question is how
representative the maps are. The NOAA navigational chart (Figure 3) information is generally
considered to be accurate and an excellent source of geospatial information about harbors.
Because of the dynamic nature of these areas it is possible that detailed information may not be
completely up to date on all charts at all times, however these maps are generally and frequently
updated.
Also in terms of representativeness, the Marinas by County layer may be dated, as the analysis
was conducted from 2005-2013. The Connecticut Marinas map may also be under representative
as the map only covers marinas classified for aquaculture purposes. A full geospatial depiction of
harbors and marinas is missing and the current mapping does not adequately represent this sector
of Long Island Sound. Stakeholders from the recreational boating sector and others have
expressed a desire to have such a depiction of harbors and marinas.
The existing maps available at this time are relevant to the harbors and marina sector because
they assist in depicting the presence and importance of the sector, however they are incomplete
for representing it.
20.2.3 Data Gaps and Availability of Data to Address Gaps
As has been noted above, there is not a complete and detailed map or maps that depict the
location and identity of harbors and marinas together in Long Island Sound – including both
New York and Connecticut. Such a map should also include boatyards (although they are often
at the same location as the marinas). NOAA navigational maps (Figure 3) provide good

181
geospatial information about harbors for the Sound, however a map which focuses on showing
harbors along with marinas could be particularly useful for spatial planning purposes.
Additionally, visual & scenic resources related to harbors are not covered in the Inventory. There
is a gap in knowing what harbors may be considered scenic and conversely, which harbors serve
as access points for viewing scenic resources seaward of the land base (e.g., the historic red
cottage viewed in a wild dune and marsh area across the water from the Guilford Harbor is a
scenic icon in town). Finally, historic and working waterfronts are missing from the inventory.
There is a gap in knowing (and having a map) about which LIS waterfronts are considered
historic and/or working waterfronts.
(a)
(b)
Figure 3. Example display of NOAA Charts. (a) NOAA charts webpage showing different chart
delineations. (a) Example chart for New Haven harbor. Access available via Office of Coast
Survey (NOAA, 2017).

182
20.3 Relevance
20.3.1 Relative Historical Importance
The maritime industry, and related harbor operations, are over three centuries old and are a vital
part of Connecticut’s culture and economy (Connecticut Maritime Coalition, 2000). Connecticut
historically has been seen to be advantageous for the development for harbors and ports as its
coastline is sheltered and protected by heavy seas in the Atlantic (Parsons, Brinckerhoff, Hogan,
& MacDonald, 1946).
This protected geographical location has allowed harbors to develop and evolve over time. This
industry has passed through a series of phases in its evolution, focusing on commercial shipping
and industrial facilities, to focusing on recreational use, inclusive of marinas and recreational
boating facilities. Through this evolution, Connecticut’s coast has demonstrated an ability to
restructure and redefine with changing conditions (Connecticut Maritime Coalition, 2000).
To see examples of this evolution, Figures 4-6 showcase what harbors looked like in 1946 vs.
what they look like today. For example, the modern day Greenwich harbor image illustrates
substantial development with office, residential, hotel, and restaurant spaces; which is vastly
different from the lumber and coal yards that resided in that spot in the late 1800s and early
1900s.
Another way to understand the historical evolution of Connecticut’s harbors and marinas along
Long Island Sound is to read through some of the regions Harbor Management Plans. For
instance the City of Stamford’s Harbor Management Plan describes the origin of the coast in the
1600s as Native American land that was sold to Puritans, transforming it with gristmills,
sawmills, and fulling mills (Stamford Harbor Management Commission, 2009). Then the
document migrates through the industrial revolution describing railways and industries, and
comes into the modern day as the harbor is a hub for corporate offices (Stamford Harbor
Management Commission, 2009).
An additional part of the evolution of Connecticut’s harbors, has been the recognition by the
federal government as to what harbors and ports are important for federal navigation, and
therefore open to federal Army Corps of Engineer projects (i.e., dredging) (Figure 7) (Army
Corps of Engineers, 2015). These projects have allowed Connecticut ports to be centers of
commercial shipping, industry, and recreational use.
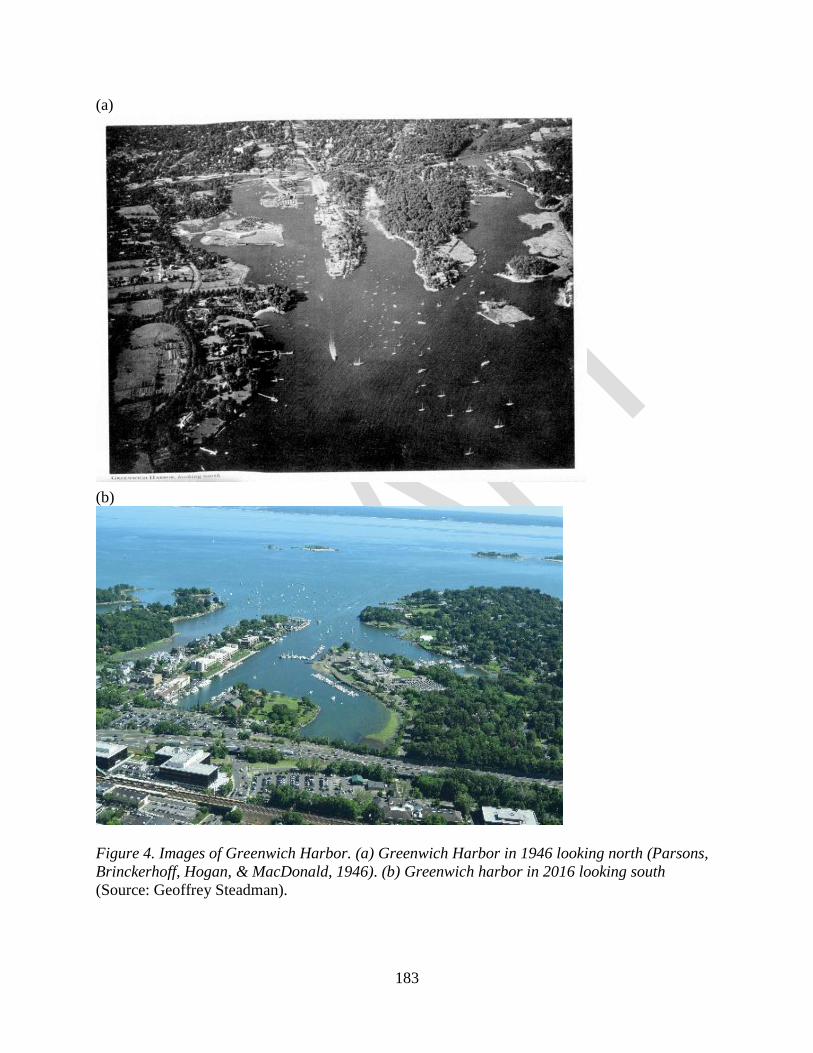
183
(a)
(b)
Figure 4. Images of Greenwich Harbor. (a) Greenwich Harbor in 1946 looking north (Parsons,
Brinckerhoff, Hogan, & MacDonald, 1946). (b) Greenwich harbor in 2016 looking south
(Source: Geoffrey Steadman).

184
(a)
(b)
Figure 5. Images of Norwalk Harbor. (a) Norwalk Harbor in 1946, far perspective (Parsons,
Brinckerhoff, Hogan, & MacDonald, 1946). (b) Norwalk Harbor in 2015, close perspective
(Source: Geoffrey Steadman).

185
(a)
(b)
Figure 6. Images of Stamford Harbor. (a) Stamford Harbor in 1946, far perspective (Parsons,
Brinckerhoff, Hogan, & MacDonald, 1946). (b) Stamford Harbor in 2016, close perspective
(source: Geoffrey Steadman).
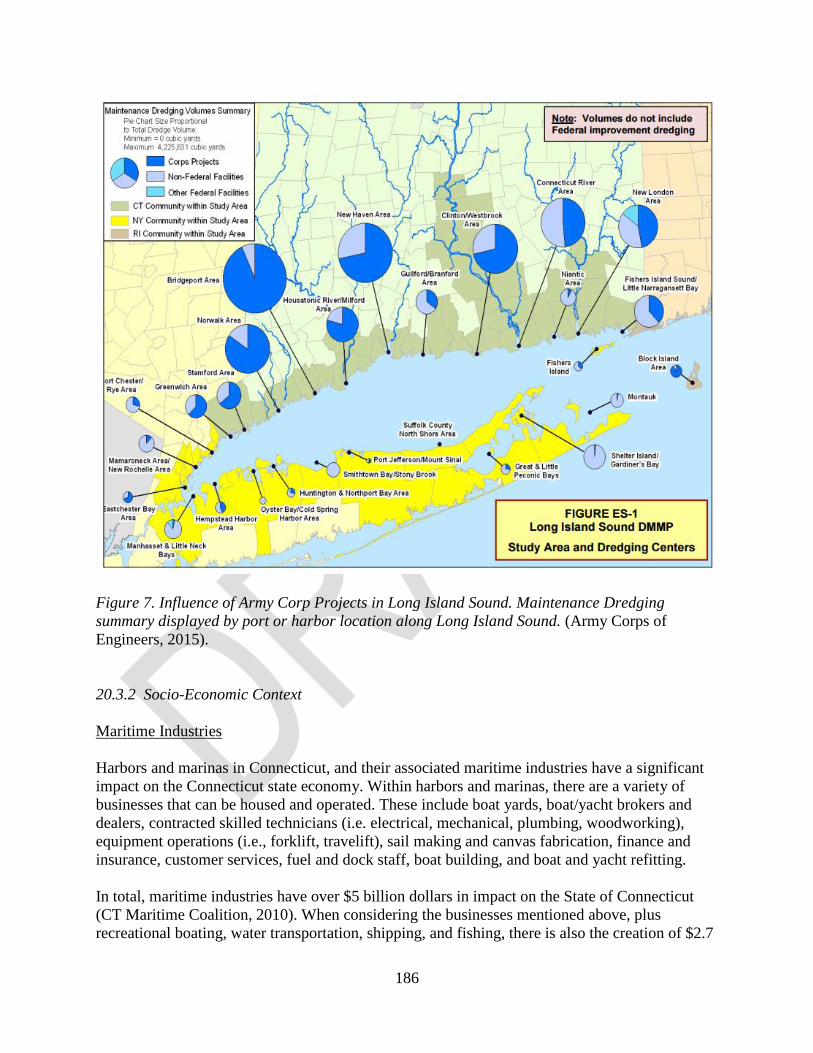
186
Figure 7. Influence of Army Corp Projects in Long Island Sound. Maintenance Dredging
summary displayed by port or harbor location along Long Island Sound. (Army Corps of
Engineers, 2015).
20.3.2 Socio-Economic Context
Maritime Industries
Harbors and marinas in Connecticut, and their associated maritime industries have a significant
impact on the Connecticut state economy. Within harbors and marinas, there are a variety of
businesses that can be housed and operated. These include boat yards, boat/yacht brokers and
dealers, contracted skilled technicians (i.e. electrical, mechanical, plumbing, woodworking),
equipment operations (i.e., forklift, travelift), sail making and canvas fabrication, finance and
insurance, customer services, fuel and dock staff, boat building, and boat and yacht refitting.
In total, maritime industries have over $5 billion dollars in impact on the State of Connecticut
(CT Maritime Coalition, 2010). When considering the businesses mentioned above, plus
recreational boating, water transportation, shipping, and fishing, there is also the creation of $2.7

187
billion in gross state product, $56 million in local taxes, and $54 million in state revenues (CT
Maritime Coalition, 2010). Additionally more than 30,000 jobs and $1.7 billion in household
income can be attributed to the maritime industry sector. Wages in the maritime-dependent
sector averaged $63,000 per job in 2007, which is 15% higher than the average wage for all jobs
in Connecticut (CT Maritime Coalition, 2010). A breakdown of marine dependent industries jobs
and wages by smaller sectors, like boat dealers and ship building, is noted in Table 1.
Table 1. Maritime Dependent Industries in Connecticut: Total Jobs and Worker Earnings, 2007
(CT Maritime Coalition, 2010).
These economic factors are also very different between the coastal counties in Connecticut
(Fairfield, New London, New Haven, and Middlesex). New London had the greatest economic
output and job creation in 2010, most likely attributed shipbuilding for commercial and military
purposes (Figure 8) (Pomeroy, Plesha, & Muawanah, 2013).
(a) (b)
Figure 8. Economic Output and Job Creation from Maritime Industries in Connecticut. (a) Total
Output Impact in 2010 (in million dollars). (b) Total maritime jobs generated in 2010. (Pomeroy,
Plesha, & Muawanah, 2013)

188
Marinas and Harbors
In 2008, marinas in Connecticut’s four coastal counties totaled 125, employed over 1,300
individuals, and distributed approximately $60 million in payroll (National Marine Fisheries
Serivce, 2008). Prior to the Great Recession in 2008, there was rapid growth in the marina
industry. In the four coastal counties marina employment increased by 42.1% and aggregate
payroll increased by 52.5%, from 2001 to 2007 (CT Maritime Coalition, 2010). Fairfield County
held the highest increase in both employment and aggregate payroll with 106.8% and 111.0%,
respectively (CT Maritime Coalition, 2010).
Visitors to marinas also contribute significantly to the economy, as in 2004 marina visitors spent
a total of $554.3 million primarily on marina sales including membership fees, boat rentals, slip
and mooring fees, boat repair, sail repair, notary services, and chandlery services (McMillen,
2006). Other significant travel expenditures included shopping at $22.3 million and meals at
$17.2 million (McMillen, 2006). For more information on the economics of the recreational
boating sector, refer to Chapter 19 Recreational Boating.
Harbors also require periodic dredging in order to be able to operate. The maintenance of
dredging to adequate depths, excluding federal navigation channels, is estimated at $82 million
(CT Maritime Coalition, 2010). Without the dredging of these harbors it is predicted that all
maritime industries will suffer revenue losses. For instance, over the next 20 years fishing may
incur approximately 58.3% in revenue losses, ship/boat building and repair at 44.8%, boat
dealers in coastal countries at 9.7%, water transportation at 31.8%, and marinas in coastal
countries at 42.7% (CT Maritime Coalition, 2010).
For more information on the economics of marine shipping and infrastructure, refer to Chapter
25 Marine Transportation, Navigation, and Infrastructure. Also refer to Chapter 26 Energy and
Telecommunications for more information on energy facilities and cables that may interact with
harbor activities.
20.3.3 Other Notes
Harbor management has a significant role on Connecticut’s coast. With the passage of the
Harbor Management Act in 1984, CT DEEP’s Coastal Management staff have been assisting
coastal towns with the development of harbor management plans (CT DEEP, 2017c). The plans
allow for the preservation of coastal resources in the harbor, the distribution and location of
seasonal moorings, and access to federal navigation channels (CT DEEP, 2017c). The status as
of November 2017, of Harbor Management Plans can be found through the Harbor Management
Plans in Connecticut Status document on CT DEEP’s website (CT DEEP, 2017a). The Harbor
Management Act also allows for the appointment of Harbor Masters, who are responsible with
the supervision and care of harbors and navigable waters in their jurisdiction (CT DEEP, 2017d).
As an overview of harbor management in Connecticut, there are 36 coastal towns, with 26 harbor
management commissions (2 commissions in non-coastal towns, 3 commissions in the Town of
Stonington, and separate commissions for the City and Town of Groton) (Steadman, 2015).

189
There is also 24 harbor management plans (2 of which are in non-coastal towns and 3 in the
Town of Stonington) and 40 harbor masters (6 of whom are in non-coastal towns and 5 harbor
masters in the Town of Stonington) (Steadman, 2015). There are 24 towns with harbor masters
and harbor management commissions and 11 towns with harbor masters but no harbor
management commissions (Steadman, 2015).
20.4 References
Aquaculture Mapping Atlas. (2017). Retrieved from Aquaculture Mapping Atlas :
https://clear3.uconn.edu/aquaculture/
Army Corps of Engineers. (2015). Long Island Sound: Connecticut, New York, and Rhode
Island.
Connecticut Maritime Coalition. (2000). Connecticut Maritime Coalition: Strategic Cluster
Initiative.
CT DEEP. (2017a). Harbor Management Plans in Connecticut: Status as of November 2017.
Retrieved from
http://www.ct.gov/deep/lib/deep/long_island_sound/coastal_management/harbor_masters
/hmp_status_november_2017.pdf
CT DEEP. (2017b). Long Island Sound Blue Plan Webinars. Retrieved from Connecticut
Department of Energy and Environmental Protection:
http://www.ct.gov/deep/cwp/view.asp?a=2705&q=593814&deepNav_GID=1635
CT DEEP. (2017c, July 10). Overview of the Coastal Management Program. Retrieved from
Connecticut Deparment of Energy and Environmental Protection:
http://www.ct.gov/deep/cwp/view.asp?a=2705&q=323536
CT DEEP. (2017d, November 6). The Connecticut Harbor Masters Program. Retrieved from
Connecticut Department of Energy and Environmental Quality:
http://www.ct.gov/deep/cwp/view.asp?a=2705&Q=594656&deepNav_GID=1635
CT Maritime Coalition. (2010). Economic Impact Study of Maritime Industries in Connecticut.
South Windor, CT and Mattapoisett, MA: Apex Companies, FXM Associates.
McMillen, S. (2006). The Economic Impact of the Arts, Film, History, and Tourism Industries in
Connecticut. CT Commission on Culture and Tourism by Connecticut Center for
Economic Analysis .
National Marine Fisheries Serivce. (2008). Marine Economy, Connecticut. NOAA.
NOAA. (2017). Office of Coast Survey. Retrieved from
http://www.charts.noaa.gov/InteractiveCatalog/nrnc.shtml
Northeast Ocean Data Portal. (2017). Northeast Ocean Data. Retrieved from
http://www.northeastoceandata.org/data-explorer/
Parsons, Brinckerhoff, Hogan, & MacDonald. (1946). An Economic and Engineering Survey of
all Navigable Waters in the State for the CT Port Survey Comission.
Pomeroy, R. S., Plesha, N., & Muawanah, U. (2013). Valuing the Coast: Economic Impacts of
Connecticuts Maritime Industry. Connecticut Sea Grant.
Stamford Harbor Management Commission. (2009). City of Stamford Harbor Management Plan.
Stamford, CT.
Steadman, G. (2015). Connecticut Towns and Municipal Areas with Coastal and Navigable
Waterways: Connecticut Harbor Management Association.
190
20.5 Appendices
20.5.1 List of Maps Used to Inform the Chapter
Below is a list of all maps used to inform this chapter, including maps presented above in the
narrative and additional maps used to support chapter findings. Maps listed below are organized
by the online data portal on which they are hosted (URL links to data portals are noted in Section
20.4 References above). Map products not accessible by online data portal are also noted below.
Northeast Ocean Data Portal
Marinas by County, 2013
CT Aquaculture Mapping Atlas
Marinas
Non-Portal Map Products
NOAA Charts
Influence of Army Corp Projects in Long Island Sound
More information on some of the map products presented in this chapter, including URL links to
data and metadata, can be found in the Recreational Boating Map Book and Marine
Transportation, Navigation, and Infrastructure Map Book (CT DEEP, 2017b) . Not all products
showcased in the map book may be addressed in this chapter or utilized to inform the final Blue
Plan.
20.5.2 Notes on Stakeholder Engagement
Communication with leaders of the Connecticut Harbor Management Association (CHMA),
Connecticut Marine Trades Association (CMTA) and Connecticut Maritime Coalition (CMC)
have been instrumental in providing information about the harbors, marinas and maritime
industry sectors of Long Island Sound. Blue Plan officials met with CMTA staff and board
members in November 2017, and efforts are underway to meet with harbor management
commission leaders and the CMC in early 2018.
It is from these discussions that much of the information used to complete this chapter emerged.
Other key points included discussion about geographic areas where they may be overlap between
harbor management jurisdiction and the spatial areas of the Blue Plan which are from the 10’
depth contour seaward. The basic message is that the Blue Plan does not alter or impact the
jurisdiction of the harbor management commissions but should aid in providing greater clarity on
State policy in general for all areas of the Sound in the State of CT. In nearly all cases, much of
the discussions focused on better understanding how the Blue Plan is intended to work and how
it would help protect traditional human uses and ecologically significant resources.

191
Chapter 21. Non-Consumptive Recreation
Chapter Table of Contents
21.1 Key Data and Map Products .............................................................................................. 191 21.2 Assessment of Data Quality ............................................................................................... 197
21.2.1 Sources of Data and Metadata ................................................................................. 197 21.2.2 Accuracy, Representativeness, and Relevance of Map Products ............................. 198
21.2.3 Data Gaps and Availability of Data to Address Gaps .............................................. 198 21.3 Relevance ........................................................................................................................... 200
21.3.1 Relative Historical Importance ................................................................................. 200 21.3.2 Socio-Economic Context ........................................................................................... 201 21.3.3 Other Notes ............................................................................................................... 203
21.4 References .......................................................................................................................... 203 21.5 Appendices ......................................................................................................................... 204
21.5.1 List of Maps Used to Inform the Chapter ................................................................. 204 21.5.2 Notes on Stakeholder Engagement ........................................................................... 205
21.1 Key Data and Map Products
Non-Consumptive Recreation (NCR) in Long Island Sound (LIS) takes many forms and occurs
throughout the Sound, from the beaches along both shores to shipwrecks deep below the surface.
For the purposes of this chapter, the non-consumptive recreational activities occurring in LIS
include: general recreation and tourism (e.g., beachgoing, lighthouse cruises), recreational scuba
diving, kayaking and other paddle sports, and wildlife watching.
Many non-consumptive recreational activities begin as shore-based activities, even if they occur
mostly in water deeper than 10 feet. Because of this, and the bulk of equipment that must be
transported by a single participant (kayak and paddle, Scuba gear, spotting scope, etc.) from a
vehicle to the water, these users require unobstructed access points to the Sound. This sentiment
was repeated in every Scuba conversation throughout this process, as well as voiced by paddle
sports representatives.
Most geospatial information pertaining to the NCR sector comes from three studies, conducted
as part of the regional planning efforts in the Northeast and Mid-Atlantic, between 2012 and
2015. As both regional efforts contain LIS in their study areas, this Inventory benefits by
including information from each. Furthermore, the reports symbolize similar data in very
different ways, lending a depth to the characterization of NCR that many other sectors do not
enjoy.
NCR spatial information from the 2015 Characterization of Coastal and Marine Recreational
Activity in the U.S. Northeast report is available on both the New York Geographic Information
Gateway (NYGIG) and the Northeast Ocean Data Portal (NODP) (Northeast Ocean Data Portal,
2018) (New York Geographic Information Gateway, 2018). These data are presented in point

192
form showing many different NCR activities broken out by use (Figure 1). These include Shore
Based Activities, Surface Water Activities, Wildlife and Sightseeing, and Diving and Snorkeling.
Relevant to this sector, the 2012 Northeast Recreational Boater Survey gathered information on
Wildlife Viewing, Relaxing, Diving, and Swimming as they occur from personal pleasure craft.
1,940 eligible respondents from Connecticut and 1,766 from New York participated in the
survey, which asked about boat-based recreational activities. Participants from both states,
separately, declared 58% of the locations identified in the survey as used for one form of NCR or
another; the other 42% were declared as fishing (Figure 1). These map products are also
available on the NYGIG and NODP.
(a)
(b)
Figure 1. (a) All Individual Ocean Uses, and (b) All Recreational Boater Activities. Other maps
in the later series show further breakdown of activities; for example, wildlife viewing by species.
Access available via the Northeast Ocean Data Portal (Northeast Ocean Data Portal, 2018).

193
Data from the U.S. Mid Atlantic Coastal and Ocean Recreation Study, available on the Mid-
Atlantic Ocean Data Portal, is not presented based on discrete locations but rather by intensity of
use in a grid, 1km to a side, along the coast (Figure 2) (MARCO, 2018). Datasets presented in
this report include Wildlife Watching, Surface Water Activities, Shore-based Activities, and
Underwater Activities (i.e., SCUBA).
Figure 2. Shore-Based Activities. Other maps in this series show Surface Water Activities,
Underwater Activities, and Wildlife Watching. Available online from the Mid Atlantic Ocean
Portal (MARCO, 2018).
Scuba diving locations are represented separate from the point datasets in the NYGIG and the
NODP, though the data were collected as part of the same effort. Scuba locations are shown as
points buffered out various distances based on source (Figure 3). Several stakeholders also
suggested that using the latest NOAA Automatic Wreck and Obstructions Information System
(AWOIS) data set (NOAA Office of Coast Survey, 2017) would be helpful to identify some, but
not all, features that are important to the dive community.
Additional datasets useful in characterizing this sector include Beaches, Water Trails, Boat
Launches, and Coastal Access Sites (as presented in the map book used with outreach for this
sector). However, the Coastal Access Sites (Figure 4) do not necessarily show where a kayak or
SUP can be launched, or Scuba may occur. Rather, these points are in many cases where the
public may approach and view the shore. There may be barriers – rocks, vertical drops, and
fences – separating participants from the Sound. The Connecticut Coastal Access Guide is an
interactive online data portal that more completely characterizes and describes these coastal
access sites, discovered by staff after the data vetting process, and should be used by anyone
interested in coastal access.
In Connecticut Scuba diving is prohibited from State boat ramps, meaning shore access is limited
to a few State and local beaches, which are heavily used by the dive community and crucial to
the sport. Divers on Long Island report similar difficulties with coastal access, siting restrictions
by private land, limited parking, or required permits.

194
(a)
(b)
(c)
Figure caption on next page.

195
Figure 3. Three possible ways of displaying Scuba activity in the Sound. (a) Recreational
SCUBA Diving Areas, including both shore-accessed and boat-accessed sites, from the
Northeast Ocean Data Portal. (b) NOAA Automatic Wrecks and Obstruction Information
System (AWOIS) dataset, as many dive sites are reefs, obstructions, and wrecks that appear in
the database. Also from the Northeast Ocean Data Portal. (c) Underwater Activities,
represented as intensity of use areas; Mid-Atlantic Ocean Data Portal (MARCO, 2018;
Northeast Ocean Data Portal, 2018).
Figure 4. Coastal Access Sites, from the Connecticut Coastal Access Guide. Note that not all
sites are conducive to all non-consumptive recreational activities, but a more detailed
description is available by clicking on each site (Connecticut Department of Energy and
Environmental Protection, n.d.).
One of the most common forms of non-consumptive recreation in LIS is Beachgoing: opt-in
surveys indicated that 90% of all recreational users of the Sound went to the coast for the simple
intrinsic pleasure of enjoying the beach at least once a year (Point 97, SeaPlan, and the Surfrider
Foundation), (Surfrider Foundation with Point 97, The Nature Conservancy, and Monmouth
University's Urban Coast Institute, 2014). Beaches are a primary draw for coastal tourism in
both Connecticut and Long Island, and important to the coastal economy. Figure 5 displays
beaches throughout LIS that are monitored by the EPA for water quality and other environmental
conditions, and may be closed if contaminates exceed minimum health and safety standards.
Note that these are not necessarily all of the beaches in Connecticut and Long Island, but the
ones that are monitored nationally. Please see Chapter 20 Research, Monitoring, and Education,
for a further discussion of water quality monitoring in the Sound.

196
Figure 5. Beaches designated under the EPA Beach Advisory and Closing Online Notification
system (BEACON). Water quality information in this database is provided by states and other
sources. Please see the BECON website for more detail. Map from Northeast Ocean Data
Portal (Northeast Ocean Data Portal, 2018).
Wildlife watching may be either an individual or chartered activity. Many bird watchers utilize
both shore sites and boat transits to observe sea birds over half a mile out. Viewing typically
includes use of binoculars, telescopes and telephotography cameras. In addition to being a
recreational activity, many bird watchers contribute to citizen science monitoring efforts through
programs such as the Christmas Bird Count and eBird database (see chapter 20, Research,
Monitoring, and Education). Locations for these activities are recorded, and discussed below in
Data Gaps. The Maritime Aquarium at Norwalk offers dedicated wildlife watching charters on
their research vessel (R/V Spirit of the Sound) from December through March. These cruises
allow customers opportunities to view birds (e.g., buffleheads, mergansers, brant, and long-tailed
ducks) and seals at haul-out sites near the Norwalk Islands (The Maritime Aquarium, 2018).
(See Chapter 3 Marine Mammals and Chapter 5 Birds for ecological characterization
information on these species.) Other organizations, such as Project Oceanology, offer seasonal
seal watch cruises in the eastern Sound (Project Oceanology, 2016). While whale watching is a
significant recreational activity in greater New England and New York (O'Connor, Campbell,
Cortez, & Knowles, 2009), most whale sightings in LIS are incidental, not part of a targeted
whale watching effort. As is noted in Chapter 3 Marine Mammals, sightings of several species
of cetaceans in LIS has increased over the last few decades.
Sightseeing on charter vessels occurs throughout LIS. For example, the Maritime Aquarium also
offers lighthouse cruises aboard R/V Spirit of the Sound; these run spring through fall and visit
the lighthouses in Western (Greens Ledge, Sheffield Island, Stamford Harbor [or Harbor Ledge],
Great Captain Island, Execution Rocks, Stepping Stones, Sands Point and Eatons Neck) and
Central (Peck Ledge, Greens Ledge and Sheffield Island lighthouses in Norwalk, Penfield Reef
Lighthouse in Fairfield and Stratford Shoal [Middle Ground] Light) LIS (The Maritime
Aquarium, 2018).

197
21.2 Assessment of Data Quality
21.2.1 Sources of Data and Metadata
Datasets from the 2015 Characterization of Coastal and Marine Recreational Activity in the U.S.
Northeast, and the 2012 Northeast Recreational Boater Survey are available on the NYGIG and
NODP. While a full detailing of the methodology of each is available in the final reports, the
details relevant to validating the data quality as the best available are discussed here.
The Characterization of Coastal and Marine Recreational Activity in the U.S. Northeast report
contains survey-generated location information for the recreational Scuba Activity, Board and
Paddle events, Shore-based Activities, Surface Water Activities, and Wildlife and Sightseeing.
These surveys were conducted between September 2014 and May 2015, and “gathered over
19,000 data points from 975 respondents,” characterizing twenty non-consumptive activities
(Point 97, SeaPlan, and the Surfrider Foundation). These activities are summarized in Table 1,
and presented in Figure 1. All accompanying metadata for the resulting map products as
described above may be found in this report, or associated with each layer in the Northeast
Ocean Data Portal.
The 2012 Northeast Recreational Boater Survey targeted the activities of recreational boaters in
coastal Northeast counties. These surveys were administered online in monthly increments for
the boating season of 2012 and collected information on spatial use, economic information, and
additional relevant data (such as number of trips and primary activity). All accompanying
metadata for the resulting map products as described above may be found in this report, or
associated with each layer in the Northeast Ocean Data Portal.
The U.S. Mid Atlantic Coastal and Ocean Recreation Study conducted for the Mid-Atlantic
Regional Council in 2014 utilizes results from an online use and mapping survey. Survey results
represented 28 participants from Connecticut and 316 participants from New York, though it
should be noted that the majority of mapped areas in New York are on the south shore of Long
Island. The maps of use intensity are models based on input from the survey and proven
statistical methods (Surfrider Foundation with Point 97, The Nature Conservancy, and
Monmouth University's Urban Coast Institute, 2014). All accompanying metadata for the
resulting map products as described above may be found in this report, or associated with each
layer in the Mid-Atlantic Ocean Data Portal.
Coastal Access Sites as reviewed with participants were provided through the Connecticut
Aquaculture Mapping Atlas. These appear to have originated in the CT Coastal Access Guide,
which provides additional information on each site, such as parking, boat launch capacity, and a
brief description of landscape and activities. The superior information from the Guide has
supplanted the Access Sites from the Atlas in this Inventory, and should be used by anyone with
questions regarding coastal access in Connecticut. Metadata for the Guide is available in the
portal.
The Beaches locations also come from the Northeast Ocean Data Portal, but are not identified by
the coastal recreation surveys. Rather, this dataset is from the EPA Beach Advisory and Closing
198
Online Notification (BEACON) program, with metadata available here, or associated with the
layer on the NODP.
21.2.2 Accuracy, Representativeness, and Relevance of Map Products
Through an in-person Scuba club meeting and two webinars, the Scuba community in
Connecticut and Long Island agreed that while diving does occur at all the locations designated
in both datasets, and many of the most important and heavily-used sites are included in the
existing maps, there is a need to designate a few of the most important sites; those that are used
by the scuba charter boats and known throughout the community (see Section 21.2.3 Data Gaps
and Availability of Data to Address Gaps). The existing map products are therefore relevant for
planning, but not accurate or representative enough to fully characterize the diving community.
In a similar webinar held for other non-consumptive recreation experts, all of the non-Scuba
recreational data layers received no response as to validity of map products from expert
stakeholders in both CT and NY. Similarly, targeted emails also received no response. A single
prominent CT kayak club leader commented by phone that the single greatest limitation to
paddle sports is coastal access; that even in busy and industrialized New Haven harbor the
difficulty of paddling comes not with conflicting uses, but rather with gaining access to the
Sound. These majority of these map products can be considered sufficiently accurate,
representative, and relevant to planning, as no dissent was expressed over their content, and
locations such as boat launches can be empirically evaluated. The HUDS data, however, is not
accurate, representative, or relevant to this sector, as it is far too small-scale to provide
meaningful insight about where in LIS people recreate.
The Connecticut Coastal Access Guide is published by CT DEEP, and is an authoritative source
for coastal access information in Connecticut. The information it contains should be considered
accurate and representative for the Connecticut coast, and is relevant to planning.
The Beach locations map product also received no comment, but can be considered to be
accurate and representative, at least of monitored beaches, as a Federal dataset. While beaches
are by definition outside of the 10-foot contour policy boundary, they are immensely important
to recreation and tourism in both coastal CT and Long Island, and easily impacted by offshore
activity that disturbs water or air quality, aesthetic value, or produces sound pollution. Beach
locations in this dataset are provided Sound-wide, and are relevant to planning.
21.2.3 Data Gaps and Availability of Data to Address Gaps
This study of NCR in LIS revealed several data gaps in each subsector, some of which can be
easily filled by simple desktop research and expert consultation, while others will require a
detailed and thoughtful study to address.
As expressed by many divers, the existing charted dive locations do not specifically note the
most crucial sites in the Sound used by the community. Adding these to the geospatial dataset

199
will accurately reflect sites divers and shops rely on, and will represent the community as a
whole. These sites, identified by divers, will be relevant to planning as they are considered the
most key to the survival of the sport in the Sound.
Not directly mentioned in this chapter, but still associated, are designated Scenic Areas for both
States. These must be researched, mapped, and included in this Inventory. This effort must be
conducted in such a way that the resulting dataset is accurate, representative, and relevant to
planning, and thus must include shoreline as well as Sound-encompassing viewsheds.
Related to both shore access and visual resources is a priority need to map all beach areas in CT
and on Long Island. While these are partially covered in the EPA Beaches dataset available on
the NODP and NYGIG, these areas are important to recreation and tourism throughout the
Sound and should be further quantified. Included in this is an identification of activities and
quantification of beachgoing; especially relevant considering that beachgoing as an activity itself
was part of 90% of respondents to the 2014 and 2015 coastal recreation reports.
There is a need to identify where most paddlers go and what areas are most crucial to the sport,
as no stakeholders have commented on existing data sets as this time. This can be done through
a participatory mapping process with several of the clubs in Connecticut and Long Island, whose
input would be believed to be accurate and representative. As conversations with representative
experts pointed to a greater concern over shore access, mapping where paddlers go may not be as
relevant as mapping where they launch and recover from.
The Wildlife Watching dataset for LIS is currently based on opt-in surveys. While this does
include charter and party boat activity (Table 1), it does not include input from the charter boat
operating community. As several organizations conduct specific wildlife watching cruises, it is
possible to generate a complete and user-driven dataset for discrete wildlife watching areas, as
well as the relative economic contributions of this sector. This dataset would be more accurate
and representative than the opt-in survey, and thus would be more relevant to planning as well.
A dataset like this would be particularly useful when combined with the ecological
characterization of the species relevant for the cruises (see, in particular, Chapter 3 Marine
Mammals, Chapter 4 Sea Turtles, and Chapter 5 Birds).
Specific to birding, maps should be constructed of where Bird Watching occurs across all of LIS,
including shoreside and from boat traffic. This dataset is believed to exist in tabular form
already, and several local experts not only desire to see it included, but have offered to help
convert it to a map. Doing so will accurately and representatively depict where bird watchers
report going most frequently, and will be relevant to planning as this activity is not just
recreation, it is also longstanding citizen science.
Furthermore, while there is no listed whale watching operation in the Sound, the closest regional
experts in Montauk and New York City should be contacted to confirm this specifically. As
whales become more prevalent in the Sound, at least one participant has expressed an interest in
citizen science effort tracking whales in the Sound (for more information on citizen science
efforts in and around LIS, see Chapter 24 Research, Monitoring, and Education). These brief

200
conversations will not only inform our understanding of the current status of activities, but also
lend insight to possible new uses of LIS.
Similarly, there is a need to determine what lighthouse and sightseeing cruises exist in the
Sound, and what areas are important for their businesses. This may relate to both the
identification of Scenic Areas and wildlife watching as above.
Lastly, there is also a need for specific Economic information of subsector-specific non-
consumptive recreation and tourism throughout the Sound. While the reports below capture
some of this, there is no discrete breakdown by Scuba, wildlife watching, etc. For many sectors
this would not be difficult to approximate, simply by asking all known shop owners and
outfitters what their annual budgets are, or a professional firm could be hired to do a
comprehensive study. Additionally, there is little tourism-specific data included; such as popular
tourist destinations, or how much of coastal economy is from tourism vs. residents. Follow-up
on this point should occur with both the CT Office of Tourism and Discover Long Island. All of
this information will improve the characterization of the Non-Consumptive Recreation sector
and emphasize the importance of considering discrete areas for each group in a planning or
permitting process.
Lastly, some activities such as parasailing and hang-gliding have not been characterized well, in
part because only one participant registered this as an activity in the surveys.
21.3 Relevance
21.3.1 Relative Historical Importance
Recreational scuba diving was born in the 1950s when advances in Navy diving techniques
became available to the layman. The term SCUBA stands for “Self-Contained Underwater
Breathing Apparatus” and has since become the general term for using a tank of compressed air
and associated gear to explore the underwater world whether for recreational or commercial
purposes. Scuba diving in Long Island Sound can be directly traced back to the late 1950s and
early 1960s with the local scuba clubs, Gillmen and South East Connecticut Skin Divers
(SECONN) being formed in 1956 and 1963 (respectively). Both clubs have a few members who
have witnessed the sport grow from infancy to one of the fastest growing sports in the world.
Long Island Sound attracts divers from the Tri-State area as well as the rest of New England.
Diving in Long Island Sound has been active since the beginning of scuba as a recreational sport.
The desire to explore the unknown drew local divers to the many shipwrecks that litter Long
Island Sound. In the early 1960s, many would accompany trawl fishing vessels in a mutualistic
relationship – divers would be able to discover potential wreck sites and draggers had
experiences personal aboard to retrieve nets and gear that became entangled. Before the
invention of sidescan sonar and seafloor mapping, this was the best method of finding new sites
to dive.
Paddle sports have gained popularity in LIS over the last 10 years, adding stand-up
paddleboarding (SUP) to the existing activities of kayaking and canoeing. While SUP activities

201
remain mostly confined to calmer bays and harbors (Point 97, SeaPlan, and the Surfrider
Foundation) where launch and recovery of the boards is easier, kayakers have for decades
traveled Sound-wide.
21.3.2 Socio-Economic Context
There are currently at least five dive clubs in Connecticut and one in Long Island. Each club
varies in size, with the largest Connecticut-based club (SECONN Skin Divers) having more than
200 annual members. Many of the divers who frequent Long Island Sound are world-travelers,
but prefer “home” waters, and support at least 10 dive shops (more than two per coastal county)
in CT, and a further 10 shops in New York and Long Island bordering the Sound (Google Maps,
2017). These shops bring in direct cash flow through gear sales and scheduled dive trips (both
local and abroad). In addition, there are at least two Scuba charter vessels operating in the
Sound, and several Rhode Island based charters occasionally use the Eastern Sound as well.
Indirectly, divers support local establishments through travel and meal costs associated with
most trips.
The economic impact of each specific activity or subsector examined in this chapter has not, to
date, been published in any known report. However, all three regional reports referenced here
have quantified broader aspects of the recreation and tourism economy of Long Island Sound.
The NCR reports found that Connecticut stakeholders spend an average of $186.18 per person
per coastal visit, with the top most popular activities being beachgoing, sightseeing, and
swimming (Point 97, SeaPlan, and the Surfrider Foundation), while New Yorkers spend an
average of $55.93 per visit, and engage primarily in beachgoing and sightseeing (Surfrider
Foundation with Point 97, The Nature Conservancy, and Monmouth University's Urban Coast
Institute, 2014).
The National Ocean Economics Program (NOEP) estimates economic information based on
Bureau of Labor Statistics and Bureau of Economic Activities in cooperation with NOAA’s
Office of Coastal Management. These data can be sorted by sector industry and county, and are
presented in Tables 2 and 3 below (Middlebury Institute of International Studies at Monterey,
2017).

202
Table 2: 2014 economic impacts of Recreational Industries in the 4 Connecticut coastal counties
(Fairfield, New Haven, Middlesex, and New London). Note that “D” represents Disclosure
issues prevent that this data from being presented. From National Ocean Economic Program.
Table 3: 2014 Ocean Economic Impacts of Tourism and Recreation Industries in the 3 New York
coastal counties. Note that Establishments are not broken out into subsectors as are available
for Connecticut, and that the two Long Island counties (Nassau and Suffolk) also receive
economic benefits from the Atlantic shore, as well as from LIS. From National Ocean Economic
Program.
The Connecticut Office of Tourism (CT OOT) tracks tourist and travel information within the
State. While the published information does not specifically highlight coastal tourism as above,
it does divide the information by county, and provides both a tourism industry sales total as well
as the percentage represented by recreation. The data for 2015 are the most recent as of this
writing, and are presented in Table 4.
Table 4: 2015 Connecticut Tourism Industry Sales by coastal county. Note that New London
County tourism overwhelmingly relies on recreational opportunities, though this could result
from the two casinos near Norwich. From Connecticut Office of Tourism.
County Recreation
(millions)
Tourism Industry Sales Total
(millions)
Rec. % of Total
Fairfield $472.90 $2,369.50 20%
New Haven $230.70 $1,135.50 20%
Middlesex $120.50 $660.40 18%
New London $1,495.20 $2,205.10 68%
Industry Establishments Employment Wages GDP
Amusement and Recreation
Services NEC 149 2,205 $52,317,978 $49,389,332
Eating & Drinking Places 2,233 28,808 $543,845,166 $1,032,465,367
Hotels & Lodging Places 138 4,193 $126,368,788 $459,171,077
Recreational Vehicle Parks &
Campsites D D D D
Scenic Water Tours 10 65 $1,262,855 $1,955,383
Sporting Goods Retailers D D D D
Zoos, Aquaria 11 613 $22,751,481 $58,495,709
County Establishments Employment Wages GDP
Nassau 1,242 15,121 $312,866,000 $572,697,000
Suffolk 2,248 29,089 $628,083,000 $1,223,731,000
Westchester 333 3,820 $90,169,000 $168,080,000

203
21.3.3 Other Notes
Several members of the dive community expressed interest in the mandated periodic updates to
this Inventory, citing the fact that new discoveries or shipwrecks may create popular dive sites.
For example, the 1984 sinking the tug and barge Celtic and Cape Race (Bachand, 2017) created
a dive site that remains popular to this day. Furthermore, the contents of the barge Cape Race
were salvaged in 2008, without the application for a Connecticut Department of Environmental
Protection (CT DEEP) permit (Koch, 2008), removing one of the more interesting facets of the
wreck.
21.4 References
Bachand, R. (2017). Anatomy of a Shipwreck: the Tug "Celtic" and its Barge "Cape Race".
Retrieved from Boating World: https://www.liboatingworld.com/single-
post/2017/01/12/Anatomy-of-a-Shipwreck-The-Tug-%E2%80%9CCeltic%E2%80%9D-
and-Its-Barge-%E2%80%9CCape-Race%E2%80%9D
Connecticut Department of Energy and Environmental Protection. (n.d.). Connecticut Coastal
Access Guide. Retrieved from http://www.depdata.ct.gov/maps/coastalaccess/index.html
Koch, R. (2008). Tugboat From 1984 Wreck Salvaged. Retrieved from The Hour:
http://www.thehour.com/norwalk/article/Tugboat-from-1984-wreck-salvaged-
8268224.php
MARCO. (2018). Retrieved from Mid-Atlantic Ocean Data Portal:
http://portal.midatlanticocean.org/visualize/#x=-
73.24&y=38.93&z=7&logo=true&controls=true&basemap=Ocean&tab=data&legends=f
alse&layers=true
Middlebury Institute of International Studies at Monterey. (2017). Ocean Economy Market Data.
Retrieved from National Ocean Economics Program:
http://www.oceaneconomics.org/Market/ocean/oceanEcon.asp
New York Geographic Information Gateway. (2018). Retrieved from New York State:
http://opdgig.dos.ny.gov
NOAA Office of Coast Survey. (2017). Public Wrecks and Obstructions database . Retrieved
from Coast Survey's Wrecks and Obstructions Map Preview:
https://wrecks.nauticalcharts.noaa.gov/viewer/
Northeast Ocean Data Portal. (2018). Northeast Ocean Data Portal. Retrieved from Northeast
Ocean Data: http://www.northeastoceandata.org/data-explorer/
O'Connor, S., Campbell, R., Cortez, H., & Knowles, T. (2009). Whale Watching Worldwide;
Tourism Numbers, Expenditures and Expanding Economic Benefits. Yarmouth, MA:
International Fund for Animal Welfare.
Point 97, SeaPlan, and the Surfrider Foundation. (n.d.). Characterization of Coastal and Marine
Recreational Activity in the U.S. Northeast.
Project Oceanology. (2016). Public Cruises. Retrieved from Project Oceanology:
http://www.oceanology.org/cruises
Starbuck, K., & Lipsky, A. (2013). 2012 Northeast Recreational Boater Sruvey: a
Socioeconomic and Spatial Characterization of Recreational Boating in Coastal and
Ocean Waters of the Northeast United States. Boston, MA: SeaPlan.

204
Surfrider Foundation with Point 97, The Nature Conservancy, and Monmouth University's Urban
Coast Institute. (2014). U.S. Mid Atlantic Coastal and Ocean Recreation Study.
The Maritime Aquarium. (2018). R/V Spirit of the Sound. Retrieved from The Maritime
Aquarium at Norwalk: https://www.maritimeaquarium.org/fun-learning/kids-
families/cruises
Tourism Economics. (2017). The Economic Impact of Travel in Connecticut, for Callendar Year
2015. Retrieved from Connecticut Office of Tourism:
http://www.cultureandtourism.org/cct/lib/cct/tourism/econimpact/Conn_Tourism_Econo
mic_Impact_-_CY2015_full_Web.pdf
University of Connecticut. (2018). Retrieved from The Aquaculture Mapping Atlas:
https://clear3.uconn.edu/aquaculture/
21.5 Appendices
21.5.1 List of Maps Used to Inform the Chapter
Below is a list of all maps used to inform this chapter, including maps presented above in the
narrative and additional maps used to support chapter findings. Maps listed below are organized
by the online data portal on which they are hosted (URL links to data portals are noted in Section
21.4 References above). Map products not accessible by online data portal are also noted below.
Northeast Ocean Data Portal
Recreational Board and Paddle Events
Boat Launches
Water Trails
Beaches
New York Geographic Information Gateway
Wildlife Viewing – Northeast Region, 2012
Target wildlife viewing species – Northeast Region, 2012
Swimming – Northeast Region, 2012
Relaxing – Northeast Region, 2012
Mid-Atlantic Ocean Data Portal
Surface Water Activities
Wildlife and Sightseeing Activities
Human Use Data Synthesis (HUDS): Theme – Recreation
Human Use Data Synthesis (HUDS): Activity
Connecticut DEEP Saltwater Fishing Resource Map
Boat launches

205
More information on some of the map products presented in this chapter, including URL links to
data and metadata, can be found in the Non-Consumptive Recreation Map Book and SCUBA
Map Book (CT DEEP, 2017). Not all products showcased in the map book may be addressed in
this chapter or utilized to inform the final Blue Plan.
21.5.2 Notes on Stakeholder Engagement
Outreach for this sector began with several email “blasts” sent out to identify contacts in early
October 2017. Responses were followed up with individual email and calls. As overall response
was very low, other potential stakeholders were identified with internet searches (such as for
kayak, paddleboard, or Scuba shops) and contacted via phone. Overall response on calls was
general interest in the Blue Plan process, though if any of these shop owners attended webinars
they did not identify themselves.
Formal Scuba outreach consisted of one in-person presentation to a prominent Connecticut dive
club during their monthly meeting, and two webinars in mid-November. A minimum of 26
participants were reached through this process (not including unidentified callers on webinars).
These presentations and webinars, like all the webinars conducted as part of the Inventory data-
vetting process, covered the basics of the Blue Plan and Inventory, the map books associated
with the sector, and requested participant comment on both.
A single webinar was held for other NCR stakeholders, with at least 5 participants (again, not
counting unidentified callers), in mid-November but very little comment was offered in this
venue. Two follow-up emails were sent to participants whose addresses were known, but only
two responses were received, each from the Surf Rider Foundation individuals who helped
conduct the Northeast and Mid-Atlantic use surveys.
Outreach to the Scuba and NCR communities was conducted as part of the 2014 and 2015
Recreational Characterization surveys for the initial data-gathering efforts, and the information
contained in the report is considered vetted as is by the original authors, but several members of
the local dive community expressed dissatisfaction with this initial effort. Furthermore, several
recreational Scuba community leaders expressed skepticism about all dive-related planning
activities at the beginning of the outreach process. This sentiment is based on a history of State
impediment to site access. In one example SECONN-club divers collaborated with the State
Archeologist on the discovery and investigation of historic shipwrecks, volunteering their unique
skills and time, only to have access to these wrecks restricted by the State Historical Preservation
Office. Anecdotes such as this are pervasive in New England dive culture, and lead to the
sentiment that the more information about diving is obscured from resource managers, the more
protected divers are in their right to practice their sport in LIS.

206
Chapter 22. Waterfowl Hunting
Chapter Table of Contents
22.1 Key Data and Map Products .............................................................................................. 206 22.2 Assessment of Data Quality ............................................................................................... 208
22.2.1 Sources of Data and Metadata ................................................................................. 208 22.2.2 Accuracy, Representativeness, and Relevance of Map Products ............................. 209
22.2.3 Data Gaps and Availability of Data to Address Gaps .............................................. 209 22.3 Relevance ........................................................................................................................... 210
22.3.1 Relative Historical Importance ................................................................................. 210 22.3.2 Socio-Economic Context ........................................................................................... 211 22.3.3 Other Notes ............................................................................................................... 211
22.4 References .......................................................................................................................... 211 22.5 Appendices ......................................................................................................................... 212
22.5.1 List of Maps Used to Inform the Chapter ................................................................. 212 22.5.2 Notes on Stakeholder Engagement ........................................................................... 213
22.1 Key Data and Map Products
Waterfowl hunting is a longstanding, traditional activity that takes place largely along
Connecticut’s rivers and the shores of Long Island Sound, particularly in marsh areas where
waterfowl tend to congregate. While relatively small in number compared to other user groups,
waterfowl hunters seriously pursue their activity, and have contributed directly to habitat
conservation and restoration through the purchase of duck stamps and excise taxes on firearms
and equipment. As such, waterfowl hunters are statutorily represented on the Blue Plan
Advisory Committee as part of the recreational fishing and hunting community.
There are two map products that help represent the spatial distribution of waterfowl hunting
around Long Island Sound. These are the Connecticut Hunting Areas map (Figure 1) and the
Waterfowl Habitat map (Figure 2).
The Connecticut Hunting areas data layer displays areas that are open to hunting on Connecticut
public land (CT DEEP, 2017). This layer also distinguishes between what type of hunting is
allowed in an area, what method of hunting is allowed in an area, and whether you need a permit
to hunt within an area. There are also separate classifications for whether areas are closed to
hunting.
Additionally, if an individual scrolls over one of the polygons in the data layer, an informational
pop-out appears that may show the name of the public land parcel, the acreage, types of gear and
hunting allowed in the area, and a pdf link to a more detailed map of the hunting area (CT DEEP,
2017).

207
Figure 1. Connecticut Hunting Areas. Map describing the public hunting areas in Connecticut
and there different regulations. Access available via the CT DEEP Hunting Area Viewer (CT
DEEP, 2017).
The Waterfowl Habitat map displays a series of polygons with waterfowl presence. Each of these
polygons contains information on what type of waterfowl is present, such as but not exclusive to
black duck, Canada goose, brant, goldeye, scaup, mallard, and teal. The polygons also identify if
Woodduck is present, if there is migration through the area, and any additional field notes.

208
Figure 2. Waterfowl Habitat. Map identifying polygons of waterfowl presence with information
on what types of waterfowl may be in that region. Access available via The Aquaculture
Mapping Atlas (Aquaculture Mapping Atlas, 2017).
22.2 Assessment of Data Quality
22.2.1 Sources of Data and Metadata
The data presented above is sourced and/or managed by CT DEEP. The data is available via the
CT DEEP Hunting Areas Viewer (Figure 1) and the Aquaculture Mapping Atlas (Figure 2).
The migratory waterfowl dataset was based on the 1991 Northeast Coastal Areas Study by
Joseph Dowhan and supplemented by midwinter surveys, breeding surveys, and personal
observations by Paul Merola and Greg Chasko, both DEEP biologists (Dowhan, 1991). Each
polygon in the map contains information on waterfowl in that location, presence of wood duck,
migration routes, and field notes. A full metadata description is available via the Aquaculture
Mapping Atlas (Aquaculture Mapping Atlas, 2017).
There is no single collective source of metadata available for the Connecticut Hunting Areas,
however more information is available via the DEEP hunting and trapping webpage (CT DEEP,
2017). Each polygon also has reference information as to what type of hunting is allowed in that
region.

209
22.2.2 Accuracy, Representativeness, and Relevance of Map Products
All data presented is deemed relevant, as it is vitally important to understand waterfowl species
presence and public hunting areas to start estimating coastal waterfowl hunting distribution.
In terms of accuracy, the DEEP hunting areas are accurate but they represent only land-based
hunting. Therefore, data on waterfowl hunting from the water or on private land is not spatially
represented. Additionally, information presented in the waterfowl habitat may be dated and
therefore less accurate as it is based on findings from the 1990s.
Also in terms of representativeness, hunting area maps are believed by New York and
Connecticut environmental agency staff to understate the extent and range of waterfowl hunting
prevalence. Notes from stakeholder engagement efforts have illustrated that hunters will utilize
every rock pile off the coast or hunt in boats anchored offshore, and those areas are not
represented in these datasets.
22.2.3 Data Gaps and Availability of Data to Address Gaps
There are a few key data gaps in this sector that are in need of being filled in order to accurately
represent waterfowl hunting activity along Long Island Sound’s coast. These include a lack of
waterfowl hunting information on the North Shore of Long Island, on in-water or offshore areas,
and on private land.
A source that may be helpful in proceeding forward is the Ducks Unlimited Migration Map
(Figure 3), which provides additional resources on National Wildlife Refuges, Ducks Unlimited
projects completed on areas with public hunting, and real-time observations of migratory birds
(Ducks Unlimited, 2017). Additional sources of information may be found in Chapter 5 Birds,
which addresses the ecological characterization of birds in Long Island Sound.

210
Figure 3. Ducks Unlimited Migration Map. Map showcasing different Ducks Unlimited Projects
on public lands and National Wildlife Refuges (identified a NWR in map. The map is also
updated daily to show user observations on migration patterns. Access available via the Ducks
Unlimited Migration Map (Ducks Unlimited, 2017).
22.3 Relevance
22.3.1 Relative Historical Importance
Historically, the presence of extensive estuarine marshes along migratory flyways in Long Island
Sound attracted large numbers of waterfowl, which in turn attracted hunters. In recent years
coastal development has encroached on waterfowl habitat and hunting access, but waterfowl
hunting remains an important traditional use along Connecticut’s shore. Waterfowl hunting in
Connecticut is regulated by the CT DEEP Wildlife Division, which works closely with the
hunting community (CT DEEP, 2017). Waterfowl hunters themselves have supported habitat
conservation and restoration, through federal excise taxes and the required purchase of both
federal and state duck stamps, including a number of tidal wetland restoration projects along
Connecticut’s coast (CT DEEP, 2017). Private advocacy groups such as Ducks Unlimited also
have a long history of aiding conservation efforts (Ducks Unlimited, 2018). Ducks Unlimited
rates the Mid-Atlantic Coast, which includes Long Island, as a Level II priority area (Ducks
Unlimited, 2017). However, as the data reflects, waterfowl hunting on the shores of Long Island
Sound generally takes place in wetlands and nearshore areas, particularly on or from public
lands, and thus may have a limited impact on the offshore Blue Plan policy area waterward of the
10 ft depth contour.

211
22.3.2 Socio-Economic Context
A 2011 national survey by the National Fish and Wildlife Service found that approximately 1.5
million waterfowl hunters nationally spent over $1.3 billion that year in trip and equipment
expenditures (Carver, 2011). However, only 7% of the hunters were located in the Northeastern
states (Carver, 2011). CT DEEP’s SCORP (Statewide Comprehensive Outdoor Recreation Plan)
surveys suggest that, among outdoor enthusiasts, a relatively small number participate in
waterfowl hunting (CT DEEP, 2017). Approximately 2,300 waterfowl hunting licenses are
issued annually in Connecticut (RealTree, 2017). The limited number of waterfowl hunters is a
concern for both the hunting community and Wildlife Division staff, since it may result in less
financial and community support for habitat conservation and access, and because a relatively
less popular activity may face increasing competition from other user groups seeking to utilize
the same areas. In common with the other user groups, waterfowl hunters are concerned to
preserve access to open space and coastal waters in the face of continuing residential
development of coastal areas and increased use of various types of watercraft.
22.3.3 Other Notes
Waterfowl hunting along the Connecticut coast is a long-running, cherished tradition, and has
taken place for many years in close proximity to areas of high human use. For the most part,
there have been very few conflicts. However, in recent years, there have been some negative
encounters between waterfowl hunters and the non-hunting public. There may be the potential
for further use conflicts as non-hunting uses such as paddlecraft navigation and wildlife viewing
increase. However, this potential would tend to be mitigated by the seasonal nature of waterfowl
hunting, which takes place in the fall while most non-hunting uses are more prevalent in the
warmer months, and by adoption of responsible hunting practices as advocated by CT DEEP
Wildlife and by waterfowl hunting organizations.
There are a series of additional resources that may be useful when understanding Waterfowl
Hunting in Long Island Sound. One resource is the Connecticut Waterfowl Association, which
provides waterfowl hunting education in addition to hosting a conservation fund to preserve
wetland habitat (CWA, 2017). Resources from the CT DEEP are also informative including the
Migratory Bird Hunting DEEP Resources, which shows information on state managed properties
that allow water fowl hunting, and the Migratory Bird Hunting Guide, which provides general
information on waterfowl hunting regulation and seasonal events (CT DEEP, 2017).
22.4 References
Aquaculture Mapping Atlas. (2017). Retrieved from Aquaculture Mapping Atlas :
https://clear3.uconn.edu/aquaculture/
Carver, E. (2011). Economic Impact of Waterfowl Hunting . Falls Church, VA: U.S. Fish &
Wildlife Service.
Coalition of CT Sportsmen. (2017). Welcome to the Digital Home of the Coalition of CT
Sportsmen. Retrieved from ctsportsmen: http://ctsportsmen.com/

212
CT DEEP. (2017). 2017-2018 CT Migratory Bird Hunting Guide. Retrieved from Connecticut
Department of Energy and Environmental Protection:
http://www.ct.gov/deep/cwp/view.asp?a=2700&q=323426
CT DEEP. (2017). Connecticut Hunting Areas. Retrieved from Connecticut Department of
Energy and Environmental Protection:
http://ctdeep.maps.arcgis.com/apps/webappviewer/index.html?id=58663e71ca114e439f7f
3473836db929
CT DEEP. (2017). Connecticut Statewide Comprehensive Outdoor Recreation Plan. Retrieved
from Connecticut Department of Energy and Environmental Protection:
http://www.ct.gov/deep/cwp/view.asp?a=2707&q=323864&deepNav_GID=1642%20
CT DEEP. (2017). Federal Funding for Fish and Wildlife. Retrieved from Connecticut
Department of Energy and Environmental Protection:
http://www.ct.gov/deep/cwp/view.asp?a=2723&q=326164&deepNav_GID=1655
CT DEEP. (2017). Hunting and Trapping. Retrieved from Connecticut Department of Energy
and Environmental Protection:
http://www.ct.gov/deep/cwp/view.asp?a=2700&q=323414&deepNav_GID=1633%20
CWA. (2017). Connecticut Waterfowl Association. Retrieved from
http://www.ctwaterfowlers.org/conservation-fund.html
Dowhan, J. (1991). 1991 Northeast Coastal Areas Study. Retrieved from US Fish and Wildlife
Service: https://training.fws.gov/resources/knowledge-
resources/pubs5/necas/web_link/table%20of%20contents.htm
Ducks Unlimited. (2017). Ducks Unlimited Migration Map. Retrieved from Ducks Unlimited:
http://www.ducks.org/migrationmap/
Ducks Unlimited. (2017). Mid-Atlantic Coast: Level II Ducks Unlimited conservation priority
area, popular wintering area for waterfowl, including the declining American black duck.
Retrieved from Ducks Unlimited: http://www.ducks.org/conservation/where-ducks-
unlimited-works/mid-atlantic-coast
Ducks Unlimited. (2018). Conservation. Retrieved from Ducks Unlimited:
http://www.ducks.org/conservation
RealTree. (2017). Duck Hunting in Connecticut. Retrieved from RealTree:
https://www.realtree.com/waterfowl-hunting/duck-hunting-nation/2017/connecticut-
duck-hunting
22.5 Appendices
22.5.1 List of Maps Used to Inform the Chapter
Below is a list of all maps used to inform this chapter, including maps presented above in the
narrative and additional maps used to support chapter findings. Maps listed below are organized
by the online data portal on which they are hosted (URL links to data portals are noted in Section
22.4 References above). Map products not accessible by online data portal are also noted below.
CT Aquaculture Mapping Atlas
Waterfowl Habitat

213
CT DEEP Hunting Area Viewer
Connecticut Hunting Areas
Ducks Unlimited Migration Map
Ducks Unlimited Migration Map
More information on some of the map products presented in this chapter, including URL links to
data and metadata, can be found in the Recreational Fishing and Waterfowl Hunting Map Book
(CT DEEP, 2017). Not all products showcased in the map book may be addressed in this chapter
or utilized to inform the final Blue Plan.
22.5.2 Notes on Stakeholder Engagement
There are several stakeholder organizations representing waterfowl hunting; in particular, Ducks
Unlimited and the Connecticut Waterfowl Association have a lot of good waterfowl-related
information and background online, while the CT Sportsmen’s Alliance advocates for hunters,
particularly on gun issues (Coalition of CT Sportsmen, 2017). Identified stakeholder and agency
staff contacts have been kept apprised of Inventory development. Eight individuals representing
the above and other organizations, including CT DEEP and NY DEC wildlife staff, were sent
map books for waterfowl and recreational boating and invited to review the data and participate
in the November 21, 2017, webinar, which was held in conjunction with the Recreational Fishing
sector. Two state agency wildlife staff members participated on the webinar and/or submitted
comments by email. No other stakeholders from this sector chose to partake in the webinar.
Cultural Resources and Education

214
Chapter 23. Historic and Archaeological Marine and Coastal Cultural Resources
Chapter Table of Contents
23.1 Key Data and Map Products .............................................................................................. 214 23.2 Assessment of Data Quality ............................................................................................... 218
23.2.1 Sources of Data and Metadata ................................................................................. 218 23.2.2 Accuracy, Representativeness, and Relevance of Map Products ............................. 219
23.2.3 Data Gaps and Availability of Data to Address Gaps .............................................. 220 23.3 Relevance ........................................................................................................................... 222
23.3.1 Relative Historical Importance ................................................................................. 222 23.3.2 Socio-Economic Context ........................................................................................... 226 23.3.3 Other Notes ............................................................................................................... 226
23.4 References .......................................................................................................................... 227 23.5 Appendices ......................................................................................................................... 228
23.5.1 List of Maps Used to Inform the Chapter ................................................................. 228 23.5.2 Notes on Stakeholder Engagement ........................................................................... 229
23.1 Key Data and Map Products
The waters and lands in and adjacent to Long Island Sound house a rich collection of historic and
archaeological resources, both known and yet-to-be discovered. While such resources may not
always been visible or recorded, they hold significant cultural value at the local, state, and
federal levels. As such, their inclusion in the Resource and Use Inventory for Long Island Sound
(LIS) is both appropriate and merited.
Based on stakeholder feedback and available data, spatial information on historic and
archaeological resources in, around, and relating to LIS fall into three categories:
1. Submerged archaeological sites (primarily shipwrecks)
2. Submerged areas of archaeological sensitivity
3. Coastal terrestrial historic and archaeological sites, standing historic structures, and
artifacts (particularly those threatened by climate change impacts)
Submerged Archaeological Sites
Submerged archaeological sites in LIS consist of two elements: (1) Shipwrecks, and (2) Non-
shipwreck sites and artifacts. Only the former has been mapped out on a Sound-wide scale and
was made available for Blue Plan purposes. According to stakeholder feedback, many non-
shipwreck sites and artifacts in the Sound remain undiscovered, some potentially under 30 m of
sediment on the Sound floor.
Figure 1 displays recorded shipwrecks in LIS in the publicly-available record. Shipwreck density
is high around major harbors (e.g., Port Jefferson, NY, and Bridgeport, CT) but is especially
concentrated at the westernmost part of the Sound (near New York City and Huntington and

215
Northport Bays of Long Island) and the easternmost part of the Sound (in Fishers Island Sound
and at the easternmost opening to Block Island Sound, between Fishers Island and Watch Hill,
RI).
Figure 1. Wrecks. Recorded shipwrecks in and around Long Island Sound based on data housed
in two NOAA databases: the Automated Wreck and Obstruction Information System (AWOIS)
and the Electronic Navigational Charts (ENC). Access available via NOAA Office of Coast
Survey’s Wrecks and Obstructions Viewer (NOAA, 2017a).
Submerged Areas of Archaeological Sensitivity
Submerged areas of archaeological sensitivity can be represented in two ways: (1) Density of
known submerged sites and artifacts (e.g., shipwrecks), and (2) Likelihood of presence of
submerged archaeological sites and artifacts not yet discovered. Both representations can be
particularly useful in mapping out general locations of submerged archaeological sites and
artifacts without compromising exact site and artifact locations, often deemed sensitive for the
protection and conservation of these resources. Only the former representation has been mapped
out for the Sound (and made available for Blue Plan purposes at this time) and only in terms of
known shipwrecks.
Figure 2 displays the relative archeological sensitivity of Sound waters, based on the density of
known submerged shipwrecks, up to ½ mile offshore. Underwater archaeological resource
sensitivity is rated “high” at the study area’s western end, close to New York City, and also at its
eastern end around Groton-New London and the north shore of Fishers Island – reflective of the
information provided in Figure 1.

216
Figure 2. Underwater Cultural Resources Sensitivity. Relative archeological sensitivity of large
nearshore regions (up to ½ mile from the shoreline) of LIS. High sensitivity indicates that
nearshore regions are more likely to contain underwater archaeological deposits, particularly
shipwrecks, based on known and plotted sites (Cherau, et al., 2010).
Coastal Terrestrial Historic and Archaeological Sites, Standing Historic Structures, and Artifacts
A number of terrestrial historic and archaeological sites, properties, and artifacts in and around
LIS are represented in the records of the National Register of Historic Places and the State
Registers of Historic Places for Connecticut and New York. However, it should be noted that
these Registers primarily account for historic properties, sites, and districts (i.e., the vast majority
of known archaeological sites are not captured in the Registers). Archaeological sites, standing
historic structures, and artifacts are also inventoried in confidential records curated by the
Connecticut and New York State Historic Preservation Offices (SHPO) and other archaeology-
related state offices (e.g., Connecticut Office of State Archaeology, New York State Museum).
Figure 3 displays known historic buildings, sites, structures, objects, and districts along the
Connecticut coastline, along Long Island’s north and east shore coastlines, and in the Sound.
Nearly all depicted sites located in the Sound are lighthouses. As sea levels are predicted to rise
over the next century, coastal and in-water historic and archaeological sites and properties may
be in danger of chronic inundation, persistent flooding, or other damage by storms and natural
coastal processes. Data on what sites and properties may be at risk from climate change impacts
were not made available for Blue Plan purposes at this time.

217
(a)
(b)
Figure 3. Historic Resources Inventory. (a) Coastal buildings, sites, structures, and objects and
in Connecticut and north and east Long Island (NY) that are listed in, or eligible for listing in,
the National Register of Historic Places (including National Historic Landmarks) or listed in a
State Register of Historic Places; (b) Coastal sites and districts in Connecticut and north and
east Long Island (NY) that are listed in, or eligible for listing in, the National Register of
Historic Places (including National Historic Landmarks) or listed in a State Register of Historic
Places (Cherau, et al., 2010). Coastal sites and districts data provided by Cherau, et al. (2010)
were supplemented by National Register data provided in November 2017 by and courtesy of NY
SHPO.

218
23.2 Assessment of Data Quality
23.2.1 Sources of Data and Metadata
Figure 1 was created using information from the NOAA AWOIS and NOAA ENC databases.
AWOIS was consolidated primarily for the purpose of planning hydrographic surveys (NOAA,
2017e). ENC is consolidated primarily to provide real-time ship positioning, as well as collision
and grounding avoidance (NOAA, 2017c). Spatial data is accessible via the NOAA Office of
Coast Survey’s Wrecks and Obstructions Viewer (NOAA, 2017a). There is no single collective
source of metadata available for this map product; however, information on the data structure,
attribute data, and symbology of the AWOIS and ENC data can be found on the NOAA Office of
Coast Survey website, under the Wrecks and Obstructions Database, NOAA ENC, and NOAA
ENC Direct to GIS, and U.S. Chart No. 1 (Chart Symbols) webpages (NOAA, 2017b; NOAA,
2017c; NOAA, 2017d; NOAA, 2017e). Map product data was collected in January 2018.
Figures 2 and 3 were created using information from the 2010 U.S. Army Corps of Engineers’
(USACE) LIS Dredged Material Management Plan (DMMP) Cultural Resources Inventory
(Cherau, et al., 2010). The Cultural Resource Inventory catalogued historic properties and
archeological sites in 57 coastal communities along Long Island Sound. The USACE DMMP
looked at both submerged archaeological sites and terrestrial historic and archaeological sites.
The DMMP submerged archaeological sensitivity data were generated using known locations of
underwater wrecks and obstructions (Figure 2). Using this information, along with input from
archaeological experts, the DMMP study authors determined areas of high, medium, and low
archaeological sensitivity for all nearshore waters of LIS (up to ½ mile from the shoreline). High,
medium, and low sensitivity designations were set via a “Jenks ‘natural breaks’ method” and
were further fine-tuned using qualitative knowledge of the “study area’s cultural and
environmental contexts and existing knowledge regarding the area’s archaeological sensitivity
based on previous investigations” (Cherau, et al., 2010, p. 13). The study authors note that the
sensitivity evaluation was “based on the observed relative frequencies and geospatial
distributions of the shipwrecks and obstructions […] located within the LIS DMMP study area”
(Cherau, et al., 2010).
The DMMP coastal terrestrial archaeological sites, standing historic structures, and artifacts data
come from a “Historic Resources Inventory” that the DMMP study authors created, based on
Connecticut and New York State Historic Preservation Office (SHPO) records (Figure 3). This
“Historic Resources Inventory” accounts for “all recorded aboveground and belowground
terrestrial historic properties within the project study area” at the time of report preparation
(Cherau, et al., 2010, p. 13). “Historic properties”, for DMMP purposes, was defined as all
“buildings, sites, structures, objects, and districts [within the DMMP study area] that are listed,
determined eligible, or potentially eligible for the National Register and or State Register within
the respective states in which they are located” (Cherau, et al., 2010, p. 134). It should be noted
that “historic properties”, as defined by the DMMP study authors, only represents a small subset
of all known archaeological sites and districts. Figure 3 also encompasses coastal terrestrial
historic and archaeological site and district data provided by NY SHPO in November 2017; this
information was used to supplement the DMMP data, which was collected in 2010.

219
23.2.2 Accuracy, Representativeness, and Relevance of Map Products
In terms of representing a comprehensive set of submerged archaeological sites and artifacts in
LIS, the quality of the AWOIS and ENC datasets is sub-optimal. Neither AWOIS nor ENC were
created for marine spatial planning purposes. As mentioned previously, AWOIS was designed
for planning hydrographic surveys while ENC is primarily intended to provide real-time ship
positioning and collision and grounding avoidance. NOAA itself has cited limitations to AWOIS,
including the fact that AWOIS records are not comprehensive, exclude reported wrecks that have
been salvaged or disproved by further investigation, and stopped being updated altogether in
2016 (NOAA, 2017e). Furthermore, the NOAA datasets do not take into account non-shipwreck
sites and artifacts that may have archaeological value. Thus, while the NOAA shipwrecks data is
relevant, it is not particularly representative of all the known submerged archaeological sites and
artifacts in LIS. Despite this, the map product in Figure 1 is assumed to be the most accurate
spatial data representing submerged archaeological sites and artifacts that was made available for
Blue Plan purposes at this time.
In terms of representing submerged archaeological sensitivity, the quality of the DMMP data is
helpful but also sub-optimal. There are two reasons for this. First, the spatial extent of the data
covers only a small portion of the Sound’s waters. Secondly, the data is only useful for
identifying sensitive areas based on known locations of shipwrecks, not for identifying areas that
may be sensitive due to the likely presence of pre-contact archaeological sites or artifacts. Thus,
while the DMMP archaeological sensitivity data is indeed relevant – after all, the DMMP report
was created for development and planning purposes and contains specific, verified historic and
archaeological data, much of it derived from SHPO datasets – it is not particularly representative
of Sound-wide submerged archaeological sensitivity. Despite this, the map product in Figure 2
is assumed to be the most accurate spatial data representing submerged archaeological sensitivity
that was made available for Blue Plan purposes at this time,
In terms of representing coastal terrestrial archaeological sites, standing historic structures, and
artifacts, the quality of the DMMP and NY SHPO data is helpful but not fully realized. For one,
the data is not complete. As the DMMP report authors note, “The number of potentially eligible
resources that have not been previously identified in the historic property inventories maintained
by the Connecticut and New York SHPOs is probably much higher as only a few of the towns
within those study areas have anything that approaches a comprehensive survey and most of
those were conducted years ago” (Cherau, et al., 2010). Moreover, while NY SHPO provided
updated information, effective November 2017, the information made available was limited;
furthermore, no updated information from CT SHPO was made available. Stakeholder feedback
indicated the importance of updated information, as any map product of terrestrial historic and
archaeological sites, properties, and artifacts should be considered a static representation of a
dynamic dataset. Stakeholders also emphasized that the narrow definition of historic properties
used in the DMMP report excludes many known archaeological sites and districts. Finally,
information on which historic sites may be threatened by climate change impacts was also not
made available. As such, while the DMMP and NY SHPO data is indeed relevant, it is likely not
fully representative of all the terrestrial historic and archaeological sites, properties and artifacts
relevant for LIS marine spatial planning. Despite this, the map product in Figure 3 is assumed to

220
be the most accurate spatial data representing coastal terrestrial archaeological sites, standing
historic structures, and artifacts that was made available for Blue Plan purposes at this time.
23.2.3 Data Gaps and Availability of Data to Address Gaps
The data gaps for this sector are partially documented in the previous section. They are reiterated
explicitly below, accompanied by potential solutions for filling these data gaps.
Major Data Gaps
Non-shipwreck archaeological sensitivity data – The archaeological sensitivity
categorizations in Figure 2 are based primarily on known shipwreck data. The inventory
would be greatly enhanced by the addition of sensitivity mapping of all known, non-
shipwreck submerged sites and artifacts in the Sound. This issue was highlighted by
stakeholder reviewers as the single largest data gap in this Inventory chapter, citing that
sensitivity mapping for submerged pre-contact resources will very likely look different
from the map product in Figure 2. This data gap could be filled by the incorporation of a
potential existing dataset held by the Connecticut Office of State Archaeology (discussed
in the Solutions section below).
Shipwreck and non-shipwreck archaeological sensitivity data further offshore –
Archaeological sensitivity categorizations for submerged shipwreck data were only
available for the Sound’s nearshore (< ½ mile) coastal region, via the DMMP report.
Expansion of this sensitivity data to all LIS waters – along with non-shipwreck
archaeological sensitivity data, as mentioned previously – would greatly enhance the
value of the Inventory. This data gap could also be filled by the incorporation of a
potential existing dataset held by the Connecticut Office of State Archaeology (discussed
in the Solutions section below). This data gap could also be filled by sensitivity mapping
using the more comprehensive shipwrecks datasets curated by the CT and NY SHPOs
(also discussed in the Solutions section below).
Coastal terrestrial resources outside of the DMMP’s “historic properties” definition – The
narrow definition of “historic properties” used in the DMMP report excludes many
known coastal terrestrial archaeological sites and districts. As such, the map product in
Figure 3 would be enhanced by the inclusion of additional archaeological point- and
district-level data. This data gap could be filled by the incorporation of the “Goodwin
dataset” from CT SHPO and more detailed point- and district-level data from NY SHPO
(discussed in the Solutions section below).
Climate change impacts on coastal terrestrial historic and archaeological sites and
resources – Information on which coastal terrestrial historic sites would be most
threatened by climate change impacts, such as sea level rise and flooding, was not made
available for Blue Plan purposes at the time this document was published. This data gap
could be filled by the incorporation of the “Goodwin dataset” from CT SHPO (discussed
in the Solutions section below).

221
Solutions
The most immediate way to address the above data gaps is to incorporate more accurate,
comprehensive, and up-to-date data into the map products. The large majority of this data is
housed in the CT and NY SHPO databases. SHPOs, located in 59 states, territories, and districts
of the U.S., are mandated by Sections 101b and 106 of the National Historic Preservation Act of
1966, as amended, to, among other things:
conduct a comprehensive survey of historic properties;
maintain an inventory of historic properties;
identify and nominate eligible properties to the National Register of Historic Places;
advise and assist Federal, State and local governments in matters of historic preservation;
provide consultation for Federal and State undertakings;
prepare and implement a statewide historic preservation plan;
work with local governments in the development of local historic preservation programs;
coordinate with tribal governments on historic preservation matters;
hold and enforce historic preservation easements; and
provide public information, education, training and technical assistance
(NCSHPO, 2017).
As such, SHPO data is to be considered authoritative and relied-upon for planning and
permitting purposes at various spatial scales. Every non-SHPO sector stakeholder who was
engaged as part of this Inventory chapter development process encouraged coordination with the
state SHPO offices. While state SHPO data is largely confidential and not available for public
distribution, CT SHPO has given permission for their data to be used for Blue Plan purposes. CT
SHPO datasets were provided to the Blue Plan team, however, they were not able to be
incorporated into this version of the Inventory. These data set should be fully incorporated in the
next version of the Inventory, due to be released later in Spring 2018.
The CT SHPO data to be incorporated into the Inventory is potentially expansive. CT SHPO
recently updated their historic property inventory for the four coastal counties of Connecticut.
This information is an output of work carried out by R. Christopher Goodwin & Associates, Inc.
and funded through a federal Disaster Relief Assistance Grant awarded to CT SHPO post-
Hurricane Sandy. Work carried out by the Goodwin & Associates team included “preparing
National Register nominations, conducting neighborhood-wide historic resources inventories,
creating a searchable database of State Register-listed properties, providing resiliency planning
as part of the next Statewide Preservation Plan, completing an inventory of historic dams,
conducting archeological surveys, and implementing the first comprehensive survey of
Connecticut’s submerged cultural resources” (Connecticut Trust for Historic Preservation, 2015).
This “Goodwin dataset” may be especially helpful in determining historic and archaeological
sites and properties within Federal Emergency Management Agency (FEMA)-designated flood
zones and areas susceptible to projected sea level rise and greater storm surge.
Further data may also be available from or through the Connecticut Office of State Archaeology.
While collaborative efforts with the Connecticut State Archaeologist to enhance the NOAA
shipwreck data did not yield particularly useful spatial results, non-shipwreck, submerged

222
archaeological sensitivity data (for areas greater than ½ mile offshore) may be available from or
through this Office. While stakeholder feedback has indicated that the nature of incremental sea
level rise (and patterns of previous coastal human settlement) mean that submerged
archaeological sites and artifacts are likely to be close to shore for more recent periods, having a
sensitivity dataset further offshore – particularly one focused on non-shipwreck sites and artifacts
– would be a valuable addition to the data already encompassed in this Inventory chapter
(particularly for Paleoindian and Archaic period occupations). As with the CT SHPO data, the
identification of this potential data is being actively pursued.
Other Data Gap Considerations
There are two data gaps intrinsic to the nature of the sector and are not resolvable by the addition
of more data. However, they are important to mention, nonetheless, to provide full context for
the sector:
Exact locations of archaeological sites and artifacts – The exact locations of many
underwater shipwrecks and other archaeological sites and artifacts constitute sensitive
data for protection purposes by the state SHPOs. These sites and artifacts contain
immense cultural and economic value, and public access to precise locations of sites
could enable theft and vandalism. For this reason, sensitivity mapping is preferable to
mapping out exact locations for known sites.
Incomplete knowledge of locations of archaeological sites and artifacts – Stakeholders
expressed confidence that only a small proportion of the archaeological artifacts in LIS
have been recovered at this time. Most nearshore archaeological resources are buried
under large quantities of slowly-accumulated benthic sediment. This characteristic of this
sector means that the Blue Plan will not, in all feasibility, be able to Inventory all
archaeological sites in the Sound. Informed sensitivity mapping provides a way to
address this issue in a way that is still beneficial to coastal and marine planners.
23.3 Relevance
23.3.1 Relative Historical Importance
The shorelines of Connecticut and New York have been inhabited by various peoples for at least
12,500 years. The oldest widely-accepted archaeological evidence for Native American
settlements in Connecticut date back to the Paleoindian Period (12,500 to 10,000 years before
present [B.P.]). The oral histories from several New England tribes suggest use of coastal areas
in the region may have extended back to at least 15,000 B.P. (Harris & Jones, 2015). From the
Paleoindian period through the Archaic (10,000-3,000 B.P.), Woodland (3,000-450 B.P.), and
Contact/Post-Contact (450 B.P.-present) periods, humans have left behind extensive remnants of
their presence.
Relatively few sites from the Paleoindian period have been found in Connecticut. Sea level rise,
following the last glaciation, inundated the former shorelines that may have been visited and

223
settled by the region’s earliest peoples. It is believed that from approximately 13,000 B.P. to
6,000 B.P., most human habitation would have been concentrated along the shorelines (Figure
4), with access to the water providing a means for sustenance (e.g., seal hunting).
Archaeological evidence of human activity dating from the Middle Archaic period (8,000 to
6,000 B.P.) and more recent periods is relatively abundant (Cherau, et al., 2010). Prior to
European Contact (before 450 B.P.), artifacts were predominantly made of stone materials,
although use of pottery increased after the Late Archaic period. Coastal archaeological sites
predating the arrival of Europeans in the New World have yielded a wide variety of artifacts
ranging from pottery to projectile points, knives, drills, hoes, and other stone tools, to bone and
shell fish hooks and harpoon tips. Projectile points are particularly useful artifacts, because they
can be used as temporal indicators of site occupation. Food remains from shell middens, storage
pits, and remnants of ancient fishing weirs suggest marine and estuarine plants and animals were
important elements in Native American subsistence patterns. Shorelines, coastal landscapes, and
seascapes in the Northeast were also (and continue to be) important places of ceremony for many
indigenous people. Known sites include small camps, large habitations, shell middens, and
fishing stations and weirs. Particularly sensitive locations include cemeteries and individual
burial sites.
During the Contact period, underwater and terrestrial archaeological evidence indicates increases
in trapping, shipping, and agricultural production in Connecticut (Cherau, et al., 2010). Coastal
areas around Long Island Sound were transformed by rapidly growing ports and settlements,
intensive trade, and wide-scale land clearing for farming and pastures. Parts of ancient docks,
wharves, and other marine infrastructure elements can be found along the waterfronts in ports
and fishing villages, often preserved beneath sediments used to expand waterfront lands.
Centuries of fishing, shipping, and marine transport within LIS have also left numerous
shipwrecks in the waters off Connecticut’s shoreline.
All of these sites and artifacts are potentially valuable resources for historians and archaeologists
trying to understand pre-colonial and historic-period societies in northeastern North America.
The value of some coastal and submerged cultural resources extends well beyond their capacity
to yield new information about past cultures. The cultural beliefs and practices of many Native
American tribes are closely associated with a variety of places and landscapes within the region.
Understanding the different values cultural resources may hold for a range of stakeholders is
often critical in identifying, understanding, and preserving elements of cultural heritage.
While many archaeological resources likely remain undiscovered, a region’s cultural, geological,
and environmental history can be used to predict the locations where undiscovered sites are most
likely to be preserved. Site location patterns from extensively studied terrestrial settings are often
employed as an analog for the now-submerged areas of the ancient landscape. Numerous recent
scientific studies in southern New England and adjacent sections of the eastern seaboard are
providing new data on the timing and nature of environmental change in the region. For
example, a range of studies for off-shore development planning near Rhode Island have included
detailed investigations of the geology, paleo-landscapes, and potential cultural resources in
Rhode Island Sound (State of Rhode Island, 2010). These and related studies sponsored by the
Bureau of Ocean Energy Management are refining the chronology of deglaciation, sea level rise,

224
and marine incursions, and the nature of formerly terrestrial landscapes now submerged beneath
the sea. USGS studies of Long Island Sound from 1998 to 2005 provide important baseline
information on the location of ancient waterways and other natural resources within the Sound
that would likely have supported Native American peoples when sea levels were much lower
(Stone, et al., 2005).
Previous archaeological assessments for nearshore environments in Long Island Sound have
focused on shipwrecks (Cherau, et al., 2010). However, terrestrial archaeological resources along
the present-day shoreline provide another important source of information on potential
archaeological resources in submerged environments. Both terrestrial and submerged artifacts
and sites have been discovered near all four of Connecticut’s shoreline counties (New London,
Middlesex, New Haven and Fairfield). The four counties also contain important archaeological
resources, with New London and Fairfield counties having the highest estimated archaeological
sensitivities for shipwrecks.
New London and Middlesex counties both lie in the Eastern Coastal Slope geographic region.
This region is characterized by low hills and hardwood trees. Inlets, marshes, and rivers provided
marine and estuarine resources for both Native American and European groups that settled in the
region. In the colonial period, large ports developed at Mystic, New London, and Stonington
alongside robust shipbuilding and whaling industries. Most of the coastal waters in New London
County are rated “moderate” to “high” in archaeological sensitivity for shipwrecks, while most
coastal waters in Middlesex County are rated “low” to “moderate” (Cherau et. al., 2010).
Most of New Haven County is located in the Central Valley geographic region. New Haven
Harbor and other former estuaries would have provided relatively abundant and varied resources
to people in the pre-contact and early historic periods. Urban development and the filling of
former marshes have likely buried much of the archaeological record of early maritime
settlements. Dredging from the late 19th century through modern times has also altered the
seabed within and near ports. Coastal waters in the eastern portion of the county generally have
“low” estimated archaeological sensitivity for shipwrecks, while waters in the western portion of
the county are generally rated as “moderate” (Cherau et. al., 2010).
Fairfield County lies within the Western Coastal Slope geographic context, which includes a
highly protected shoreline and previously abundant salt marshes and marine resources. It is now
one of the most heavily populated regions in Connecticut. Known shipwrecks and archaeological
sensitivities increase moving westward through the county, from mostly “moderate” designations
to “high” designations (Cherau et. al., 2010).
Because sea levels rose dramatically since the last glacial retreat (22,000 to 18,000 B.P.), ancient
archaeological sites may be preserved offshore, located in marine benthos that were once
terrestrial soils. At the beginning of the Paleoindian period, sea levels were between 180-90 ft
below current sea levels (Figure 4). Early archaeological sites may be preserved where ancient
shorelines are buried beneath the sands and muds of the modern-day seabed. The preservation of
these resources is enhanced along protected, low energy sections of the shoreline, such as bays
and estuaries, where the force of waves and tidal currents is dissipated by the nearshore
environment.

225
Submerged sites can also be preserved when they were deeply buried before rising seas
inundated Long Island Sound. Ancient rivers and streams drained the Long Island Sound basin
following the last glaciation. Native American sites along these rivers may be preserved in
floodplain deposits buried by more recent marine sediments. Unique archaeological resources are
likely to be found in submerged environments; the colder temperatures, lower oxygen levels, and
more consistent conditions can preserve organic materials that would decompose in the acidic
terrestrial soils of New England.
For example, all of the Native American canoes discovered in New England have been found
underwater (Connecticut Office of State Archaeology, 2018). The preservation of these resources
is enhanced along protected, low energy sections of the shoreline, such as bays and estuaries.
Additionally, more recent shipwrecks have left remnants of 17th - 20th century life throughout the
waters of LIS. Many of these shipwrecks have become popular dive sites, adding economic value
to their cultural and historical importance.
Figure 4. Long Island Sound Paleoshoreline. Modeled historical shoreline of Long Island Sound
for 11,000 B.P. and 9,000 B.P. Access available via USACE LIS DMMP Cultural Resources
Inventory (Cherau, et al., 2010, p. 16).

226
23.3.2 Socio-Economic Context
Shipwrecks are popular dive sites in the Sound, bringing income to Connecticut- and Long
Island- based recreational diving operations. Historic and archaeological resources may also
benefit the larger tourism industries in Connecticut and Long Island, as well. Additionally,
underwater artifacts, relics, and other cultural resources are highly valued by museums and
archaeological curators. Though all these elements add economic value to this sector, to the best
of the Blue Plan team’s knowledge, no robust valuation estimates have been calculated in
monetary terms.
It should be emphasized that this sector’s value is primarily noneconomic in nature. It is hard to
place an economic value on historical importance, which could encompass such elements as
community-building (e.g., the long-standing presence of local historical society chapters),
scholastic enhancement (e.g., development of educational curriculums), and hobby inspiration
and facilitation. Additionally, the value of some coastal and marine cultural resources extends
well beyond their capacity to yield new information about past cultures. The cultural beliefs and
practices of many Native American tribes are associated with a variety of places and landscapes
within the region. Understanding the different values cultural resources may hold for a range of
stakeholders is critical for identifying, evaluating, and preserving elements of cultural heritage.
23.3.3 Other Notes
It is understood that the Inventory and subsequent Blue Plan will guide how any future
development project is proposed and developed. Such development projects often require a
cultural resource impact analysis as part of their development plans. Known historic and
archaeological sites and artifacts – and archaeologically sensitive areas – are a crucial concern in
coastal and marine development projects, as dredging can disrupt or destroy known or unknown
sites. While development projects may uncover artifacts, these projects can also simultaneously
damage or remove them from their original state and spatial context. As such, including historic
and archaeological data in the Blue Plan is important to protecting both known sites and potential
future discoveries by making cultural artifacts and sensitive areas visible on maps.
Stakeholders interviewed for this chapter emphasized their confidence that many archaeological
resources in the LIS still await discovery and documentation. While this uncertainty and promise
of future discovery makes this Inventory chapter necessarily incomplete, outlining known
resources and sensitivities is an essential first step, at the very least to provide Plan users with a
more robust sense of the dynamic history of LIS.
Additional Resources
Narrative history can provide a helpful context to better understanding the historic and
archaeological resources in a planning area. Pace University historian Marilyn E. Weigold is
considered an expert on the environmental and social history of Long Island Sound post-1614.
Two oft-cited pieces by Dr. Weigold include her book, The Long Island Sound: A History of Its
People, Places, and Environment and her chapter contribution (with collaborator Elizabeth

227
Pillsbury) to the environmental management anthology, Long Island Sound: Prospects for the
Urban Sea (Weigold M. E., 2004; Weigold & Pillsbury, 2014). Additionally, an environmental
history of LIS, with a particular focus on environmental mismanagement and pollution, has been
documented by Tom Andersen in his book, This Fine Piece of Water: An Environmental History
of Long Island Sound (Andersen, 2002).
Geologic and archaeological history may also be helpful in understanding and mapping out
archaeologically sensitive areas. Resources that may shed light on such history include a USGS
map on Quaternary Geologic Map of Connecticut and Long Island Sound Basin (Stone, et al.,
2005) and a journal article on “Sea Levels and Archeology in the Long Island Sound Area”
(Salwen, 1962).
23.4 References
Andersen, T. (2002). This Fine Piece of Water: An Environmental History of Long Island Sound.
New Haven: Yale University Press.
Cherau, S., Olausen, S., Robinson, D., Banister, J., Allegretto, K., & Stuart, Q. (2010). Cultural
Resources Inventory - Long Island Sound - Dredged Material Management Plan, Long
Island Sound, Connecticut, New York, and Rhode Island - Volume I. Prepared for the U.S.
Army Corps of Engineers, New England District. PAL Report No. 2394. Pawtucket: PAL
Publications. Retrieved from
http://www.usace.army.mil/Portals/74/docs/Topics/LISDMMP/STID11-LIS-DMMP-
CulturalResourceInventory.pdf
Connecticut Office of State Archaeology. (2018). Dugout Canoe. Retrieved from Issues in
Underwater Archaeology: http://www.mnh.uconn.edu/underwater/Dugout.html
Connecticut Trust for Historic Preservation. (2015, September/October). After Sandy: Recovery
and Preparedness. Connecticut Preservation News, XXXVIII(5), p. 2. Retrieved from
https://cttrust.org/_IMAGES/2015%205%20sept.pdf
CT DEEP. (2018). Long Island Sound Blue Plan Webinars. Retrieved from Connecticut
Department of Energy and Environmental Protection (CT DEEP):
http://www.ct.gov/deep/cwp/view.asp?a=2705&q=593814&deepNav_GID=1635
Harris, D., & Jones, D. (2015). Ceremonial Stone Landscapes of New England and Developing
Best Practices to Assess Submerged Paleocultural Landscapes. Proceedings of the
Maritime Cultural Landscape Symposium. Washington, D.C.: National Park Service,
National Center for Preservation Technology and Training. Retrieved from
https://www.ncptt.nps.gov/blog/ceremonial-stone-landscapes-of-new-england-and-
developing-best-practices-to-assess-submerged-paleocultural-landscapes/
NCSHPO. (2017). What is a State Historic Preservation Officer (SHPO)? Retrieved from
National Conference of State Historic Preservation Officers: http://ncshpo.org/about-
us/what-is-shpo/
NOAA. (2017a). NOAA Coast Survey Wrecks and Obstructions Viewer. Retrieved from NOAA
Office of Coast Survey: https://wrecks.nauticalcharts.noaa.gov/viewer/
NOAA. (2017b). NOAA ENC Direct to GIS. Retrieved from NOAA Office of Coast Survey:
https://encdirect.noaa.gov/ENC_Direct/encdirect_download.html

228
NOAA. (2017c, October 2). NOAA ENC® – Electronic Navigational Charts. Retrieved from
NOAA Office of Coast Survey: https://www.nauticalcharts.noaa.gov/charts/noaa-
enc.html
NOAA. (2017d). U.S. Chart No. 1 (Chart Symbols). Retrieved from NOAA Office of Coast
Survey: https://nauticalcharts.noaa.gov/publications/us-chart-1.html
NOAA. (2017e, October 2). Wrecks and Obstructions Database. Retrieved from NOAA Office
of Coast Survey: https://nauticalcharts.noaa.gov/data/wrecks-and-obstructions.html
Salwen, B. (1962). Sea Levels and Archaeology in the Long Island Sound Area. American
Antiquity, 28(1), 46-55. Retrieved from https://www.jstor.org/stable/278077
State of Rhode Island. (2010). Rhode Island Ocean Special Area Management Plan. Wakefield:
Rhode Island Coastal Resources Management Council. Retrieved from
http://seagrant.gso.uri.edu/oceansamp/
Stone, J. R., Schafer, J. P., London, E. H., DiGiacomo-Cohen, M. L., Lewis, R. S., & Thompson,
W. B. (2005). Quaternary Geologic Map of Connecticut and Long Island Sound Basin.
Scientific Investigations Map 2784. Denver: U.S. Geological Survey. Retrieved from
https://pubs.usgs.gov/sim/2005/2784/
Weigold, M. E. (2004). The Long Island Sound: A History of Its People, Places, and
Environment. New York: New York University Press.
Weigold, M. E., & Pillsbury, E. (2014). Long Island Sound: A Socioeconomic Perspective. In J.
S. Latimer, M. A. Tedesco, R. L. Swanson, C. Yarish, P. E. Stacey, & C. Garza (Eds.),
Long Island Sound: Prospects for the Urban Sea (pp. 1-46). New York: Springer.
23.5 Appendices
23.5.1 List of Maps Used to Inform the Chapter
Below is a list of all maps used to inform this chapter, including maps presented above in the
narrative and additional maps used to support chapter findings. Maps listed below are organized
by the online data portal on which they are hosted (URL links to data portals are noted in Section
23.4 References above). Map products not accessible by online data portal are also noted below.
NOAA Coast Survey Wrecks and Obstructions Viewer
NOAA AWOIS Wrecks
NOAA ENC Wrecks
Non-Portal Map Products
NY SHPO Historic Inventory – Polygons
USACE LIS DMMP Historic Resources Inventory – Points
USACE LIS DMMP Historic Resources Inventory – Polygons
USACE LIS DMMP Long Island Sound Paleoshoreline
USACE LIS DMMP Underwater Cultural Resources Sensitivity
More information on some of the map products presented in this chapter, including URL links to
data and metadata, can be found in the Historic and Archaeological Map Book (CT DEEP,

229
2017). ***Not yet live*** Not all products showcased in the map book may be addressed in this
chapter or utilized to inform the final Blue Plan.
23.5.2 Notes on Stakeholder Engagement
Stakeholder engagement was crucial to informing, vetting, and reviewing the data presented in
this Inventory chapter. Engagement included phone, webinar, email, and in-person
correspondence with a number of stakeholders.
Within the public sector, the Blue Plan team engaged Connecticut SHPO and the Connecticut
State Archaeologist via an in-person meeting in early December 2017, along with email and
phone follow-up. The Blue Plan team also engaged New York SHPO staff and the U.S. Army
Corps of Engineers, New England District, both via email. Public sector engagement primarily
consisted of providing an overview of the overall Blue Plan process and gathering government-
based data on historic and archaeological resources.
Efforts were also made to consult with representatives from state- and federally-recognized tribal
nations in Connecticut and on Long Island, including the Mashantucket Pequot Tribal Nation
(CT), Eastern Pequot Tribal Nation (CT), Schaghticoke Indian Tribe (CT), Golden Hill
Paugussett Tribe (CT), Shinnecock Indian Nation (NY), and Unkechaug Indian Nation (NY).
The Blue plan team held a webinar with the Mohegan Tribe of Connecticut’s Tribal Historic
Preservation Officer in November 2017 to provide a general overview of the Blue Plan process.
The Blue Plan team also presented at the March 2018 Connecticut Native American Heritage
Advisory Council meeting, through which the team summarized the Blue Plan Inventory and
planning process and invited feedback from the Connecticut-based tribes (and others
representatives present) on how to best represent coastal lands, waters, and cultural resources
important to the tribes.
Feedback in the form of data input and interpretation, along with Inventory chapter review, was
largely provided by non-government sector experts, representing organizations such as
Archaeological and Historical Services, Inc., Long Island Traditions, Pace University, and Public
Archaeology Laboratory. Engagement with these stakeholders took place over phone and email.

230
Chapter 24. Research, Monitoring, and Education
Chapter Table of Contents
24.1 Key Data and Map Products .............................................................................................. 230 24.2 Assessment of Data Quality ............................................................................................... 239
24.2.1 Sources of Data and Metadata ................................................................................. 239 24.2.2 Accuracy, Representativeness, and Relevance of Map Products ............................. 240
24.2.3 Data Gaps and Availability of Data to Address Gaps .............................................. 241 24.3 Relevance ........................................................................................................................... 242
24.3.1 Relative Historical Importance ................................................................................. 242 24.3.2 Socio-Economic Context ........................................................................................... 243 24.3.3 Other Notes ............................................................................................................... 243
24.4 References .......................................................................................................................... 243 24.5 Appendices ......................................................................................................................... 245
24.5.1 List of Maps Used to Inform the Chapter ................................................................. 245 24.5.2 Notes on Stakeholder Engagement ........................................................................... 246
24.1 Key Data and Map Products
Research, Monitoring, and Education (RME) has been a use of LIS in one form or another for as
long as humans have utilized it as a resource. This continues today, with numerous universities,
schools, private organizations, and national security interests conducting RME activities as their
full interest in the Sound. Research, monitoring, and education are often closely linked, and
occur throughout the Sound. The societal benefits provided by continued RME activities are
very difficult to quantify, but can be qualified by saying that an informed, educated, and engaged
population promote management decisions that increase quality of life for all by promoting a
strong economy and an intact environment that provides the most ecosystem services.
The research opportunities provided by LIS are diverse and unique as the Sound itself.
Numerous research laboratories are located on the Sound or use it as a testbed, conducting
studies that span years or decades in time. The sound is a “natural laboratory,” offering a unique
suite of ecological and sociological conditions for research benefiting innumerous sectors and
subjects.
Long-term environmental monitoring is inherently place-based, seeking to understand the
conditions and changes that exist at a precise location over extended periods of time. The value
of long-term sites like these to natural resources management cannot be understated: without the
baselines and trends they provide, policies enabling sustainability would be impossible to create
or adjust to changing conditions.
The educational opportunities offered by organizations throughout the Sound are multifarious,
and range from introductory sailing to nutrient cycling, from students in kindergarten to this in
their post-doctoral studies. Traditional education is provided by magnet schools, colleges,
academies, and universities, while other opportunities are available from aquaria, museums, and

231
experiential outfits that teach sailing (see Chapter 19 Recreational Boating and Sailing), SCUBA
diving (see Chapter 21 Non-Consumptive Recreation), estuarine ecology, and many other
subjects.
Few map products exist that are representative of RME activities in the Sound. Perhaps the most
endorsed are those curated by the Connecticut Department of Energy and Environmental
Protection (DEEP), such as sampling locations for fish trawls (i.e., the Long Island Sound Trawl
Survey [LISTS]) and water quality (WQ). CT DEEP is responsible for monitoring the entire
Sound on behalf of both Connecticut and New York, with funding provided in part by the
Federal Environmental Protection Agency (EPA) through the Long Island Sound Study (LISS).
The results of these studies are used by both states to define their environmental management
strategies independently.
DEEP LISTS activities are conducted spring and fall from the State research vessel John
Dempsey at 40 sites. These locations (Figure 1) are selected at random based on bottom type and
depth, and sampling activities occur throughout the water column along the towpath. Results
from this survey are combined with fisheries reports and analyzed statistically to determine next
year’s acceptable fish catch. Full methodology and results are available online on the DEEP
LISTS web page (CT Department of Energy and Environmental Protection, 2017a).
Figure 1. Long Island Sound Trawl Survey Towpaths, 1995-2012. Provided by CT DEEP; not
accessible online. Note that some areas are much more frequently sampled during this time
series (dense patches of lines); these are representative of particular bottom type/depth
combinations uncommon in the Sound and thus appear more regularly in the random sampling
algorithm (CT Department of Energy and Environmental Protection, 2017a).
DEEP Water Quality monitoring sites (Figure 2) were established in 1994 as part of the effort to
study and resolve hypoxic conditions that manifest annually in the bottom waters of the western
Sound. The majority of the 47 active stations are sampled during the summer months, while 17
stations are sampled year-round. Parameters recorded at each site include dissolved oxygen
(DO), temperature, salinity, dissolved and particulate silica and nitrogen, chlorophyll a, and total
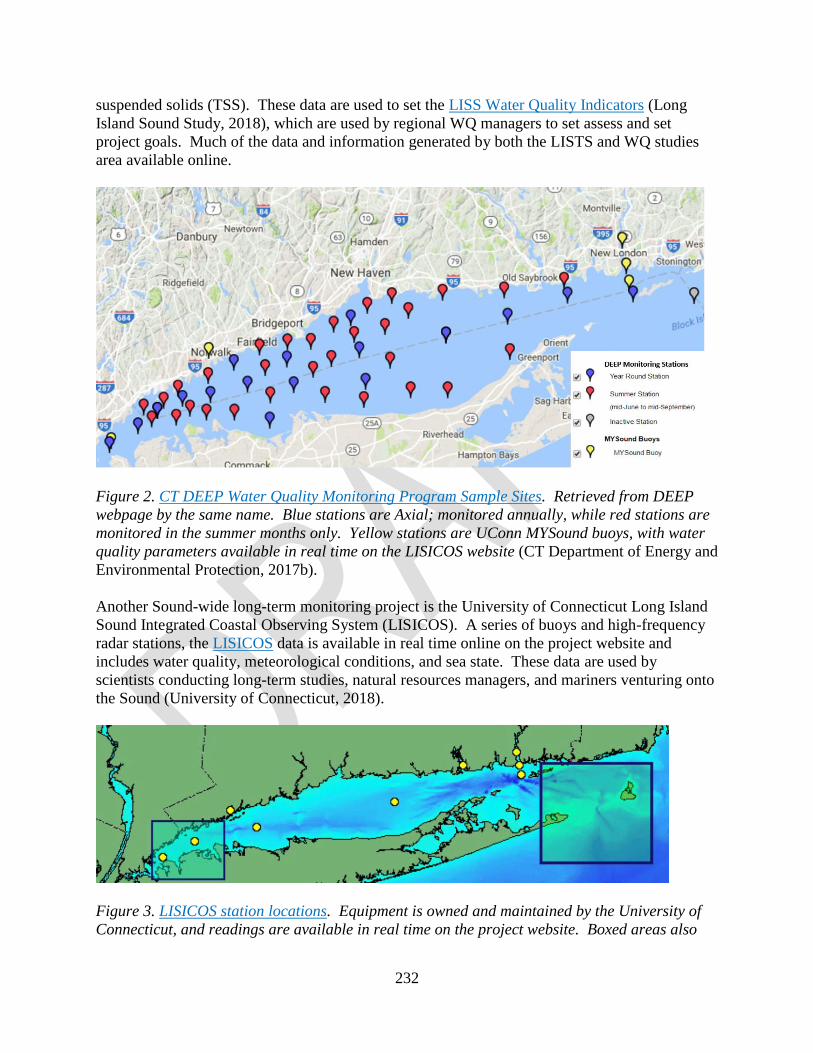
232
suspended solids (TSS). These data are used to set the LISS Water Quality Indicators (Long
Island Sound Study, 2018), which are used by regional WQ managers to set assess and set
project goals. Much of the data and information generated by both the LISTS and WQ studies
area available online.
Figure 2. CT DEEP Water Quality Monitoring Program Sample Sites. Retrieved from DEEP
webpage by the same name. Blue stations are Axial; monitored annually, while red stations are
monitored in the summer months only. Yellow stations are UConn MYSound buoys, with water
quality parameters available in real time on the LISICOS website (CT Department of Energy and
Environmental Protection, 2017b).
Another Sound-wide long-term monitoring project is the University of Connecticut Long Island
Sound Integrated Coastal Observing System (LISICOS). A series of buoys and high-frequency
radar stations, the LISICOS data is available in real time online on the project website and
includes water quality, meteorological conditions, and sea state. These data are used by
scientists conducting long-term studies, natural resources managers, and mariners venturing onto
the Sound (University of Connecticut, 2018).
Figure 3. LISICOS station locations. Equipment is owned and maintained by the University of
Connecticut, and readings are available in real time on the project website. Boxed areas also
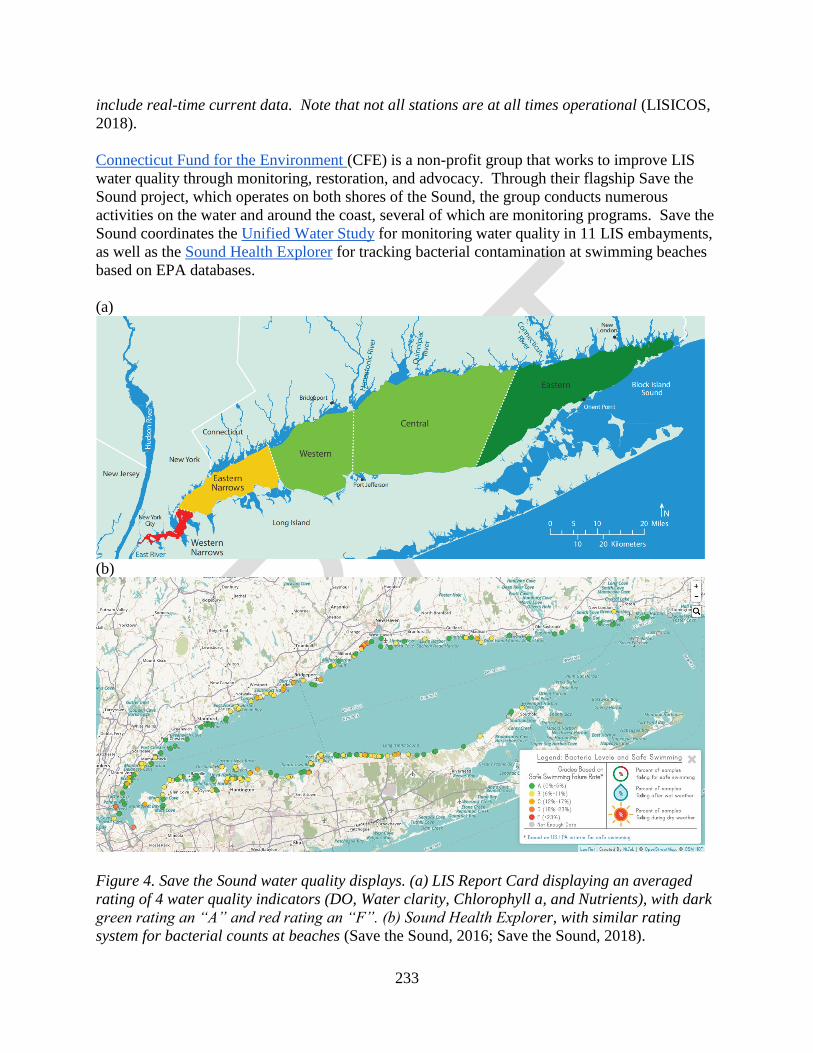
233
include real-time current data. Note that not all stations are at all times operational (LISICOS,
2018).
Connecticut Fund for the Environment (CFE) is a non-profit group that works to improve LIS
water quality through monitoring, restoration, and advocacy. Through their flagship Save the
Sound project, which operates on both shores of the Sound, the group conducts numerous
activities on the water and around the coast, several of which are monitoring programs. Save the
Sound coordinates the Unified Water Study for monitoring water quality in 11 LIS embayments,
as well as the Sound Health Explorer for tracking bacterial contamination at swimming beaches
based on EPA databases.
(a)
(b)
Figure 4. Save the Sound water quality displays. (a) LIS Report Card displaying an averaged
rating of 4 water quality indicators (DO, Water clarity, Chlorophyll a, and Nutrients), with dark
green rating an “A” and red rating an “F”. (b) Sound Health Explorer, with similar rating
system for bacterial counts at beaches (Save the Sound, 2016; Save the Sound, 2018).

234
Bird monitoring occurs throughout LIS, primarily conducted by citizen-scientists participating in
two longstanding surveys (Christmas and Summer Bird Counts, below), as well as collecting
incidental observation data from shore and boat. The eBird system (Figure 5) houses the central
database which is now collecting bird observations data from most bird watchers, everywhere
they go, for most bird related activities. Scientists are able to specify downloads of selected
subsets of this database to conduct their research. Bird watchers enter their bird observations
from their mobile phones or computers, including the number of each species, seen where and
when, with the option of including comments and photographs, etc. Other LIS bird surveys
tabulated in eBird include: breeding bird surveys, the Connecticut Bird Atlas, Big January
Counts, bird banding, the LIS Super Seawatch, and numerous waterfowl surveys performed by
USFWS.
Figure 5. Example eBird map, showing the thousands of trips in LIS which were reported to
eBird which included one or more common Terns. Map available on eBird (The Cornell Lab of
Ornithology, 2018).
Christmas Bird Counts (CBC) (Figure 6) occur annually from mid-December through early
January. Counts are concentrated efforts that follow prescribed methods and occur in defined
areas 15 miles in diameter annually. There are 14 CBC locations around the perimeter of LIS:
Napatree Point, New London, Old Lyme/Saybrook, Guilford, New Haven, Stratford/Milford,
Westport, Greenwich/Stamford, Bronx/Westchester, Queens, Northern Nassau County,
Smithtown, Orient, and Montauk. The CBC circles serve as the anchor points for 9 zones that
define survey areas over the width of LIS. Most of these counts have been done every year for
many decades, at the same time of year, each with dozens of observers, and provide good times
series for decadal analysis. Most birds are counted by experienced bird watchers “seawatching”
from shore, often looking out hundreds of yards into LIS using tripod-mounted telescopes and
long telephoto cameras. The majority of birds in LIS are within that range of shore, with a
minority further out, beyond scope range. All CBC data is maintained in its own central
database by the National Audubon Society, and is available to scientists to do their research.
Most of these CBCs have many decades of historical data which reveal trends in bird numbers
over time. Over the last decade much of this data has also been reported in eBird.

235
Summer Bird Counts are simply Christmas Bird Counts conducted in June, by similar CBC
procedures, in the same circles as the CBCs use in winter. Eight are done in CT, including two
overlapping LIS: Greenwich-Stamford and New Haven.
Figure 6. Christmas Bird Count Locations. Circles are also used for summer bird counts during
the breeding season. The 9 zones are used for both amateur and professional for ongoing bird
counts and studies. Map courtesy of Tom Robben.
The Motus Wildlife Tracking System uses “nano-tag” radio transmitters affixed to flying
organisms and a network of receiving stations to track the movements of birds, bats, and large
flying insects. The data gained through this international collaborative research effort are used
by scientists in many projects, including tracking migratory birds. There are several Motus
tracking antennas along the coast of LIS, established and maintained through various research
efforts (Figure 7).
Figure 7. Modus Receiving Antenna Locations. Note that a single animal passing through may
be picked up by any and all antennas in range. This allows for spatial and temporal tracking of
organisms near stations. Map available on Modus (Bird Studies Canada, 2018).

236
There are several long-standing datasets that are used as baselines with regard to monitoring
data; either for comparing results or for designing studies. One of these is the Sediment Texture
(grain size) data maintained by the US Geological Survey, used by DEEP when preparing the
annual LISTS program. Another is Pellegrino and Hubbard’s 1983 benthic community sampling
work, which covers the entire northern half of LIS (Figure 8).
Figure 8. Benthic Community Sampling Locations, from Pellegrino and Hubbard, 1983. Data
from this study is still used today in characterizing the LIS benthic ecosystem. Data layer by
Larry Poppe, USGS. Accessible via the NY Geographic Gateway (NYS DOS OPD, 2017).
Not all research in the Sound is focused on the waterbody itself. The Navy, through the Naval
Undersea Warfare Center (NUWC), has designated a Testing Range (Figure 9) for the waters
south of New England that includes the central and eastern portions of LIS. There is a NUWC
facility on Fishers Island, and additional influence from the larger Newport, RI-based NUWC
Division Newport. While NUWC use of the Sound is infrequent, it is possible that naval testing
will become more common in the protected waters offered by the LIS portion of the Test Range.
Much of this research is underwater, including unmanned vehicles, but some work includes use
of equipment on the surface or in the airspace just above the water. While naval research
activities typically does not impact other user of the Sound, information may be published in
Coast Guard Local Notice to Mariners (LNM) from time to time. When planning where to
conduct research activities NUWC refers to the Northeast Ocean Data Portal for identifying
conflicts to avoid, and has expressed interest in knowing where other existing and emerging uses
of LIS are. For more information on NUWC, see Chapter 27 National Security.

237
Figure 9. Naval Undersea Warfare Center Test Range. Note that Range extends as far west as
the Cape Cod elbow, and as far south as the shelf break. Accessible via the Northeast Ocean
Data Portal (Northeast Ocean Data Portal, 2018).
Representing every RME effort occurring in LIS is not the intent of this Inventory; the studies
highlighted above are simply the most crucial to management of the Sound. Many other
research, monitoring, and educational endeavors exist. Tables 1-3 below demonstrate this, and
should be considered as a representative cross-section of the breadth of this sector.
Table 1. Research institutions using LIS. Note that this list may be incomplete, and should be
updated in future revisions of this Inventory.
Research Institution Location
UConn Groton, CT
State University of New York (SUNY)
(Stony Brook and Maritime)
Stony Brook, NY; Bronx, NY
Sea Grant Groton, CT; Stony Brook, NY
Quinnipiac University Hamden, CT
Wesleyan University Middletown, CT
Yale University New Haven, CT
Sacred Heart University Fairfield, CT
Naval Undersea Warfare Center Newport, RI
Mystic Aquarium Mystic, CT
The Maritime Aquarium Norwalk, CT

238
Table 2. Monitoring organizations and activities in LIS. Many entities maintain or contribute to
long time series datasets about environmental conditions in and around the Sound. The list
below is incomplete, but represents many of the most prominent groups. Please see each
organization’s website for more details.
Organization Monitoring Activity Location
Project Oceanology Seafloor and plankton tows Groton, CT; Mouth of
the Thames
Project Limulus Horseshoe Crab breeding and
movement studies Throughout LIS
Clean Up Sound and Harbor Water quality, bacteria Mystic and Stonington,
CT
Millstone Power Station Effluent, regional ecosystem Waterford, CT
Audubon Christmas Bird Counts, others Throughout LIS
Connecticut Ornithological
Association (COA)
eBird; capture of almost all
bird observations in LIS Throughout LIS
The Maritime Aquarium Participant in Project Limulus,
Unified Water Study, others Norwalk, CT
Coastal Research and Education
Society of Long Island Marine mammals West Sayville, NY
Ferry-based Observations for
Science Targeting Estuarine
Research (FOSTER)/
SoundScience
Water column currents; marine
and atmospheric observations
Cross Sound Ferry and
Bridgeport-Port Jefferson
Steamboat Co. routes.
Friends of the Bay Water quality Oyster Bay, NY
Long Island Sound Study
Sundry monitoring projects not
mentioned above, including
climate change and sea level
rise, seafloor mapping, and
riparian restoration
Throughout LIS
Gotham Whale Whales and other marine
mammals.
Expected to expand into
LIS soon
Table 3. Educational institutions dependent on LIS. Note that there is some overlap between
research, monitoring, and education activities, as well as between educational programs.
Institution Type Organization Location
UConn Storrs, CT; Groton, CT;
Stamford, CT
SUNY Stony Brook Stony Brook, NY
Fairfield University Fairfield, CT
U.S. Coast Guard Academy Groton, CT
Maritime Merchant Academy Kings Point, NT
Mitchell College New London, CT
Connecticut College New London, CT

239
Institution Type Organization Location
K-12 School
Marine Science Magnet High School of
Southeastern CT
Groton, CT
Bridgeport Regional Aquaculture
Science & Technology Education
Center
Milford, CT
Mystic Aquarium Mystic, CT
The Maritime Aquarium at Norwalk Norwalk, CT
Cold Spring Harbor Whaling Museum Cold Spring Harbor, NY
Mystic Seaport Mystic, CT
Long Island Aquarium Riverhead, NY
New London Maritime Society New London, CT
The Ledge Light Foundation Groton, CT
Mystic Whaler Tall Ship New London, CT
Mystic Seaport Mystic, CT
Soundwaters Stamford, CT
The Sound School New Haven, CT
Thames River Heritage Park New London, CT
New England Science and Sailing Stonington, CT
Project Oceanology Groton, CT
24.2 Assessment of Data Quality
24.2.1 Sources of Data and Metadata
CT DEEP monitoring data come from the CT DEEP website and from personal communication
with the Marine Fisheries staff. All data informing the map products come from DEEP
monitoring activities. Metadata for the DEEP fisheries data is available from DEEP Marine
Fisheries, while WQ metadata is available here. Information on LISICOS comes from the
project website; metadata for the map and project are available here, or by contacting LISICOS
staff. The CFE LIS Report Card is composed from water quality monitoring data from CT
DEEP, New York City Department of Environmental Protection, and the Interstate
Environmental Commission/New England Interstate Water Pollution Control Commission, with
more information available here. The Sound Health Explorer is based on EPA STORET and
BEACON 2.0 databases, with more information available here.
Major funding for DEEP monitoring, LISICOS, and many CFE projects come from The Long
Island Sound Study (LISS); a partnership of the Environmental Protection Agency (EPA), state
agencies from both Connecticut and New York, user groups, and interested organizations and
individuals. LISS supports many projects in the Research, Monitoring, and Education sector
through the Long Island Sound Futures Fund, a grant program primarily funded by the EPA and
managed by the National Fish and Wildlife Foundation. Other efforts funded through LISS
include seafloor mapping, eelgrass monitoring, Project Limulus, and endangered and migratory
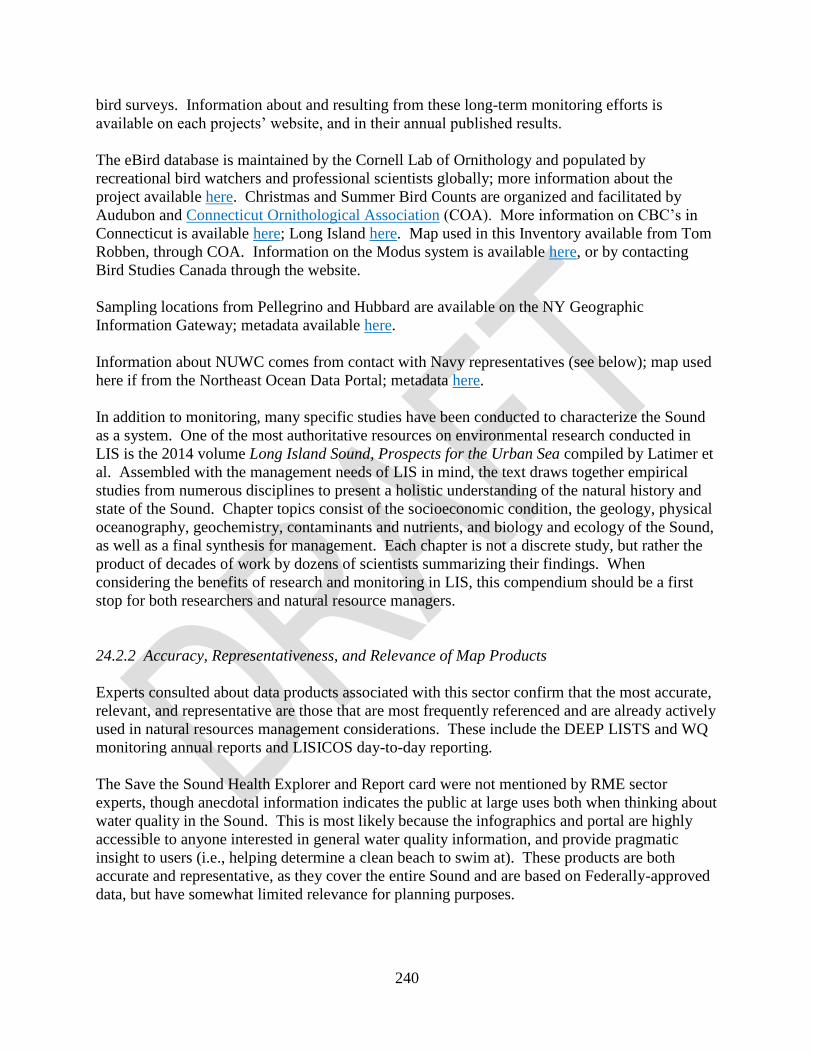
240
bird surveys. Information about and resulting from these long-term monitoring efforts is
available on each projects’ website, and in their annual published results.
The eBird database is maintained by the Cornell Lab of Ornithology and populated by
recreational bird watchers and professional scientists globally; more information about the
project available here. Christmas and Summer Bird Counts are organized and facilitated by
Audubon and Connecticut Ornithological Association (COA). More information on CBC’s in
Connecticut is available here; Long Island here. Map used in this Inventory available from Tom
Robben, through COA. Information on the Modus system is available here, or by contacting
Bird Studies Canada through the website.
Sampling locations from Pellegrino and Hubbard are available on the NY Geographic
Information Gateway; metadata available here.
Information about NUWC comes from contact with Navy representatives (see below); map used
here if from the Northeast Ocean Data Portal; metadata here.
In addition to monitoring, many specific studies have been conducted to characterize the Sound
as a system. One of the most authoritative resources on environmental research conducted in
LIS is the 2014 volume Long Island Sound, Prospects for the Urban Sea compiled by Latimer et
al. Assembled with the management needs of LIS in mind, the text draws together empirical
studies from numerous disciplines to present a holistic understanding of the natural history and
state of the Sound. Chapter topics consist of the socioeconomic condition, the geology, physical
oceanography, geochemistry, contaminants and nutrients, and biology and ecology of the Sound,
as well as a final synthesis for management. Each chapter is not a discrete study, but rather the
product of decades of work by dozens of scientists summarizing their findings. When
considering the benefits of research and monitoring in LIS, this compendium should be a first
stop for both researchers and natural resource managers.
24.2.2 Accuracy, Representativeness, and Relevance of Map Products
Experts consulted about data products associated with this sector confirm that the most accurate,
relevant, and representative are those that are most frequently referenced and are already actively
used in natural resources management considerations. These include the DEEP LISTS and WQ
monitoring annual reports and LISICOS day-to-day reporting.
The Save the Sound Health Explorer and Report card were not mentioned by RME sector
experts, though anecdotal information indicates the public at large uses both when thinking about
water quality in the Sound. This is most likely because the infographics and portal are highly
accessible to anyone interested in general water quality information, and provide pragmatic
insight to users (i.e., helping determine a clean beach to swim at). These products are both
accurate and representative, as they cover the entire Sound and are based on Federally-approved
data, but have somewhat limited relevance for planning purposes.

241
Longstanding datasets such as Pellegrino and Hubbard accurately display where research has
occurred, but alone are not representative of the RME sector, and thus should not be considered
relevant for planning considerations related to RME. They are, however, valuable to aspects of
the Ecological Characterization of the Sound (see Chapter 1 Ecological Characterization
Process).
Thirteen Christmas Bird Count (CBC) locations include LIS waters, spanning all of the CT
shoreline, and most of the NY shoreline. CBCs are considered research and monitoring, since
their count data is collected centrally and used by many scientists. The map of CBCs is accurate
and representative (complete). CBC locations are relevant to consider in LIS planning because
their multi-decadal time series of data suggest cause and effect relationships.
The eBird system is at least as accurate as the CBCs, since the eBird computers spot unlikely
bird reports and contact the observer to discuss those unusual reports and verify/delete them. The
database is more representative than the CBCs because it covers every area, including outside the
CBC 15-mile diameter circles, and contains observations from a full year, not just the three
weeks starting in mid-December as CBCs do. The eBird database is relevant to LIS planning for
the same reasons as CBCs, but does not sample from repeated discrete locations around the
Sound.
Both eBird data and the cross-Sound zones (Figure 6) have been adopted by the NOAA Office of
Response and Restoration Ecological Sensitivity Index for oil spill management, and thus can
already be seen to be relevant to planning. See Chapter 5 Birds, for more information on Bird
Counts and eBird. The numerous other bird monitoring studies (Modus, Connecticut Bird Atlas,
Big January Counts, the LIS Super Seawatch, Federal waterfowl studies, etc.) are all part of the
larger ornithological and ecological understanding of the Sound and its place in migratory routes.
Information from each is considered accurate and representative of the natural history of LIS,
and thus relevant to planning, both as it relates to RME activities as well as ecologically.
Additionally, the discrete locations these studies are conducted at should be considered relevant
to planning.
24.2.3 Data Gaps and Availability of Data to Address Gaps
While the studies presented above are considered to be the most useful to Sound-wide
management and planning, several other specific studies exist. For example, Project Limulus,
run by the Sacred Heart biology department, collects data about the horseshoe crab population in
LIS. This research has been ongoing since 1998, and is an excellent example of citizen science
informing management research. There is a priority need to include more information about
Project Limulus sample locations and management impacts in this Inventory. Project Limulus is
a perfect example of why characterizing RME in the Sound is so complex, but also so important:
it is a research project, based on long-term monitoring, that uses citizen science and education as
methodology, and produces results key to the management of a unique natural resource. This
gap may be addressed by conversations with Project Limulus lead staff.

242
Other data gaps persist in the characterization of this sector. The tables of organizations above
(Tables 1, 2, and 3) are known to be incomplete, and should be revised in the future. This can be
addressed through a more comprehensive study, including further stakeholder engagement.
Other relevant RME organizations, including citizen science programs, need to be identified and
if their activities are accurate, relevant, and representative these efforts should be reflected in this
Inventory. As part of this, any discrete areas that are important to education, especially
experiential education, should be identified and mapped. Additionally, it is unknown if there are
particular areas in LIS that are important for research that is not based in monitoring, but rather
on undisturbed local conditions. Furthermore, as the LISS seafloor mapping program evolves,
this should be evaluated for incorporation as part of the RME use of the Sound.
Lastly, there is a need to quantify the contribution research institutions make to the
socioeconomic wellbeing of everyone living near and using the Sound. This can be
accomplished through research into existing studies, or by conducting a dedicated study.
24.3 Relevance
24.3.1 Relative Historical Importance
Scientific exploration of the Sound has been occurring since its “discovery” by Adriaen Block in
1614. Early scientific inquiry consisted primarily of charting the coasts for resources and trade.
Since at least the mid-1800s NUWC has conducted weapons and technology research within the
confines of the sound, including many aspects of submarine warfare, and continuing today.
NUWC use of the Sound for research has intensified since 2012, with the expansion of the Test
Range to include LIS.
Bird watchers are very active in and around Long Island Sound, but until the last decade, most of
their data, from their many field trips, were kept in paper notebooks and personal computers,
eventually being lost. Bird watchers have transformed over the last decade into citizen scientists
as their observations and studies are increasingly quantified, standardized, and entered into
central databases for scientists to analyze, especially thanks to the rise of the eBird system in the
last 15 years. In 1900 the first avian citizen science event began, the annual Christmas Bird
Counts (CBC), which now reveal long-term population and distribution trends at hundreds of
locations across the USA and the world. Summer Bird Counts, the summer version of those
CBCs, began in 1971 and has been conducted in numerous CT locations since then. These and
most other bird observations are increasingly reported via the eBird system, into its one central
database which is used for many academic studies of bird and environmental changes. The eBird
system has been lauded as a way to “democratize science” with many associated benefits,
including getting more of the public more comfortable and confident about science and its
methods. Birders, for example, have watched and counted birds over the decades, and have seen
the declines in many bird species. Their citizen-science experiences have helped them better
understand the changing ecosystems on the planet, and be leaders in conservation and
environmental issues.

243
24.3.2 Socio-Economic Context
Most research conducted in and about LIS is grant funded and aimed at answering a specific
question. These projects support research teams, technical personnel, peripheral staff, and
suppliers in the community. Knowledge derived from research in LIS may be applied locally or
globally, depending on the study.
Monitoring efforts are conducted to determine changes in the LIS system, such that corrective
changes can be made before any given natural resource is diminished or denigrated. Given that
the overall estimated value of LIS in ecosystem benefits ranges from $9.4 billion (Long Island
Sound Study, 2018) to $37.0 billion (Earth Economics, 2015) management based on quality data
is paramount.
Citizen science is the collection of scientific data according to prescribed methods by trained
volunteers. Citizen science has become an increasingly crucial part of monitoring throughout the
US and abroad, and LIS is no different. Many smaller monitoring efforts, including those funded
by the LISS and CFE depend on citizen science for much of their annual data. These data are
used directly in the management of the Sound in both Connecticut and Long Island, so the
importance of public involvement cannot be overstated. LISS maintains a list of volunteer
opportunities available around the Sound, accessible on their website.
Education based in or focusing on LIS primarily centers on the history and ecology of the
estuary. The economic value of the institutions curating exhibits or offering related lessons has
not been quantified in any identified report thus far. Despite this, the social value of learning
opportunities related to the Sound can be said to enhance quality of life for all, by promoting
preservation of the natural resources the Sound offers and an appreciation of the many uses that
rely on those uses today.
24.3.3 Other Notes
No other notes at this time.
24.4 References
Audubon. (n.d.). Christmas Bird Count. From Connecticut Audubon:
http://ct.audubon.org/christmas-bird-count
Bird Studies Canada. (2018). From Modus Wildlife Tracking System: https://motus.org/
CT DEEP. (2017). Long Island Sound Blue Plan Webinars. From Connecticut Department of
Energy and Environmental Protection:
http://www.ct.gov/deep/cwp/view.asp?a=2705&q=593814&deepNav_GID=1635
CT Department of Energy and Environmental Protection. (2017a). Long Island Sound Trawl
Survey. From
http://www.ct.gov/deep/cwp/view.asp?a=2696&q=322660&deepNav_GID=1647

244
CT Department of Energy and Environmental Protection. (2017b). Long Island Sound Water
Quality Monitoring Stations. From http://www.depdata.ct.gov/maps/lis/liswqmap.htm
CT Fund for the Environment. (2018). Sound Health Explorer. From Save the Sound:
http://www.soundhealthexplorer.org/
CT Fund for the Environment. (2018). Unified Water Study. From Connecticut Fund for the
Environment/Save the Sound: http://www.ctenvironment.org/uws
CT Fund for the Environment. (n.d.). Connecticut Fund for the Environment/Save the Sound.
From http://www.ctenvironment.org/
Earth Economics. (2015). The Trillion Dollar Asset. From Long Island Sound Study:
https://drive.google.com/file/d/0ByzlUWI76gWVVW1qdXRCbGhMMTg/view?pref=2&
pli=1
Latimer, J. S., Tedesco, M. A., Swanson, R. L., Yarish, C., Stacey, P. E., & Garza, C. (2014).
Long Island Sound, Prospects for the Urban Sea. New York: Springer.
Long Island Sound Study. (2018). Long Island Sound - By The Numbers. From
http://longislandsoundstudy.net/about-the-sound/by-the-numbers/
Long Island Sound Study. (2018). Long Island Sound Study. From
http://longislandsoundstudy.net/
Long Island Sound Study. (2018). Status and Trends: LIS Environmental Indicators. From
http://longislandsoundstudy.net/research-monitoring/long-island-sound-environmental-
indicators/
Long Island Sound Study. (2018). Volunteer Opportunities. From Long Island Sound Study:
http://longislandsoundstudy.net/get-involved/lis-volunteer-opportunities/
National Fish and Wildlife Foundation. (2018). Who We Are. From NFWF:
http://www.nfwf.org/whoweare/Pages/home.aspx#.WnIo8bynG01
Northeast Ocean Data Portal. (2018). Northeast Ocean Data Portal. From Northeast Ocean
Data: http://www.northeastoceandata.org/data-explorer/
NYS DOS OPD. (2017). New York Geographic Information Gateway. From New York State
Department of State, Office of Planning and Development:
http://opdgig.dos.ny.gov/#/map
Project Limulus. (2018). SHU Biology Department. From Sacred Heart University:
http://www.sacredheart.edu/academics/collegeofartssciences/academicdepartments/biolo
gy/projectlimulus/
Save the Sound. (2016, October). Long Island Sound Report Card 2016. From Eco Report Card:
https://ecoreportcard.org/site/assets/files/1853/2016-long-island-sound-report-card.pdf
Save the Sound. (2018). Sound Health Explorer. From Save the Sound:
http://www.soundhealthexplorer.org/
The Cornell Lab of Ornithology. (2018). eBird. From https://ebird.org/home
University of Connecticut. (2018). Long Island Sound Coastal Observing System. From
http://lisicos.uconn.edu/
US Environmental Protection Agency. (2018, January 16). Water Quality Data. From Water
Data and Tools: https://www.epa.gov/waterdata/water-quality-data-wqx
US Environmental Protection Agency. (n.d.). Find a Beach. From BEACON 2.0:
https://watersgeo.epa.gov/beacon2/
US Geological Survey. (n.d.). USGS Studies in Long Island Sound. From Woods Hole Coastal
And Marine Science Center: https://woodshole.er.usgs.gov/project-
pages/longislandsound_archive/Data/Texture.htm

245
24.5 Appendices
24.5.1 List of Maps Used to Inform the Chapter
Below is a list of all maps used to inform this chapter, including maps presented above in the
narrative and additional maps used to support chapter findings. Maps listed below are organized
by the online data portal on which they are hosted (URL links to data portals are noted in Section
24.4 References above). Map products not accessible by online data portal are also noted below.
Please note that many of the maps used in this chapter were simply meant to serve as examples
that serve to represent the larger extent of available maps on a certain map portal. Maps that
specifically serve as example maps are demarcated with the caret symbol (^) below.
Northeast Ocean Data Portal
Naval Undersea Warfare Center Testing Range
New York Geographic Information Gateway
Long Island Sound Benthic Communities
CT DEEP Long Island Sound Water Quality Monitoring Stations Viewer
Water Quality Monitoring Program Sample Sites
Save the Sound’s Sound Health Explorer
Bacterial Levels and Safe Swimming – Sampling Locations^
eBird
Common Tern – Sterna hirundo, Year-Round, All Years^
Motus Wildlife Tracking System
Receiver Locations^
Non-Portal Map Products
Christmas Bird Count Locations
CT DEEP Long Island Sound Trawl Survey Towpaths, 1995-2012
LISICOS Station Locations
Save the Sound LIS Report Card 2016^
More information on some of the map products presented in this chapter, including URL links to
data and metadata, can be found in the Research, Monitoring, and Education Map Book ***Not
yet live*** (CT DEEP, 2017). Not all products showcased in the map book may be addressed in
this chapter or utilized to inform the final Blue Plan.

246
24.5.2 Notes on Stakeholder Engagement
Marine Fisheries staff, emails with two university professors familiar with many of the potential
data sets, and a call with the NUWC Senior Environmental Planner. This contact all occurred in
January and February 2018, and was efficient for confirming relevant map products, rejecting
irrelevant information, and identifying more appropriate sources. The meeting with DEEP staff
evaluated the LISTS, DEEP WQ sampling sites, and Pellegrino and Hubbard maps, as well as
several that were deemed irrelevant. University of Connecticut professors were each involved
with research work mentioned here: one leads the LISICOS program and discussed that, and
pointed to Latimer, et al. (2014) as a good resource. The other has lead several studies
characterizing LIS benthic ecology and seafloor surveys, and confirmed that DEEP monitoring
data is accurate, representative, and relevant, as well as suggesting several other, localized
research efforts that could be considered there. However, these studies are not considered
representative research in the Sound as a whole in the way Latimer, et al. (2014) is. The
conversation with NUWC staff characterized Navy research activities in and around LIS.
Marine Transportation, Infrastructure, and Security

247
Chapter 25. Marine Transportation, Navigation, and Infrastructure
Chapter Table of Contents
25.1 Key Data and Map Products .............................................................................................. 247 25.2 Assessment of Data Quality ............................................................................................... 251
25.2.1 Sources of Data and Metadata ................................................................................. 251 25.2.2 Accuracy, Representativeness, and Relevance of Map Products ............................. 251
25.2.3 Data Gaps and Availability of Data to Address Gaps .............................................. 252 25.3 Relevance ........................................................................................................................... 253
25.3.1 Relative Historical Importance ................................................................................. 253 25.3.2 Socio-Economic Context ........................................................................................... 254 25.3.3 Other Notes ............................................................................................................... 255
25.4 References .......................................................................................................................... 255 25.5 Appendices ......................................................................................................................... 255
25.5.1 List of Maps Used to Inform the Chapter ................................................................. 255 25.5.2 Notes on Stakeholder Engagement ........................................................................... 256
25.1 Key Data and Map Products
The Marine Transportation, Navigation and Infrastructure Sector encompasses a variety of
traditional water-dependent uses including transportation by cargo vessels, tug and tow vessels,
and ferries and the associated activities and facilities that support such uses. In addition, because
it represents such an intensive use of Long Island Sound, recreational boating is mentioned in
this sector but explored more deeply in Chapter 19 Recreational Boating and Sailing.
The All Vessel Density map, which is an aggregation of the passenger, cargo, tug-tow and tanker
vessel density maps, is an important and useful map product for this sector. This map shows
commercial vessel density traffic routes as “heat maps” based on actual vessel tracking over the
course of the year and is the best available source of data for identifying potential conflict with
the commercial transportation sector.

248
Figure 1. Marine Transportation: Commercial Traffic. 2013 All Vessel Density. Commercial
vessel traffic derived from Automatic Identification System (AIS) tracking data. The relative
amount of vessel activity is indicated qualitatively from high (red) to low (blue). Access available
via the Northeast Ocean Data Portal (Northeast Ocean Data Portal, 2017).
Similar to the commercial vessel density maps, the Recreational Boating Density Map is a
valuable source of information for identifying potential conflicts with boating traffic. This map
is also a heat map showing intensity of use. A map showing the individual track lines used to
generate the heat map is also available on the Northeast Ocean Data Portal and provides useful
context when zoomed in for more granular analysis of where recreational boating occurs.

249
(a)
(b)
Figure 2. Recreational Boating. Recreational boating route as reported in 2012 recreational
boating survey. Information is displayed as (a) a boating density “heat map” showing the
relative amount of vessel activity indicated qualitatively from high (red) to low (green); and (b)
track lines or routes reported by boaters. Access available via the Northeast Ocean Data Portal
(Northeast Ocean Data Portal, 2017).
The map book includes a map of maintained federal navigation channels. Navigation channels
are extremely important human use areas where potential for conflict is high and uses other than
navigational will be severely restricted. The channels are difficult to see at a sound-wide scale
and the information is most useful by accessing directly through the Northeast Ocean Data Portal
(NODP) and zooming in. The Marine Transportation view on the NODP also includes
designated anchorage areas and dredged material disposal locations which are areas where
certain uses may be restricted or prohibited. For example, activities that disturb the seafloor
should not be allowed in dredged material disposal areas and placement of permanent structures
in anchorage areas should be restricted.

250
Figure 3. Marine Transportation: Navigation. Information includes maintained navigation
channels, anchorage areas and dredged material disposal areas. Access available via the
Northeast Ocean Data Portal (Northeast Ocean Data Portal, 2017).
It is also important to understand coastal infrastructure in this sector as it could influence
surrounding water quality, commercial activity, and recreational use. Figure 5 is a map
showcasing the Sewage Treatment Plants on the Connecticut side of Long Island Sound. For
more information on coastal infrastructure and activity, please refer to Chapter 20 Harbors and
Marinas and Chapter 26 Energy and Telecommunications.
Figure 4. Sewage Treatment Plants. Municipal, Private, and State-Owned Sewage Treatment
Plants. Access available via the Aquaculture Mapping Atlas (Aquaculture Mapping Atlas, 2017).

251
25.2 Assessment of Data Quality
25.2.1 Sources of Data and Metadata
All the data used to inform this chapter, with the exception of the Sewage Treatment Plants data
layer, are available via the Northeast Ocean Data Portal. Some sets of data can also be viewed on
other portals. Shipping Lanes and Zones can also be viewed on the New York Geographic
Information Gateway and Maintained Channels can also be viewed via the Mid-Atlantic Ocean
Data Portal. Full metadata descriptions can be found on the Northeast Ocean Data Portal, New
York Geographic Information Gateway, and Mid-Atlantic Ocean Data Portal.
The Sewage Treatment Plan data layer is the one exception and can found on The Aquaculture
Mapping Atlas. The data source and maintainer is UConn Clear in partnership with CT Sea
Grant and the CT Department of Agriculture, Bureau of Aquaculture. More metadata
information on sewage treatment plants and municipal wastewater can be found on CT DEEP’s
Municipal Wastewater page (CT DEEP, 2017). Additional source and metadata information may
be found in Connecticut’s Open Data Sewage Treatment Plant data layer; which uses
information from CT DEEP (CT DEEP, 2018).
To inform the Commercial Vessel Density data layer, AIS data was collected from vessels in
2013. Further information on the requirement of vessels to have AIS can be found Marine
Cadastre’s AIS Frequently Asked Question page (Marine Cadastre, 2016).
Marinas by County, 2013 and Ports Cargo Volumes were developed in part through economic
research and reports. Marinas by County, 2013 was based on research from the Center for the
Blue Economy and NOAA’s 2013 Economics National Ocean Watch (ENOW) database. The
Ports Cargo Volumes layer was sourced through the National Geospatial-Intelligence Agency
(NGA) World Port Index.
Recreational Boating Density was created based on resulted from the 2012 Northeast
Recreational Boater Survey, which was conducted in part by SeaPlan. More information on this
report and how it was used to develop this data layer can be found in Chapter 19 Recreational
Boating and Sailing.
Other layers are federally sourced and maintained including the Pilot Boarding Areas developed
by the United States Coast Pilot, Shipping Lanes and Zones developed by the NOAA Coastal
Services Center, and Maintained Channels developed by the U.S. Army Core of Engineers.
25.2.2 Accuracy, Representativeness, and Relevance of Map Products
Commercial vessel density map products are highly relevant in Long Island Sound. Commercial
traffic data are considered accurate and representative of vessel tracks but do not identify if or
where vessels may stop between end points. Vessel AIS data may not represent all types of
commercial vessel traffic in Long Island Sound. Some subsectors of marine commercial vessel
use such as sightseeing and small commercial fishing and charter vessels may be excluded.

252
These uses could be important in some areas. Stakeholders generally responded positively to
commercial vessel traffic maps. Some expressed concerns about representativeness because the
maps are not based on more current AIS datasets and the maps do not reflect the temporal aspect
of vessel traffic (for example the track lines representing the Bridgeport-Port Jefferson Ferry
appear as solid lines but the ferry may run only once per hour).
Recreational boating maps are highly relevant but accuracy and representativeness are uncertain
because they are based on boater survey responses over a narrow time scale. Some stakeholders
raised concerns about the representativeness of the recreational boating traffic data.
Stakeholders commented that data on marinas may be highly relevant and expressed concern that
detailed location information on individual marinas is not available and that aggregating the
number of marinas by county as shown in these maps is of limited value.
The maintained channels maps are highly relevant and because they are based on USACE and
NOAA surveys are also highly accurate and representative of the location of Federal Navigation
Projects. However, the maps are not fully representative of all maintained channels, which may
also include locally or privately maintained channels
Maps showing anchorage areas and dredged material disposal site, which are on the Northeast
Ocean Data Portal but are not in the map book, are relevant and very accurate and representative.
It was noted by one stakeholder that the Bridgeport Dredged Material Management Plan and the
locations of Confined Aquatic Disposal (CAD) Cells for dredged material may be relevant.
25.2.3 Data Gaps and Availability of Data to Address Gaps
As noted above, more current vessel traffic map products are needed and NOAA has indicated
that the commercial vessel density maps products are expected to be updated in the early 2018.
The updated map products are expected to represent vessel traffic on a monthly rather than
annual time scale.
As noted earlier AIS is not required on some smaller commercial and passenger vessels and
recreational vessels are not represented. Vessel AIS data may not represent all types of
commercial vessel traffic in Long Island Sound. Thus, some subsector of marine vessel use such
as sightseeing and small commercial fishing and charter vessels may be excluded. These uses
could be important in some areas. A stakeholder noted that dinner and tour boats are an
important use (e.g., Thimble Island tours, New London lighthouse tours).
More current, comprehensive and detailed recreational vessel boating density information is
desirable, however there is no readily available source of data and the survey approach used for
the existing dataset would be costly and time consuming to repeat and there are currently no
plans for doing so.
253
While non-federal channels are not included in the navigation channels dataset, identifying and
creating new map products for other maintained channels could be a significant effort relative to
the value of the information.
While maps of existing open water dredged material disposal sites are available, the location of
CAD cells and other future dredged material management locations could be beneficial and
would not require significant investment to create.
Mapping of specific locations of marinas would be useful and may be available. The
Aquaculture Mapping Atlas contains locations of some but not all marinas (Aquaculture
Mapping Atlas, 2017).
Updated and more detailed information on ports cargo volume will become available from a
study that is being conducted for the CT Port Authority by the Connecticut Economic Resource
Center.
A stakeholder commented that Massachusetts has identified historic shipping lanes, which could
be helpful when considering potential future shipping opportunities.
A stakeholder suggested that other past uses, such as lobstering areas, should be identified in the
event that such uses return.
25.3 Relevance
25.3.1 Relative Historical Importance
The State of Connecticut has long support traditional water-dependent uses through the
Connecticut Coastal Management Act (CCMA), giving “high priority and preference to water-
dependent use,” where such uses are defined to include, among others, marinas, recreational and
commercial fishing and boating facilities, port facilities, navigation aids, basins and channels and
uses dependent upon waterborne transportation (C.G.S. Sec. 22a-93(16)). The CCMA establishes
various policies pertaining to marine transportation as follows:
“To promote, through existing state and local planning, development, promotional and
regulatory authorities, the development, reuse or redevelopment of existing urban and
commercial fishing ports giving highest priority and preference to water-dependent uses,
including but not limited to commercial and recreational fishing and boating uses”
(C.G.S. Sec. 22a-92(b)(1)(C))
“To disallow uses with unreasonable congest navigation channels, or unreasonably
preclude boating support facilities elsewhere in a port or harbor”
(C.G.S. Sec. 22a-92(b)(1)(C))
“To encourage, through the state permitting program for dredging activities, the
maintenance and enhancement of existing federally maintained navigation channels,
basins and anchorages”
(C.G.S. Sec. 22a-92(c)(1)(C))
254
“To encourage increased recreational boating use of coastal waters”
(C.G.S. Sec. 22a-92(b)(1)(G))
In 2016, the Connecticut Port Authority (CPA) was established as a state-wide authority to
coordinate the development of Connecticut's ports and harbors (CPA, 2018). The CPA is a
primary stakeholder in the Blue Plan and is represented on the Blue Plan Advisory Committee by
Executive Director Evan Matthews. Among various other significant stakeholders include the
Connecticut Maritime Coalition, Connecticut Harbor Management Association, towing service
companies, ferry operators and cargo terminal operators (Connecticut Harbor Management
Association, 2018; Conneticut Maritime Coalition, 2017).
Marine transportation has been an important use of Long Island Sound historically and, though
having suffered a decline, remains so today. Marine transportation can provide economic,
cultural, environmental and quality of life benefits through increased economic activity
(statewide and in urban waterfront areas), reductions in highway congestion and air emissions,
availability of recreational boating opportunities. Connecticut has three deep water ports in
Bridgeport, New Haven and New London, and numerous smaller harbors that support various
commercial water-borne transportation activities (e.g., Stamford, Norwalk, Stonington) and
numerous recreational boating marinas. In 2012, the State of Connecticut released Connecticut’s
Deepwater Port Strategy Study to assist the state in developing and implementing a long-term
strategy for the economic development of Connecticut’s three deep water ports (Moffat &
Nichol, 2012). This study reports that “despite its rich maritime history, the Connecticut ports
and related maritime industries have not fared well in recent decades” noting that “export
volumes have grown modestly, while import volumes have declined by nearly 80% since 2006.
Much of this decline is due to the phasing out of coal and elimination of fresh fruit imports into
Bridgeport, as well as the loss of imports due to the real estate market collapse and the
corresponding loss of demand for lumber, steel and other building materials that would have
passed through Connecticut ports.”
In New York, the vast majority of cargo enters through the Port of New York/New Jersey which
is not located on Long Island Sound. The north shore of Long Island, which fronts Long Island
Sound includes facilities in Port Jefferson, Riverhead, and Orient Point that support water-borne
transportation of cargo and fuel and/or ferry services. Ferries also service Fishers Island and
Plum Island. Various harbors on Long Island, Fishers Island and in Westchester County support
recreational boating.
25.3.2 Socio-Economic Context
According to a report by Pomeroy, et al. (2013), the total output impact of the maritime industry
in Connecticut in 2010 was nearly $7 billion and contributed nearly 40,000 jobs. The report also
cites a study commissioned by the Connecticut Maritime Coalition that found that in 2007,
Connecticut’s maritime-dependent industries, including their suppliers and related economic
activities, were estimated to account for over $5 billion in business output, generating 30,000
jobs; approximately $1.7 billion in household income; and $2.7 billion in Connecticut’s gross
domestic product (GDP) (Pomeroy, Plesha, & Muawanah, 2013).
255
25.3.3 Other Notes
No other notes at this time.
25.4 References
Aquaculture Mapping Atlas. (2017). Retrieved from Aquaculture Mapping Atlas :
https://clear3.uconn.edu/aquaculture/
Connecticut Harbor Management Association. (2018). An Assocation of Local Harbor
Management Commissions, Harbormasters, Interested Companies and Individuals .
Retrieved from Connecticut Harbor Management Association:
http://www.ctharbormanagement.org/
Conneticut Maritime Coalition. (2017). Advocating for Connecticut's Maritime Industry .
Retrieved from Connecticut Maritime Coalition: http://www.ctmaritime.com/
CPA. (2018). Home Page. Retrieved from Connecticut Port Authority:
http://ctportauthority.com/
Moffat & Nichol. (2012). 2012 Connecticut Port Study. Retrieved from OLR Research Report:
https://www.cga.ct.gov/2012/rpt/2012-R-0469.htm
Northeast Ocean Data Portal. (2017). Northeast Ocean Data. Retrieved from
http://www.northeastoceandata.org/data-explorer/?commercial-fishing
Pomeroy, R. S., Plesha, N., & Muawanah, U. (2013). Valuing the Coast: Economic Impacts of
Connecticuts Maritime Industry. Connecticut Sea Grant.
25.5 Appendices
25.5.1 List of Maps Used to Inform the Chapter
Below is a list of all maps used to inform this chapter, including maps presented above in the
narrative and additional maps used to support chapter findings. Maps listed below are organized
by the online data portal on which they are hosted (URL links to data portals are noted in Section
25.4 References above). Map products not accessible by online data portal are also noted below.
Northeast Ocean Data Portal
2013 All Vessel Density
2013 Cargo Vessel Density
2013 Tug-Tow Vessel Density
2013 Tanker Vessel Density
Pilot Boarding Areas
Ports Cargo Volumes
Marinas by County, 2013
Recreational Boating Density
New York Geographic Information Gateway
Shipping Lands and Zones

256
Mid-Atlantic Ocean Data Portal
Maintained Channels
Aquaculture Mapping Atlas
Sewage Treatment Plants
More information on some of the map products presented in this chapter, including URL links to
data and metadata, can be found in the Marine Transportation, Navigation, and Infrastructure
Map Book (CT DEEP, 2017). Not all products showcased in the map book may be addressed in
this chapter or utilized to inform the final Blue Plan.
25.5.2 Notes on Stakeholder Engagement
Emails were sent on December 4, 2017, to various sector representatives including port
authorities, the Connecticut Harbor Management Association, port terminal operators, ferry
operators, shipping companies, marine towing companies, regional planning organizations, US
Department of Transportation and US Army Corps of Engineers. The email communications
briefly introduced the Blue Plan and Inventory and the important role of stakeholder
engagement, distributed the marine transportation map book for review and notified stakeholders
of an upcoming webinar and the opportunity for additional stakeholder engagement as needed.
A follow-up reminder email was sent on December 15, 2017.
A Marine Transportation Sector webinar was held on December 18, 2017. The webinar provided
participants with an overview of the Blue Plan and reviewed map products contained in the
marine transportation and navigation sector map book. During the webinar comments and
questions were received from representatives of the Connecticut Maritime Coalition, New Haven
Port Authority and Bridgeport Port Authority.
The Blue Plan was briefly discussed at a meeting of the Connecticut Port Authority Board of
Directors in Stamford on November 1, 2017. On January 9, 2018, a brief overview of the Blue
Plan was presented at the Connecticut Maritime Coalition Board of Directors meeting and was
followed by several questions and comments by board members.
A meeting with the Connecticut Harbor Management Association Board of Directors was
scheduled for late-December 2017 but was postponed due to schedule conflicts. The meeting
will be rescheduled.

257
Chapter 26. Energy and Telecommunications
Chapter Table of Contents
26.1 Key Data and Map Products .............................................................................................. 257 26.2 Assessment of Data Quality ............................................................................................... 273
26.2.1 Sources of Data and Metadata ................................................................................. 273 26.2.2 Accuracy, Representativeness, and Relevance of Map Products ............................. 273
26.2.3 Data Gaps and Availability of Data to Address Gaps .............................................. 273 26.3 Relevance ........................................................................................................................... 274
26.3.1 Relative Historical Importance ................................................................................. 274 26.3.2 Socio-Economic Context ........................................................................................... 275 26.3.3 Other Notes ............................................................................................................... 277
26.4 References .......................................................................................................................... 279 26.5 Appendices ......................................................................................................................... 282
26.5.1 List of Maps Used to Inform the Chapter ................................................................. 282 26.5.2 Notes on Stakeholder Engagement ........................................................................... 283
26.1 Key Data and Map Products
The lands surrounding Long Island Sound (LIS) are some of the most densely populated areas in
the United States; in fact, it is believed that about 7.5% of the entire U.S. population
(approximately 23.3 million people) live within a 50-mile radius of the Sound (LISS, 2018).
Given that energy and telecommunications demand grows with population size, it is expected
that such demand is significant in the LIS region. Given that energy and telecommunications
demand grows with population size, it is to be expected that such demand would be significant in
the LIS region, not in the least because of the area’s notable history of human development and
resource use.
For Blue Plan purposes, the energy and telecommunication sector is best described by the
existing energy and telecommunications infrastructure and activity in place in and around the
Sound. Such infrastructure and activity falls into five general data categories:
1. Electricity and Telecommunications (including cables)
2. Oil and Gas
3. Nuclear Energy
4. Renewable Energy (including wind, wave, and tidal)
5. Other Mineral Resources (notably sand and gravel)
Each of these categories is explained in more detail below.
Electricity and Telecommunications / Oil and Gas
Spatial data on existing electric, telecommunications, oil, and gas infrastructure in LIS is
available through National Oceanic and Atmospheric Administration (NOAA) Electronic

258
Navigational Charts and various reputable online data sources. Figure 1 illustrates the known
offshore oil terminals, submarine (electric and telecommunications) cables, submarine (gas)
pipelines, and cable and pipeline areas in Long Island Sound. The difference in nomenclature
between “submarine cable’ and “cable area” (and, for that matter, “submarine pipeline” and
“pipeline area”) is simply one of classification distinction by NOAA for its navigational charts,
in which navigators are to expect that cables and pipelines can be found anywhere in their
respective named areas.
Major infrastructure in Long Island Sound includes the following.
Two offshore terminals, from west to east:
National Grid Northport Terminal
United Riverhead Terminal
Two gas pipelines, from west to east:
Eastchester Extension
Long Island Sound crossing of the Iroquois Gas Pipeline
Two submarine cables, one west-east-oriented and the other north-south-oriented:
Fiber-optic Link Around the Globe (FLAG) Atlantic-1 (telecommunications cable)
Cross-Sound Cable (electric and telecommunications cable)
Four cable areas, each of which contain a cable or group of cables, from west to east:
Y49 Cable (also known as the Sprain Brook-East Garden City Cable)
1385 Cable (also known as the Northport-Norwalk Harbor Cable)
AT&T Cable
MCI/Verizon Cable
A NOAA-designated pipeline area just west of the Y49 Cable is the Y50 Cable (also known as
the Dunwoodie-Shore Road Cable); the Y50 Cable is indeed an electric cable line; however,
because it is encased in a steel pipe, NOAA considers the cable to be within a pipeline area.
Finally, there are various, minor cable areas around the eastern entrance of the Sound (i.e.,
around Fishers Island, Great Gull Island, and Plum Island) and as well as those protruding into
the Sound, primarily from mainland Connecticut.
It should be noted that some of the infrastructure named above is solely in New York waters.
Such infrastructure includes both offshore terminals, the FLAG Atlantic-1 telecommunications
cable, the Eastchester Extension pipeline, the Y49 Cable, the Y50 Cable, and some of the minor
cables on the eastern end of the Sound. State water boundaries are included in Figure 1 to
illustrate this spatially.
Information about all the major infrastructure named above – as well as information about some
of the minor cable areas – are described in more detail in Tables 1-4 below. It is necessary to
mention that the minor cable areas mentioned in Tables 1-3 should not be considered a
comprehensive list of all the minor cable areas depicted in Figure 1. In fact, information about

259
many of these minor cable areas is either outdated or non-existent. However, for Blue Plan
purposes, specific data about these cable areas is not as important as the location of the cable
areas, which is fully captured in Figure 1. It is possible that many of these minor cable areas
currently or previously served as electric sources for inhabited islands and lighthouses in the
Sound. To illustrate this possibility, Figure 2 depicts the cable areas from Figure 1 (along with
pipeline areas, to account for the Y50 Cable), overlaid on a spatial data layer of shore-adjacent
lighthouses and named, in-Sound lighthouses and beacons that either closely border, overlap
with, or cap-end known cable lines or cable areas (Cherau, et al., 2010; NOAA, 2018; Northeast
Ocean Data Portal, 2017).
Figure 1. Major energy and telecommunications infrastructure in Long Island Sound. This map
is a combination of spatial information from a variety of different sources, including NOAA
Electronic Navigation Charts (ENCs) and the Northeast Ocean Data Portal (Northeast Ocean
Data Portal, 2017; NOAA, 2018).
Figure 2. Major cable infrastructure and lighthouses in Long Island Sound. Pipeline areas were
included in this map graphic, due to the Y50 cable being designed as a Pipeline Area in the
NOAA ENC. This map is a combination of spatial information from a variety of different
sources, including NOAA Electronic Navigation Charts and the Northeast Ocean Data Portal

260
(Northeast Ocean Data Portal, 2017; NOAA, 2018).
All cables and pipelines depicted in Figure 1, either individually demarcated or lying within a
cable and/or pipeline area, connect to an onshore facility (e.g., electric generation plant, fuel
terminal or storage tank, electrical substation) and/or an existing on-land network (e.g., electric
grid, pipeline system). Map products of this on-land infrastructure can be found in the Energy &
Telecommunications Map Book (CT DEEP, 2017).
Although not depicted on Figure 1, there are numerous onshore energy terminals and storage
facilities (mostly petroleum-based) that have nearshore docks, wharfs, or other berth areas for
ships to load or unload raw or processed commodities. Based on the best available data, Table 5
provides a list of known terminals and storage facilities with shipping berths (along with a
known anchorage area in Bridgeport Harbor for ships that hold petroleum products). Table 5
also includes a list of known terminals and storage facilities in which the presence of a shipping
berth is thought to exist but is unconfirmed.

261
Table 1. Summary information of offshore terminal infrastructure in LIS, from west to east
Name Location Technical Specs Additional Notes Ownership Citations National Grid
Northport
Terminal
Platform
Offshore
(two miles
north of
Fort
Salonga,
NY)
Offshore petroleum terminal; consists of an
unloading platform, two mooring platforms
(each approx. 50’ x 50’), and mooring
buoys; stands 17’ above water surface; max
draft 45’
Completed in and operating since 1967;
connected to onshore terminal in Fort Salonga,
NY (just north of Northport) via submarine
pipelines; the Iroquois gas pipeline and its
associated Eastchester extension crosses onto
Long Island at Northport
National Grid
USA (formerly
owned by Long
Island Lighting
Company
[LILCO] and
KeySpan)
1
2
3
4
5
United
Riverhead
Terminal
Platform
Offshore
(one mile
north of
Riverhead,
NY)
Offshore petroleum terminal; consists of a
center platform (approx. 100’ x 45’) with
berths on either side (2 berths total); overall
platform footprint of approx. 250’ x 100’;
stands 24’ above mean low water (MLW);
max length 1150’ (designed for very large
crude carriers [VLCC] and Suezmax
tankers), Max draft 64’
Originally constructed in 1956 with further
construction in 1974; connected to onshore
terminal in Riverhead, NY, via two 24”
submarine pipelines
United
Riverhead
Terminal, Inc.
(affiliate of
United Refining
Company Inc.;
formerly owned
by
ConocoPhillips
and Northville
Industries,
Tosco, Phillips
Petroleum,
ConocoPhillips,
and Phillips 66)
1
2
3
4
5
6
Table 2. Summary information of major pipeline infrastructure in LIS, from west to east
Name Location Technical Specs Additional Notes Ownership Citations Eastchester
Extension
Pipeline
National
Grid’s
Northport
Station,
Northport,
NY, to
ConEdison’s
Hunts Point
Liquefied natural gas (LNG) pipeline; 30.3
miles of 24” pipeline (27.4 miles of which
are buried); pipeline trenches were dug
using a combination of horizontal
directional drilling (shallow nearshore
waters only) and plowing; mechanical
backfilling of excavated material was
attempted without much success within 1
year, total seafloor impacts was between
Completed in 2004; construction inadvertently
damaged Y49 cable but was later repaired;
Iroquois Gas Transmission System states that
the project allowed the delivery of an
additional 230 MMcf/day of LNG to the NYC
metropolitan area (with the ability to expand
upwards of 750 MMcf/day).
Iroquois Gas
Transmission
System LP
(partnership of
TC PipeLines
Intermediate
LP,
TransCanada
Iroquois Ltd,
1
2
3
4
5
6
7

262
Name Location Technical Specs Additional Notes Ownership Citations Station, The
Bronx, NY
7,800-14,600 acres (depending on extent
of use of mid-line buoys)
Dominion
Iroquois Inc,
and Iroquois
GP Holding
Company LLC)
Iroquois
Pipeline,
Long Island
Sound
crossing
GenConn’s
Devon B
Station,
Milford, CT,
to National
Grid’s
Northport
Station,
Northport,
NY
Liquefied natural gas (LNG) pipeline;
approx. 26 miles of 24” pipeline; pipeline
trenches were dug using a combination of
methods (based on water depth): dredging
(shallow nearshore waters only), plowing,
and excavation; pipeline was partially
buried: (a) Non-buried portions were
largely placed on silt and sand-silt areas
with expected partial burial due to natural
sediment movement, (b) Pipeline areas
near oyster beds and oyster harvesting
areas were buried with a min. of 3’ cover,
(c) Landfall areas were buried with 5-15’
of cover (some with concrete coating),
depending on historical erosion patterns
and topography; assuming a 75-ft
construction right-of-way, total seafloor
impact was approx. 243 acres
Completed in 1991; pipeline crossing is part
of a larger 416-mile interstate pipeline system
connecting to various other pipeline systems
including the TransCanada Pipeline at the
northern terminus in Waddington, NY; the
southernmost termini are National Grid’s
South Commack Station in Commack, NY,
and ConEdison’s Hunts Point Station in The
Bronx, NY via the Eastchester Extension
Pipeline (see below); the entire system
transports more than 1 Bcf/day of LNG from
Canada into the U.S. and started operating
commercially in 1992
Iroquois Gas
Transmission
System LP
(partnership of
TC PipeLines
Intermediate
LP,
TransCanada
Iroquois Ltd,
Dominion
Iroquois Inc,
and Iroquois
GP Holding
Company LLC)
1
2
3
4
5
6
7
Table 3. Summary information of major electric and telecommunications cable infrastructure in LIS, from west to east
Name Location Technical Specs Additional Notes Ownership Citations Y49 Cable
(Sprain Brook-
East Garden
City Cable)
ConEdison’s Sprain
Brook Substation,
Yonkers, NY, to
Long Island Power
Authority’s (LIPA)
East Garden City
Substation, East
Garden City, NY
Submarine electric cables; 26.6
miles long in total, 7.9 miles of
which cross LIS; four self-
contained, high-pressure fluid-
filled cables buried in the seabed
(three energized phase cables and
a de-energized spare) along with
two fiber optic cables; 345 kV;
637 MW; cable placement
utilized underwater jet plow;
cables laid approx. 10’ into sea
Construction began in 1989 and was
completed in 1991; when constructed, the
Y49 was considered the final link in New
York Power Authority’s (NYPA) high
voltage transmission network installed to
provide lower-cost electricity from
Canada/upstate NY to NYC and Long Island,
NYPA leases a section of the Sprain Brook
Substation; National Grid (formerly KeySpan
Electric Services) maintains the East Garden
City Substation as an agent of LIPA; cable
NYPA (cable
used by LIPA
under contract
with NYPA)
1
2
3
4
5
6
7
8
9
10
11

263
Name Location Technical Specs Additional Notes Ownership Citations bottom and backfilled 4’, pipe-
type cable used for land portions
of the cable route
system experienced anchor strikes in 2004
and 2014 but were repaired
12
13
Y50 Cable
(Dunwoodie-
Shore Road
Cable)
ConEdison’s
Dunwoodie North
Substation, to Long
Island Power
Authority’s (LIPA)
Glenwood Landing
Station, Glenwood
Landing, NY, via
both LIS and
Hempstead Harbor
Submarine electric cables;
approx. 18 miles long; 12.75”
pipe-type cable circuit (i.e.,
housed in steel and concrete
piping) coated in concrete;
dielectric fluid circulated to cool
conductors and insulate
electricity; 345 kV; 653 MW;
cable placement utilized dredges
(clam shell, drag line, or suction)
to dig 5’ trenches in LIS and 10’
trenches in Hempstead Harbor;
indeterminate backfill was used
to fill trenches after pipe-laying
Construction began between 1976-1977,
operations began in 1978; in-Sound cable
failure in May 2002 possibly due to thermo-
mechanical bending; cable was subsequently
repaired and temporarily de-rated from 600
MW to 400 MW temporarily to minimize
thermal bending
Jointly by
ConEdison and
LIPA
1
2
3
4
5
6
7
8
9
10
11
1385 Cable
(Northport-
Norwalk
Harbor Cable)
Eversource’s
Norwalk Harbor 6J
Substation,
Norwalk, CT, to
Long Island Power
Authority’s
Northport 6F
Substation,
Northport, NY
Submarine electric cables;
approx. 11 miles long; originally
consisted of seven 3” dielectric
fluid-filled cables; cable
placement of original cables two
methods: (1) In nearshore waters,
dredged (conventional and
hydraulic) trench with concrete,
rock, and other backfill, (2) In
deeper water, laid directly on
seafloor and later filled (though
not completely); from 2007-2008,
all seven cables were replaced
with three, 9”, 138 kV alternating
current (AC)s cables, which carry
up to 300 MW of electricity;
operating voltage is 1the new
cables were completely buried
under the seabed (avg. 6’) using
an underwater jet plow system
Original cables placed in 1969; original
cables were damaged on at least 55 occasions
by fishing vessels, barges, and anchors,
resulting in leaks of dielectric fluid;
construction of new cables from 2007-2008
was seen as more environmentally conscious,
less vulnerable to ship traffic, and less
burdensome for repairs (which usually
required the use of underwater divers and
barge cranes)
Eversource
(formerly
Connecticut
Light & Power)
and Long Island
Power Authority
(LIPA)
1
2
3
4
5
6
7
8
9
FLAGAtlantic-
1, North Cable
Dual fiber, trans-
Atlantic submarine
Submarine telecommunications
cable; 100 Gbps dual fiber loop;
Completed in 2001; joint venture between
FLAG Atlantic Holdings Ltd and GTS
Global Cloud
Xchange
1
2

264
Name Location Technical Specs Additional Notes Ownership Citations cable between
London, Paris, and
New York with
onward connectivity
to Washington DC
and Frankfurt; only
the North Cable
enters LIS via The
Race and connects
at Northport, NY;
sits entirely in NY
waters; South Cable
does not enter LIS
collective length of both North
and South Cables approx. 7500
miles; the North Cable’s run in
LIS is approx. 93 miles
TransAtlantic Holdings Ltd; constructed by
Alcatel Submarine Networks
(subsidiary of
Reliance
Communications
Ltd, formerly
owned by FLAG
Atlantic
Holdings Ltd and
GTS
TransAtlantic
Holdings Ltd)
3
4
5
Cross-Sound
Cable
Halvarsson
Converter Station
(connected to the
United Illuminating
electric grid), New
Haven, CT, to
Tomson Converter
Station (connected
to the Long Island
Power Authority
electric grid),
Shoreham, NY
Electric and telecommunications
(fiber-optic) cables; approx. 24
miles long; cable placement
utilized horizontal directional
drilling (shallow nearshore waters
only) and remotely operated jet
sled; two high-voltage direct
current (HVDC) power cables
and one 192-fiber fiber optic
cable bundled together; 4.1”
diameter; contains no insulating
or cooling fluid; 330 MW ± 150
kV HVDC with max current of
1175 A; AC voltage conversion
on both ends of the cable (345 kV
in New Haven, 138 kV in
Shoreham); cable buried approx.
3-6’ under the seabed
Completed in 2002 with operations
beginning in 2003; connects New England
and Long Island power grids with
transmission capacity contracted to the Long
Island Power Authority (LIPA) through
2032; also designed to promote competition
in New England and NY by enabling
electricity trading; some sections of the cable
were not installed to the required burial
depth; six months after installation, some
bottom topographic scars remained (2-8’
wide, 0.5-2’ deep)
Cross-Sound
Cable Company
LLC (subsidiary
of Argo
Infrastructure
Partners,
formerly owned
by Brookfield
Asset
Management Inc,
Babcock &
Brown
Infrastructure,
and the joint
ownership of
TransEnergie
HQ Inc and UIL
Holdings Corp)
1
2
3
4
5
6
7
8
9
10
11
AT&T Cable East Haven, CT to
Miller Place, NY
Submarine telecommunications
cable; approx. 22 miles long;
cable placement utilized
horizontal directional drilling (up
to 3500’ waterward of high tide
line) to approx. 8-50’ below the
sediment surface and jet plowing
to approx. 10’ below the sediment
Completed in 1993 AT&T Corp 1
2
3
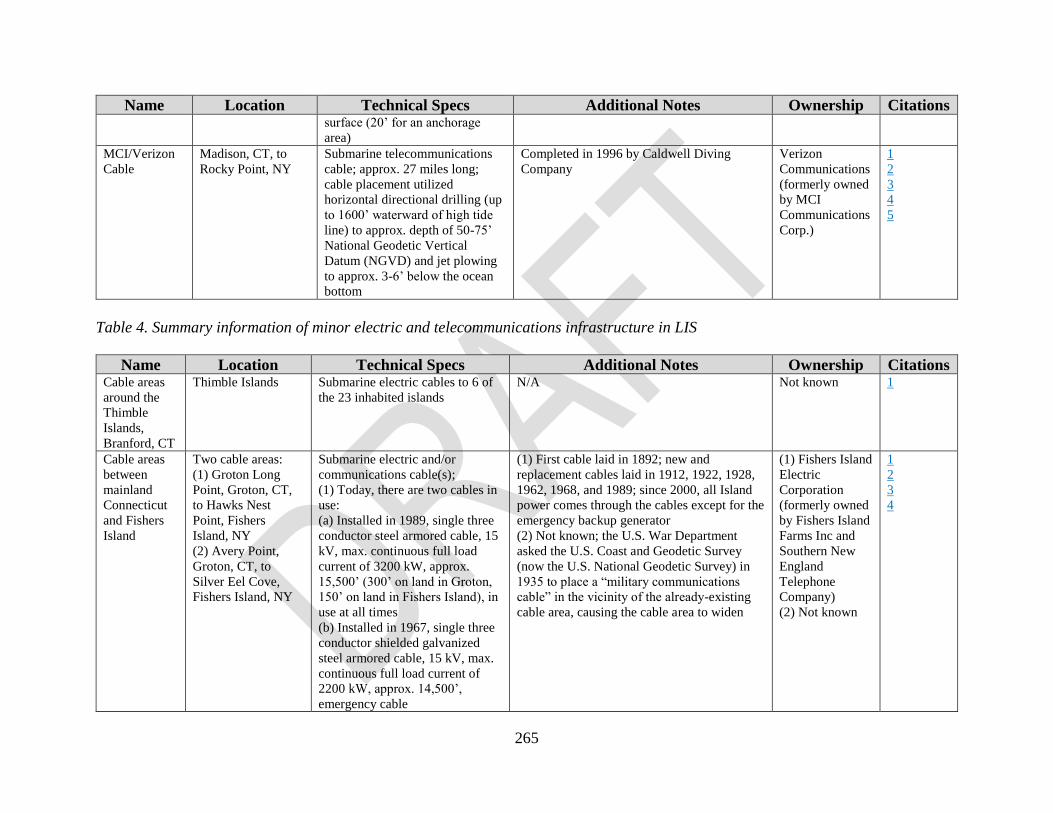
265
Name Location Technical Specs Additional Notes Ownership Citations surface (20’ for an anchorage
area)
MCI/Verizon
Cable
Madison, CT, to
Rocky Point, NY
Submarine telecommunications
cable; approx. 27 miles long;
cable placement utilized
horizontal directional drilling (up
to 1600’ waterward of high tide
line) to approx. depth of 50-75’
National Geodetic Vertical
Datum (NGVD) and jet plowing
to approx. 3-6’ below the ocean
bottom
Completed in 1996 by Caldwell Diving
Company
Verizon
Communications
(formerly owned
by MCI
Communications
Corp.)
1
2
3
4
5
Table 4. Summary information of minor electric and telecommunications infrastructure in LIS
Name Location Technical Specs Additional Notes Ownership Citations Cable areas
around the
Thimble
Islands,
Branford, CT
Thimble Islands Submarine electric cables to 6 of
the 23 inhabited islands
N/A Not known 1
Cable areas
between
mainland
Connecticut
and Fishers
Island
Two cable areas:
(1) Groton Long
Point, Groton, CT,
to Hawks Nest
Point, Fishers
Island, NY
(2) Avery Point,
Groton, CT, to
Silver Eel Cove,
Fishers Island, NY
Submarine electric and/or
communications cable(s);
(1) Today, there are two cables in
use:
(a) Installed in 1989, single three
conductor steel armored cable, 15
kV, max. continuous full load
current of 3200 kW, approx.
15,500’ (300’ on land in Groton,
150’ on land in Fishers Island), in
use at all times
(b) Installed in 1967, single three
conductor shielded galvanized
steel armored cable, 15 kV, max.
continuous full load current of
2200 kW, approx. 14,500’,
emergency cable
(1) First cable laid in 1892; new and
replacement cables laid in 1912, 1922, 1928,
1962, 1968, and 1989; since 2000, all Island
power comes through the cables except for the
emergency backup generator
(2) Not known; the U.S. War Department
asked the U.S. Coast and Geodetic Survey
(now the U.S. National Geodetic Survey) in
1935 to place a “military communications
cable” in the vicinity of the already-existing
cable area, causing the cable area to widen
(1) Fishers Island
Electric
Corporation
(formerly owned
by Fishers Island
Farms Inc and
Southern New
England
Telephone
Company)
(2) Not known
1
2
3
4

266
(2) Not known, possibly inactive
Cable area
south of
Fishers Island
Cable area south of
Fishers Island
Cable area used to contain
hydrophones, cables, and related
infrastructure; these were all later
removed
Cable area was used for hydrophone testing
during World War II
Presumably, the
former
infrastructure
belonged to the
U.S. War
Department /
Department of
Defense
1
Cable area
between
Fishers Island
and Race
Rock
Cable area between
Silver Eel Cove,
Fishers Island, NY,
to Race Rock (off
southwestern tip of
Fishers Island)
Potential submarine electric
and/or communications cables
(unconfirmed)
In 1957, the USACE requested that the U.S.
Coast and Geodetic Survey (now the U.S.
National Geodetic Survey) to add this cable
area; may contain utility cable that power the
lighthouse
Not known 1
Cable areas
between
Fishers Island
and Great
Gull Island
Two cable areas
connecting Fishers
Island to Great Gull
Island
Submarine electric and/or
communications cable(s):
(1) Northern cable area: Contains
inactive cable
(2) Southern cable area: Not
known, cables may have been
removed or are no longer active
(1) Cable area added by NOAA after request
by War Department to the Secretary of
Commerce in 1940; contained a cable
between Fort Wright on Fishers Island and
Fort Michie on Great Gull Island; neither fort
is active nor is seemingly the cable
(2) Not known
According to a 1915 issue in the now-defunct
trade journal Electric World, the Atlantic
Insulated Wire & Cable Company had
previously constructed a 35,000’ cable across
The Race, which was said at the time to be the
large cable the U.S. government owned on the
Atlantic coast
(1) Not known
(2) Not known
1
2
Cable area
between
Great Gull
Island and
Little Gull
Island
Cable area
connecting Great
Gull Island to Little
Gull Island
Potential submarine electric
and/or communications cables
(unconfirmed); no active power
cable or utility lines to Little Gull
Island
U.S. Coast Guard maintains an active
lighthouse on Little Gull Island powered by
solar panels; cable area may contain utility
cables that previously powered the lighthouse
Not known 1
Cable area
between
Orient Point,
Cable area between
Orient Point, NY,
and Plum Island
Submarine electric cables; single
13.2 kV aerial line serves two
underwater electric cables from a
transfer station on Orient Point;
Cables supply electrical power particularly for
the Plum Island Animal Disease Center, the
only major facility on Plum Island
LIPA 1

267
NY, and
Plum Island
historical peak demand on the
electrical service is 2.3 mW (each
cable is capable of supplying 2.3
mW load at a voltage drop of the
2.5 mile conductor length); only
one line is used at any given time
(current distribution isolation
switches are arrayed to operate
Plum Island facilities on one
cable)
Table 5. Known petroleum ship anchorage area and onshore energy terminals with confirmed and unconfirmed nearshore berthing
areas
Name Location Technical Specs Ownership Citations Anchorage area in
Bridgeport Harbor
Bridgeport,
CT
Anchorage for petroleum ships City of Bridgeport 1
Sprague Terminal,
Stamford
Stamford,
CT
Petroleum terminal; max length 300’, max draft 15.5’ Sprague Energy 1
Inland Fuel Terminals,
Bridgeport
Terminal
Bridgeport,
CT
Petroleum terminal Inland Fuel Terminals,
Inc. (subsidiary of
Santa Energy)
1
2
3
Harborview Terminal Bridgeport,
CT
Petroleum terminal Harborview Terminals,
Inc.
1
2
Sprague Terminal,
Bridgeport
Bridgeport,
CT
Petroleum and asphalt terminal; max length 650’, max beam 105’, max draft
32’, vessels with draft over 27’5” must transit channel on high water due to
shoal in channel
Sprague Energy /
Global Partners LP
(formerly owned by
Consumers
Connecticut Petroleum
Wholesalers)
1
2
3
4
5
6
Motiva Enterprises,
Bridgeport Terminal
Bridgeport,
CT
Petroleum terminal Motiva Enterprises /
Global Partners LP
1
2
3
Public Service
Enterprise Group
(PSEG) Bridgeport
Power Station
Bridgeport,
CT
Petroleum and coal terminal; max length 848’, max beam 137.3’, max draft
34’, vessels with draft over 27’5” must transit channel on high water due to
shoal in channel
PSEG Power
Connecticut LLC
1
2
3
4
O&G Industries, Main
Wharf
Bridgeport,
CT
Sand and stone terminal O&G Industries 1
2

268
Name Location Technical Specs Ownership Citations 3
O&G Industries,
Seaview Avenue
Wharf
Bridgeport,
CT
Sand and stone terminal O&G Industries 1
2
3
Gateway Terminal New
Haven, CT
Petroleum, biofuel, asphalt, and road salt terminal; seven berths (four for ships
[dry and liquid commodities] and three for barges [dry commodities only]):
(1) Main Pier, North Berth (ships) – Max length 650’, max beam 100’, max
draft 28’
(2) Main Pier, South Berth (ships) – Max length 735’, max beam 110’, max
draft 36’
(3) Wharf #1 (ships) – Max length 650’, max beam 105’, max draft 36’,
channel draft 35’
(4) Finger pier (ships) – 650’ long
(5) Dock #1 (barges) – 300’ long
(6) Dock #2 (barges) – 300’ long
(7) Wharf #2 (barges) – 225’ long
Gateway Terminal 1
2
3
Gulf Oil New Haven
Terminal Wharf
New
Haven, CT
Petroleum, biofuel, and asphalt terminal; max length 650’, max beam 110’,
max draft 38’
Gulf Oil LP 1
2
3
Magellan Terminal,
East Street
New
Haven, CT
Petroleum, biofuel, and asphalt terminal; max length 700’, max width 110’,
max beam 106’, max draft 36’
Magellan Midstream
Partners LP / Global
Partners LP
1
2
3
4
5
6
Magellan Terminal,
Waterfront Street
New
Haven, CT
Petroleum and biofuel terminal; max length 750’, max beam 105’, max draft
35’
Magellan Midstream
Partners LP / Global
Partners LP
1
2
3
4
5
6
Motiva New Haven
Terminal
New
Haven, CT
Petroleum terminal; max length 738’, max beam 107’, max draft 37’ Motiva Enterprises
LLC (subsidiary of
Saudi Aramco) /
Global Partners LP
1
2
3
4
5
New Haven Terminal New
Haven, CT
Petroleum terminal; finger pier and marginal wharf; finger pier can
accommodate 2 ships, 2 barges, or 1 ship + 1 barge concurrently:
New Haven Terminal,
Inc.
1
2
3

269
Name Location Technical Specs Ownership Citations (1) Finger Pier, South Side (primary berth) – Max length 600’, max beam
105’, max draft 36’
(2) Finger Pier, North Side – Max length 600’, max draft 35’
(3) Marginal Wharf – Approx. 650’ long (dry commodities only)
4
PSEG New Haven
Station Pier
New
Haven, CT
Petroleum terminal; max length 400’, max draft 25’ PSEG Power
Connecticut LLC
1
2
3
Buckeye Terminal Groton, CT Petroleum terminal; max length 900’, max draft 34’ Buckeye Partners LP
(formerly owned by
Hess Corp.)
1
2
Northville Port
Jefferson
Facility
Port
Jefferson,
NY
Petroleum terminal; two berths:
(1) Tanker Berth – Max length 700’, max beam 106’, max draft 35’, vessels
enter through channel of only 26’
(2) North Berth – Max length 350’, max beam 75’, max draft 20’
Northville Industries
(subsidiary or NIC
Holding Corp.)
1
2
Port Jefferson Power
Station
Port
Jefferson,
NY
Petroleum terminal National Grid USA
(formerly owned by
LILCO)
1
2
Plum Island Animal
Disease Center Fuel
Storage and
Distribution System
Plum
Island, NY
Petroleum terminal U.S. Department of
Homeland Security
1
Hi-Ho Petroleum Bulk
Terminal*
Bridgeport,
CT
Petroleum terminal Hi-Ho Petroleum
(subsidiary of
D’Addario Industries)
Magellan Terminal,
Forbes Avenue*
New
Haven, CT
Petroleum and biofuel terminal; max length 200’, max draft 16’ Magellan Midstream
Partners LP / Global
Partners LP
American Green
Fuels*
New
Haven, CT
Biofuel terminal American GreenFuels
LLC (subsidiary of
Kolmar Americas Inc.)
Clean Harbors* New
Haven, CT
Petroleum terminal; max length 300’, max draft 15’ Clean Harbors
(formerly owned by
R&H Terminal LLC)
* Onshore terminals in which the presence of a shipping berth is thought to exist but is unconfirmed.
270
Nuclear
Apart from the U.S. Navy’s use of nuclear-powered subs in the eastern portion of the Sound, the
only area of significant nuclear activity exists within the Dominion Energy Millstone Power
Station site, situated on the peninsula just east of Niantic Bay in Waterford, CT (Weigold &
Pillsbury, 2014). Made up of three units, it is the only multi-unit nuclear plant in New England.
Millstone utilizes an outfall pond just south of the plant’s premises, which flows into Long Island
Sound at the base of the peninsula between Millstone Point and Fox Island.
Publicly available spatial data, as it relates to the Millstone Power Station and LIS, pertains to
the waters surrounding the plant, which falls within two U.S. Coast Guard regulated zones: the
Long Island Sound Marine Inspection and Captain of the Port Zone (see 33 CFR § 3.05-35 and
33 CFR § 165.153) and the Dominion Millstone Nuclear Power Plant security zone (see 33 CFR
§ 165.154) (Navigation and Navigable Waters, 33 CFR, 2017). Such spatial data is not included
in this Inventory chapter but is fully captured by NOAA ENCs (NOAA, 2018).
Renewable Energy
The National Renewable Energy Laboratory (NREL) mapped out offshore wind speeds in Long
Island Sound (Figure 3). Recent studies have shown that average wind speeds need to exceed 6-
8 m/s in order for even small wind turbines to be economically viable in a certain location (ANL,
2017; Level, 2017). Figure 3 shows that at a 90 m height (a height often used to measure wind
speeds for wind turbines), predicted mean annual wind speeds in the Sound range from 6-8.25
m/s with the greatest mean annual wind speeds concentrated in the center of the Sound between
Bridgeport, CT, and Port Jefferson, NY. Additional offshore wind map products can be found in
the Energy & Telecommunications Map Book (CT DEEP, 2017).
NREL also generated maps that would help to assess wave energy potential for LIS using three
variables: Energy period, power density, significant wave height, and water depth. For nearly all
of LIS across all variables, the calculated values were minimal. These wave energy map
products can be found in the Energy & Telecommunications Map Book (CT DEEP, 2017).
Furthermore, NREL generated maps that would help to assess tidal energy potential for LIS
using two variables: mean current and mean power density (Figure 4). Mean current and mean
power density were of greater magnitude on the eastern end of the Sound, with greatest values
being found in The Race. Moreover, a 2007 study by environmental consulting firm E3, Inc.
considered 483 potential tidal energy sites off the shores of Long Island, Rhode Island, and New
Jersey; 20 priority sites were determined, many of which fell in areas that NREL data noted to be
of higher mean current and high mean power density, particularly in The Race (Figure 5).
Other Mineral Resources
Long Island Sound has played host to a number of sand harvesting sites over the last few
decades. Exact locations of these sites are recorded in permit files at the Connecticut
Department of Energy and Environmental Protection (CT DEEP) and the U.S. Army Corps of
Engineers (USACE). However, conversations with CT DEEP officials in January 2018 indicated

271
that past sand harvesting sites do not merit being designated as future harvesting sites for marine
spatial planning purposes. An additional map product of potential onshore mineral resource
areas can be found in the Energy & Telecommunications Map Book (CT DEEP, 2017).
Figure 3. Predicted mean annual wind speeds at 90-m height at a resolution of 200 m. According
to NREL, areas with annual average wind speeds of 7 m/s and greater at 90-m height are
generally considered to have a wind resource suitable for offshore development (NREL, 2012).

272
(a)
(b)
Figure 4. Maps of tidal energy potential in LIS. (a) Mean current potential (m/s), and (b) Mean
power density (W/m2). Access available via NY Geographic Information Gateway (NY
Geographic Information Gateway, 2017).
Figure 5. Potential tidal energy sites in LIS. Access available via Long Island Tidal and Wave
Energy Study (E3, Inc., 2007).

273
26.2 Assessment of Data Quality
26.2.1 Sources of Data and Metadata
Spatial data derives from the Northeast Ocean Data Portal, NOAA ENCs, Argonne National
Laboratory Energy Zones Mapping Tool, NY Geographic Information Gateway, Mid-Atlantic
Ocean Data Portal (MARCO, 2017), National Renewable Energy Laboratory, and Long Island
Power Authority. Metadata can be found on the corresponding data portals and in the
corresponding reports from which the spatial data products were taken. More information on the
Sources of Data and Metadata can be found in the Energy & Telecommunications Map Book
(CT DEEP, 2017).
26.2.2 Accuracy, Representativeness, and Relevance of Map Products
The spatial data included in this chapter and in the Energy & Telecommunications Map Book, at
the time of collection, was considered to be the most accurate and representative spatial data
available, notably because all the data was collected from either official government websites or
from map portals specifically aimed at providing data to be used for planning purposes. All this
spatial data was provided to sector stakeholders before and during a December 2017 webinar
(CT DEEP, 2017). See Section 26.5.2 Notes on Stakeholder Engagement for more information
on stakeholder outreach practices for this sector.
None of the stakeholders engaged contended the accuracy, representative, and relevance of the
map products displayed. This could well be because the existing energy and telecommunications
infrastructure in the Sound is fairly well known. Energy or telecommunications infrastructure
projects in the Sound, after all, become fairly prominent public knowledge even at the earliest of
proposal stages, often because of their controversial nature.
Stakeholders did, however, mention that more information about individual in-Sound cables and
pipelines – such as when they were constructed, how deep they are buried, and who owns them –
would augment the existing spatial data to provide a more representative picture of the energy
and telecommunications sector for marine spatial planning purposes.
26.2.3 Data Gaps and Availability of Data to Address Gaps
As mentioned above, none of the stakeholders engaged noted any prominent spatial data gaps.
However, stakeholders did mention the lack of more detailed information that would help to
place the spatial data in context. As such, the Blue Plan team considered this lack of contextual
information to be a data gap.
Subsequent to webinar, the Blue Plan team collected much of the stakeholder-requested
contextual information and consolidated it into Tables 1-5. The information provided in these
tables are not necessarily complete, particularly the list of onshore terminals with nearshore
berthing sites. As such, these tables would benefit from further stakeholder review to determine
274
if the information provided is sufficiently accurate, representative, and relevant in its
supplemental nature to the spatial data products.
Finally, while not an explicit data gap, a utility company stakeholder felt it was important, going
forward, to create a streamlined process for documenting and providing as-built drawings of
historic and new energy and telecommunications infrastructure to the Blue Plan. This comment
anticipates the need for proactively ensuring that the data being used for marine spatial planning
purposes does not fall out of the realm of accurate, relevant, or representative.
26.3 Relevance
26.3.1 Relative Historical Importance
Much of the early intensive energy use in the LIS region was that related to activities on and
around the Sound (e.g., industrial urban development, fire-powered steam boats, cars, railroads)
(Weigold M. E., The Long Island Sound: A History of Its People, Places, and Environment,
2004; Weigold & Pillsbury, 2014). As noted in Table 3, utilization of the Sound itself began late
in the 19th century, with the placement of cables in The Race and around Fishers Island, though
most of the major infrastructure in the Sound today did not exist prior to the mid-to-late 20th
century.
Yet, even beyond the usage of the Sound’s submerged lands as a substrate for energy transfer,
the waters of Sound have also historically been utilized as a resource for energy development.
Power plants (whether fossil fuel- or nuclear-based) require large amounts of water for cooling
purposes, so it is not surprising that many such plants, both former and current, are strategically
placed along the LIS shoreline (CT DEEP, 2017; Weigold & Pillsbury, 2014). Dominion’s
Millstone Nuclear Power Station – which, today, utilizes about 2 billion gallons of water daily to
cool its reactors – was built in 1966, around the time when nuclear power was seen as the
solution to the region’s growing energy needs (Hladky G. B., 2015; Miller, 2014; Weigold M. E.,
The Long Island Sound: A History of Its People, Places, and Environment, 2004; Weigold &
Pillsbury, 2014). In fact, around and since the time of the Millstone Power Station’s opening, a
handful of nuclear plants were proposed (but failed to be built) along the Sound’s shorelines,
notably a plant in Lloyd Harbor, NY, in the 1960s, and a four-reactor plant on David’s Island,
NY, in the 1970s (Weigold & Pillsbury, 2014). A nuclear plant in Shoreham, NY, first proposed
in 1966 (and constructed beginning in 1973), was completed but never officially opened, due to
concerns over infeasible emergency evacuation plans (Weigold M. E., The Long Island Sound: A
History of Its People, Places, and Environment, 2004; Weigold & Pillsbury, 2014).
Yet, as populations in Connecticut and Long Island continued to grow – along with energy
demand – utility companies were on the lookout for ways to ensure adequate energy supply,
emergency backup supply, or simply lower cost energy for local residents. For example, with
the official closure of the Shoreham Power Plant in 1994, the Long Island Power Authority
(LIPA), throughout the late 1990s and early 2000s, built several small conventional power
plants, and worked with TransEnergie Hydro Quebec to install the Cross-Sound Cable in 2002 as

275
a back-up energy supply to Long Island (Fairley, 2005; Weigold M. E., The Long Island Sound:
A History of Its People, Places, and Environment, 2004; Weigold & Pillsbury, 2014).
Presumably, it also because of these reasons that other energy and telecommunications
infrastructure was developed and placed in the Sound throughout the 20th and 21st centuries. It is
feasible to imagine, for instance, that as demand for faster telecommunications connections and
worldwide reach grew in the densely populated LIS region, fiber optic and other modern
infrastructure became attractive considerations for submarine development.
Still, not all energy development projects have been as successful. The proposed, 22-mile
Islander East liquefied natural gas pipeline (designed to transport natural gas between Branford,
CT, and Wading River, NY) failed to secure the necessary permits from Connecticut and New
York, and the project was abandoned in February 2009 (CT DEEP, 2006b; Doan, 2009;
Zaretsky, 2009). Moreover, the proposed Broadwater offshore terminal and pipeline route
(which would have connected to the Iroquois Gas Transmission System pipeline mid-Sound)
failed to receive the required permits from the U.S. Commerce Department and the State of New
York, causing the Broadwater project team to stop pursuing the project in March 2012 (Benson,
2012; FERC, 2008; Weigold & Pillsbury, 2014). Notable public opposition accompanied these
project proposals, and may have been a contributing factor to these infrastructure projects not
being successful. Section 26.3.2 Socio-Economic Context provides further context on the oft-
controversial nature of energy infrastructure projects in the Sound.
26.3.2 Socio-Economic Context
If history is any indication, proposals for new energy or telecommunications infrastructure in the
Sound are bound to be controversial. As developers pursue the necessary permits to start
construction, proposals are reviewed, commented upon, and/or evaluated by various regulatory
and advisory agencies, programs, committees, tribal nations, and the general public, often over a
period of years.
The reason for such great attention to these proposals is the fact that energy and
telecommunications infrastructure in the Sound may often seem incompatible with other
resources, be they natural (e.g., benthic habitat) or cultural (e.g., archaeologically-sensitive
submerged lands), as well as with other human uses (shellfish harvesting, visual resources,
emergency management, community health, and fishing, transportation, to name a few). For
example, environmental concerns played a large role in the failure of both the Islander East and
Broadwater proposals from receiving permits that would have allowed for their construction (CT
DEEP, 2006b; Rather, 2008). Moreover, CT DEEP, in its Water Quality Certification ruling on
the Islander East proposal, cited that the project, as proposed, would have negatively impacted
both shellfish habitat and active and potential shellfish operations (CT DEEP, 2006b). The
Cross-Sound Cable was also controversial among environmental and shellfishing groups
(Fairley, 2005; Grant, 2003; Rather, 2007; Weigold M. E., 2004)
However, even after infrastructure is built, concerns over incompatibility with resources and
other human uses remain. For instance, when the Millstone Power Station intakes water from

276
the Sound to cool its reactors, 90% of that water that discharged back to the Sound at a
temperature approximately 20° F warmer than when it was taken in. While CT DEEP officials
say there is no scientific evidence that the heated discharge water is causing a significant impact
on water temperatures in the Sound, concerns over heat pollution were worrisome enough to
Long Island’s Suffolk County government that the County commissioned a Stony Brook
University Study in the Spring of 2015 to explore whether Millstone is contributing to the
warming of the Sound’s waters. Warming waters, according to natural resource scientists, could
negatively affect wildlife habitat in the Sound, such as that for winter flounder and lobsters (CT
DEEP, 2006a; Hladky, 2015; Miller, 2014). In terms conflicts with other human use sectors, as
noted in Table 3, marine transportation has more than once run up against submerged cable lines,
especially during anchoring accidents. These situations have resulted in the temporary leaching
of dielectric fluid into Sound waters, constrained energy loads across compromised wires,
expensive repair costs, and even litigation.
Human and environmental health and security have also been raised as concerns with regards to
energy infrastructure. For example, as the Shoreham Power Plant was being constructed in the
early-to-mid 1970s, the Plant developers were working with Suffolk County to determine
emergency evacuation plans. When, in 1979, the Three Mile Island nuclear power plant in
Pennsylvania overheated, the federal Nuclear Regulatory Commission (NRC) imposed new,
stricter requirements for evacuation plans. By 1982, Suffolk County officials determined, after
public hearings on the draft evacuation plan, that evacuation would be infeasible – a
determination that effectively closed the Shoreham Plant (Weigold M. E., The Long Island
Sound: A History of Its People, Places, and Environment, 2004; Weigold & Pillsbury, 2014).
The Millstone Power Station has also been the recipient of negative attention with regards to
human safety. The plant was fined for discharging radioactive waste into Long Island Sound in
1997, and a 1999 NRC public hearing in Riverhead, NY, turned contentious, as members of the
public expressed frustration that the NRC-approved evacuation plan for Millstone only
accounted for a ten-mile radius rather than a 50-mile radius that would have covered portions of
Long Island (Weigold M. E., 2004).
Human and environmental safety has furthermore been a concern with regards to the transport
and temporary storage of petroleum products in and around the Sound. Because the Sound is a
“well-sheltered body of water with a large urbanized area surrounding it and no harbors equipped
to handle large tankers”, petroleum products are generally carried by medium and small ships; in
fact, it is believe that 80% of the cargo transported across the Sound consists of oil or oil
products (Weigold M. E., 2004, p. 217). For some, this may not only be a direct cause for
concern, as it relates to oil spills, but may also be an indirect cause for concern with regards for
needing regularly dredged harbors to provide the necessary draft for ship moorings, a process
that could disturb contaminated silt (Weigold & Pillsbury, 2014). As for the two offshore
platforms in the Sound, there have historically been concerns over blasts (e.g., a 1988 explosion
on the Northport Terminal Platform, reported felt as far as 20 miles away) and the storage of
especially volatile petroleum products (e.g., Bakken Shale oil at the United Riverhead Terminal)
(Civiletti, 2015; McQuiston, 1988).
Socio-political issues have also arisen when it comes to energy infrastructure. The Cross-Sound
Cable, for instance, was historically contentious due to differing beliefs over who would be the

277
net beneficiary of the Cable’s services. Prior to the Cable’s construction in 2002, Connecticut
politicians were concerned that the state would not benefit with the Cable in place, potentially
raising energy costs for Connecticut residents (Fairley, 2005; Weigold M. E., 2004). Even two
years following the Cable’s construction, concerns over who was actually benefitting remained
in political discourse. Prior to the August 2003, the State of Connecticut had kept the cable from
service over concerns that parts of the Cable had not been buried as deeply as required, citing
that environmental and safety concerns. However, after the Northeast blackout of 2003, U.S.
Department of Energy Secretary Spencer Abraham issued an emergency order for the cable to be
energized (Fairley, 2005; Grant, 2003). When the cable remained on through early into 2004,
then-Connecticut Attorney General Richard Blumenthal sued LIPA in federal court to have the
cable turned off, with Connecticut politicians claiming that the Cable was causing a net loss of
power for the state, harm to aquatic life, and increased energy costs for Connecticut energy
customers (Salzman, 2004). While issues between Connecticut and LIPA settled in June 2004 –
including LIPA agreeing to replace the original (and sometimes problematic) 1385 Cable – this
situation demonstrated how socio-political issues may come into play in energy infrastructure
projects. Even so, energy sharing between Connecticut and New York has shown itself to be
beneficial, particularly in emergency situations. For instance, in 1996, all three reactors at the
Millstone Power Station had to be shut down for safety reasons, and the 1385 Cable allowed
Long Island to help supply Connecticut with power (Weigold M. E., The Long Island Sound: A
History of Its People, Places, and Environment, 2004; Weigold & Pillsbury, 2014). Connecticut
and New York may very well find themselves in a situation down the road where the ability to
energy-share becomes of immediate relevance and importance.
26.3.3 Other Notes
Regulatory Considerations
While environmental concerns may arise, or be expected, with the construction or operation of
energy or telecommunications infrastructure in and around the Sound, there is precedent for
regulation taking into account longer-term environmental impacts and study. One example of
this is the Millstone Power Station’s environmental monitoring program. The program began in
1976 as a requirement of the Dominion’s National Pollutant Discharge Elimination System
Permit, a permit issued by CT DEEP (based on delegated authority from the US EPA) that
allows the Station to discharge water into the Sound. The program monitors the marine
environment around the Station by tracking and reporting a variety of physical, chemical, and
ecological parameters; the Millstone Environmental Laboratory releases an annual report with
the results of these reporting requirements (CT DEEP, 2006a; CT DEEP, 2010; Falcone, 2016).
A second example of regulation taking into account longer-term environmental impacts and
study is through the Cross Sound Settlement Agreement Fund, formed as a result of the June
2004 settlement mentioned in Section 26.3.2 Socio-Economic Context. The background of this
fund can be best described through a timeline of events:
April 12, 2002 – Connecticut Governor John G. Rowland issues Executive Order No. 26,
which bars state agencies from making final determinations on any large-scale gas or

278
electric transmission expansion projects, including in-Sound projects, until January 15,
2003. The Executive Order also sets up a task force that is to:
o review and analyze pending proposals;
o study ways to provide for the region’s energy needs while protecting the Sound;
o assess the environmental impact of laying cables, power lines, and pipelines in the
Sound; and
o evaluate ways to limit the number of such energy crossings (Connecticut Office of
the Governor, 2012).
June 3, 2002 – Public Act 02-95 is passed, adding members to the task force outlined in
Executive Order No. 26 (Connecticut General Assembly, 2002).
January and June 2003 – The task force publishes Part I and Part II of a Comprehensive
Assessment and Report, on January 1, 2003, and June 3, 2003, respectively. Part I
focuses on the Energy Resource and Infrastructure of Southwest Connecticut and Part II
focuses on the Environmental Resource and Energy Infrastructure of Long Island Sound.
A major conclusion of the task force is that substantially more natural resource
information regarding the sound is necessary for comprehensive planning (Task Force on
LIS, 2003; Working Group on Southwest CT and Task Force on LIS, 2003).
June 24, 2004 – The LIS Cross Sound Settlement Agreement is signed by CT DEEP, CT
Department of Utility Control, LIPA, Northeast Utilities (now Eversource), and Cross
Sound Cable Company (CSCC) LLC. The agreement outlines:
o stipulations for coming into compliance with a CT DEEP permit that CSCC LLC
submitted on June 17, 2004, to replace the 1385 Cable;
o the formation of a $6 million fund to be used for grants towards research and
restoration projects that directly enhance the waters of LIS and associated natural
resources;
o that the Fund will be administered by the States of Connecticut and New York;
and
o that the Funds will not be released until the Cross Sound Cable permit is issued
Also on this date, a Memorandum of Understanding (MOU) was signed by CT DEEP,
NY DEC, and the U.S. EPA New England Region and Region II (who make up the
Policy Committee of the Long Island Sound Study Management Conference) outlining:
o a Cable Fund Steering Committee;
o the Committee’s responsibilities for preparing a list of research and habitat
restoration activities, generating a Request for Proposals process, and establishing
a technical review process for reviewing proposals; and
o CT DEEP’s responsibility for the administration of Fund money
September 28, 2006 – The aforementioned Policy Committee signs a second MOU that
establishes a framework for the Fund’s use. This second MOU “emphasize[s] benthic
mapping as a priority need, essential to an improved scientific basis for management and
mitigation decisions” (LISS, 2018; Long Island Sound Study Policy Committee, 2006).
Since the signing of this MOU, the Fund has been used primarily for seafloor mapping
efforts of LIS, which continue on through today.
These two examples outline how regulation of approved energy and telecommunications
infrastructure can be used to also benefit scientific knowledge of the Sound’s natural resources.

279
Additional Resources
While the aforementioned Comprehensive Assessment and Report, Parts I and II are slightly
dated, this pair of documents represents the most complete understanding and analysis of the
existing energy and telecommunications infrastructure currently in LIS. As such, both of these
reports serve as a valuable supplement to this Inventory chapter.
Moreover, further socioeconomic context of the energy and telecommunications sector can be
gleaned from two pieces written by Pace University historian Marilyn E. Weigold, an expert on
the environmental and social history of Long Island Sound post-1614. These two pieces are Dr.
Weigold’s solo book, The Long Island Sound: A History of Its People, Places, and Environment
and her chapter contribution (with collaborator Elizabeth Pillsbury) to the environmental
management anthology, Long Island Sound: Prospects for the Urban Sea (Weigold M. E., 2004;
Weigold & Pillsbury, 2014). This Inventory chapter summarizes much of the information from
these two pieces, but further contextual information can be found by directly referencing these
resources.
26.4 References
ANL. (2017, December). Energy Zones Mapping Tool. Retrieved from Argonne National
Laboratory (ANL): https://ezmt.anl.gov/mapping/viewer
Benson, J. (2012, March 7). Broadwater abandons LNG project in Long Island Sound. The Day.
Retrieved from https://www.theday.com/article/20120307/NWS12/120309662
Cherau, S., Olausen, S., Robinson, D., Banister, J., Allegretto, K., & Stuart, Q. (2010). Cultural
Resources Inventory - Long Island Sound - Dredged Material Management Plan, Long
Island Sound, Connecticut, New York, and Rhode Island - Volume I. Prepared for the U.S.
Army Corps of Engineers, New England District. Pal Report No. 2394. Pawtucket: PAL
Publications. Retrieved from
http://www.usace.army.mil/Portals/74/docs/Topics/LISDMMP/STID11-LIS-DMMP-
CulturalResourceInventory.pdf
Civiletti, D. (2015, October 8). ‘Extra-flammable’ crude oil being stored at Riverhead oil tanks;
town officials, first responders kept in the dark. RiverheadLOCAL. Retrieved from
https://riverheadlocal.com/2015/10/08/extra-flammable-crude-oil-being-stored-at-
riverhead-oil-tanks-town-officials-first-responders-kept-in-the-dark/
Connecticut General Assembly. (2002, June 3). An Act Concerning the Protection of Long Island
Sound. Public Act No. 02-95. Retrieved from
https://www.cga.ct.gov/2002/act/Pa/2002PA-00095-R00HB-05609-PA.htm
Connecticut Office of the Governor. (2012, April 12). Executive Order No. 26.
CT DEEP. (2006a, August 25). DEP Issues Tentative Decision to Renew Millstone Discharge
Permit. Retrieved from Connecticut Department of Energy and Environmental Protection
(CT DEEP): http://www.ct.gov/deep/cwp/view.asp?A=2712&Q=324620
CT DEEP. (2006b, December 19). Declaratory Ruling on Water Quality Certification
Application #200300937-SJ. Retrieved from
http://www.ct.gov/deep/lib/deep/declaratory_rulings_other_decisions/islandereastdecisio
n.pdf

280
CT DEEP. (2010). NPDES Permit CT 0003263. Retrieved from
https://www3.epa.gov/region1/npdes/permits/2010/finalct0003263permit.pdf
CT DEEP. (2010). NPDES Permit CT0003263. Retrieved from
https://www3.epa.gov/region1/npdes/permits/2010/finalct0003263permit.pdf
CT DEEP. (2017, December). Long Island Sound Blue Plan Webinars. Retrieved from
Connecticut Department of Energy and Environmental Protection (CT DEEP):
http://www.ct.gov/deep/cwp/view.asp?a=2705&q=593814&deepNav_GID=1635
Doan, L. (2009, February 29). Developer Gives Up On Islander East Pipeline. Hartford Courant.
Retrieved from http://articles.courant.com/2009-02-
26/news/islandereast0226.art_1_long-island-sound-spectra-energy-national-grid
E3, Inc. (2007). Long Island Tidal and Wave Energy Study: An Assessment of the Resource.
Report prepared for the Long Island Power Authority. New York: E3, Inc. Retrieved
from http://www.lipower.org/pdfs/company/papers/report-wave0107.pdf
Fairley, P. (2005, April 1). TransÉnergie: Playing Two Power Games. MIT Technology Review.
Retrieved from https://www.technologyreview.com/s/403882/trans-nergie-playing-two-
power-games/
Falcone, A. (2016, July 27). Intern Studying Ecosystem at Nuclear Power Plant. UConn Today.
Retrieved from https://today.uconn.edu/2016/07/intern-studying-ecosystem-nuclear-
power-plant/
FERC. (2008). Final Environmental Impact Statement on the Broadwater LNG Project. Docket
Nos. CP06-54-000, et al. Washington, D.C.: Federal Energy Regulatory Commission.
Retrieved from https://www.ferc.gov/industries/gas/enviro/eis/2008/01-11-08-eis.asp
Grant, S. (2003, November 22). Cross-Sound Cable Effects Unclear: Tests Continue To Assess
Long-term Environmental Impact. Hartford Courant. Retrieved from
http://articles.courant.com/2003-11-22/news/0311220659_1_long-island-sound-energy-
bill-cross-sound-cable/2
Hladky, G. B. (2015, June 22). Are Millstone's Nuclear Plants Adding To The Sound's Warming
Problems? Hartford Courant. Retrieved from http://www.courant.com/politics/hc-
millstone-hot-water-20150622-story.html
Level. (2017, June 23). Wind Turbine Systems. Retrieved from Level:
http://www.level.org.nz/energy/renewable-electricity-generation/wind-turbine-systems/
LISS. (2018). Population Within 50-Mile Radius of LIS. Retrieved from Long Island Sound
Study (LISS): http://longislandsoundstudy.net/2010/08/population-within-50-mile-radius-
of-lis/
LISS. (2018). Seafloor Mapping. Retrieved from Long Island Sound Study (LISS):
http://longislandsoundstudy.net/research-monitoring/seafloor-mapping/
Long Island Sound Study Policy Committee. (2006, September 28). Establishment of the Cross
Sound Cable/1385 Cable Settlement Fund. Retrieved from
http://longislandsoundstudy.net/wp-content/uploads/2010/03/Cable_MOU.pdf
MARCO. (2017). Mid-Atlantic Ocean Data Portal. Retrieved from Mid-Atlantic Regional
Council on the Ocean: http://portal.midatlanticocean.org/visualize/
McQuiston, J. T. (1988, September 1). Workman Lost in Blast Off L.I. The New York Times.
Retrieved from https://www.nytimes.com/1988/09/01/nyregion/workman-lost-in-blast-
off-li.html

281
Miller, C. (2014, November 21). Is Millstone power plant killing lobsters in the Sound? Suffolk
Times. Retrieved from http://suffolktimes.timesreview.com/2014/11/54100/is-millstone-
power-plant-killing-lobsters-in-the-sound/
Navigation and Navigable Waters, 33 CFR (2017).
NOAA. (2018, February). NOAA ENC Direct to GIS. Retrieved from National Oceanic and
Atmospheric Administration (NOAA) Office of Coast Survey:
https://encdirect.noaa.gov/enc_direct/encdirect_download.html
Northeast Ocean Data Portal. (2017). Northeast Ocean Data. Retrieved from
http://www.northeastoceandata.org/data-explorer/?commercial-fishing
NREL. (2012, June 26). Wind Data. Retrieved from National Renewable Energy Laboratory
(NREL): https://www.nrel.gov/gis/data-wind.htm
NY Geographic Information Gateway. (2017). New York Geographic Information Gateway.
Retrieved from http://opdgig.dos.ny.gov/
Rather, J. (2007, January 21). A Power Infusion Comes to Long Island by Land and by Sea. The
New York Times. Retrieved from
http://www.nytimes.com/2007/01/21/nyregion/nyregionspecial2/21lineptune.html?pagew
anted=print
Rather, J. (2008, January 27). Long Island Sound Proposal Awaits Crucial Ruling. The New York
Times. Retrieved from
http://www.nytimes.com/2008/01/27/nyregion/nyregionspecial2/27energyli.html
Salzman, A. (2004, May 8). Energy Secretary Orders the Cross-Sound Cable Turned Off. The
New York Times. Retrieved from http://www.nytimes.com/2004/05/08/nyregion/energy-
secretary-orders-the-cross-sound-cable-turned-off.html
Task Force on LIS. (2003). Comprehensive Assessment and Report, Part II: Environmental
Resources and Energy Infrastructure of Long Island Sound. Pursuant to Public Act No.
02-95 and Executive Order No. 26. Willimantic: Institute for Sustainable Energy at
Eastern Connecticut State University. Retrieved from
https://cdm15019.contentdm.oclc.org/digital/collection/p128501coll2/id/154777
Weigold, M. E. (2004). The Long Island Sound: A History of Its People, Places, and
Environment. New York: New York University Press.
Weigold, M., & Pillsbury, E. (2014). Long Island Sound: A Socioeconomic Perspective. In J. T.
Latimer, Long Island Sound: Prospects for the Urban Sea (pp. 1-46). New York, NY:
Springer.
Working Group on Southwest CT and Task Force on LIS. (2003). Comprehensive Assessment
and Report, Part I: Energy Resources and Infrastructure of Southwest Connecticut.
Pursuant to Public Act 02-95 and Executive Order No. 26. Willimantic: Institute for
Susainable Energy at Eastern Connecticut State University. Retrieved from
http://worldcat.org/arcviewer/2/CZL/2009/05/07/H1241727069096/viewer/file2.pdf
Zaretsky, M. (2009, February 26). State hails victory with demise of Islander East pipeline. New
Haven Register. Retrieved from https://www.nhregister.com/news/article/State-hails-
victory-with-demise-of-Islander-East-11632222.php

282
26.5 Appendices
26.5.1 List of Maps Used to Inform the Chapter
Below is a list of all maps used to inform this chapter, including maps presented above in the
narrative and additional maps used to support chapter findings. Maps listed below are organized
by the online data portal on which they are hosted (URL links to data portals are noted in Section
26.4 References above). Map products not accessible by online data portal are also noted below.
Northeast Ocean Data Portal
Alternative Fuel Stations
Cable and Pipeline Areas
Coastal Energy Facilities
New England Electrical Transmission Lines
New England Electrical Transmission Substations
Submarine Cables
New York Geographic Information Gateway
Tidal Stream Resource Potential – Mean Current
Tidal Stream Resource Potential – Mean Power Density
Mid-Atlantic Ocean Data Portal
Offshore Wind Technology Zones
Energy Zones Mapping Tool (must sign up for an account)
Biodiesel Plants
Mineral Resources
Pipelines – Natural Gas
Pipelines – Petroleum Product
Wave Energy – Energy Period
Wave Energy – Power Density
Wave Energy – Significant Wave Height
Wave Energy – Water Depth
NOAA ENC Direct to GIS
Approach – Aids to Navigation – Beacon – Lateral (Point)
Approach – Aids to Navigation – Beacon – Special Purpose General (Point)
Approach – Aids to Navigation – Light (Point)
Approach – Offshore Installations – Offshore Platform (Point)
Approach – Offshore Installations – Pipeline – Submarine On Land (Line)
Approach – Ports and Services – Mooring – Warping Facility (Point)
Approach – Regulated Areas and Limits – Restricted Area (Area)

283
Non-Portal Map Products
Potential Tidal Energy Sites Around Long Island, NY
Potential Tidal Energy Sites with Depth < 50 ft, Long Island
Potential Tidal Energy Sites with Depth > 50 ft, Long Island
Offshore Wind Speed 90m
U.S. Army Corps of Engineers LIS Dredged Material Management Plan Historic
Resources Inventory
More information on some of the map products presented in this chapter, including URL links to
data and metadata, can be found in the Energy & Telecommunications Map Book (CT DEEP,
2017). Not all products showcased in the map book may be addressed in this chapter or utilized
to inform the final Blue Plan.
26.5.2 Notes on Stakeholder Engagement
Initial rounds of spatial data review took place throughout the Fall of 2017 with a team of at least
three representatives from Eversource Energy, along with two representatives from the
Connecticut Siting Council. These initial rounds of review consisted of overview preliminary
assessments of the accuracy, relevance, and relevance of collected spatial data and identification
of other stakeholders in the sector who may also want to review the spatial data.
Over 75 stakeholders in the energy and telecommunications sector were identified and invited to
take part in a spatial data review webinar on December 18, 2017, including being sent the Energy
& Telecommunications Map Book (CT DEEP, 2017). Approximately 21 people participated on
the webinar, 14 of whom represented organizations within the energy and telecommunications
sector. Webinar topics covered included a basic overview of the Inventory and Blue Plan policy
development processes, summary of the spatial data products collected by the Blue Plan team,
and an open discussion on whether the spatial data was accurate, relevant, and representative for
marine spatial planning purposes.
Moreover, in September 2017, CT DEEP staff members met with representatives from
Deepwater Wind for informational purposes to discuss the process of wind energy development
on the Atlantic coast. According to CT DEEP members present at the meeting, Deepwater Wind
has no current plans to pursue permits for wind turbine placement in LIS.
Further opportunities for stakeholder engagement include engaging more stakeholders at industry
meetings and facilitating more in-depth review of the information provided in Tables 1-5.

284
Chapter 27. National Security
Chapter Table of Contents
27.1 Key Data and Map Products .............................................................................................. 284 27.2 Assessment of Data Quality ............................................................................................... 288
27.2.1 Sources of Data and Metadata ................................................................................. 288 27.2.2 Accuracy, Representativeness, and Relevance of Map Products ............................. 288
27.2.3 Data Gaps and Availability of Data to Address Gaps .............................................. 289 27.3 Relevance ........................................................................................................................... 290
27.3.1 Relative Historical Importance ................................................................................. 290 27.3.2 Socio-Economic Context ........................................................................................... 290 27.3.3 Other Notes ............................................................................................................... 291
27.4 References .......................................................................................................................... 291 27.5 Appendices ......................................................................................................................... 292
27.5.1 List of Maps Used to Inform the Chapter ................................................................. 292 27.5.2 Notes on Stakeholder Engagement ........................................................................... 293
27.1 Key Data and Map Products
The National Security sector concerns those activities and facilities associated with national
defense and law enforcement, predominantly the responsibilities of the U.S. Navy and U.S.
Coast Guard. Other authorities such as DEEP’s Environmental Conservation Police, municipal
police, harbormasters and the Coast Guard Auxiliary play ongoing roles in law enforcement for
on-water uses such as the commercial shipping and recreational boating sectors, but this sector is
focused on the activities and regulatory authorities of the federal maritime services.
There are a few map products that help to show the distribution and diversity of National
Security activities in Long Island Sound. These maps illustrate data surrounding topics of
regulated zones, anchorage areas, and warfare testing ranges.
Anchorage Areas (Figure 1) is a map that displays polygons identifying where boats and ships
can safely drop anchor. Special anchorage areas are described in subpart A of 33 U.S. Code
(U.S.C.) 100 (MARCO, 2017).

285
Figure 1. Anchorage Areas. Map displaying where ships and boats can safely drop anchor.
Access available via the Mid-Atlantic Data Portal (MARCO, 2018).
The Safety, Security, and Regulation zones map (Figure 2) is a data layer that identifies what
regions are in permanent or coniditonal security zones, and what regions lie within regulated
navigation areas. The goal of the layer is to display where vessel access is limited or restricted,
or if special regulations apply. Safety and security zones that are associated with special events
or construction are not shown on this map, but are included in the dataset.

286
(a)
(b)
Figure 2. Safety, Security, and Regulated Zones. (a) Map displaying regulated navigational area
in Long Island Sound. (b) Map displaying regulated safety and security zones around the
Thames River region. Access available via the Northeast Ocean Data Portal (NEODP, 2017).
The HUDS (Human Use Data Synthesis) Theme – Security map (Figure 3) is an integrative data
layer that combines 15 other data layers to see how much information lies in a given cell.
Security layers include regulatory zones, danger zones, and restricted areas. If an individual were
to click on a cell, a pop-out box would appear identifying how many data layers are in a cell and
what those data layers are. The legend separates the cells by the number of data layers and
assigns those numbers a color. The cells over Long Island Sound contain one data layer, being
the Naval Undersea Warfare Testing Range presented below, and therefore are identified by a
blue color.

287
Figure 3. Human Use Data Synthesis (HUDS) Theme – Security Data. Map analyzing the
different amount of security data layers in a given cell, classified by color. Access available via
Mid-Atlantic Ocean Data Portal (MARCO, 2017).
The Naval Undersea Warfare Testing Range map (Figure 4), which is also accounted for in the
HUDS data in Figure 3, displays an area where research, development, testing, and evaluation of
undersea warfare technology can occur. This area can also support other Navy or Department of
Defense activities. The Naval Undersea Warfare Center (NUWC), headquartered in Newport,
RI, is known to use areas within the Sound for classified research and testing activities and
maintains an installation on Fishers Island.
Figure 4. Naval Undersea Warfare Center Testing Range. Map that shows the extent of U.S.
Navy research, testing, and evaluation of undersea warfare technology. Access available via the
Northeast Ocean Data Portal (NEODP, 2017).

288
27.2 Assessment of Data Quality
27.2.1 Sources of Data and Metadata
Data is available through a series of online data portals including the Northeast Ocean Data
Portal and Mid-Atlantic Ocean Data Portal. The NOAA charts are also a prominent source of
maritime transportation, boating, and security information, particularly for features such as safety
and security zones which must be taken into account by other users of Long Island Sound.
Metadata information is available through the online portals. Most of the data is collected via the
U.S. Coast Guard and Navy.
27.2.2 Accuracy, Representativeness, and Relevance of Map Products
In terms of accuracy, the most up-to-date information can be found via NOAA navigation charts,
which are available in both electronic and raster forms (Electronic Navigation Charts [ENCs]
and Raster Navigation Charts [RNCs], respectively) (NOAA, 2017). Certain data layers like the
Aids to Navigation map product (see Section 23.5.1 List of Maps Used to Inform the Chapter)
may not be as useful in a static form; however, NOAA ENCs display their latest locations,
updated as often as daily (Figure 5). Aids to Navigation information may also be supplemented
with the Weekly Light List to improve navigation and data accuracy. The weekly light list is
meant to provide more complete information concerning aids to navigation that cannot be shown
on charts (United States Coast Guard, 2016). This list is supplied annually, and corrections are
made as needed (United States Coast Guard, 2016).
In relation to representativeness and relevance, again the NOAA Charts will be the best way to
understand spatial concerns of National Security. For example, the spatial aspects of naval
operations in the Sound essentially comprise submarine transits through existing navigational
channels between the Sub Base and open ocean waters, which are of course reflected on the
NOAA charts. National Security also has strong ties to the Marine Transportation, Navigation,
and Infrastructure (Chapter 21) sector and dataset, and should be referred to while understanding
this sector.

289
(a)
(b)
Figure 5. Example display of NOAA navigation charts. (a) Webpage showing different NOAA
Electronic Navigation Charts delineations. (b) NOAA Raster Navigation Chart for New Haven
harbor. Access available via Office of Coast Survey (NOAA, 2017).
27.2.3 Data Gaps and Availability of Data to Address Gaps
One potential data gap is that lightering, generally ship-to-barge transfer of petroleum products,
is not officially designated for particular locations in the Sound. Lightering activities take place
fairly regularly but are not yet depicted in a spatial data layer, though stakeholders noted that
ships could likely congregate in anchorage areas (Figure 1). It was suggested that providing a
link to the 33 CFR (Code of Federal Regulations) would provide further information on specific
anchorage areas, rules about using lights, and other relevant regulations (Coast Guard, 2017).

290
Other data gaps of the National Security sector may include emergency response, infrastructure
and environmental sensitivity. Additional resources from stakeholders were suggested to fill in
some of those gaps and to have a robust variety of data. These include federal datasets such as
Homeland Infrastructure Foundation-Level Data (HIFLD), which provides spatial datasets on
maritime transportation, jurisdiction boundaries, ports, and USCG districts (DHS, 2017). Other
federal datasets include the Emergency Response Management Application from NOAA
(ERMA), which is an online mapping toolset that can provide datasets on ship locations,
weather, ocean currents, and Environmental Sensitivity Indexes (NOAA, 2018). Environmental
Sensitivity Indexes provide essential information on coastal resources that may be at risk to
spilled oil (NOAA, 2018).
One last data gap presented may be the lack of spatial representation of marine events. To fill
this gap it was suggested to refer to the Notices to Mariners, which can provide information on
marine events, dredging projects, construction, etc. that are not spatially catalogued (DHS,
2017).
27.3 Relevance
27.3.1 Relative Historical Importance
Connecticut’s naval tradition goes back to the earliest days of the Republic, when a shipyard in
what is now Essex built a frigate for the Continental Navy. Today, submarines are built at
Electric Boat (EB) in Groton and based upriver at the Naval Submarine Base New London (Sub
Base). The Coast Guard Academy, with extensive docks and the home of the tall ship Eagle, is
nearby in New London, and Coast Guard Sector Long Island Sound is headquartered in New
Haven. Within the Sound, there are other Coast Guard stations at Fort Trumbull in New London
and Eaton’s Neck, NY. The Sub Base, the Academy, and EB are facilities of national
importance that contribute significantly to the security of the United States. In addition, the
Naval Undersea Warfare Center, based in Newport, RI, and with a facility on Fishers Island, NY,
occasionally conducts classified research and testing activities in Long Island Sound.
Currently there is little conflict between national security activities and other uses of Long Island
Sound. Submarine operations, generally transiting between the Sub Base and offshore
deployments, are restricted to existing navigational channels. NUWC activities take place only
occasionally within the Sound, and NUWC has referred to the Northeast Ocean Data Portal,
among other data sources, to ensure that there will be no interference with other users.
27.3.2 Socio-Economic Context
From an economic perspective, the Sub Base and EB each constitute two of the largest
employers in Southeastern Connecticut. The Sub Base hosts 6,500 military personnel and over
2,000 civilian employees and contractors and plays an essential role in the state and regional
economy (CNIC, 2018) (Southeastern CT Council of Governments). In 2005, when the Sub Base
was threatened with closure under the Pentagon’s Base Realignment And Closure (BRAC)

291
process, Connecticut state agencies and business groups mobilized to document the economic
and security values that were at stake (State of Connecticut). As a result of this study’s findings,
the closure recommendation was overturned and the base remains open. In addition, the U.S.
Navy’s plans for procurement of new submarines in the coming decades have prompted EB to
boost its employment to 15,000 people (The Day, 2017). The indirect and multiplier effects of all
submarine-related employment and expenditures are integral to the entire regional economy.
27.3.3 Other Notes
In terms of spatial requirements, both the Sub Base and EB are protected by designated security
zones and require periodic dredging of the navigational channel of the Thames River in order to
function. Electric Boat is of greatest concern in this respect, since projected increases in
submarine construction will necessitate additional dredging, for which a permit application is
forthcoming, and may affect other maritime traffic. Moreover, EB is within the statutorily
specified Blue Plan policy area and will need to be taken into account in policy development.
In terms of marine spatial planning for potential new uses, virtually all human activities in Long
Island Sound will depend to a greater or lesser extent on navigation by ship or boat. As such,
any future uses and the navigational traffic patterns they generate will need to accommodate
national security considerations such as restricted zones around sensitive facilities and naval
operations.
27.4 References
CNIC. (2018). Total Force Power. Retrieved from CNIC: Naval Submarine Base New London :
https://www.cnic.navy.mil/regions/cnrma/installations/navsubbase_new_london/about/tot
al_force_manpower.html
Coast Guard. (2017). 33 CFR I - Coast Guard, Department of Homeland Security . Retrieved
from Legal Information Institute: https://www.law.cornell.edu/cfr/text/33/chapter-I
DHS. (2017). HIFLD Open Data. Retrieved from Homeland Infrastructure Foundation-Level
Data (HIFLD): https://hifld-geoplatform.opendata.arcgis.com/
DHS. (2017). Local Notice to Mariners. Retrieved from Navigation Center:
https://www.navcen.uscg.gov/?pageName=lnmDistrict®ion=1
MARCO. (2017). Mid-Atlantic Ocean Data Portal. Retrieved from Anchorage Areas:
http://portal.midatlanticocean.org/data-catalog/maritime-industries/#layer-info-
anchorage-areas
MARCO. (2018). Retrieved from Mid-Atlantic Ocean Data Portal:
http://portal.midatlanticocean.org/visualize/
NEODP. (2017). Retrieved from Northeast Ocean Data Portal:
http://www.northeastoceandata.org/data-explorer/
NOAA. (2017). Office of Coast Survey. Retrieved from
http://www.charts.noaa.gov/InteractiveCatalog/nrnc.shtml

292
NOAA. (2018). Download ESI Maps and GIS Data. Retrieved from Office of Response and
Restoration: https://response.restoration.noaa.gov/maps-and-spatial-data/download-esi-
maps-and-gis-data.html
NOAA. (2018). Environmental Response Management Application (ERMA). Retrieved from
Office of Response and Restoration: https://response.restoration.noaa.gov/maps-and-
spatial-data/environmental-response-management-application-erma
Southeastern CT Council of Governments. (n.d.). Subase New London Joint Land Use Study.
Retrieved from http://www.seccog.org/pdfs/SNL_JLUS_ProjectOverview_Final_2017-
12-06.pdf
State of Connecticut. (n.d.). The Contribution of the Groton Naval Sub Base and the Electric
Boat Company to the Economies of Connecticut and Southeastern Connecticut. Retrieved
from http://www.ct.gov/ecd/lib/ecd/Sub_Base_Executive_Summary_5.4.05.pdf
The Day. (2017, January 9). Electric Boat poised to invest $1.5 billion to meet demand for more
subs. Retrieved from theday: Military News:
http://www.theday.com/article/20170109/NWS09/170109316
27.5 Appendices
27.5.1 List of Maps Used to Inform the Chapter
Below is a list of all maps used to inform this chapter, including maps presented above in the
narrative and additional maps used to support chapter findings. Maps listed below are organized
by the online data portal on which they are hosted (URL links to data portals are noted in Section
23.4 References above). Map products not accessible by online data portal are also noted below.
Northeast Ocean Data Portal
Safety, Security, and Regulated Zones
Naval Undersea Warfare Testing Range
Mid-Atlantic Ocean Data Portal
Anchorage Areas
HUDS Theme – Security Data
Aids to Navigation
Maintained Channels
Non-Portal Map Products
NOAA Navigational Charts
More information on some of the map products presented in this chapter, including URL links to
data and metadata, can be found in the National Security Map Book ***Not yet live*** (CT
DEEP, 2017). Not all products showcased in the map book may be addressed in this chapter or
utilized to inform the final Blue Plan.

293
27.5.2 Notes on Stakeholder Engagement
In-person meetings were held with DEEP Encon Police on October 12, 2017, with US Coast
Guard personnel, including the Chiefs of Prevention, Waterways Management and Incident
Management for Sector Long Island Sound, on December 1, 2017, and with personnel from the
Navy Sub Base New London on January 24, 2018. A conference call with staff from NUWC and
the Sub Base was held on February 8, 2018. On each occasion agency activities, data sources,
and data needs were discussed, and provisions made for following up. Further engagement and
coordinated was suggested with regional Port Security groups, which gather all relevant law
enforcement agencies and relevant maritime stakeholders in periodic meetings.