march 24, 2010san jose state university measuring precipitation from space past, present, and...
Post on 20-Dec-2015
214 views
TRANSCRIPT
March 24, 2010 San Jose State University
Measuring Precipitation from SpaceMeasuring Precipitation from Space Past, Present, and FuturePast, Present, and Future
Jian-Jian Wang
University of Maryland Baltimore Countyand NASA Goddard Space flight Center,
Greenbelt, MD

The Importance of Rainfall Measurement
• To agriculture, measuring rainfall and monitoring flood/ drought is important to crop growing and harvest.
• Hydrologists monitor rainfall to predict river flows and flood stages, as well as the storage of water in lakes and reservoirs.
• To global weather and climate modeling, accurate rainfall information is crucial to improve forecasts of changes in our weather and climate.
Rain Gauge
• Around 350 BC, the Indian author, Kautilya, described the first known rain gauge in his manuscript, Arthasastra.
• In 1247 AD, the Chinese reported the first known use of rain gauges during the Southern Song Dynasty.
Ground-Based Rainfall Measurement
Weather Radar
• In 1941, a 10-cm radar tracked a thunderstorm with hail on the south coast of England.
• In the late 1980s, highly sophisticated, ground-based Doppler weather radar systems, the Next-Generation Weather Radar (NEXRAD), now called the WSR-88D, were adapted for use.

Rain Gauge
Advantage
• “True” measurement of rain
Disadvantage
• No coverage over oceans or remote regions
• Point measurement not representative of area
• Wind drift may cause the underestimates
• Different gauge designs

Weather Radar
Advantage
• Excellent Space and Time Resolution
• Observations in Real Time
Disadvantage
• Little coverage over oceans or remote regions
• Corrections required for beam filling, attenuation, etc.
• Z-R relationship

• Precipitation is still the most difficult atmospheric variable to measure, mainly because of its concentration into a few cloud systems.
• Scarcity of quantitative precipitation information over ocean and remote regions has been a frustrating long-time bottleneck for atmospheric science.
• Global rainfall can be measured satisfactorily only from space.

Rainfall Measurement from Space — Geostationary Satellite (VIS/IR)
GOES Weather SatellitesGeostationary Operational Environmental Satellite (GOES) system was developed by the NASA and NOAA. The first satellite of the series, GOES-1 with a resolution of ~1 km, was launched in 1975.
MesosatA series of geostationary satellites launched by the European Space Agency. The first generation series starting in 1977 had ~5 km resolution. The second generation series since 2004 improved the resolution to 3 km and a high resolution mode of 1 km.
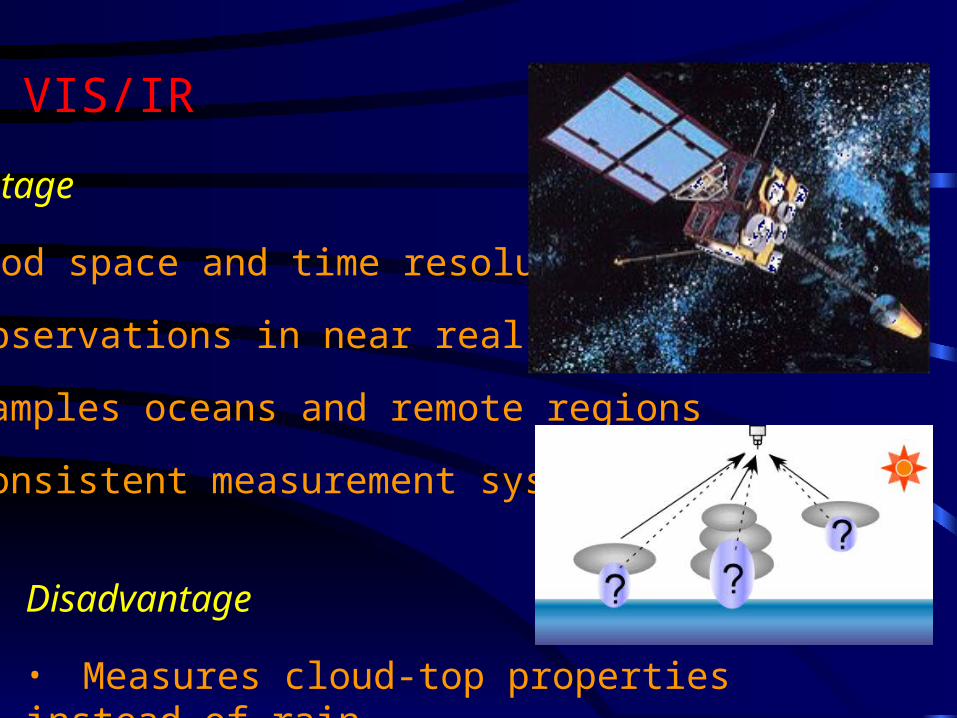
VIS/IR
Advantage
• Good space and time resolution
• Observations in near real time
• Samples oceans and remote regions
• Consistent measurement system
Disadvantage
• Measures cloud-top properties instead of rain
Microwave Sounding Unit (MSU) Flown on NOAA's TIROS-N polar-orbiting satellite in 1978 and continued on the NOAA-6 through NOAA-14 in 1994.
Rainfall Measurement from Space — Polar Orbiting Satellite (Passive Microwave)
Special Sensor Microwave Imager (SSM/I) On board Defense Meteorological Satellite Program (DMSP) F-8 satellites in 1987 and continued through F-18 in 2009.
Advanced Microwave Sounding Unit (AMSU) The first AMSU was launched on NOAA-15 in 1998 and continued through NOAA-19 in 2009.

Passive Microwave
Advantage
• Samples remote regions
• Consistent measurement system
• More physically based, more accurate than VIS/IR Estimates
Disadvantage
• Poorer Time and Space Resolution (~6 h, ~5-25+ km)
QuickTime™ and aTIFF (Uncompressed) decompressor
are needed to see this picture.
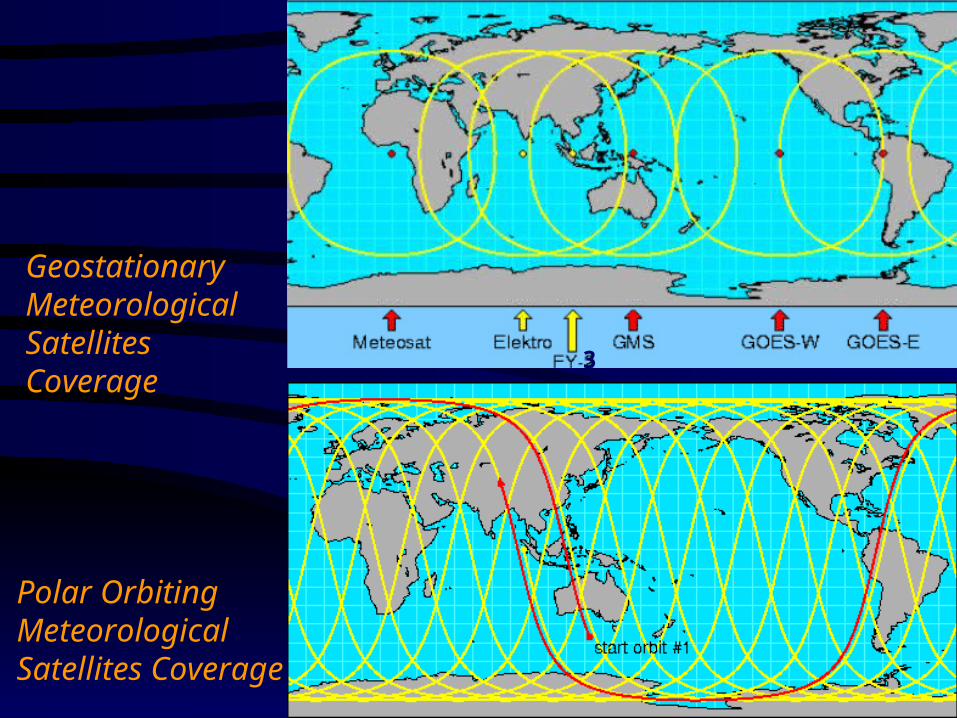
Geostationary MeteorologicalSatellites Coverage
Polar Orbiting MeteorologicalSatellites Coverage
3
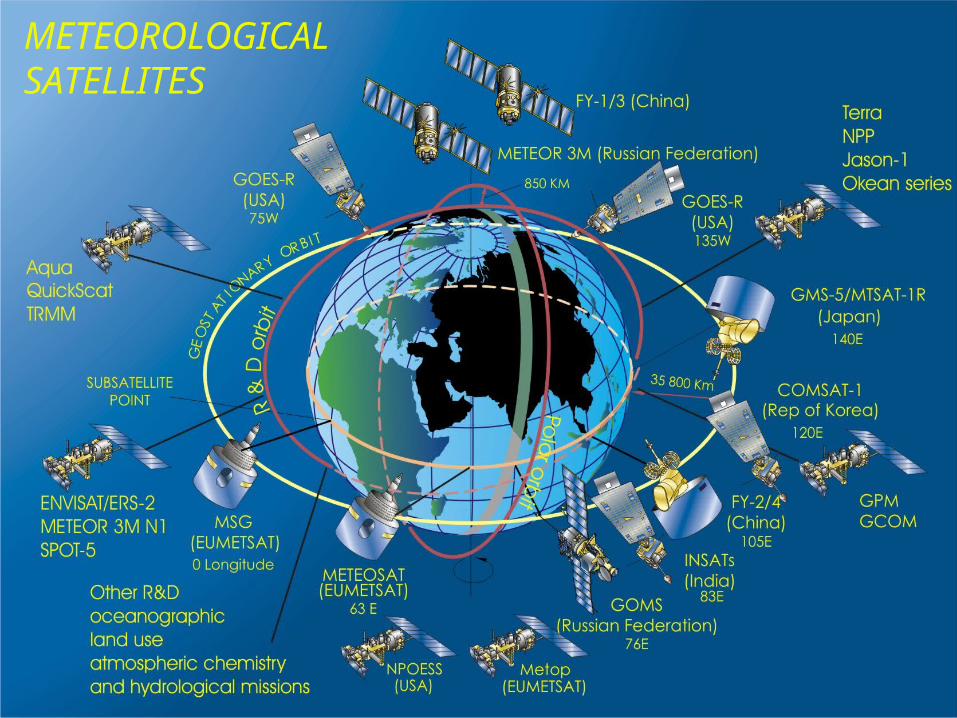
METEOROLOGICALSATELLITES


Tropical Rainfall Measuring Mission (TRMM): A joint U.S. (NASA), Japan (Japan Aerospace
Exploration Agency, JAXA) mission.
A precessing low-inclination (35o) low-altitude (350 km) orbit to achieve high spatial resolution and capture the diurnal variation of tropical rainfall
1 day coverage 2 day coverage
Orbit and Coverage

TRMM SensorsMicrowave radiometer (TMI) [U.S.]
10.7, 19.3, 21.3, 37.0 85.5 GHz (dual polarized except for 21.3 V-only)
conical scanning (530 inc.)
at 5.1 km resolution at 85.5 GHz
878 km swath
Precipitation radar (PR) [Japan]
13.8 GHz
cross-track scanning
at 5 km resolution
247 km swathVisible/infrared radiometer (VIRS) [U.S.]
0.63, 1.61, 3.75, 10.8, and 12m
cross-track scanning
at 2.4 km resolution
833 km swath
Lightning Imaging Sensor (LIS) [U.S.]
Staring optical array

TRMM GOALS• To advance understanding the global energy and water cycles by providing
distributions of rainfall and latent heating over the global tropics.
• To understand the mechanisms through which changes in tropical rainfall influence global circulation, and to improve ability to model these processes in order to predict global circulations and rainfall variability at monthly and longer time scales
• To provide rain and latent heating distributions to improve the initialization of models ranging from 24 hour forecasts to short-range climate variations
• To help understand, diagnose and predict the onset and development of the El Niño, Southern Oscillation and the propagation of the 30-60 day oscillations in the tropics
• To help understand the effect that rainfall has on the ocean thermohaline circulations and the structure of the upper ocean
• To allow cross-calibration between TRMM and other sensors with life expectancies beyond that of TRMM itself
• To evaluate the diurnal variability of tropical rainfall
• To evaluate a space-based system for rainfall measurement

Simultaneous PR, TMI, and VIRS Images

The Lightning Imaging Sensor (LIS)
Christian, Blakeslee, Goodman, Mach -- NASA/MSFC, UAH
composite• Land/ocean differences pronounced
• Consistent with NASA OTD climatology in both spatial distribution and rates
• Island effects pronounced
• Significant orographic signals (Himalayas, also in Colombia, Zaire, Indonesia)
• Lightning / precipitation ice relationship (LIS / TMI)
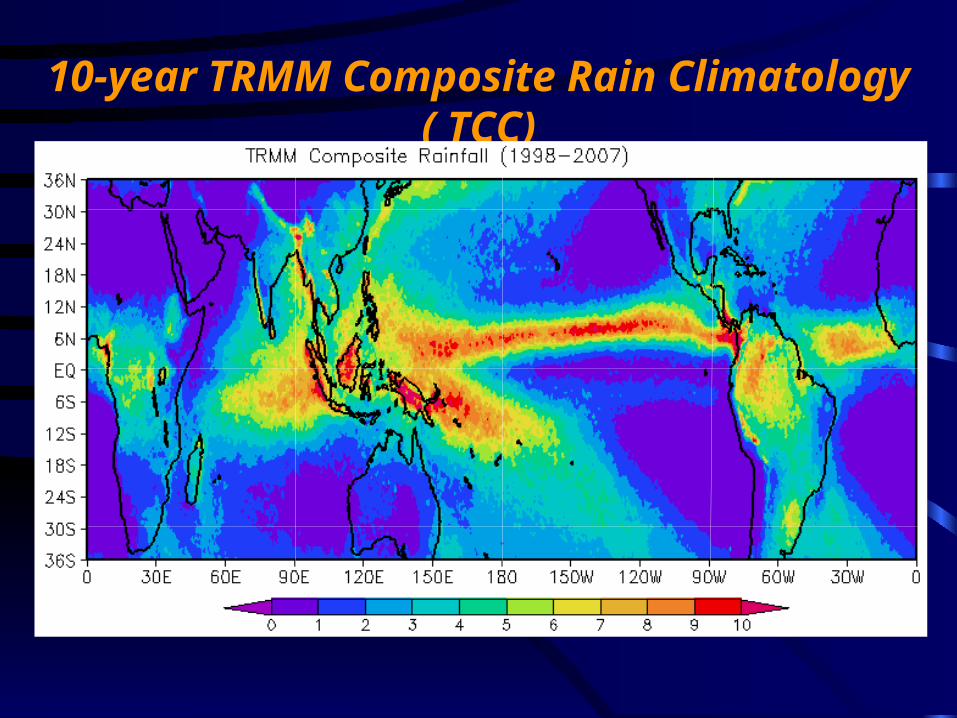
10-year TRMM Composite Rain Climatology ( TCC)
mm/day
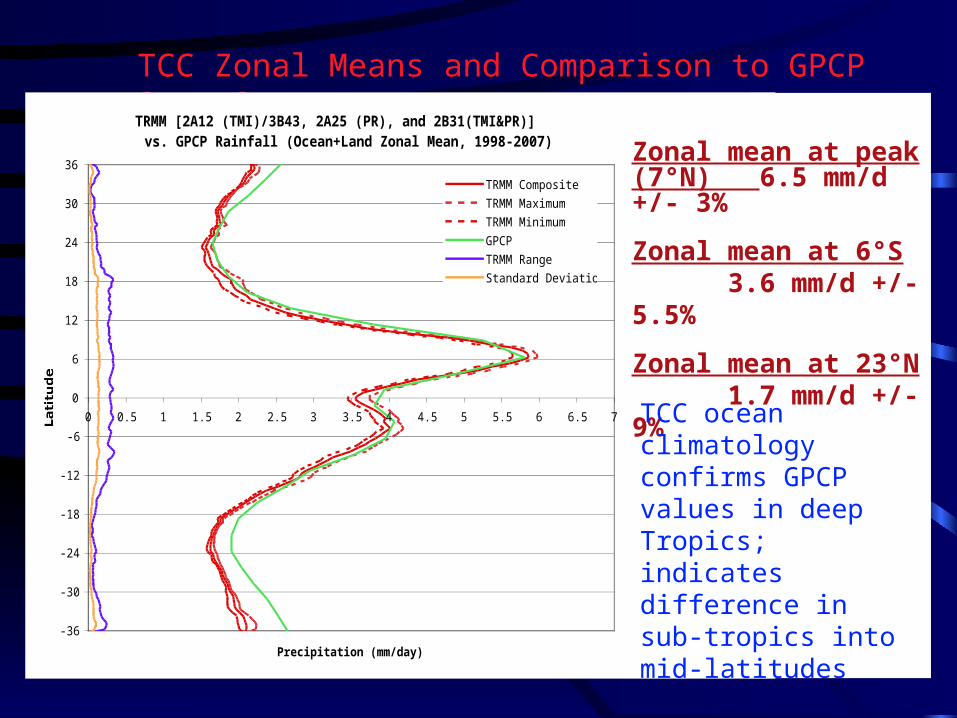
TCC Zonal Means and Comparison to GPCP Over Ocean
TRMM [2A12 (TMI)/3B43, 2A25 (PR), and 2B31(TMI&PR)] vs. GPCP Rainfall (Ocean+Land Zonal Mean, 1998-2007)
-36
-30
-24
-18
-12
-6
0
6
12
18
24
30
36
0 0.5 1 1.5 2 2.5 3 3.5 4 4.5 5 5.5 6 6.5 7
Precipitation (mm/day)
Latitude
TRMM Composite
TRMM Maximum
TRMM Minimum
GPCP
TRMM Range
Standard Deviation
Zonal mean at peak (7°N) 6.5 mm/d +/- 3%
Zonal mean at 6°S 3.6 mm/d +/- 5.5%
Zonal mean at 23°N 1.7 mm/d +/- 9%
TCC ocean climatology confirms GPCP values in deep Tropics; indicates difference in sub-tropics into mid-latitudes
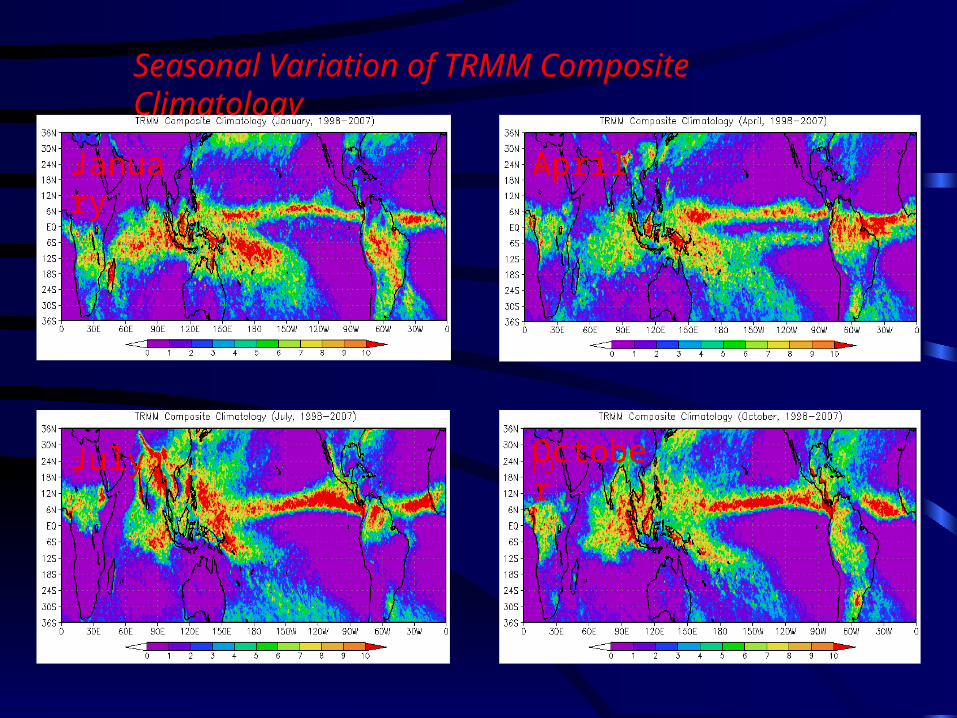
Seasonal Variation of TRMM Composite Climatology
July
January April
October
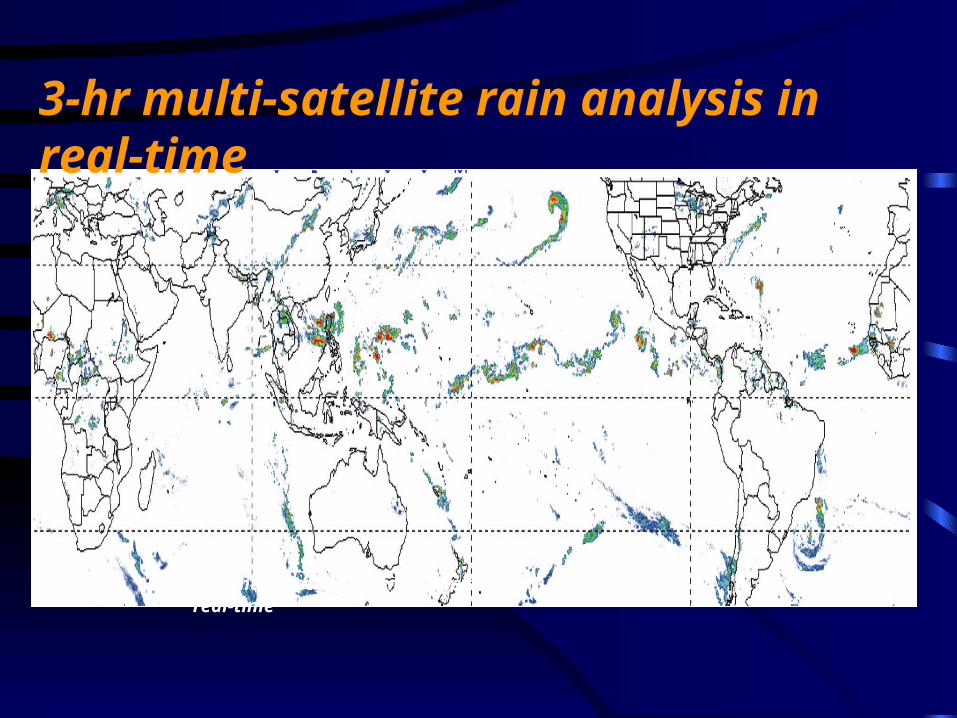
3-hr multi-satellite rain analysis in real-time
3-hr multi-satellite rain analysis in real-time
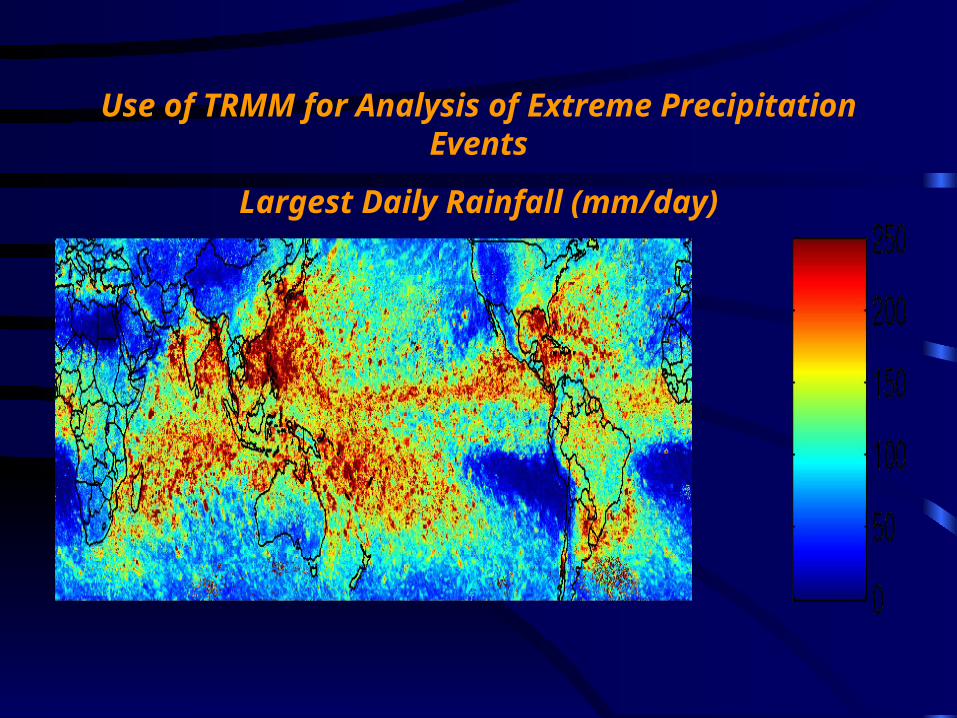
Use of TRMM for Analysis of Extreme Precipitation Events
Largest Daily Rainfall (mm/day)