march 7, 2013 class 10. ace, economic impacts, and forest dependency
TRANSCRIPT

M A RC H 7 , 2 0 1 3
CLASS 10. ACE, ECONOMIC IMPACTS, AND FOREST
DEPENDENCY

ALLOWABLE CUT EFFECT (ACE)
• The Allowable Cut Effect exists where there are regulations or policies that constrain harvest levels• Examples in BC are
the metering out of old growth timber (key for it to work)
• Improvements in growth and yield are spread out over the entire rotation• Conversely losses in
timber are also spread out (regardless of whether or not timber was close to harvesting age)
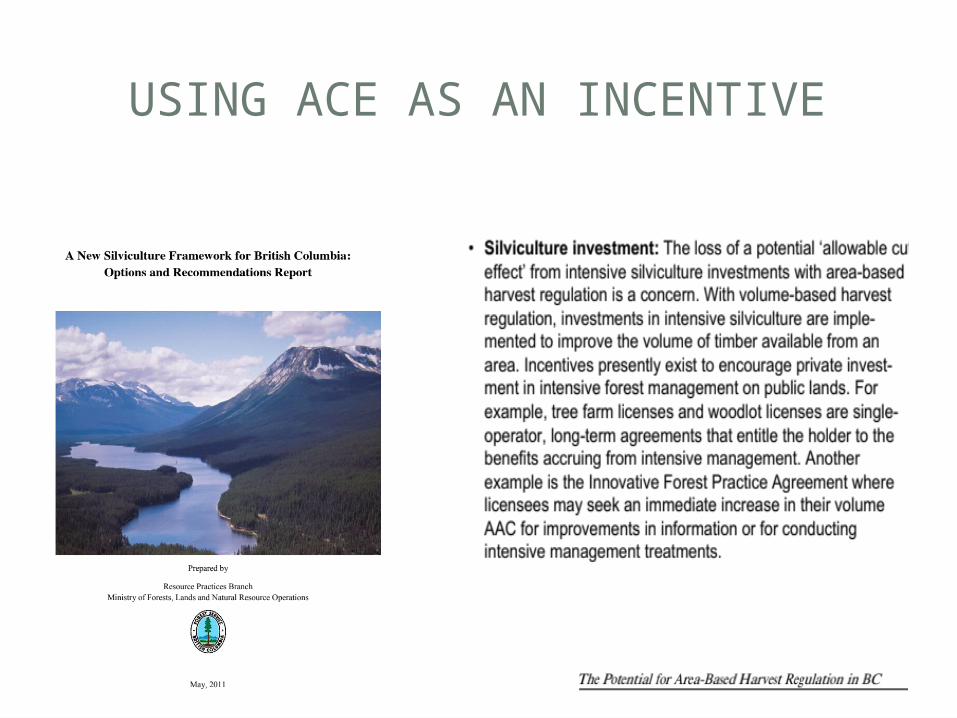
USING ACE AS AN INCENTIVE

EFFECT OF ACE
Standard CBA
• Cost of improving the stand -$1000 per hectare
• Result-doubling of growth (an additional 995 cubic metres)
• Standard cost-benefit:• Discounted Benefit:
$13,187/1.0558=$778• Cost: $1000• So NPV =-$222
Effect of ACE
• If you can take additional volume over the 58 years… ($13,187/58)• Then it looks quite different
• Using a formula-the present value of a finite annuity
• Result with ACE• Discounted benefit =
($13,187/58)*((1.05)58-1)/.05*(1.05)58 = $4,546
• Same cost but NPV=$3,546

EXPERIENCE WITH ACE
ASSESSING ECONOMIC IMPACTS
• Whether for planning or cost benefit analysis we are interested in the economic impacts that flow from different decisions
• We can use Input-Output models that show the income an output relationship between different sectors of the economy
• This then allows us to determine the economic impacts that follow from an event such as• Change in harvest level, • Construction (or closure) of a sawmill or pulp mill• or a project (such as improving infrastructure/road access)
• Often interested in impact on output, employment, government revenues, or GDP
BASIC ECONOMY
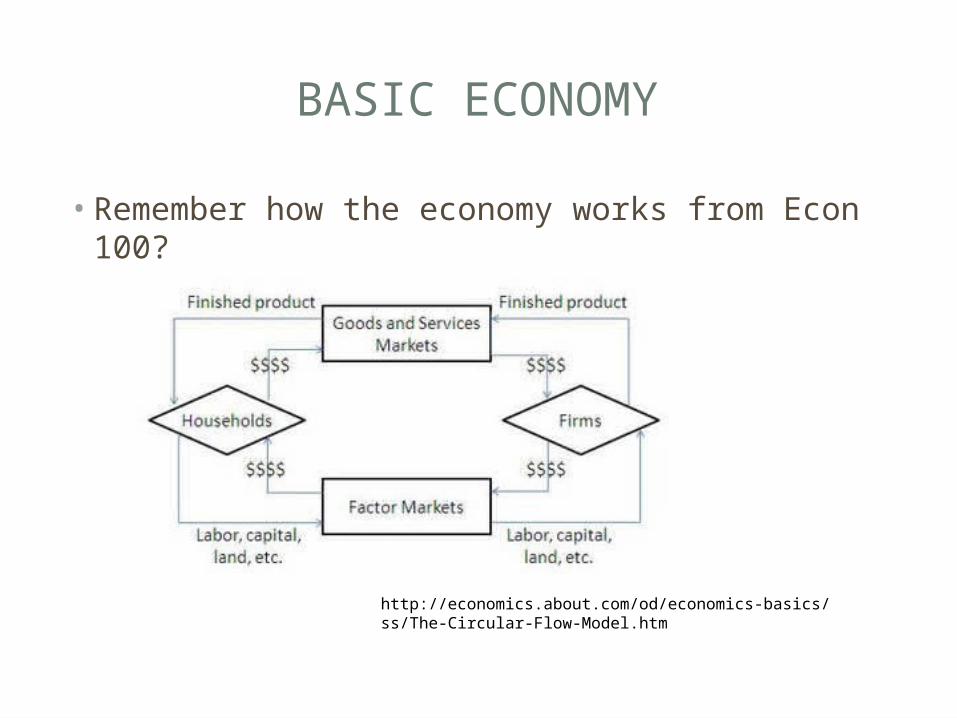
• Remember how the economy works from Econ 100?
http://economics.about.com/od/economics-basics/ss/The-Circular-Flow-Model.htm
INPUT/OUTPUT MODELS OF ECONOMY
• Can use purchases and transactions in economy to develop simplified models that identify relationships between sectors• These input-output models break out these
income flows by different sectors and commodities• These can be used to identify the potential
impact of one event on a sector in a regional economy and the change in value-added and income earned by primary factors of production

DIRECT AND SECONDARY IMPACTS
• Direct impacts are associated with the initial change• The secondary impacts follow as those changes
work their way through the economy• When a sector expands (contracts) it will buy
more (less) from the either sectors• In turn those other sectors will also buy more
(less)• The process keeps repeating itself into a new
equilibrium is reached

BUILDING BLOCKThese numbers represent how much of an input is required from each sector to produce output from that sector
So for B to produce $1 of output, it needs to purchase 5 ½ ($.055) cents of inputs from sector C;And households (labour) contribute $0.283 for every $1

DERIVING THE COMBINED EFFECT
• For $1 change in output of sector A results in a $0.185 change in output for sector B and so on…by the time the new equilibrium is reached, the overall impact from an increase in output by A for $1 for the overall economy will be $1.985
• Different multipliers reflect assumptions about how household income is treated, in-migration of resources, etc.

BC MULTIPLIERS
• Can be used to derive:• Changes in overall output• Employment• GDP• Government revenue
• Application can be tricky

BC MULTIPLIERS

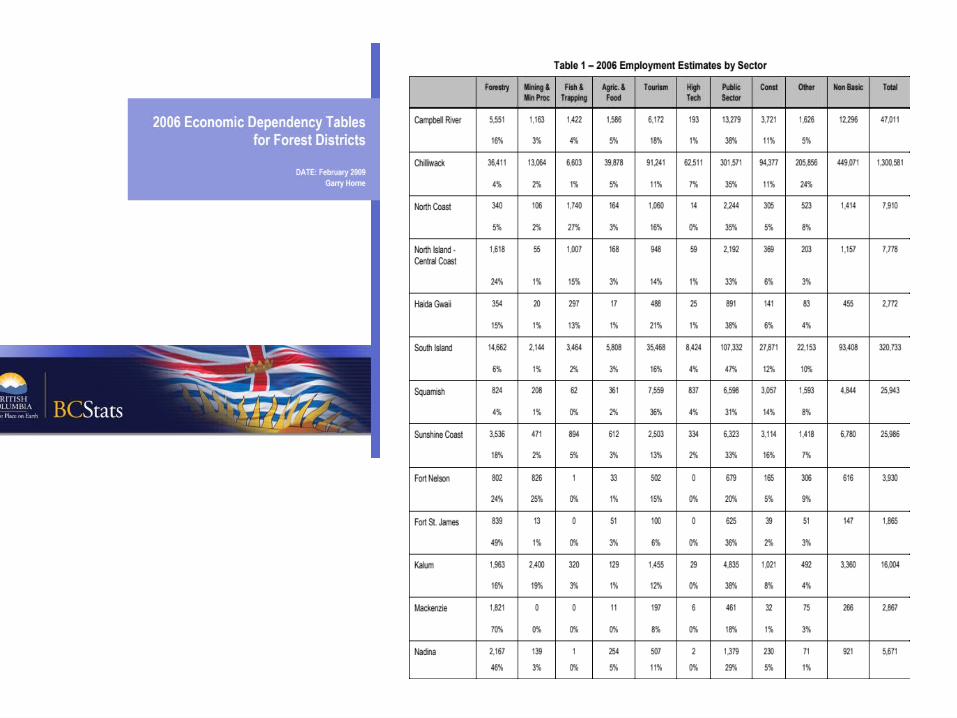
EXAMPLE (FROM HORNE 2008)
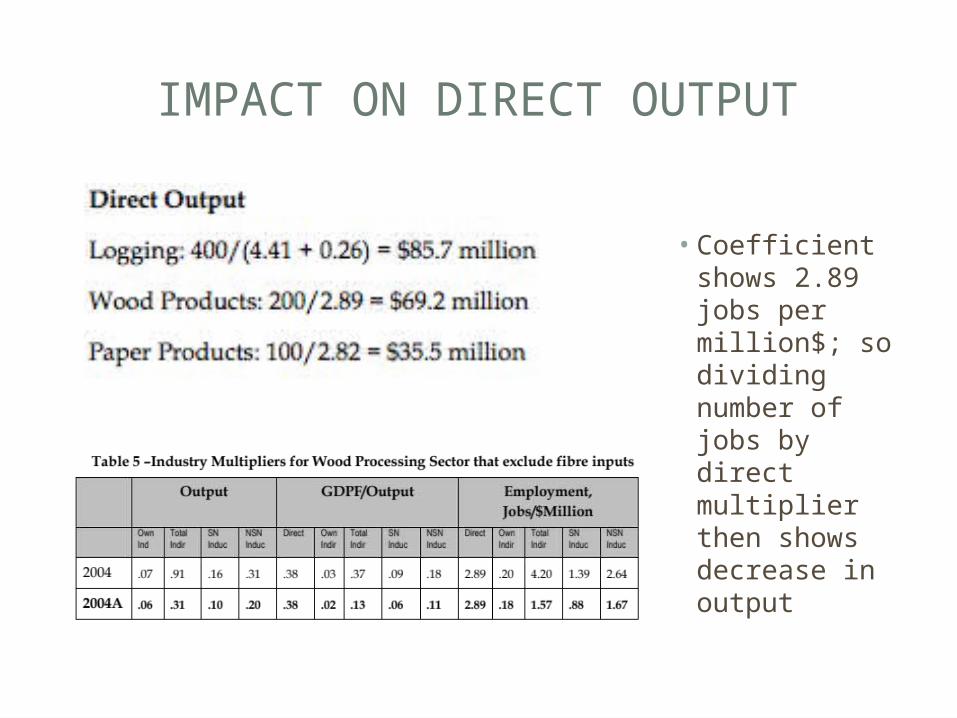
IMPACT ON DIRECT OUTPUT
• Coefficient shows 2.89 jobs per million$; so dividing number of jobs by direct multiplier then shows decrease in output
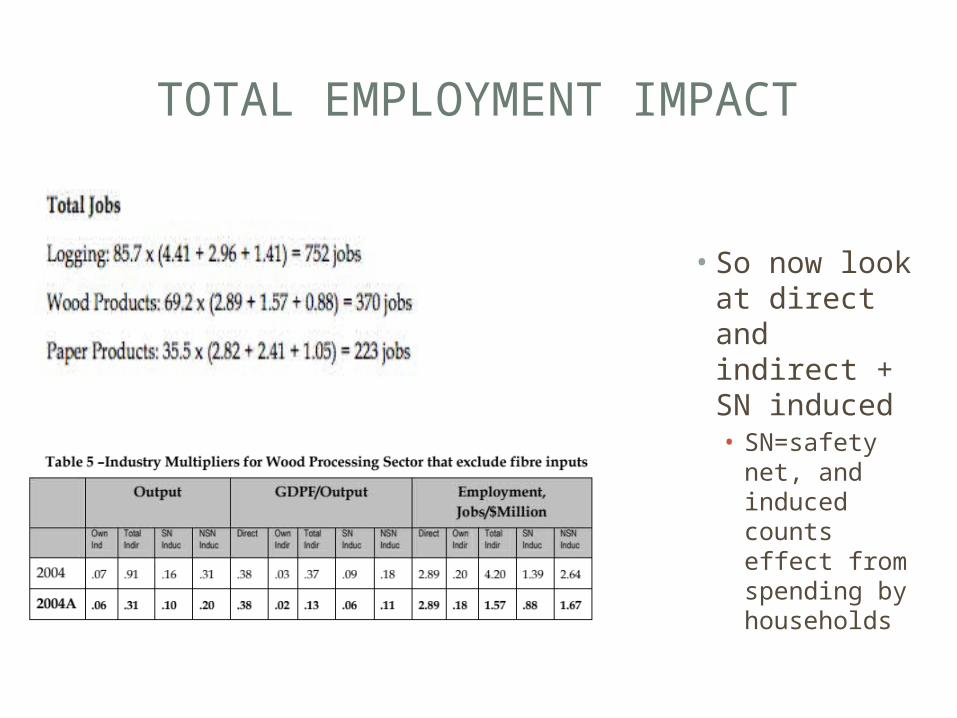
TOTAL EMPLOYMENT IMPACT
• So now look at direct and indirect + SN induced• SN=safety
net, and induced counts effect from spending by households

AND THEN EFFECT ON GDP…
• Again use direct and own indirect and induced• Note
that overall impact is summed up for all three sectors
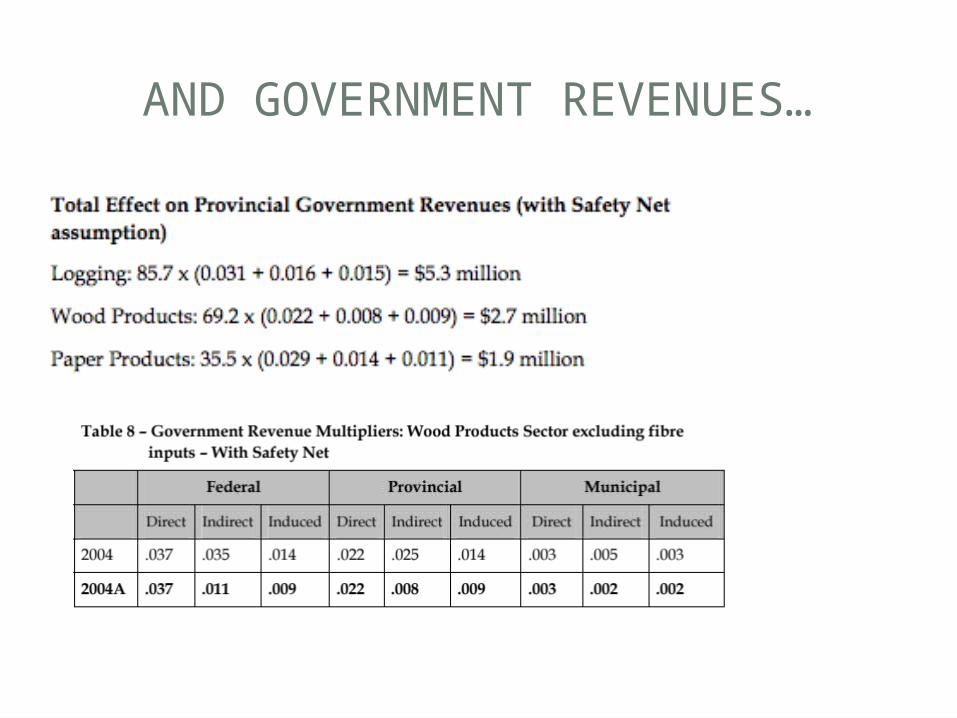
AND GOVERNMENT REVENUES…
IMPORTANT ASSUMPTIONS
• Perfectly elastic supply of inputs• All resources fully utilized (at capacity)• Quantities (technical coefficients) fixed• So Marginal equals average• Static, not dynamic
I/O APPLICATIONS TO CBA(OR UTILIZING ECONOMIC IMPACTS FROM INPUT-OUTPUT MODELS AND
OTHER SOURCES IN COST-BENEFIT ANALYSIS)
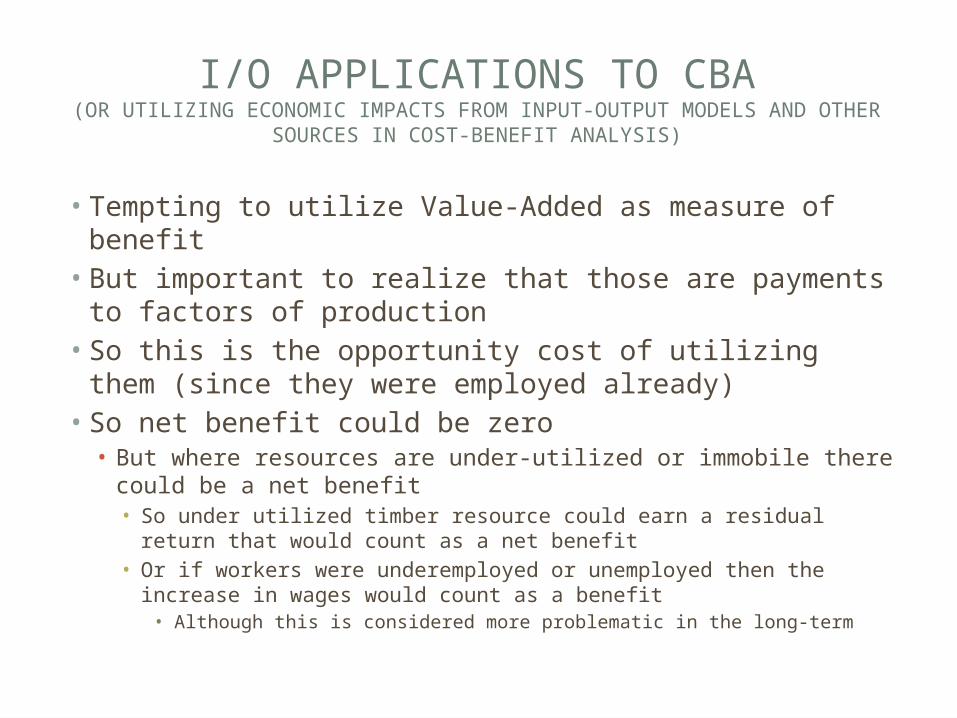
• Tempting to utilize Value-Added as measure of benefit• But important to realize that those are payments to
factors of production• So this is the opportunity cost of utilizing them (since
they were employed already)• So net benefit could be zero• But where resources are under-utilized or immobile there
could be a net benefit• So under utilized timber resource could earn a residual return that
would count as a net benefit• Or if workers were underemployed or unemployed then the
increase in wages would count as a benefit• Although this is considered more problematic in the long-term

ADDITIONAL FACTORS TO CONSIDER IN CBA
• Mobile resources (both workers and capital coming into region)• Economies of scale• Forward linkages aren’t quantified

FOREST DEPENDENT COMMUNITIES
Mill closures—permanent (total number of mills closed) and indefinite (total number of workers laid off) by province, between January 2003 and December 2009:•
• full mill closure jobs lost• Alberta 12 1 722• British Columbia 75 13 927• Manitoba 1 190• New Brunswick 17 3 211• Newfoundland 3 1 086• Nova Scotia 3 550• Ontario 52 10 855• PEI 1 36• Quebec 94 14 550• Saskatchewan 11 1 668• Total 269 47 795
But had recovered by 32,000 as of Fall 2012
http://www.fpac.ca/index.php/en/economic-backbone/

BROADER VIEW
• Emphasis on economic dependence ignores other aspects• Aboriginal
communities• Tourism not well-
represented
From Beckley 2008