maret 15, 2018miraesolo.com/wp-content/uploads/2018/03/9774_1.pdfmenurut survei paket data kami...
TRANSCRIPT

Giovanni Dustin +62-21-515-1140 [email protected]
To subscribe to our Daily Focus, please contact us at [email protected]
Mirae Asset Sekuritas Indonesia
Embun Pagi
Maret 15, 2018
Telecommunication – Prices maintained, promos remained
March data package survey: Prices maintained, promos remained
Menurut survei paket data kami untuk bulan Maret, semua operator -
Telekomunikasi Indonesia (TLKM), Indosat (ISAT), dan XL Axiata (EXCL) -
mempertahankan harga mereka dari bulan Februari, namun paket murah (paket
Unlimited dan Yellow ISAT, dan Xtra Quota EXCL ) masih ada. Berdasarkan survei
kami, ISAT merubah Yellow package nya. Pertama, ISAT mengubah harga headline
Yellow package (dari IDR2,500 menjadi IDR3,000 dan dari IDR7,000 menjadi
IDR6,000). Selain itu, semua masa aktif Yellow package berubah menjadi satu hari.
Oleh karena itu, walaupun pada dasarnya ini memotong data yield, biaya
langganan 30 hari akan meningkat secara signifikan. Mengingat rata-rata
konsumsi data/pelanggan ISAT hanya 1GB/bulan, kuota 30GB/bulan nampaknya
terlalu besar. Dengan demikian, kami percaya bahwa implied data yield (data yang
benar-benar digunakan/harga paket) lebih tinggi daripada effective data yield
(total semua kuota yang bisa dipakai/harga paket). Kedua, ISAT menambahkan
bonus panggilan dan SMS on-net tak terbatas dan sistem perpanjangan otomatis,
untuk Yellow package IDR3,000, dan panggilan telepon dan SMS on-net tak
terbatas , 100 menit voice call off-net, 100 SMS off-net, dan sistem perpanjangan
otomatis untuk Yellow package IDR6,000. Kami percaya bahwa penambahan
sistem perpanjangan otomatis membuat Yellow package lebih menarik untuk
pelanggan high-value yang menghindari Yellow package di masa lalu karena
ketidaknyamanan. Dengan demikian, kita melihat risiko kanibalisasi yang lebih
tinggi di antara produk ISAT.
Operators to stay aggressive until the hard deadline of SIM registration
Operator tetap agresif melewati tenggat waktu pendaftaran kartu SIM prabayar di
28 Februari. Kami pikir persaingan tidak akan mereda sebelum batas waktu
pendaftaran terakhir (yaitu saat pendaftaran ditutup) pada tanggal 1 Mei.
Berdasarkan informasi dari Bisnis Indonesia, 305mn nomor terdaftar (81% dari
376mn) per tanggal 28 Februari. Telkomsel memiliki jumlah 143 juta yang
terdaftar (75% dari total pelanggan), ISAT memiliki 101 juta (91%), dan EXCL
memiliki 43 juta (80%), sebesar 287 juta (c.86% dari jumlah pelanggan prabayar
mereka sebanyak 3Q17 ). Karena angka-angka ini tidak final (pelanggan masih bisa
mendaftar sampai 1 Mei), menurut kami nomor terdaftar akan terus naik. Pada
tanggal 11 maret, 341.6mn terdaftar (+12% sejak 28 Februari). Kami percaya
bahwa mayoritas nomor yang belum mendaftar berasal dari Telkomsel, karena
Telkomsel menguasai sekitar 75% pangsa pasar Ex-Java. Pandangan kami
didasarkan pada keyakinan kami bahwa pasar Ex-Java relatif kurang mendapat
informasi tentang proses registrasi. Oleh karena itu, saat tahap pemblokiran
dimulai, pelanggan akan merasakan perubahan dan akhirnya mendaftar.
Reiterate Overweight; TLKM remains our preferred pick
Kami reiterate Overweight call kami di sektor telco, meskipun kami menyadari
risiko kompetisi yang meningkat. Telekomunikasi Indonesia (TLKM/Buy/TP:
IDR5,000) tetap menjadi top pick kami, karena lanskap persaingan akan
menguntungkan incumbent di 2H18. Risiko utama untuk call kami meliputi 1)
persaingan yang lebih kuat dari perkiraan; 2) perubahan regulasi secara mendadak;
dan 3) monetisasi data lebih lambat dari perkiraan.
Market Index
Last Trade Chg (%) MoM YoY
JCI 6,382.6 -0.5 -2.7 18.0
MSCI Indonesia 27.9 -0.6 -6.4 11.1
MSCI EM 1,218.7 -0.4 1.8 29.7
HANG SENG 31,435.0 -0.5 1.6 32.8
KOSPI 2,486.1 -0.3 2.7 16.6
FTSE 7,132.7 -0.1 -1.3 -3.1
DJIA 24,758.1 -1.0 -0.8 19.4
NASDAQ 7,496.8 -0.2 3.5 27.3
Valuation
2018F P/E (x) P/B (x) ROE (%)
JCI 16.3 2.5 17.7
Key Rates
Last Trade Chg (bps) MoM YoY
BI 7-Day RR 4.25 0 0 -100
3yr 6.12 -9 32 -91
10yr 6.69 -8 26 -69
FX
Last Trade Chg (%) MoM YoY
USD/IDR 13,734.00 -0.1 0.9 2.9
USD/KRW 1,064.55 -0.3 -1.2 -6.9
USD/JPY 106.32 -0.2 0.2 -6.2
USD/CNY 6.32 -0.1 -0.3 -8.6
Commodities
Last Trade Chg (%) MoM YoY
WTI 61.0 0.4 -0.6 16.3
Gold 1,324.9 -0.1 -2.1 8.6
Coal 97.7 -0.3 -6.4 20.8
Palm Oil 2,441.0 1.3 -2.6 -19.2
Rubber 132.4 0.1 4.7 -29.0
Nickel 13,835.0 -0.3 -1.9 35.6
Copper 6,945.0 0.5 -3.0 19.3
Tin 21,150.0 0.0 -1.8 6.0
JCI Index VS MSCI Emerging Markets
850
1,150
1,450
5,000
6,000
7,000
01/17 04/17 07/17 10/17 01/18
JCI MSCI EM(pt)
(pt)
650
800
950
1,100
3,500
4,500
5,500
04/13 01/14 10/14 07/15 04/16
(pt) JCI MSCI EM (pt)

Maret 15, 2018
2
Embun Pagi
Mirae Asset Sekuritas Indonesia
Local flashes
AKRA: AKR Corporindo amankan kebutuhan dana 2018. PT AKR Corporindo Tbk
(AKRA) tak pusing lagi memikirkan sumber pendanaan tahun ini. Perusahaan sudah
mengamankan kas triliunan dari divestasi asetnya di China."Sudah ada cukup kas dari
divestasi, tak perlu lagi merilis obligasi," ujar Direktur AKRA Suresh Vembu kepada
KONTAN, Rabu (14/3). Awal bulan ini, AKRA menjual aset milik anak usahanya,
Khalista Chemical Industries Ltd melalui proses lelang. Aset itu berupa tanah seluas
99.267 meter persegi (m2). Nilai penjualannya mencapai RMB 1,83 miliar atau setara
Rp 3,56 triliun. (Kontan)
TLKM: Telkom masih fokus pada bisnis digital. PT Telekomunikasi Indonesia Tbk
(TLKM) alias Telkom membidik kinerja tahun ini bisa lebih baik daripada tahun
sebelumnya. Hal ini didasari pencapaian tahun 2017, di mana perusahaan membukukan
pendapatan naik 10,25% dan laba bersih naik 14,43%. Arif Prabowo, Vice President
Corporate Communication TLKM menyatakan, perusahaan masih akan fokus pada
bisnis digital. Perusahaan masih melihat peluang yang besar pada sektor tersebut.
Untuk itu, segala strategi maupun langkah TLKM ke depan, akan mengarah pada
bermacam-macam perkembangan dan peluang bisnis digital. (kontan)
BWPT: Grup Rajawali bantah kabar divestasi Eagle High. Grup Rajawali diisukan
kembali akan melepas sisa kepemilikannya dalam PT Eagle High Plantations Tbk
(BWPT). Namun, manajemen menampik kabar tersebut. Satrio Tjai, Direktur Rajawali
Corpora menampik kabar penjualan tersebut. "Itu hanya rumor," ujarnya saat
dikonfirmasi oleh KONTAN, Rabu (14/3). Seperti diketahui, ada rumor yang menyebut
kepanjangan tangan Grup Rajawali, yakni, PT Rajawali Capital akan melepas 11,86
miliar atau setara 37,64% saham BWPT. Jumlah saham itu yang kabarnya bakal dilepas
kepada dua calon investor strategis.(Kontan)
PTPP: PTPP anggarkan capex 2018 sebesar Rp 15 triliun. PT Pembangunan
Perumahan Tbk (PTPP) pada tahun ini menganggarkan belanja modal alias capital
expenditure (capex) sekitar Rp 15 triliun. Anggaran capex tahun ini naik dibandingkan
tahun lalu sebesar Rp 7 triliun. “Porsi Rp 15 triliun itu tersebar untuk induk dan anak
perusahaan. Kami telah mengambil langkah-langkah untuk menyiapkan capex tersebut,”
kata Lukman Hidayat Direktur Utama PT Pembangunan Perumahan di Jakarta, Rabu
(14/3).(Kontan)
ISAT: Indosat targetkan pertumbuhan konservatif pada 2018. Lantaran tak
melakukan ekspansi secara agresif tahun ini, PT Indosat Tbk (ISAT) menargetkan
pertumbuhan yang cenderung konservatif pada 2018. Tahun ini, ISAT menargetkan
pertumbuhan pendapatan di kisaran low single digit. "Target kami tahun ini bisa
tumbuh sekitar 0%-5%," ujar Direktur Utama ISAT Joy Wahyudi kepada Kontan.co.id di
Jakarta, Rabu (14/3). Tak heran, Indosat memasang target yang tergolong rendah.
Pasalnya, tahun ini, perusahaan hanya memiliki dua rencana ekspansi. Rencana
pertama, memperluas jaringan LTE ke empat wilayah di Sumatra, Kalimantan, dan
Sulawesi.(Kontan)
PGAS: Laba PGN terus tergerus karena FSRU Lampung dan Saka Energi. PT
Perusahaan Gas Negara Tbk (PGN) tercatat mengalami penurunan kinerja keuangan
dalam lima tahun terakhir. Berdasarkan data dari Komisi VI DPR RI tercatat laba usaha
dan laba bersih PGN dalam lima tahun berturut-turut turun selama tahun 2012 hingga
2017. Padahal menurut Anggota Komisi VI DPR RI, Rieke Diah Pitaloka, PGN masih bisa
mencatatkan pertumbuhan pendapatan dan penyaluran gas. Begitu pula dengan aset
PGN yang meningkat dalam periode 2012 hingga 2016. Menurut Rieke dalam jawaban
tertulis Direksi PGN, sejak selesai dibangun 2014, FSRU Lampung beroperasi tidak
maksimal sesuai rencana. Makanya PGN terus harus membayar sewa sebesar lebih dari
US$ 90 juta. (Kontan)

Maret 15, 2018
3
Embun Pagi
Mirae Asset Sekuritas Indonesia
Technical analysis
Tasrul +62-21-515-1140 [email protected]
Jakarta Composite Index (JCI) – Limited Downside
IHSG akan coba bertahan diatas abnormal lower band pada uptrend channel.
IHSG saat masih dalam pola uptrend yang relatif valid yang dimulai sejak 131 hari
terakhir dengan r-squared = 0.8662 dan bergerak normal dalam rentang +/-1.50
std.deviasi dari centerline. Peluang IHSG bergerak di luar pergerakan normal sekitar
13.38% atau sekitar 17 bar chart. Rata-rata volatilitas normal pergerakan IHSG saat ini
sebesar antara +0.37% / - 0.43 % atau +23.62 point / -27.45 point (rata-rata pergerakan
normal positif / negatif selama periode analisis) sebagaimana terlihat pada Figure 1.
Summary
Item Data Item Data
Close (March 14, 2017) 6,383 (-0.47%) Trading range 6,359 - 6,410
Average index performance (%) 2.07 Target
Period 131 - Daily 6,410
r-squared 0.8662 - Weekly 6,482
Volatility (+/-, %) +0.37 / -0.43 - Monthly 6,626
Volatility (+/-, point) +23.62 / -27.45 Stop loss 6,359
Source: Mirae Asset Sekuritas Indonesia Research
Figure 1. Daily trend – Uptrend
Source: Mirae Asset Sekuritas Indonesia Research
Created with AmiBroker - adv anced charting and technical analy sis sof tware. http://www.amibroker.com
_____ 6,410.2
_____ 6,359.1
Optimization Trading System - ©2010 Optimization Trading System - ©2010
^JKSE [ ^JKSE ] - Daily - 3/14/2018 Open: 6,411 High: 6,413 Low: 6,364 Close: 6,383 Chg. -0.5% Vol. 8,656,034,816
Prev . Av g. Price: 6,386.3
R-Squared: 0.8662
Period: 131
Std.Dev : 1.50
Volatility (+) : 0.0037
Volatility (-) : -0.0043
V-Ratio : 0.88
6,382.62
6,363.63
6,439.17
6,630.54
6,630.54
6,821.92
6,897.46
Sep Oct Nov Dec 2018 Feb Mar
^JKSE - Volume = 8,656,034,816.00, EMA(Volume,18) = 9,195,657,216.00
8,656,034,816
9,195,657,216

Maret 15, 2018
4
Embun Pagi
Mirae Asset Sekuritas Indonesia
Aliran dana keluar dan volatilitas pergerakkan indeks turun masih terlihat namun
mulai terbatas.
Pada Figure 2, terlihat dari hasil optimalisasi terakhir pada periode daily, potensi koreksi
masih terlihat. Indikator W%R optimized akan menguji support trendline. Pada Bollinger
Band optimized harga akan coba naik diatas BBBottom. Sementara itu pada Figure 3
pada periode weekly ,indikator MFI optimized, stochastic %D optimized dan indikator
W%R optimized masih akan menguji support trend line , Daily resistance di 6,410 dan
daily support di 6,359. Cut loss level di 6,358.
Figure 2. Daily MFI optimized,W%R optimized & Bollinger Band optimized
Source: Mirae Asset Sekuritas Indonesia Research
Created with AmiBroker - adv anced charting and technical analy sis sof tware. http://www.amibroker.com
^JKSE - MFI Smoothed = 40.98
40.9787
^JKSE - Will%R Smoothed = -70.86
-70.8614
^JKSE - Daily 3/14/2018 Open 6410.89, Hi 6412.75, Lo 6363.63, Close 6382.62 (-0.5%) BBTop(Close,20,1.5) = 6,683.07, BBBot(Close,20,1.5) = 6,407.82, EMA(Av erage,18)
6,382.62
6,503.87
^JKSE [ ^JKSE ] - Daily - 3/14/2018 Open: 6,411 High: 6,413 Low: 6,364 Close: 6,383 Vol. 8,656,034,816
Prev . Av g. Price: 6,386.3
R-Squared: 0.8662
Period: 131
Std.Dev : 1.50
Volatility (+) : 0.0037
Volatility (-) : -0.0043
V-Ratio : 0.88
Chg.: -0.47%
6,382.62
May Jun Jul Aug Sep Oct Nov Dec 2018 Feb Mar
^JKSE - Volume = 8,656,034,816.00, EMA(Volume,18) = 9,195,657,216.00
8,656,034,816
9,195,657,216

Maret 15, 2018
5
Embun Pagi
Mirae Asset Sekuritas Indonesia
Figure 3. Weekly Trend – Uptrend, MFI optimized,W%R optimized , Stochastic %D & Bollinger Band optimized
Source: Mirae Asset Sekuritas Indonesia Research
IHSG akan coba naik dan bertahan diatas level 6,386
Terlihat pada pergerakkan daily, rata-rata koreksi normal selama periode analisis adalah
sekitar +0.43%, saat ini di -0.47%. Sementara itu pada pergerakkan weekly potensi
koreksi normal rata-rata sekitar -0.9%, sementara saat ini di level -0.79% dan telah
masuk minggu minggu ke tiga. Dengan demikian potensi koreksi makin terbatas. Pada
Figure 4,5 dan 6 terlihat perkiraan normal trading range untuk masing-masing periode.
Figure 4. Daily : 6,359 – 6,410 Figure 5. Weekly : 6,358– 6,482 Figure 6. Monthly : 6,317– 6,626
x
x
Source: Mirae Asset Sekuritas Indonesia Research
Source: Mirae Asset Sekuritas Indonesia Research
Source: Mirae Asset Sekuritas Indonesia Research
Created with AmiBroker - adv anced charting and technical analy sis sof tware. http://www.amibroker.com
^JKSE - MFI Smoothed = 24.73
24.7261
^JKSE - Will%R Smoothed = -49.18
-49.1798
^JKSE - Stochastic %D = 71.48, MA = 76.40
71.4818
76.3994
^JKSE - Weekly 3/14/2018 Open 6459.32, Hi 6501.13, Lo 6363.63, Close 6382.62 (-0.8%) BBTop(Av erage,9,1.86) = 6,681.45, BBBot(Av erage,9,1.86) = 6,397.38, EMA(Av erage,9)
6,382.62
6,476.41
Optimization Trading System - ©2010
_____ 6,482.5_____ 6,357.9
^JKSE [ ^JKSE ] - Weekly - 3/14/2018 Open: 6,459 High: 6,501 Low: 6,364 Close: 6,383 Vol. 24,594,599,936
Prev . Av g. Price: 6,415.8
R-Squared: 0.9362
Period: 70
Std.Dev : 1.86
Volatility (+) : 0.0104
Volatility (-) : -0.0090
V-Ratio : 1.15
Chg.: -0.79%
6,689.32
6,491.55
6,382.62
6,293.77
Apr Jul Oct 2017 Apr Jul Oct 2018
^JKSE - Volume = 24,594,599,936.00, EMA(Volume,10) = 40,457,764,864.00
24,594,599,936
40,457,764,864
Created with AmiBroker - adv anced charting and technical analy sis sof tware. http://www.amibroker.com
_____ 6,410.2
_____ 6,359.16,386.3
^JKSE [ ^JKSE ] - Daily - 3/14/2018 Open: 6,411
Prev . Av g. Price: 6,386.3
R-Squared: 0.8662
Period: 131
Std.Dev : 1.50
Volatility (+) : 0.0037
Volatility (-) : -0.0043
V-Ratio : 0.88
Chg.: -0.47%
6,382.62
26 Mar 12
^JKSE - Volume = 8,656,034,816.00
8,656,034,816
Created with AmiBroker - adv anced charting and technical analy sis sof tware. http://www.amibroker.com
_____ 6,482.5
_____ 6,357.9
^JKSE [ ^JKSE ] - Weekly - 3/14/2018 Open:
Prev . Av g. Price: 6,415.8
R-Squared: 0.9362
Period: 70
Std.Dev : 1.86
Volatility (+) : 0.0104
Volatility (-) : -0.0090
V-Ratio : 1.15
Chg.: -0.79%
6,382.62
Feb Mar
^JKSE - Volume = 24,594,599,936.00
24,594,599,936
Created with AmiBroker - adv anced charting and technical analy sis sof tware. http://www.amibroker.com
_____ 6,626.1
_____ 6,316.9
6,463.1
^JKSE [ ^JKSE ] - Monthly - 3/14/2018 Open:
Prev . Av g. Price: 6,453.1
R-Squared: 0.9574
Period: 31
Std.Dev : 2.03
Volatility (+) : 0.0268
Volatility (-) : -0.0211
V-Ratio : 1.27
Chg.: -3.25%
6,382.62
Jul Oct 2018
^JKSE - Volume = 84,943,085,568.00
84,943,085,568

Maret 15, 2018
6
Embun Pagi
Mirae Asset Sekuritas Indonesia
Stocks on our focus list
Medco Energy (MEDC)- Daily, Buy on Weakness
Harga akan coba bertahan diatas normal lower band pada uptrend channel.
Secara umum harga saham ini masih bergerak pada uptrend channel yang masih
relatif valid (r-squared = 0.901) selama 100 hari terakhir yang bergerak normal dalam
rentang +/- 1.65 std.deviasi dari center line. Peluang harga keluar dari pergerakan
normal sekitar 9.95 % (sekitar 100 bar chart ). Rata-rata volatilitas normal pergerakan
harga saat ini sebesar antara +2.6 / -2.05 % atau +34.97 rupiah / -27.57 rupiah (rata-
rata pergerakan normal positif / negatif, selama periode analisis) sebagaimana terlihat
pada Figure 7.
Summary
Item Data Item Data
Close (March 14, 2017) 1,345 (-2.88%) Trading range 1,320 - 1,380
0Relative Avg. Price performance to JCI (%) 40.91 Target
β (beta) 1.35 - Daily 1,380
Corelation 0.92 - Weekly 1,460
Period 100 - Monthly 1,725
r-squared 0.901 Stop loss 1,275
Volatility (+/-, %) +2.6 / -2.05
Volatility (+/-, Rp.) +34.97/ -27.57
Source: Mirae Asset Sekuritas Indonesia Research
Figure 7.Daily trend – Uptrend
Source: Mirae Asset Sekuritas Indonesia Research
Created with AmiBroker - adv anced charting and technical analy sis sof tware. http://www.amibroker.com
_____ 1,380.7
_____ 1,317.5
Optimization Trading System - ©2010 Optimization Trading System - ©2010 Optimization Trading System - ©2010
Medco Energi International Tbk [ MEDC.JK ] - Daily - 3/14/2018 Open: 1,380 High: 1,385 Low: 1,305 Close: 1,345 Vol. 41,460,400
Prev . Av g. Price: 1,345.0
R-Squared: 0.9006
Period: 100
Std.Dev : 1.65
Volatility (+) : 0.0266
Volatility (-) : -0.0205
V-Ratio : 1.30
Chg.: -2.888% 1,345
1,326.32
1,288.84
1,376.65
1,467.16
1,467.16
1,608
1,645.47
Nov Dec 2018 Feb Mar
MEDC.JK - Volume = 41,460,400.00, EMA(Volume,23) = 68,549,792.00
41,460,400
68,549,792

Maret 15, 2018
7
Embun Pagi
Mirae Asset Sekuritas Indonesia
Aliran dana masuk masih terlihat dan volatilitas harga turun mulai terbatas.
Pada Figure 8, terlihat dari hasil optimalisasi terakhir terlihat pada indikator MFI
optimized masi cenderung menguat, indikator W%R optimized dan indikator
Stochastic % akan menguji support trendline. Sementara itu harga pada indikator
Bollinger Band optimized akan coba berrtahan sekitar di atas BBBottom. Daily support
di 1,320 dan daily resistance di 1,460.Cut loss level di 1,275.
Figure 8. Daily, MFI optimized, W%R optimized, Stochastic %D & Bollinger Band optimized
Source: Mirae Asset Sekuritas Indonesia Research
Created with AmiBroker - adv anced charting and technical analy sis sof tware. http://www.amibroker.com
MEDC.JK - MFI Smoothed = 42.54
42.539
MEDC.JK - Will%R Smoothed = -76.54
-76.5367
MEDC.JK - Stochastic %D = 34.58, MA = 56.10
34.5833
56.0977
MEDC.JK - Daily 3/14/2018 Open 1380, Hi 1385, Lo 1305, Close 1345 (-2.9%) BBTop(Close,13,1.65) = 1,546.98, BBBot(Close,13,1.65) = 1,333.02, EMA(Av erage,13)
1,345
1,398.37
_____ 1,380.7_____ 1,317.5
Optimization Trading System - ©2010
Medco Energi International Tbk [ MEDC.JK ] - Daily - 3/14/2018 Open: 1,380 High: 1,385 Low: 1,305 Close: 1,345 Vol. 41,460,400
Prev . Av g. Price: 1,345.0
R-Squared: 0.9006
Period: 100
Std.Dev : 1.65
Volatility (+) : 0.0266
Volatility (-) : -0.0205
V-Ratio : 1.30
Chg.: -2.89%
1,345
1,376.65
Sep Oct Nov Dec 2018 Feb Mar
MEDC.JK - Volume = 41,460,400.00, EMA(Volume,13) = 64,472,396.00
41,460,400
64,472,396

Maret 15, 2018
8
Embun Pagi
Mirae Asset Sekuritas Indonesia
Harga akan coba naik dan bertahan diatas rata-rata pada masing-masing periode.
Untuk mampu naik lebih lanjut, harga saham saat ini harus mampu minimal bertahan
diatas rata-rata masing-masing periode (positive area). Pada pergerakkan daily harga
saat ini di level -2.89% , normal koreksi -2.05 %.Sementara itu pada pergerakkan
weekly harga di level -1.10.%, normal koreksi sekitar -4.74 % namun terlah memasuki
minggu ke tiga. Dengan demikian potensi koreksi makin terbatas. Pada Figure 9,10 dan
11 terlihat perkiraan normal trading range untuk masing-masing periode.
Figure 9. Daily : 1,320 – 1,380 Figure 10. Weekly : 1,300 – 1,460 Figure 11. Monthly : 1,270 –1,725
Source: Mirae Asset Sekuritas Indonesia Research
Source: Mirae Asset Sekuritas Indonesia Research
Source: Mirae Asset Sekuritas Indonesia Research
Created with AmiBroker - adv anced charting and technical analy sis sof tware. http://www.amibroker.com
_____ 1,380.7
_____ 1,317.5
1,345
Medco Energi International Tbk [ MEDC.JK
Prev . Av g. Price: 1,345.0
R-Squared: 0.9006
Period: 100
Std.Dev : 1.65
Volatility (+) : 0.0266
Volatility (-) : -0.0205
V-Ratio : 1.30
Chg.: -2.89%
1,345
26 Mar 12
MEDC.JK - Volume = 41,460,400.00
41,460,400
Created with AmiBroker - adv anced charting and technical analy sis sof tware. http://www.amibroker.com
_____ 1,462.1
_____ 1,297.1
1,361.7
Medco Energi International Tbk [ MEDC.JK
Prev . Av g. Price: 1,361.7
R-Squared: 0.8371
Period: 38
Std.Dev : 1.40
Volatility (+) : 0.0737
Volatility (-) : -0.0474
V-Ratio : 1.55
Chg.: -1.10%
1,345
Feb Mar
MEDC.JK - Volume = 155,540,096.00
155,540,096
Created with AmiBroker - adv anced charting and technical analy sis sof tware. http://www.amibroker.com
_____ 1,725.0
_____ 1,269.8
1,416.7
Medco Energi International Tbk [ MEDC.JK
Prev . Av g. Price: 1,416.7
R-Squared: 0.7497
Period: 30
Std.Dev : 1.14
Volatility (+) : 0.2176
Volatility (-) : -0.1037
V-Ratio : 2.10
Chg.: -14.60%
1,345
Jul Oct 2018
MEDC.JK - Volume = 613,045,120.00
613,045,120

Maret 15, 2018
9
Embun Pagi
Mirae Asset Sekuritas Indonesia
Bumi Resources Mineral (BRMS) - Daily , Trading Buy
Harga akan coba bertahan diatas center line pada uptrend channel.
Secara umum harga saham ini juga masih bergerak dalam pola uptrend channel yang
masih relatif valid (r-squared = 0.822) selama 117 hari terakhir dan bergerak normal
dalam rentang +/- 1.35 std.deviasi dari center line. Peluang harga keluar dari
pergerakan normal sekitar 17.8% (sekitar 20 bar chart ). Rata-rata volatilitas normal
pergerakan harga saat ini sebesar antara +3.8 / -2.56% atau +3.27rupiah / - 2.20 rupiah
(rata-rata pergerakan normal positif / negatif, selama periode analisis) sebagaimana
sebagaimana terlihat pada Figure 12.
Summary
Item Data Item Data
Close (March 14, 2017) 86 (+2.38%) Trading range 86 - 90
Relative Avg. Price performance to JCI (%) 6.18 Target
β (beta) 0.70 - Daily 90
Corelation 0.90 - Weekly 92
Period 117 - Monthly 104
r-squared 0.822 Stop loss 82
Volatility (+/-, %) +3.8 / -2.56
Volatility (+/-, Rp.) +3.27/ -2.20
Source: Mirae Asset Sekuritas Indonesia Research
Figure 12. Daily trend – Uptrend
Source: Mirae Asset Sekuritas Indonesia Research
Created with AmiBroker - adv anced charting and technical analy sis sof tware. http://www.amibroker.com
_____ 88.9
_____ 83.5
Optimization Trading System - ©2010 - Powered by AMTA Optimization Trading System - ©2010 - Powered by AMTA Optimization Trading System - ©2010 - Powered by AMTA
Bumi Resources M [ BRMS.JK ] - Daily - 3/14/2018 Open: 84 High: 88 Low: 83 Close: 86 Vol. 297,174,208
Prev . Av g. Price: 85.7
R-Squared: 0.8222
Period: 117
Std.Dev : 1.35
Volatility (+) : 0.0380
Volatility (-) : -0.0256
V-Ratio : 1.48
Chg.: 2.38% 86
81.7497
78.5659
89.7185
89.7185
91.4061
97.6873
100.871
Oct Nov Dec 2018 Feb Mar
BRMS.JK - Volume = 297,174,208.00, EMA(Volume,18) = 400,651,520.00
297,174,208
400,651,520

Maret 15, 2018
10
Embun Pagi
Mirae Asset Sekuritas Indonesia
Aliran dana masuk dan volatilitas harga naik masih terlihat.
Pada Figure 13, terlihat dari hasil optimalisasi indikator MFI optimized,indikator W%R
optimized dan indikator stochastic %D cenderung naik. Disisi lain pada indikator
Bollinger Band optimized harga akan coba mendekati center line. Weekly resistance
di 92 dengan catatan daily resistance 90 dapat ditembus. Sementara itu daily dan
weekly support di 86 dan 82. Cut loss level di 82.
Figure 13. Daily, MFI optimized , W%R optimized, Stochastic %D & Bollinger Band optimized
Source: Mirae Asset Sekuritas Indonesia Research
Created with AmiBroker - adv anced charting and technical analy sis sof tware. http://www.amibroker.com
BRMS.JK - MFI Smoothed = 46.83
46.8287
BRMS.JK - Will%R Smoothed = -68.42
-68.4162
BRMS.JK - Stochastic %D = 35.09, MA = 30.26
35.0877
30.2605
BRMS.JK - Daily 3/14/2018 Open 84, Hi 88, Lo 83, Close 86 (2.4%) BBTop(Close,18,1.35) = 94.59, BBBot(Close,18,1.35) = 81.96, EMA(Av erage,18) = 87.13
86
87.1301
_____ 89.3
_____ 83.6
Optimization Trading System - ©2010
Bumi Resources M [ BRMS.JK ] - Daily - 3/14/2018 Open: 84 High: 88 Low: 83 Close: 86 Vol. 297,174,208
Prev . Av g. Price: 85.7
R-Squared: 0.8222
Period: 117
Std.Dev : 1.35
Volatility (+) : 0.0422
Volatility (-) : -0.0240
V-Ratio : 1.76
Chg.: 2.38%
86
91.4061
Oct Nov Dec 2018 Feb Mar
BRMS.JK - Volume = 297,174,208.00, EMA(Volume,18) = 400,651,520.00
297,174,208
400,651,520

Maret 15, 2018
11
Embun Pagi
Mirae Asset Sekuritas Indonesia
Harga saat ini akan coba naik dan bertahan diatas rata-rata pada masing-masing
periode.
Untuk mampu naik lebih lanjut, harga saham saat ini harus mampu minimal bertahan
diatas rata-rata masing-masing periode (positive area) . Lebih lanjut potensi kenaikkan
normal harga pada pergerakkan daily sekitar +4.17%, saat ini di level 2.38%. Sementara
itu pada pergerakkan weekly kenaikkan normal sekitar +8.7 % saat ini harga di level
+3.61%. Dengan demikian potensi kenaikkan masih terlihat . Pada Figure 14,15 dan 16
terlihat perkiraan normal trading range untuk masing-masing periode.
Figure 14. Daily : 86– 90 Figure 15. Weekly : 82 – 92 Figure 16. Monthly : 78 – 104
x
Source: Mirae Asset Sekuritas Indonesia Research
Source: Mirae Asset Sekuritas Indonesia Research
Source: Mirae Asset Sekuritas Indonesia Research
Created with AmiBroker - adv anced charting and technical analy sis sof tware. http://www.amibroker.com
_____ 89.2
_____ 83.5
91.7
85.7
Bumi Resources M [ BRMS.JK ] - Daily - 3/14/2018
Prev . Av g. Price: 85.7
R-Squared: 0.8222
Period: 117
Std.Dev : 1.35
Volatility (+) : 0.0417
Volatility (-) : -0.0250
V-Ratio : 1.67
Chg.: 2.38%
86
26 Mar 12
BRMS.JK - Volume = 297,174,208.00
297,174,208
Created with AmiBroker - adv anced charting and technical analy sis sof tware. http://www.amibroker.com
_____ 92.8
_____ 81.785.3
Bumi Resources M [ BRMS.JK ] - Weekly -
Prev . Av g. Price: 85.3
R-Squared: 0.7331
Period: 30
Std.Dev : 1.11
Volatility (+) : 0.0870
Volatility (-) : -0.0425
V-Ratio : 2.05
Chg.: 3.61%
86
Dec 2018 Mar
BRMS.JK - Volume = 530,133,408.00
530,133,408
Created with AmiBroker - adv anced charting and technical analy sis sof tware. http://www.amibroker.com
_____ 104.4
_____ 78.3
89.7
Bumi Resources M [ BRMS.JK ] - Monthly
Prev . Av g. Price: 89.7
R-Squared: 0.7994
Period: 86
Std.Dev : 1.28
Volatility (+) : 0.1642
Volatility (-) : -0.1263
V-Ratio : 1.30
Chg.: -11.34%
86
Jul Oct 2018
BRMS.JK - Volume = 3,374,006,272.00
3,374,006,272
Maret 15, 2018
12
Embun Pagi
Mirae Asset Sekuritas Indonesia
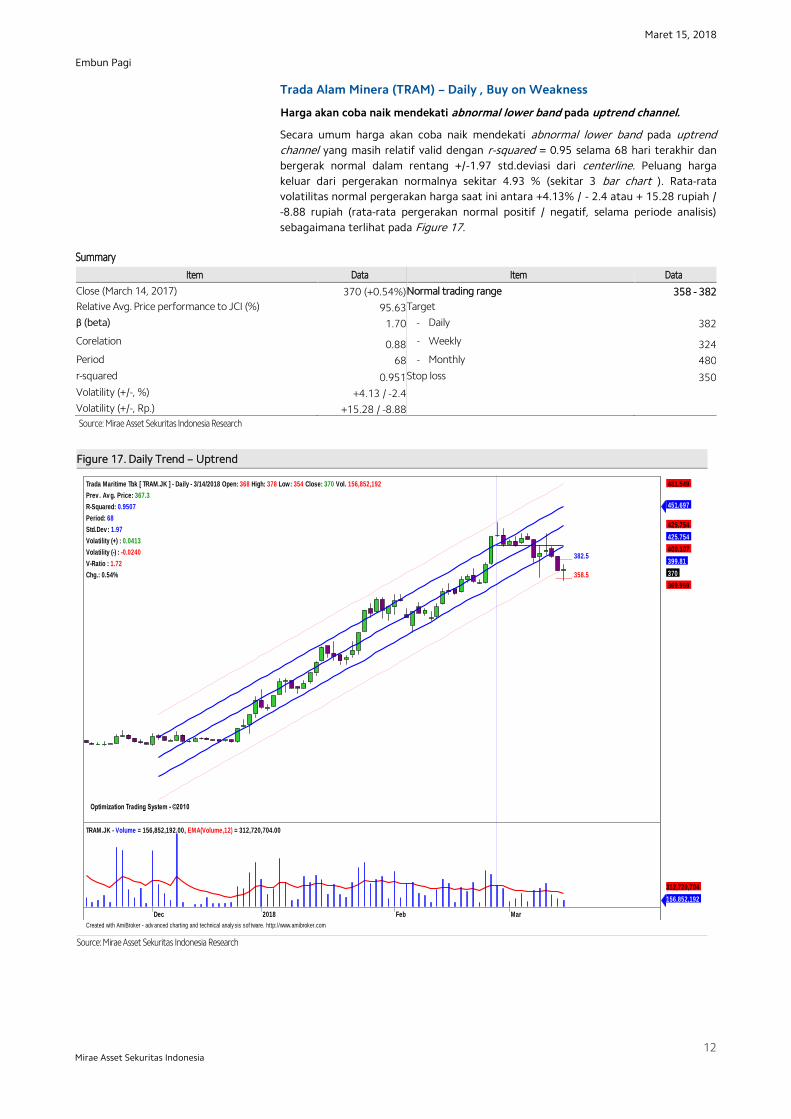
Trada Alam Minera (TRAM) – Daily , Buy on Weakness
Harga akan coba naik mendekati abnormal lower band pada uptrend channel.
Secara umum harga akan coba naik mendekati abnormal lower band pada uptrend
channel yang masih relatif valid dengan r-squared = 0.95 selama 68 hari terakhir dan
bergerak normal dalam rentang +/-1.97 std.deviasi dari centerline. Peluang harga
keluar dari pergerakan normalnya sekitar 4.93 % (sekitar 3 bar chart ). Rata-rata
volatilitas normal pergerakan harga saat ini antara +4.13% / - 2.4 atau + 15.28 rupiah /
-8.88 rupiah (rata-rata pergerakan normal positif / negatif, selama periode analisis)
sebagaimana terlihat pada Figure 17.
Summary
Item Data Item Data
Close (March 14, 2017) 370 (+0.54%) Normal trading range 358 - 382
Relative Avg. Price performance to JCI (%) 95.63 Target
β (beta) 1.70 - Daily 382
Corelation 0.88 - Weekly 324
Period 68 - Monthly 480
r-squared 0.951 Stop loss 350
Volatility (+/-, %) +4.13 / -2.4
Volatility (+/-, Rp.) +15.28 / -8.88
Source: Mirae Asset Sekuritas Indonesia Research
Figure 17. Daily Trend – Uptrend
Source: Mirae Asset Sekuritas Indonesia Research
Created with AmiBroker - adv anced charting and technical analy sis sof tware. http://www.amibroker.com
Optimization Trading System - ©2010 Optimization Trading System - ©2010
_____ 382.5
_____ 358.5
Optimization Trading System - ©2010
Trada Maritime Tbk [ TRAM.JK ] - Daily - 3/14/2018 Open: 368 High: 378 Low: 354 Close: 370 Vol. 156,852,192
Prev . Av g. Price: 367.3
R-Squared: 0.9507
Period: 68
Std.Dev : 1.97
Volatility (+) : 0.0413
Volatility (-) : -0.0240
V-Ratio : 1.72
Chg.: 0.54%
451.697
425.754
425.754
400.107
399.81
370
369.959
481.549
Dec 2018 Feb Mar
TRAM.JK - Volume = 156,852,192.00, EMA(Volume,12) = 312,720,704.00
156,852,192
312,720,704

Maret 15, 2018
13
Embun Pagi
Mirae Asset Sekuritas Indonesia
Aliran dana masuk dan volatilitas harga naik masih terlihat.
Pada Figure 18, terlihat dari hasil optimalisasi, indikator W%R optimized dan indikator
Stochastic %D optimized sudah berada di support trendline. Pada indikator Bollinger
Band optimized harga akan coba bertahan diatas BBBottom.. Dengan demikian
diperkirakan potensi koreksi mulai tertahan. Perkiraan daily dan weekly resistance di 382
dan 424. Daily support dan weekly support di 358 dan 350. Cut loss level di 350.
Figure 18. Daily ,MFI optimized, RSI optimized, Stochastic %D & Bollinger Band optimized
Source: Mirae Asset Sekuritas Indonesia Research
Created with AmiBroker - adv anced charting and technical analy sis sof tware. http://www.amibroker.com
TRAM.JK - MFI Smoothed = 18.16
18.1627
TRAM.JK - Will%R Smoothed = -66.32
-66.3168
TRAM.JK - Stochastic %D = 38.46, MA = 52.24
38.4615
52.241
TRAM.JK - Daily 3/14/2018 Open 368, Hi 378, Lo 354, Close 370 (0.5%) BBTop(Av erage,12,1.78) = 424.28, BBBot(Av erage,12,1.78) = 369.72, EMA(Av erage,12) =
370
384.191
_____ 382.8_____ 358.7
Trada Maritime Tbk [ TRAM.JK ] - Daily - 3/14/2018 Open: 368 High: 378 Low: 354 Close: 370 Vol. 156,852,192
Prev . Av g. Price: 367.3
R-Squared: 0.9507
Period: 68
Std.Dev :
Volatility (+) : 0.0421
Volatility (-) : -0.0236
V-Ratio : 1.78
Chg.: 0.5%
370
Oct Nov Dec 2018 Feb Mar
TRAM.JK - Volume = 156,852,192.00, EMA(Volume,12) = 312,720,704.00
156,852,192
312,720,704

Maret 15, 2018
14
Embun Pagi
Mirae Asset Sekuritas Indonesia
Harga akan coba bertahan diatas rata-rata pada masing-masing periode.
Untuk mampu naik lebih lanjut, harga saham saat ini harus mampu minimal bertahan
diatas rata-rata masing-masing periode (positive area) . Jika dilihat lebih lanjut potensi
kenaikkan normal pada pergerakkan daily sekitar +4.13 %, saat ini di level 0.54%.
Sementara itu pada pergerakkan weekly kenaikkan normal sekitar +13.23 % saat ini di
level -6.09%. Dengan demikan potensi koreksi mulai terbatas dengan kecenderungan
menguat. Pada Figure 19,20 dan 21 terlihat perkiraan normal trading range untuk
masing-masing periode.
Figure 19. Daily : 358 – 382 Figure 20. Weekly : 350 – 424 Figure 21. Monthly : 348 – 480
Source: Mirae Asset Sekuritas Indonesia Research
Source: Mirae Asset Sekuritas Indonesia Research
Source: Mirae Asset Sekuritas Indonesia Research
Relative Avg.Price Performance to JCI (%) : Persentase kenaikan harga saham dari rata-rata sejak IHSG memulai uptrend-nya β (beta) : Indikator sensitivitas harga saham terhadap IHSG, beta diatas 1 berarti harga makin sensitif terhadap pergerakan IHSG dan sebaliknya Correlation : Ukuran kuat hubungan (korelasi) pergerakan harga saham dibanding dengan pergerakan IHSG selama periode analisis. Period : Periode uptrend / downtrend yang valid dari pergerakan harga saham. r-squared : Koefisien determinasi, menunjukkan persentase gerakan yang dapat dijelaskan dengan regresi linier.Nilai R2 terletak antara 0 – 1, dan kecocokan model dikatakan lebih baik kalau R2 semakin mendekati 1 (validitas uptrend atau downtrend makin valid) Volatility (+/-%) : Besaran volatilitas normal positif/negatif dari pergerakan harga harian selama harga saham bergerak normal pada trend channel dalam persentase. Volatility (+/- point or Rp) : Besaran volatilitas normal positifl/negatif dari pergerakan harga harian selama harga saham bergerak dalam periode analisis.
Created with AmiBroker - adv anced charting and technical analy sis sof tware. http://www.amibroker.com
_____ 382.5
_____ 358.5
367.3
Trada Maritime Tbk [ TRAM.JK ] - Daily - 3/14/2018
Prev . Av g. Price: 367.3
R-Squared: 0.9507
Period: 68
Std.Dev : 1.97
Volatility (+) : 0.0413
Volatility (-) : -0.0240
V-Ratio : 1.72
Chg.: 0.54%
370
26 Mar 12
TRAM.JK - Volume = 156,852,192.00
156,852,192
Created with AmiBroker - adv anced charting and technical analy sis sof tware. http://www.amibroker.com
_____ 424.2
_____ 350.7374.7
Trada Maritime Tbk [ TRAM.JK ] - Weekly -
Prev . Av g. Price: 374.7
R-Squared: 0.7904
Period: 40
Std.Dev : 1.25
Volatility (+) : 0.1323
Volatility (-) : -0.0640
V-Ratio : 2.07
Chg.: -6.09%
370
Dec 2018 Mar
TRAM.JK - Volume = 631,071,872.00
631,071,872
Created with AmiBroker - adv anced charting and technical analy sis sof tware. http://www.amibroker.com
_____ 479.1
_____ 348.2380.7
Trada Maritime Tbk [ TRAM.JK ] - Monthly -
Prev . Av g. Price: 380.7
R-Squared: 0.5961
Period: 30
Std.Dev :
Volatility (+) : 0.2587
Volatility (-) : -0.0853
V-Ratio : 3.03
Chg.: -7.96%
370
Jul Oct 2018
TRAM.JK - Volume = 2,721,333,504.00
2,721,333,504

Maret 15, 2018
15
Embun Pagi
Mirae Asset Sekuritas Indonesia
Chart 22. JCI Vs. USD/IDR Chart 23. JCI performance (absolute vs. relative)
Source: Bloomberg, Mirae Asset Sekuritas Indonesia Note: Relative to MSCI EM Index
Source: Bloomberg, Mirae Asset Sekuritas Indonesia
Chart 24. Foreigner’s net purchase (EM) Chart 25. Energy price
Note: The latest figure for India are March 13th, 2018
Source: Bloomberg, Mirae Asset Sekuritas Indonesia Source: Bloomberg, Mirae Asset Sekuritas Indonesia
Chart 26. Non-ferrous metal price Chart 27. Precious metal price
Source: Bloomberg, Mirae Asset Sekuritas Indonesia Source: Bloomberg, Mirae Asset Sekuritas Indonesia
13,100
13,300
13,500
13,700
13,900
5,600
5,800
6,000
6,200
6,400
6,600
6,800
12/13 1/10 2/7 3/7
(IDR) (pt) JCI (L) USD/IDR (R)
-0.5
0.2
-3.2
17.5
-0.1 -1.7
-4.5
-11.7 -16
-12
-8
-4
0
4
8
12
16
20
1D 1W 1M 1Y
Absolute Relative(%, %p)
-16
-274
-43
128
-27
760 909
406
-167
177
-76
1,156
-400
-200
0
200
400
600
800
1,000
1,200
1,400
Korea Taiwan Indonesia Thailand Philippines India
1 Day 5 Days (USDmn)
90
95
100
105
110
115
120
12/13 1/10 2/7 3/7
CPO WTI Coal(D-3M=100) (D-3M=100)
90
95
100
105
110
115
120
125
130
12/17 01/18 02/18 03/18
(D-3M=100) Copper Nickel Tin
90
95
100
105
110
115
120
12/17 01/18 02/18 03/18
(D-3M=100) Silver Gold Platinum

Maret 15, 2018
16
Embun Pagi
Mirae Asset Sekuritas Indonesia
Table. Key valuation metrics
Company Name Ticker Price Market Cap Price Performance (%) P/E(X)* P/B(X)* ROE(%)*
(IDR) (IDRbn) 1D 1W 1M 1Y FY18 FY19 FY18 FY19 FY18 FY19
Jakarta Composite Index JCI 6,383 7,125,225 -0.5 0.2 -3.2 17.5 16.3 14.6 2.5 2.3 17.7 20.0
FINANCIALS
Bank Central Asia BBCA 23,400 576,927 -0.2 3.5 -1.3 49.3 23.2 25.0 4.1 4.4 19.1 19.0
Bank Mandiri Persero BMRI 8,200 382,667 0.3 3.5 -1.2 43.5 18.1 18.8 2.2 2.4 13.0 12.8
Bank Rakyat Indonesia Persero BBRI 3,750 462,547 -0.3 2.5 -2.8 55.6 15.3 16.6 2.7 2.8 18.5 18.2
Bank Negara Indonesia Persero BBNI 9,450 176,230 2.2 4.1 -2.6 48.2 13.6 13.2 1.9 1.8 14.7 14.7
Bank Tabungan Negara Persero BBTN 3,680 38,971 -1.9 -0.8 -3.4 62.8 18.1 17.3 1.7 1.7 9.9 10.5
CONSUMER
HM Sampoerna HMSP 4,310 501,331 2.4 -4.4 -11.7 6.7 43.4 38.6 16.1 14.2 37.1 37.4
Gudang Garam GGRM 72,500 139,496 -1.9 -6.2 -9.4 12.4 18.7 16.6 3.3 3.0 17.9 18.2
Indofood CBP Sukses Makmur ICBP 8,700 101,459 -0.3 -0.3 -2.8 3.9 26.3 24.2 5.2 4.6 20.7 20.1
Indofood Sukses Makmur INDF 7,325 64,317 -2.3 0.7 -6.4 -7.6 14.7 13.8 2.0 1.9 14.4 13.7
Kalbe Farma KLBF 1,475 69,141 -3.0 -2.3 -9.0 -0.3 28.4 26.2 5.2 4.7 19.2 18.6
Unilever Indonesia UNVR 50,125 382,454 -0.6 -2.0 -8.0 18.8 60.9 52.9 82.4 71.6 141.8 143.6
AGRICULTURAL
Astra Agro Lestari AALI 13,750 26,464 -1.8 -4.0 2.6 -9.1 12.6 13.1 1.4 1.4 11.4 11.4
PP London Sumatera Indonesia LSIP 1,305 8,904 -1.1 -5.4 -3.3 -12.4 12.7 11.0 1.2 1.1 9.7 10.0
Sawit Sumbermas Sarana SSMS 1,450 13,811 -0.3 -0.7 0.0 -2.0 18.8 13.9 3.5 3.0 19.4 22.6
INFRASTRUCTURE
XL Axiata EXCL 2,590 27,682 -2.3 -6.2 -11.0 -15.1 84.6 67.2 1.5 1.3 1.8 1.8
Jasa Marga JSMR 4,990 36,217 -3.1 -4.5 -12.1 7.8 21.1 15.7 3.1 2.3 15.3 14.9
Perusahaan Gas Negara PGAS 2,410 58,422 -0.4 -2.0 -3.6 -11.1 21.5 21.9 1.0 1.3 4.5 5.6
Tower Bersama Infrastructure TBIG 5,800 26,282 -0.9 2.7 -0.9 14.9 22.4 18.8 12.9 9.4 61.4 56.8
Telekomunikasi Indonesia TLKM 4,060 409,248 -0.7 1.5 0.5 0.7 19.9 17.4 4.7 4.2 24.3 25.9
Soechi Lines SOCI 268 1,892 0.8 0.8 -2.2 -1.5 3.9 3.9 N/A N/A 11.3 10.2
Garuda Indonesia GIAA 300 7,766 0.0 -1.3 -9.1 -11.8 19.0 14.7 2.1 1.9 11.3 12.7
BASIC-INDUSTRIES
Semen Indonesia SMGR 10,475 62,133 -0.5 0.0 -3.5 13.9 27.4 21.8 2.1 2.0 7.8 9.6
Charoen Pokphand Indonesia CPIN 3,590 58,869 5.0 10.1 5.9 13.6 23.2 17.5 3.7 3.2 16.4 18.7
Indocement Tunggal Prakarsa INTP 20,300 74,729 -0.5 2.3 -3.4 31.8 36.2 29.8 2.9 2.8 8.1 9.6
Japfa Comfeed Indonesia JPFA 1,495 17,059 -1.0 -1.6 -5.1 -6.6 14.8 14.3 1.6 1.8 11.0 12.8
MINING
Indo Tambangraya Megah ITMG 26,400 29,830 -5.7 -0.6 -9.5 57.1 6.6 8.8 1.7 2.1 27.1 25.3
Adaro Energy ADRO 2,070 66,211 -4.6 -4.2 -15.2 25.8 9.1 9.4 1.3 1.4 14.6 14.1
Aneka Tambang ANTM 880 21,147 0.0 -0.6 -0.6 24.8 110.0 N/A 0.8 1.2 0.7 -0.5
Vale Indonesia INCO 3,150 31,299 1.3 3.3 -13.2 37.0 N/A N/A 1.1 1.3 0.1 -0.6
Tambang Batubara Bukit Asam PTBA 2,850 32,834 -2.7 -2.7 -11.8 31.9 5.8 8.8 1.9 2.4 37.3 29.2
TRADE
United Tractors UNTR 33,700 125,706 -4.3 -3.4 -10.7 29.9 17.8 16.6 2.9 3.0 17.2 17.2
AKR Corporindo AKRA 5,750 23,036 -1.7 -1.3 -3.0 -8.4 20.3 18.6 3.0 2.7 15.2 15.3
Global Mediacom BMTR 600 8,519 0.0 1.7 -7.0 16.5 N/A N/A N/A N/A N/A N/A
Matahari Department Store LPPF 11,200 32,681 -3.9 4.2 8.0 -14.8 15.3 16.6 12.5 12.4 91.2 90.4
Media Nusantara Citra MNCN 1,480 21,129 -2.0 -1.7 -4.8 -13.2 14.2 12.5 2.1 1.9 15.4 16.4
Matahari Putra Prima MPPA 422 2,270 -0.5 -0.9 -8.3 -63.1 N/A N/A 1.1 1.1 -10.3 -0.8
Surya Citra Media SCMA 2,850 41,672 -1.0 5.9 2.9 2.9 27.5 24.5 10.8 8.9 40.3 39.3
Siloam International Hospital SILO 8,075 13,128 0.3 0.3 -5.3 -38.9 140.2 118.4 2.5 2.2 2.0 2.4
PROPERTY
Bumi Serpong Damai BSDE 1,720 33,104 -1.4 -1.7 -4.4 -1.1 6.6 11.1 1.3 1.4 21.4 12.9
Adhi Karya ADHI 2,210 7,869 -3.5 -4.7 -6.8 -5.2 13.0 15.4 1.1 1.3 9.1 8.3
Alam Sutera Realty ASRI 380 7,467 -0.5 1.1 -0.5 3.3 6.3 6.9 0.9 0.8 13.0 11.1
Ciputra Development CTRA 1,195 22,180 -0.4 -2.0 -8.1 -4.8 22.6 18.2 1.7 1.6 8.3 9.1
Lippo Karawaci LPKR 492 11,359 -1.6 1.2 -5.4 -32.1 11.2 10.8 0.6 0.5 5.5 5.1
Pembangunan Perumahan PTPP 3,000 18,600 0.0 3.1 0.0 -12.5 11.3 13.0 1.4 1.6 13.8 13.0
Pakuwon Jati PWON 620 29,859 -2.4 -3.9 -8.8 8.8 15.2 13.5 2.8 2.4 19.3 18.4
Summarecon Agung SMRA 965 13,922 -2.5 -2.0 -14.2 -29.3 48.4 32.3 2.0 1.9 4.9 6.2
Wijaya Karya WIKA 1,785 16,011 -0.8 -1.4 -7.3 -28.0 11.6 13.0 1.8 1.2 12.9 9.9
Waskita Karya WSKT 2,620 35,564 -2.2 -4.4 -9.7 10.5 6.6 10.6 2.1 2.2 31.0 22.4
MISCELLANEOUS
Astra International ASII 7,575 306,663 -1.6 -3.2 -9.6 -7.6 17.8 15.7 2.7 2.4 16.0 15.9
Source: Bloomberg, Mirae Asset Sekuritas Indonesia
*Note: Valuation metrics based on Bloomberg consensus estimates

Maret 15, 2018
17
Embun Pagi
Mirae Asset Sekuritas Indonesia
Sector performance
Top 10 market cap performance
Name Index Chg (%) Ticker Price Market Cap (IDRbn) Chg (%)
Agricultural 1,660.8 -1.1 PSAB IJ 248 6,562 9.7
Mining 1,848.4 -2.0
CPIN IJ 3590 58,869 5.0
Basic-Industry 753.3 -0.4 BDMN IJ 7025 67,332 2.6
Miscellaneous Industry 1,290.1 -1.4 BFIN IJ 840 13,412 2.4
Consumer Goods 2,645.7 0.2 BTEK IJ 126 5,831 2.4
Property & Construction 514.4 -1.3
SDRA IJ 860 5,660 2.4
Infrastructure 1,146.4 -0.8 BRMS IJ 86 5,360 2.4
Finance 1,181.5 0.1 BBNI IJ 9450 176,230 2.2
Trade 931.0 -1.1 TBLA IJ 1205 6,437 2.1
Composite 6,382.6 -0.5 IBST IJ 9900 13,374 2.1 Source: Bloomberg
Top 5 leading movers Top 5 lagging movers
Name Chg (%) Close Name Chg (%) Close
HMSP IJ 2.4 4,310 UNTR IJ -4.3 33,700
BBNI IJ 2.2 9,450 ASII IJ -1.6 7,575
CPIN IJ 5.0 3,590 ADRO IJ -4.6 2,070
BDMN IJ 2.6 7,025 TLKM IJ -0.7 4,060
BMRI IJ 0.3 8,200 GGRM IJ -1.9 72,500 Source: Bloomberg
Economic Calendar
Time Currency Detail Forecast Previous
4:45am NZD GDP q/q 0.8% 0.6%
7:00am AUD MI Inflation Expectations 3.6%
7:30am AUD RBA Bulletin
15th-16th CNY Foreign Direct Investment ytd/y 0.3%
2:45pm EUR French Final CPI m/m -0.1% -0.1%
3:15pm CHF PPI m/m 0.2% 0.3%
3:30pm CHF Libor Rate -0.75% -0.75%
3:30pm CHF SNB Monetary Policy Assessment
Tentative EUR Spanish 10-y Bond Auction 1.50|2.0
Tentative GBP 10-y Bond Auction 1.29|2.4
7:30pm CAD ADP Non-Farm Employment Change 10.7K
7:30pm USD Empire State Manufacturing Index 15.2 13.1
7:30pm USD Import Prices m/m 0.3% 1.0%
7:30pm USD Philly Fed Manufacturing Index 23.2 25.8
7:30pm USD Unemployment Claims 230K 231K
9:00pm USD NAHB Housing Market Index 72 72
9:30pm USD Natural Gas Storage -57B
Note: Time is based on Indonesian local time
Source: Forex Factory

Maret 15, 2018
18
Embun Pagi
Mirae Asset Sekuritas Indonesia
Disclaimers
This report is prepared strictly for private circulation only to clients of PT Mirae Asset Sekuritas Indonesia (MASI). It is purposed only to person having
professional experience in matters relating to investments. The information contained in this report has been taken from sources which we deem reliable. No
warranty (express or implied) is made to the accuracy or completeness of the information. All opinions and estimates included in this report constitute our
judgments as of this date, without regards to its fairness, and are subject to change without notice. However, none of MASI and/or its affiliated companies
and/or their respective employees and/or agents makes any representation or warranty (express or implied) or accepts any responsibility or liability as to, or
in relation to, the accuracy or completeness of the information and opinions contained in this report or as to any information contained in this report or any
other such information or opinions remaining unchanged after the issue thereof. We expressly disclaim any responsibility or liability (express or implied) of
MASI, its affiliated companies and their respective employees and agents whatsoever and howsoever arising (including, without limitation for any claims,
proceedings, action, suits, losses, expenses, damages or costs) which may be brought against or suffered by any person as a results of acting in reliance upon
the whole or any part of the contents of this report and neither MASI, its affiliated companies or their respective employees or agents accepts liability for any
errors, omissions or misstatements, negligent or otherwise, in the report and any liability in respect of the report or any inaccuracy therein or omission there
from which might otherwise arise is hereby expresses disclaimed.
This document is not an offer to sell or a solicitation to buy any securities. This firms and its affiliates and their officers and employees may have a position,
make markets, act as principal or engage in transaction in securities or related investments of any company mentioned herein, may perform services for or
solicit business from any company mentioned herein, and may have acted upon or used any of the recommendations herein before they have been provided
to you. © PT Mirae Asset Sekuritas Indonesia 2016.