marina park draft eir - newport beach, california park... · marina park draft eir ... based on...
TRANSCRIPT

Marina Park Draft EIR
Michael Brandman Associates H:\Client (PN-JN)\0064\00640022\DEIR\00640022 Sec11-00 Appendix Dividers.doc
Appendix K: Traffic Analysis

Marina Park Draft EIR
Michael Brandman Associates H:\Client (PN-JN)\0064\00640022\DEIR\00640022 Sec11-00 Appendix Dividers.doc
K.1 - MARINA PARK TPO TRAFFIC ANALYSIS

MARINA PARK TPO Traffic Analysis February 2009

MARINA PARK TPO TRAFFIC ANALYSIS
Prepared by: Austin-Foust Associates, Inc. 2020 North Tustin Avenue Santa Ana, California 92705-7827 (714) 667-0496 February 18, 2009

Marina Park TPO 1 Austin-Foust Associates, Inc. Traffic Analysis 029033tpo.doc
MARINA PARK TPO TRAFFIC ANALYSIS
This report summarizes an analysis performed for the proposed development of Marina Park in
Newport Beach based on the City’s Traffic Phasing Ordinance (TPO) methodology. In addition, this
report summarizes the results of an analysis of cumulative conditions in compliance with California
Environmental Quality Act (CEQA) requirements.
PROJECT DESCRIPTION
The proposed Marina Park project is located on the Bay side of Balboa Boulevard between 18th
Street and 16th Street on the Balboa Peninsula in the City of Newport Beach. Marina Park consists of a
10,200 square foot Community Center, an 11,200 square foot Sailing Center, recreational park uses, and a
23-berth non-commercial Visitor Marina. The Sailing Center will include a 54-seat café. A playground,
two tennis courts, two half-court basketball courts, beach volleyball courts, and open lawn areas for
picnicking and free play are proposed. New docks and slips for sailing programs and expanded and
improved beach access will be provided. The existing Girl Scout House will be relocated on-site.
The approximately nine-acre site is currently developed with a 57-unit mobile home park, a
community center, four tennis courts, a small playground, and the Girl Scout House. The Girl Scout
House will be relocated to the northwest corner of the project site. Adjacent to the project site between
16th Street and 15th Street is the existing American Legion Post 291, a small residential development,
and a commercial building.
Figure 1 illustrates the location of the project. Figure 2 illustrates the proposed concept plan.
TRIP GENERATION AND DISTRIBUTION
The proposed Community Center will include three ground-floor classrooms for use by the sailing
program or other City programs, and the second floor will provide administrative functions and a large
room that accommodates up to 80 people for use as a large classroom, four small classrooms, or a banquet
facility.


Marina Park TPO 4 Austin-Foust Associates, Inc. Traffic Analysis 029033tpo.doc
The Sailing Center consists of a reception area, a medium sized meeting room, and a two-story
gallery space. The second floor will include a 54-seat café and administrative offices. The Sailing Center
will provide indoor space for storage and maintenance of the boats and equipment used in the sailing
program.
The Visitor Marina includes 21 40-foot long berths and two 50-foot long berths for use by the
public for short-term visiting non-commercial vessels plus a 200 foot long dock. Full hook-ups will be
provided to all berths. The marina will be fenced and controlled security access provided at the
southeastern corner. A marina control building containing an office, restrooms, and washing machines
will be provided adjacent to the marina entry point.
Amenities in the park will include picnic tables, restrooms, showers, play areas, half-court
basketball courts, benches, public beach and access to the water. Tennis courts are located adjacent to the
American Legion.
The site is currently developed with a 57-unit mobile home park, community center, Girl Scout
House, tennis courts, and playground which are generating peak hour and daily traffic. The mobile home
park is only partially occupied full-time. Credit for the peak hour and daily trips currently being
generated by the mobile home park was determined from driveway counts conducted in early June 2008.
These counts were collected prior to the beginning of the Summer season. Credit for the trips currently
being generated by the existing community center, tennis courts and playground were determined from
Institute of Transportation Engineers (ITE) trip rates.
The Girl Scout House will be relocated from its current location to the northwest corner of the site.
No changes in the trips generated by the Girl Scout House are expected.
Trip generation rates for the proposed project were derived from peak hour and daily trip rates
contained in ITE Trip Generation, Seventh Edition. A combined rate that consists of the ITE City Park
peak hour rates per acre and an average of the ITE City Park and Beach Park daily rates per acre was
applied to the park uses. ITE’s Recreational Community Center trip rates were applied to the proposed
Community Center and Sailing Center, which includes a 54-seat café. These rates and the resulting trips
are summarized in Table 1.
The existing trips from the mobile home park, the tennis courts, and the playground were
subtracted from the proposed trip generation to produce the net new trips for the project. The project
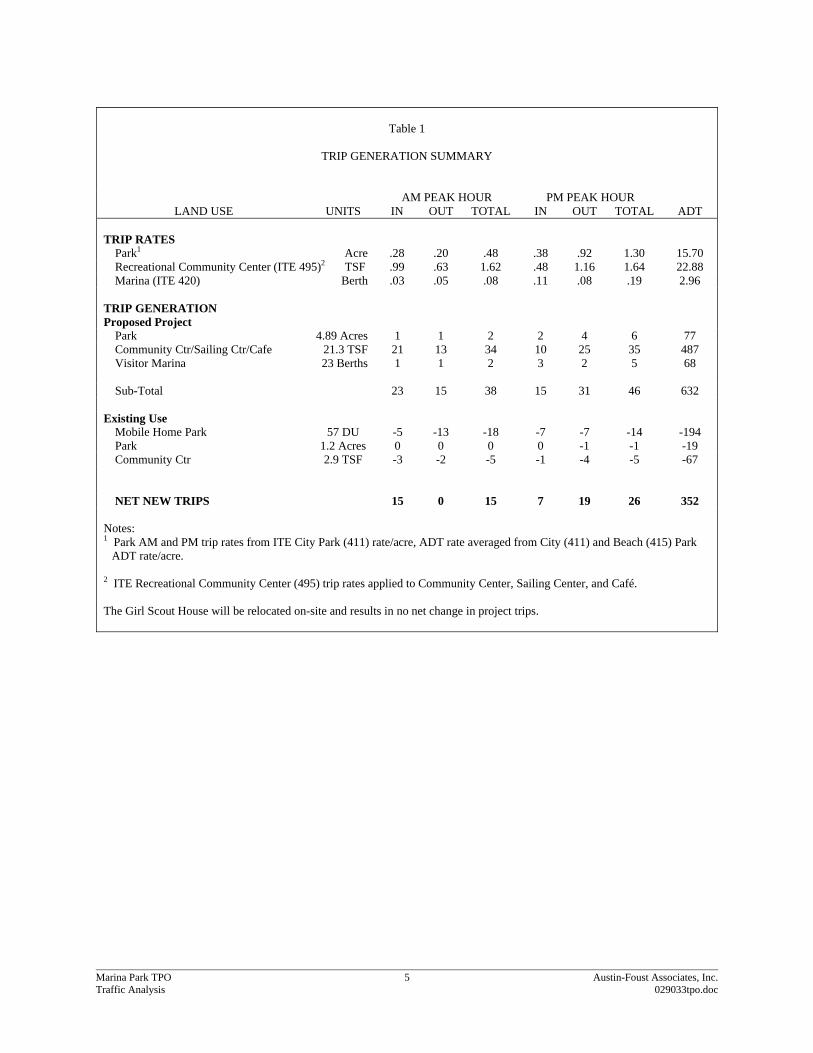
Marina Park TPO 5 Austin-Foust Associates, Inc. Traffic Analysis 029033tpo.doc
Table 1
TRIP GENERATION SUMMARY
AM PEAK HOUR PM PEAK HOUR LAND USE UNITS IN OUT TOTAL IN OUT TOTAL ADT
TRIP RATES Park1 Acre .28 .20 .48 .38 .92 1.30 15.70 Recreational Community Center (ITE 495)2 TSF .99 .63 1.62 .48 1.16 1.64 22.88 Marina (ITE 420) Berth .03 .05 .08 .11 .08 .19 2.96 TRIP GENERATION Proposed Project Park 4.89 Acres 1 1 2 2 4 6 77 Community Ctr/Sailing Ctr/Cafe 21.3 TSF 21 13 34 10 25 35 487 Visitor Marina 23 Berths 1 1 2 3 2 5 68 Sub-Total 23 15 38 15 31 46 632 Existing Use Mobile Home Park 57 DU -5 -13 -18 -7 -7 -14 -194 Park 1.2 Acres 0 0 0 0 -1 -1 -19 Community Ctr 2.9 TSF -3 -2 -5 -1 -4 -5 -67 NET NEW TRIPS 15 0 15 7 19 26 352 Notes: 1 Park AM and PM trip rates from ITE City Park (411) rate/acre, ADT rate averaged from City (411) and Beach (415) Park
ADT rate/acre.
2 ITE Recreational Community Center (495) trip rates applied to Community Center, Sailing Center, and Café. The Girl Scout House will be relocated on-site and results in no net change in project trips.

Marina Park TPO 6 Austin-Foust Associates, Inc. Traffic Analysis 029033tpo.doc
impacts are analyzed under worst case conditions since peak summer intersection counts are used in the
analysis and the trips generated by the proposed project represent peak summer trips; whereas, the credit
from the existing mobile home park is based on the non-peak season when the mobile home park is not
fully occupied. As the trip generation table indicates, the proposed project results in a net increase of 352
trips daily. During the AM peak hour there is a net increase of 15 trips generated compared with the trip
generation of the existing uses on the site. During the PM peak hour the proposed project generates 26
new trips compared with the trip generation of the existing uses on the site.
Trip distribution of project-generated traffic onto the surrounding circulation system was
determined from observed travel patterns in the vicinity of the project site as well as from locations and
levels of development in relation to the subject property. A large portion of trips generated by the project
are estimated to originate within the City of Newport Beach. Approximately 35 percent of project trips
are oriented toward the areas south of Coast Highway, including the Balboa Peninsula area. The
remaining 65 percent of project traffic is distributed along Coast Highway and Newport Boulevard. The
general distribution for the proposed development is illustrated in Figure 3. Project-generated trips were
distributed to the circulation system according to these distribution patterns. The AM and PM peak hour
trips for the proposed development are illustrated in Appendix A.
TPO TRAFFIC IMPACTS
The City of Newport Beach identified seven intersections for analysis to determine the impact of
the proposed Marina Park development. These intersections are:
Newport Boulevard and Hospital Road
Balboa Boulevard/Superior Avenue and Coast Highway
Newport Boulevard and Coast Highway
Riverside Avenue and Coast Highway
Tustin Avenue and Coast Highway
Newport Boulevard and Via Lido
Newport Boulevard and 32nd Street
Existing peak hour intersection volumes for the seven study locations listed above were provided
by City Staff (existing peak hour volumes are illustrated in Appendix A). The peak hour data was
collected during the non-peak season in 2006, 2007, and 2008. Existing intersection levels of service are


Marina Park TPO 8 Austin-Foust Associates, Inc. Traffic Analysis 029033tpo.doc
based on intersection capacity utilization (ICU) values. The ICU values are a means of presenting the
volume to capacity ratios, with a V/C ratio of .90 representing the upper threshold for an acceptable level
of service (LOS “D”) in the City of Newport Beach. The City methodology calculates the ICU value to
three decimal places, and then reports the resulting ICU value rounded to two decimal places.
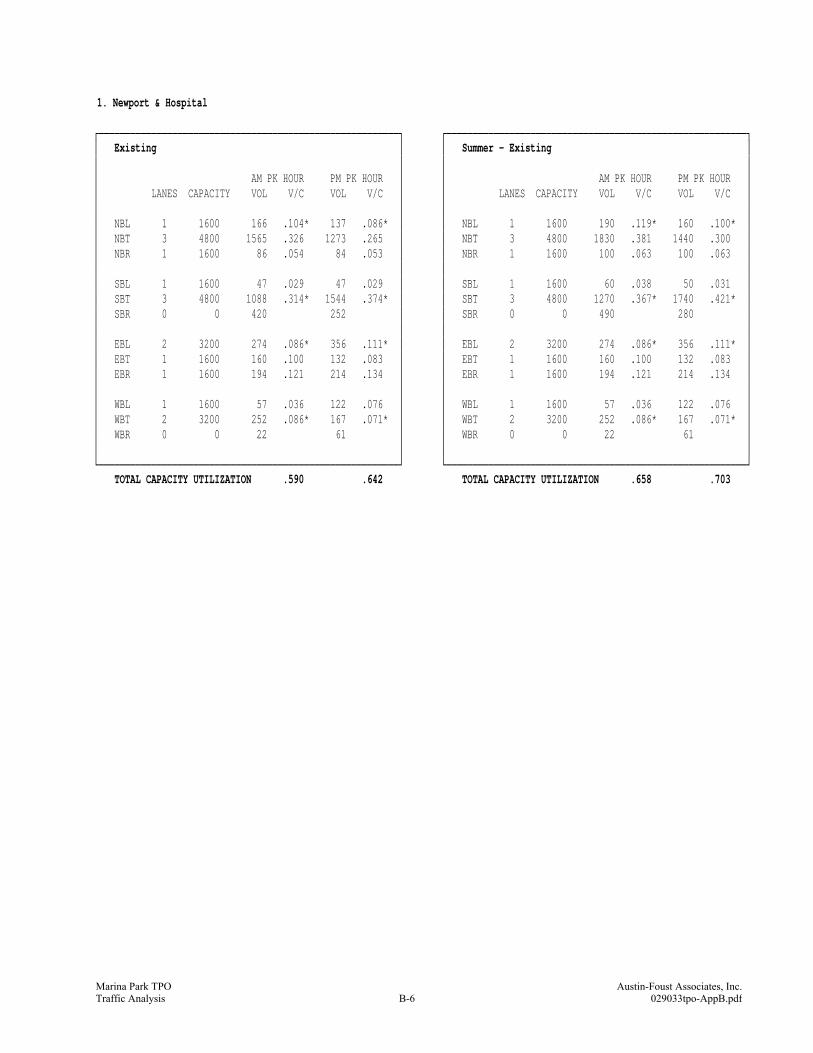
Existing ICU values for the study intersections assuming existing lane configurations are
summarized in Table 2 (actual ICU calculation sheets are included in Appendix B). As this table shows,
the study intersections are currently operating at LOS “D” or better during the AM and PM peak hours.
These ICU values represent the non-peak season conditions.
Sample mid-block counts were collected to determine the seasonal increase in Summer traffic
volumes for this area of Newport Beach. Counts collected on Newport Boulevard at 32nd Street and on
Balboa Boulevard at 18th Street in early June 2008 (non-peak season) and late June 2008 (peak Summer
season) indicate an average increase of 18 percent in the daily traffic volume during the Summer (count
data is included in Appendix D). During the peak hours, the Summer increase averages 17 percent over
the non-peak season volume during the AM peak hour and 16 percent during the PM peak hour. Existing
peak hour volumes at the study intersections were increased to Summer conditions (illustrated in
Appendix A), and the resulting Summer season ICU values are summarized in Table 3.
An ambient growth rate of 1.0 percent per year was added to the existing volumes along Newport
Boulevard north of Coast Highway and along Coast Highway. Construction of the project is assumed to
be complete in 2010; therefore, the study year is 2011. Traffic generated by approved projects in the
study area, obtained from City Staff, were added to the existing peak hour volumes to obtain year 2011
background peak hour volumes for the intersections prior to the addition of project-generated traffic
(illustrated in Appendix A). Table 4 summarizes the approved projects included in this analysis.
Background-plus-project peak hour volumes were obtained by adding the project-generated peak
hour intersection volumes presented above to the existing-plus-regional growth-plus-approved projects
peak hour volumes. Background-plus-project peak hour volumes are illustrated in Appendix A.
The TPO analysis consists of a one percent analysis and an ICU analysis at each study intersection.
The one percent analysis compares the proposed project traffic with projected background peak hour
volumes. To pass the one percent analysis, peak hour traffic from the proposed project must be less than
one percent of the projected background peak hour traffic on each leg of the intersection. If the proposed

Marina Park TPO 9 Austin-Foust Associates, Inc. Traffic Analysis 029033tpo.doc
Table 2
EXISTING ICU ANALYSIS SUMMARY – NON-PEAK SEASON
INTERSECTION AM PM 1. Newport & Hospital
.59
.64
2. Balboa/Superior & Coast Hyw .68 .72 3. Newport & Coast Hwy .77 .68 4. Riverside & Coast Hwy .70 .81 5. Tustin & Coast Hwy .67 .58 6. Newport & Via Lido .47 .43 7. Newport & 32nd .48 .66 Level of service ranges: .00 - .60 A .61 - .70 B .71 - .80 C .81 - .90 D .91 – 1.00 E Above 1.00 F

Marina Park TPO 10 Austin-Foust Associates, Inc. Traffic Analysis 029033tpo.doc
Table 3
EXISTING ICU ANALYSIS SUMMARY – SUMMER SEASON
INTERSECTION AM PM 1. Newport & Hospital
.66
.70
2. Balboa/Superior & Coast Hyw .79 .82 3. Newport & Coast Hwy .90 .77 4. Riverside & Coast Hwy .80 .88 5. Tustin & Coast Hwy .78 .65 6. Newport & Via Lido .54 .49 7. Newport & 32nd .56 .74 Level of service ranges: .00 - .60 A .61 - .70 B .71 - .80 C .81 - .90 D .91 – 1.00 E Above 1.00 F

Marina Park TPO 11 Austin-Foust Associates, Inc. Traffic Analysis 029033tpo.doc
Table 4
APPROVED PROJECTS SUMMARY
LOCATION PERCENT COMPLETE Fashion Island Expansion 40
Temple Bat Yahm Expansion 65
CIOSA – Irvine Project 91
Newport Dunes 0
1401 Dove Street 0
1901 Westcliff Surgical Center 0
Hoag Hospital Phase III 0
Birch Medical Office 0
St Mark Presbyterian Church 77
Corporate Plaza West 0
Mariner’s Mile Gateway 0
Land Rover NB Service Center 0
Our Lady Queen of Angels Church Expansion 0
2300 Newport Boulevard 0
Newport Executive Court 0
Hoag Health Center 0
North Newport Center 0
Santa Barbara Condo 0

Marina Park TPO 12 Austin-Foust Associates, Inc. Traffic Analysis 029033tpo.doc
project passes the one percent analysis, then the ICU analysis is not required and no further analysis is
necessary. If the proposed project does not pass the one percent analysis, then the ICU analysis must be
performed for the intersection which fails to pass the one percent test.
Table 5 summarizes the results of the non-peak season one percent analysis (the one percent
analysis sheets are included in Appendix C). As this table indicates, the proposed project does not pass
the one percent analysis at two study intersections during the AM and PM peak hour; therefore, an ICU
analysis is required for the intersections of Newport Boulevard at Via Lido and Newport Boulevard at
32nd Street. The non-peak season volumes represent the worst-case one percent analysis since the
Summer season volumes increase the background level against which the project trips are compared. If
the project passes the one percent analysis at a location under non-peak season conditions, then the
project will pass the one percent analysis at that location under Summer season conditions.
An ICU analysis was performed for the two intersections which did not pass the one percent test.
Existing lane configurations were assumed, and a capacity of 1,600 vph per lane with no clearance factor
was utilized. Table 6 summarizes the existing, background, and background-plus-project ICU values
during the AM and PM peak hours under non-peak season and Summer season conditions (actual ICU
calculation sheets are included in Appendix B).
As the ICU summary table indicates, the project will have no marginal impact on the intersections
of Newport Boulevard at Via Lido and Newport Boulevard at 32nd Street which will operate at LOS “C”
or better during the AM and PM peak hours under non-peak season and Summer season conditions. The
project has no significant impact on the study intersections, and no mitigation is required.
CUMULATIVE CONDITIONS ANALYSIS
City Staff provided a list of two known but not approved projects for use in a cumulative
conditions analysis. These cumulative projects are summarized in Table 7. Trip generation and
distribution for each cumulative project was also provided by City Staff. The peak hour cumulative
intersection volumes were added to the background volumes presented earlier, and then project-generated
traffic was added (see Appendix A). The previous non-peak season one percent analysis without
cumulative volumes represents the worst-case one percent analysis since the addition of cumulative traffic
to the background volumes increases the chances of a project passing the one percent analysis. If an

Marina Park TPO 13 Austin-Foust Associates, Inc. Traffic Analysis 029033tpo.doc
Table 5
SUMMARY OF ONE PERCENT ANALYSIS – NON-PEAK SEASON
AM PEAK HOUR PROJECT VOLUMES LESS THAN 1% OF INTERSECTION NB SB EB WB PEAK HOUR VOLUMES 1. Newport & Hospital
1
4
0
0
Yes
2. Balboa/Superior & Coast Hwy 0 0 2 0 Yes 3. Newport & Coast Hwy 0 0 0 5 Yes 4. Riverside & Coast Hwy 0 1 0 4 Yes 5. Tustin & Coast Hwy 0 0 0 4 Yes 6. Newport & Via Lido 1 10 0 0 Yes 7. Newport & 32nd 1 10 1 0 No PM PEAK HOUR PROJECT VOLUMES-- LESS THAN 1% OF INTERSECTION NB SB EB WB PEAK HOUR VOLUMES 1. Newport & Hospital
6
2
0
0
Yes
2. Balboa/Superior & Coast Hwy 2 0 1 0 Yes 3. Newport & Coast Hwy 0 0 0 3 Yes 4. Riverside & Coast Hwy 0 1 7 2 Yes 5. Tustin & Coast Hwy 0 0 5 2 Yes 6. Newport & Via Lido 13 5 0 0 No 7. Newport & 32nd 14 5 0 0 No

Marina Park TPO 14 Austin-Foust Associates, Inc. Traffic Analysis 029033tpo.doc
Table 6
ICU ANALYSIS SUMMARY
EXISTING
BACKGROUND
BACKGROUND + PROJECT
INTERSECTION AM PM AM PM AM PM Non-Peak Season
6. Newport & Via Lido .47 .43 .47 .44 .47 .44 7. Newport & 32nd .48 . 66 .49 .67 .49 .67 Summer Season 6. Newport & Via Lido .54 .49 .55 .49 .55 .49 7. Newport & 32nd .56 .74 .56 .75 .56 .75 Level of service ranges: .00 - .60 A .61 - .70 B .71 - .80 C .81 - .90 D .91 – 1.00 E Above 1.00 F

Marina Park TPO 15 Austin-Foust Associates, Inc. Traffic Analysis 029033tpo.doc
Table 7
CUMULATIVE PROJECTS SUMMARY
PROJECT LAND USE AMOUNT Newport Coast TAZ 1 – 4
Single Family Detached
954 DU
Condominium/Townhouse 389 DU Multi-Family Attached 175 DU
Newport Ridge TAZ 1 – 3 Single Family Detached 632 DU Multi-Family Attached 384 DU Commercial 102.96 TSF
DU – dwelling units TSF – thousand square feet
Marina Park TPO 16 Austin-Foust Associates, Inc. Traffic Analysis 029033tpo.doc
intersection passes the one percent analysis prior to the addition of cumulative traffic, then the
intersection will pass the one percent analysis with the addition of cumulative traffic and no further
analysis is required at that location. Therefore, an ICU analysis for the two study intersections that did
not pass the non-peak season one percent analysis was prepared.
The results of the cumulative ICU analysis are summarized in Table 8 (actual ICU calculation
sheets are included in Appendix B). This table includes the non-peak season and Summer season ICU
values. As the cumulative ICU table indicates, the proposed project will have no significant impact on
the study intersections which operate at LOS “C” or better, and no mitigation is required.
PARKING ANALYSIS
Parking for the proposed project will be provided in a main parking lot adjacent to the Community
Center, Sailing Center, and Visitor Marina. This parking lot will provide approximately 127 spaces with
two-way circulation throughout the lot. Access to the main parking lot will be provided at 16th Street and
with a connection to 15th Street. Parking for the Girl Scout House will be provided in a 26-space lot at
18th Street. One-way circulation should be provided in the 18th Street parking lot with traffic entering
the south driveway and exiting the north driveway.
The amount of parking required for the proposed project was determined from ITE parking rates
modified to suit this specific development. The parking rate applied to the Community Center is the ITE
Recreational Community Center parking rate; however, the rate applied to the Sailing Center is reduced
from the ITE Recreational Community Center rate since large areas of the sailing center are used for
storage and maintenance. The parking rate for the Visitor Marina is the ITE Marina parking rate. These
rates were developed in coordination with City staff.
Table 9 summarizes the required project parking. As this table indicates, the worst-case parking
estimate for the project is 144 spaces. Approximately 127 spaces will be provided in the main project
parking lot, with another 26 spaces provided in the 18th Street parking lot for a total of 153 spaces.
The City is in the process of acquiring the existing SCE substation on Balboa Boulevard. The
proposed site plan shows parking on the substation property. If the City is unsuccessful in obtaining the
SCE property and cannot include that land in the parking lot, the parking lot will lose approximately 11
spaces resulting in an overall parking deficiency of two spaces.

Marina Park TPO 17 Austin-Foust Associates, Inc. Traffic Analysis 029033tpo.doc
Table 8
CUMULATIVE ICU ANALYSIS SUMMARY
EXISTING
BACKGROUND
BACKGROUND +
CUMULATIVE
BACKGROUND + CUMULATIVE +
PROJECT INTERSECTION AM PM AM PM AM PM AM PM Non-Peak Season
6. Newport & Via Lido .47 .43 .47 .44 .47 .44 .47 .44 7. Newport & 32nd .48 .66 .49 .67 .49 .67 .49 .67 Summer Season
6. Newport & Via Lido .54 .49 .55 .49 .55 .49 .55 .49 7. Newport & 32nd .56 .74 .56 .75 .56 .75 .56 .75 Level of service ranges: .00 - .60 A .61 - .70 B .71 - .80 C .81 - .90 D .91 - 1.00 E Above 1.00 F

Marina Park TPO 18 Austin-Foust Associates, Inc. Traffic Analysis 029033tpo.doc
Table 9
PARKING SUMMARY
LAND USE
SIZE
PARKING
RATE
RATE
SOURCE
SPACES
REQUIRED Girl Scout House 5.5 TSF 2.36 sp/TSF 1 13 sp Community Ctr 10.2 TSF 6 sp/TSF 2 61 sp Sailing Ctr 11.1 TSF 5 sp/TSF 3 56 sp Visitor Marina 23 Berths .59 sp/Berth 4 14 sp TOTAL SPACES 144 sp Parking rate sources:
1 Existing 6 spaces plus 7 added for expansion of facility 2 ITE Recreational Community Center (495) – includes Café and Park uses 3 Modified ITE Recreational Community Center (495) 4 ITE Marina (420)

Marina Park TPO 19 Austin-Foust Associates, Inc. Traffic Analysis 029033tpo.doc
The proposed parking lot is intended for the project only and not to provide additional beach
parking. To prevent the parking lot from being used for beach parking, as a result reducing the amount of
parking available for the project uses, signs indicating appropriate users and time limits and warning signs
indicating enforcement will be posted throughout the parking lot. Periodic monitoring and surveying of
parking lot users will be performed to determine if beach parking is encroaching on the project parking
lot. If the warning signs are discouraging inappropriate users, then no further actions will be required. If
the warning signs are being ignored, then a parking management plan with a more rigorous enforcement
program will be developed.
Currently, on-street parking is allowed along Balboa Boulevard in the vicinity of the project site.
Parking along the project frontage (i.e., the north side of Balboa Boulevard) is not metered; however,
parking is not allowed on Monday mornings (8:30 AM – 12:30 PM) for street sweeping. Furthermore,
parking is prohibited from 9:00 AM to 6:00 PM on Saturdays and Sundays from May through September,
Memorial Day, Fourth of July, and Labor Day to provide an additional travel lane. These parking
restrictions are assumed to remain in place with the development of the proposed project. Metered
parking spaces are provided in the center median along Balboa Boulevard, and development of the project
will have no affect on the operation of these spaces. A public parking lot with 24 spaces is currently
located at the corner of 18th Street and Balboa Boulevard. This parking lot will be removed and replaced
with a 26-space lot in the same location with development of the project.
The number of on-street parking spaces along the project frontage will change with the
development of the proposed project. Development of the project site will result in the widening of 18th
Street north of Balboa Boulevard which will allow additional on-street parking (approximately eight
spaces). In addition, development of the project will result in the closure of driveways on Balboa
Boulevard along the project frontage at the public parking lot on the corner of 18th Street, the existing
community center, Girl Scout House, and SCE substation, and the removal of the 30 minute loading zone
in front of the existing community center. With the closure of these driveways, an additional four on-
street parking spaces may be available; although, a new on-street drop-off zone may reduce this number
of new on-street parking spaces. On the other hand, the need to provide adequate sight distance east of
16th Street will require the removal of approximately 15 existing on-street parking spaces.
A left-turn pocket from eastbound Balboa Boulevard into the parking lot driveway at 16th Street
should be provided to reduce entering project traffic from blocking through traffic on Balboa Boulevard.
Although the hourly volume entering the parking lot driveway is not large (approximately 11 to 17
vehicles per hour), project trips are not spread out evenly throughout the hour, with the majority of

Marina Park TPO 20 Austin-Foust Associates, Inc. Traffic Analysis 029033tpo.doc
vehicles entering the parking lot in the 10 to 15 minutes before classes begin. An 85-foot pocket, similar
to existing left-turn pockets on Balboa Boulevard in the project vicinity, would result in the loss of
approximately three existing parking spaces in the center median on Balboa Boulevard.
The overall change in on-street parking as a result of the proposed project is a reduction of
approximately six spaces between 18th Street and 15th Street.
SPECIAL ISSUES
Access to the main parking lot of the proposed project will be provided by a driveway opposite
16th Street. A connection to 15th Street will also be available. A traffic signal exists at the intersection
of 15th Street and Balboa Boulevard, approximately 400 feet east of the proposed driveway. Installation
of a traffic signal is being considered at the driveway opposite 16th Street. The need for a signal at this
location was examined.
Satisfaction of Caltrans Peak Hour Signal Warrant (Figure F-1) requires a minimum of 100 peak
hour trips on the side street approach. The proposed project will generate 39 AM peak hour driveway
trips, 15 of which are outbound, and 46 PM peak hour driveway trips, 31 of which are outbound. The
project does not generate enough peak hour traffic to satisfy the signal warrant. Besides, the majority of
outbound trips from the project will be oriented toward the west; therefore, they will make a right turn out
of the driveway and will experience very little benefit from a traffic signal at this location. Installation of
a signal at the project driveway is not recommended due to the low peak hour volumes expected and the
close proximity to the existing signal at 15th Street.
Without a signal at the project driveway, outbound vehicles will have to wait for gaps in Balboa
Boulevard traffic to exit. Vehicles making a left turn from the parking lot will have the option of exiting
the parking lot onto 15th Street and utilizing the existing signal at the intersection of 15th Street and
Balboa Boulevard. However, relatively little project traffic (approximately 15 percent) is expected to be
oriented toward the Balboa Peninsula east of the project site during the peak hours. Less than five peak
hour trips would be added to the 15th Street/Balboa Boulevard intersection. The existing signal at 15th
Street can accommodate the addition of five peak hour trips.
Without a signal at the driveway on Balboa Boulevard, vehicles will have to wait for gaps in traffic
on Balboa Boulevard. Balboa Boulevard is classified as a primary roadway in the vicinity of the project

Marina Park TPO 21 Austin-Foust Associates, Inc. Traffic Analysis 029033tpo.doc
site. Parking and landscaping will need to be restricted east of the driveway so that a sight distance of
450 feet is provided per City Standard STD-110-L. This restriction will remove all on-street parking
along the north side of Balboa Boulevard between 16th Street and 15th Street (approximately 15 spaces).
CONCLUSIONS
The proposed project, consisting of a 10,200 square foot community center, an 11,200 square foot
sailing center, park uses, a 23-berth non-commercial visitor marina, and re-located on-site Girl Scout
House, will generate 15 new AM peak hour trips, 26 new PM peak hour trips, and 352 new daily trips.
The marginal impact of project traffic on the street system was determined at seven intersections in the
vicinity. Two of the seven intersections did not pass the City’s one percent analysis; however, the project
had no marginal impact on the ICU values at these two intersections, which will continue to operate at
level of service (LOS) “C” or better during the AM and PM peak hours under non-peak season and
Summer season conditions. Consequently, the proposed project has no significant impact on the study
intersections, and no additional intersection improvements are required.
The impact of traffic from known but not approved projects was included in a cumulative
conditions analysis. Under cumulative non-peak season and Summer season conditions, the project had
no marginal impact during the AM or PM peak hour on the ICU values at the two intersections that did
not pass the one percent analysis. Therefore, the proposed project has no significant impact on the study
intersections under cumulative conditions, and no intersection mitigation measures are required.
A review of the proposed parking reveals that the 153 spaces provided on-site are adequate to
satisfy the project’s demand. However, some monitoring of the parking lot as outlined in a parking
management plan will be required to ensure that the parking there is limited to legitimate Marina Park
users.

Marina Park TPO A-1 Austin-Foust Associates, Inc. Traffic Analysis 029033tpo.doc
APPENDIX A
PEAK HOUR INTERSECTION VOLUMES


Marina Park TPO B-1 Austin-Foust Associates, Inc. Traffic Analysis 029033tpo.doc
APPENDIX B INTERSECTION CAPACITY UTILIZATION
Peak hour intersection volume/capacity ratios are calculated by means of intersection capacity
utilization (ICU) values. ICU calculations were performed for the intersections shown in Figure B-1. For
simplicity, signalization is assumed at each intersection. Precise ICU calculations of existing non-
signalized intersections would require a more detailed analysis.
The procedure is based on the critical movement methodology, and shows the amount of capacity
utilized by each critical move. A capacity of 1600 vehicles per hour (VPH) per lane is assumed with no
clearance interval. Calculations are carried out to three decimal places. A "de-facto" right-turn lane is
used in the ICU calculation for cases where a curb lane is wide enough to separately serve both thru and
right-turn traffic (typically with a width of 19 feet from curb to outside of thru-lane with parking
prohibited during peak periods). Such lanes are treated the same as striped right-turn lanes during the
ICU calculations, but they are denoted on the ICU calculation worksheets using the letter "d" in place of a
numerical entry for right-turn lanes.
The methodology also incorporates a check for right-turn capacity utilization. Both right-turn-on-
green (RTOG) and right-turn-on-red (RTOR) capacity availability are calculated and checked against the
total right-turn capacity need. If insufficient capacity is available, then an adjustment is made to the total
capacity utilization value. The following example shows how this adjustment is made.
Example For Northbound Right
1. Right-Turn-On-Green (RTOG)
If NBT is critical move, then: RTOG = V/C (NBT)
Otherwise, RTOG = V/C (NBL) + V/C (SBT) - V/C (SBL)
2. Right-Turn-On-Red (RTOR)
If WBL is critical move, then: RTOR = V/C (WBL)
Otherwise, RTOR = V/C (EBL) + V/C (WBT) - V/C (EBT)


Marina Park TPO B-3 Austin-Foust Associates, Inc. Traffic Analysis 029033tpo.doc
3. Right-Turn Overlap Adjustment
If the northbound right is assumed to overlap with the adjacent westbound left, adjustments to the RTOG and RTOR values are made as follows:
RTOG = RTOG + V/C (WBL) RTOR = RTOR - V/C (WBL)
4. Total Right-Turn Capacity (RTC) Availability For NBR
RTC = RTOG + factor x RTOR Where factor = RTOR saturation flow factor (75%)
Right-turn adjustment is then as follows: Additional ICU = V/C (NBR) - RTC
A zero or negative value indicates that adequate capacity is available and no adjustment is
necessary. A positive value indicates that the available RTOR and RTOG capacity does not adequately
accommodate the right-turn V/C, therefore the right-turn is essentially considered to be a critical
movement. In such cases, the right-turn adjustment is noted on the ICU worksheet and it is included in
the total capacity utilization value. When it is determined that a right-turn adjustment is required for more
than one right-turn movement, the word "multi" is printed on the worksheet instead of an actual right-turn
movement reference, and the right-turn adjustments are cumulatively added to the total capacity
utilization value. In such cases, further operational evaluation is typically carried out to determine if
under actual operational conditions, the critical right-turns would operate simultaneously, and therefore a
right-turn adjustment credit should be applied.
Shared Lane V/C Methodology
For intersection approaches where shared usage of a lane is permitted by more than one turn
movement (e.g., left/thru, thru/right, left/thru/right), the individual turn volumes are evaluated to
determine whether dedication of the shared lane is warranted to any one given turn movement. The
following example demonstrates how this evaluation is carried out:
Example for Shared Left/Thru Lane
1. Average Lane Volume (ALV)
ALV = Left-Turn Volume + Thru Volume Total Left + Thru Approach Lanes (including shared lane)

Marina Park TPO B-4 Austin-Foust Associates, Inc. Traffic Analysis 029033tpo.doc
2. ALV for Each Approach
ALV (Left) = Left-Turn Volume Left Approach Lanes (including shared lane)
ALV (Thru) = Thru Volume
Thru Approach Lanes (including shared lane) 3. Lane Dedication is Warranted
If ALV (Left) is greater than ALV then full dedication of the shared lane to the left-turn approach is warranted. Left-turn and thru V/C ratios for this case are calculated as follows:
V/C (Left) = Left-Turn Volume
Left Approach Capacity (including shared lane)
V/C (Thru) = Thru Volume Thru Approach Capacity (excluding shared lane)
Similarly, if ALV (Thru) is greater than ALV then full dedication to the thru approach is warranted, and left-turn and thru V/C ratios are calculated as follows:
V/C (Left) = Left-Turn Volume
Left Approach Capacity (excluding shared lane)
V/C (Thru) = Thru Volume Thru Approach Capacity (including shared lane)
4. Lane Dedication is not Warranted
If ALV (Left) and ALV (Thru) are both less than ALV, the left/thru lane is assumed to be truly shared and each left, left/thru or thru approach lane carries an evenly distributed volume of traffic equal to ALV. A combined left/thru V/C ratio is calculated as follows:
V/C (Left/Thru) = Left-Turn Volume + Thru Volume
Total Left + Thru Approach Capacity (including shared lane)
This V/C (Left/Thru) ratio is assigned as the V/C (Thru) ratio for the critical movement analysis and ICU summary listing.
If split phasing has not been designated for this approach, the relative proportion of V/C (Thru) that is attributed to the left-turn volume is estimated as follows:
If approach has more than one left-turn (including shared lane), then:
V/C (Left) = V/C (Thru)

Marina Park TPO B-5 Austin-Foust Associates, Inc. Traffic Analysis 029033tpo.doc
If approach has only one left-turn lane (shared lane), then: V/C (Left) = Left-Turn Volume
Single Approach Lane Capacity
If this left-turn movement is determined to be a critical movement, the V/C (Left) value is posted in brackets on the ICU summary printout.
These same steps are carried out for shared thru/right lanes. If full dedication of a shared
thru/right lane to the right-turn movement is warranted, the right-turn V/C value calculated in step three is
checked against the RTOR and RTOG capacity availability if the option to include right-turns in the V/C
ratio calculations is selected. If the V/C value that is determined using the shared lane methodology
described here is reduced due to RTOR and RTOG capacity availability, the V/C value for the thru/right
lanes is posted in brackets.
When an approach contains more than one shared lane (e.g., left/thru and thru/right), steps one
and two listed above are carried out for the three turn movements combined. Step four is carried out if
dedication is not warranted for either of the shared lanes. If dedication of one of the shared lanes is
warranted to one movement or another, step three is carried out for the two movements involved, and then
steps one through four are repeated for the two movements involved in the other shared lane.
1. Newport & Hospital ┌─────────────────────────────────────────────────────────┐ ┌─────────────────────────────────────────────────────────┐ │ Existing │ │ Summer - Existing │ │ │ │ │ │ AM PK HOUR PM PK HOUR │ │ AM PK HOUR PM PK HOUR │ │ LANES CAPACITY VOL V/C VOL V/C │ │ LANES CAPACITY VOL V/C VOL V/C │ │ │ │ │ │ NBL 1 1600 166 .104* 137 .086* │ │ NBL 1 1600 190 .119* 160 .100* │ │ NBT 3 4800 1565 .326 1273 .265 │ │ NBT 3 4800 1830 .381 1440 .300 │ │ NBR 1 1600 86 .054 84 .053 │ │ NBR 1 1600 100 .063 100 .063 │ │ │ │ │ │ SBL 1 1600 47 .029 47 .029 │ │ SBL 1 1600 60 .038 50 .031 │ │ SBT 3 4800 1088 .314* 1544 .374* │ │ SBT 3 4800 1270 .367* 1740 .421* │ │ SBR 0 0 420 252 │ │ SBR 0 0 490 280 │ │ │ │ │ │ EBL 2 3200 274 .086* 356 .111* │ │ EBL 2 3200 274 .086* 356 .111* │ │ EBT 1 1600 160 .100 132 .083 │ │ EBT 1 1600 160 .100 132 .083 │ │ EBR 1 1600 194 .121 214 .134 │ │ EBR 1 1600 194 .121 214 .134 │ │ │ │ │ │ WBL 1 1600 57 .036 122 .076 │ │ WBL 1 1600 57 .036 122 .076 │ │ WBT 2 3200 252 .086* 167 .071* │ │ WBT 2 3200 252 .086* 167 .071* │ │ WBR 0 0 22 61 │ │ WBR 0 0 22 61 │ │ │ │ │ └─────────────────────────────────────────────────────────┘ └─────────────────────────────────────────────────────────┘ TOTAL CAPACITY UTILIZATION .590 .642 TOTAL CAPACITY UTILIZATION .658 .703
Marina Park TPOTraffic Analysis B-6
Austin-Foust Associates, Inc.029033tpo-AppB.pdf

2. Balboa/Superior & Coast Hwy ┌─────────────────────────────────────────────────────────┐ ┌─────────────────────────────────────────────────────────┐ │ Existing │ │ Summer - Existing │ │ │ │ │ │ AM PK HOUR PM PK HOUR │ │ AM PK HOUR PM PK HOUR │ │ LANES CAPACITY VOL V/C VOL V/C │ │ LANES CAPACITY VOL V/C VOL V/C │ │ │ │ │ │ NBL 1.5 202 261 │ │ NBL 1.5 240 300 │ │ NBT 1.5 4800 327 .129* 209 .111* │ │ NBT 1.5 4800 380 .150* 240 .127* │ │ NBR 0 89 65 │ │ NBR 0 100 70 │ │ │ │ │ │ SBL 2.5 170 163 .051 │ │ SBL 2.5 200 180 .056 │ │ SBT 1.5 6400 122 .046* 237 .074* │ │ SBT 1.5 6400 140 .053* 270 .084* │ │ SBR 2 3200 187 .058 738 .231 │ │ SBR 2 3200 220 .069 830 .259 │ │ │ │ │ │ EBL 2 3200 988 .309 255 .080* │ │ EBL 2 3200 1160 .363 290 .091* │ │ EBT 3 4800 2242 .467* 1169 .244 │ │ EBT 3 4800 2620 .546* 1320 .275 │ │ EBR 1 1600 238 .149 225 .141 │ │ EBR 1 1600 280 .175 250 .156 │ │ │ │ │ │ WBL 1 1600 61 .038* 147 .092 │ │ WBL 1 1600 70 .044* 170 .106 │ │ WBT 4 6400 582 .121 2165 .359* │ │ WBT 4 6400 680 .142 2450 .406* │ │ WBR 0 0 206 .129 134 │ │ WBR 0 0 240 .150 150 │ │ │ │ │ │ Right Turn Adjustment SBR .097* │ │ Right Turn Adjustment SBR .107* │ │ Note: Assumes N/S Split Phasing │ │ Note: Assumes N/S Split Phasing │ └─────────────────────────────────────────────────────────┘ └─────────────────────────────────────────────────────────┘ TOTAL CAPACITY UTILIZATION .680 .721 TOTAL CAPACITY UTILIZATION .793 .815
Marina Park TPOTraffic Analysis B-7
Austin-Foust Associates, Inc.029033tpo-AppB.pdf

3. Newport & Coast Hwy ┌─────────────────────────────────────────────────────────┐ ┌─────────────────────────────────────────────────────────┐ │ Existing │ │ Summer - Existing │ │ │ │ │ │ AM PK HOUR PM PK HOUR │ │ AM PK HOUR PM PK HOUR │ │ LANES CAPACITY VOL V/C VOL V/C │ │ LANES CAPACITY VOL V/C VOL V/C │ │ │ │ │ │ NBL 0 0 0 0 │ │ NBL 0 0 0 0 │ │ NBT 0 0 0 0 │ │ NBT 0 0 0 0 │ │ NBR 0 0 0 0 │ │ NBR 0 0 0 0 │ │ │ │ │ │ SBL 2 3200 384 .120* 617 .193* │ │ SBL 2 3200 450 .141* 700 .219* │ │ SBT 0 0 0 0 │ │ SBT 0 0 0 0 │ │ SBR 1 1600 269 .168 470 .294 │ │ SBR 1 1600 320 .200 530 .331 │ │ │ │ │ │ EBL 0 0 0 0 │ │ EBL 0 0 0 0 │ │ EBT 2 3200 2075 .648* 1267 .396* │ │ EBT 2 3200 2430 .759* 1430 .447* │ │ EBR f 487 267 │ │ EBR f 570 300 │ │ │ │ │ │ WBL 0 0 0 0 │ │ WBL 0 0 0 0 │ │ WBT 3 4800 979 .204 1848 .385 │ │ WBT 3 4800 1140 .238 2090 .435 │ │ WBR f 370 563 │ │ WBR f 430 640 │ │ │ │ │ │ Right Turn Adjustment SBR .093* │ │ Right Turn Adjustment SBR .103* │ └─────────────────────────────────────────────────────────┘ └─────────────────────────────────────────────────────────┘ TOTAL CAPACITY UTILIZATION .768 .682 TOTAL CAPACITY UTILIZATION .900 .769
Marina Park TPOTraffic Analysis B-8
Austin-Foust Associates, Inc.029033tpo-AppB.pdf

4. Riverside & Coast Hwy ┌─────────────────────────────────────────────────────────┐ ┌─────────────────────────────────────────────────────────┐ │ Existing │ │ Summer - Existing │ │ │ │ │ │ AM PK HOUR PM PK HOUR │ │ AM PK HOUR PM PK HOUR │ │ LANES CAPACITY VOL V/C VOL V/C │ │ LANES CAPACITY VOL V/C VOL V/C │ │ │ │ │ │ NBL 0 0 1 {.001}* 7 │ │ NBL 0 0 1 {.001}* 7 │ │ NBT 1 1600 3 .003 6 .014* │ │ NBT 1 1600 3 .003 6 .014* │ │ NBR 0 0 1 9 │ │ NBR 0 0 1 9 │ │ │ │ │ │ SBL 0 0 82 77 {.048}* │ │ SBL 0 0 82 77 {.048}* │ │ SBT 1 1600 9 .057* 4 .051 │ │ SBT 1 1600 9 .057* 4 .051 │ │ SBR 1 1600 337 .211 451 .282 │ │ SBR 1 1600 337 .211 451 .282 │ │ │ │ │ │ EBL 1 1600 274 .171 253 .158* │ │ EBL 1 1600 320 .200 290 .181* │ │ EBT 2 3200 2004 .629* 1388 .438 │ │ EBT 2 3200 2340 .734* 1570 .497 │ │ EBR 0 0 9 14 │ │ EBR 0 0 10 20 │ │ │ │ │ │ WBL 1 1600 12 .008* 4 .003 │ │ WBL 1 1600 10 .006* 10 .006 │ │ WBT 3 4800 1106 .230 2312 .482* │ │ WBT 3 4800 1290 .269 2610 .544* │ │ WBR 1 1600 64 .040 45 .028 │ │ WBR 1 1600 80 .050 50 .031 │ │ │ │ │ │ Right Turn Adjustment SBR .106* │ │ Right Turn Adjustment SBR .088* │ └─────────────────────────────────────────────────────────┘ └─────────────────────────────────────────────────────────┘ TOTAL CAPACITY UTILIZATION .695 .808 TOTAL CAPACITY UTILIZATION .798 .875
Marina Park TPOTraffic Analysis B-9
Austin-Foust Associates, Inc.029033tpo-AppB.pdf

5. Tustin & Coast Hwy ┌─────────────────────────────────────────────────────────┐ ┌─────────────────────────────────────────────────────────┐ │ Existing │ │ Summer - Existing │ │ │ │ │ │ AM PK HOUR PM PK HOUR │ │ AM PK HOUR PM PK HOUR │ │ LANES CAPACITY VOL V/C VOL V/C │ │ LANES CAPACITY VOL V/C VOL V/C │ │ │ │ │ │ NBL 0 0 0 2 {.001}* │ │ NBL 0 0 0 2 {.001}* │ │ NBT 1 1600 0 .000 1 .002 │ │ NBT 1 1600 0 .000 1 .002 │ │ NBR 0 0 0 0 │ │ NBR 0 0 0 0 │ │ │ │ │ │ SBL 0 0 29 53 │ │ SBL 0 0 29 53 │ │ SBT 1 1600 0 .035* 0 .051* │ │ SBT 1 1600 0 .035* 0 .051* │ │ SBR 0 0 27 28 │ │ SBR 0 0 27 28 │ │ │ │ │ │ EBL 1 1600 37 .023 68 .043* │ │ EBL 1 1600 40 .025 80 .050* │ │ EBT 2 3200 2016 .631* 1406 .440 │ │ EBT 2 3200 2360 .741* 1590 .500 │ │ EBR 0 0 2 2 │ │ EBR 0 0 10 10 │ │ │ │ │ │ WBL 0 0 0 0 │ │ WBL 0 0 0 0 │ │ WBT 3 4800 1138 .237 2326 .485* │ │ WBT 3 4800 1330 .277 2630 .548* │ │ WBR 1 1600 40 .025 56 .035 │ │ WBR 1 1600 50 .031 60 .038 │ │ │ │ │ └─────────────────────────────────────────────────────────┘ └─────────────────────────────────────────────────────────┘ TOTAL CAPACITY UTILIZATION .666 .580 TOTAL CAPACITY UTILIZATION .776 .650
Marina Park TPOTraffic Analysis B-10
Austin-Foust Associates, Inc.029033tpo-AppB.pdf

6. Newport & Via Lido ┌─────────────────────────────────────────────────────────┐ ┌─────────────────────────────────────────────────────────┐ │ Existing │ │ Existing + Regional Growth + Approved │ │ │ │ │ │ AM PK HOUR PM PK HOUR │ │ AM PK HOUR PM PK HOUR │ │ LANES CAPACITY VOL V/C VOL V/C │ │ LANES CAPACITY VOL V/C VOL V/C │ │ │ │ │ │ NBL 0 0 0 0 │ │ NBL 0 0 0 0 │ │ NBT 3 4800 1501 .313* 1236 .258* │ │ NBT 3 4800 1529 .319* 1258 .262* │ │ NBR f 17 28 │ │ NBR f 17 28 │ │ │ │ │ │ SBL 2 3200 461 .144* 515 .161* │ │ SBL 2 3200 461 .144* 515 .161* │ │ SBT 3 4800 922 .192 1811 .377 │ │ SBT 3 4800 932 .194 1860 .388 │ │ SBR 0 0 0 0 │ │ SBR 0 0 0 0 │ │ │ │ │ │ EBL 0 0 0 0 │ │ EBL 0 0 0 0 │ │ EBT 0 0 0 0 │ │ EBT 0 0 0 0 │ │ EBR 0 0 0 0 │ │ EBR 0 0 0 0 │ │ │ │ │ │ WBL 1 1600 12 .008* 21 .013* │ │ WBL 1 1600 12 .008* 21 .013* │ │ WBT 0 0 0 0 │ │ WBT 0 0 0 0 │ │ WBR 2 3200 285 .089 272 .085 │ │ WBR 2 3200 285 .089 272 .085 │ │ │ │ │ └─────────────────────────────────────────────────────────┘ └─────────────────────────────────────────────────────────┘ TOTAL CAPACITY UTILIZATION .465 .432 TOTAL CAPACITY UTILIZATION .471 .436 ┌─────────────────────────────────────────────────────────┐ ┌─────────────────────────────────────────────────────────┐ │ Existing + Growth + Approved + Project │ │ Existing + Growth + Approved + Cumulative │ │ │ │ │ │ AM PK HOUR PM PK HOUR │ │ AM PK HOUR PM PK HOUR │ │ LANES CAPACITY VOL V/C VOL V/C │ │ LANES CAPACITY VOL V/C VOL V/C │ │ │ │ │ │ NBL 0 0 0 0 │ │ NBL 0 0 0 0 │ │ NBT 3 4800 1530 .319* 1271 .265* │ │ NBT 3 4800 1529 .319* 1258 .262* │ │ NBR f 17 28 │ │ NBR f 17 28 │ │ │ │ │ │ SBL 2 3200 461 .144* 515 .161* │ │ SBL 2 3200 461 .144* 515 .161* │ │ SBT 3 4800 942 .196 1865 .389 │ │ SBT 3 4800 932 .194 1860 .388 │ │ SBR 0 0 0 0 │ │ SBR 0 0 0 0 │ │ │ │ │ │ EBL 0 0 0 0 │ │ EBL 0 0 0 0 │ │ EBT 0 0 0 0 │ │ EBT 0 0 0 0 │ │ EBR 0 0 0 0 │ │ EBR 0 0 0 0 │ │ │ │ │ │ WBL 1 1600 12 .008* 21 .013* │ │ WBL 1 1600 12 .008* 21 .013* │ │ WBT 0 0 0 0 │ │ WBT 0 0 0 0 │ │ WBR 2 3200 285 .089 272 .085 │ │ WBR 2 3200 285 .089 272 .085 │ │ │ │ │ └─────────────────────────────────────────────────────────┘ └─────────────────────────────────────────────────────────┘ TOTAL CAPACITY UTILIZATION .471 .439 TOTAL CAPACITY UTILIZATION .471 .436
Marina Park TPOTraffic Analysis B-11
Austin-Foust Associates, Inc.029033tpo-AppB.pdf

6. Newport & Via Lido ┌─────────────────────────────────────────────────────────┐ ┌─────────────────────────────────────────────────────────┐ │ Existing + Growth + Approved + Cumulative + Project │ │ Summer - Existing │ │ │ │ │ │ AM PK HOUR PM PK HOUR │ │ AM PK HOUR PM PK HOUR │ │ LANES CAPACITY VOL V/C VOL V/C │ │ LANES CAPACITY VOL V/C VOL V/C │ │ │ │ │ │ NBL 0 0 0 0 │ │ NBL 0 0 0 0 │ │ NBT 3 4800 1530 .319* 1271 .265* │ │ NBT 3 4800 1760 .367* 1400 .292* │ │ NBR f 17 28 │ │ NBR f 20 30 │ │ │ │ │ │ SBL 2 3200 461 .144* 515 .161* │ │ SBL 2 3200 540 .169* 580 .181* │ │ SBT 3 4800 942 .196 1865 .389 │ │ SBT 3 4800 1080 .225 2050 .427 │ │ SBR 0 0 0 0 │ │ SBR 0 0 0 0 │ │ │ │ │ │ EBL 0 0 0 0 │ │ EBL 0 0 0 0 │ │ EBT 0 0 0 0 │ │ EBT 0 0 0 0 │ │ EBR 0 0 0 0 │ │ EBR 0 0 0 0 │ │ │ │ │ │ WBL 1 1600 12 .008* 21 .013* │ │ WBL 1 1600 10 .006* 20 .013* │ │ WBT 0 0 0 0 │ │ WBT 0 0 0 0 │ │ WBR 2 3200 285 .089 272 .085 │ │ WBR 2 3200 330 .103 310 .097 │ │ │ │ │ └─────────────────────────────────────────────────────────┘ └─────────────────────────────────────────────────────────┘ TOTAL CAPACITY UTILIZATION .471 .439 TOTAL CAPACITY UTILIZATION .542 .486 ┌─────────────────────────────────────────────────────────┐ ┌─────────────────────────────────────────────────────────┐ │ Summer - Existing + Regional Growth + Approved │ │ Summer - Existing + Growth + Approved + Project │ │ │ │ │ │ AM PK HOUR PM PK HOUR │ │ AM PK HOUR PM PK HOUR │ │ LANES CAPACITY VOL V/C VOL V/C │ │ LANES CAPACITY VOL V/C VOL V/C │ │ │ │ │ │ NBL 0 0 0 0 │ │ NBL 0 0 0 0 │ │ NBT 3 4800 1788 .373* 1422 .296* │ │ NBT 3 4800 1789 .373* 1435 .299* │ │ NBR f 20 30 │ │ NBR f 20 30 │ │ │ │ │ │ SBL 2 3200 540 .169* 580 .181* │ │ SBL 2 3200 540 .169* 580 .181* │ │ SBT 3 4800 1090 .227 2099 .437 │ │ SBT 3 4800 1100 .229 2104 .438 │ │ SBR 0 0 0 0 │ │ SBR 0 0 0 0 │ │ │ │ │ │ EBL 0 0 0 0 │ │ EBL 0 0 0 0 │ │ EBT 0 0 0 0 │ │ EBT 0 0 0 0 │ │ EBR 0 0 0 0 │ │ EBR 0 0 0 0 │ │ │ │ │ │ WBL 1 1600 10 .006* 20 .013* │ │ WBL 1 1600 10 .006* 20 .013* │ │ WBT 0 0 0 0 │ │ WBT 0 0 0 0 │ │ WBR 2 3200 330 .103 310 .097 │ │ WBR 2 3200 330 .103 310 .097 │ │ │ │ │ └─────────────────────────────────────────────────────────┘ └─────────────────────────────────────────────────────────┘ TOTAL CAPACITY UTILIZATION .548 .490 TOTAL CAPACITY UTILIZATION .548 .493
Marina Park TPOTraffic Analysis B-12
Austin-Foust Associates, Inc.029033tpo-AppB.pdf

6. Newport & Via Lido ┌─────────────────────────────────────────────────────────┐ ┌─────────────────────────────────────────────────────────┐ │ Summer - Existing + Growth + Approved + Cumulative │ │ Summer - Existing + Growth + Approved + Cumulative + │ │ │ │ Project │ │ AM PK HOUR PM PK HOUR │ │ AM PK HOUR PM PK HOUR │ │ LANES CAPACITY VOL V/C VOL V/C │ │ LANES CAPACITY VOL V/C VOL V/C │ │ │ │ │ │ NBL 0 0 0 0 │ │ NBL 0 0 0 0 │ │ NBT 3 4800 1788 .373* 1422 .296* │ │ NBT 3 4800 1789 .373* 1435 .299* │ │ NBR f 20 30 │ │ NBR f 20 30 │ │ │ │ │ │ SBL 2 3200 540 .169* 580 .181* │ │ SBL 2 3200 540 .169* 580 .181* │ │ SBT 3 4800 1090 .227 2099 .437 │ │ SBT 3 4800 1100 .229 2104 .438 │ │ SBR 0 0 0 0 │ │ SBR 0 0 0 0 │ │ │ │ │ │ EBL 0 0 0 0 │ │ EBL 0 0 0 0 │ │ EBT 0 0 0 0 │ │ EBT 0 0 0 0 │ │ EBR 0 0 0 0 │ │ EBR 0 0 0 0 │ │ │ │ │ │ WBL 1 1600 10 .006* 20 .013* │ │ WBL 1 1600 10 .006* 20 .013* │ │ WBT 0 0 0 0 │ │ WBT 0 0 0 0 │ │ WBR 2 3200 330 .103 310 .097 │ │ WBR 2 3200 330 .103 310 .097 │ │ │ │ │ └─────────────────────────────────────────────────────────┘ └─────────────────────────────────────────────────────────┘ TOTAL CAPACITY UTILIZATION .548 .490 TOTAL CAPACITY UTILIZATION .548 .493
Marina Park TPOTraffic Analysis B-13
Austin-Foust Associates, Inc.029033tpo-AppB.pdf

7. Newport & 32nd ┌─────────────────────────────────────────────────────────┐ ┌─────────────────────────────────────────────────────────┐ │ Existing │ │ Existing + Regional Growth + Approved │ │ │ │ │ │ AM PK HOUR PM PK HOUR │ │ AM PK HOUR PM PK HOUR │ │ LANES CAPACITY VOL V/C VOL V/C │ │ LANES CAPACITY VOL V/C VOL V/C │ │ │ │ │ │ NBL 1 1600 24 .015 51 .032* │ │ NBL 1 1600 24 .015 51 .032* │ │ NBT 2 3200 1020 .323* 925 .292 │ │ NBT 2 3200 1032 .327* 941 .297 │ │ NBR 0 0 13 8 │ │ NBR 0 0 13 8 │ │ │ │ │ │ SBL 1 1600 69 .043* 62 .039 │ │ SBL 1 1600 69 .043* 62 .039 │ │ SBT 2 3200 827 .289 1464 .547* │ │ SBT 2 3200 833 .291 1491 .556* │ │ SBR 0 0 98 287 │ │ SBR 0 0 98 287 │ │ │ │ │ │ EBL 1.5 302 161 │ │ EBL 1.5 303 161 │ │ EBT 0.5 3200 29 .103* 32 .060* │ │ EBT 0.5 3200 29 .104* 32 .060* │ │ EBR f 23 27 │ │ EBR f 23 27 │ │ │ │ │ │ WBL 0 0 21 21 │ │ WBL 0 0 21 21 │ │ WBT 2 3200 18 .012* 33 .017* │ │ WBT 2 3200 18 .012* 33 .017* │ │ WBR f 65 46 │ │ WBR f 65 46 │ │ │ │ │ │ Note: Assumes E/W Split Phasing │ │ Note: Assumes E/W Split Phasing │ └─────────────────────────────────────────────────────────┘ └─────────────────────────────────────────────────────────┘ TOTAL CAPACITY UTILIZATION .481 .656 TOTAL CAPACITY UTILIZATION .486 .665 ┌─────────────────────────────────────────────────────────┐ ┌─────────────────────────────────────────────────────────┐ │ Existing + Growth + Approved + Project │ │ Existing + Growth + Approved + Cumulative │ │ │ │ │ │ AM PK HOUR PM PK HOUR │ │ AM PK HOUR PM PK HOUR │ │ LANES CAPACITY VOL V/C VOL V/C │ │ LANES CAPACITY VOL V/C VOL V/C │ │ │ │ │ │ NBL 1 1600 24 .015 52 .033* │ │ NBL 1 1600 24 .015 51 .032* │ │ NBT 2 3200 1033 .327* 954 .301 │ │ NBT 2 3200 1032 .327* 941 .297 │ │ NBR 0 0 13 8 │ │ NBR 0 0 13 8 │ │ │ │ │ │ SBL 1 1600 69 .043* 62 .039 │ │ SBL 1 1600 69 .043* 62 .039 │ │ SBT 2 3200 843 .294 1496 .557* │ │ SBT 2 3200 833 .291 1491 .556* │ │ SBR 0 0 98 287 │ │ SBR 0 0 98 287 │ │ │ │ │ │ EBL 1.5 303 161 │ │ EBL 1.5 303 161 │ │ EBT 0.5 3200 29 .104* 32 .060* │ │ EBT 0.5 3200 29 .104* 32 .060* │ │ EBR f 24 27 │ │ EBR f 23 27 │ │ │ │ │ │ WBL 0 0 21 21 │ │ WBL 0 0 21 21 │ │ WBT 2 3200 18 .012* 33 .017* │ │ WBT 2 3200 18 .012* 33 .017* │ │ WBR f 65 46 │ │ WBR f 65 46 │ │ │ │ │ │ Note: Assumes E/W Split Phasing │ │ Note: Assumes E/W Split Phasing │ └─────────────────────────────────────────────────────────┘ └─────────────────────────────────────────────────────────┘ TOTAL CAPACITY UTILIZATION .486 .667 TOTAL CAPACITY UTILIZATION .486 .665
Marina Park TPOTraffic Analysis B-14
Austin-Foust Associates, Inc.029033tpo-AppB.pdf

7. Newport & 32nd ┌─────────────────────────────────────────────────────────┐ ┌─────────────────────────────────────────────────────────┐ │ Existing + Growth + Approved + Cumulative + Project │ │ Summer - Existing │ │ │ │ │ │ AM PK HOUR PM PK HOUR │ │ AM PK HOUR PM PK HOUR │ │ LANES CAPACITY VOL V/C VOL V/C │ │ LANES CAPACITY VOL V/C VOL V/C │ │ │ │ │ │ NBL 1 1600 24 .015 52 .033* │ │ NBL 1 1600 30 .019 60 .038* │ │ NBT 2 3200 1033 .327* 954 .301 │ │ NBT 2 3200 1190 .378* 1040 .328 │ │ NBR 0 0 13 8 │ │ NBR 0 0 20 10 │ │ │ │ │ │ SBL 1 1600 69 .043* 62 .039 │ │ SBL 1 1600 80 .050* 70 .044 │ │ SBT 2 3200 843 .294 1496 .557* │ │ SBT 2 3200 970 .341 1650 .616* │ │ SBR 0 0 98 287 │ │ SBR 0 0 120 320 │ │ │ │ │ │ EBL 1.5 303 161 │ │ EBL 1.5 350 180 │ │ EBT 0.5 3200 29 .104* 32 .060* │ │ EBT 0.5 3200 30 .119* 40 .069* │ │ EBR f 24 27 │ │ EBR f 30 30 │ │ │ │ │ │ WBL 0 0 21 21 │ │ WBL 0 0 20 20 │ │ WBT 2 3200 18 .012* 33 .017* │ │ WBT 2 3200 20 .013* 40 .019* │ │ WBR f 65 46 │ │ WBR f 80 50 │ │ │ │ │ │ Note: Assumes E/W Split Phasing │ │ Note: Assumes E/W Split Phasing │ └─────────────────────────────────────────────────────────┘ └─────────────────────────────────────────────────────────┘ TOTAL CAPACITY UTILIZATION .486 .667 TOTAL CAPACITY UTILIZATION .560 .742 ┌─────────────────────────────────────────────────────────┐ ┌─────────────────────────────────────────────────────────┐ │ Summer - Existing + Regional Growth + Approved │ │ Summer - Existing + Growth + Approved + Project │ │ │ │ │ │ AM PK HOUR PM PK HOUR │ │ AM PK HOUR PM PK HOUR │ │ LANES CAPACITY VOL V/C VOL V/C │ │ LANES CAPACITY VOL V/C VOL V/C │ │ │ │ │ │ NBL 1 1600 30 .019 60 .038* │ │ NBL 1 1600 30 .019 61 .038* │ │ NBT 2 3200 1202 .382* 1056 .333 │ │ NBT 2 3200 1203 .382* 1069 .337 │ │ NBR 0 0 20 10 │ │ NBR 0 0 20 10 │ │ │ │ │ │ SBL 1 1600 80 .050* 70 .044 │ │ SBL 1 1600 80 .050* 70 .044 │ │ SBT 2 3200 976 .343 1677 .624* │ │ SBT 2 3200 986 .346 1682 .626* │ │ SBR 0 0 120 320 │ │ SBR 0 0 120 320 │ │ │ │ │ │ EBL 1.5 351 180 │ │ EBL 1.5 351 180 │ │ EBT 0.5 3200 30 .119* 40 .069* │ │ EBT 0.5 3200 30 .119* 40 .069* │ │ EBR f 30 30 │ │ EBR f 31 30 │ │ │ │ │ │ WBL 0 0 20 20 │ │ WBL 0 0 20 20 │ │ WBT 2 3200 20 .013* 40 .019* │ │ WBT 2 3200 20 .013* 40 .019* │ │ WBR f 80 50 │ │ WBR f 80 50 │ │ │ │ │ │ Note: Assumes E/W Split Phasing │ │ Note: Assumes E/W Split Phasing │ └─────────────────────────────────────────────────────────┘ └─────────────────────────────────────────────────────────┘ TOTAL CAPACITY UTILIZATION .564 .750 TOTAL CAPACITY UTILIZATION .564 .752
Marina Park TPOTraffic Analysis B-15
Austin-Foust Associates, Inc.029033tpo-AppB.pdf

7. Newport & 32nd ┌─────────────────────────────────────────────────────────┐ ┌─────────────────────────────────────────────────────────┐ │ Summer - Existing + Growth + Approved + Cumulative │ │ Summer - Existing + Growth + Approved + Cumulative + │ │ │ │ Project │ │ AM PK HOUR PM PK HOUR │ │ AM PK HOUR PM PK HOUR │ │ LANES CAPACITY VOL V/C VOL V/C │ │ LANES CAPACITY VOL V/C VOL V/C │ │ │ │ │ │ NBL 1 1600 30 .019 60 .038* │ │ NBL 1 1600 30 .019 61 .038* │ │ NBT 2 3200 1202 .382* 1056 .333 │ │ NBT 2 3200 1203 .382* 1069 .337 │ │ NBR 0 0 20 10 │ │ NBR 0 0 20 10 │ │ │ │ │ │ SBL 1 1600 80 .050* 70 .044 │ │ SBL 1 1600 80 .050* 70 .044 │ │ SBT 2 3200 976 .343 1677 .624* │ │ SBT 2 3200 986 .346 1682 .626* │ │ SBR 0 0 120 320 │ │ SBR 0 0 120 320 │ │ │ │ │ │ EBL 1.5 351 180 │ │ EBL 1.5 351 180 │ │ EBT 0.5 3200 30 .119* 40 .069* │ │ EBT 0.5 3200 30 .119* 40 .069* │ │ EBR f 30 30 │ │ EBR f 31 30 │ │ │ │ │ │ WBL 0 0 20 20 │ │ WBL 0 0 20 20 │ │ WBT 2 3200 20 .013* 40 .019* │ │ WBT 2 3200 20 .013* 40 .019* │ │ WBR f 80 50 │ │ WBR f 80 50 │ │ │ │ │ │ Note: Assumes E/W Split Phasing │ │ Note: Assumes E/W Split Phasing │ └─────────────────────────────────────────────────────────┘ └─────────────────────────────────────────────────────────┘ TOTAL CAPACITY UTILIZATION .564 .750 TOTAL CAPACITY UTILIZATION .564 .752
Marina Park TPOTraffic Analysis B-16
Austin-Foust Associates, Inc.029033tpo-AppB.pdf

Marina Park TPO C-1 Austin-Foust Associates, Inc. Traffic Analysis 029033tpo.doc
APPENDIX C
1% ANALYSIS WORKSHEETS

Intersection: 1. Newport Blvd & Hospital RdExisting Traffic Volumes Based on Average Winter/Spring 2008
Peak 1 Hour Approved CumulativeExisting Regional Projects Projects Projected 1% of Projected Project
Approach Peak 1 Hour Growth Peak 1 Hour Peak 1 Hour Peak 1 Hour Peak 1 Hour Peak 1 HourDirection Volume Volume Volume Volume Volume Volume Volume
Northbound 1817 55 96 0 1968 20 1
Southbound 1555 47 78 0 1680 17 4
Eastbound 628 0 30 0 658 7 0
Westbound 331 0 1 0 332 3 1
==> Project AM Traffic is estimated to be less than 1% of Projected AM Peak 1 Hour Traffic Volume.
Project AM Traffic is estimated to be 1% or greater of Projected AM Peak 1 Hour Traffic Volume.Intersection Capacity Utilization (ICU) Analysis is required.
Northbound 1494 45 127 0 1666 17 6
Southbound 1843 55 82 0 1980 20 2
Eastbound 702 0 102 0 804 8 0
Westbound 350 0 0 0 350 4 0
==> Project PM Traffic is estimated to be less than 1% of Projected PM Peak 1 Hour Traffic Volume.
Project PM Traffic is estimated to be 1% or greater of Projected PM Peak 1 Hour Traffic Volume.Intersection Capacity Utilization (ICU) Analysis is required.
PROJECT: Marina Park FULL OCCUPANCY YEAR: 2011
AM PEAK PERIOD
PM PEAK PERIOD
1% Traffic Volume Analysis
Marina Park TPOTraffic Analysis C-2
Austin-Foust Associates, Inc.029033tpo-AppC.pdf

Intersection: 2. Balboa Blvd/Superior Ave & Coast HwyExisting Traffic Volumes Based on Average Winter/Spring 2006
Peak 1 Hour Approved CumulativeExisting Regional Projects Projects Projected 1% of Projected Project
Approach Peak 1 Hour Growth Peak 1 Hour Peak 1 Hour Peak 1 Hour Peak 1 Hour Peak 1 HourDirection Volume Volume Volume Volume Volume Volume Volume
Northbound 618 0 13 0 631 6 0
Southbound 479 0 30 0 509 5 0
Eastbound 3468 173 97 0 3738 37 2
Westbound 849 42 42 0 933 9 0
==> Project AM Traffic is estimated to be less than 1% of Projected AM Peak 1 Hour Traffic Volume.
Project AM Traffic is estimated to be 1% or greater of Projected AM Peak 1 Hour Traffic Volume.Intersection Capacity Utilization (ICU) Analysis is required.
Northbound 535 0 17 0 552 6 2
Southbound 1138 0 137 0 1275 13 0
Eastbound 1649 82 102 0 1833 18 1
Westbound 2446 122 67 0 2635 26 0
==> Project PM Traffic is estimated to be less than 1% of Projected PM Peak 1 Hour Traffic Volume.
Project PM Traffic is estimated to be 1% or greater of Projected PM Peak 1 Hour Traffic Volume.Intersection Capacity Utilization (ICU) Analysis is required.
PROJECT: Marina Park FULL OCCUPANCY YEAR: 2011
AM PEAK PERIOD
PM PEAK PERIOD
1% Traffic Volume Analysis
Marina Park TPOTraffic Analysis C-3
Austin-Foust Associates, Inc.029033tpo-AppC.pdf

Intersection: 3. Newport Blvd & Coast HwyExisting Traffic Volumes Based on Average Winter/Spring 2007
Peak 1 Hour Approved CumulativeExisting Regional Projects Projects Projected 1% of Projected Project
Approach Peak 1 Hour Growth Peak 1 Hour Peak 1 Hour Peak 1 Hour Peak 1 Hour Peak 1 HourDirection Volume Volume Volume Volume Volume Volume Volume
Northbound 0 0 0 0 0 0 0
Southbound 653 26 61 0 740 7 0
Eastbound 2562 102 16 0 2680 27 0
Westbound 1098 44 42 0 1184 12 5
==> Project AM Traffic is estimated to be less than 1% of Projected AM Peak 1 Hour Traffic Volume.
Project AM Traffic is estimated to be 1% or greater of Projected AM Peak 1 Hour Traffic Volume.Intersection Capacity Utilization (ICU) Analysis is required.
Northbound 0 0 0 0 0 0 0
Southbound 1087 43 105 0 1235 12 0
Eastbound 1534 61 83 0 1678 17 0
Westbound 2411 96 26 0 2533 25 3
==> Project PM Traffic is estimated to be less than 1% of Projected PM Peak 1 Hour Traffic Volume.
Project PM Traffic is estimated to be 1% or greater of Projected PM Peak 1 Hour Traffic Volume.Intersection Capacity Utilization (ICU) Analysis is required.
PROJECT: Marina Park FULL OCCUPANCY YEAR: 2011
AM PEAK PERIOD
PM PEAK PERIOD
1% Traffic Volume Analysis
Marina Park TPOTraffic Analysis C-4
Austin-Foust Associates, Inc.029033tpo-AppC.pdf

Intersection: 4. Riverside Ave & Coast HwyExisting Traffic Volumes Based on Average Winter/Spring 2008
Peak 1 Hour Approved CumulativeExisting Regional Projects Projects Projected 1% of Projected Project
Approach Peak 1 Hour Growth Peak 1 Hour Peak 1 Hour Peak 1 Hour Peak 1 Hour Peak 1 HourDirection Volume Volume Volume Volume Volume Volume Volume
Northbound 5 0 0 0 5 0 0
Southbound 428 0 2 0 430 4 1
Eastbound 2287 69 116 0 2472 25 0
Westbound 1182 35 112 0 1329 13 4
==> Project AM Traffic is estimated to be less than 1% of Projected AM Peak 1 Hour Traffic Volume.
Project AM Traffic is estimated to be 1% or greater of Projected AM Peak 1 Hour Traffic Volume.Intersection Capacity Utilization (ICU) Analysis is required.
Northbound 22 0 0 0 22 0 0
Southbound 532 0 2 0 534 5 1
Eastbound 1655 50 181 0 1886 19 7
Westbound 2361 71 171 0 2603 26 2
==> Project PM Traffic is estimated to be less than 1% of Projected PM Peak 1 Hour Traffic Volume.
Project PM Traffic is estimated to be 1% or greater of Projected PM Peak 1 Hour Traffic Volume.Intersection Capacity Utilization (ICU) Analysis is required.
PROJECT: Marina Park FULL OCCUPANCY YEAR: 2011
AM PEAK PERIOD
PM PEAK PERIOD
1% Traffic Volume Analysis
Marina Park TPOTraffic Analysis C-5
Austin-Foust Associates, Inc.029033tpo-AppC.pdf

Intersection: 5. Tustin Ave & Coast HwyExisting Traffic Volumes Based on Average Winter/Spring 2008
Peak 1 Hour Approved CumulativeExisting Regional Projects Projects Projected 1% of Projected Project
Approach Peak 1 Hour Growth Peak 1 Hour Peak 1 Hour Peak 1 Hour Peak 1 Hour Peak 1 HourDirection Volume Volume Volume Volume Volume Volume Volume
Northbound 0 0 0 0 0 0 0
Southbound 56 0 0 0 56 1 0
Eastbound 2055 62 121 0 2238 22 0
Westbound 1178 35 112 0 1325 13 4
==> Project AM Traffic is estimated to be less than 1% of Projected AM Peak 1 Hour Traffic Volume.
Project AM Traffic is estimated to be 1% or greater of Projected AM Peak 1 Hour Traffic Volume.Intersection Capacity Utilization (ICU) Analysis is required.
Northbound 3 0 0 0 3 0 0
Southbound 81 0 0 0 81 1 0
Eastbound 1476 44 184 0 1704 17 5
Westbound 2382 71 172 0 2625 26 2
==> Project PM Traffic is estimated to be less than 1% of Projected PM Peak 1 Hour Traffic Volume.
Project PM Traffic is estimated to be 1% or greater of Projected PM Peak 1 Hour Traffic Volume.Intersection Capacity Utilization (ICU) Analysis is required.
PROJECT: Marina Park FULL OCCUPANCY YEAR: 2011
AM PEAK PERIOD
PM PEAK PERIOD
1% Traffic Volume Analysis
Marina Park TPOTraffic Analysis C-6
Austin-Foust Associates, Inc.029033tpo-AppC.pdf

Intersection: 6. Newport Blvd & Via LidoExisting Traffic Volumes Based on Average Winter/Spring 2007
Peak 1 Hour Approved CumulativeExisting Regional Projects Projects Projected 1% of Projected Project
Approach Peak 1 Hour Growth Peak 1 Hour Peak 1 Hour Peak 1 Hour Peak 1 Hour Peak 1 HourDirection Volume Volume Volume Volume Volume Volume Volume
Northbound 1518 0 28 0 1546 15 1
Southbound 1383 0 10 0 1393 14 10
Eastbound 0 0 0 0 0 0 0
Westbound 297 0 0 0 297 3 0
==> Project AM Traffic is estimated to be less than 1% of Projected AM Peak 1 Hour Traffic Volume.
Project AM Traffic is estimated to be 1% or greater of Projected AM Peak 1 Hour Traffic Volume.Intersection Capacity Utilization (ICU) Analysis is required.
Northbound 1264 0 22 0 1286 13 13
Southbound 2326 0 49 0 2375 24 5
Eastbound 0 0 0 0 0 0 0
Westbound 293 0 0 0 293 3 0
Project PM Traffic is estimated to be less than 1% of Projected PM Peak 1 Hour Traffic Volume.
==> Project PM Traffic is estimated to be 1% or greater of Projected PM Peak 1 Hour Traffic Volume.Intersection Capacity Utilization (ICU) Analysis is required.
PROJECT: Marina Park FULL OCCUPANCY YEAR: 2011
AM PEAK PERIOD
PM PEAK PERIOD
1% Traffic Volume Analysis
Marina Park TPOTraffic Analysis C-7
Austin-Foust Associates, Inc.029033tpo-AppC.pdf

Intersection: 7. Newport Blvd & 32nd StExisting Traffic Volumes Based on Average Winter/Spring 2007
Peak 1 Hour Approved CumulativeExisting Regional Projects Projects Projected 1% of Projected Project
Approach Peak 1 Hour Growth Peak 1 Hour Peak 1 Hour Peak 1 Hour Peak 1 Hour Peak 1 HourDirection Volume Volume Volume Volume Volume Volume Volume
Northbound 1057 0 12 0 1069 11 1
Southbound 994 0 6 0 1000 10 10
Eastbound 354 0 1 0 355 4 1
Westbound 104 0 0 0 104 1 0
Project AM Traffic is estimated to be less than 1% of Projected AM Peak 1 Hour Traffic Volume.
==> Project AM Traffic is estimated to be 1% or greater of Projected AM Peak 1 Hour Traffic Volume.Intersection Capacity Utilization (ICU) Analysis is required.
Northbound 984 0 16 0 1000 10 14
Southbound 1813 0 27 0 1840 18 5
Eastbound 220 0 0 0 220 2 0
Westbound 100 0 0 0 100 1 0
Project PM Traffic is estimated to be less than 1% of Projected PM Peak 1 Hour Traffic Volume.
==> Project PM Traffic is estimated to be 1% or greater of Projected PM Peak 1 Hour Traffic Volume.Intersection Capacity Utilization (ICU) Analysis is required.
PROJECT: Marina Park FULL OCCUPANCY YEAR: 2011
AM PEAK PERIOD
PM PEAK PERIOD
1% Traffic Volume Analysis
Marina Park TPOTraffic Analysis C-8
Austin-Foust Associates, Inc.029033tpo-AppC.pdf

Marina Park TPO D-1 Austin-Foust Associates, Inc. Traffic Analysis 029033tpo.doc
APPENDIX D
COUNT DATA

D-2

D-3

D-4

D-5

Marina Park TPO E-1 Austin-Foust Associates, Inc. Traffic Analysis 029033tpo.doc
APPENDIX E
DEFINITIONS
Certain terms used throughout this report are defined below to clarify their intended meaning:
ADT Average Daily Traffic. Generally used to measure the total two-directional
traffic volumes passing a given point on a roadway. DU Dwelling Unit. Used in quantifying residential land use.
ICU Intersection Capacity Utilization. A measure of the volume to capacity ratio for an intersection. Typically used to determine the peak hour level of service for a given set of intersection volumes.
LOS Level of Service. A scale used to evaluate circulation system performance based on intersection ICU values or volume/capacity ratios of arterial segments.
Peak Hour This refers to the hour during the AM peak period (typically 7 AM - 9 AM) or the PM peak period (typically 3 PM - 6 PM) in which the greatest number of vehicle trips are generated by a given land use or are traveling on a given roadway.
TSF Thousand Square Feet. Used in quantifying non-residential land uses, and refers to building floor area.
V/C Volume to Capacity Ratio. This is typically used to describe the percentage of capacity utilized by existing or projected traffic on a segment of an arterial or intersection.
VPH Vehicles Per Hour. Used for roadway volumes (counts or forecasts) and trip generation estimates. Measures the number of vehicles in a one hour period, typically the AM or PM peak hour.

Marina Park TPO F-1 Austin-Foust Associates, Inc. Traffic Analysis 029033tpo.doc
APPENDIX F
PEAK HOUR SIGNAL WARRANT


Marina Park Draft EIR
Michael Brandman Associates H:\Client (PN-JN)\0064\00640022\DEIR\00640022 Sec11-00 Appendix Dividers.doc
K.2 - PARKING MANAGEMENT PLAN

Walker Parking Consultants 2550 Hollywood Way, Suite 303 Burbank, CA 91505 Voice: 818.953.9130 Fax: 818.953.9331 www.walkerparking.com
October 24, 2008 Anthony Brine, P.E., Principal Civil Engineer City of Newport Beach 3300 Newport Boulevard Newport Beach, CA 92663 Re: Parking Management Recommendations – Marina Park Project (revised) Newport Beach, California Dear Mr. Brine, Walker Parking Consultants is pleased to present this letter report covering the parking management alternatives for the Marina Park project on Balboa Peninsula. SUMMARY In discussing parking management issues with other community centers and sailing facilities in Southern California we have determined that parking management issues at similar facilities present unique and distinct challenges. We also determined that parking capacity issues at Marina Park are likely to occur during peak summer weekends, indicating that a permanent, year-round solution may not be the most efficient solution for this area. Rather, flexible solutions that can be modified and managed rapidly may be the best way to ensure efficient and available parking. From discussions with City staff, we understand that enforcement beyond 8:00 AM to 6:00 PM may be difficult to attain. Nonetheless, our recommendations sometimes include extending the hours of enforcement, when appropriate, for efficient operation. With this in mind, we recommend that the City develop the following initiatives to help manage parking at Marina Park:
1. Charge a fee for parking to help turn over the spaces and ensure the lot is available for beach goers and Marina Park patrons.
2. Parking fees should be enforced 24 hours per day to help manage overnight parking by residents that may otherwise interfere with access to the Marina Park community center.
3. Install multi-space meters at the lot to enable automatic payment for all spaces in all lots to efficiently manage the payment system.
4. Install flip signs to quickly, inexpensively and efficiently reserve spaces during events at the community center, Girl Scout House, marina, and sailing center.
In general, parking in Balboa Peninsula is impacted during the summer weekends from June to September. The peak demand period begins in the early afternoon and does not subside until nearly sunset. If events at Marina Park do not coincide with these peak demand periods, parking can be managed with simple economic cues. During peak summer periods, events should be scheduled either early in the morning (e.g. beginning at 8:00AM) or later in the evening to avoid the impact from the beach visitors.

Tony Brine Marina Park New Community Center
24 October 2008 Page 2 of 7
PROJECT DESCRIPTION The City of Newport Beach is creating a new plan for Marina Park that includes a community center, sailing center, and marina. The site is located between 15th Street and 18th Street along the bay side of the Newport Peninsula and currently includes various recreational uses and approximately 60 mobile homes. The proposed plan for the site consists of a10,200 square foot community center, an 11,200 square foot sailing center and café, a recreational park, and a 28-berth visitor marina. The Girl Scout House will also be relocated from its current location to the northwest corner of the project site. The recreational amenities at the park will include a playground, tennis courts, basketball courts, beach volleyball courts, and open park areas. In addition, docks and slips for sailing programs and improved beach access will be provided. Figure 1 outlines the proposed location of the Marina Park development. Figure 1: Project Study Area
Source: Google Earth Pro, Accessed September 24, 2008.
Figure 2 shows the proposed project site plan and related parking areas.
Figure 2: Project Site Plan
Source: City of Newport Beach, September 2008.
18th S
treet
Oceanfront
Balboa Blvd
Balboa Blvd
15th S
treet
Marina Park

Tony Brine Marina Park New Community Center
24 October 2008 Page 3 of 7
PROJECT BACKGROUND Access to Marina Park will be critical to the success of the development. A parking study examining the myriad uses was conducted by Austin-Foust in July 2008. Our understanding is that the City is satisfied with the projections from the Austin-Foust report; therefore, we have not studied the parking generation for this project. Our understanding is that parking at the Marina Park project is being developed to ensure that patrons and visitors using the facilities at Marina Park have appropriate parking and access to those facilities. During the summer months, parking will likely be problematic because as the Newport Peninsula beach lots and nearby on-street parking becomes unavailable many beach goers will likely park in any nearby space. With over 150 spaces in the main lot and the nearby “Girl Scout” lot, the Marina Park complex (Marina Park) will likely be used by beach visitors or other excursionists on the central part of the Peninsula. If the price for parking at Marina Park is attractive, beach goers and nearby residents will immediately fill the lot, leaving the Marina Park users unable to park anywhere near their intended destination. If beach goers and residents have a greater willingness to pay than Marina Park patrons then the Marina Park parking lot will be unavailable to Marina Park patrons throughout much of the summer, and particularly during the weekends. Our belief is that demand for parking on Newport Peninsula is nearly unlimited during the busy summer season. If supply is continually developed and subsidized, effectively removing economic considerations, parking will continue to be a problem throughout Newport Beach and near the Marina Park area specifically. PARKING MANAGEMENT In our earlier discussion and analyses we referred to many of the elements of parking management. Parking Management includes myriad strategies aimed at making better use of the available parking supply in any defined area. Proper parking management incorporates a number of goals, but a core principle is that parking spaces should be used efficiently. Parking spaces that sit unoccupied are inefficient as they represent significant financial and land resources, as well as the opportunity costs of the funds and real estate, that is not devoted to productive uses. This is especially true in a desirable place such as Newport Beach. It is also true where competition for impacted parking spaces exists a short distance away. The time and frustration that results from the search for a convenient space in these impacted areas represents inefficiencies. Parking management practices attempt to address inefficiencies through restrictions and parking pricing. We aim to allocate parking spaces for which there is high demand with user restrictions and/or prices to park. For spaces for which there is low demand, we relax parking restrictions and lower prices in order to maximize their utilization. In high demand area we recommend increased prices, strict enforcement, and greater turnover of the parking spaces. If spaces in high demand are free and/or spaces in low demand are priced, inefficiencies are created. We note that parking spaces are a finite resource and represent a real cost. We wish to allocate that resource as efficiently as possible. Finally, although not always politically popular, pricing is virtually always the most effective way to manage parking spaces.

Tony Brine Marina Park New Community Center
24 October 2008 Page 4 of 7
ALTERNATIVES This report is focused on managing the future parking at the Marina Park development. In an effort to conform to the likely requirements of the California Coastal Commission, our recommendations try to support equal access to all visitors and patrons of Marina Park as well as the beach going public. This is particularly important during the summer months from June to September. As we have observed from other parking studies conducted in the area, parking during weekend days throughout the summer will be nearly impossible to manage due to the significant demand and presumed willingness of infrequent beach goers to pay for parking during their excursion to the Newport beaches. To mitigate demand and help manage the parking, we have come up with several alternatives for the City to consider. The following is a list outlining the possible parking management strategies to help prioritize parking at Marina Park.
1. Install automated multi-space meters. In an area that has virtually unlimited
demand for parking and a commensurate shortage of land, one of the few solutions to help manage parking is to allocate the spaces to those who are most willing to pay. That is, we recommend installing parking meters. This may seem inherently unfair, or regressive; however, it helps alleviate parking in the less expensive, less desirable areas by removing vehicles that are willing to pay a premium for a space from the on-street spaces they would otherwise occupy. Given the size and circulation of the parking lots at Marina Park, we believe that multi-space pay-and-display meters will be the best solution, used in conjunction with any other combination of parking management that we outline in this report. To ensure optimal efficiency, pricing in the lot should be marginally higher than nearby on-street parking meter fees.
2. Charge for overnight parking. To help ensure that residents or businesses do not over utilize the
Marina Park parking lot, we recommend that a paid parking system be in operation at all times. This will ensure that there are no cars occupying the lot that are not there for a specific event or purpose. This will help ensure the lot does not become a long-term storage area for vehicles. If the lot is open, and free to residents overnight, having the lot available for morning classes or sailing lessons will be difficult to achieve.
3. Do not accept master park permits. Another measure that should be included in the plan is that
the Marina Park lot should not accept Newport Beach master park permits, blue pole permits or any other exempt parking permit that is accepted in other areas of the City. Again, this will help ensure that the Marina Park lot is available for Marina Park patrons, visitors and guests.
These first three recommendations will help ensure that the lot is primarily utilized by day visitors to Marina Park and not by long-term excursionists to other destinations or by residents seeking inexpensive and convenient parking. The alternatives below may help supplements these solutions by segmenting parking at Marina Park. It should be noted that these alternatives are more nuanced than the first three recommendations and have additional limitations that should be considered by the City.

Tony Brine Marina Park New Community Center
24 October 2008 Page 5 of 7
BEST OPTIONS—THOUGH NOT LIKELY TO BE APPROVED BY COASTAL COMMISSION
4. Marina Park Only Parking. The most obvious solution to achieve the City’s goal of ensuring the Marina Park lot is only used by its intended patrons is to restrict Marina Park parking to only the patrons, visitors and guests of the Marina, Sailing Center, Girl Scout Center, Community Center or Park. Of course this would be extremely difficult to enforce because it would not be readily apparent which vehicles were using the Marina Park facilities and which vehicles where using the beach or other nearby land uses. Permits could be used for community center visitors, or other registered users, but issuing permits for park users would be difficult to identify and control. In addition, we do not feel that this solution would be agreeable with the Coastal Commission’s stated goal of ensuring equal access to ALL beach visitors.
5. Validation. If there is a pricing mechanism for the Marina Park lot, all patrons, visitors, users, and
guests could receive a validation sticker to off-set or eliminate their cost to park in the lot. If pricing at the Marina Park lots is significantly higher than the surrounding spaces, it is likely to discourage all but the most price-insensitive patrons to park elsewhere. Of course, this again means that the lot will be underutilized except when there is an event at Marina Park. From our experience it is unlikely that the Coastal Commission will agree to this sort of validation system since it creates a preferential parking system that limits or restricts public access to the nearby beaches.
6. Reverse Validation. If the price to park at the Marina Park lot was twice as high as nearby on-
street or surface lot users of Marina Park facilities could be offered a rebate on their parking fees for whichever activity they are pursuing at Marina Park (reverse validation). Rather than validate parking (offsetting the price of parking) the user could pay the same price for parking as other users (beach visitors, residents and others seeking parking) but bring their parking receipt into the Marina Park offices to receive a discount on their sailing lesson, community center activity, or moorage fee. This system could be a bit confusing to infrequent users and may not be readily accepted by many Marina Park patrons, visitors, or guests. While technically everyone would pay the same fee for parking, the Coastal Commission may not approve such a minor technicality. As a result of these uncertainties, this may not be the most desirable solution.
OTHER OPTIONS – NOT RECOMMENDED
7. Pricing. If the Marina Park lot is priced significantly higher than nearby beach lots and on-street spaces it is likely that the lot will fill up only after all other areas spaces fill. This strategy may help ensure that Marina Park has as much availability as possible for as much time as possible. One drawback to this strategy is that during peak demand periods this lot will eventually fill up and Marina Park patrons will not have access. Another problem is that the lot will be significantly underutilized throughout the remainder of the year, as neither beach visitors, residents, nor Marina Park patrons will want to park in the most expensive spaces except during high demand days or during busy events. A market-rate pricing scheme that adjusts prices based on demand (occupancy) is recommended.

Tony Brine Marina Park New Community Center
24 October 2008 Page 6 of 7
8. Create priority areas for the Marina Park users. Another option is to create a parking system that sets aside (either with nesting gates or chains) a certain number of spaces for visitors that have Marina Park reservations for daily activities. As classes, events, or other reservations are made for the Marina Park users, parking could be paid in advance, along with their other fees, this helps ensure the Marina Park user that they will have a parking space when they come to Marina Park. This option would be fairly labor intensive because it would likely require that spaces be set aside in advance of any classes or events at the center and would essentially reduce the total number of available parking spaces for much of the day. A parking attendant would be recommended to ensure that parking is appropriately assigned. This sort of inefficiency is not desirable from a parking management perspective and would not likely be approved by the Coastal Commission.
RECOMMENDED OPTIONS
9. Install flip signs. Rather than create “Marina Park Parking Only” areas, a sign that changes dependant upon the expected amount of daily visitors can be installed. We often call these “flip signs” since they can flip open to display a message or flip closed to display a different message (or no message). Flip signs can be installed in some or all of the spaces (including near the Girl Scout Center) at Marina Park. When the facility has an event during the peak season, the signs can display a “Reserved For Marina Park Visitors Only” (or “Reserved for Girl Scout House”) sign. When there is no event, the sign can be flipped closed; opening the space to all visitors or guests to the area. Event reservations can be used to help determine the appropriate number of spaces to reserve.
10. Increase bicycle/pedestrian facilities. Demand for parking can be reduced by providing bicycle
and pedestrian facilities and amenities that make it easier and more pleasant to bicycle or walk to nearby destinations. This strategy could prove to be particularly valuable for a community center in an area like Balboa Peninsula. Some cities have also begun experimenting with bike stations or full-service bike lockers near destinations that provide lockers, changing rooms and showers for bicycle commuters. Bikestation services include secure, indoor bicycle parking available to members with a membership pass. In the Seattle Bikestation there is free attended bicycle parking during operating hours. Bicycle repair services and commuter retail items are also available at this facility, as well as public transportation schedules, bike maps, and a personalized service matching new bicycle commuters with experienced cyclists who can help them plan a commute route, provide tips on bicycle commuting, and generally serve as mentors.1
Bikestations are currently in use in several California cities including Long Beach, Palo Alto, and San Francisco.
1 Metro King County Government, http://transit.metrokc.gov/tops/bike/bikestation.html, accessed September 29, 2008.
Source: emedco.com

Tony Brine Marina Park New Community Center
24 October 2008 Page 7 of 7
RECOMMENDATIONS
The goal of this report is to provide the City with parking management solutions that will likely help provide the appropriate amount of access to Marina Park without restricting beach goers from parking at the area lots. We believe that a combination of solutions will be the most effective approach to achieving this goal. Namely, we believe that paid parking will be essential to help manage this facility. A multi-space, pay-and-display system that operates 24-hours per day will likely be the most efficient solution to help manage the parking. In addition, a fee that is slightly higher than the nearby on-street spaces will likely ensure that the Marina Park lots are the last to be occupied during busy summer peak demand periods. Flip signs that alternate between “Reserved For Marina Park Visitors Only” and “Parking Available” should be installed to help manage parking during events at Marina Park. To accomplish this, the Marina Park lots can estimate the number of users for any event, and flip open the “Reserved Parking” side of the sign to help ensure that Marina Park patrons have access to the facility. At all other times, the signs can be flipped closed, or display a “Parking Available” message to enable all vehicles on the Peninsula to use the parking facility. Finally, while not necessarily a parking management technique, demand for parking in general could be reduced at Marina Park by providing ample bicycle and pedestrian access and facilities. If you have any questions regarding our report, please do not hesitate to contact us. Sincerely,
Mark Linsenmayer WALKER PARKING CONSULTANTS cc: Steffen Turoff Rosalinh Ung
