marine asset management plan for an inland ferry...
TRANSCRIPT

Marine Asset Management Plan for an Inland Ferry Fleet
Opus International Consultants (Canada) Limited March 2012
Transport Research Board 9th National Conference on Transportation Asset Management)

British Columbia’s Inland Ferry System
14 Routes Variety of types including Reaction ferries Cable ferries and Free running ferries
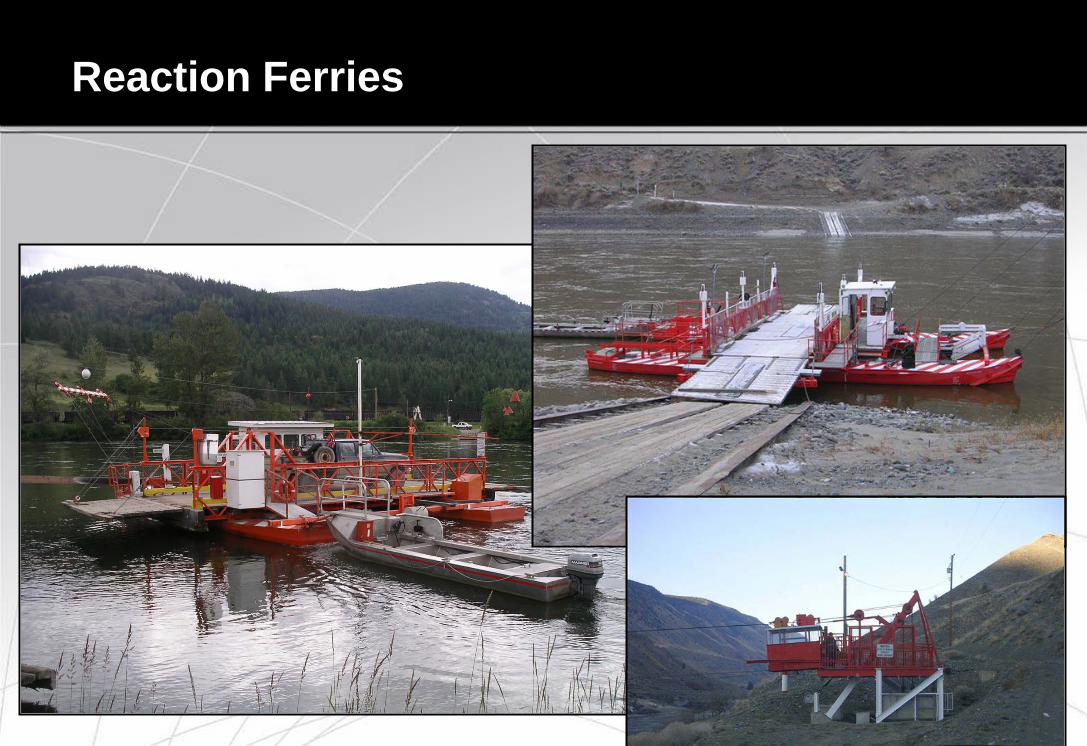
Reaction Ferries

Cable Ferries
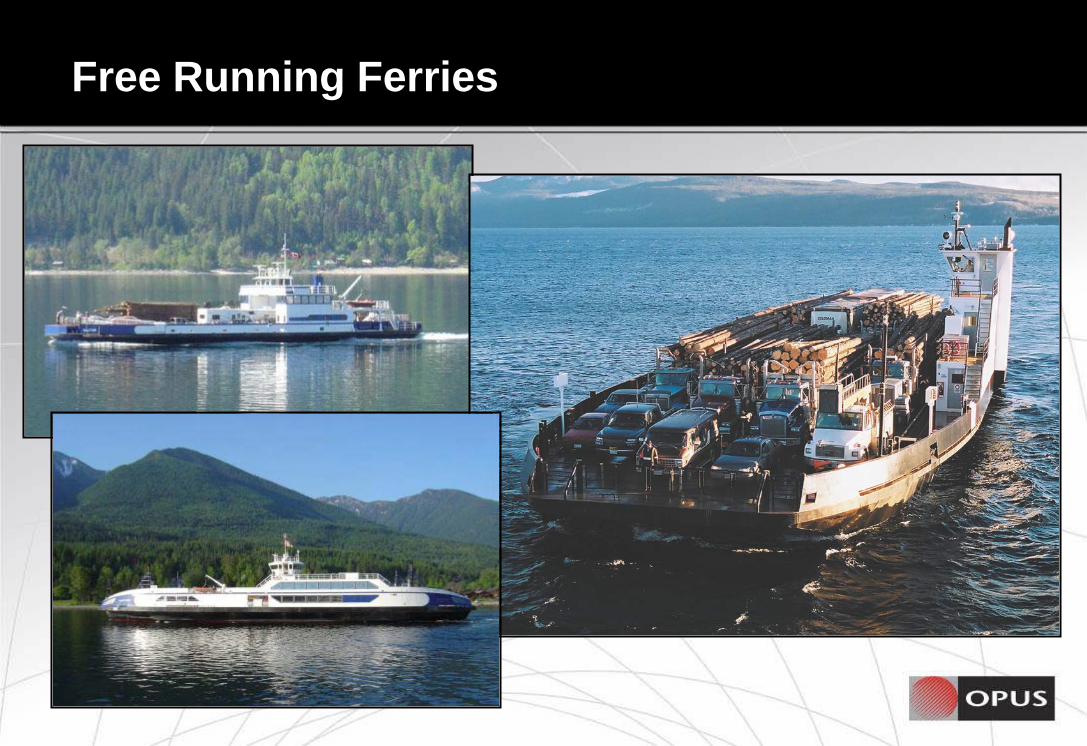
Free Running Ferries

Terminal Facilities
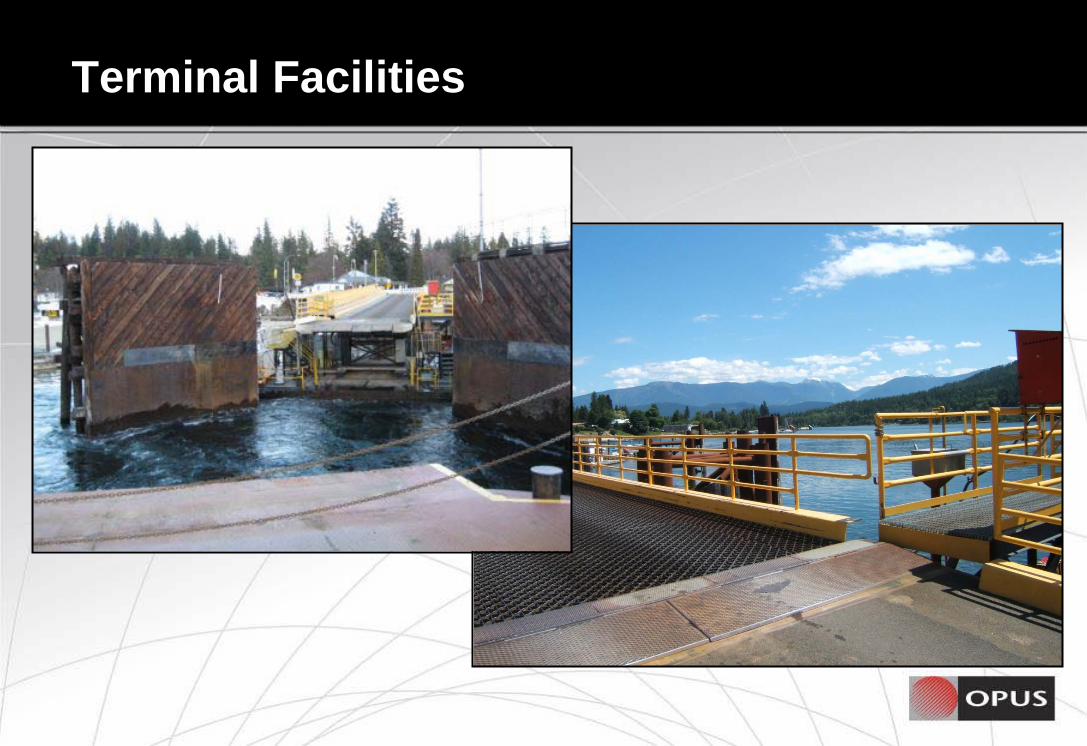
Terminal Facilities

Terminal Facilities

Terminal Facilities

Inland Ferry Fleet
14 Routes
Provides connectivity for road network
Free for users
Outsourced service

Asset Management Plan Project Drivers
Is a cornerstone strategic planning document
States how assets are to be managed over a period of time to achieve Ministry objectives
Defines Marine Branch’s practices, processes and systems that are being applied to the management of its infrastructure assets
Documentation to retain institutional knowledge / practice

Framework
Asset Management as a Process
Governance
Goals & Objectives Policies & Legislation 1
Inventory & Condition
Asset Inventory Measure Condition 3
Levels of Service
Asset Condition Other Demands 2
Option Identification
Performance Assessment Lifecycle Management
4
Performance Gaps Maintenance vs Rehabilitation
Decision Making
Optimization & Budget Considerations Risk Assessment
5
Implementation
Forward Work Program
Physical Works & Service Delivery
6
Qua
lity
Man
agem
ent
Cont
inuo
us Im
prov
emen
t Pe
rform
ance
Rep
ortin
g Pe
rform
ance
Mon
itorin
g
7
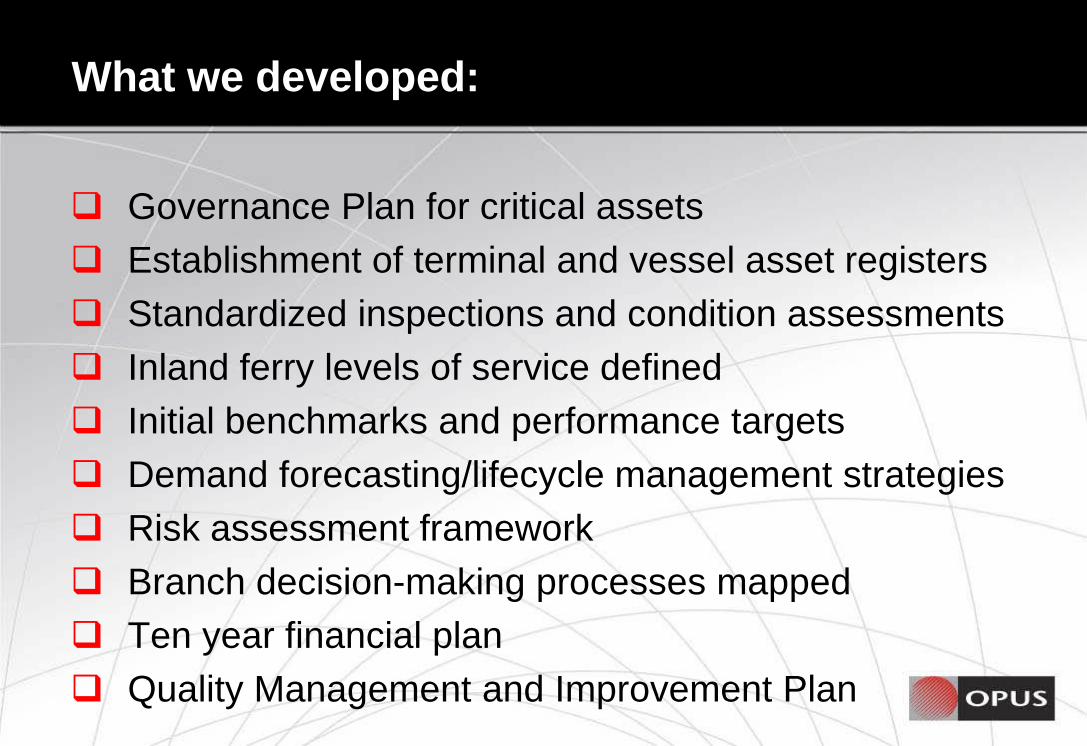
What we developed:
Governance Plan for critical assets Establishment of terminal and vessel asset registers Standardized inspections and condition assessments Inland ferry levels of service defined Initial benchmarks and performance targets Demand forecasting/lifecycle management strategies Risk assessment framework Branch decision-making processes mapped Ten year financial plan Quality Management and Improvement Plan

Governance Plan
Ris
k M
anag
emen
t
Opt
imiz
atio
n
Forw
ard
Wor
ks P
lan
Impr
ovem
ent P
lan
Perf
orm
ance
Asse
t Reg
iste
r
Insp
ectio
n Pr
oced
ures
Dat
a Va
lidat
ion
Branch Goals
Governance
Asset Management Plan
Plan Components

Governance Plan
Marine Branch(Internal Goals)
Provincial / MinistryGoals
RegulatoryRequirements
StakeholderExpectations
OperatorExpectations
Linkages between Levels of Government
Understanding and Managing Expectations

Standardized inspections and condition assessments
Focused on preserving the asset; Objective, repeatable, consistent survey methods; Definitions for Excellent, Good, Fair, Poor, Very Poor % of each key component at a given condition level Overall structure index used for planning
Vessel Information
PK Vessel ID
Vessel NameOfficial NumberPort of Registry
FK1 Charac_IDFK2 Component ID
Vessel Characteristics
PK Charac ID
BeamDraftFreeboardDisplacementLengthGross TonnageNet TonnageLightshipGeneratorsYear BuiltAgeSubdivision Class
Vessel Comparment List
PK Compartment ID
NameFK1 Elec Inv IDFK2 Elect Inv IDFK3 Aux Inv IDFK4 Mech Inv IDFK5 Struct Inv IDFK6 Fit Inv ID
Structural Inv Condition
PK Struct Inv ID
Item NameConditionDamageIntegrityFunctionalitySupportabilityDate Stamp
Mechnical Inv Condition
PK Mech Inv ID
Item NameConditionDamageIntegrityFunctionalitySupportabilityDate Stamp
Electrical Inv Condition
PK Elec Inv ID
Item NameConditionDamageIntegrityFunctionalitySupportabilityDate Stamp
Electronic Inv Condition
PK Elect Inv ID
Item NameConditionDamageIntegrityFunctionalitySupportabilityDate Stamp
Auxiliary Inv Condition
PK Aux Inv ID
Item NameConditionDamageIntegrityFunctionalitySupportabilityDate Stamp
Outfit Inv Condition
PK Fit Inv ID
ConditionDamageIntegrityFunctionalitySupportabilityItem NameDate Stamp
Data collection programs should be rational, practical and methodical
Levels of service and performance measurement
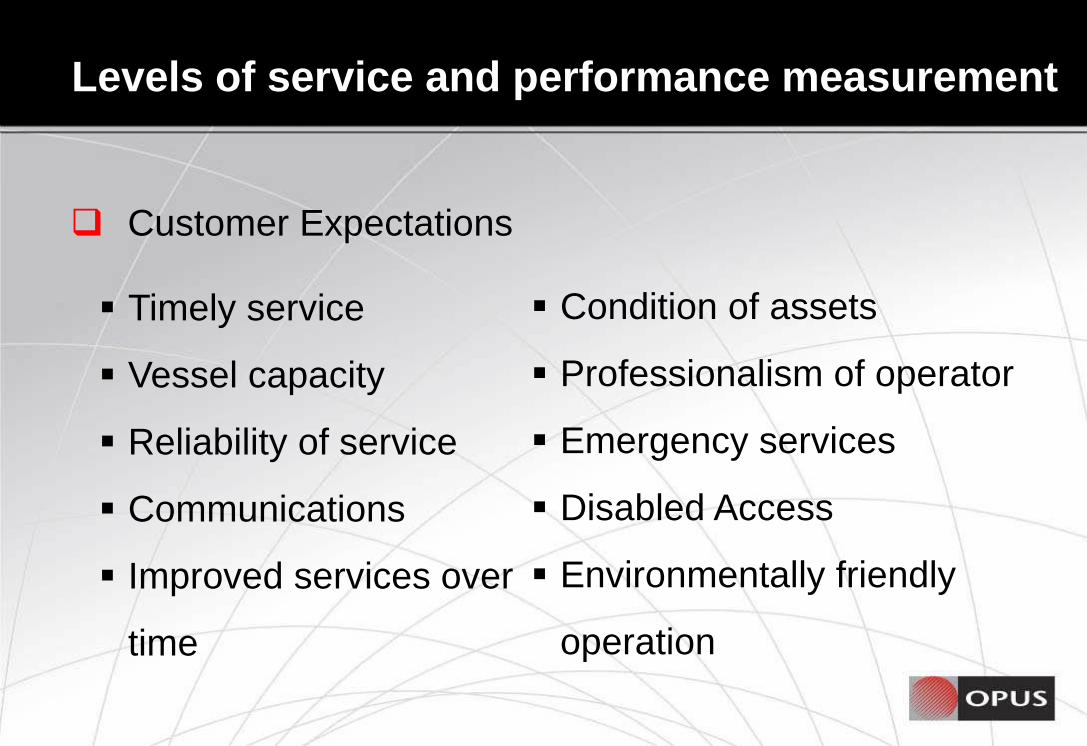
Customer Expectations Timely service
Vessel capacity
Reliability of service
Communications
Improved services over
time
Condition of assets
Professionalism of operator
Emergency services
Disabled Access
Environmentally friendly
operation

Levels of service and performance measurement
Ministry’s Priorities
Regulatory compliance
Condition of assets
Safety of the asset
Capacity of assets
Reliability of infrastructure
Preservation of assets
Maximize asset service life
Improved services over time
Optimized delivery

Levels of service and performance measurement
Assessed through knowledge of the asset, investigations, inspections, regulatory checks or through completed risk assessments.
Detailed Level ofService
Performance Measure
Regulatory
Resp Code Scale Targets Potential Actions
FLEET:At least 85 percent of the fleetis at Level 2 or better
FLEET:Percentage of fleet that is atLevel 2 or better
Marine Safety
ROUTE:1. Compliant; or2. Noncompliant / Low Risk
OPTIONS:
- Obtain exemptions toregulation for vessels that arelow risk- Refurbish vessels- Replace vessels
ROUTE:1. Compliant2. NC with Board decision3. NC, urgent action required
RM1
MarineBranch
FLEET:X events per year or less(X: Figure to be determined)
FLEET:Number of occupationalhealth and Safety events peryear
Operational Healthand Safety
(See Appendix I:Improvement Planfor more details)
ROUTE:X event per year or less(X: Figure to be determined)
OPTIONS:
- Increased auditing andmonitoring- Improved work practices- Contractual incentives
ROUTE:Number of occupationalhealth and Safety events peryear
Operator
FLEET:X operational impact per yearor less(X: Figure to be determined)
FLEET:Number of events affectingusers / the local environmentannually
Environmental(See Appendix I:
Improvement Planfor more details)
ROUTE:X event per year or less(X: Figure to be determined)
OPTIONS:
- Improved work practices- Increased inspection- Increased auditing andmonitoring- Contractual incentives
Operator
RM2
RM3
RM4
RM5
RM6
ROUTE:Number of environmentalimpact events per year
Compliance with Federal Marine Regs
Health and Safety Targets
Environmental Targets

* Key amenities include wash facilities on the vessel or at the terminal, rest areas for travelers, food services and foul weather shelter for passengers.
Detailed Level of Service
Reliability(Weight 35%)
Performance Measure
Service Provision - External
Level 5 Level 4 Level 3 Level 2
Peak Volume Traffic% of total sailings wherevehicles were left behindwhere data is available(Weight 25%)
CommunicationFerry service disruptions and/or delays(Weight 25%)
Amenities(Weight 15%)
Level 1Ferry may be out ofservice for unknownlengths of time basedon site conditionswhich may be beyondthe control of thecontractor
Unscheduled downtimedoes not exceed 5hours per month
Less than 40% of totalsailings where vehiclesare left behind
Less than 35% of totalsailings where vehiclesare left behind
Ferry Operator:- Updates Drive BC- Notifies MoT
Ferry Operator:- Updates Drive BC- Notifies MoT- Notify key stakeholdersdirectly by phone. (i.e.emergency service providersand/or frequent users)
Amenities not requiredand not provided
Amenities Available onan unscheduled orintermittent basis
Unscheduled downtimedoes not exceed 3hours per month
Unscheduled downtimedoes not exceed 2hours per month
Less than 30% of totalsailings where vehiclesare left behind
Less than 20% of totalsailings where vehiclesare left behind
Ferry Operator:- Updates Drive BC- Notifies MoT- Notify key stakeholdersdirectly by phone (i.e.emergency service providersand/or frequent users)-Important stakeholders arenotified directly by automaticemail from the Drive BCsystem
Ferry Operator:- Updates Drive BC- Notifies MoT- Notify key stakeholdersdirectly by phone (i.e.emergency service providersand/or frequent users)-Important stakeholders arenotified directly by automaticemail from the Drive BCsystem- Proactively makes use ofother information systemssuch as the TIS and portableCMSs
One to two amenitiesavailable
Two to three amenitiesavailable in total on thevessel and/or onshore
No unscheduleddowntime
Less than 10% of totalsailings where vehiclesare left behind
Ferry Operator:- Updates Drive BC- Notifies MoT- Notify key stakeholdersdirectly by phone (i.e.emergency service providersand/or frequent users)-Proactively updates DriveBCwith information aboutexpected delays (when usualbusy times are approachingor expected delays)-Proactively makes use ofother information systemssuch as the TIS and portableCMSs-Important stakeholders arenotified directly by automaticemail from the DriveBCsystem
Four or more amenitiesavailable in total on thevessel and/or onshore
Levels of service and performance measurement
Wait Times
Reliability
Communication
Amenities

* Key amenities include wash facilities on the vessel or at the terminal, rest areas for travelers, food services and foul weather shelter for passengers.
Detailed Level of Service
Reliability(Weight 35%)
Performance Measure
Service Provision - External
Level 5 Level 4 Level 3 Level 2
Peak Volume Traffic% of total sailings wherevehicles were left behindwhere data is available(Weight 25%)
CommunicationFerry service disruptions and/or delays(Weight 25%)
Amenities(Weight 15%)
Level 1Ferry may be out ofservice for unknownlengths of time basedon site conditionswhich may be beyondthe control of thecontractor
Unscheduled downtimedoes not exceed 5hours per month
Less than 40% of totalsailings where vehiclesare left behind
Less than 35% of totalsailings where vehiclesare left behind
Ferry Operator:- Updates Drive BC- Notifies MoT
Ferry Operator:- Updates Drive BC- Notifies MoT- Notify key stakeholdersdirectly by phone. (i.e.emergency service providersand/or frequent users)
Amenities not requiredand not provided
Amenities Available onan unscheduled orintermittent basis
Unscheduled downtimedoes not exceed 3hours per month
Unscheduled downtimedoes not exceed 2hours per month
Less than 30% of totalsailings where vehiclesare left behind
Less than 20% of totalsailings where vehiclesare left behind
Ferry Operator:- Updates Drive BC- Notifies MoT- Notify key stakeholdersdirectly by phone (i.e.emergency service providersand/or frequent users)-Important stakeholders arenotified directly by automaticemail from the Drive BCsystem
Ferry Operator:- Updates Drive BC- Notifies MoT- Notify key stakeholdersdirectly by phone (i.e.emergency service providersand/or frequent users)-Important stakeholders arenotified directly by automaticemail from the Drive BCsystem- Proactively makes use ofother information systemssuch as the TIS and portableCMSs
One to two amenitiesavailable
Two to three amenitiesavailable in total on thevessel and/or onshore
No unscheduleddowntime
Less than 10% of totalsailings where vehiclesare left behind
Ferry Operator:- Updates Drive BC- Notifies MoT- Notify key stakeholdersdirectly by phone (i.e.emergency service providersand/or frequent users)-Proactively updates DriveBCwith information aboutexpected delays (when usualbusy times are approachingor expected delays)-Proactively makes use ofother information systemssuch as the TIS and portableCMSs-Important stakeholders arenotified directly by automaticemail from the DriveBCsystem
Four or more amenitiesavailable in total on thevessel and/or onshore
Levels of service and performance measurement
Reaction Ferry Route Target: Level : 3.75

* Key amenities include wash facilities on the vessel or at the terminal, rest areas for travelers, food services and foul weather shelter for passengers.
Detailed Level of Service
Reliability(Weight 35%)
Performance Measure
Service Provision - External
Level 5 Level 4 Level 3 Level 2
Peak Volume Traffic% of total sailings wherevehicles were left behindwhere data is available(Weight 25%)
CommunicationFerry service disruptions and/or delays(Weight 25%)
Amenities(Weight 15%)
Level 1Ferry may be out ofservice for unknownlengths of time basedon site conditionswhich may be beyondthe control of thecontractor
Unscheduled downtimedoes not exceed 5hours per month
Less than 40% of totalsailings where vehiclesare left behind
Less than 35% of totalsailings where vehiclesare left behind
Ferry Operator:- Updates Drive BC- Notifies MoT
Ferry Operator:- Updates Drive BC- Notifies MoT- Notify key stakeholdersdirectly by phone. (i.e.emergency service providersand/or frequent users)
Amenities not requiredand not provided
Amenities Available onan unscheduled orintermittent basis
Unscheduled downtimedoes not exceed 3hours per month
Unscheduled downtimedoes not exceed 2hours per month
Less than 30% of totalsailings where vehiclesare left behind
Less than 20% of totalsailings where vehiclesare left behind
Ferry Operator:- Updates Drive BC- Notifies MoT- Notify key stakeholdersdirectly by phone (i.e.emergency service providersand/or frequent users)-Important stakeholders arenotified directly by automaticemail from the Drive BCsystem
Ferry Operator:- Updates Drive BC- Notifies MoT- Notify key stakeholdersdirectly by phone (i.e.emergency service providersand/or frequent users)-Important stakeholders arenotified directly by automaticemail from the Drive BCsystem- Proactively makes use ofother information systemssuch as the TIS and portableCMSs
One to two amenitiesavailable
Two to three amenitiesavailable in total on thevessel and/or onshore
No unscheduleddowntime
Less than 10% of totalsailings where vehiclesare left behind
Ferry Operator:- Updates Drive BC- Notifies MoT- Notify key stakeholdersdirectly by phone (i.e.emergency service providersand/or frequent users)-Proactively updates DriveBCwith information aboutexpected delays (when usualbusy times are approachingor expected delays)-Proactively makes use ofother information systemssuch as the TIS and portableCMSs-Important stakeholders arenotified directly by automaticemail from the DriveBCsystem
Four or more amenitiesavailable in total on thevessel and/or onshore
Levels of service and performance measurement
Free Running Ferry Target: Level : 2.2

Component, Structure/Vessel and Portfolio Condition Thresholds
Condition(Reactive)
Condition(Limit Asset Consumption)
Asset Management - Structures
MS1
MS3
For any structure componenthaving a Condition rating of 3.0 orgreater but less than 3.5
Develop a remediation strategy for the defect,deterioration or damage; or
Undertake works so component condition rating isless than or equal to 3.0 by the time the nextscheduled condition inspection is undertaken
Year 3 to 5
Condition(Serviceability) MS2
For any structure componenthaving a Condition rating of 3.5 orgreater but less than 4.0
Detailed Level of ServicePerformance Measure
Code Intervention Criteria Action Timeframe
Com
pone
nt Fully investigate and have in place a remediationstrategy for the defect, deterioration or damage; or
Undertake works so component condition rating isless than or equal to 3.0 by the time the nextscheduled condition inspection is undertaken
Year 2 to 3
For any structure componenthaving a Condition rating of 4.0 orgreater
Undertake works so component condition rating isless than or equal to 3.0 by the time the nextscheduled condition inspection is undertaken Year 1

Annual Scorecard
Route
Route Specific Fleet / Overall
Clas Regulatory Condition Clas Regulatory Comm. Condition
SP1 RM1 RM3 RM5 MS2 MS3 MS4 MS5 VM1 VM3 SP2 RM2 RM4 RM6 CM1 CM2 MS6 VM4
Free Running Ferry Routes
Kootenay Lake 2.55 C
Future Implementation
Future Implementation
1 4
Future Implementation
Future Implementation
0.0% 9.1%
Future Implementation
84.6%
Future Implementation
Future Implementation
100.0%
Future Implementation
Future Implementation
0.5%
Upper Arrow 2.40 C 3 4 0.0% 0.0%
Francois Lake 1.80 C 2 0 50.0% 0.0%
Barnston Island 1.80 C 0 3 0.0% 0.0%
Cable Ferry Routes
Arrow Park 2.55 C 1 2 9.1% 0.0%
Needles 2.90 C 0 0 0.0% 0.0%
Glade 2.55 C 1 0 0.0% 0.0%
Harrop 2.55 C 1 0 0.0% 0.0%
Adams Lake 2.55 C 0 0 4.5% 0.0%
Reaction Ferry Routes
Lytton 3.25 C 0 0 0.0% 0.0%
Big Bar 3.25 C 0 0 30.0% 0.0%
McLure 3.25 C 0 0 0.0% 0.0%
Little Fort 3.25 C 0 0 0.0% 0.0%
Usk 3.75 N 0 0 0.0% 0.0%

Risk assessment framework
Business Management • Previous focus
Project Management • Consultants and Capital
Works
Contract Management • Ferry Operators
Asset Management • Asset Data / System • Asset Performance • Ops and Emerg.
Response

Risk assessment framework
Availability Community relations Economic Environmental Probity Quality Safety Staff development Time/Schedule
CONSEQUENCES (loss)
Negligible (1) Minor (10) Medium (40) Major (70) Substantial (100)
LIKELIHOOD
Likely (5)
5 Low ThreatACCEPT ACTIVELY-Enhance systems to
minimise potential-Accept or Repair
50 Moderate threatACCEPT ACTIVELY-Enhance systems to
minimise potential
200 Very high ThreatAVOID
-Immediate action-Enhance systems to
minimise potential
350 Extreme threatAVOID
Immediate Action-Cease Activity
500 Extreme threatAVOID
-Immediate action-Cease Activity
Quite Common
(4)
4 Low ThreatACCEPT ACTIVELY-Enhance systems to
minimise potential- Accept or Repair
40 Moderate threatACCEPT ACTIVELY-Enhance systems to
minimise potential-Insure
160 Very high ThreatAVOID
-Immediate action-Enhance systems to
minimise potential
280 Extreme threatAVOID
- Immediate Action- Cease Activity
400 Extreme threatAVOID
-Immediate action-Cease Activity
Unlikely (3)
3 Negligible ThreatACCEPT PASSIVELY
-Repair
40 Moderate threatACCEPT ACTIVELY-Enhance systems to
minimise potential-Insure
-Contingency Plan
120 High threatACCEPT ACTIVELY OR
TRANSFER-Immediate Action
-Insure-Contingency Plan
210 Very high threatAVOID
-Immediate Action-Contingency Plan
300 Very high threatAVOID
-Immediate Action-Contingency Plan
Unusual (2)
2 Negligible ThreatACCEPT PASSIVELY
-Repair
20 Low ThreatACCEPT ACTIVELY OR
TRANSFER-Repair
80 Low ThreatACCEPT ACTIVELY OR
TRANSFER-Monitor- Insure
-Contingency Plan
140 High threatAVOID OR TRANSFER
-Monitor- Insure
-Contingency Plan & Disaster Plans
200 Very high threatAVOID / TRANSFER
-Monitor- Insure
-Contingency Plan & Disaster Plans
Rare (1)
1 Negligible ThreatACCEPT PASSIVELY
-Repair
10 Low ThreatACCEPT ACTIVELY OR
TRANSFER-Repair
40 Low ThreatACCEPT ACTIVELY OR
TRANSFER-Monitor- Insure
-Contingency Plan
70 High threatAVOID OR TRANSFER
-Monitor- Insure
-Contingency Plan & Disaster Plans
100 Very high threatAVOID / TRANSFER
-Monitor- Insure
-Contingency Plan & Disaster Plans

Branch decision-making processes mapping
Vessel Replacement
New / Replacement VesselAssessment (See S1.4)
Operational costs and trendsof existing vessel
User demand assessment overvessel service life
Anticipated OperationalRequirements (Regulatory)
Performance targets for newvessel
Terminal facility requirementsfor new vessel
Fleet Planning Considerations
Level of ServiceNon-Achievement (See S1.2)
Obsolescence (VM3)
Service Provision (SP1, SP2)
Fleet Renewal (VM4)
Safety (RM1 or RM2)Will a replacement or newsecond vessel potentiallyenable Branch to achieveall Levels of Service on
Route?
Branch enhances servicesprovided, increases
inspections, improveswork methods and
procedures, refurbishesvessels to allow for LoS
achievement
Yes
N Are LoS targetsreasonable?
Can Branch achievetarget LoS on route by
improving existing vesselor service delivery?
Branch adjusts Level ofService targets while
ensuring that new targetsare acceptable to Branch
and users of route
No
Marine Branch conductsongoing assessment of route
and fleet compliance to definedLoS Targets
Branch investigatesalternative optionsincluding fixed link,
demand management andstakeholder expectation
management
No
Y
Definevessel
specificationsY
Evaluate vesselalternatives
Obtain vesselproposals
Select preferredvessel option
Non-Vessel Replacement Alternatives to Achieve Levels of Service (See S1.3) Procurement(See S1.5)

Thank You
Any Questions?
Levels of service and performance measurement
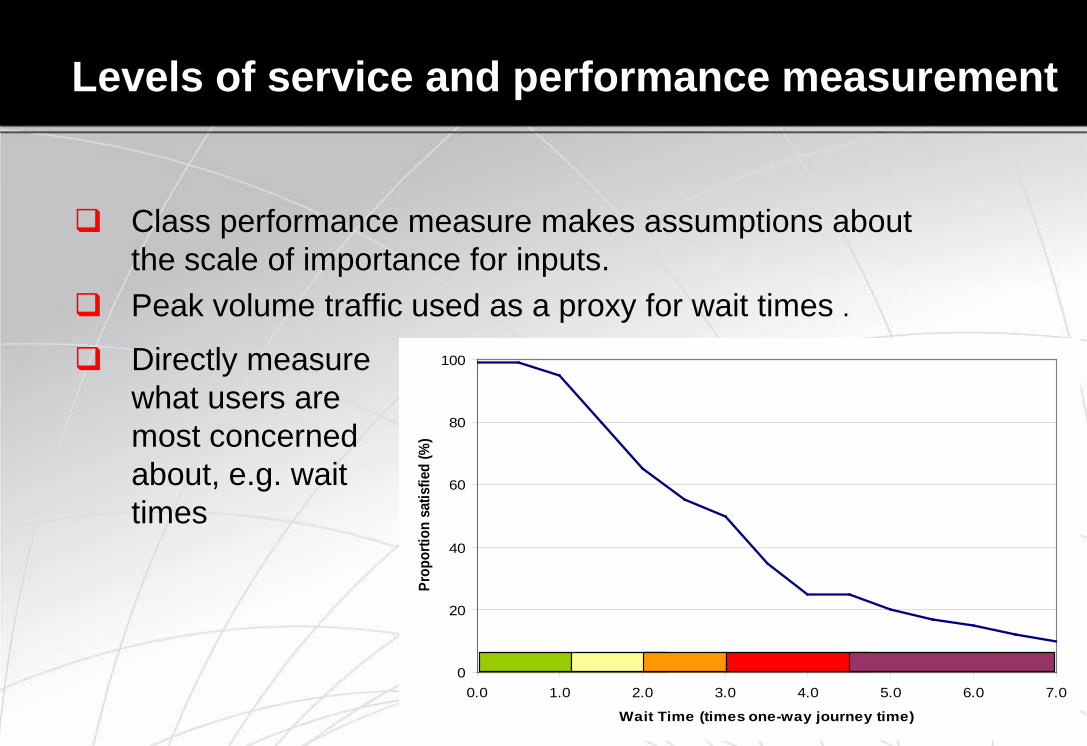
Class performance measure makes assumptions about the scale of importance for inputs.
Peak volume traffic used as a proxy for wait times .
Directly measure what users are most concerned about, e.g. wait times
0
20
40
60
80
100
0.0 1.0 2.0 3.0 4.0 5.0 6.0 7.0
Wait Time (times one-way journey time)
Prop
ortio
n sa
tisfie
d (%
)