marine litter in the north-east atlantic region
TRANSCRIPT

Marine litter in the
North-East Atlantic Region
OS
PA
R C
OM
MIS
SIO
N

Marine litter in the North-East Atlantic Region
Assessment and priorities for response
Rebeca Lopez Lozano and John Mouat KIMO International
Regional Consultants
February 2009

II
© 2009, OSPAR Commission ISBN 978-1-906840-26-6 This report shows what is believed to be the best available information on the assessment of marine litter in the North-East Atlantic. No liability for the accuracy or completeness of the information and data presented in this report will be accepted by the OSPAR Commission or by the governments of Contracting Parties to the OSPAR Convention. The designations employed and the presentation of the material in this publication do not imply the expression of any opinion whatsoever on the part of the OSPAR Commission, the governments of Contracting Parties to the OSPAR Convention, or the United Nations Environment Programme concerning the legal status of any country, territory, city or area or of its authorities, or concerning delimitation of its frontiers or boundaries. Moreover, the views expressed do not necessarily represent the decision or the stated policy of the OSPAR Commission, the governments of Contracting Parties to the OSPAR Convention, or the United Nations Environment Programme, nor does citing of trade names or commercial processes constitute endorsement. The preparation of this report was financed by the United Nations Environment Programme. For bibliographic purposes this document may be cited as: OSPAR (2009). Marine litter in the North-East Atlantic Region: Assessment and priorities for response. London, United Kingdom, 127 pp. This publication may be reproduced in whole or in part and in any form for educational or non-profit purposes without special permission from the copyright holder, provided acknowledgement of the source is made. The OSPAR Commission and the United Nations Environment Programme would appreciate receiving a copy of any publication that uses this publication as a source. No use of this publication may be made for resale or for any other commercial purpose whatsoever without prior permission in writing from the OSPAR Commission. Cover design: Nikki Meith Cover photo: KIMO Graphics: p. 21 - Jan Andreas van Franaker; p.31 - Jan Andreas van Franaker; p.42 - Tim Fanshawe/MCS; p.48 - Skomer MNR Staff; p.48 - Steve Trewhella; p.49 - Mick Clifton/Shetland Amenity Trust; p.51 - Caroline Curtis; p.52 - Austin Taylor; p.53 - Rebecca Hosking/BBC; p.54- Jan Andreas van Franaker

III
Acknowledgements This report was prepared with the financial support of the United Nations Environment Programme (UNEP) and the OSPAR Commission. We would like to express our gratitude to Dr. Ellik Adler, Senior Programme Officer, Regional Seas Programme Coordinator, UNEP, Dr. Ljubomir Jeftic, Chief Marine Litter Consultant, Regional Seas Programme (RSP) UNEP, Prof. David Johnson, Executive Secretariat, OSPAR, Sebastian Unger, Deputy Secretariat, OSPAR, and Sylvie Ashe, OSPAR, for their support, assistance and advice during the preparation of this assessment. The assessment was only possible thanks to the contributions made by all the Contracting Parties and their National Contacts; Francis Kerckhof (Belgium), Bergmann Finnsson (Faroe Islands), Arnaud Guéna (France), Hans-Georg Neuhoff (Germany), Sesselja Bjarnadóttir (Iceland), Eugene Nixon (Ireland), Floor de Kleijn and Lex Oosterbaan (The Netherlands), Anne E. Langaas (Norway), João Pedro Barreiros (Azores, Portugal), Mr. Jose L. Buceta Miller (Spain), Jacob Hagberg (Sweden) and Andy Greaves (United Kingdom). We would also like to thank the members of the Inter-Sessional Correspondence Group on Marine Litter (ICG) and other experts for their suggestions, help and time in this research; David M Fleet (Germany), Eugene Nixon (Ireland), Lex Oosterbaan and Barbara Wenneker (The Netherlands), Dr Sue Kinsey (United Kingdom), Dr Richard Thompson (United Kingdom). Finally, we would like to thank everybody who has been involved in the project, sharing their knowledge, thoughts and support for this assessment. All the experts mentioned above and others that have not been mentioned, which are gratefully acknowledged. Regional Consultants: KIMO International John Mouat Project Manager KIMO International Grantfield Lerwick Shetland UK ZE1 ONT Tel +44 (0) 1535 744826 Email [email protected] Web www.kimointernational.org
Rebeca Lopez Lozano Researcher KIMO International Grantfield Lerwick Shetland UK ZE1 ONT Email [email protected]

IV
Executive Summary Marine litter is one of the most pervasive pollution problems affecting the marine environment. It has been defined as ‘any persistent, manufactured or processed solid material discarded, disposed of or abandoned in the marine and coastal environment. Marine litter consists of items that have been made or used by people and deliberately discarded into the sea or rivers or on beaches; brought indirectly to the sea with rivers, sewage, storm water or winds; or accidentally lost, including material lost at sea in bad weather’ 1 The universal challenge of sustainable management of marine litter is a perfect illustration of a worldwide and transboundary marine environmental problem and is one of eight contaminant categories of the Global Programme of Action for the Protection of the Marine Environment from Land-Based Activities (GPA) of UNEP. The OSPAR Commission’s (OSPAR’s) initial contribution to the marine litter category has been to undertake an assessment of the problem in the North-East Atlantic Region with the support of UNEP. There is one clear picture that emerges from the data that has been collected in this assessment of marine litter in the OSPAR Maritime Area and that is, despite year on year variability, the overall amount of marine litter is consistently high and is not reducing despite recent efforts. The results for the OSPAR Pilot Project on Marine Beach Litter Monitoring showed that from 2001 to 2006 there was no statistically significant increase or decrease in the amount of marine beach litter in the North-East Atlantic. The spatial distribution of marine beach litter is significantly different throughout the area however. The highest levels recorded during the OPSPAR Pilot Project were in the Greater North Sea Region with 600-1400 items per 100m of beach surveyed in the Northern North Sea and 200-600 items per 100m in the Southern North Sea. In the Celtic Seas levels were also high with 600-800 items per 100m. However levels were higher in the south, as shown by the MCS Beachwatch Survey 2007 where 3,230 items per km were monitored in the south west of England compared to 1,057 items per km in Northern Ireland. Marine Litter levels on beaches in the Bay of Biscay and Iberian Coast were much lower with only 100-300 items per 100m. In France anecdotal evidence from local authorities suggests that on average around 30 tonnes of marine litter are collected per km per year. Whilst the Wider Atlantic and Arctic Waters are likely to have the lowest levels, however due to lack of quantitative data for these areas it is not possible to carry out an assessment. Amounts of marine litter at sea have also remained constant but show varied spatial distribution with litter on the seabed varying significantly from 0 to 101000 pieces of litter per km2, due to topological and tidal differences. In the Greater North Sea the background study into the EcoQO on plastic particles in Fulmars’ stomachs showed that there was a reduction in the amount of litter at sea during the late 1990’s with the average amount of plastic per bird falling from 0.5g to 0.3g. This reduction levelled off around the year 2000 and there has been no downward trend in recent years. In the Bay of Biscay strong seasonal variation was noted with 7 times more litter found on the seabed in winter compared to summer. Monitoring, both at the coastline and at sea, has confirmed that the predominant type of marine litter is plastic although the values at sea and on the coastline differed. There was little data for the wider Atlantic and Arctic Waters but on the Greater North Sea coast plastic predominated with the highest level in the north where it made up 80% of items monitored. This value reduced in southern waters with plastic making up 75% of items on the Southern North Sea coast, 70% in the Celtic sea and 62% on the Iberian Coast and Bay of Biscay. In these southern areas sanitary waste (16%) and paper and cardboard (13%) made up a larger percentage of the total. In the monitoring of seabed marine litter in the various Fishing for Litter projects the proportion of plastic varied from 55% in the Celtic Seas to 38% in the Greater North Sea. Other items such as metal (23-13%), rubber (25-9%) and wood (10-11%) made up a greater proportion of the total number of items compared to marine litter monitored on beaches. This is as expected as many types of plastic float and therefore are concentrated on the surface of the sea and at the coastline whereas heavier items sink to the seabed. Identifying sources of marine litter is difficult as many types of items can come from multiple sources. This is demonstrated in the Beachwatch survey, in the UK, where the largest source is non-sourced items at 42% of the total with recreation beach users at 35% and fishing at 14%. The OSPAR Pilot Project on Marine Beach Litter Monitoring identified several indicator items specific to different sources in an attempt to analyse trends. However analysis of the data for the whole of the OSPAR Region showed a consistent
1 http://www.unep.org/regionalseas/marinelitter/about/default.asp

V
picture with no trends in shore based sources such as tourism or sanitary waste. There was also no trend for sea based sources galley waste and shipping, although fishing sources did show an increase from 2001 to 2006. The only quantitative data on the environmental impact of marine litter is from the background study into the EcoQO on plastic particles in Fulmars’ stomachs. Averaged for the whole North Sea, 94% of birds investigated contained plastic; on average 34 pieces and 0.30 gram mass and 55% of all birds exceeded the level of 0.1 gram of plastic in the stomach much higher than the preliminary EcoQO target of 10%. Other anecdotal evidence shows that a wide range of organisms are effected by either entanglement in or ingestion of marine litter including; birds, seals, turtles, porpoises and whales. In addition to the direct impacts, there is evidence that invasive species have also been carried into the Region by marine litter as in the case of the exotic barnacle species Elminius modestus, which has been found on plastic on the shoreline of the Shetland Islands. One of the emerging issues for marine litter in the Greater North Sea is the discovery of microscopic plastic particles, in the μm to mm size range, in the marine environment at concentrations of 150-2400 particles per m3. These have been shown to be widespread and based on plankton records have been increasing in line with the production of synthetic fibres. The impact of this type of pollution on marine organisms is not yet known although several organisms have been shown to ingest the particles, which could potentially cause damage physically or by transport of hazardous substances. The cost of cleaning marine litter from beaches can be significant with the cost usually falling to local authorities rather than national governments. For example in 2004 UK local authorities, industry and coastal communities spent approximately £14 million (€17.7 million) cleaning up marine litter. In tourist areas these figures are even higher: for example, Den Haag Municipality in the Netherlands (receiving 15 million visitors a year) spends €626,709 (approx £500,450) per year on coastal cleaning. However, the costs are far more significant if the financial impacts other than just cleaning are considered. KIMO estimated, in 2000, that in a worst case scenario the cost to the Shetland community (population 22,000) could be as much as £5.6 million (approx €7.1 million) per year. In addition to the cost of beach cleaning (local authority and voluntary), this figure included the costs for aquaculture, power generation, farming, fishing, harbours and lifeboat launches. Despite the overall picture being clear there are still gaps in detailed knowledge concerning marine litter. Most of the information comes from beach monitoring of litter but outside the OSPAR monitoring programme almost all the monitoring is undertaken by local authorities or NGO’s with very little harmonisation between countries. The data is also not collected centrally within Contracting Parties and in relation to litter at sea and on the seabed there are relatively few studies making analysis of the problem in the Wider Atlantic extremely difficult. Awareness of the issues and regulations relating to marine litter also needs to be improved. For example two of the main sources of marine litter are the shipping and fishing industries however there are no compulsory courses on marine environmental awareness in either of these sectors. The diffuse nature of marine litter pollution also makes prosecution of those who break existing legislation extremely difficult and, hence, almost no convictions are ever brought severely reducing the effectiveness of legislation. There is also still a lack of practical programmes and measures at a national level to tackle marine litter. To date most of the programmes have involved monitoring of litter or legislation rather than practical action. In order to tackle the problem of marine litter a much broader suite of economic and practical incentives, such as Fishing for Litter, is recommended. OSPAR should continue its efforts to tackle these issues if it is to be successful in reducing the levels on marine litter. However, for this to be successful, Contracting Parties also need to also place more emphasis on marine litter in their own national priorities.

VI
Contents Assessment of the Marine Litter Problem in the North-East Atlantic Maritime Area and Priorities for Response................................................................................................................................. I Acknowledgements .................................................................................................................................... III Executive Summary .................................................................................................................................... IV Contents.......................................................................................................................................................VI List of Figures ............................................................................................................................................VII List of Tables .............................................................................................................................................VIII 1. Introduction .............................................................................................................................................. 1 2 The Scale of the Problem ......................................................................................................................... 5
2.1 Amounts of Marine Litter in the North-East Atlantic ..........................................................5 2.1.1 Amounts found at Coastlines .......................................................................................................... 5 2.1.2 Amounts found at Sea.................................................................................................................... 14
2.2 Types of Marine Litter in the North-East Atlantic ............................................................21 2.2.1 Types at Coastline .......................................................................................................................... 21 2.2.2 Types At Sea ................................................................................................................................... 27
2.3 Sources of Marine Litter in the North-East Atlantic Region ...............................................29 2.3.1 Land-based sources ...................................................................................................................... 29 2.3.2 Sea-based sources ........................................................................................................................ 34
3 Environmental Effects, Economic Losses and other Negative Effects caused by Marine Litter .... 38
3.1 Ecological/Environmental effects ................................................................................38
3.2 Abandoned and Lost Fishing Gear (ALFG)....................................................................45
3.3 Socio-economic Effects ............................................................................................46 3.3.1 Cost of Management of Marine Litter at the Community level, and other levels...................... 49
4 Existing Legal Regimes in the areas related to the Marine Litter in the North-East Atlantic .......... 51
4.1 International ...........................................................................................................51
4.2 National and Local Legislation....................................................................................55 4.2.1 Iceland.............................................................................................................................................. 55 4.2.2 Faeroe Islands (Denmark) .............................................................................................................. 55 4.2.3 Norway............................................................................................................................................. 55 4.2.4 Netherlands ..................................................................................................................................... 55 4.2.5 Sweden ............................................................................................................................................ 55 4.2.6 Germany .......................................................................................................................................... 55 4.2.7 UK..................................................................................................................................................... 56 4.2.8 Belgium............................................................................................................................................ 59 4.2.9 Ireland .............................................................................................................................................. 60 4.2.10 Spain .............................................................................................................................................. 60 4.2.11 France ............................................................................................................................................ 61 4.2.12 Portugal (Azores) .......................................................................................................................... 61
4.3 Responsible Organisations for Marine Litter .................................................................61 4.3.1 Iceland.............................................................................................................................................. 61 4.3.2 Faeroe Islands (Denmark) .............................................................................................................. 62 4.3.3 Netherlands ..................................................................................................................................... 62 4.3.4 Germany .......................................................................................................................................... 62 4.3.5 UK..................................................................................................................................................... 63 4.3.6 Belgium............................................................................................................................................ 63 4.3.7 Ireland .............................................................................................................................................. 63 4.3.8 Spain ................................................................................................................................................ 63 4.3.9 France .............................................................................................................................................. 63 4.3.10 Portugal (Azores) .......................................................................................................................... 63

VII
5 Programmes and Measures in the North-East Atlantic ....................................................................... 64
5.1 Port reception facilities (PRFs) ...................................................................................67 6 Existing Monitoring Programmes related to Marine Litter in the North-East Atlantic...................... 71
7 Scientific Studies and Research in Marine Litter................................................................................. 72 8 Summary of Marine Litter Situation in the OSPAR Maritime Area Regions ...................................... 74
8.1 Arctic Waters ..........................................................................................................74
8.2 Greater North Sea ....................................................................................................74
8.3 Celtic Seas .............................................................................................................75
8.4 Bay of Biscay and Iberian Coast .................................................................................76
8.5 Wider Atlantic .........................................................................................................76 9 Gaps, Needs, Priorities and Recommendations .................................................................................. 77
9.1 Gaps and Needs ......................................................................................................77
9.2 Priorities and Recommendations ................................................................................78
9.3 Proposals for Action.................................................................................................79 Annex 1. Assessment of the marine litter problem in the North-East Atlantic Maritime Area and priorities for response. National Questionnaire...................................................................................... 84 Annex 2. Monitoring programmes related to marine litter ................................................................... 104 Annex 3. Scientific studies and research in marine litter .................................................................... 116
List of Figures
Figure 1.1 OSPAR Maritime Area Regions ........................................................................................................2 Figure 2.1 Average number of marine litter items per 100 meters on the reference beaches .....................5 Figure 2.2 Most common (total numbers) items on reference beaches .........................................................6 Figure 2.3 Average number of items in different categories. ..........................................................................6 Figure 2.4 Average number of marine litter items on Northern North Sea reference beaches ....................7 Figure 2.5 Average number of marine litter items on Southern North Sea reference beaches............................ 7 Figure 2.6 Amounts of marine litter from on the Dutch reference beaches, 2001-2007................................8 Figure 2.7 Mean number of items of litter/km surveyed recorded in Beachwatch surveys 1994- 2007
for the whole of the UK...............................................................................................................................9 Figure 2.8 Mean number of items of litter/km surveyed recorded in the Channel Islands during
Beachwatch...............................................................................................................................................10 Figure 2.9 Weight (Kg) of marine litter items per km during 2004-2008. Legend: Metaal en blikjes:
metal and cans, Restafval: rest – other, Hout: Wood, Touw en textiel: rope and cord, textile, Papier en carton: paper and cardboard, Plastiek: plastic, Glas: glass ...............................................11
Figure 2.10 Average number of marine litter items on Celtic Sea reference beaches ................................11 Figure 2.11 Items per km surveyed in MCS Beachwatch on Northern Irish beaches .................................12 Figure 2.12 Items per km surveyed in MCS Beachwatch on Welsh beaches………………………………………. 12 Figure 2.13 Average number of marine litter items on Iberian coast reference beaches ...........................13 Figure 2.14 Spatial and Temporal Analysis of Microscopic Plastic Particles..............................................15 Figure 2.15 Fulmars feeding at sea taken from Fulmar Litter EcoQO Monitoring in the North Sea -
results to 2006...........................................................................................................................................16 Figure 2.16 Summary view of Filmar-Litter monitoring results in the Netherlands from 1982 to 2006;
comparing average data for incidence, number of items and mass (arithmetic average) in the 1980’s whilst running 5-year averages for the more recent period......................................................................... 17
Figure 2.17 Amount of litter collected in the Fishing for litter project 2000-2007 in kg ..............................18 Figure 2.18 Tonnages of marine litter collected by FFL Scotland. In the Greater North Sea .....................19 Figure 2.19 Tonnages of marine litter collected by FFL Scotland......................................................................... 20

VIII
Figure 2.20 Proportion of different categories of marine litter found on reference beaches during the project period 2001–2006...................................................................................................................22
Figure 2.21 Proportion of items in different categories .................................................................................22 Figure 2.22 Proportion of marine litter categories on Northern North Sea beaches...................................23 Figure 2.23 Proportion of marine litter categories on Southern North Sea beaches ..................................23 Figure 2.24 Seabird Group in Texel, Netherlands, 2005......................................................................................... 25 Figure 2.25 Proportion of different categories of marine litter found in the 100-metre surveys on
French beaches in 2006..............................................................................................................................26 Figure 2.26 Proportion of marine litter categories on Celtic Seas beaches.................................................26 Figure 2.27 Proportion of marine litter categories on Iberian coast beaches.......................................................27 Figure 2.28 Types of items of marine litter collected by fishermen in the Netherlands during 2006 ........28 Figure 2.29 Breakdown of types of litter collected in FFL Scotland project ................................................29 Figure 2.30 Number of marine litter indicator items: SANITARY WASTE……………………………………………30 Figure 2.31 Number of marine litter indicator items: TOURISM……………………………………………………….31 Figure 2.32 UK Beachwatch 2007 Beach Litter Survey ..................................................................................32 Figure 2.33 Beach Visitor’s litter. Beachwatch 2007. Tim Fanshawe/MCS ..................................................32 Figure 2.34 Regional variations in sources and densities of litter in UK, 2007..........................................33 Figure 2.35 Number of marine litter indicator items: FISHING ......................................................................34 Figure 2.36 Number of marine litter indicator items: GALLEY WASTE ........................................................35 Figure 2.37 Number of marine litter indicator items: SHIPPING……………………………………………………….35 Figure 2.38 Fishing nets. MCS Beachwatch UK, 2007. Skomer MNR Staff. .................................................36 Figure 3.1 Entanglement of a seal at Gweek Seal Sanctuary in Cornwall. Photography
by Caroline Curtis .....................................................................................................................................38 Figure 3.2 An entangled Minke Whale found dead in the Shetland Islands, UK Photography
by Austin Taylor........................................................................................................................................39 Figure 3.3 Plastic in marine animals from the film ‘Message in the Waves’. Rebecca Hosking/BBC................39 Figure 3.4 Contents of a Fulmar’s stomach taken from Fulmar Litter EcoQO Monitoring in the North Sea –
results to 2006...................................................................................................................................................40 Figure 3.5 Eco performance of Fulmar from the Netherlands 1980s to 2006. Percentage of fulmars
having ≥ 0.1g plastic in the stomach ......................................................................................................41 Figure 3.6 Location differences in EcoQO performance of Fulmars from study areas around
North Sea and the Faeroe Islands over the 5 year period 2002-2006 ..................................................41 Figure 3.7 Number of dead birds by entanglement during 1995-2007..........................................................43
List of Tables
Table 2.1 Total amount of rubbish collected in sacks in the Oslofjord. ........................................................ 8 Table 2.2 Data from the OSPAR Marine Beach Litter Monitoring Pilot Project for Schleswig-
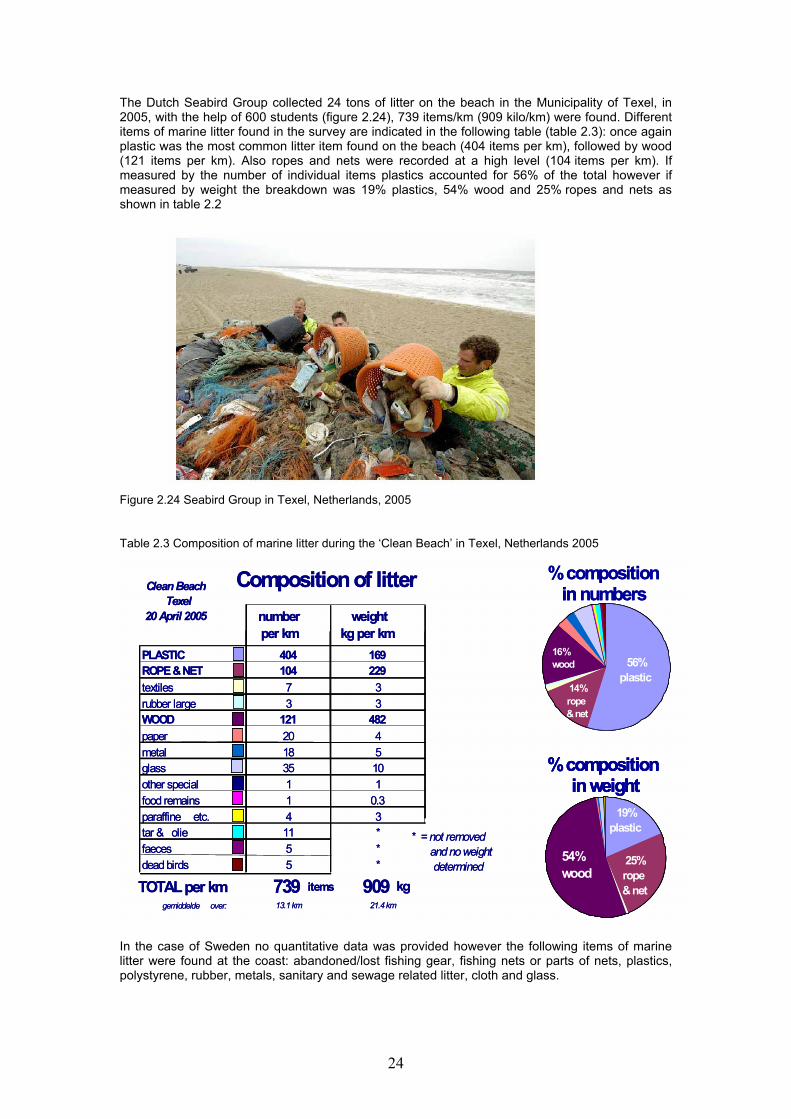
Holstein 2006.............................................................................................................................................. 9 Table 2.3 Composition of marine litter during the ‘Clean Beach’ in Texel, Netherlands 2005 .................. 24 Table 2.4 Litter items of each material type recorded in Beachwatch 2007 in UK (The Percentages
and items/km are recorded to 1 decimal place) .................................................................................... 25 Table 2.5 Source-specific indicator items selected for the purpose of the analysis of beach data in
the pilot project ........................................................................................................................................ 30 Table 2.6 Number of items from different sources on French beaches, 2006 ............................................ 37 Table 3.1 Beached bird survey on islands of Lower Saxony, Niedersachsen, 10 controlling
stretches, controlled biweekly................................................................................................................ 42 Table 3.2 Areas affected by marine litter in Shetland.................................................................................... 48 Table 4.1 Pollution types covered by MARPOL Annexes I-VI....................................................................... 51 Table 4.2 Restriction on dumping waste at sea, from Merchant Shipping Regulations 1998 ................... 57 Table 5.1 Port Reception Facilities Information for OSPAR Contracting Parties ports ............................. 69 Table 5.2 Port Reception Facilities Information for German ports .............................................................. 70

1
1. Introduction Marine litter is one of the most pervasive pollution problems affecting the marine environment. It has been defined as ‘any persistent, manufactured or processed solid material discarded, disposed of or abandoned in the marine and coastal environment. Marine litter consists of items that have been made or used by people and deliberately discarded into the sea or rivers or on beaches; brought indirectly to the sea with rivers, sewage, storm water or winds; or accidentally lost, including material lost at sea in bad weather’2 The marine litter problem is exacerbated by the fact that it can travel long distances conveyed by sea currents to end up in accumulation sites3. Serious public health issues are associated with hazardous materials, medical wastes, syringes, glass and other sharp and/or dangerous litter washed-up on beaches. Plastic materials, which are durable and slow to degrade, have become the most abundant material within marine litter. In addition, many plastic items are highly buoyant, allowing them to be carried with wind and currents for long distances. It is estimated that more than one million birds and 100,000 marine mammals and sea turtles die each year throughout the world after either becoming entangled in or eating plastic materials dumped in the sea4 The universal challenge of sustainable management of marine litter is a perfect illustration of a worldwide and transboundary marine environmental problem, and for this reason it is anticipated that the Regional Seas Programme (RSP) of UNEP will be instrumental in tackling this challenge. Litter is one of eight contaminant categories of the Global Programme of Action for the Protection of the Marine environment from Land-Based Activities (GPA) of UNEP. The RSP and the GPA have made considerable efforts in the last several years to approach the problem of marine litter and to raise awareness in the international community, at the global, Regional and national levels to the problem. Partially as a result of these efforts international attention is focusing more and more on the problem of marine litter. Moreover, the General Assembly of UN addressed the problem of marine litter in 2005 and its Resolution A/60/L.22 - Oceans and the Law of the Sea - of 29 November 2005 states: “…The General Assembly, 65. Notes the lack of information and data on marine litter and encourages relevant national and international organisations to undertake further studies on the extent and nature of the problem, also encourages States to develop partnerships with industry and civil society to raise awareness of the extent of the impact of marine litter on the health and productivity of the marine environment and consequent economic loss; 66. Urges States to integrate the issue of marine litter within national strategies dealing with waste management in the coastal zone, ports and maritime industries, including recycling, reuse, reduction and disposal, and to encourage the development of appropriate economic incentives to address this issue. This important UN General Assembly resolution of November 2005 should serve as a legal justification for bringing the issue of marine litter to the centre of attention and concern of the North-East Atlantic Region and lends weight to a rationale for the development of relevant Regional and National initiatives to challenge the problem of marine litter. The OSPAR Commission’s (OSPAR’s) initial contribution to the Global Action Plan developed by UNEP has been to undertake an assessment of the marine litter problem in the North-East Atlantic Region. The purpose of this report is to assess the amounts, types and sources of marine litter as well as investigating their environmental and socio-economic impacts and to draw together information on legislation, programmes and measures and organisations involved with marine litter issues. To facilitate this National Contacts in each Contracting Party were asked to fill in a questionnaire (see Annex 1) on marine litter after consulting with competent organisations within their country. Unfortunately no response was received from Denmark or Portugal.
2 http://www.unep.org/regionalseas/marinelitter/about/default.asp 3 The United Nations Environment Programme (UNEP) 2005 4 The United Nations Environment Programme (UNEP) 2006a

2
This report along with others from each Regional Seas Convention will form the basis of a UNEP Global Marine Litter Assessment. It will also contribute to the background report for the marine litter section of the OSPAR Quality Status Report 2010 and therefore the data has also been broken down into OSPAR Regions where possible. The OSPAR Regions, as defined in the 2000 Quality status report, are outlined below (see figure 1.1) • Region I (Arctic Waters) • Region II (Greater North Sea) • Region III (The Celtic Seas) • Region IV (Bay of Biscay and Iberian Coast) • Region V (Wider Atlantic)
Figure 1.1 OSPAR Maritime Area Regions
Arctic Waters The Arctic Waters or Region I is the second largest OSPAR Region and incorporates a wide range of environmental conditions and human activities. Most of the Region is sparsely populated and appears relatively pristine. However, the long-range transport of contaminants and human activities such as fisheries, industry, petroleum production and military activities do impact upon the Region. Region I itself can be divided into the following subregions based on ecological characteristics: the Barents Sea, the Norwegian Sea, the Iceland Sea and assessments of the quality of the marine environment shelf and the south-east Greenland shelf, and the Greenland Sea. In addition, Region I also includes a sector of the Arctic Ocean.

3
Greater North Sea The Greater North Sea or Region II is the area defined for the purposes of the North Sea Conferences, but extended to cover the Kattegat. The Greater North Sea is regarded as being bound by the coastlines of England, Scotland, Norway, Sweden, Denmark, Germany, The Netherlands, Belgium, and France, and by imaginary lines delimiting the western approaches to the Channel (5° W), the northern Atlantic between Scotland and Norway (62° N, 5° W), and the Baltic in the Danish Straits. Transportation on the North Sea and the exploitation of living and non-living resources are increasing, and some areas, in particular the Norwegian Trench, continue to function as a sink for contaminants. Consequently, the ecosystems continue to suffer from a number of old problems, sometimes showing some signs of amelioration, but also new problems have arisen. The effects of hazardous substances, eutrophication, and the direct as well as indirect impacts of fisheries comprise the most important issues. The Celtic Seas For the Celtic Seas or Region III the eastern boundary is defined by 5º W and the west coast of Great Britain, between 60º N and 48º N, while the western boundary follows the 200 m depth contour to the west of 6º W, also between 60º N and 48º N Generally the waters off the west coasts of Ireland and Scotland are relatively unimpacted by contamination arising from within the Region. The main needs in these areas are to ensure that exploitation of their mariculture potential does not result in serious contamination and disruption of natural ecosystems and that recreational activities, and associated developments, do not cause long-term damage to valuable habitats and landscapes. Ecosystem effects due to pollution are, for the most part, confined to urbanised estuaries such as inner Cork Harbour, the Liffey Estuary and inner Dublin Bay, Belfast Lough, the upper reaches of the Bristol Channel, the Mersey Estuary and Liverpool Bay, and the upper Clyde Estuary. Less obvious, much off the Irish Sea is subject to elevated levels of contaminants ranging from nutrients to metals, organochlorine pesticides, PCBs and radionuclides5. Bay of Biscay and Iberian Coast The Bay of Biscay and Iberian Coast or Region IV extends from 48º N to 36º N, and from 11º W to the coastlines of France, Portugal and Spain. The naturally favourable oceanographic conditions in this part of the North-East Atlantic, with its well-oxygenated coastal waters and strong hydrodynamic processes, positively influence the ecology of the Region. Nevertheless a large proportion of shellfish farming is affected by microbiological pollution, which implies that most of the shellfish must undergo depuration in an approved plant before they can be marketed. Impact of mariculture is often minimal but in some areas the deposit of organic detritus beneath suspended mussels has resulted in benthic enrichment; with a substantial increase in the organic content of the sediments, a dramatic decrease in faunal diversity and the predominance of opportunistic organisms. Region IV also includes ICES Fishing Areas VIII and IX and has traditionally been an area of intensive fishing activity, particularly with the expansion of engine-powered vessels and trawling over recent decades. The Region has a wider variety of fish and shellfish species of commercial interest than more northern areas and given the wider range in size and behaviour of these species, a large array of towed or fixed fishing gear must be used. Direct effects include the mortality of target and by-catch species of fish, shellfish, birds and marine mammals, the dumping of discards of offal, physical changes to the seabed caused by fishing gear, ghost fishing by lost gear and litter dumped from fishing vessels. The indirect effects include trophic changes in predator-prey relationships and energy flows, habitat alterations and genetic changes.
5 OSPAR Quality Status Report, 2000

4
Wider Atlantic The Wider Atlantic or Region V extends from 62º N (just to the south of Iceland) to 36º N (i.e. the latitude of the Strait of Gibraltar). To the west the area is bounded by 42º W and to the east either by 11º W or the shelf-break (taken as being the 200 m depth contour) to the west of the British Isles. The land masses within the Region comprise the Azores Archipelago in the southern sector and the tiny pinnacle of rock that atops Rockall Bank in the north-eastern sector. Fishing is a vital industry for the many remote communities that contribute to the cultural diversity of Region V, hence achieving sustainability in fisheries is a high priority. Even so, for many of the stocks present there is evidence that the current levels of exploitation exceeded estimated rates of replacement. Currently activities associated with shipping are not of high concern. Direct inputs of pollutants to Region V are probably smaller than to the four other OSPAR Regions, as these have extensive areas of shelf seas and busier shipping lanes. Losses of vessels at sea have neither declined or increased, despite marked increases in the sizes of ships and in the volumes of goods and bulk cargoes being transported, and are also more likely to occur inshore than offshore. The volume of ship movements is likely to continue to increase as global population increases. Provision of adequate waste facilities in ports is still not universal and the charges levied discourage their use by a minority of operators who resort to illegal dumping. Means of ensuring these facilities are used should reduce direct discharges.

5
2 The Scale of the Problem Marine litter originates from many sources and causes a wide spectrum of environmental, economic, safety, health and cultural impacts. The very slow rate of degradation of most marine litter items, mainly plastics, together with the continuously growing quantity of the litter and debris disposed, is leading to a gradual increase in marine litter found at sea and on the shores.6
2.1 Amounts of Marine Litter in the North-East Atlantic
2.1.1 Amounts found at Coastlines In the pilot study “Monitoring of marine litter on beaches in the OSPAR Region” 7 published by OSPAR in 2007, on average, 542 items of marine litter of varying size were found per 100-metre survey on the reference beaches. Surveys were also made on 1-km stretches for larger items (>50 cm in any direction), but included some items smaller than this. On the 1-km stretches on reference beaches, an average of 67 marine litter items was recorded. The total number of marine litter items found per stretch of beach varied considerably among beaches and surveys in different Regions (figure 2.1) On average, significantly more items were found on beaches in the northern Regions (Northern North Sea and the Celtic Seas) than on the beaches on the Iberian coast and in the Southern North Sea. There were no statistically significant trends of either a decrease or an increase in the average number of marine litter items found. However the average number of items of marine litter found per 100 m stretches was already high so this lack of trend should not be interpreted as a good sign.
Figure 2.1 Average number of marine litter items per 100 meters on the reference beaches Small plastic/polystyrene pieces were the most common type of marine litter items, found in the highest numbers, on all reference beaches (see figure 2.2).
6 http://www.unep.org/regionalseas/marinelitter/about/default.asp
7 OSPAR Commission. 2007. OSPAR Pilot Project on Monitoring Marine Beach Litter: Final Project report.

6
Figure 2.2 Most common (total numbers) items on reference beaches Changes in the composition of marine litter items on the reference beaches during the six-year period of the OSPAR marine litter Monitoring project, in eleven categories used in the beach survey protocol (see figure 2.3).
Figure 2.3 Average number of items in different categories.

7
2.1.1.1 Arctic Waters OSPAR Contracting Parties provided no quantitative information on the amounts of marine litter found at coastlines for the Arctic Waters.
2.1.1.2 Greater North Sea Even although, from 2003 onwards, there appears to be an increasing trend in the number of marine litter items found on the reference beaches in the Southern North Sea there were no statistically significant trends of either a decrease or an increase in the average number of marine litter items found in the Greater North Sea region (see figure 2.4-2.5). However the average number of items of marine litter found per 100 m stretches was already high so this lack of trend should not be interpreted as a good sign.
Figure 2.4 Average number of marine litter items on Northern North Sea reference beaches
Figure 2.5 Average number of marine litter items on Southern North Sea reference beaches In Norway, over a period of 10 years the amount of litter collected from rubbish bins and from the shoreline in the Oslofjord, from the Swedish border to the county of Aust-Agder is expressed in the following table (table 2.1):
8
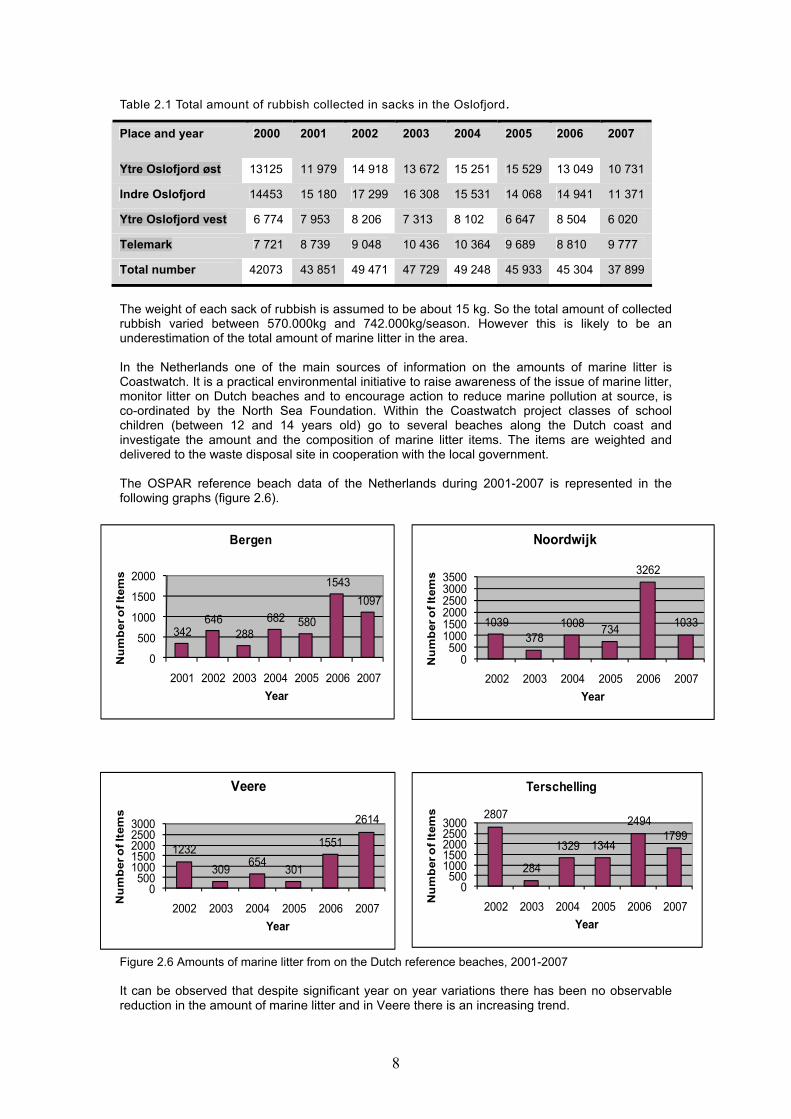
Table 2.1 Total amount of rubbish collected in sacks in the Oslofjord.
Place and year 2000 2001 2002 2003 2004 2005 2006 2007
Ytre Oslofjord øst 13125 11 979 14 918 13 672 15 251 15 529 13 049 10 731
Indre Oslofjord 14453 15 180 17 299 16 308 15 531 14 068 14 941 11 371
Ytre Oslofjord vest 6 774 7 953 8 206 7 313 8 102 6 647 8 504 6 020
Telemark 7 721 8 739 9 048 10 436 10 364 9 689 8 810 9 777
Total number 42073 43 851 49 471 47 729 49 248 45 933 45 304 37 899
The weight of each sack of rubbish is assumed to be about 15 kg. So the total amount of collected rubbish varied between 570.000kg and 742.000kg/season. However this is likely to be an underestimation of the total amount of marine litter in the area. In the Netherlands one of the main sources of information on the amounts of marine litter is Coastwatch. It is a practical environmental initiative to raise awareness of the issue of marine litter, monitor litter on Dutch beaches and to encourage action to reduce marine pollution at source, is co-ordinated by the North Sea Foundation. Within the Coastwatch project classes of school children (between 12 and 14 years old) go to several beaches along the Dutch coast and investigate the amount and the composition of marine litter items. The items are weighted and delivered to the waste disposal site in cooperation with the local government. The OSPAR reference beach data of the Netherlands during 2001-2007 is represented in the following graphs (figure 2.6).
Figure 2.6 Amounts of marine litter from on the Dutch reference beaches, 2001-2007 It can be observed that despite significant year on year variations there has been no observable reduction in the amount of marine litter and in Veere there is an increasing trend.
2807
284
1329 1344
24941799
0500
10001500200025003000
2002 2003 2004 2005 2006 2007Nu
mb
er o
f Ite
ms
Year
Terschelling
1232309 654 301
1551
2614
0500
10001500200025003000
2002 2003 2004 2005 2006 2007
Nu
mb
er o
f Ite
ms
Year
Veere
1039378
1008 734
3262
1033
0500
100015002000250030003500
2002 2003 2004 2005 2006 2007
Num
ber
of I
tem
s
Year
Noordwijk
342646
288682 580
15431097
0
500
1000
1500
2000
2001 2002 2003 2004 2005 2006 2007
Num
ber o
f Ite
ms
Year
Bergen
9
In Sweden, in 2007 beaches on the Swedish west coast from Gothenburg to the Norwegian border were monitored as part of the OSPAR Pilot project. The amount of marine litter found on the west coast during annual clean up activities was in the Region of 4000m3. On the German North Sea coast, between 2002-2006, a total of 70 surveys from 5 beaches, in Schleswig-Holstein, were made in the OSPAR Marine Beach Litter Monitoring Pilot Project. An average of 162 items were found in 100m surveys of the coastline. 115 (71%) of the litter items were plastic or polystyrene and 10% was wood. Approximately 2.6 m³/km of litter was collected on the mainland dykes (358 km) in Schleswig-Holstein (Germany), in 2006. The data is represented in the following table: Table 2.2 Data from the OSPAR Marine Beach Litter Monitoring Pilot Project for Schleswig-Holstein 2006
Stranded goods 2006 per region:
m³ organic + inorganic
km of coast
% inorganic = litter
m³/km m³/km inorganic
m³ inorganic
Nordfriesland 9733 218,9 6,14% 44,5 2,7 597,6
Dithmarschen 13650 82,3 1,54% 165,9 2,6 210,2
Unterelbe 4117 56,8 < 1%
Total 27500 358 Average: 2.6 Total: 807,8
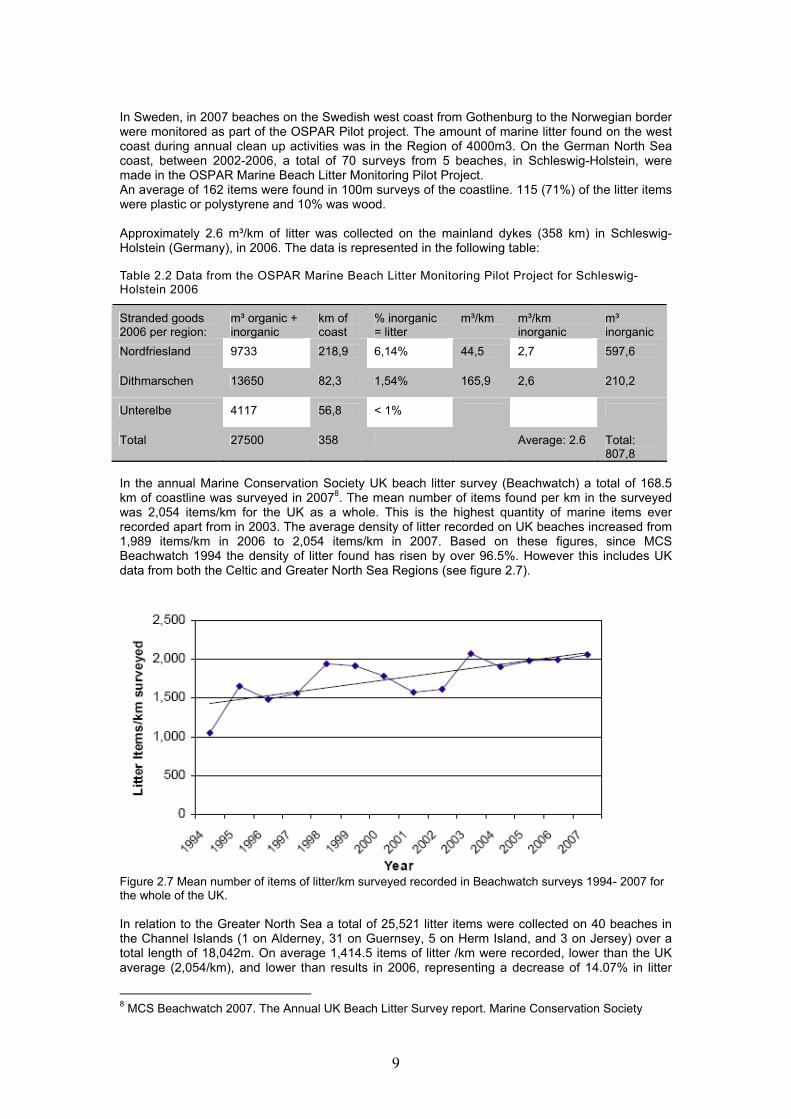
In the annual Marine Conservation Society UK beach litter survey (Beachwatch) a total of 168.5 km of coastline was surveyed in 20078. The mean number of items found per km in the surveyed was 2,054 items/km for the UK as a whole. This is the highest quantity of marine items ever recorded apart from in 2003. The average density of litter recorded on UK beaches increased from 1,989 items/km in 2006 to 2,054 items/km in 2007. Based on these figures, since MCS Beachwatch 1994 the density of litter found has risen by over 96.5%. However this includes UK data from both the Celtic and Greater North Sea Regions (see figure 2.7).
Figure 2.7 Mean number of items of litter/km surveyed recorded in Beachwatch surveys 1994- 2007 for the whole of the UK. In relation to the Greater North Sea a total of 25,521 litter items were collected on 40 beaches in the Channel Islands (1 on Alderney, 31 on Guernsey, 5 on Herm Island, and 3 on Jersey) over a total length of 18,042m. On average 1,414.5 items of litter /km were recorded, lower than the UK average (2,054/km), and lower than results in 2006, representing a decrease of 14.07% in litter
8 MCS Beachwatch 2007. The Annual UK Beach Litter Survey report. Marine Conservation Society

10
levels. Despite this drop, overall litter levels appear to be steadily increasing as indicated by figure 2.8. In North-East England a total of 28,659 items of litter were collected from 39 beaches over a total length of 21.67km. On average 1,322.5 items of litter/km were found representing a decrease of 18.4% in the density recorded in 2006 (1,620.6 /km). However in the South East a total of 116,886 litter items were collected from 114 beaches over a total length of 63.46km. On average 1,841.7 litter items/km were found, lower than the UK average (2,054/km) and 14.79% higher than the average density for the South East in 2006 (1,604.4/km). During the OSPAR Pilot Project on Monitoring Marine Beach Litter on average over 3,800 marine litter items were found per 100 metres in the French beach surveys. This is about ten times higher than the average number of items found on the regular reference beaches in the Southern North Sea Region. The number is also about seven times higher than the average number of items found on the reference beaches as a whole. However the French beaches were only studied in 2006 and are located in shipping and fishing areas as well as being well known for high concentrations of floating marine litter.
Figure 2.8 Mean number of items of litter/km surveyed recorded in the Channel Islands during Beachwatch Since 2001 and until 2008 a spring coastal cleanup, Lenteprikkel, in Belgium, has been organised in all coastal communities by the Coordination Centre for Integrated Coastal Zone Management coordinating volunteers beach cleaning, with the support of several organisations, authorities, administrations, etc. The results are indicated in figure 2.9.
11
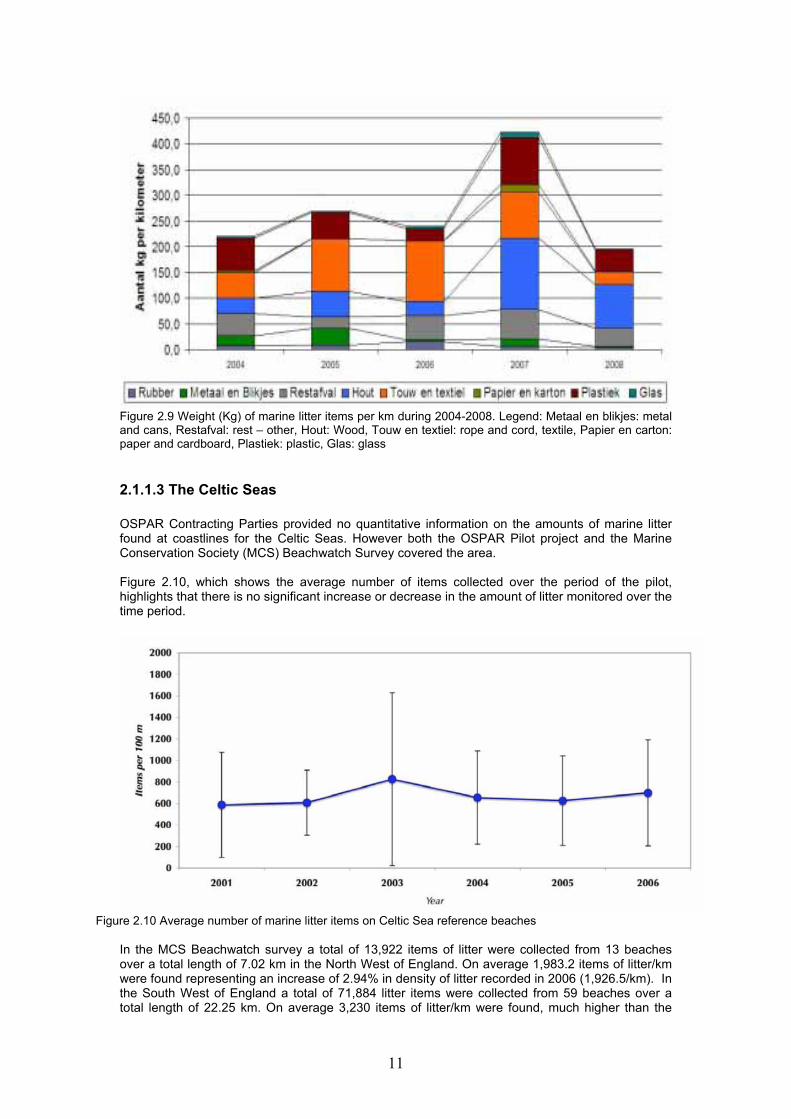
Figure 2.9 Weight (Kg) of marine litter items per km during 2004-2008. Legend: Metaal en blikjes: metal and cans, Restafval: rest – other, Hout: Wood, Touw en textiel: rope and cord, textile, Papier en carton: paper and cardboard, Plastiek: plastic, Glas: glass
2.1.1.3 The Celtic Seas OSPAR Contracting Parties provided no quantitative information on the amounts of marine litter found at coastlines for the Celtic Seas. However both the OSPAR Pilot project and the Marine Conservation Society (MCS) Beachwatch Survey covered the area. Figure 2.10, which shows the average number of items collected over the period of the pilot, highlights that there is no significant increase or decrease in the amount of litter monitored over the time period.
Figure 2.10 Average number of marine litter items on Celtic Sea reference beaches
In the MCS Beachwatch survey a total of 13,922 items of litter were collected from 13 beaches over a total length of 7.02 km in the North West of England. On average 1,983.2 items of litter/km were found representing an increase of 2.94% in density of litter recorded in 2006 (1,926.5/km). In the South West of England a total of 71,884 litter items were collected from 59 beaches over a total length of 22.25 km. On average 3,230 items of litter/km were found, much higher than the
12
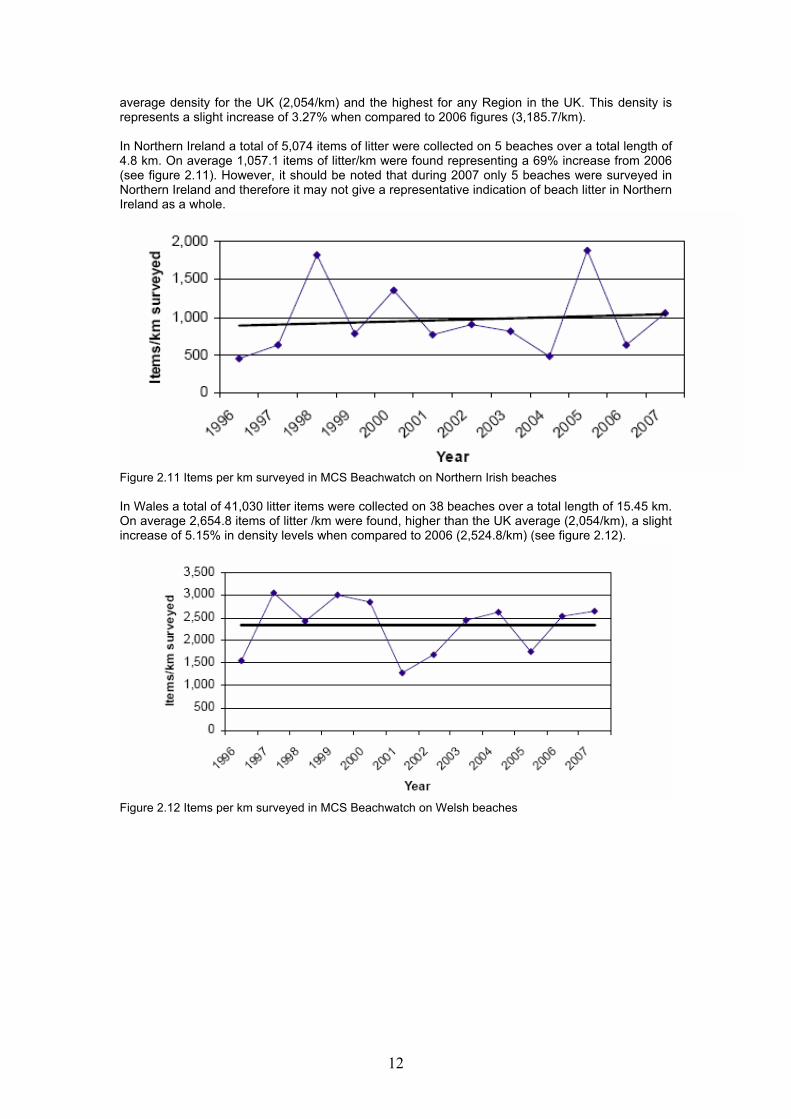
average density for the UK (2,054/km) and the highest for any Region in the UK. This density is represents a slight increase of 3.27% when compared to 2006 figures (3,185.7/km). In Northern Ireland a total of 5,074 items of litter were collected on 5 beaches over a total length of 4.8 km. On average 1,057.1 items of litter/km were found representing a 69% increase from 2006 (see figure 2.11). However, it should be noted that during 2007 only 5 beaches were surveyed in Northern Ireland and therefore it may not give a representative indication of beach litter in Northern Ireland as a whole.
Figure 2.11 Items per km surveyed in MCS Beachwatch on Northern Irish beaches In Wales a total of 41,030 litter items were collected on 38 beaches over a total length of 15.45 km. On average 2,654.8 items of litter /km were found, higher than the UK average (2,054/km), a slight increase of 5.15% in density levels when compared to 2006 (2,524.8/km) (see figure 2.12).
Figure 2.12 Items per km surveyed in MCS Beachwatch on Welsh beaches

13
2.1.1.4 Bay of Biscay and Iberian Coast There is no data quantifying marine litter on the Atlantic Spanish coastline. The studies undertaken for the past few years do not represent the entire coastline as they have been undertaken at a local level, as in the analysis done during the OSPAR Pilot Project on marine beach litter, or they refer specifically to composition of marine litter and not quantities of marine litter like the data undertaken in Coastwatch. For instance, during the Coastwatch beach litter survey on the Spanish Atlantic coast in 2001, several drink containers were surveyed, such as glass bottles (8924 items), cans (9738 items), plastic bottles (23127 items), PVC (2547 items), cartons and tetra packs (2665 items). The survey also recorded drink yokes (1201 items), tyres (1855 items) and plastic bags (10595 items). It is not possible to analyse any trends as the data is only supplied for 2001. An average of over 3,800 marine litter items was found per 100 meters in the French beach surveys during 2006. This number is about seven times higher than the average number of items found on the regular reference beaches as a whole. However the French beaches located in shipping and fishing areas, studied in 2006 only, are well known for high concentrations of floating marine litter. A study by IFREMER in 1982 showed that the quantity of marine litter in France varied between 400 kg and 4 tons per kilometre. One of the beaches studied in 1982 was resurveyed in 1994 and the amount of litter had doubled. In France it was difficult to gather information on the amounts of litter as most of the information is held by local authorities or NGO’s and is not collected centrally. However anecdotal evidence suggests that on average around 30 tonnes are collected per km per year.
Figure 2.13 Average number of marine litter items on Iberian coast reference beaches The data from the OSPAR Pilot project, Figure 2.13, again shows no significant increase or decrease in the trend for the amounts of litter monitored on the Iberian Coast. However levels are lower that those in the Celtic Seas or Northern North Sea.
2.1.1.5 Wider Atlantic OSPAR Contracting Parties provided no quantitative information on the amounts of marine litter found at coastlines for the Wider Atlantic and whilst anecdotal evidence from the Azores suggests that levels are increasing this could not be verified.
2.1.1.6 Summary The overall amount of marine litter is consistently high and it is not reducing despite recent efforts. The results for the OSPAR Pilot Project on Marine Beach Litter Monitoring showed that from 2001 to 2006 there was no statistically significant increase or decrease of the amount of marine beach

14
litter in the North-East Atlantic. The spatial distribution of marine beach litter is significantly different throughout the area however. The highest levels recorded during the OSPAR Pilot Project were in the Greater North Sea Region with 600-1400 items per 100m of beach surveyed in the Northern North Sea and 200-600 items per 100m in the Southern North Sea. In the Celtic Seas, levels were also high with 600-800 items per 100m, however in this case levels were higher in the south, as shown by the MCS Beachwatch Survey 2007, where 3,230 items per km were monitored in the south west of England compared to 1,057 items per km in Northern Ireland. Marine Litter levels on the Bay of Biscay and Iberian Coast were much lower with only 100-300 items per 100m. In France, anecdotal evidence from local authorities suggests that on average around 30 tonnes of marine litter are collected per km per year. Whilst the Wider Atlantic and Arctic Waters are likely to have the lowest levels, however, due to lack of quantitative data for these areas, it is not possible to carry out an assessment.
2.1.2 Amounts found at Sea
As approximately 70% of marine litter sinks to the seabed and 15% floats the majority of marine litter is actually found at sea9. A study in 2000 investigated the distribution and abundance of large items of marine litter on continental shelves and slopes along European Seas, including the Baltic Sea, the North Sea, the Celtic Sea, the Bay of Biscay and different areas in the north- western basin of the Mediterranean Sea and the Adriatic Sea. On the basis of 27 oceanographic cruises undertaken between November 1992 and August 1998, different types of litter were enumerated, particularly pieces of plastic, plastic and glass bottles, metallic objects, glass, and diverse materials including fishing gear. The results showed considerable geographical variation in concentrations, which ranged from 0 to 101000 pieces of litter per km2. In most stations sampled, plastic (mainly bags and bottles) accounted for a very high percentage (more than 70%) of the total number of litter items, and accumulation of specific litter, such as fishing gear, was also common. In some areas, only small amounts of litter were collected on the continental shelf, mostly in canyons descending from the continental slope and in the bathyal plain where high amounts of litter were found down to more than 500m. Dives using the manned submersibles Cyana and Nautile between 50 and 2700 m allowed accumulation areas to be detected on the sea floor. Analysis of these results revealed the influence of geomorphologic factors, local anthropogenic activities and river inputs. Temporal trends indicated seasonal variations in the northern part of the Bay of Biscay. Accumulation areas were detected 200 km west of Denmark, in the southern part of the Celtic Sea and along the southeast coast of France10. A study of microscopic plastic found at sea, undertaken by Thompson et al (2004)11 in UK (OSPAR Regions I, II and III) showed that microscopic plastic fragments and fibres (Fig. 2.14A) are also widespread in the oceans and have accumulated in the pelagic zone and sedimentary habitats. The fragments appear to have resulted from degradation of larger items. Marine organisms have also been shown to ingest plastics of this size, but the environmental consequences of this contamination are still unknown. To assess the extent of contamination, a further 17 beaches were examined (Fig. 2.14B). Similar fibres were found, demonstrating that microscopic plastics are common in sedimentary habitats. To assess long-term trends in abundance, plankton samples collected regularly were examined since the 1960s along routes between Aberdeen and the Shetland Islands (315 km) and from Sule Skerry to Iceland (850 km) (Fig. 2.14B). Undetermined particles, some being identified as plastic, were found archived among the plankton in samples back to the 1960s, but with a significant increase in abundance over time (Fig. 2.14E). Similar types of polymer were found in the water
9 The Ocean Concervancy (2004). 2004 International Coastal Cleanup Data Report 10 Galgani, F., et al. 2000. Litter on the Sea Floor along European Coasts. Marine Pollution Bulletin, Vol. 40, No. 6, pp 516-527 11 Thompson, R., et al. 2004. Lost at Sea: Where Is All the Plastic? SCIENCE. Volume 304. Number 5672. Page 838
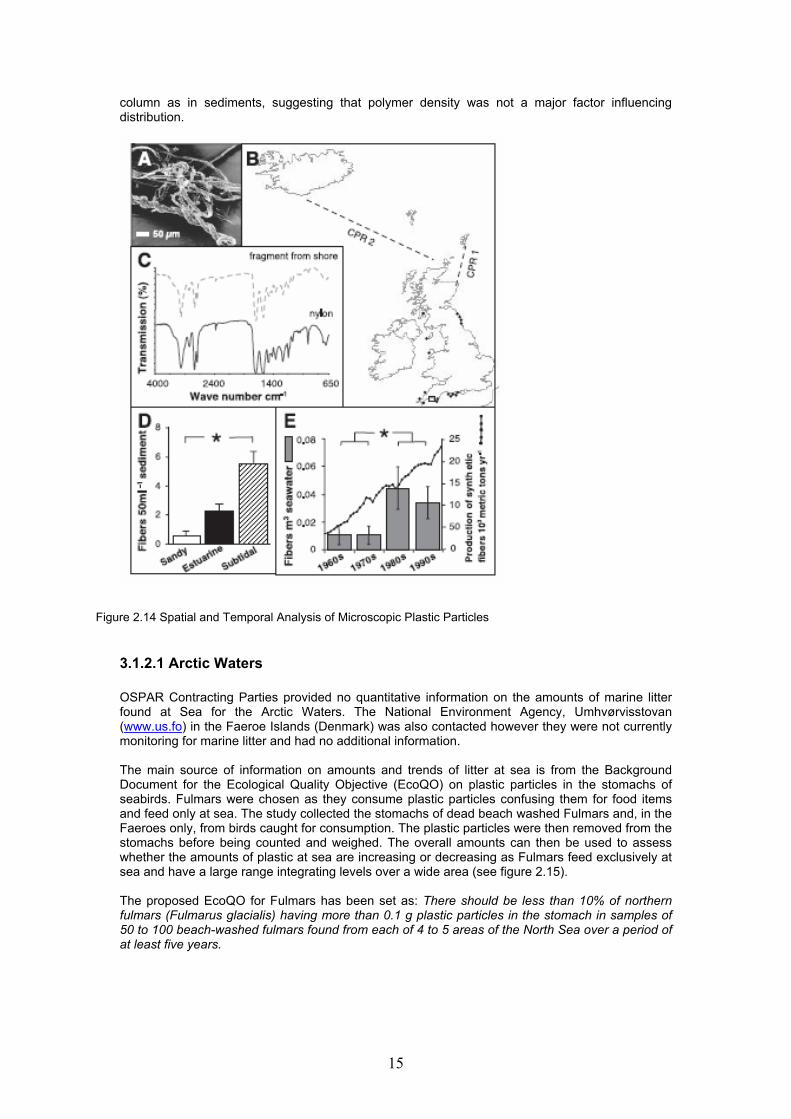
15
column as in sediments, suggesting that polymer density was not a major factor influencing distribution.
Figure 2.14 Spatial and Temporal Analysis of Microscopic Plastic Particles
3.1.2.1 Arctic Waters OSPAR Contracting Parties provided no quantitative information on the amounts of marine litter found at Sea for the Arctic Waters. The National Environment Agency, Umhvørvisstovan (www.us.fo) in the Faeroe Islands (Denmark) was also contacted however they were not currently monitoring for marine litter and had no additional information. The main source of information on amounts and trends of litter at sea is from the Background Document for the Ecological Quality Objective (EcoQO) on plastic particles in the stomachs of seabirds. Fulmars were chosen as they consume plastic particles confusing them for food items and feed only at sea. The study collected the stomachs of dead beach washed Fulmars and, in the Faeroes only, from birds caught for consumption. The plastic particles were then removed from the stomachs before being counted and weighed. The overall amounts can then be used to assess whether the amounts of plastic at sea are increasing or decreasing as Fulmars feed exclusively at sea and have a large range integrating levels over a wide area (see figure 2.15). The proposed EcoQO for Fulmars has been set as: There should be less than 10% of northern fulmars (Fulmarus glacialis) having more than 0.1 g plastic particles in the stomach in samples of 50 to 100 beach-washed fulmars found from each of 4 to 5 areas of the North Sea over a period of at least five years.
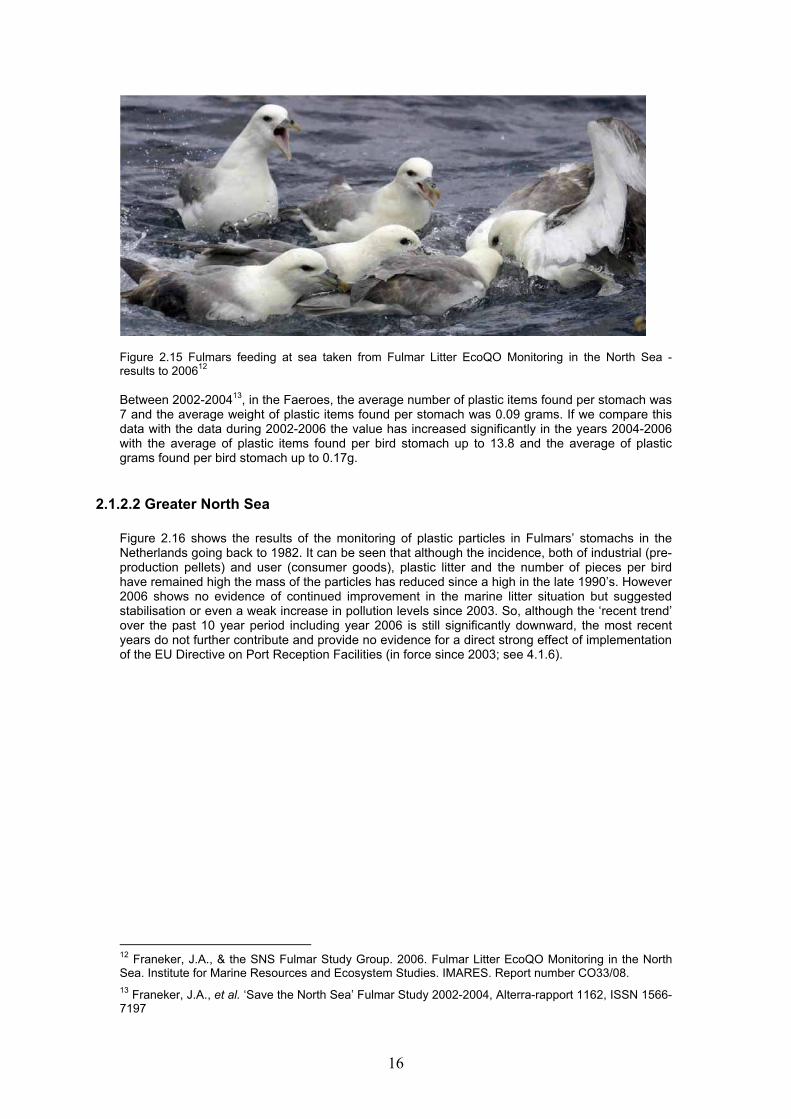
16
Figure 2.15 Fulmars feeding at sea taken from Fulmar Litter EcoQO Monitoring in the North Sea - results to 200612 Between 2002-200413, in the Faeroes, the average number of plastic items found per stomach was 7 and the average weight of plastic items found per stomach was 0.09 grams. If we compare this data with the data during 2002-2006 the value has increased significantly in the years 2004-2006 with the average of plastic items found per bird stomach up to 13.8 and the average of plastic grams found per bird stomach up to 0.17g.
2.1.2.2 Greater North Sea Figure 2.16 shows the results of the monitoring of plastic particles in Fulmars’ stomachs in the Netherlands going back to 1982. It can be seen that although the incidence, both of industrial (pre-production pellets) and user (consumer goods), plastic litter and the number of pieces per bird have remained high the mass of the particles has reduced since a high in the late 1990’s. However 2006 shows no evidence of continued improvement in the marine litter situation but suggested stabilisation or even a weak increase in pollution levels since 2003. So, although the ‘recent trend’ over the past 10 year period including year 2006 is still significantly downward, the most recent years do not further contribute and provide no evidence for a direct strong effect of implementation of the EU Directive on Port Reception Facilities (in force since 2003; see 4.1.6).
12 Franeker, J.A., & the SNS Fulmar Study Group. 2006. Fulmar Litter EcoQO Monitoring in the North Sea. Institute for Marine Resources and Ecosystem Studies. IMARES. Report number CO33/08. 13 Franeker, J.A., et al. ‘Save the North Sea’ Fulmar Study 2002-2004, Alterra-rapport 1162, ISSN 1566-7197

17
Figure 2.16 Summary view of Filmar-Litter monitoring results in the Netherlands from 1982 to 2006; comparing average data for incidence, number of items and mass (arithmetic average) in the 1980’s whilst running 5-year averages for the more recent period. In the Netherlands one of the main sources of information on the amount of litter on the seabed is from Fishing for Litter activities run by both the National Government and KIMO Netherlands and Belgium. The project involves fishing boats collecting marine litter that accumulates in their nets as part of their normal fishing activity and taking it ashore in large hardwearing bags before it is processed in an onshore waste facility. In Den Helder harbour the weight and number of items collected has been monitored since 2000. 162 to 380 big bags are collected every year from 15 ships operating in the North Sea and the weight of marine litter collected has ranged form 60.000 to 100.000 kg at a cost of approximately 22.000 to 35.000 euros per year to transport and process.
18
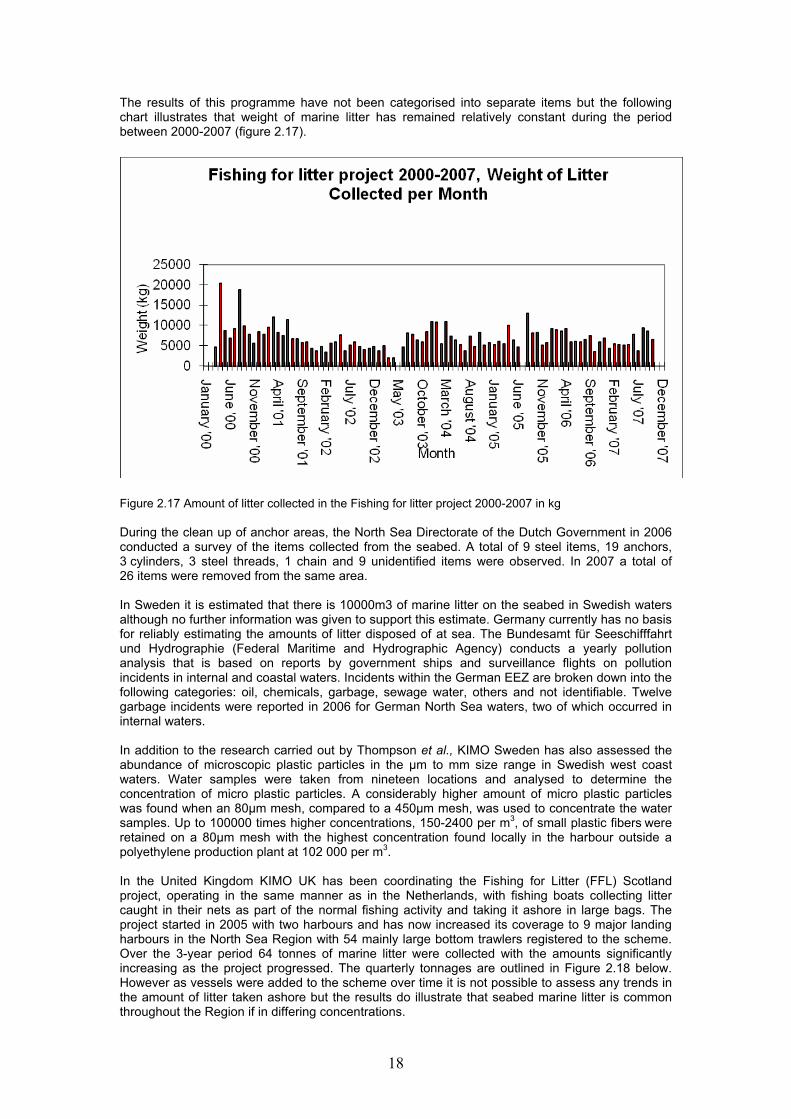
The results of this programme have not been categorised into separate items but the following chart illustrates that weight of marine litter has remained relatively constant during the period between 2000-2007 (figure 2.17).
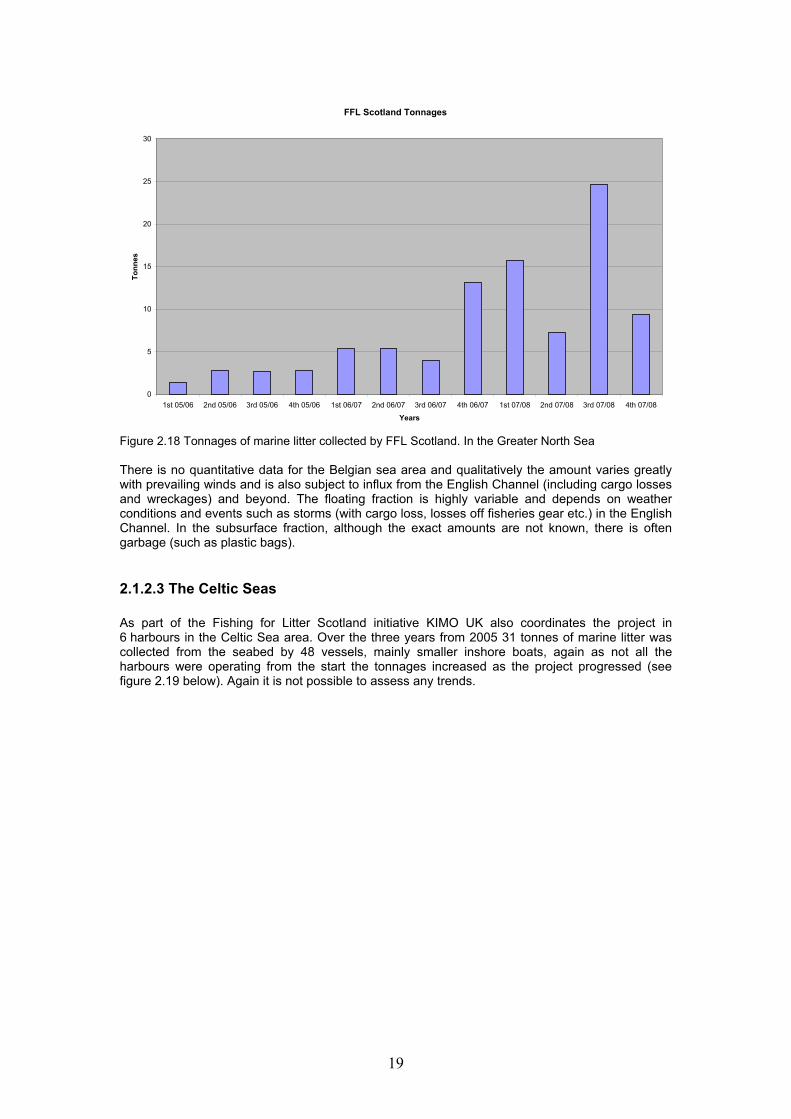
Figure 2.17 Amount of litter collected in the Fishing for litter project 2000-2007 in kg During the clean up of anchor areas, the North Sea Directorate of the Dutch Government in 2006 conducted a survey of the items collected from the seabed. A total of 9 steel items, 19 anchors, 3 cylinders, 3 steel threads, 1 chain and 9 unidentified items were observed. In 2007 a total of 26 items were removed from the same area. In Sweden it is estimated that there is 10000m3 of marine litter on the seabed in Swedish waters although no further information was given to support this estimate. Germany currently has no basis for reliably estimating the amounts of litter disposed of at sea. The Bundesamt für Seeschifffahrt und Hydrographie (Federal Maritime and Hydrographic Agency) conducts a yearly pollution analysis that is based on reports by government ships and surveillance flights on pollution incidents in internal and coastal waters. Incidents within the German EEZ are broken down into the following categories: oil, chemicals, garbage, sewage water, others and not identifiable. Twelve garbage incidents were reported in 2006 for German North Sea waters, two of which occurred in internal waters. In addition to the research carried out by Thompson et al., KIMO Sweden has also assessed the abundance of microscopic plastic particles in the μm to mm size range in Swedish west coast waters. Water samples were taken from nineteen locations and analysed to determine the concentration of micro plastic particles. A considerably higher amount of micro plastic particles was found when an 80µm mesh, compared to a 450µm mesh, was used to concentrate the water samples. Up to 100000 times higher concentrations, 150-2400 per m3, of small plastic fibers were retained on a 80µm mesh with the highest concentration found locally in the harbour outside a polyethylene production plant at 102 000 per m3. In the United Kingdom KIMO UK has been coordinating the Fishing for Litter (FFL) Scotland project, operating in the same manner as in the Netherlands, with fishing boats collecting litter caught in their nets as part of the normal fishing activity and taking it ashore in large bags. The project started in 2005 with two harbours and has now increased its coverage to 9 major landing harbours in the North Sea Region with 54 mainly large bottom trawlers registered to the scheme. Over the 3-year period 64 tonnes of marine litter were collected with the amounts significantly increasing as the project progressed. The quarterly tonnages are outlined in Figure 2.18 below. However as vessels were added to the scheme over time it is not possible to assess any trends in the amount of litter taken ashore but the results do illustrate that seabed marine litter is common throughout the Region if in differing concentrations.
19
FFL Scotland Tonnages
0
5
10
15
20
25
30
1st 05/06 2nd 05/06 3rd 05/06 4th 05/06 1st 06/07 2nd 06/07 3rd 06/07 4th 06/07 1st 07/08 2nd 07/08 3rd 07/08 4th 07/08
Years
Tonn
es
Figure 2.18 Tonnages of marine litter collected by FFL Scotland. In the Greater North Sea There is no quantitative data for the Belgian sea area and qualitatively the amount varies greatly with prevailing winds and is also subject to influx from the English Channel (including cargo losses and wreckages) and beyond. The floating fraction is highly variable and depends on weather conditions and events such as storms (with cargo loss, losses off fisheries gear etc.) in the English Channel. In the subsurface fraction, although the exact amounts are not known, there is often garbage (such as plastic bags).
2.1.2.3 The Celtic Seas As part of the Fishing for Litter Scotland initiative KIMO UK also coordinates the project in 6 harbours in the Celtic Sea area. Over the three years from 2005 31 tonnes of marine litter was collected from the seabed by 48 vessels, mainly smaller inshore boats, again as not all the harbours were operating from the start the tonnages increased as the project progressed (see figure 2.19 below). Again it is not possible to assess any trends.

20
Celtic Seas
0
2
4
6
8
10
12
14
16
1st 05/06 2nd 05/06 3rd 05/06 4th 05/06 1st 06/07 2nd 06/07 3rd 06/07 4th 06/07 1st 07/08 2nd 07/08 3rd 07/08 4th 07/08
Year
Tonn
es
Figure 2.19 Tonnages of marine litter collected by FFL Scotland.
2.1.2.4 Bay of Biscay and Iberian Coast Regional-scale studies indicate the presence of debris along the coasts of Spain and Portugal with particular problems in the French Basque Country, which owing to the general pattern of circulation receives debris from Spain and Portugal from late autumn to late winter. During summer the debris is from the northern part of the Bay of Biscay and from local rivers.14 Other Regional information is scarce and restricted to a few areas of the Bay of Biscay. A large-scale survey of debris on the seabed of the northern section of the continental shelf shows that densities vary throughout the year and are particularly high during late autumn and winter in an area offshore of the Gironde Estuary. In France IFREMER conducted several trawling operations to assess the quantity of debris at sea. In this assessment between 2 items of marine litter in summer time and 14 items in winter were found per hectare on the bottom of the Bay of Biscay. Most of the items were plastic (92%) and from those, 94% were plastic bags. This study also showed that litter in winter was concentrated in an area and in summer time was spread along the sea because of the effect of the currents. Also, in the south of Bay of Biscay, in Aquitaine, between November 2002 and July 2003, 70 fishing boats (180 fishermen and 41000 hours of fishing activities) collected 560 m3 (45.2 tons) of marine litter in their fishing nets during their normal fishing activities. There were plastics in 100% of nets, wood in 50%, shipping litter in 50%, metal in 10% and glass in 5%. In 2004, in the same area, 1004 m3 (89 tons) was collected in fishing harbours comprising marine litter collected at sea by fishing gears and also litter produced by the boats themselves. As the amount of litter collected in 2004 contained operational waste it is not possible to say to what extent the doubling of the amount of litter brought ashore was due to marine litter.
2.1.2.5 Wider Atlantic OSPAR Contracting Parties provided no quantitative information on the amounts of marine litter found at sea for the Wider Atlantic.
14 OSPAR Commission. Quality Status Report 2000. Region IV Bay of Biscay and Iberian Coast

21
2.1.2.6 Summary Amounts of marine litter at sea have also remained consistent, but show varied spatial distribution with litter on the seabed varying significantly from 0 to 101 000 pieces of litter per km2, due to topological and tidal differences. The Greater North Sea background study into the EcoQO on plastic particles in fulmars stomachs showed that there was a reduction in the amount of litter at sea during the late 90’s, with the average amount of plastic per bird falling from 0.5g to 0.3g, however, this has now levelled off and there has been no reduction in recent years. In the Bay of Biscay strong seasonal variation was noted with 7 times more litter found on the seabed in winter compared to summer. In the monitoring of seabed marine litter in the various Fishing for Litter projects the proportion of plastic varied from 55% in the Celtic Seas to 38% in the Greater North Sea. However other items such as metal (23-13%), rubber (25-9%) and wood (10-11%) made up a greater proportion of the total number of items compared to marine litter monitored on beaches. This is as expected as many types of plastic float and therefore are concentrated on the surface of the sea and at the coastline whereas heavier items sink to the seabed.
2.2 Types of Marine Litter in the North-East Atlantic
2.2.1 Types at Coastline Marine litter can be any persistent solid material discarded, disposed of or abandoned in the marine, coastal or riverine environment. It can be accidentally lost material (fishing gear, cargo), deliberately left by people on beaches and shores or thrown overboard from ships. Globally reported marine litter consists of many items, for example: plastics, fishing gear, polystyrene (coffee cups, takeaway food containers, packing material), rubber, glass, wood, metals, sanitary and sewage-related litter, clothing, paper and cardboard.15 Of all marine litter items found in all 100-metre surveys on the regular reference beaches in the OSPAR Maritime Area, an average of 75 per cent was made of non-degradable plastic and/or polystyrene, (see Figure 2.20). Plastic and polystyrene was the most common type of marine litter found also in the 1-km surveys on the reference beaches, accounting on average for almost 66 per cent of the total16. Figure 2.21 illustrates the proportion of items in different categories monitored each year in the OSPAR Pilot Project: again plastic and polystyrene are the most common items but also the proportion of items that are plastic has increased from 68% in 2001 to 78% in 2006.
15 OSPAR Commission, 2004. Environmental Assessment and Monitoring Committee (ASMO) 16 OSPAR Commission, 2007. OSPAR Pilot Project on Monitoring Marine Beach Litter: Final Project report.

22
Figure 2.20 Proportion of different categories of marine litter found on reference beaches during the project period 2001–2006
Figure 2.21 Proportion of items in different categories

23
2.2.1.1 Arctic Waters Contracting Parties only provided qualitative data for Arctic Waters. Several items were found at the Norwegian coast, such as different kinds of plastic items (bags, boxes, buckets, helmets, nets, trawls), pieces of cardboard, metal such as drinking boxes, glass, clothing, wood and pieces of rubber. Also at the Icelandic coastline different items were found, such as plastic bags and other plastic, driftwood, buoys, fishing nets, building material and other wood pieces.
2.2.1.2 Greater North Sea In the Greater North Sea area, either in the Northern Sea or the Southern Sea beaches the most common marine litter items were plastic and polystyrene (see figure 2.22 and figure 2.23). The highest proportion (over 80 %) of plastic and polystyrene items was found on the Northern North Sea beaches.
Figure 2.22 Proportion of marine litter categories on Northern North Sea beaches
Figure 2.23 Proportion of marine litter categories on Southern North Sea beaches
24
The Dutch Seabird Group collected 24 tons of litter on the beach in the Municipality of Texel, in 2005, with the help of 600 students (figure 2.24), 739 items/km (909 kilo/km) were found. Different items of marine litter found in the survey are indicated in the following table (table 2.3): once again plastic was the most common litter item found on the beach (404 items per km), followed by wood (121 items per km). Also ropes and nets were recorded at a high level (104 items per km). If measured by the number of individual items plastics accounted for 56% of the total however if measured by weight the breakdown was 19% plastics, 54% wood and 25% ropes and nets as shown in table 2.2
Figure 2.24 Seabird Group in Texel, Netherlands, 2005
Table 2.3 Composition of marine litter during the ‘Clean Beach’ in Texel, Netherlands 2005
% compositionin numbers
56% plastic
14% rope & net
16% wood
% composition in weight
19% plastic
25% rope & net
54% wood
Clean Beach Texel
20 April 2005 Composition of litter
number per km
weightkg per km
PLASTIC 404 169ROPE & NET 104 229textiles 7 3rubber large 3 3WOOD 121 482paper 20 4metal 18 5glass 35 10other special 1 1food remains 1 0.3paraffine etc. 4 3tar & olie 11 *faeces 5 *dead birds 5 *
TOTAL per km 739 items 909 kggemiddelde over: 13.1 km 21.4 km
* = not removed and no weight determined
% compositionin numbers
56% plastic
14% rope & net
16% wood
in
56% plastic
14% rope & net
16% wood
% composition in weight
19% plastic
25% rope & net
54% wood
% composition in weight
19% plastic
25% rope & net
54% wood
19% plastic
25% rope & net
54% wood
Clean Beach Texel
20 April 2005 Composition of litter
number per km
weightkg per km
PLASTIC 404 169ROPE & NET 104 229textiles 7 3rubber large 3 3WOOD 121 482paper 20 4metal 18 5glass 35 10other special 1 1food remains 1 0.3paraffine etc. 4 3tar & olie 11 *faeces 5 *dead birds 5 *
TOTAL per km 739 items 909 kggemiddelde over: 13.1 km 21.4 km
* = not removed and no weight determined
In the case of Sweden no quantitative data was provided however the following items of marine litter were found at the coast: abandoned/lost fishing gear, fishing nets or parts of nets, plastics, polystyrene, rubber, metals, sanitary and sewage related litter, cloth and glass.

25
In the OSPAR-Project, the results of surveys on the German North Sea coast in the period 1992 to 2002 and the published results of litter investigations on the German North Sea coast all show that plastic litter is by far the most common litter type by number and wood by far the most common litter type by weight found on German North Sea coasts. This general situation has not changed over the last 20 years.17 Data from the OSPAR Marine Beach Litter Monitoring Pilot Project for the German North Sea coast 2002-2006 indicates that 115 (71%) of the litter items were plastic or polystyrene and 10% was wood.
In the UK plastic items were the most common litter item recorded on the beaches in the Beachwatch 2007 survey and constituted 58.3% of the total number of litter items found on the survey beaches (see table 2.3). This relates to 1198 items per km of coastline with a total number of 201,862 items. The type of litter with the next highest proportion was paper with 8.5% or 174.6 items per km.
Table 2.4 Litter items of each material type recorded in Beachwatch 2007 in UK (The Percentages and items/km are recorded to 1 decimal place)
Material % of Total Litter
Items/km Total Number Collected
Plastics 58.3 1198.0 201,862
Paper 8.5 174.8 29,449
Polystyrene 7.7 157.3 26,500
Sanitary 6.1 125.5 21,142
Metal 6.1 125.1 21,077
Glass 3.9 80.2 13,507
Cloth 3.4 69.5 11,704
Rubber 2.4 49.0 8,254
Wood 2.3 48.2 8,126
Pottery & Ceramics 0.6 12.4 2,082
Faeces 0.5 10.2 1,714
Medical 0.2 3.8 637 On French beaches small pieces of plastic rope, cord and net (smaller than 50 cm) were the most common type of marine litter on 100-metre stretches of beaches in France. These items accounted for nearly 64 per cent of all items found, as compared to 14 per cent on the regular reference beaches. On the regular reference beaches, these items were the second most common type of marine litter. Larger pieces of plastic, rope, cord and net (larger than 50 cm) were the second most common type of marine litter on 100-metre stretches of beach in France. These items accounted for approximately 9 per cent of all items found, as compared to 3 per cent on the regular reference beaches. On the regular reference beaches, these items were the eight most common types of marine litter. Also over 95 per cent off all marine litter items found in the 100-metre surveys on French beaches, were made of non-degradable plastic and/or polystyrene (see figure 2.25). The corresponding figure for the regular reference beaches (all Regions) was about 75 per cent (see figure 2.20)
17 Fleet, D. M. (2003): Untersuchung der Verschmutzung der Spülsäume durch Schiffsmüll an der deutschen Nordseeküste. Im Auftrag des Umweltbundesamtes.
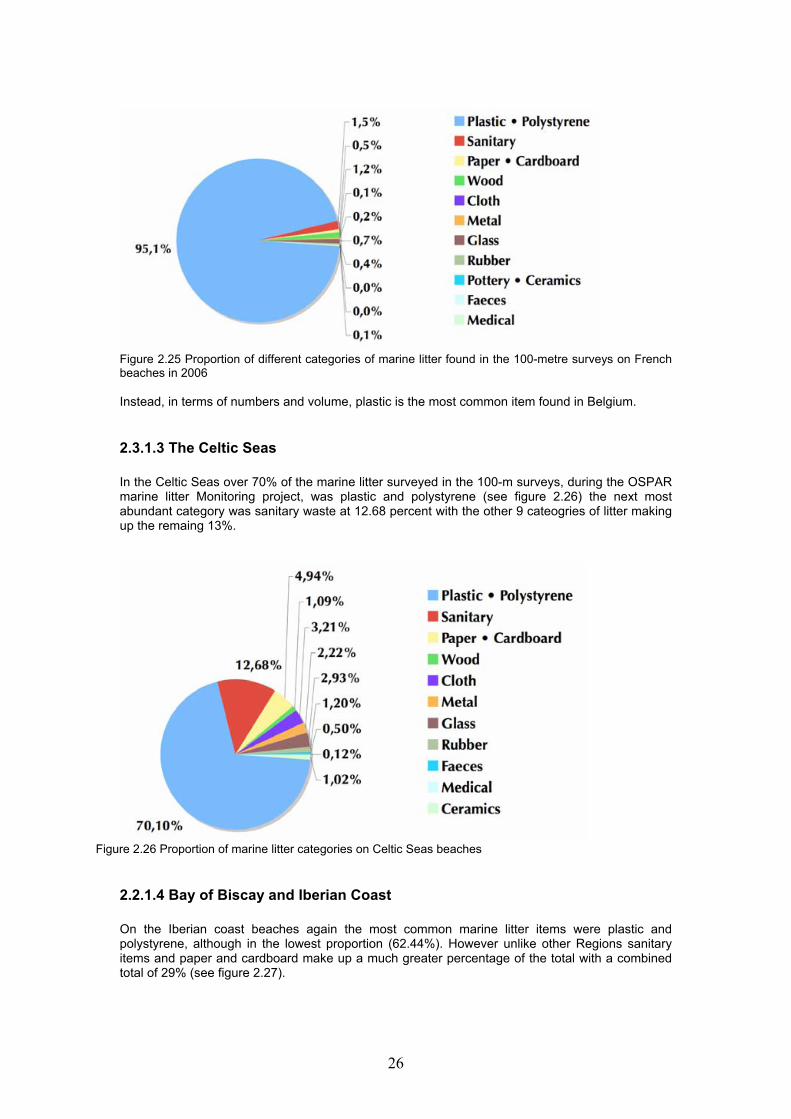
26
Figure 2.25 Proportion of different categories of marine litter found in the 100-metre surveys on French beaches in 2006 Instead, in terms of numbers and volume, plastic is the most common item found in Belgium.
2.3.1.3 The Celtic Seas In the Celtic Seas over 70% of the marine litter surveyed in the 100-m surveys, during the OSPAR marine litter Monitoring project, was plastic and polystyrene (see figure 2.26) the next most abundant category was sanitary waste at 12.68 percent with the other 9 cateogries of litter making up the remaing 13%.
Figure 2.26 Proportion of marine litter categories on Celtic Seas beaches
2.2.1.4 Bay of Biscay and Iberian Coast On the Iberian coast beaches again the most common marine litter items were plastic and polystyrene, although in the lowest proportion (62.44%). However unlike other Regions sanitary items and paper and cardboard make up a much greater percentage of the total with a combined total of 29% (see figure 2.27).
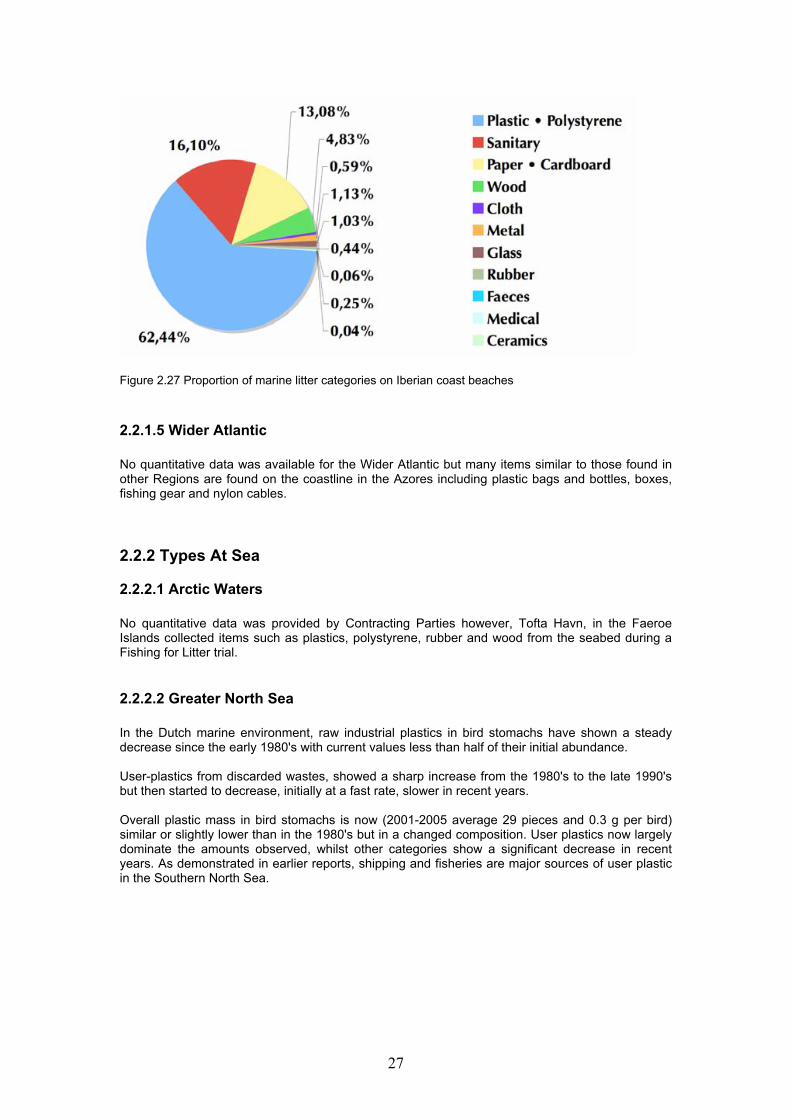
27
Figure 2.27 Proportion of marine litter categories on Iberian coast beaches
2.2.1.5 Wider Atlantic No quantitative data was available for the Wider Atlantic but many items similar to those found in other Regions are found on the coastline in the Azores including plastic bags and bottles, boxes, fishing gear and nylon cables.
2.2.2 Types At Sea
2.2.2.1 Arctic Waters No quantitative data was provided by Contracting Parties however, Tofta Havn, in the Faeroe Islands collected items such as plastics, polystyrene, rubber and wood from the seabed during a Fishing for Litter trial.
2.2.2.2 Greater North Sea In the Dutch marine environment, raw industrial plastics in bird stomachs have shown a steady decrease since the early 1980's with current values less than half of their initial abundance. User-plastics from discarded wastes, showed a sharp increase from the 1980's to the late 1990's but then started to decrease, initially at a fast rate, slower in recent years. Overall plastic mass in bird stomachs is now (2001-2005 average 29 pieces and 0.3 g per bird) similar or slightly lower than in the 1980's but in a changed composition. User plastics now largely dominate the amounts observed, whilst other categories show a significant decrease in recent years. As demonstrated in earlier reports, shipping and fisheries are major sources of user plastic in the Southern North Sea.

28
Figure 2.28 below represents types of items of marine litter collected by fishermen participating in KIMO Netherlands and Belgium Fishing for Litter Schemes in the. 20 tons of marine litter in 102 large hardwearing bags was monitored during 2006. The percentage of plastic items collected from the seabed is lower than for the coastline but this is to be expected as many plastic items are buoyant and either remain on the surface of the sea or wash up on the coastline
Figure 2.28 Types of items of marine litter collected by fishermen in the Netherlands during 2006 Different marine litter items were found, mostly rubber (104 gauntlets, 47 strings and belts) and textile (91 items from clothing and shoes), also mechanically processed wood such as wooden palettes, plastic and polystyrene (69 buoys, 32 ropes and cords, 49 fishing nets and fishing lines, 20 large oil barrels and also metal oil drums.
2.2.2.3 The Celtic Seas In Scotland litter collected from the seabed by vessels participating in the Fishing for Litter Scotland project was monitored in several harbours. Again plastic and polystyrene were the predominant types of litter accounting for 58% of the total. With the remaining 45% split evenly between textiles, rubber, wood and metal (see figure 2.29).
Types of litter collected by FFL Netherlands
38%
3%11%
25%
23%
Plastic / PolystyreneMetalWoodRubberTextile

29
Figure 2.29 Breakdown of types of litter collected in FFL Scotland project
Breakdown of types of litter collected in FFL Scotland project
Plastic and Polystyrene
55%
Metal13%
Wood11%
Rubber9%
Textiles12%
2.2.2.4 Bay of Biscay and Iberian Coast No quantitative data was provided but the anecdotal evidence provided indicated that the main item found was plastic. Also other marine litter items were found at sea, such as wood and glass, although in smaller proportions.
2.2.2.5 Wider Atlantic Again no quantitative data was provided for this Region but anecdotal evidence from the Azores indicated that the main item found was plastic.
2.3 Sources of Marine Litter in the North-East Atlantic Region Marine litter enters the ocean from both land-based sources and sea-based sources. Marine litter can be brought indirectly to the sea or coast by rivers, drains, sewage and storm water outflows or winds. Land-based sources include tourism or recreational visitors to the coast, fly tipping, local businesses and unprotected waste disposal sites. Recognised sea-based sources for marine litter are shipping (commercial, recreational and other), the fishing industry and offshore oil/gas installations. This section has not been separated into the OSPAR Regions, the sources are considered to be consistent across the whole OSPAR Maritime Area.
2.3.1 Land-based sources Land-based sources and recreational users of the coast have been found to contribute the largest percentage to beach litter in several surveys18. The OSPAR Pilot Project on Monitoring Marine Beach Litter identified indicator items to analyse trends in different sources of marine litter (see table 2.5).
18 MCS Beachwatch 2007. The Annual UK Beach Litter Survey report. Marine Conservation Society

30
Table 2.5 Source-specific indicator items selected for the purpose of the analysis of beach data in the pilot project
During the period 2001-2006 although levels of indicators of sanitary waste or tourism have fluctuated no statistically significant trends can be demonstrated. However the initial levels of the items were already high, 50 items from sanitary waste and about 60 items from tourism, per 100m surveyed so the lack of any trend should not be seen as a positive indicator (see figures 2.30- 2.31). It should also be noted that these graphs should not be used for direct comparison and do not indicate which source is most important. They only indicate the change in the individual source over time.
Figure 2.30 Number of marine litter indicator items: SANITARY WASTE
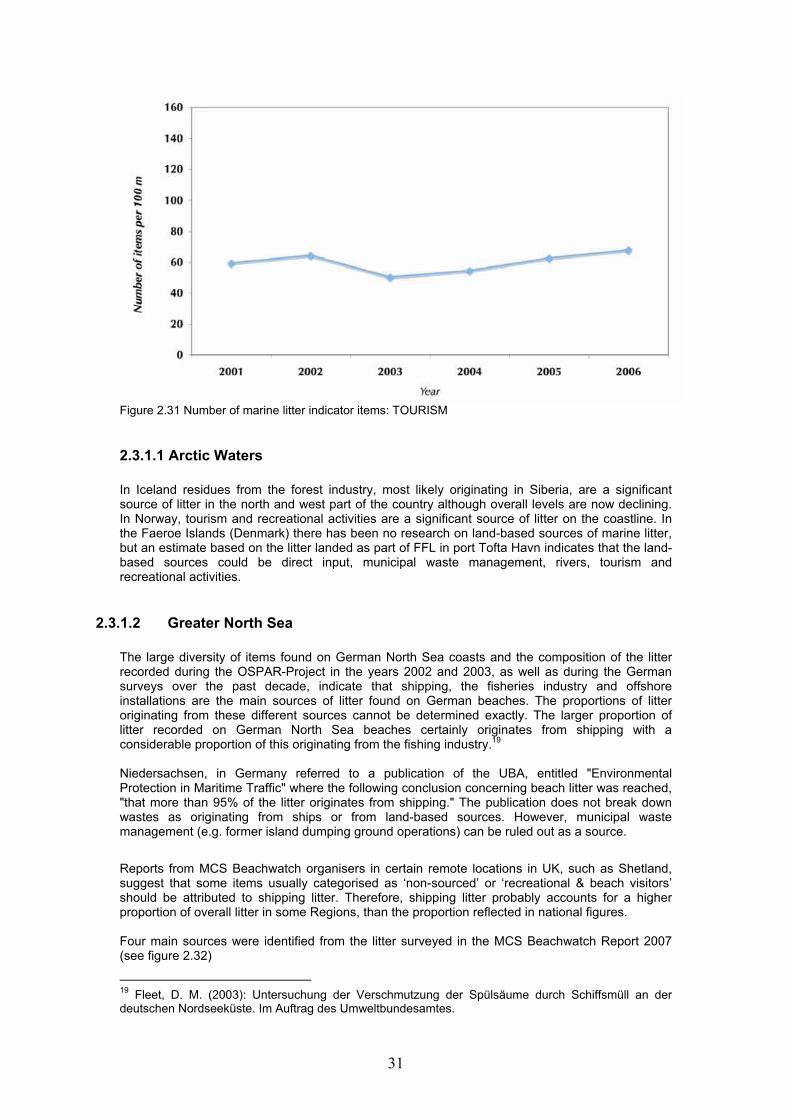
31
Figure 2.31 Number of marine litter indicator items: TOURISM
2.3.1.1 Arctic Waters In Iceland residues from the forest industry, most likely originating in Siberia, are a significant source of litter in the north and west part of the country although overall levels are now declining. In Norway, tourism and recreational activities are a significant source of litter on the coastline. In the Faeroe Islands (Denmark) there has been no research on land-based sources of marine litter, but an estimate based on the litter landed as part of FFL in port Tofta Havn indicates that the land-based sources could be direct input, municipal waste management, rivers, tourism and recreational activities.
2.3.1.2 Greater North Sea The large diversity of items found on German North Sea coasts and the composition of the litter recorded during the OSPAR-Project in the years 2002 and 2003, as well as during the German surveys over the past decade, indicate that shipping, the fisheries industry and offshore installations are the main sources of litter found on German beaches. The proportions of litter originating from these different sources cannot be determined exactly. The larger proportion of litter recorded on German North Sea beaches certainly originates from shipping with a considerable proportion of this originating from the fishing industry.19 Niedersachsen, in Germany referred to a publication of the UBA, entitled "Environmental Protection in Maritime Traffic" where the following conclusion concerning beach litter was reached, "that more than 95% of the litter originates from shipping." The publication does not break down wastes as originating from ships or from land-based sources. However, municipal waste management (e.g. former island dumping ground operations) can be ruled out as a source.
Reports from MCS Beachwatch organisers in certain remote locations in UK, such as Shetland, suggest that some items usually categorised as ‘non-sourced’ or ‘recreational & beach visitors’ should be attributed to shipping litter. Therefore, shipping litter probably accounts for a higher proportion of overall litter in some Regions, than the proportion reflected in national figures. Four main sources were identified from the litter surveyed in the MCS Beachwatch Report 2007 (see figure 2.32)
19 Fleet, D. M. (2003): Untersuchung der Verschmutzung der Spülsäume durch Schiffsmüll an der deutschen Nordseeküste. Im Auftrag des Umweltbundesamtes.

32
Figure 2.32 UK Beachwatch 2007 Beach Litter Survey
Recreational & Beach Visitors’ Litter Recreational & beach visitors’ litter includes items such as crisp, sweet and lolly wrappers, plastic drink bottles, cigarette stubs, ice lolly sticks, toys, golf balls, glass bottles and drinks cans, which may have been dropped directly on the beach or dropped elsewhere and washed in on the tide (figure 2.33). The percentage of beach visitors’ litter has increased from 33.9% in 2006 to 35.3% in 2007. The density of beach visitors’ litter has also increased from 673.4/km in 2006 to 725.7/km.
Figure 2.33 Beach Visitor’s litter. Beachwatch 2007. Tim Fanshawe/MCS
As in previous Beachwatch surveys, recreational & beach visitors litter remains the highest percentage of sourced litter. Sewage Related Debris (SRD) SRD items, such as cotton bud sticks, tampons, tampon applicators and towels/panty liners can be sourced with confidence since the vast majority of these items have originated from the sewerage system. The density and percentage of total litter represented by SRD decreased from 205.9 items/km (10.4%) in 2006 to 125.5/km (6.1%) in 2007. This is the lowest percentage and density of SRD litter for 5 years. Fly Tipped Litter Fly tipping accounts for a small proportion of litter recorded in Beachwatch surveys, and includes items such as industrial scrap, tyres and furnishings; however, many of these items are large and therefore have a significant aesthetic impact. The average density of fly tipped items increased from 18.4 items/km in 2006 to 19.5/km in 2007 and is the highest density recorded since 1999. The percentage of total litter caused by fly tipping remained the same. Medical Items
35.3
13.7
41.9
6.11.80.9
0.2
% Recreational & Beachvisitors% Fishing
% Sewage RelatedDebris% Shipping
% Fly Tipped
% Medical
% Non – Sourced

33
The density of medical litter items increased from 3.2/km in 2006 to 3.8/km in 2007, however the percentage of total litter represented by medical litter remained at 0.2%. Syringes are some of the most hazardous items collected and recorded during Beachwatch surveys. A total of 144 syringes were recorded in Beachwatch 2007, an average of 0.9 per km surveyed. Non-Sourced Litter Although the process of sourcing litter continues to be refined each year as further research is conducted, 41.9% of all items recorded in Beachwatch 2007 remain either unidentifiable, or cannot be attributed to one specific source (Figure 2.34). These items remain un-sourced, because sourcing them would only be a ‘best-guess’, or because they are completely unidentifiable. Pieces of plastic, rubber and cloth etc, rarely provide clues about their original source and continue to represent a significant proportion of the total litter recorded. Plastic pellets also known as “nurdles” that form the basis for feedstock plastics fall into this category. They can enter the oceans via effluent, accidental spillages and leakages from ships.
Figure 2.34 Regional variations in sources and densities of litter in UK, 2007 Although the levels of litter vary between Regions in the UK the proportion of the land-based sources remain reasonably consistent with a few exceptions. The amount of sewage related debris in Scotland is much higher than in the rest of the UK, however this is related to a point source rather than general diffuse pollution. In Belgium, influxes are highly dependent on the weather conditions and on the season either referring to land-based sources and to sea-based sources. Marine litter originating from tourism and recreational activities is an important land-source in Belgium and is higher during the tourist season. For instance, during holiday periods such as Whitsun weekend the amount of litter on the beaches is high. For example, 12 tons of beach litter was colleted in Oostende, 9 tons in Blankenberge and 7.5 tons in Middelkerke over Whitsun weekend in 2008. The figure for the entire Belgian coast was estimated to be around 80 tons. There is also an input from harbours: this is the case in Zeebrugge and Oostende, where marine litter items originated from harbour activities (handling of cargo, car parts, etc).
2.3.1.3 The Celtic Seas Contracting Parties provided no information on sources for the Celtic Seas. However, figure 2.35 above for Beachwatch in the UK contains information for Wales and Northern Ireland which indicates the sources of marine litter in the Celtic Sea are similar to those in the Greater North Sea.

34
2.3.1.4 Bay of Biscay and Iberian Coast In France CEDRE undertook a study in 2002 in which they asked Local Authorities what were the main sources of litter on beaches in their area. 99% replied that litter was washed ashore by winds and currents, 78% had litter abandoned on site, 44% had significant inputs of litter from rivers and 21% had point source pollution from storm water networks.
2.3.1.5 Wider Atlantic Although there is no data in relation to land-based sources in the Azores anecdotal evidence suggests they have a significant impact.
2.3.2 Sea-based sources Ocean-based sources of litter include commercial shipping, fishing vessels, passenger cruise liners, military fleets, research vessels, passenger ferries, tugboats and barges, offshore oil and gas platforms, offshore industry service vessels, and recreational boats. Items ranging from large oil drums and storage pallets to everyday domestic waste from galleys continue to be discharged at sea, despite international legislation such as Annex V of the International Convention for the Prevention of Pollution from Ships, 1973 (MARPOL 73/78).20 One particular area of concern is the increase in lost containers from shipping especially in the wake of the MSC Napoli grounding in Lyme Bay, UK.
The OSPAR Pilot Project 100-metre beach survey data, during the project period 2001–2006, indicated that the number of fishing indicator items (fishing including aquaculture) found in the 100-metre surveys increased during the project period. The increase was statistically significant on the reference beaches (see figure 2.35).
Figure 2.35 Number of marine litter indicator items: FISHING
However no statistically significant trends in numbers of marine litter indicator items could be demonstrated for other sea-based sources such as galley waste or shipping litter that were collected during the project period, as the number of items have not been exposed to any statistical analysis during the period (see figure 2.36-2.37). It should be noted however that these source graphs should not be used for direct comparison between sources and do not indicate which source is most important. They only indicate the change in the individual source over time.
20 MCS Beachwatch 2007. The Annual UK Beach Litter Survey report. Marine Conservation Society
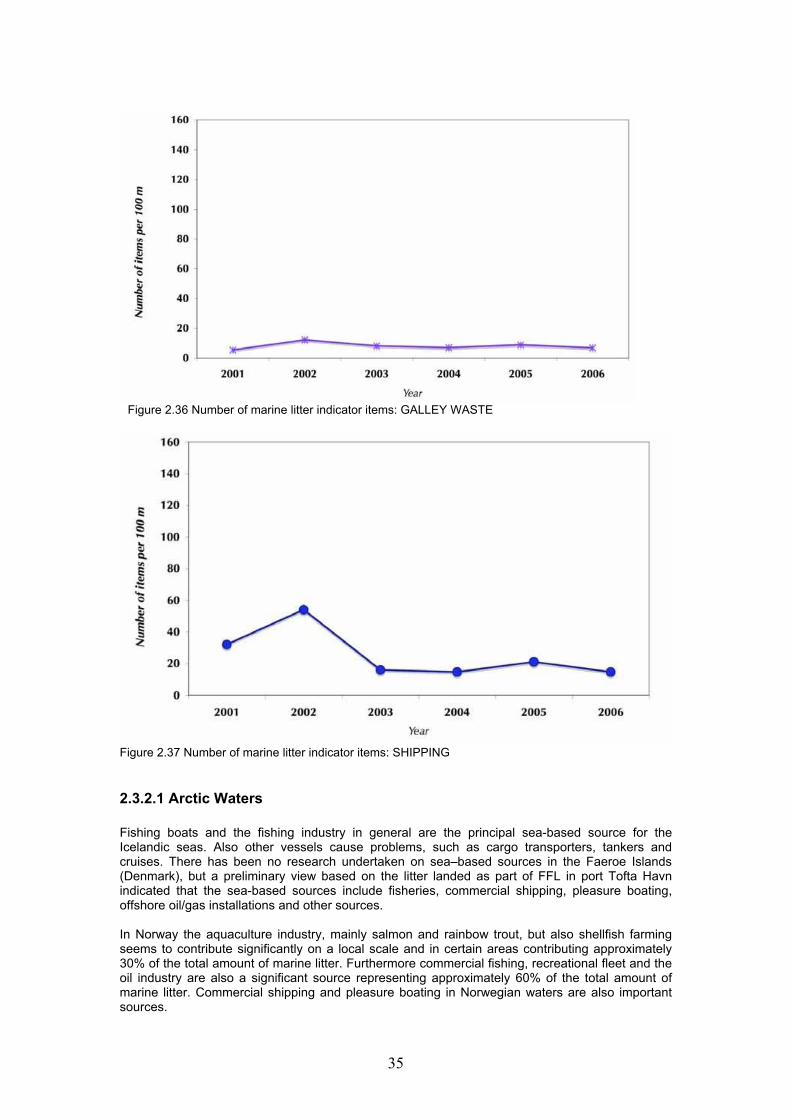
35
Figure 2.36 Number of marine litter indicator items: GALLEY WASTE
Figure 2.37 Number of marine litter indicator items: SHIPPING
2.3.2.1 Arctic Waters Fishing boats and the fishing industry in general are the principal sea-based source for the Icelandic seas. Also other vessels cause problems, such as cargo transporters, tankers and cruises. There has been no research undertaken on sea–based sources in the Faeroe Islands (Denmark), but a preliminary view based on the litter landed as part of FFL in port Tofta Havn indicated that the sea-based sources include fisheries, commercial shipping, pleasure boating, offshore oil/gas installations and other sources. In Norway the aquaculture industry, mainly salmon and rainbow trout, but also shellfish farming seems to contribute significantly on a local scale and in certain areas contributing approximately 30% of the total amount of marine litter. Furthermore commercial fishing, recreational fleet and the oil industry are also a significant source representing approximately 60% of the total amount of marine litter. Commercial shipping and pleasure boating in Norwegian waters are also important sources.

36
2.3.2.2 Greater North Sea Swedish waters are affected by the following sources: fisheries, commercial shipping, offshore oil and gas installations in the North Sea (oil drums, ship paint, chemicals, gas flasks) and recreational boating (it has a very minor percentage of total but sometimes is found locally in high amounts). In Belgium with prevailing winds onshore, significant amounts of floating litter with a remote origin (English Channel or even Atlantic) arrives on Belgian beaches. The source of this marine litter is mainly fisheries and commercial shipping. There are also important shipping routes off the Belgian coast including an anchorage area from which shipping litter originates. The density of fishing litter recorded in 2006, (223.2 items/km) increased to 281 items/km in MCS Beachwatch 2007, in UK. Fishing litter remains the second largest recognisable source of litter on UK beaches surveyed and represented 13.7% of all litter, an increase from the percentage recorded in MCS Beachwatch 2006 (11.2%).
Although there is no significant trend in the shipping items deliberate discharges of marine litter from the shipping sector still occur despite the regulations. Figure 2.40 shows a large fridge floating in the middle of the North Sea. The picture was taken from the bridge of a passenger ferry from Aberdeen to Shetland that had taken a detour to identify the item.
Fishing Litter Items originating from the fishing industry (including commercial and recreational angling), such as fishing line (Figure 3.38), rope, net, buoys, floats and weights, are perhaps some of the most straightforward items to source.
Figure 2.38 Fishing nets. MCS Beachwatch UK, 2007. Skomer MNR Staff.
Shipping Litter Litter from shipping includes oil drums, aerosol cans, crates, pallets and strapping bands (Figure 3.39). The number of shipping related items found per km surveyed decreased slightly from 39.8 items/km in 2006 to 37.8/km in 2007, and is the lowest density since 2002. Shipping items represented 1.8% of total litter found in 2007, 0.2% lower than in 2006.
Figure 2.29 Shipping litter. MCS Beachwatch UK, 2007. Steve Trewhella.
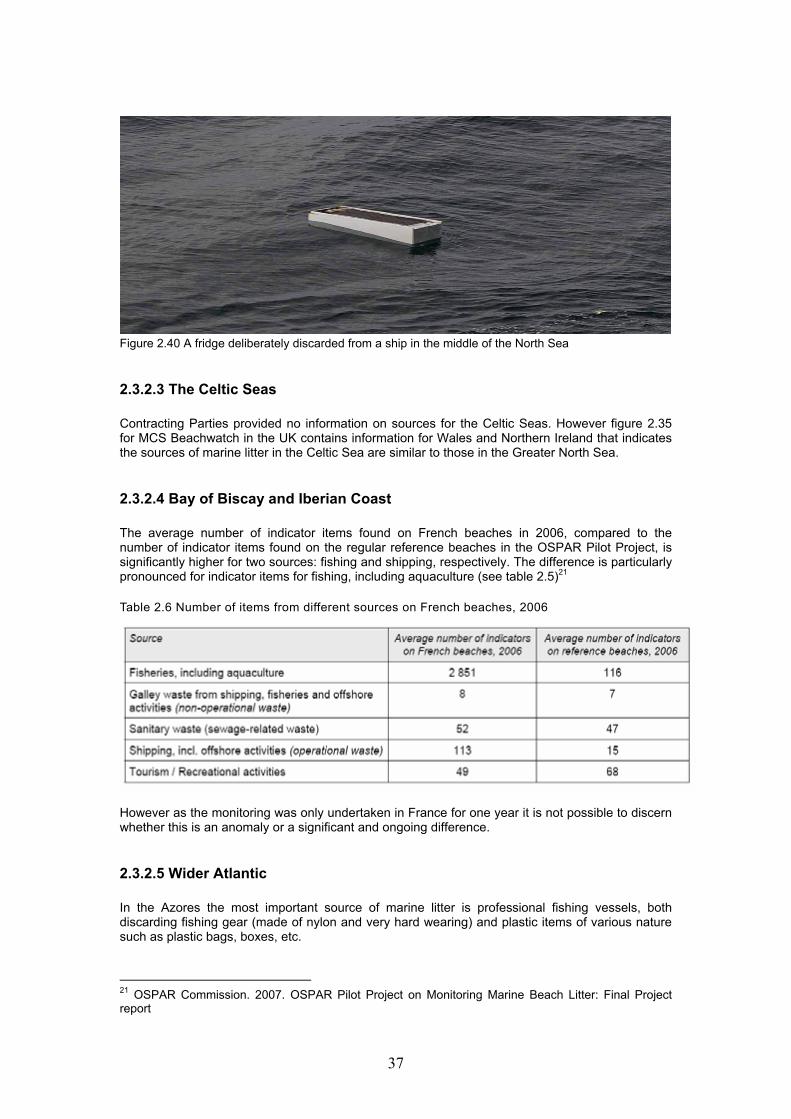
37
Figure 2.40 A fridge deliberately discarded from a ship in the middle of the North Sea
2.3.2.3 The Celtic Seas Contracting Parties provided no information on sources for the Celtic Seas. However figure 2.35 for MCS Beachwatch in the UK contains information for Wales and Northern Ireland that indicates the sources of marine litter in the Celtic Sea are similar to those in the Greater North Sea.
2.3.2.4 Bay of Biscay and Iberian Coast The average number of indicator items found on French beaches in 2006, compared to the number of indicator items found on the regular reference beaches in the OSPAR Pilot Project, is significantly higher for two sources: fishing and shipping, respectively. The difference is particularly pronounced for indicator items for fishing, including aquaculture (see table 2.5)21 Table 2.6 Number of items from different sources on French beaches, 2006
However as the monitoring was only undertaken in France for one year it is not possible to discern whether this is an anomaly or a significant and ongoing difference.
2.3.2.5 Wider Atlantic In the Azores the most important source of marine litter is professional fishing vessels, both discarding fishing gear (made of nylon and very hard wearing) and plastic items of various nature such as plastic bags, boxes, etc.
21 OSPAR Commission. 2007. OSPAR Pilot Project on Monitoring Marine Beach Litter: Final Project report

38
3 Environmental Effects, Economic Losses and other Negative Effects caused by Marine Litter The presence of marine litter on beaches and in the water has a wide range of impacts on a number of interests. Damage to wildlife, marine ecosystems, the aesthetic quality of beaches, recreational and fishing interests and risks to health and property are all part of the price that is paid for the irresponsible and accidental disposal of litter.22
3.1 Ecological/Environmental effects Marine litter can have a severe impact on marine life and incidents involving litter are very common in the North Sea. It affects wildlife such as seals, whales and turtles as well as seabirds either through entanglement by ropes and fishing gears or by ingestion of different kinds of marine litter. Outlined below are some of the main impacts of ingestion and entanglement. Entanglement: • Drowning of air-breathing species, asphyxiation of fish species that require constant motion for
respiration, or death by starvation or predation whilst trapped. • Restricts growth or cuts off circulation to appendages. Sometimes results in death, or can limit the ability
to reproduce successfully (see figure 3.1-3.3).
Figure 3.1 Entanglement of a seal at Gweek Seal Sanctuary in Cornwall. Photography by Caroline Curtis
22 Hall, K. 2000. Impacts of Marine Debris and Oil Economic & Social Costs to Coastal Communities Kommunenes Internasjonale Miljoorganisasjon (KIMO)

39
Figure 3.2 An entangled Minke Whale found dead in the Shetland Islands, UK Photography by Austin Taylor.
Ingestion: • Physical damage to the digestive tract (scarring, ulceration and occasional penetration into
the body cavity) can lead to infections, starvation and occasionally death (see figure 3.4). • Mechanical blockage of the passage of food. • A false sensation of satiation, or impaired digestive functioning (e.g. nutrient dilution, impaired
uptake). • Ingestion of contaminated debris, release of toxic pollutants from within the debris (released
by erosion within the digestive tract) or from absorption of contaminants adhering to the surface of the ingested debris.
Figure 3.3 Plastic in marine animals from the film ‘Message in the Waves’. Rebecca Hosking/BBC

40
3.1.1 Arctic Waters The target level for acceptable ecological quality with regard to marine litter set out in the EcoQO on plastic particles in fulmars’ stomachs is for only 10% of the birds to exceed 0.1g of plastic in their stomachs. In this regard the Arctic waters are closest to reaching the required level with 43% of Fulmars in the Faeroes exceeding the limit rather than the required 10%. However there is still a large and significant gap between the current levels and what is considered ecologically acceptable with regards to the impact of marine litter.
3.1.2 Greater North Sea Results from the Fulmar Litter EcoQO Monitoring Programme in the North Sea between 2002-2006 in the Netherlands indicate that amounts of plastic in stomach contents of beached Fulmars in the Netherlands in 2006 were average for the levels observed in the past 5 years 2002-2006 (95% incidence; 31 pieces and 0.30 gram per bird; 61% exceeding the critical EcoQO level of 0.1g of plastic). With a small sample sizes and many birds close to the critical level, caution should be used when looking at some year on year comparisons such as the jump in EcoQO percentage from 45% to 85% between 2005 and 2006. Neither underlying data on mass of plastics, nor comparisons to neighbouring countries supported the suggestion of a sudden strong increase. Between locations and Regions in the North Sea, significant differences in pollution levels are observed, with levels in the Channel area about three times higher than those around the Scottish Islands and intermediate levels in between.
Figure 3.4 Contents of a Fulmar’s stomach taken from Fulmar Litter EcoQO Monitoring in the North Sea - results to 2006 Averaged for the whole North Sea, 94% of investigated birds contained plastic; on average 34 pieces and 0.30 gram mass and 55% of all birds exceeded the critical EcoQO level of 0.1 gram of plastic in the stomach. Over the whole North Sea area over 90% of Fulmars have plastic in their stomach, and 45% to 60% exceed the critical EcoQO level of 0.1 gram of plastic
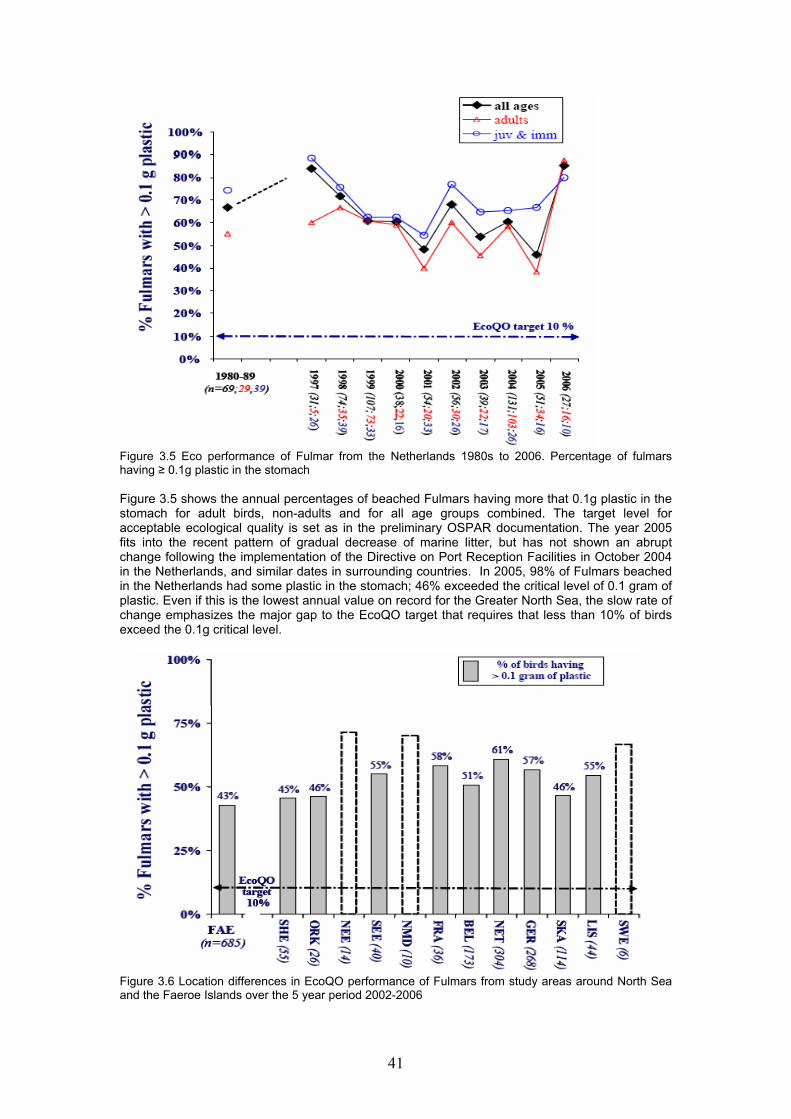
41
Figure 3.5 Eco performance of Fulmar from the Netherlands 1980s to 2006. Percentage of fulmars having ≥ 0.1g plastic in the stomach Figure 3.5 shows the annual percentages of beached Fulmars having more that 0.1g plastic in the stomach for adult birds, non-adults and for all age groups combined. The target level for acceptable ecological quality is set as in the preliminary OSPAR documentation. The year 2005 fits into the recent pattern of gradual decrease of marine litter, but has not shown an abrupt change following the implementation of the Directive on Port Reception Facilities in October 2004 in the Netherlands, and similar dates in surrounding countries. In 2005, 98% of Fulmars beached in the Netherlands had some plastic in the stomach; 46% exceeded the critical level of 0.1 gram of plastic. Even if this is the lowest annual value on record for the Greater North Sea, the slow rate of change emphasizes the major gap to the EcoQO target that requires that less than 10% of birds exceed the 0.1g critical level.
Figure 3.6 Location differences in EcoQO performance of Fulmars from study areas around North Sea and the Faeroe Islands over the 5 year period 2002-2006

42
Figure 3.6 indicates the proportion of beached Fulmars having more than 0.1g plastic in their stomach. All age groups are combined in the graph (adults and non adults) and blank bars with dashed contours indicate insufficient sample size. If the Fulmar is taken as an indicator species for the impacts of marine litter it can be clearly seen that marine litter is having a much greater impact on marine organisms than is currently considered acceptable. There is a large gap between the current levels in the Greater North Sea and the target level set for the EcoQO. In addition to the data supplied by Niedersachsen, Germany (table 3.1) an analysis of the common beached bird database (Schleswig-Holstein/Niedersachsen) for the period 1992-2006 indicates that less than 1% of the beached birds found on the German North Sea coast are the victims of litter but the most common litter items involved are line/rope entanglements (48% of all litter victims), net entanglements (39%) and fishing hooks (7%), reducing movement and potentially resulting in serious injury, death by starvation, drowning or suffocation Table 3.1 Beached bird survey on islands of Lower Saxony, Niedersachsen, 10 controlling stretches, controlled biweekly
NLWKN unpublished
Birds Cause of death
Jahr Garbage Oil Unknown
1995 15 560 2248
1996 18 531 5947
1997 11 195 3261
1998 18 368 2690
1999 16 257 3605
2000 3 257 2980
2001 19 182 3205
2002 5 129 3077
2003 5 100 1867
2004 11 66 1271
2005 11 204 1816
2006 9 48 1764
2007 14 879 4411

43
It is possible that marine litter was responsible for a higher proportion of the overall bird deaths as no analysis of the number of deaths caused by ingestion was undertaken. This is backed up by the fact that during the Save the North Sea project 93% of beached Fulmars on the German North Sea coast had litter in their stomachs. On average 29 items were found per stomach (maximum 1175) with an average weight of 0.3g per stomach (maximum 4.3g). Also over 57% of stranded Fulmars in the period 2002-2006 had more than 0.1g or more of litter in their stomach, which is the proposed target level for the OSPAR EcoQO.
Marine litter
1
10
100
1995
1997
1999
2001
2003
2005
2007
Dea
d B
irds
litter
Figure 3.7 Number of dead birds by entanglement during 1995-2007
Figure 3.7 above illustrates the number of birds killed by entanglement during the period 1995-2007. The number has remained relatively constant, however as the numbers are very low it is difficult to draw any conclusions. In the UK, outside the Fulmar EcoQO study, the full impact of litter on marine species is difficult to assess because of the limited research in this area and the fact that sampling is largely constrained to land-based observations of beached animals. Research so far has primarily measured frequency of interaction rather than assessing the proportion of a species affected. It is argued that marine litter has not been an issue in cetaceans that have been examined at post mortem (very low number found with plastic etc in stomach and are not considered to have had a significant pathological effect) but that it could well be for marine turtles, although the number examined is very small (~10% of the ~20 examined found with man made material in stomach). However, during MCS Beachwatch 2007, a total of 16 mammals, 83 birds, and 9 fish and invertebrates were recorded. The most commonly found dead fauna were gulls and guillemots. Two rays were found with hooks and line in their wings. Although there is no published information in Belgium, entanglement of birds has been recorded. There are several documented cases of birds (gannets, guillemots) washed up that were entangled in fishing gear. Also the ingestion of plastic by fulmars is being investigated by INBO although the results are not currently available. Specific reports of death or injury caused by litter in the UK are mentioned below: • In February 2004, a large adult grey seal, rescued by British Divers for Marine Life Rescue
from a beach in Kent subsequently died whilst receiving treatment at an RSPCA hospital. A post mortem revealed the seal had swallowed a plastic sea angling line splitter, which had lacerated the seal’s gut, and prevented it from feeding.
• In 2005, 879.6 entangled sea fans were found per km of beach surveyed at Chesil Beach in Dorset (S. Trewhella, 2005 pers.comm.)
• The exotic invasive barnacle species Elminius modestus has been found on plastic on the shoreline of the Shetland Islands (Barnes and Milner, 2005)
• An autopsy carried out on a harbour porpoise found in Kent in 2006 found pieces of plastic which appeared to be from crisp or sweet wrappers in the animal’s stomach (Deaville, 2006)
44
• In 2007 a juvenile Minke whale washed ashore in the Shetland Islands had been strangled by a strapping band.( Austin Taylor, 2007, pers comm.)
Microplastics also have potentially negative environmental effects on marine organisms. In a study by Browne et al (2008) the mussel, Mytilus edulis, was used to investigate ingestion, translocation, and accumulation of this debris. Initial experiments showed that upon ingestion, microscopic plastics accumulated in the gut. Mussels were subsequently exposed to treatments containing seawater and microscopic plastics (3.0 or 9.6 μm). After transfer to clean conditions, microscopic plastic was tracked in the hemolymph. Particles translocated from the gut to the circulatory system within 3 days and persisted for over 48 days. Abundance of microscopic plastic was greatest after 12 days and declined thereafter. Smaller particles were more abundant than larger particles and the data indicates as plastic fragments into smaller particles, the potential for accumulation in the tissues of an organism increases. The short-term pulse exposure used did not result in significant biological effects. However, plastics are exceedingly durable and so further work using a wider range of organisms, polymers, and periods of exposure would be required to establish the biological consequences of this type of litter.
3.1.3 The Celtic Seas As well as being mistaken for food plastics are also used as nesting material by some seabirds. Over 90% of the 30,000 gannet nests on Grassholm Island (in the Bristol Channel) now contain plastic (Bullock, pers. comm.). This indicates the extent of plastic pollution in surrounding waters, as gannets collect almost all of their nest material at sea. Young gannets' feet can often become entangled, resulting in serious injuries, and each Autumn RSPB staff travel to the island to cut free birds entangled in netting and plastic. In 2006, 33 birds were cut free from entanglement. It is believed that at this time the young birds were still being fed by adults that would have shortly left the island, when this happened the entangled young would have starved if they had not been freed (Morgan, 2006) A further, indirect effect of litter on the coastal environment is the ecological impact of mechanical cleaning, which is carried out by many local authorities to keep popular beaches free of litter, predominantly through the summer season (KIMO, 2000). The use of mechanical beach cleaners may threaten the stability of some beaches, as they remove organic matter, which holds sand grains together (Countryside Council for Wales, 1999). Cleaning may also disrupt food chains through the removal of important organic components of the beach fauna. Other specific injuries caused by litter in The Celtic Seas are mentioned below: • Juvenile humpback whale found dead in Port Talbot harbour off the south coast of Wales in
mid-December (2007), preliminary report by Zoological Society of London (ZSL) stated that the whale had probably just been weaned but had low blubber thickness. It also had numerous lacerations caused by a rope or cable, though it is not known if these occurred before or after it died (BBC Wildlife Magazine, March 2008)
• During Summer 2004, an entangled Minke whale was spotted in the Sound of Harris, Scotland. The whale had a piece of rope entangled in its jaw, which was removed by a local British Divers Marine Life Rescue unit (WDCS, 2004). Between 1992 and 2000, 15 of the 70 (21%) Minke whales stranded in Scotland died due to entanglement (HWDT, 2006)
• A green turtle found stranded at Knott End, Blackpool, Lancashire in December 2001, was examined by Rob Deaville at the Zoological Society of London in December 2002. The investigation revealed an assortment of plastic fragments within the oesophagus and stomach; the largest item found included a fragment of blue balloon in the stomach (Penrose, 2002 pers. comm.)
• An autopsy of a dead leatherback turtle washed up in Scotland in December 1994 showed that it appeared to have died as a result of starvation, caused by a primary obstruction of the digestive tract by ingested plastic and metal litter (Godley et al., 1998). Another leatherback, washed ashore in Scotland in December 1998, was found in very poor condition with approximately 57g of plastic obstructing its alimentary tract (Reid, pers. comm.)
• A study of North Sea puffins nesting in Britain and Ireland found items (mostly elastic bands and threads) in 13.3% of stomachs sampled. In some of the puffins, balls of elastic thread up to 30 x 10 mm in size filled approximately half of the space in the stomach, potentially interfering with digestion. The number of plastic pellets recorded in the puffins ranged from 1 to 20 per stomach.

45
• The stalked barnacle (Dosimia fasicularis) attaches itself to floating debris at settlement. In a survey of barnacles that had been stranded on Irish North Atlantic shores, it was found that tar pellets less than 25 mm in diameter and angular plastic fragments were the main attachment materials, because they are of the correct particle size for attachment. Thus, any increase in the input of such materials into the sea could lead to a population expansion of this species, which may have implications for other species in the food chain (Minchin, 1996).
3.1.4 Bay of Biscay and Iberian Coast The information provided by Contracting Parties was very limited. In France studies undertaken, between 1979 and 1999, showed that 55% of the Luth Turtles (Dermochelys coriacea) had marine litter in their stomachs. In one specific incident a Minke whale was found washed up on the Normandy shore, France in April 2002, and in determining the cause of death a stomach analysis was undertaken. Over 800g (wet weight) of plastic bags and packaging were found, including an English plastic and foil crisp wrapper and two English supermarket plastic bags.
3.1.5 Wider Atlantic Visual pollution is high in some sites of the Azores, especially those near fishing villages and impact is commonly seen when travelling by sea. Many animals are found dead and/or seriously injured due to entanglement, in both, discarded plastic and fishing gear. These animals include sea birds, fish, turtles and cetaceans.
3.2 Abandoned and Lost Fishing Gear (ALFG) Lost or abandoned fishing gear is a significant and very persistent form of marine litter. It poses a threat to the marine environment, as well as human life and activities. The United Nations Environment Programme (UNEP) Regional Seas Programme recognises the immediate and direct interconnection between marine litter and lost/abandoned fishing gear and related debris. The problem with this is that unlike natural fibre gear that degrades over time, synthetic fishing gear is functionally resistant to degradation in the water. Hence, once discarded or lost, this gear remains in the marine environment, with negative economic and environmental impacts. Lost/abandoned fishing gear is increasingly becoming a world wide problem. Statistics or estimates on quantities are hard to find, but it is assumed that hundreds of thousands of tonnes of non-degradable fishing nets are abandoned or lost in the world oceans every year. Putting prominent emphasis on the effort to address the issue of lost or abandoned fishing gear within the wider context of marine litter, UNEP’s Regional Seas Programme can act as a platform for developing common Regional objectives, promoting synergies and coordinated Regional implementation.23 Commercial fishing interests can be affected when fisheries resources are depleted by ‘ghost fishing’, where lost or abandoned nets and traps continue to capture target and non-target species. This also reduces reproductive potential, as the nets may capture immature fish that have not yet produced offspring. Ghost fishing can also result in the needless death of marine organisms through entrapment and tangling. Even when the lost nets sink from the weight of their 'catch', the persistent nature of the plastics from which they are made means that they can continue to damage the seabed and affect commercially important shellfish species for many years. An estimated $250 million (about €161 million or £127 million) in marketable lobster is lost every year due to ghost fishing (Global Marine Litter Information Gateway, 2004).
23 UNEP Regional Seas Programme. April 2005. Marine Litter And Abandoned Fishing Gear. Nairobi.

46
According to the Norwegian Fisheries Directorate, efforts to collect and take up lost fishing nets have been made regularly since 1983. On average, about 500 nets are found and removed every year (with a peak in 1992, when some 1,200 nets were removed). However, it is assumed that considerably larger amounts of fishing nets are lost and not reported. Since 1989, it has been laid down in Norwegian legislation that when nets are lost during fishing for cod, haddock and saith, this should be reported to the Norwegian Coastguard.24 The Marine Institute and BIM, from Ireland, together with Seafish and CEFAS from the UK have recently begun an EU funded project focussing on assessing the extent and effect of lost, discarded and abandoned gillnets on the shelf edge and deepwater fisheries off the coast of Ireland and the UK. This programme (DEEPCLEAN) 25 has the following three key objectives: • Retrieving lost deepwater gillnets; • Assessing the scale of ghost netting in the fisheries; and • Evaluating the biological consequences. The motivation behind this programme is to reduce any unnecessary wastage of monkfish and other species caused by ghost fishing. While the EU regulations introduced in 2006, which restrict depth fished, fleet length and soak-times, are likely to have reduced the problem, nets lost before these regulations came into force may still be catching fish and need to be removed. In addition, gear conflicts between gill-netters and trawlers may continue to be problematic, not only in terms of being a potential source of ghost fishing, but also are costly for all fleets in terms of gear damage and loss in fishing time. The DEEPCLEAN surveys planned for 2008 will be the largest coordinated retrieval exercise conducted in the North-East Atlantic (a total of 80 days) and will cover a wide area off the coast of Ireland and the UK including Rockall and the Porcupine. Depths from 200m-1000m will be covered to encompass both the hake and monkfish fisheries. In Belgium there is anecdotal evidence of entanglement of birds in nets although this is not documented. Moreover, it is not always clear if entangled birds were victims of abandoned gear or have been caught by nets and cut out afterwards. There is evidence of negative impacts in the Azores caused mainly by pelagic trawls with hooks and nylon lines that entangle several fish species, sea birds, turtles and cetaceans.
3.3 Socio-economic Effects Marine litter can cause serious socio-economic losses to various sectors and authorities. In 2000, KIMO International presented the results of a two-year project to investigate the economic and social impacts of marine litter on coastal communities26. The report demonstrates the significant costs to coastal communities not previously acknowledged and demonstrates not only that polluters of the oceans are not being caught but that they are not being made to pay for their actions either. Marine litter may have impacts on human health and local economics including the loss of tourism and recreational potential, repeated clean-up costs, fouling of marine equipment and fishing gear, direct competition with fisheries (ghost fishing) and reduced value of catches.27 Sectors that can be economically affected by marine litter are: • Local Authorities (human health and safety, beach and sea cleaning operations, waste
disposal)
24 OSPAR Commission 2007. Background Report on Fishing-for-litter Activities in the OSPAR Region 25 http://www.bim.ie/templates/text_content.asp?node_id=1034 26 Hall, K. 2000. Impacts of Marine Debris and Oil Economic & Social Costs to Coastal Communities Kommunenes Internasjonale Miljoorganisasjon (KIMO) 27 MCS Beachwatch 2007. The Annual UK Beach Litter Survey report Marine Conservation Society

47
• Tourism and recreational activities (local business, publicity) • Shipping (fouled propellers, broken engines, removal of litter in harbours, waste management
in harbours) • Fishing (reduced catch, damaged nets, fouled propellers, contamination) • Agriculture by the coast (wind blown marine litter harms livestock, through ingestion, and
stock fences) • Marinas and recreational boats (fouled/entangled propellers, blocked intake pipes/valves,
fouled rudder/anchor) • Aquaculture (contaminated cages, loss of stock due to marine litter, damaged propellers) • Rescue services The main cost to Local Authorities throughout the study area was for beach cleaning. The UK Tourist Boards responding to this survey reported that over 34 million people were specifically visiting the coast each year. These visitors spend an estimated £1.4 billion (about €1.8 billion) each year visiting coastal attractions. In comparison with the high numbers of tourists visiting the coast each year, the number of complaints about the state of the beach received by tourist boards remains low, with less than 200 being reported annually. These complaints are generally about dog fouling, sewage or broken glass. Tourist Boards also stated that they received few reports of actual injuries occurring on the beach due to marine debris. The fishing industry has long been associated with being a main contributor of marine pollution but little work has been done on the effects of marine debris and other pollution on the industry. Shetland fishermen were questioned about the effects of marine debris on their fishing activities. They responded that 92% had recurring problems with accumulated debris in nets, 69% had had their catch contaminated by debris and that 92% had snagged their nets on debris on the seabed. Many also experienced fouled propellers and blocked intake pipes. On average 1-2 hours per week is spent clearing debris from nets. The debris could cause a restricted catch and many boats avoided particular fishing areas altogether due to the high concentrations of debris. The catch, net and other equipment could be contaminated by oil containers, paint tins, oil filters and other chemicals. This may cost up to £2,000 (about €2,500) in lost revenue each time. Large items such as wires and old nets may be collected off the seabed and may damage the nets. A fouled propeller could cost up to £300 (about €380) for the hire of a diver to disentangle it. A substantial amount of fishing time could also be lost. It is estimated that each boat could lose between £6,000 (about €7,600) and £30,000 (about €38,000) per year due to the effects and presence of marine debris. If 50% of the Shetland fishing fleet was affected in the same way, the cost to the local industry could be between £492,000 (about €624,000) and £2,460,000 (about €3,120,000). The cost of marine debris to the fishing community of the Bohus Region of Sweden was estimated to be over £620,000 (about €786,296) each year. According to reports from fishermen in both Shetland and Esbjerg, small inshore boats appear to be more susceptible to marine debris than large pelagic boats. This is because the larger offshore boats are fishing mid-water and are therefore less likely to collect debris on or near the seabed. Smaller boats may also notice the presence of marine debris more than larger boats as they have less crew and a lower profit margin, so any time or money lost will affect them more. In comparison with the commercial fishing industry, aquaculture in Shetland was not affected as much by marine debris. On average one hour per month was spent removing debris from in or beside the cages. The main problem was that of propeller fouling and blocked intake pipes. The costs of hiring a diver to disentangle a propeller are similar to those reported by the fishermen. The aquaculture industry also stated that it could cost up to £1,200 (about €1,500) to repair or replace a damaged propeller. Harbour Authorities throughout the UK reported over 180 incidences of propeller fouling during 1998. The cost of hiring a diver was between £100-£400 (about €127-€507) In some cases, the vessel was required to be lifted out by crane to remove the fouled material. Fouled anchors were also known to have delayed vessels and in some cases, caused safety concerns during bad weather. Some Harbour Authorities also undertook additional dredging or removal of items from the seabed. A survey of 42 harbour authorities reported that up to £26,100 (about €33,000) is spent per year in some ports; to clear fouled propellers and remove debris from the water discarded fish boxes were a problem in many harbours.

48
Marina managers reported high numbers of propeller fouling among recreational vessels particularly during the summer months. Some marinas reported better waste management practice by boat owners resulting in reduced marina cleaning for their staff. In 1998, the Royal National Lifeboat Institution (RNLI) attended over 200 incidents to vessels with a fouled propeller. The rescues were divided equally between fishing vessels and pleasure craft. As noticed by the marina managers, the RNLI data confirmed that there are more incidences of recreational boats becoming fouled in the summer months. It is estimated that the cost to the RNLI to undertake these rescues is on average £900,000 (about €1,141,402) each year. In many exposed coastal areas and, in particular island areas, marine debris may be blown from the shore onto neighbouring farmland. For example, in Shetland, 96% of responding crofters had experienced problems with debris blowing onto their land. They may spend up to 3 hours per month removing debris from their fields. Debris may also collect on fences causing damage to them, and in drainage ditches. Up to five animals per croft may become entangled in marine debris each year. It is estimated that marine debris may cost affected crofters £400 (about €507) each year in Shetland. Power stations reported having to clean their water intake screens more often due to accumulations of marine debris. The amount of debris removed from the screens varies between 100-10,000 tonnes depending on location each year. This may cost the company up to £50,000 (about €63,465) to remove the debris with additional costs for pump maintenance. Table 3.2 below outlines the worst case scenario for the Shetland Islands (population 22,000) taking into consideration the financial impact on all sectors based on 1998 figures. The total of £5,662,840 (about €7,119,601) is highly significant for such a small coastal community and highlights the impact of marine litter.
Table 3.2 Areas affected by marine litter in Shetland
Areas affected in Shetland
Cost per year
Beach cleaning budget (Local Authority)
£10,000.00 (€12,573)
Da Voar Redd Up28
£5,000.00 (€6,286)
Voluntary labour and transport cost
£45,000.00 (€56,578)
Power station cost
£1,000.00 (€1,257)
Harbour clean-up
£1,000.00 (€1,257)
Aquaculture
£51,840.00 (€65,175)
Crofters
£600,000.00 (€758,343)
Fishing Industry
£4,920,000.00 (€6,184,651)
Lifeboat launching cost
£29,000.00 (€36,460)
TOTAL
£5,662,840 (€7,119,602)
28 ‘Da Voar Redd Up’ is an annual voluntary clean up of Shetland. It includes removal of debris form beaches, roadsides and other public areas and is undertaken by various community groups

49
3.3.1 Cost of Management of Marine Litter at the Community level, and other levels
3.3.1.1 Arctic Waters Contracting Parties provided no information on the economic impacts of marine litter in Arctic Waters.
3.3.1.2 Greater North Sea It is difficult to come up with a number of high accuracy in Norway because the amount of management differs a lot from municipality to municipality. In the area of Skjærgårdstjenesten, in the Oslofjord, the cost would be around 50,000 – 100,000 NOK (€6,269-€12,533 or approx £5 million-£10 million) to clean the coastline. There are several sectors economically affected by marine litter on the Swedish west coast, such as tourism, fishing and coastal agriculture. Also local authorities have been engaged in beach cleaning since 1992, which incurs significant operational and waste disposal costs. The cost for cleaning the Swedish Skagerrak coast in 2006 was about 15 million SEK (about €1.5 million or £1.2 million). The work demands about 100 people for 4 months to manage the coast and the 2000 islands in the archipelago. In areas of high tourism, the costs of coastal cleaning tend to be high and must be paid out of municipal funds. The Hague Municipality, in the Netherlands receives approximately 15 million tourists each year and spends as much as €626,709 (about £494,164) per year on coastal cleaning. The costs, at the municipality level, for processing litter (including transport) is about €165 (about £130) per ton. In Den Helder, with approximately 1.5 million tourists per year, around €25,080 (about £19,776) are spent on cleaning beaches per annum29. In addition fifteen ships participate in the collecting of marine litter in the Fishing for Litter initiative the costs for transport and processing the marine litter collected is approximately €22,000 (about £17,347) to €35,000 (about £27,574) per year. At the national level the Ministry of Transport spends €100,000 (about £78,770) per year (approximately 2500 man-hours) on marine litter issues. This includes approximately €25,000 (about £19,712) per year for monitoring marine litter on beaches since 2001. In UK, the cost of management at the Community level is very hard to estimate since there are many volunteer programmes such as Beachwatch, which involves around 4000 volunteers on about 400 beaches on one weekend. Costs could include the time of volunteers and time of volunteer organisers and each event, on average takes 1.5 hours plus organisers extra time, that means about 5 – 10 hours. The cost also includes litter cleaning equipment, rubbish disposal costs and MCS staff costs/time in organising events and producing reports, at least 6 months of time in total. Adopt-a-Beach, another volunteer scheme, involves about 3000 people a year on 400 beaches, cleaning the beaches about 4 times in the year. UK local authorities, industry and coastal communities spend approximately £14 million (about €18 million) a year to clean up coastal marine litter in England and Wales (Environment Agency, 2004). Another study of a 6km stretch of beach at Studland in Dorset found that 1 million visitors per year resulted in 12 to 13 tonnes of litter being collected each week during the summer, at a cost of £36,000.00 (about €45,515) per year (Environment Agency, 2001). Also the direct and indirect cost of litter on the Kent coastline has been estimated at over £11 million (about €14 million) per annum (Gilbert, 1996). Although these repeated beach clean-up efforts reduce the amount of litter on the shore in the short-term, these reactive efforts can be expensive and time consuming, and do not directly address the source of the problem.
29 Hall, K. 2000. Impacts of Marine Debris and Oil Economic & Social Costs to Coastal Communities Kommunenes Internasjonale Miljoorganisasjon (KIMO)

50
In Belgium beach cleaning is a responsibility of local authorities, which spend considerable time and money on this activity, since the tourism sector is very important in Belgian beaches. Beach cleaning involves the use of mechanical cleaning devices that not only remove large litter items but also natural items. Moreover this type of cleaning destroys the natural aspect of the beach. Attempts have been made to persuade coastal communities to use other methods (handpicking) for removing marine litter. There is no data about the cost of management for Belgium, or at least not readily available. Although the Coordination Centre for Integrated Coastal Zone Management is currently considering initiating the development of a study and a questionnaire to be send to the costal communities to obtain current data.
3.3.1.3 The Celtic Seas No information was provided for Irish waters but in the UK local authorities, and ultimately local taxpayers, bear the financial burden of clearing litter on beaches. In a survey of 56 local authorities in the UK, the annual expenditure on beach cleaning ranged from £15/km (about €19/km) in West Dunbartonshire to £50,000/km (€63,241/km) in Wyre.
3.3.1.4 Bay of Biscay and Iberian Coast The management of marine litter in Spain is included in the management of municipal solid residues, so it is difficult to quantify the cost generated. For instance a council with 30 beaches (5 of them are Blue Flag Beaches) spends around €80,000 (about £63,080) for beach cleaning a year. In France a 2005 study (IPSOS, 2005) showed that the 40% of the users of a beach would stop visiting this beach if it was not cleaned this also included “natural elements” like seaweed. Some of the results indicated that of the 99% of French communes who clean up their beaches, 50% of them do it the whole year, 30% during holiday periods, 13% only during summer and the rest is unknown. The management of marine litter is generally included into the management of the municipal garbage, so it is difficult to quantify the cost generated. On the other hand, the cost of “beach caring” includes beach clearing, monitoring of buoys, coastguard, etc. For instance, a council with 30 beaches (5 of them with blue flag) spends around €400,000 (about £315,402) per year on “beach caring”, around a 20% of this cost relates to beach clearing. In Landes, in the Bay of Biscay, the cost of cleaning-up 108 km of sandy beaches was €8 million (about £6.5 million), between 1998 and 2005. Also an enquiry by CEDRE in 2002 showed that the cost of beach cleaning was between €4,500 (about £3,548) and 50,000€ (about £39,425) per year per council corresponding to an average cost of €6,500 (about £5,125) per km of cleaned beach per year.
3.3.1.5 Wider Atlantic Contracting Parties provided no information for the cost of management of marine litter in the Wider Atlantic.

51
4 Existing Legal Regimes in the areas related to the Marine Litter in the North-East Atlantic
4.1 International
4.1.1 United Nations Convention on the Law of the Sea (UNCLOS) The United Nations Convention on the Law of the Sea (UNCLOS) comprises 320 Articles and nine annexes, governing all aspects of ocean space, such as delimitation, environmental control, marine scientific research, economic and commercial activities, transfer of technology and the settlement of disputes relating to ocean matters. Part XII of the Convention (Articles 192-237) addresses Protection and Preservation of the Marine Environment and gives basic obligations to prevent, reduce and control pollution from land-based sources; pollution from sea-bed activities subject to national jurisdiction; pollution from activities in the Area; pollution by dumping; pollution from vessels; and pollution from or through the atmosphere (Articles 207-212).
4.1.2 International Convention for the Prevention of Pollution from Ships 1973 (MARPOL 73/78) Annex V
MARPOL 73/78 is the main international convention aimed at controlling pollution from the shipping sector and deals with garbage (that may become marine litter). Annex V has been in force since 1988. The MARPOL Convention regulates types and quantities of waste that ships may discharge into the sea, taking into account the ecological sensitivity of different sea areas. The disposal of plastics is prohibited in all seas. All OSPAR Contracting Parties have ratified the Convention, including Annex V. The North Sea is a Special Area for the purpose of Annex V to MARPOL 73/78. The International Convention was laid down as international law in 1973 by the International Maritime Organisation and modified by the Protocol of 1978, generally known as MARPOL 73/78. MARPOL 73/78 has six annexes covering different types of pollution (see table 5.1). Table 4.1 Pollution types covered by MARPOL Annexes I-VI
Annex I Oil
Annex II Noxious liquid substances by bulk
Annex III Harmful substances carried by sea in packaged form or freight containers, portable tanks, or road and rail tank wagons
Annex IV Sewage (See section 5.2.3)
Annex V Garbage
Annex VI Air pollution
In MARPOL Annex V, it is required that all ships of 400 gross tons and above, or ships certified to carry more than 15 persons, develop and follow a written garbage management plan. Such plans should have been developed by 1 July 1997 and include the following:
• Description of the collection, processing, storage and disposal of each type of waste generated by the ship, and waste that may be further categorised by local requirements, e.g., hazardous and medical waste;
• List of waste management techniques/equipment available and to be employed;
• Provisions for the discharge of garbage in compliance with MARPOL Annex V; and
• Designation of a person to be responsible for carrying out the plan.
The North Sea and adjacent areas have been designated as Special Areas with regard to MARPOL Annex V. In accordance with the regulations for Special Areas, discharges of garbage

52
(except food waste) into the sea are prohibited. The Convention also comprises an obligation for countries surrounding Special Areas to provide appropriate reception facilities for ship-generated waste in their ports and harbours. Currently the IMO is undertaking a review of the MARPOL Annex V, due to be completed by 2008, it is hoped the OSPAR/UNEP review of marine litter reporting in the OSPAR Region will feed into that process. The Annex V review aims to assess the effectiveness of the Annex in addressing sea-based sources of marine litter and will be undertaken in consultation with relevant organisations and bodies.30
4.1.3 London Convention on the Prevention of Marine Pollution by Dumping of Wastes and Other Matter, 1972 (LC) The London Convention was signed in 1972 and covers solely the control of dumping of wastes at sea. All OSPAR Contracting Parties have ratified the Convention. Annex I of the London Convention prohibits signatories from dumping persistent plastics and other non-biodegradable materials as well as other compounds into the sea from ships and other man-made structures. It is recognised that plastic materials, and other materials that may cause problems of entanglement and ingestion by marine organisms, constitute an environmental hazard. As a consequence, dumping of such materials is prohibited. In 1996 the London Protocol was drafted entering into force on 24 March 2006. Where the London Convention defines “dumping is allowed except …” the London Protocol 1996 defines “dumping is prohibited except …”
4.1.4 Agenda 21 and the Johannesburg Plan of Implementation In 1992, more than 100 heads of state met in Rio de Janeiro, Brazil for the first international Earth Summit convened to address urgent problems of environmental protection and socio-economic development. The assembled leaders signed the Convention on Climate Change and the Convention on Biological Diversity, endorsed the Rio Declaration and the Forest Principles, and adopted Agenda 21, a 300-page plan for achieving sustainable development in the 21st century. The present plan of implementation will further build on the achievements made since the United Nations Conference on Environment and Development and expedite the realisation of the remaining goals. To this end, there is a commitment to undertake concrete actions and measures at all levels and to enhancing international cooperation, taking into account the Rio principles, including, inter alia, the principle of common but differentiated responsibilities as set out in principle 7 of the Rio Declaration on Environment and Development.31 These efforts will also promote the integration of the three components of sustainable development; economic development, social development and environmental protection, as interdependent and mutually reinforcing pillars. Poverty eradication, changing unsustainable patterns of production and consumption and protecting and managing the natural resource base of economic and social development are overarching objectives of, and essential requirements for, sustainable development.
4.1.5 Convention on Biological Diversity, with the Jakarta Mandate
The CBD is a legally binding instrument committing governments to protecting the earth's biological resources. It was opened for signature in June 1992, at the Earth Summit in Rio de Janeiro. As of November 1996, 164 States and one Regional economic integration organisation had ratified the Convention.
30 http://www.imo.org/About/mainframe.asp?topic_id=109&doc_id=7537 31 Report of the United Nations Conference on Environment and Development, Rio de Janeiro, 3-14 June 1992 (United Nations publication, Sales No. E.93.I.8 and corrigenda), vol. I: Resolutions Adopted by the Conference, resolution 1, annex I.
53
The three objectives of the CBD are the conservation of biological diversity, the sustainable use of its components and the fair and equitable sharing of the benefits arising out of the utilization of genetic resources. The CBD is unique in the sense that it is the only multilateral, legally binding instrument that covers all the world's ecosystems, thereby taking a comprehensive rather than a sectoral approach.
The Jakarta Mandate on Marine and Coastal Biological Diversity is a global consensus on the importance of marine and coastal biological diversity and is a part of the Ministerial Declaration on the implementation of the Convention on Biological Diversity as adopted by the Conference of the Parties (COP) at its second meeting held in Jakarta in November 1995. The programme of the Jakarta Mandate covering the five themes namely Integrated Marine and Coastal Area Management (IMCAM), Marine and Coastal Living Resources (MCLR), Marine and Coastal Protected Areas (MCPA), Mariculture, and Alien Species are developed to assist in mitigating the problem faced by marine and coastal ecosystems. The paper outlines the importance of marine and coastal biological diversity and status of the marine and coastal resources in the region.32
4.1.6 EU Directive on port reception facilities for ship-generated waste and cargo residues (EC2000/59) The aim of this directive is to reduce the illicit discharge of waste and other pollutants to a minimum, in order to protect the marine environment. Key points of the directive are: Ports must set up waste handling plants and make available adequate reception facilities. Every ship is required to deliver all ship-generated waste and cargo residues to ports. All ships are to pay a set fee for waste disposal, irrespective of their actual use of the facilities. Member states must ensure proper monitoring of compliance with the directive, by means of spot checks and the exchange of information between ports. Ships that do not deliver waste in one port will be reported to their next port of call for a more detailed inspection. The Port Waste Reception Facilities Regulations entered into force on 16th July 2003. There are three significant changes under the new regulations: • All ships must provide notification before entering into the port or terminal of the waste they
will discharge, including information on types and quantities, • All ships must deliver their waste to the port reception facilities before leaving the port or
terminal, unless they have sufficient dedicated storage capacity to store the waste until the next port of call,
• All ships must pay a mandatory charge to make a significant contribution to the cost of the port reception facilities for ship generated waste, whether they use them or not.
Ports are required to cover the costs of the post waste reception facilities including costs of treatment and disposal. How the port recovered its costs were left open so they vary from port to port with some charging on a ship-by-ship basis, others incorporated in harbour/port dues. However the charge is calculated, the port must make clear the amount of the charge, and the way in which it has been calculated.
4.1.7 The Waste Framework Directive 75/442/EEC Concerns all waste except for: radioactive waste; waste resulting from extraction and prospecting of mineral resources; non-dangerous agricultural waste; waste waters – with the exception of waste in a liquid form; decommissioned explosives. The directive sets out the following: • Sets a waste management hierarchy 1) prevention 2) reuse and recycle 3) energy recovery. • Obliges competent authorities of Member States to draw up and implement waste
management plans
32 International Symposium on Protection and Management of Coastal Marine Ecosystem

54
• Recommends establishing an integrated network of waste disposal installations, taking account of best availabile technology and the use of the self-sufficiency and proximity principle
• Introduces permit requirements for waste processing and disposal makes it necessary to keep a record, which covers waste type, quantity, origin, the destination, frequency of collection, mode of transport and treatment methods
• In accordance with the polluter pays principle the cost of disposing of waste must be borne by the holder of the waste
4.1.8 EU Marine Strategy Framework Directive The directive sets up for the first time an overall, integrated policy for the protection of the marine environment, which is faced with a number of threats including loss or degradation of biodiversity and changes in its structure, loss of habitats, contamination by dangerous substances and nutrients and the impact of climate change. It requires Member States to take the necessary measures to achieve or maintain good environmental status in the marine environment by the year 2020. The directive divides the EU waters into marine regions / subregions and Member States by 2015 should develop programmes and measures, which should enter into operation by 2016 at the latest, designed to achieve or maintain good environmental status by 2020. Marine Litter is specifically mentioned as one of the elements that must be addressed.
4.1.9 EC Urban Waste Water Treatment Directive (97/27/EEC) The EC UWWTD (91/27/EEC) required that, by 31st December 2005, all sewerage discharges serving populations over 10,000 in coastal areas and 2,000 in estuarine areas must receive secondary (biological) treatment prior to discharge. Discharges to waters designated as 'sensitive' were required to have tertiary treatment including nutrient removal by the end of 1998. Following the 2000-2005 Periodic Price Review, the UK Government committed water companies to exceed the requirements of the EC Directive, requiring that all sewerage discharges serving more than 2,000 people receive secondary treatment by 2005. As a result, the only areas where raw sewerage containing solids and used sanitary protection may still be discharged from coastal and estuarine outfalls are those serving populations of less than 2,000.
4.1.10 EU Environmental Liability Directive (2004/35/EC) This Directive came into force in April 2004 and its aim is to prevent environmental damage by forcing industrial operators (or polluters) to pay both prevention and remediation costs – the “Polluter Pays Principle”. Accordingly, under the Directive, a preventative framework will be established with the aim of stopping (or rectifying) “significant environmental damage”. The definition of significant environmental damage is dependent on: The level of biodiversity protection as given in the EU Habitats Directive and Wild birds Directive and whether a water area is covered by the Water Framework Directive. The Directive contains specific criteria to determine when damage is “significant”. Member states had until 30th April 2007 to incorporate the Directive’s provisions into national law. Under this new Directive, an operator causing environmental damage while engaged in specified hazardous activities will be strictly liable, regardless of fault or negligence. They will, however, potentially be allowed permit and state of knowledge defences. Operators who cause damage while engaged in any other activity may be subject to a fault based liability regime.
4.1.11 EU Directive on Packaging and Packaging waste (Directive 2004/12/EC)
The main objective of the Directive on Packaging and Packaging Waste is to prevent packaging waste by encouraging packaging re-use and recycling, while at the same time avoiding distortions in the internal market. The Directive requests that Member States introduce systems for the return and/or collection of used packaging and defines specific targets for packaging waste recovery and recycling.

55
4.2 National and Local Legislation
4.2.1 Iceland All local communities have waste schemes that contribute to the protection of coastal zones at a local level in Iceland. On the other hand, there are laws and regulations that protect the coast and the marine environment at a national level:
4.2.1.1 Law on protection of the coast and sea no. 33/2004. This law prohibits disposal from ships into the sea.
4.2.1.2 Regulation on waste disposal from ships. no. 801/2004.
4.2.1.3 Regulation on waste disposal no. 737/2003 This is a regulation on general waste disposal and proper waste management. As such it contributes to protection of coastal areas as the majority of all communities in Iceland are situated at the coast.
4.2.2 Faeroe Islands (Denmark) The Law Nr. 59 from 17. May 2005 on the protection of the marine environment is implemented in the Faeroe Islands (Løgtingslóg Nr. 59 frá 17. mai 2005 um verju av havumhvørvinum) This is a broad law on protecting the sea environment. The subsequent notices are on removal of Oil, Wastewater and Litter from vessels, on port reception facilities and on the handling of dangerous cargo.
4.2.3 Norway At a national level in Norway the main legislation is The Norwegian Pollution Control Act, Chapter 5 on Waste.
4.2.4 Netherlands MARPOL and the Port Waste Reception Facilities Directive have been implemented nationally furthermore some aspects of garbage and littering on beaches is covered by provincial and local legislation.
4.2.5 Sweden It is prohibited to dump waste in the form of solid matter, liquid or gas without the permission of the Swedish Environmental protection agency (chapter 15 and 30 form the Environmental Code). When it comes to marine litter on beaches, the municipalities have a responsibility to keep the beaches clean.
4.2.6 Germany In Germany the legislation regarding marine litter is the responsibility of the Länder (Regional Governments).

56
4.2.6.1 Bremen • Bremen Law on Port Waste Reception Facilities for Ships’ Wastes and Cargo Residues,
November 2002. • Ordinance on Port Waste Reception Facilities and Fees for Ships’ Wastes and Cargo
Residues, February 2003. • Bremen Tariffs on Port Dues. December 2007.
4.2.6.2 Hamburg • Law by the City of Hamburg on ship-generated waste and cargo residues. December 2002 • Ordinance on the levying of a charge for the disposal of ship-generated waste (Ship-generated
Waste Charge Ordinance) as of 16 November 2004.
4.2.6.3 Niedersachsen (Lower Saxony) • Waste Management Law of Lower Saxony. March 2006 • Regulation on the discharge of ship-generated waste and cargo residues in seaports. October
2006. In addition, local public waste disposal authority statutes are applicable in: 1. Stadt Emden, Frickensteinplatz 2, 26721 Emden. 2. Stadt Wilhelmshaven, Rathaus, 26380 Wilhelmshaven. 3. Stadt Cuxhaven, Rathausplatz 1, 27472 Cuxhaven. 4. Landkreis Leer, Bergmannstraße 37,D - 26789 Leer. 5. Landkreis Aurich, Fischteichweg 7-13, 26603 Aurich. 6. Landkreis Wittmund - Am Markt 9 - 26409 Wittmund. 7. Landkreis Friesland, Lindenallee 1, D-26441 Jever. 8. Landkreis Wesermarsch, Poggenburger Straße 15, 26919 Brake. 9. Landkreis Cuxhaven, Vincent-Lübeck-Str. 2, 27474 Cuxhaven. 10. Landkreis Stade, Am Sande 2, 21682 Stade.
4.2.6.4 Schleswig-Holstein • Waste Management Law of Schleswig-Holstein. January 1999. • Ordinance on the Disposal of Ships’ Wastes and Cargo Residues in Ports of Schleswig-
Holstein In addition, statutes of local public waste authorities (municipalities) are applicable.
4.2.7 UK The implementation of national and local legislation related to marine litter in UK dictated by the following acts (4.2.7.1. to 4.2.7.10).
4.2.7.1 The Merchant Shipping and Maritime Security Act 1997 The Merchant Shipping and Maritime Security Act 1997, which amended The Merchant Shipping Act 1995, brought in enabling powers for the Secretary of State for Environment, Transport and the Regions to require mandatory provision and use of port waste reception facilities, port waste management plans and garbage record books. These enabling powers are to be exercised through The Merchant Shipping (Prevention of Pollution from Garbage) Regulations 1998 and The Merchant Shipping (Port Waste Reception Facilities) Regulations 1997.

57
4.2.7.2 The Merchant Shipping (Prevention of Pollution by Garbage) Regulations 1998 The Merchant Shipping (Prevention of Pollution by Garbage) Regulations 1998 replaced the 1988 regulations of the same name in July 1998 and apply to UK ships wherever they may be, and to foreign ships in UK waters. The Regulations apply to small craft and yachts, fishing vessels, passenger ferries, cargo ferries, offshore platforms and Royal Fleet Auxiliaries; they prohibit the disposal of plastics and oily wastes anywhere in UK waters and prohibit the disposal of other types of pollutant within specific distances from nearest land.
4.2.7.2.1 Atlantic Ocean and Irish Sea The dumping of the following waste types is prohibited within specific distances (see table 4.2).
Table 4.2 Restriction on dumping waste at sea, from Merchant Shipping Regulations 1998
Outside 25 nautical miles nearest land
12 to 25 nautical miles from land
3 to 12 nautical miles from land
0 to 3 nautical miles from nearest land
Plastics Plastics, lining & packaging materials that float
Plastics, lining & packaging materials that float
No waste or rubbish of any kind may be thrown overboard
Oily wastes Oily wastes Oily wastes
Garbage if not ground to less than 25 mm
4.2.7.2.2 North Sea and English Channel The North Sea and the English Channel are declared Special Areas under the Regulations, and dumping of any waste is prohibited within 12 nautical miles of land. Beyond this limit, it is illegal to dispose of any waste other than food wastes. Under the Regulations there is a requirement for all ships of 400 tonnes gross tonnage or more and ships certified to carry 15 persons or more to: • Prepare a garbage management plan, • Display placards notifying crew and passengers of the disposal requirements for ships’ waste. • Maintain a Garbage Record Book, logging all waste discharge or incineration operations. Garbage record books should: • Record each day the volume, description and type of garbage arising from the normal
operation of the ship. • Record the date, time, volume, description and type of garbage placed into reception facilities
at named UK ports. • Record the date, volume and method of disposal of any garbage from the ship by whatever
means. Garbage Record Books must be available for inspection and port state control inspectors have powers to take copies of entries, and detain vessels for the purposes of discharging their litter to reception facilities. Where clear evidence of illegal disposal of litter is available, alleged offenders can be prosecuted under The Merchant Shipping (Prevention of Pollution by Garbage) Regulations 1988. The maximum fine was increased in 1998 from £5,000.00 (about €6,341.10) to £25,000.00 (about

58
€31,705.48) in a Magistrate’s Court and unlimited on conviction before the Crown Court, and applies within all UK controlled waters out to 200 nautical miles.
4.2.7.3 The Merchant Shipping (Port Waste Reception Facilities) Regulations 1997 These Regulations replaced The Merchant Shipping (Reception Facilities for Garbage) Regulations 1988 in January 1998 and require all ports and terminals in the UK to: Provide adequate reception facilities for waste, including dry waste and oil. Prepare a waste management plan to be approved by the Secretary of State. Any harbour authority or terminal operator failing to comply can be fined up to £2,000 under the Merchant Shipping Notice M. 1389.
4.2.7.4 Merchant Shipping (Prevention of Pollution) (Limits) Regulations 1996 New regulations came into force in 1996, extending the UK’s powers to prosecute for pollution offences. The Merchant Shipping (Prevention of Pollution) (Limits) Regulations 1996, created a ‘pollution zone’ extending out to 200 nautical miles from the UK coast. Any foreign ship suspected of committing a pollution offence within the ‘pollution zone’ will be liable to prosecution if it calls at a UK port.
4.2.7.5 Environmental Protection Act (1990) Under Section 87 of the EPA 1990, it is an offence to drop litter in any public place, including beaches. Section 88 allows local authority officers and / or accredited persons to issue a fixed penalty notice for leaving litter (£75 in England and Wales, and €125 in Ireland). i.e. no proceedings will be taken if the fixed penalty is paid within 14 days. The maximum fine for littering is £2,500 (about €3,161), but unless a person of authority catches the offence on film, enforcement is difficult. The average fine is around £100 (about €126) plus costs. The EPA also places duties on, and gives powers to, the local authority to keep its beaches clear of litter according to the Code of Practice. In 2000, a revised Code of Practice extended the requirements from amenity beaches only to all beaches. Individual local authorities must decide the level of cleanliness that they are able to give to any non-amenity beaches in their area. Duty bodies are advised that they may find it helpful to encourage voluntary groups to assist in cleaning up beaches. The Code of Practice was updated again in 2006. The code now carries a description of aquatic litter, and guidance that suggests that between May and September beaches should be subject to a frequent monitoring routine, and cleansed to as practicable a standard as possible. The code also recommends that duty bodies carry out regular monitoring and appropriate cleansing of beaches that are used outside of the traditional bathing season (DEFRA, 2006a). Under Section 33 of the EPA 1990, it is an offence if a person has deposited or knowingly permitted the deposit of controlled waste on land without a waste management licence. Local authorities can prosecute fly-tippers with fines of up to £20,000 (about €25,274) and/or prison for two years (five if the waste is special/hazardous). See also Clean Neighbourhoods and Environment Act.
4.2.7.6 The Dogs (Fouling of Land) Act 1996 The Dogs (Fouling of Land) Act allows local authorities to designate land upon which it is an offence not to clean up after your dog. The maximum fine for an offence is £1,000 (about €1,263) and councils have the power to issue a £50 (about €63) fixed penalty fine. Under the Clean Neighbourhoods and Environment Act (2005), byelaws can be made by local authorities to impose dog bans, make dog fouling an offence and insist that dogs be kept on leads.

59
4.2.7.7 The Anti Social Behaviour Act (2003) The Act received Royal Assent on 20 November 2003. The powers in the Act came into force gradually, with the first group of provisions commencing on 20 January 2004 and 27 February 2004. The Act extends the range of powers available to local authorities in England and Wales and gives waste collection authorities in England and Wales the powers to stop, search and seize a vehicle they suspect of being used for the unlawful deposit of waste. It gives waste collection authorities the power to investigate incidents of unlawfully deposited waste, and removes the barrier that currently prevents local authorities from entering relevant land (Crown and or land owned by a Statutory Undertaker), clearing that land of litter, and recovering its costs through the courts.
4.2.7.8 Local Government Act 2003 On the 18th November 2003, Section 119 of the Local Government Act 2003 came into force in the UK. The Act relates to fixed penalty notices for littering and dog fouling. Section 119 (m) provides guidance notes on new procedures for local authorities that issue fixed penalty notices for littering and dog fouling offences. This change means that Section 88(6)(a) of the Environmental Protection Act 1990 and section 4(2) of the Dogs (Fouling of Land) Act 1996 cease to have effect. Local authorities can now retain any sums they receive from the issuing of such penalty notices. It was hoped this would encourage more local authorities to take a proactive approach to management of the local environment (Improvement and Development Agency, 2004). This provides local authorities with more incentive to impose fines, and also to create positions such as litter wardens as they can be self-funding from the revenue gained from fines.
4.2.7.9 Clean Neighborhoods and Environment Act 2005 The Clean Neighbourhoods and Environment Act 2005, to tackle environmental crime and anti-social behaviour came into force in June 2005, and plays a key part in the Governments agenda to create cleaner, safer and greener communities. It applies to England and Wales only and makes it an offence to drop litter anywhere, including private land, rivers, ponds and lakes. The Act permits the greater use of fixed penalty fines as an alternative to prosecution and allows local authorities to set their own rates along with giving parish councils the power to issue fixed penalty fines for litter and dog offences, graffiti and fly-tipping. Under the Act fly tipping became an arrestable offence, with the most serious cases resulting in a maximum £50,000 (about €63,160) fine or five years imprisonment. In addition, it confirms that cigarette butts and chewing gum are litter. The Government issued guidance notes for the Act in October 2005. New measures under the Act, which came into force in 2006, increase the maximum on the spot fine for dropping litter from £50 (about €63) to £80 (about €101), and allow on the spot fines of up to £100.00 (about €126) to be issued for leaving domestic litter out at the wrong time.
4.2.7.10 The Packaging (Essential Requirements) Regulation 2003. Statutory Instrument 2002 Number 1941 These requirements are specific to the manufacturing and composition of packaging. They state that packaging must be designed in such a way so as to permit its reuse or recovery, and to minimize its impact on the environment when packaging waste or residues from packaging waste are disposed of.
4.2.8 Belgium There is no local legislation in particular for marine litter in Belgium. Instead, in the coastal communities local legislation forbids fly tipping. Special containers are set on the beach for small items.

60
Household litter has to be disposed in special (payable) containers, e.g. in marinas, such as, Oostende, Zeebrugge, Blankenberge and Nieuwpoort, payable containers are available although they are not always used.
4.2.9 Ireland The implementation of the following legislation has taken place at a national level in Ireland:
4.2.9.1 S.I. No. 605 of 2001: Waste Management Environmental Levy, Plastic Bag Regulations, 2001 regulations under the Waste Management Act 1996 (as amended) The primary purpose of the plastic bag levy is to reduce the consumption of disposable plastic bags by influencing consumer behaviour. This has resulted in a significant reduction in the plastic bag litter.
4.2.9.2 Waste Management Act 1996
4.2.9.3 Sea Pollution Act, 1991
4.2.9.4 Sea Pollution (Amendment) Act 1999
4.2.9.5 Sea Pollution (Miscellaneous Provisions) Act 2006 S.I. No. 117 of 2003: European Communities (Port Reception Facilities for Ship-Generated Waste and Cargo Residues) Regulations 2003 under the European Communities Act 1972. Available from: http://www.irishstatutebook.ie/2003/en/si/0117.html S.I. No. 788 of 2007: Sea Pollution (Prevention of Oil Pollution) Regulations 2007 S.I. No. 46 of 1994: Sea Pollution (Control of Pollution by Noxious Liquid Substances in Bulk) Regulations 1994, as amended by S.I. No. 515 of 1997, as amended by S.I. No. 641 of 2002 S.I. No. 513 of 1997: Sea Pollution (Harmful Substances in Packaged Form) Regulations 1997 S.I. No. 269 of 2006: Sea Pollution (Prevention of Pollution by Sewage from Ships) Regulations 2006 S.I. No. 45 of 1994: Sea Pollution (Prevention of Pollution by Garbage from Ships) Regulations 1994, amended by S.I. No. 516 of 1997, amended by S.I. No. 239 of 2006 S.I. No. 81 of 2004: European Communities (Vessel Traffic Monitoring and Information System) Regulations 2004
4.2.10 Spain Marine litter is not covered in Spanish Legislation. It is included in the treatment of activities for control and prevention of residues and other pollutants. It is included in the management of urban garbage, management of containers and management of industrial, toxic and hazardous residues. Instead there is specific legislation related to MARPOL Convention and to EU Directive on PRFs in Spain.

61
The implementation of the following legislation has taken place at a national level: • 27/1992 (24th November) Estate ports and merchant navy. • ‘Hazardous and toxic residues’ 20/1986 (14th May) • 62/1997 (26th December) modifies the estate harbours and merchant navy law. • 11/1997 (24th April) Law of containers and residual containers • 10/1998. Law of residues. • MAM/304/2002 (8th February) Publication of the assessment and disposal of residues and the
European list of residues. • 16/2002 (1st July) Prevention and control of pollution. • FOM/3056/2002 (29th November) Scale of ships of general ports. • R.D 253/2004 (13th February) Prevention and control of marine pollution. At a local level, the implementation of the national legislation indicated above is adapted in each autonomous Region.
4.2.11 France The implementation of the following legislation has taken place at a national level in France: • French “Code General des Collectivités Territoriales” (regulation concerning Communes and
Mayors responsibilities) prescribes that the Major of Communes are responsible in case of injury by marine debris on shoreline. The Communes must clean up their shoreline so that it is safe for the users. In case of deficiency of the mayor, the local representative of state authority must substitute him.
• The French Penal Code indicates that it is forbidden to throw any waste on public or private
area.
• The French “code des ports” (ports regulation) indicates that it’s forbidden to throw any waste in harbour areas (water and facilities) and to abandon old ships.
• The Law of 14 May 1974 refers to the organisation of prevention of beach pollution by garbage
and sewage.
4.2.12 Portugal (Azores) There is no local legislation for marine litter concerning Portugal. Instead, there are several national and Regional legal tools, albeit rather ineffective when law enforcement and police patrols are not widespread and constant.
4.3 Responsible Organisations for Marine Litter
4.3.1 Iceland Icelandic ports are responsible for the disposal of litter and waste from small boats and ships. The ports facilitate waste management and guide ships on waste disposal that is carried out by the

62
private sector. Local communities are responsible for keeping the coastline free of litter and waste and beach cleaning.
4.3.2 Faeroe Islands (Denmark) The organisation that has the responsibility for marine litter is Umhvørvisstovan, that is the National Environmental Agency. Umhvørvisstovan and Løgmálaráðið (Ministry of Environment) have the legal responsibility for implementing and enforcing marine litter legislation.
4.3.3 Netherlands With respect to shipping: The Ministry of Transport undertakes the implementation of relevant international legislation, with the enforcement through port state control. Harbour authorities undertake the execution of port waste plans, setting up indirect fee systems and informing the shipping industry. The Shipping industry manages the waste administration on board, notification and delivery, hiring educated crew and adequate equipment on board and the Justice Department covers fines and penalties. With respect to beaches: The Municipalities organise of gathering marine litter and they are responsible for communications concerning the behaviour of beach visitors and the Provinces are responsible for the cleaning beach policy. The Stichting Nederlands Schoon (The Clean Holland Foundation) is involved in marine litter responsibilities. The coast guard and the police department are the organisations that have the legal responsibility for implementing and enforcing marine litter legislation.
4.3.4 Germany In Bremen marine litter is a responsibility of the Senator for Economics and Ports (Senator für Wirtschaft und Häfen) and the Bremen Port Authority (Hansestadt Bremisches Hafenamt Bremen). In Hamburg, the Department for Waste Management / MARPOL is the Office for Urban Development and Environment. In Niedersachsen, marine litter is in the responsibility of the local public waste disposal authority (section 4.2.6.3), the management of the Niedersachsen Ports or, as regards the authorisation of the Management Plans for Ships’ Wastes, in the responsibility o the Trade Supervisory Office Oldenburg. In Schleswig-Holstein, the responsibilities lie with: (1) the Agency for Coastal Defence, National Park and Marine Conservation as regards the disposal of marine litter found along the dykes, (2) the municipalities as regards the disposal of marine litter found at all other places, (3) the Local Port Authorities in so far as ship generated wastes and cargo residues collected in port reception facilities and their final disposal are concerned, (3) the Agency for Nature and Environment concerning waste management plans and (4) the Ministry for Science, Economy and Transport as regards ports in the possession of Schleswig-Holstein. In case the administrative procedure is insufficient, the legal responsibility implementing and enforcing marine litter legislation is under the Senator for Economics and Ports in Bremen, the Department for Waste Management / MARPOL in the Office for Urban Development and Environment in Hamburg, the Ministry for Environment and Climate Protection of Lower Saxony. In Schleswig-Holstein the responsibility lies with the Ministry for Agriculture, Environment and Rural Areas of and the Ministry for Science, Economy and Transport.

63
4.3.5 UK Marine litter is covered by several organisations at different points across the UK. This includes Local Authorities, the devolved Administrations (Scotland, Northern Ireland and Wales), the Marine and Coastguard Agency who deal specifically with litter from ships and DEFRA who are the general policy lead implementing the Marine Strategy Framework Directive.
4.3.6 Belgium
Marine litter is not the sole responsibility of one organisation. In Flanders, OVAM is responsible for waste management and soil remediation in Flanders but locally also other organisations are responsible for certain aspects (communities, harbours, agencies). OVAM has the legal responsibility for implementing and enforcing marine litter legislation.
4.3.7 Ireland In Ireland, marine litter is a responsibility covered by the following organisations: • Department of environment. • Heritage and local government. • Department of transport. • Environmental Protection Agency. • Local authorities. These also have the legal responsibility implementing and enforcing marine litter legislation.
4.3.8 Spain
Several civil services in Spain undertake the management of the marine environment. The Central Government manages the residues from ships (MARPOL Annexes I, IV, V) in state harbours and for activities undertaken at the coast. The residues from ships (MARPOL Annexes I, IV, V) in Regional harbours are managed by the Transport Department of the Regional Government. Also the Regional Government undertakes the management of the industrial, toxic and hazardous residues, but in this case it is undertaken by the Environmental Department. The management of fisheries activities is undertaken by the Fisheries Department. Local Government deals with urban garbage and beach clearing. If the administrative procedure is inefficient, the legal responsibility implementing and enforcing marine litter legislation is under the civil services indicated above, depending what activity the residues come from.
4.3.9 France Collection of waste and shoreline clean up are responsibilities of the local authorities. If they do not organise the operations the local representative of the French State must substitute for them.
4.3.10 Portugal (Azores)
Marine litter in the Azores is mainly the responsibility of the Regional government through the Secretary for the Environment. Police patrols have the responsibility of enforcing marine litter legislation. If they are not widespread and constant national and Regional legal tools are not very effective.

64
5 Programmes and Measures in the North-East Atlantic The OSPAR Pilot Project on Monitoring Marine Beach Litter (2000-2006), and the designation of the North Sea as a Special Area for the purpose of Annex V to MARPOL 73/78, are two examples of practical action taken to deal with marine litter in the OSPAR Maritime Area. Some countries have also taken some initial steps to address the marine litter issue through different programmes and initiatives improving their waste management practices, supporting beach cleanup activities, Fishing for Litter33 projects, national litter campaigns, as well as through the initiation of information, education and public awareness programmes. Despite these examples progress has still been slow on developing and implementing the wide range of programmes and measures that are required to reduce the input of marine litter from its many sources or to introduce mechanisms for the remediation of existing litter. Marine litter therefore remains one of the major unresolved outstanding pollution issues throughout the North-East Atlantic Region. Local municipalities in Iceland are responsible for protection of the coastline and removal of litter from the coastline. Numerous NGOs, local schools, nursery schools, local community organisations, the Icelandic Youth Association, and municipal bodies (The health inspection service and environmental departments), are also involved in activities related to removal of marine litter from the coastline around Iceland. The NGOs involved in marine litter in Iceland are: Blai herinn an Icelandic environmental organisation that works together with local communities to remove marine litter from the coast and in harbours. It has been removing marine litter from coasts and harbours since 1998. World Wide Friends is an Icelandic environmental organisation dedicated to cleaning the coastline of Iceland. A cleaning campaign has been developed from 2006 and it will be carried out until 2011. Numerous volunteers take part in the programme that is supported by the private sector as well as the Ministry for the Environment and Ministry of Fisheries and Agriculture. Seeds are another Icelandic environmental organisation that works on beach cleaning in Iceland. Icelandic Youth Association (UMFÍ) has on several occasions taken part in clean-up arrangements in most parts of the coastline. Furthermore schools and preschools have been active in environmental and coastal protection. Some schools are now running the program: “Adopt a beach” together with the municipal of Reykjavik (Environmental department and the Reykjavik’s nature school). In the Adopt a Beach Programme, several measures are undertaken including marine litter clean ups, measurement and analysis the types and amounts of litter that is found at the beach. In general the collection of beach garbage in Iceland is perceived to be quite efficient with beach litter not considered a problem according to the stakeholders that were interviewed in connection with this questionnaire. However as there is continued replenishment of marine litter from sea-based sources continued cleanup activities are required at the coastline. In the Faeroe Islands (Denmark) Føroya Kommunufelag is in the process of starting a Fishing for Litter pilot project in the port of Tofta havn, currently with one vessel participating. The vessel has landed initial FFL-bags, which are providing data on the amount of litter found at sea around the Faeroe Islands. Furthermore, in 2006 Umhvørvisstovan and Løgmálaráðið launched a TV campaign on bringing litter on vessels at sea back into harbour.34 Most municipalities also have a cleaning day every year, where citizens in the municipalities voluntarily clean up the beaches, streams, along the roads etc. In other municipalities, like Runavíkar Kommuna, adults with special needs assist in cleaning the beaches on a more regular basis. The Netherlands is undertaking several programmes and activities to tackle marine litter. The activities being undertaken by ports are: • Port Reception Plans in accordance with Directive EC/2000/59
33 OSPAR Commission 2007. Background Report on Fishing-for-litter Activities in the OSPAR Region 34 http://www.us.fo/Default.aspx?ID=5790

65
• Annual report on ship generated waste disposal and financial situation (indirect fee system) in the Dutch ports.
• The Ministry of Transport, Public Works and Water Management: • Enforce existing legislation on marine litter and other types of waste through Port State Control
inspections. • Organise annual meeting with stakeholders to discuss current and future practice and policy. • Coordinate national marine litter projects; co-lead for OSPAR marine litter Group and Fishing
for litter project in Den Helder. • Clean ship approach; follow up activities to the 6th North Sea Ministers Conference. • Leading OSPAR Litter Fulmar EcoQO project from 2002 onwards. Other activities undertaken are: • KIMO undertakes Fishing for Litter projects with financial support from the Dutch Ministry of
Transport, local authorities and waste treatment facilities. • The North Sea Foundation undertakes marine litter research and cleaning beaches
(Coastwatch 2003-2006) • Pro Sea organises marine awareness courses for professional seafarers. • ANWB is a member of Foundation for Environmental Education and certifies Blue Flag
beaches In addition to the activities above all the coastal communities clean up their beaches regularly/daily during the “beach season”, approximately from April to October, outside this period it differs per municipality. The beach clean ups are regularly organised through schools and by the North Sea Foundation, which monitors the marine litter collected. For instance, Scheveningen and the Westland area keep the focus on the awareness of visitors to the beaches. Their main aim is reducing the amount of marine litter through a communications campaign. In Sweden some municipalities have local beach litter cleaning programmes but there is no nationally organised programme. Collection tends to be sporadic and varies between municipalities with clean ups often restricted to coastal areas that are attractive for swimming. The biggest national coastal clean up and surveys undertaken within both the UK and Europe are the MCS Beachwatch and Adopt-a-Beach schemes. Beachwatch is a practical environmental initiative organised by the Marine Conservation Society (MCS), to raise awareness of the issue of marine litter, monitor litter on Britain's beaches and to encourage action to reduce marine pollution at source. Beachwatch was launched in 1993 and takes place on the third weekend of September every year, to coincide with the International Coastal Cleanup, coordinated by the Ocean Conservancy in the USA. MCS also coordinates the Adopt-a-Beach scheme, which involves local individuals, groups and communities in caring for their coastal environment. In this case, the monitoring is extended to 4 times a year to try and capture seasonal changes in litter quantities and types. The UK has two Fishing For Litter schemes coordinated by KIMO UK. Fishing for Litter Scotland covers 15 harbours and includes 110 vessels and Fishing for Litter South West (FFLSW), which is currently being established in cooperation with the Cornwall Fisheries Resource Centre. DEFRA is part funding FFLSW, as part of a commitment to the British and Irish Council on investigating how FFL can be implemented across the whole of the UK. The Marine Institute and BIM, from Ireland, together with Seafish and CEFAS from the UK have recently began an EU funded project focussing on assessing the extent and effect of lost, discarded and abandoned gillnets on the shelf edge and deepwater fisheries off the coast of Ireland and the UK. This programme (DEEPCLEAN)35 has the following three key objectives: • Retrieving lost deepwater gillnets; • Assessing the scale of ghost netting in the fisheries; and • Evaluating the biological consequences.
35 http://www.bim.ie/templates/text_content.asp?node_id=1034

66
At the community level In the UK Local authorities are required by law to keep their relevant land clear of litter and refuse. This land includes beaches above the high water mark. Local authorities are advised to monitor and clean beaches below the high water mark areas as appropriate. This is set out in the Code of Practice on Litter and Refuse. The Code recommends that Amenity Beaches should be generally clear of litter and refuse between 1 May and 30 September inclusive. During this time the expectation is that beaches are subject to frequent monitoring and cleansed to as practicable standard as possible. Individual local authorities should decide the level of cleanliness that they are able to provide to any non-amenity beaches (including inland beaches) and where practicable, beaches must be inspected from time to time and cleansed as necessary. It is recognised that beaches can present unique challenges and it is not anticipated that beaches will always be cleansed to the maximum standard possible for cleansing activities because of considerations such as terrain, conditions, accessibility and the need to be sensitive to habitats, however the duty body should do as much as is practicable. It is recommended that local authorities and beach managers are aware of the different types and nature of beaches within their area, and carry out regular monitoring and suitable cleansing. This might be relevant for a beach that is used outside the bathing season for example and should be given attention that it might not otherwise receive. DEFRA currently supports ENCAMS, which runs the Quality Coast Awards and Blue Flag. The Quality Coast Awards were launched in April 2007 and recognise different types of beaches that achieve the very highest standards. ENCAMS administers the Blue Flag programme in England on behalf of FEE. The international campaign aims to improve the environmental management and public awareness of coastal areas. The international Blue Flag award is given only to clean, well-managed resort beaches that must meet the higher, recommended European water guideline quality. The Coordination centre for Integrated Coastal Zone Management in Belgium has been coordinating a spring coastal cleanup, Lenteprikkel, from 2001 to 2008 with the support of several organisations, authorities, administrations, etc. However, as this initiative has been discontinued due to a lack of success although individual communities can still use the format. Additional “cleanup activities” are organised by individuals, schools, clubs, companies etc, mainly to make a statement on the issue of a healthy and clean natural environment, and to demonstrate their benevolence and concern. However, in most or even all the cases there is a lack of data on the amount of marine litter collected. It seems that most of the time, beach cleaning events are seen as an easy and effective way to get publicity in the local newspaper. Two projects related to marine litter are being undertaken in Spain. The first project is investigating a system for the management of the residues from shellfish aquaculture activities and is being undertaken by the Fisheries and Maritime Ministry, coordinated by CETMAR and co-financed by the LIFE Environment EU Programme. The second is investigating the management of garbage from fishing, shipping and aquaculture activities. The Sea Technologic Centre (CETMAR), with the co-operation of the Galician Environment Society (SOGAMA), Galician harbours and Spanish national harbours, has developed this.36 At the community level in Spain the local community cleans most of the beaches mechanically. The frequency of clearing depends on the importance of the tourism. Consequently most tourist beaches are cleaned everyday during the summer time and other periods and the rest normally once a week. Virgin beaches are cleaned every period of the year but not mechanically. Outside tourist areas there is no coordinated campaign for beach clearing along the Iberian coast and the Bay of Biscay but local authorities, environmental groups and cultural and diving associations, undertake numerous local activities. In France local authorities and NGO’s conduct local initiatives and marine litter studies but there is no national coordination or gathering data. Collection of beach garbage and marine litter management activities in the Azores (Portugal) is managed in a similar way being undertaken by the local government and NGO’s and carried out sporadically.
36 http://www.observatoriomar.org/

67
5.1 Port reception facilities (PRFs) IMO has recognized that provision of reception facilities is crucial for effective MARPOL implementation, and the Marine Environment Protection Committee (MEPC) has strongly encouraged Member States, particularly those Parties to the MARPOL Convention as port States, to fulfil their treaty obligations on providing adequate reception facilities.
The “no-special-fee” system is one of the prerequisites for a substantial decrease in the number of operational and illegal discharges and thus for the prevention of pollution from ships to the marine environment.
Port Authorities are responsible for providing reception facilities for wastes covered by Annex I (oily wastes from machinery spaces of ships), Annex IV (sewage) and Annex V (garbage) of the International Convention for the Prevention of Pollution from Ships, 1973, as modified by the Protocol of 1978 relating thereto (MARPOL 73/78)37
OSPAR Contracting Parties that are members of the EU must also adhere to the EU Directive on port reception facilities for ship-generated waste and cargo residues (EC2000/59). The aim of this directive is to reduce the illicit discharge of waste and other pollutants to a minimum, in order to protect the marine environment. Key points of the directive are: • All ships must provide notification before entering into the port or terminal of the waste they
will discharge, including information on types and quantities, • All ships must deliver their waste to the port reception facilities before leaving the port or
terminal, unless they have sufficient dedicated storage capacity to store the waste until the next port of call.
• All ships must pay a mandatory charge to make a significant contribution to the cost of the port reception facilities for ship generated waste, whether they use them or not.
Ports are required to cover the costs of the post waste reception facilities including costs of treatment and disposal. How the port recovers its costs was left open so this varies from port to port with some charging on a ship-by-ship basis, others incorporating charges in harbour/port dues. However the charge is calculated, the port must make clear the amount of the charge, and the way in which it has been calculated. All ports in Iceland have PRFs for small boats and all larger vessels use the service of private waste management companies. In case of the Faeroe Islands (Denmark) all ports with a certain frequency of vessels have port reception facilities for litter, waste, etc. They are also party to the Annex V of the MARPOL 73/78 Convention. With reference to the PRFs only one port, Tofta Havn, it is known for having reception of marine litter without a special fee. Here the fee for use of port reception facilities is integrated into the harbour fee, whether you use the reception facilities or not. In other harbours there are facilities, as demanded by law, but it is paid per cubic meter of litter delivered to the facility. In the Netherlands the PRFs are listed in the GSIS database on the IMO website the EU Directive on PRFs has been fully implemented since October 2004. In Germany, the Federal States involved have taken different approaches: In Bremen, the cost of garbage disposal is included in the port dues and is dependent on the size of the ship: ≤ 500, > 500 and ≤ 1500, > 1500 and ≤ 2500, > 2500 and ≤ 3500, > 3500 and ≤ 6000, > 6000 registered tonnes at tariffs between €10,40 and €109,20 . Also Hamburg is charging depending on the size of the ship where the following steps apply: ≤ 1500, > 1500 and ≤ 3500, > 3500 and ≤ 6000, > 6000 and ≤ 10000, > 10000 and ≤ 30000, > 30000 registered tonnes at tariffs between €10 and €105.
Lower Saxony has introduced a mandatory disposal of ships waste the costs of which are covered by a no special fee system. This means that waste disposal fees are included in the port dues
37 http://www.imo.org/Conventions/contents.asp?doc_id=678&topic_id=258

68
collected by the port operator. For the port system of "Lower Saxony ports", the following rules apply:
• Each seagoing vessel has to pay a fixed disposal fee with the port dues. • The owner or his agent gives a declaration of the vessel and the type and quantity of ship-
generated waste at least 24 hours before the vessel entering. • The owner or his agent appoints a suitable disposal company with the disposal. • The disposal company charges the service to the ship owner's account. • The owner or its agent presents the bill in its original form and a declaration on the type and
quantity of the waste to the responsible branch office of the Lower Saxony ports. • The port operator reimburses up to 70 per cent of the cost within the limits of the usual
disposal quantities and conditions determined in the valid port tariff. • Exceptions to the approach described above can be approved for ships that run a regular
service and for ships that have a permanent moorage on more than 60 days a year in a German North Sea port. Applications need to be submitted to the Lower Saxony Ministry of Economy, Labour and Transport.
In Schleswig-Holstein programs and plans basically refer to the implementation of the legislation listed in Section 4.2.6.4 above. In general, waste management plans are established in order to guarantee the environmentally friendly management and disposal of waste. In terms of waste management in ports, harbour managers are obliged to produce and publish waste management plans in cooperation with all relevant parties, thereby ensuring the use of port reception facilities for all ship generated waste and cargo residues. The mandatory use of these reception facilities is enforced by the application of the no special fee system. The amount of this fee is calculated from the size and type of each ship regardless of the actual use of port reception facilities. Exemptions from this fee can only be granted by the competent authority for ships that run under regular service (liner trades) and call at the same port at least twice a month or that have a permanent moorage on more than 60 days a year. In Belgium a disposal system has been implemented, which provides an incentive to dispose waste in ports. However, it appears that not all ships contribute to the costs of PRFs, since the ships can reclaim the cost in case of disposal in a Community port. (Carl Bro study 2005) In Belgium, every port has more or less its own disposal system, although this is going to be investigated in depth. In Ireland, every port, including the major recreational centres, is required to have a port waste management plan in place. Ship-source pollution prevention seeks a status report every year in order to ascertain any new developments. In accordance with EU Port Waste Directive 2000/59/EC, fees are only of sufficient charge in order to encourage use of reception facilities. In Spain there is enough infrastructure and facilities for the reception and management of the residues in the harbours managed by the Central Administration (6 major ports in the Bay of Biscay and 7 in the Atlantic) although not all of the 185 harbours managed by the autonomous Regions (52 in the Bay of Biscay and 185 in the Atlantic) have necessary facilities. In general the most important ports for shipping and fishing own all the facilities for managing waste but only containers for the disposal of oil are available in the smallest ones. However all the autonomous Regions are currently developing plans for the reception and management of the residues from ships following MARPOL Annex I (oil residues), Annex IV (sewage from ships) and Annex V (Garbage from ships). The following tables (table 5.1 and 5.2) indicates data of the ports activities for the different OSPAR Contracting Parties:

69
Table 5.1 Port Reception Facilities Information for OSPAR Contracting Parties ports
Country Most common types of ships calling at the ports
Garbage waste delivered to ports (amount)
Garbage, % of the total amount of waste at ports
‘No Special Fee’ system38: effect on the amounts of waste delivered to the ports YES/NO
Cost of use of the port reception facilities (No-fee basis)
Belgium
Container vessels, bulk carriers
No data provided
No data provided
No data provided No data provided
Denmark
No data provided No data provided
No data provided
No data provided No data provided
France
No data provided No data provided
No data provided
No data provided No data provided
Iceland Fishing vessels Cargo ships Tankers
No data provided
No data provided
No Fee basis
Ireland
No data provided In 2006, 1116 tonnes and 182 m3 and in 2007, 1250 tonnes and 393 m3
48% in 2006 and 45% in 2007
No data provided No data provided
Netherlands
Containerships & bulkcarriers
40.000 m3 (in 2006)
33,5 % Yes, with 30% indirect fee
Different in each port
Norway
No data provided No data provided
No data provided
No data provided No data provided
Portugal
Commercial/ merchant/ fishing
No data provided
No data provided
No No data provided
Spain
Roll-on roll-off vessels
334,000m3 (MARPOL V 2006)
No data provided
Yes No data provided
Sweden
98000 ship landings (2006) Small/medium sized cargo ships Oil shipping and passenger ships (not ranked)
23000 m3 30-50% including sludge and cargo waste (not including toilet waste)
Yes we have a No special fee system, probably an increase of amounts landed due to the fee system and the fact that Sweden accepts all garbage carried onboard (not only since last port)
No data provided
UK
No data provided No data provided
No data provided
No data provided No data provided
38 The "no-special-fee" system is defined as a charging system where the cost of reception, handling and disposal of ship-generated wastes, originating from the normal operation of the ship, as well as of marine litter caught in fishing nets, is included in the harbour fee or otherwise charged to the ship irrespective of whether wastes are delivered or not.
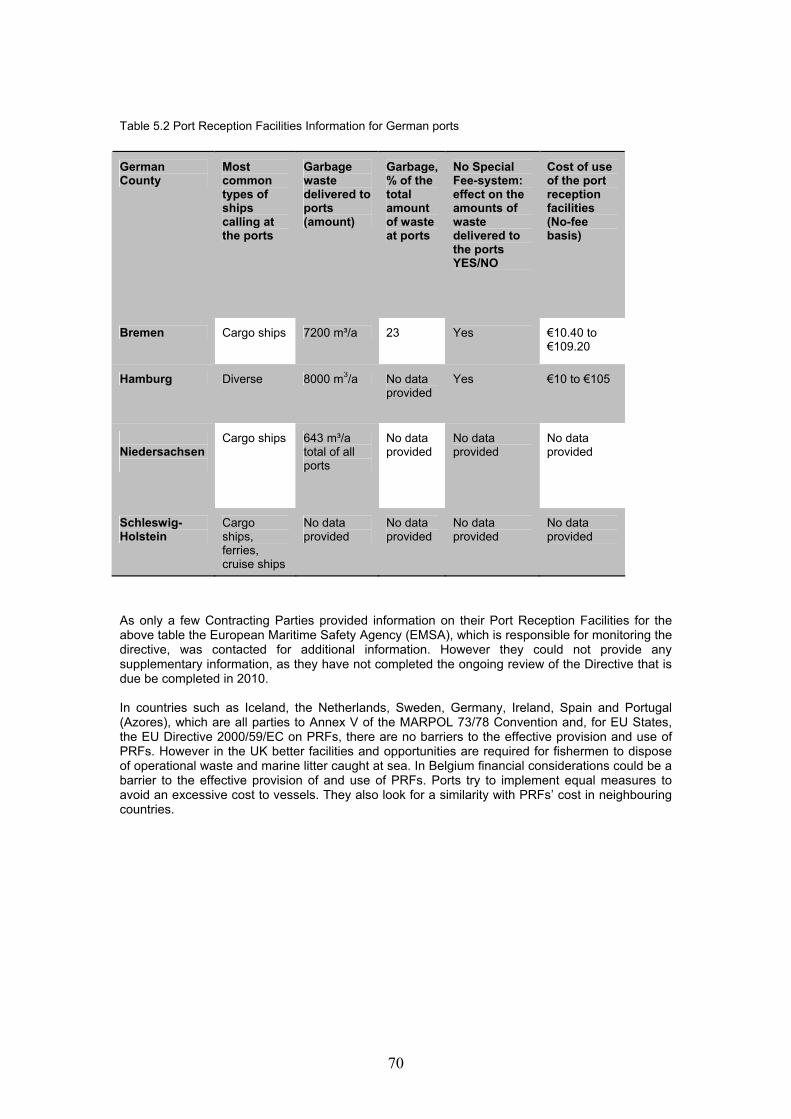
70
Table 5.2 Port Reception Facilities Information for German ports
As only a few Contracting Parties provided information on their Port Reception Facilities for the above table the European Maritime Safety Agency (EMSA), which is responsible for monitoring the directive, was contacted for additional information. However they could not provide any supplementary information, as they have not completed the ongoing review of the Directive that is due be completed in 2010. In countries such as Iceland, the Netherlands, Sweden, Germany, Ireland, Spain and Portugal (Azores), which are all parties to Annex V of the MARPOL 73/78 Convention and, for EU States, the EU Directive 2000/59/EC on PRFs, there are no barriers to the effective provision and use of PRFs. However in the UK better facilities and opportunities are required for fishermen to dispose of operational waste and marine litter caught at sea. In Belgium financial considerations could be a barrier to the effective provision of and use of PRFs. Ports try to implement equal measures to avoid an excessive cost to vessels. They also look for a similarity with PRFs’ cost in neighbouring countries.
German County
Most common types of ships calling at the ports
Garbage waste delivered to ports (amount)
Garbage, % of the total amount of waste at ports
No Special Fee-system: effect on the amounts of waste delivered to the ports YES/NO
Cost of use of the port reception facilities (No-fee basis)
Bremen Cargo ships 7200 m³/a 23 Yes €10.40 to €109.20
Hamburg Diverse 8000 m3/a No data provided
Yes €10 to €105
Niedersachsen
Cargo ships 643 m³/a total of all ports
No data provided
No data provided
No data provided
Schleswig-Holstein
Cargo ships, ferries, cruise ships
No data provided
No data provided
No data provided
No data provided

71
6 Existing Monitoring Programmes related to Marine Litter in the North-East Atlantic Comprehensive surveys of marine litter on specific beaches have been made in many areas, often over a number of years, by various organisations and groups in the North-East Atlantic Maritime Area. Valuable information about the quantity and composition of marine litter found on beaches has therefore been available for decades. The challenges in dealing with this problem have not been due to lack of awareness of the issues surrounding marine litter or lack of data from various Regions. Instead, the problem has been the lack of standardisation and compatibility between methods used and results obtained in these projects, and that has made it difficult to compare data from different Regions and to make an overall assessment of the marine litter pollution situation for the entire OSPAR Maritime Area. Despite the difficulties in comparison, there are many longstanding monitoring programmes such as Beachwatch and Adopt-a-Beach organised by the Marine Conservation Society in the UK. Also programmes such as Coastwatch that undertakes a beach marine litter monitoring data or Jellyfish campaign that also manages the clearing of marine litter on the sea surface along the Spanish coast. All these programmes can help to provide an insight into the marine litter situation in the OSPAR Maritime Area. The six-year OSPAR Pilot Project on Monitoring Marine Beach Litter (2000–2006) was the first Region-wide attempt in Europe to develop a standard method for monitoring marine litter on beaches and, using this standardised method, to assess presence of marine litter on the beaches in the OSPAR Region. Nine countries; Belgium, Denmark, France, Germany, The Netherlands, Portugal, Spain, Sweden and the United Kingdom participated in the pilot project, which was coordinated by an International Steering Group with representatives of the countries and OSPAR observer organisations. A method for conducting surveys of marine litter on beaches, following a common, standardised survey protocol for either a 100-metre or a 1-km stretch of beach was developed, tested and used in fieldwork. The protocol for 100-metre surveys included well over 100 different items of all sizes, whereas the protocol for 1-km surveys included about 20 mainly large items (>50 cm in any direction). A total of 614 regular beach surveys were conducted on a total of 51 reference beaches in eight countries during the pilot project period, 2001–2006. In addition, 10 surveys were made during 2006 on 4 beaches in France (not classified as regular reference beaches). The monitoring method developed during the pilot project proved functional for the purpose of providing data on marine litter on beaches. It provides a feasible approach and could be used as a cost effective means to monitor marine litter on beaches – quantities, composition and trends – in the OSPAR Maritime Area. However a monitoring programme for marine litter is yet to be made mandatory within OSPAR and is currently proceeding on a voluntary basis only. There are also many monitoring schemes operating nationally within individual Contracting Parties. However as this information was provided in tabular form it has been included in Annex 2 along with web links to the projects where available.

72
7 Scientific Studies and Research in Marine Litter Various scientific analysis and researches have been undertaken in different areas, studying several items such as small plastic fragments found in seabirds’ stomachs (e.g. fulmar) or the ingestion and accumulation of microscopic plastic by marine organisms. Studies into the impact on microscopic plastic particles on the marine environment are at the forefront of recent research into marine litter. Global plastic production is now estimated at 225 million tons per year (Plastic-Europe 2006). Plastic debris is accumulating in terrestrial and aquatic habitats worldwide and it is progressively fragmenting into small pieces and as it does so the potential for ingestion by animals increases. The biological consequences of macroscopic plastic (≥ 5mm) debris on wildlife have been better documented than those of microscopic plastics and include suffocation, entanglement and starvation. By contrast, the impacts of microscopic (<1mm) plastic debris are still poorly understood. Plastics are mistaken as food by numerous animals, including birds, fish, turtles, marine mammals, and marine vertebrates. Given the high capacity of the plastics to absorb phenanthrene, plastics may be an important vehicle for transporting contaminants to organisms. Several studies have been undertaken recently in the UK investigating the abundance, properties and impact of microscopic plastic particles. In Ingested Microscopic Plastic Translocates to the Circulatory System in the Mussel, Mytilus edulis (L.) Browne, M., et al., 2008. Environmental Science and Technology. The mussel M.edulis was used to investigate ingestion, translocation and accumulation of this microscopic plastic. The results indicated that abundance of microscopic plastic was greatest after 12 days after the ingestion of microscopic plastics and declined thereafter. Smaller particles were more abundant than larger particles and the data indicates as plastic fragments into smaller particles the potential for accumulation in the tissues of an organism increases. In view of the findings, the potential for plastics, to transport contaminants to a variety of organisms now warrants further investigation. In particular, there is a need to consider a range of contaminants, plastic types and the effects of environmental exposure on the sorption characteristics. Additional studies into microscopic plastic particles are outlined below. • Thompson, R., et al. 2004. Lost at Sea: Where Is All the Plastic? SCIENCE. Volume 304,
Number 5672, pp 838 • Browne, M., et al. 2007. Microplastic-An Emerging Contaminant of Potential Concern?
University of Plymouth, UK. Integrated Environmental Assessment and Management. Volume 3, Number 4, pp 559-566
• Thompson, R., et al. 2005. New Directions in Plastic Debris. SCIENCE. Letters. Volume 310 • Teuten, E., et al. 2007. Potential for Plastics to Transport Hydrophobic Contaminants.
Environmental Science and Technology • Norén, F., 2007. Small Plastic Particles in Coastal Swedish Waters. KIMO International Another example of unique research is the monitoring programme using litter abundance in stomachs of a seabird, the Northern Fulmar, which is being developed by OSPAR as an Ecological Quality Objective (EcoQO). As Fulmars are purely oceanic foragers, they regularly ingest litter, and accumulate wear-resistant items like plastic in their stomach. Stomach contents thus provide an integrated picture of litter abundance at the sea surface. The current situation fits in with the pattern of reduced plastic loads in Fulmar stomachs after peak levels in the 1990s, with the overall mass of plastic returning to levels similar to those in the early 1980s. Mean values over the most recent 5 years are that 95% of birds had plastic in the stomach, with an average number of 31 pieces and average mass of 0.3 grams plastic. Thus, the year 2006

73
was very 'average' for the situation over the past 5 years, which implies that there is no clear evidence of improvement within this period.39 There are few studies into the socio-economic impacts of marine litter however a study for KIMO International in 2000 under the name “Economic and Social Impacts of Marine Debris and Oil in the Coastal Communities” by Karen Hall40 illustrated the wide-ranging impacts. In addition to the studies highlighted above Contracting Parties also highlighted additional research papers on marine litter for which references have been included in Annex 3.
39 Franeker, J.A., & the SNS Fulmar Study Group 2006. Fulmar Litter EcoQO Monitoring in the North Sea. Institute for Marine Resources and Ecosystem Studies. IMARES. Report number CO33/08 40 Hall, K. 2000. Impacts of Marine Debris and Oil. Economic & Social Costs to Coastal Communities. Kommunenes Internasjonale Miljoorganisasjon (KIMO)

74
8 Summary of the Marine Litter Situation in the OSPAR Maritime Area Regions
8.1 Arctic Waters There is very limited information in relation to marine litter in the Arctic Waters with little quantitative information being provided on amounts or sources of marine litter. One source of information is the background studies on to the EcoQO on plastic in Fulmars’ stomachs as it indicates the amount of litter at sea. In the Faeroes the average weigh of plastic in a Fulmars’ stomachs, in the period 2002-2006 is 0.09g compared to, for example, 0.30g for the Netherlands indicating that there is approximately 30% less litter in Arctic Waters compared to the southern North Sea. Qualitative data on types of marine litter has shown that these are similar to those in other OSPAR Regions with plastics the most abundant type of litter found both at the coastline and at sea in particular nets, buoys and plastic bags. Other types of litter include pieces of metal and rubber. However due to the lack of information it is not possible to determine any trends in marine litter for this Region. Data on the environmental and socioe-conomic impacts of marine litter is also limited although results for the Fulmar EcoQO Study show that the impact on marine organisms in the Arctic Waters is probably amongst the lowest for the OSPAR Regions. However with 43% of Fulmars with more than 0.1g of plastic in their stomach compared to the EcoQO level of 10% the impact on marine organisms is still unacceptably high.
8.2 Greater North Sea The majority of the information submitted for this report relates to the Greater North Sea area. In relation to amounts of litter at the coastline the data shows a consistent picture. Despite year on year variability the level of marine litter is consistent and high. The results for the OSPAR beach litter-monitoring programme showed that from 2001-2006 there was no statistically significant increase or decrease of the amount of marine litter in the Greater North Sea but it remained was the highest level for any OSPAR Region. MCS Beachwatch Data from the UK actually shows an increase of 96.5% in the amount of litter collected from 1994 to 2007 with an average of 2,054 items/km in 2007. The spatial distribution of marine litter is significantly different throughout the area however. The Fulmar study has shown that levels of marine litter at sea in the northern North Sea near the Shetland Islands are approximately 50% lower than that in the southern North Sea. Studies by Galgani et al41 have also shown that the distribution on the sea floor varies significantly, ranging from 0 to 101000 pieces of litter per km2, due to topological and tidal differences. The highest density was found in an area around 200km off the Danish coastline. In relation to amounts of litter on the seabed over time the data from the Fishing for Litter project in Den Helder shows that despite month-by-month variations the overall level is relatively constant. Litter brought ashore by the 15 vessels involved, over the period 2000 to 2007, has shown little change with an average of approximately 80,000kg per year. Results from the Fulmar Litter EcoQO Monitoring Programme in the North Sea between 2002-2006 indicate a significant decrease in marine litter over the past 10 years, but most change occurred in the late 1990s. Recent data indicate at best weak and mostly insignificant further reductions from the south-eastern North Sea, and provide no evidence for a direct strong effect of implementation of the EU Directive on Port Reception Facilities or MARPOL Regulations.
41 Litter on the Sea Floor along European Coasts. F.Galgani, J.P. Leaute, P.Moguedet, A. Souplet, Y. Verin, A. Carpentier, H. Goraguer, D. Latrouite, B. Andral, Y. Cadiou, J.C. Mahe, J.C. Poulard and P. Nerisson.
Marine Pollution Bulletin, 2000

75
Between locations and Regions in the North Sea, significant differences in pollution levels are observed, with levels in the Channel area about three times higher than those around the Scottish Islands and intermediate levels in between. Averaged for the whole North Sea, 94% of investigated birds contained plastic; on average 34 pieces and 0.30 gram mass and 55% of all birds exceeded the critical EcoQO level of 0.1 gram of plastic in the stomach, which is much greater than the target of 10%. In all monitoring both at the coastline and at sea the predominant type of marine litter was plastic although the values at sea and on the coastline differed. In the monitoring of seabed marine litter in the various Fishing for Litter projects the percentage of plastic was 38-55% compared to marine litter monitored on beaches which was 58-95% plastic. This is as expected as many types of plastic float and therefore are concentrated on the sea surface and at the coastline. Identifying sources of marine litter is difficult as many types of items can come from multiple sources. This is demonstrated in the MCS Beachwatch survey where the largest source is non-sourced items at 42% of the total with recreation beach users at 35% and fishing at 14%. The analysis of the OSPAR monitoring data for the whole of the OSPAR Region showed no trends in land-based sources such as tourism or sanitary waste. There was also no trend for the sea-based sources such as galley waste and shipping although fishing-related marine litter did show an increase from 2001 to 2006. The only quantitative data on the environmental impact of marine litter is from the background study into the Fulmar EcoQO, which shows that the impact is much higher than the target level. Other anecdotal evidence shows that a wide range of organisms are affected including birds, seals, turtles, porpoises and whales. In addition to the direct impacts invasive species have also been carried into the Region by marine litter as in the case of the exotic barnacle species Elminius modestus, which has been found on plastic on the shoreline of the Shetland Islands. The cost of cleaning marine litter from beaches can be significant with the cost usually falling to local authorities rather than national governments. For example, in 2004 UK local authorities, industry and coastal communities spent approximately £14 million (about €18 million) cleaning up marine litter. In tourist areas these figure are even higher with Den Haag Municipality in the Netherlands, which receives 15 million visitors a year, spending €626,709 (about £496,127) per year on coastal cleaning. However, the costs are far more significant if the financial impacts other than just cleaning are considered. KIMO estimated, in 2000, that in a worst case scenario the cost to the Shetland community (population 22,000) could be as much as £5.6 million (about €7.1 million) per year. This figure included the cost of beach cleaning (local authority and voluntary), and falling on aquaculture, power generation, farming, fishing, harbours and lifeboat launches. One of the emerging threats from marine litter in the Greater North Sea is the identification of microscopic plastic particles, in the μm to mm size range, in the marine environment at concentrations of 150-2400 particles per m3. These have been shown to be widespread and based on plankton records have been increasing in line with the production of synthetic fibres. The impact of this type of pollution on marine organisms is not yet known although several organisms have been shown to ingest the particles, which could potentially cause damage physically or by transport of hazardous substances.
8.3 Celtic Seas Contracting Parties for the Celtic Seas only provided limited information on marine litter so it was difficult to make a complete assessment. However data from the OSPAR beach monitoring and the MCS Beachwatch survey does allow an assessment of litter at the coastline. Both the OSPAR figures and the information from MCS Beachwatch indicate that amounts of marine litter have remained relatively constant over the period of 1996-2007 with no discernable trends. Although there is significant differences within the Region with levels in the South West of England (a popular tourist area) on average 3,230 items of litter/km, the highest in the UK and over a 1000 items higher than the average, compared with on average 1,057 items of litter/km in Northern Ireland, which is the lowest. The predominant type of marine litter was again plastic making up 55% of litter found at sea and 70% of that found at the coast. The next most prevalent types found at sea and at the coast

76
respectively were metal and sanitary items both making up 13% of the total number of items. Although there is limited data about sources of marine litter what information there is suggests they are similar to the Greater North Sea. Evidence from the Celtic Seas highlights the extent of plastic in the marine environment. Over 90% of the 30,000 gannet nests on Grassholm Island (in the Bristol Channel) contain plastic, which can cause young birds to become entangled. It is not only small animals that are affected with several reports of whales becoming entangled in rope and turtle deaths caused by ingestion of plastic. The cost of managing marine litter on beaches within the Celtic seas area ranged from £15/km (€19/km) to £50,000/km (€63,241/km). Local authorities, and ultimately local taxpayers, bear most of this financial burden of clearing litter on beaches.
8.4 Bay of Biscay and Iberian Coast The results from the OSPAR Pilot Monitoring programme show that levels of marine litter at the Iberian coast have remained at the same level over the period 2001-2006 with no discernible trend. However levels are significantly lower than for other Regions in the monitoring programme with only a quarter of the number of items per 100m compared to the Northern North Sea for example. Several studies have been conducted on seabed litter in the Bay of Biscay with results suggesting that levels of litter are higher in the winter. In a Fishing for Litter initiative in Aquitaine in 2002-03 70 vessels collected 45.2 tonnes of litter from the Bay of Biscay. The predominant type of marine litter is again plastic accounting for 62% of the total number of items at the coastline but unlike the levels of sanitary and paper items were higher at 16% and 13% respectively. There is little information on the sources of marine litter in the Region. However the average number of indicator items found on French beaches in 2006, compared to the number of indicator items found on the regular reference beaches in the OSPAR Pilot Project, was significantly higher for two sources: fishing and shipping. However as the monitoring was only undertaken for one year it is not possible to discern whether this is an anomaly or a significant and ongoing difference. Few studies have been undertaken into the environmental impact of marine litter in this Region however a study undertaken, between 1979 and 1999, in France, showed that 55% of the Luth Turtles (Dermochelys coriacea) had marine litter in their stomachs. An enquiry by CEDRE in 2002 showed that the cost of beach cleaning, in France, was between €4,500 (about £3,562) and €50,000 (about £39,581) per year per council corresponding to an average cost of €6,500 (about £5,145) per km of cleaned beach per year.
8.5 Wider Atlantic It is very difficult to undertake any assessment of litter for this Region as Contracting Parties provided no information and there are very few studies available for this Region. Some anecdotal evidence was included for the Azores, which indicates that the situation in the Wider Atlantic is similar to those in other Regions with levels of marine litter high and mainly consisting of plastic.

77
9 Gaps, Needs, Priorities and Recommendations There is one clear picture that emerges from the data which has been collected in this assessment of marine litter in the OSPAR Maritime Area and that is that the amount of marine litter remains high and is not reducing. This is despite areas such as the North Sea being Special Areas under MARPOL Annex V and the introduction of EU legislation such as the Directive on port reception facilities for ship-generated waste and cargo residues (EC2000/59). The impact on biodiversity is clear and with studies showing that 96% of North Sea Fulmars have at least one piece of plastic in their stomachs illustrating the prevalence of marine litter in the marine environment. In addition the cost of marine litter to marine users and coastal communities continues to rise for example Den Haag Municipality spending €626,709 (about £493,804) on beach cleaning in a single year. However despite the overall picture being clear there are still gaps in the knowledge on marine litter.
9.1 Gaps and Needs Most of the information comes from beach monitoring of litter and although OSPAR has developed a harmonised monitoring programme for marine litter it is voluntary and not being implemented by all Contracting Parties (CPs). Outside the OSPAR monitoring programme almost all the monitoring is undertaken by Local Authorities or NGO’s with very little harmonisation between countries. The available data is also not collected centrally within CPs making it very difficult to for them to gain an objective view of the marine litter situation or its impacts. For the propose of this review much of the monitoring information provided was not spatially complete or repeated over a sufficient timescale to allow a complete analysis of the situation. In relation to litter at sea and on the seabed there are relatively few studies making analysis of the problem in the Wider Atlantic extremely difficult. In assessing the impacts of marine litter on biodiversity the development of an Ecological Quality Objective on plastic particles in Fulmars’ stomachs is a welcome step but this is currently only implemented within the North Sea Region and would need to be rolled out across the whole OSPAR Maritime Area to give a full picture. The impact of microscopic plastic particles in the marine environment is another area that requires further research. Work by Dr Richard Thomson and his research team have shown that these particles are removed from the water column by detritivores such as barnacles and lug worms yet their impact on these animals and the rest of the food chain has still to be assessed. At a national level one of the main gaps is the lack of a coordinated approach to marine litter. In almost all of the countries in the OSPAR Maritime Area marine litter is not the sole responsibility of a single agency but is divided between a range of national and local government agencies and voluntary organisations making even just collecting the most basic information a difficult and time consuming task. As a result many CPs found it difficult to contribute fully to this assessment with no information at all being received from Portugal and Denmark. Awareness of the issues is another area where there are significant gaps both in terms of the general public and specific source industries. For example two of the main sources of marine litter are the shipping and fishing industries but there are no compulsory courses on marine environmental awareness in either of these sectors, although the Dutch Government has been working with the ProSea Foundation to incorporate amendments into the STCW Convention at the IMO. If crewmembers are more aware of the impacts of marine litter they are more likely to adhere to existing regulations. However it is not just awareness of the impacts but of the legislation and regulations themselves that is lacking. For example an investigation by the Netherlands showed that many agents and skippers were not aware of the fee system in Dutch ports highlighting the lack of efficient communication between users of the sea and regulators. Outside public awareness campaigns by NGOs and initiatives such as the ProSea marine awareness courses and Fishing for Litter there is still a lack of practical programmes and measures at a national level to tackle marine litter. To date most programmes have involved monitoring of litter or legislation rather than practical action. In order to tackle the problem of marine litter a much broader suite of economic and practical incentives is needed.
78
The diffuse nature of marine litter pollution also makes prosecution of those who break existing laws extremely difficult. There is rarely any evidence as to the source of the litter and this lack of proof means that almost no convictions are ever brought severely reducing the effectiveness of legislation. There needs to be more effective communication between prosecutors in CPs and more effective implementation of the EU Port Waste Reception Directive, which is currently under review. Despite recent initiatives at EU Level such as the Marine Strategy Framework Directive, which includes marine litter, there is a lack of political commitment and resources from CPs. For example the Intersessional Correspondence Group on Marine Litter (ICG Marine Litter), which coordinates marine litter issues and monitoring within OSPAR, does not have representation from all CPs. Marine litter monitoring itself is only a voluntary programme hence it is not funded by many CPs unlike chemical or heavy metal monitoring which are compulsory and resourced appropriately.
9.2 Priorities and Recommendations In deciding upon priorities and recommendations it is important to note that with a diffuse and widespread problem like marine litter that action at all levels is required to have any impact on the problem. The first priority is to consider the continuation and expansion of the monitoring programme for marine beach litter by making it mandatory within the OSPAR Maritime Area. This would ensure that it would be possible to assess the marine litter situation uniformly in all CPs allowing the impact of any programmes and measures to be assessed. However, as this only addresses litter that washes ashore a different approach would be needed to assess litter at sea. ICG Marine Litter is currently working towards developing a monitoring protocol to be used by fisheries research vessels to monitor litter on the seabed during scientific trawls. If this were implemented in all CPs it would allow assessment of litter at sea especially in areas such as the Wider Atlantic that are not currently covered. In relation to the collection of information on marine litter a more coordinated approach at the national level would also be useful. Each CPs should be encouraged to establish a lead agency that is responsible for marine litter with a duty to collect data centrally, assess impacts and assist in the development of programmes and measures in cooperation with Local Authorities and NGO’s. Currently the responsibility tends to be spread over too many agencies resulting in a lack of cohesion in approaching marine litter problems. A more co-ordinated approach would assist in gaining political support for marine litter initiatives, as it would be easier to show the problems in a national perspective. A new threat from marine litter is that of microscopic plastic particles in the marine environment. Studies by Thomson et al and KIMO Sweden have shown that these particles, in the μm to mm size range, are numerous and widespread with concentrations up to 150-2400 per m3 in the water column. A monitoring programme is needed to assess the situation across the OSPAR Maritime Area along with further research into the impact of these particles on marine organisms. Initial studies have shown that small detritivores and bivalves will remove these particles from the water column but their impact on organisms through both physical damage and concentration and transport of hazardous substances is unknown. Education on the impacts of marine litter, both ecological and financial, is another priority area. Despite many public awareness campaigns there is insufficient targeted awareness and training in marine environmental awareness for professional mariners. The ProSea Education Foundation has been leading the way in this field with the development of courses for the merchant navy and fishermen. There is an argument for these types of courses to be mandatory as part of the IMO STCW Convention and form a part of any mariner’s basic training along with issues such as safety and navigation. The level of awareness of facilities, regulations and fee structures in relation to the disposal of wastes from ships is also low in some areas and is not helped by the range of different charging structures for wastes under the EU Directive on Port Waste Reception Facilities. The introduction of a harmonised indirect (or even no special) fee system in all ports for both merchant and fishing vessels would eliminate this confusion. The introduction of more programmes and measures is essential to tackle a diffuse pollution source such as marine litter. An example of a programme that could be easily implemented in the
79
whole OSPAR Maritime Area is Fishing for Litter. This project not only works to change attitudes to marine litter within the Fishing Industry but also actively removes marine litter from the environment. This could be implemented in all CPs with a fishing fleet and could form a subject for further discussion between OSPAR and the North-East Atlantic Fisheries Commission. There are also many more generic programmes that are operating in CPs that could be considered for implementation across the OSPAR Maritime Area. For example in Germany plastic bottles all have a deposit giving them a value after they have been used encouraging recycling. This measure could also be expanded to cover larger plastic containers that are used commercially. In Ireland the introduction of a tax on plastic bags has reduced the number of bags entering the marine environment. Current International legislation is very clear in relation to plastic: the IMO MARPOL Convention Annex V bans all dumping of plastic at sea. However, as there is very little enforcement there is little deterrent to breaking the law. The EU Port Waste Reception Directive also requires vessels to carry a waste log to ensure that no waste has been dumped during a voyage but again more stringent enforcement and greater cooperation between ports and regulators is required for this to be effective. A possible solution to increasing the effectiveness of enforcement on marine litter in general would be to ask networks such as the North Sea Network of Investigators and Prosecutors, which currently try to harmonise evidence gathering and increase prosecutions for oil pollution, to address marine litter. The level of fines also needs to be reviewed to make them a sufficient deterrent. For example in the US the cruise ship Regal Princess was fined $500,000 (about €336,600 or £268,719) in 1993 for dumping 20 bags of garbage in to the sea. Fines of this level would act as a genuine deterrent to dumping of marine litter. Finally in order to start reducing the levels of marine litter CPs should give marine litter a higher profile within their own national priorities in order to release the funding required to tackle the problem. This is especially important with the adoption of the EU Marine Strategy Framework Directive, which includes Marine Litter in Annex III under pressures and impacts. This will require CPs to develop programmes and measures at a Regional level to ensure that waters reach good environmental status in relation to marine litter.
9.3 Proposals for Action It is recommended that OSPAR consider the following actions to address marine litter within the OSPAR area: • Include Marine Beach Litter Monitoring in an expanded CEMP (Coordinator Environmental
Monitoring Programme) as a mandatory element. • Investigate using fisheries research vessels to undertake seabed monitoring of marine litter
during scientific trawls. • Encourage all CPs to participate actively in OSPAR’s work on marine litter. • Develop a recommendation that all CPs identify a lead agency to collect and assess marine
litter data nationally and report back to OSPAR. • Investigate a possible monitoring programme and further research on microscopic plastic
particles. • Collective action to encourage other competent authorities to take necessary action where
appropriate. For example, CPs should support the Netherlands efforts at the IMO to have marine environmental awareness training included in the STCW Convention.
• Encourage CPs to introduce a harmonised indirect (or even No Special) Fee system for Port Reception Facilities.
• Develop a recommendation to implement Fishing for Litter in all CPs with a fishing fleet. • Ask the North Sea Network of Investigators and Prosecutors to investigate cooperation on
marine litter pollution enforcement.

80
Acronyms
ALFG Abandoned and Lost Fishing Gear
ASMO Environmental Assessment and Monitoring Committee (OSPAR)
BBC British Broadcasting Corporation
BDC Biodiversity Committee
BIM Board Lascaigh Mhara. Irish Sea Fisheries Board
CBD Convention on Biological Diversity
CEDRE Centre of Documentation, Research and Experimentation of Accidental Water Pollution
CEFAS Centre for Environment, Fisheries and Aquaculture Science
CEIDA Centros de Educación e Investigación Didáctico-Ambiental (Environmental Research and Education Centre)
CEMP Coordinator Environmental Monitoring Programme
CETMAR Centro Tecnologico del Mar. Sea Technologic Centre
COBSEA CPs
East Asian Seas Contracting Parties
CPSPS South East Pacific
DEFRA Department of Environment, Food and Rural Affairs
DGzRS German Maritime Rescue Service
EEZ Exclusive Economic Zone
ENCAMS Keep Britain Tidy Campaign
EPA Environmental Protection Act
FAO Food and Agriculture Organisation of the United Nations
FEE Foundation for Environmental Education
FFL Fishing for Litter

81
GAUSS Association on Environmental Protection and Safety in Shipping
GECC Global Environmental Change Committee
GPA Global Programme of Action
HELCOM Baltic Marine Environment Protection Commission
HWDT Hebridean Whale and Dolphin Trust
ICG Inter-Sessional Correspondence Group on Marine Litter
IFREMER French Research Institute for Exploitation of the Sea
IMO International Maritime Organisation
INBO Research Institute for Nature and Forest
IOC Intergovernmental Oceanographic Commission
KIMO Kommunenes Internasjonale Miljoorganisasjon. Local Authority International Environmental Organisation
LIFE
EU Financial Instrument Supporting Environmental and Nature Conservation projects
MARPOL International Convention for the Prevention of Pollution from Ships 1973, 1978
MCS Marine Conservation Society
MEPC Marine Environment Protection Committee
MNR Marine Nature Reserve
MOU Memorandum of Understanding
NGOs Non-Governmental Organisations
NOWPAP Northwest Pacific Action Plan
NPA National Programme of Action for the protection of the marine environment
NSO-NZG Beached Bird Survey of the Dutch Seabird Group
OSPAR Convention for the Protection of the Marine Environment

82
OVAM Openbare Afvalstoffenmaatschappij voor het Vlaams Gewest. Public Waste Agency of Flanders
PERSGA Red Sea and Gulf of Aden
PRFs Port Reception Facilities
QSR Quality Status Report
RSP Regional Seas Programme
RSPB Royal Society for the Protection of Birds
RSPCA The Royal Society for the Prevention of Cruelty to Animals
SACEP South Asia Seas
SEPA Scottish Environment Protection Agency
SFAV Foundation for the Financing of Ship-generated Waste in the Fishery
SNS Save the North Sea
SOGAMA Sociedade Galega do Medio Ambiente. Environmental Galician Society
SPREP Pacific Environment Programme
SRD Sewage Related Debris
STCW Standards of Training, Certification and Watchkeeping for Seafarers
TWG Technical Working Group
UBA Federal Environmental Agency
UMFÍ Icelandic Youth Association
UNEP United Nations Environment Programme

83
Bibliography Browne, M., et al. 2007. Microplastic-An Emerging Contaminant of Potential Concern? University of Plymouth, UK. Integrated Environmental Assessment and Management. Volume 3, Number 4, pp 559-566 Browne, M., et al. 2008. Ingested Microscopic Plastic Translocates to the Circulatory System if the Mussel, Mytilus edulis (L.) Environmental Science and Technology Franeker, J.A., & the SNS Fulmar Study Group. 2006. Fulmar Litter EcoQO Monitoring in the North Sea. Institute for Marine Resources and Ecosystem Studies. IMARES. Report number CO33/08 Franeker, J.A., et al. ‘Save the North Sea’ Fulmar Study 2002-2004, Alterra-rapport 1162, ISSN 1566-7197 Galgani, F., et al. 2000. Litter on the Sea Floor along European Coasts. Marine Pollution Bulletin, Vol. 40, No. 6, pp 516-527 Hall, K. 2000. Impacts of Marine Debris and Oil. Economic & Social Costs to Coastal Communities. Kommunenes Internasjonale Miljoorganisasjon (KIMO) HELCOM Baltic Marine Environment Protection Commission. May 2007. Assessment of the Marine Litter Problem in the Baltic Region and Priorities for Response MCS Beachwatch 2007. The Annual UK Beach Litter Survey report. Marine Conservation Society Norén, F., 2007. Small Plastic Particles in Coastal Swedish Waters. KIMO International OSPAR Commission 2007. Background Report on Fishing-for-litter Activities in the OSPAR Region OSPAR Commission. 2004. Environmental Assessment and Monitoring Committee (ASMO) OSPAR Commission. 2007. OSPAR Pilot Project on Monitoring Marine Beach Litter: Final Project report Teuten, E., et al. 2007. Potential for Plastics to Transport Hydrophobic Contaminants. Environmental Science and Technology Thompson, R., et al. 2004. Lost at Sea: Where Is All the Plastic? SCIENCE. Volume 304, Number 5672, pp 838 Thompson, R., et al. 2005. New Directions in Plastic Debris. SCIENCE. Letters. Volume 310 UNEP Regional Seas Programme. April 2005. Marine Litter And Abandoned Fishing Gear. Nairobi
84
Annex 1. Assessment of the marine litter problem in the North-East Atlantic Maritime Area and priorities for response. National Questionnaire In order to assess the marine litter problem a National Questionnaire was developed and sent to all National Contact Persons (NCs), in line with the Memorandum of Understanding (MOU) between the OSPAR Commission (OSPAR) and the United Nations Environment Programme (UNEP), to collect the information which forms the basis of this assessment.

85
Questionnaire Assessment of the marine litter problem in the North-East Atlantic Maritime Area and priorities for response National contacts should endeavour to provide as many examples and ideas as possible as the quality of the final report will depend upon the quality of the submissions. Please send the completed assessment by 1st March 2008 To Rebecca Lopez, Project Researcher, at Ms Rebecca Lopez KIMO Researcher Grantfield Lerwick Shetland ZE1 ONT UK
Tel: +44(0) 1595 744890 Fax: +44(0) 1595 744804 [email protected] Web: www.kimointernational.org In case of queries: Mr John Mouat Project Manager Tel: +44 (0) 1595 744826 Fax: +44 (0) 1595 744804 [email protected]
THANK YOU, IN ANTICIPATION
OSPAR Commission

86
1. Questions about the National Contact Person/Respondent Please fill in the following personal details. Name of Country:
Name of the National Contact / Respondent and Organization:
Contact information: Postal Address, Phone number (with country code), Fax Number (with country code), Email address
Stakeholders Consulted:

87
2. The scale of the problem 2.1 Amounts of marine litter in different parts of the North-East Atlantic What are the amounts of marine litter found at the coastline in your country? Please state the data for each OSPAR Maritime Area separately if possible42 What are the amounts of marine litter found at sea in your country? Give estimation if data is not available. Please state the data for each OSPAR Maritime Area separately if possible1 42 See figure attached in page 6 in the Questionnaire Background Report

88
2.2 Environmental effects, economic losses, cost of management and other negative effects caused by marine litter Is there any information on the ecological and environmental effects, socioeconomic impacts or impacts on public health of marine litter in your country? If YES, please list the information sources and describe the main findings. An example list is provided in section 4.2 of the Background Report although this should not be considered exhaustive. Information should be broken down into the different OSPAR Maritime Areas if possible1 Ecological and Environmental effects
Socioeconomic Impacts and other impacts

89
Please specify the cost of management of marine litter at the community level, and other levels if possible, in your country: Outline any evidence of negative impacts of lost and abandoned fishing gear
90
2.3 Types of marine litter in different parts of the North-East Atlantic What are the types of marine litter in your country? Please rank the different types according to their commonality An example list provided in section 4.3 of the Background Report although this should not be considered exhaustive. Please state separately for each OSPAR Maritime Area if possible1 At sea
At coastline

91
3. Sources of marine litter in the North-East Atlantic Region What are the land-based sources in your country? Please rank the sources in descending order and indicate the quantities from each source if possible. Please at least use the example list in section 5 of the background report as a starting point and state sources separately for each OSPAR Maritime Area if possible1

92
What are the sea-based sources in your country? Please rank the sources in descending order and indicate the quantities from each source if possible. Please at least use the example list in section 5 of the background report as a starting point and state sources separately for each OSPAR Maritime Area if possible1

93
4. Existing legal regimes in the areas related to the marine litter in the North-East Atlantic Do you think there is any international legislation that should be added to the background paper in section 6.1? What are the national and local legislation and the economic instruments in your country concerning marine litter? National Legislation
Local Legislation

94
Please describe the contents of the legislation and how it addresses marine litter. Is marine litter the sole responsibility of one organization, or is the responsibility covered by several organizations? Please list the organizations and their responsibilities for marine litter.

95
What organizations have the legal responsibility implementing and enforcing marine litter legislation in case the administrative procedure is inefficient?

96
5. Programmes and Measures in the North-East Atlantic Please specify any national and regional programmes, initiatives, arrangements and activities related to marine litter in your country

97
Please stipulate what the availability and state of the port reception facilities is, and whether your country is party to Annex V of the MARPOL Convention and EU Directive on Port Reception Facilities (please see page 16 of the Background report) Are there any barriers to the effective provision of and use of port waste reception facilities in your country? Please describe.

98
Please fill in the table the missing information from your country:
Country Most common types of ships calling the ports
Garbage waste delivered to ports (amount)
Garbage, % of the total amount of waste at ports
No Special Fee-system: effect on the amounts of waste delivered to the ports YES/NO
Cost of use of the port reception facilities (No-fee basis)
Belgium
Denmark
Finland
France
Germany
Iceland
Ireland
Netherlands
Norway
Portugal
Spain
Sweden
UK

99
How efficient is the collection of beach garbage at the community level? Please outline the main marine litter management activities taking place in your country including beach cleanups, participation in International Coastal Cleanup Day etc.

100
6. Existing monitoring programmes related to the marine litter in the North-East Atlantic Are there or has there been any surveys, monitoring or other activities collecting information on marine litter in your country? If YES, please list the references: name of the project, organization, time period, types of data collected and publications / web addresses. If the monitoring data is unpublished, or not in English, please include a summary of its findings in English. SURVEYS/MONITORING/OTHER Name of the projects
Organizations
Time periods
Methods
Type of Data collected
Publication/web addresses
101
7. Scientific studies and research Please specify any scientific studies and research that has been undertaken in your country on marine litter (ecological, environmental, economical, etc.) 8. Gaps, needs, priorities and recommendations Please specify needs, gaps and priorities in marine litter issues in your country

102
Please specify any proposals for future programmes and measures related to marine litter, especially economic instruments and initiatives

103
Additional information:

104
Annex 2. Monitoring programmes related to marine litter Comprehensive surveys of marine litter on specific beaches have been made in many areas, often over a number of years, by various organisations and groups in the North-East Atlantic Maritime Area. Several monitoring programmes related to marine litter are indicated in the annex. The data has been broken down into the 12 countries from the OSPAR Maritime Area involved in the project. Iceland: SURVEYS/MONITORING/OTHER
Name of the projects
Adopt a beach
Organizations
Local municipalities (Environmental department of the municipalities in cooperation with public schools and Reykjavik Nature school).
Time periods
Started 2006-
Methods
Beaches are monitored by school students. During the wintertime the beaches are visited with 2-3 weeks intervals.
Type of Data collected
Amount of litter Type of litter Pollution monitoring
Publication/web addresses
Not available

105
Faroe Islands (Denmark): SURVEYS/MONITORING/OTHER Name of the projects
1. Fishing for Litter pilot project. 2. OSPAR Pilot Project on Monitoring Marine Beach Litter.
Organizations
1. Føroya Kommunufelag. 2. Føroya Kommunufelag.
Time periods
1. 2007-2008 2. 2002-2005
Methods
1. Marine Litter from trawls gathered and registered. 2. Marine Litter from beaches gathered and registered.
Type of Data collected
1. Amount and types of Marine Litter. 2. Amount and types of Marine Litter.
Publication/web addresses
Norway: A major survey, mapping and cleaning up of Norwegian sea beds was made in the period 1982–199743. In 1980, the Norwegian Oljedirektoratet (Norwegian Petroleum Directorate) and Fiskeridirektoratet (Fisheries Directorate) initiated a project leading to an area of 1,200–1,400 km2 being surveyed annually for presence of waste and garbage. The objective was to survey and clean up waste that could originate from the extraction of oil and natural gas in Norwegian waters, particularly in the vicinity of important fishing areas, but also to get an idea of the waste situation on Norwegian sea beds in general. Much of the garbage found on the sea beds was collected and removed ("seabed cleaning") during those years, and the project was closed down when it was concluded that the remaining waste did not originate from activities by the oil industry. As a spin off effect of the project, several ship wrecks and other major obstacles that could cause damage to fishing gear were located and marked on the sea charts. Some seabed areas, with huge amounts of marine litter is still left, were described as "horror sights". For example, there is one area in the Skagerrak, where such a huge amount of marine litter has been trapped at a depth of 500–700 metres due to the specific currents prevailing in the area.44
43 Information provided by Norwegian consultants in a study commissioned by the Nordic Council
of Ministers (2004) on the situation in the Nordic countries regarding management of waste from fishing vessels.
44 Background Report on Fishing-for-litter Activities in the OSPAR Region OSPAR Commission 2007

106
The Netherlands: SURVEYS/MONITORING/OTHER Name of the projects
1. Coastwatch 2. North Sea Directorate Fishing for Litter project 3. Clean up of anchor areas 4. “beached harbour porpoises in the Netherlands” 5. Pro Sea 6. ANWB: Blauwe Vlag certificate (“clean beaches”) 7. OSPAR Pilot Project on Monitoring Marine Beach Litter
Organizations
1. North Sea Foundation is the leading party 2. National Government and KIMO Netherlands and Belgium 3. North Sea Directorate of the Dutch Government 4. OSPAR
Time periods
1. 2001-2007 2. In Den Helder harbour the weight and number of items
collected has been monitored since 2000 3. Survey undertaken in 2006. Also activities in 2007 4. 2007 5. 2001-2009
Methods
1. Coastwatch project classes of school children (between 12
and 14 years old) go to several beaches along the Dutch coast and investigate the amount and the composition of marine litter items. The items are weighted and delivered to the waste disposal site in cooperation with the local government
2. The project involves fishing boats collecting marine litter that accumulates in their nets as part of their normal fishing activity and taking it ashore in large hardwearing bags before it is processed in an onshore waste facility.
3. Monitoring of the items collected from the seabed, 2006. Clearing of 26 items from the same areas in 2007.
4. It organises marine awareness courses for seamen 5. Collection and registration of litter items on reference beaches
4 times per year
Type of Data collected
1. Monitoring of the composition and quantity of marine litter
items 2. Weight of marine litter collected during the study. 3. Quantity and composition of marine litter items found on the
seabed. 4. Number of items and type of items
Publication/web addresses
1.http://www.blueflag.ca/bwt/resourses/presentations/Ouwehand.pdf 2. OSPAR BDC 2007. 07/05/04

107
Other monitoring programmes related to marine litter in the Netherlands are the following: A systematic survey and investigation of marine litter accumulated on the seabed was carried out in the years 1987–1995 by the Netherlands in the Dutch sector of the North Sea. Results from the survey indicated an average of 116 pieces of marine litter per km2 of seabed. Extrapolated to the entire Dutch sector of the North Sea at the time, these results would imply a total of 6.6 million pieces of marine litter, or approximately 8,600 tonnes of marine litter, on the seabed. Assuming that similar quantities of marine litter can be found all over the bottom of the North Sea, at least some 600,000 m3 of marine litter could be resting on the seabed. In March 2000, the Dutch North Sea Directorate in co-operation with the fisheries association started the Vuilvisproject Den Helder. The aim of the project was to clean up the North Sea from marine litter by bringing ashore the litter gathered in nets during fishing. The pilot project was initiated to investigate whether the amount of collected litter would be high enough in relation to the efforts needed to collect, process and destroy the litter. Since the beginning of the project in 2000 until March 2006, approx. 500 tonnes of litter were collected. Just over 1500 big-bags were collected, with an average weight of 300 kg. Note that a growing amount of fished up litter is collected separately since it's too big to effectively fit a big-bag. This is litter such as truck tires, fridges and large tree trunks. The litter consisted mainly of parts of shiploads, wood, packing material, decaying fishing gear and rope. After being delivered ashore, the litter is properly destroyed. The fishermen receive no remuneration for taking part in the project. Ten ships that land their fishing products at the harbour of Den Helder have participated. The North Sea Directorate has contracted the local port reception facility to collect the fished litter from the fishing vessels, in addition to their operational waste. New big bags for the collection of the litter have been regularly supplied to the ships. The North Sea Directorate have paid the costs for the collection and processing of the litter. A gradual extension of the project to all of the fishing harbours in the Netherlands with a port reception facility and a maximum number of fishing vessels has been considered. All participating vessels must be members of the Stichting Financiering Afvalstoffen Visserij (SFAV; Foundation for the Financing of Ship-generated Waste in the Fishery) to be allowed to participate. SFAV, founded in 1994, is an initiative by the fishing sector in cooperation with the Ministerie van Verkeer en Waterstaat. All Dutch fishing associations are SFAV members.45
45 Background Report on Fishing-for-litter Activities in the OSPAR Region OSPAR Commission 2007

108
Sweden: SURVEYS/MONITORING/OTHER Name of the projects
1. OSPAR Pilot Project on Monitoring Marine Beach Litter 2. Retrieving lost gear
Organizations
1. OSPAR 2. Swedish board of Fisheries
Time periods
1. 2001-2009 2. approx 2004
Methods
1. Collection and registration of litter items on reference beaches 4
times per year 2. Dragging for lost gears
Type of Data collected
1. Number of items and type of items 2. Amounts of gears, number of newly caught fishes, species
caught
Publication/web addresses
1. OSPAR BDC 2007. 07/05/04 2. Unpublished report
Other monitoring programmes related to marine litter in the Sweden: In 2004, a small pilot survey was made of the seabed on the Swedish west coast, in the Kattegat, along transects 50–60 kilometres long, at water depths ranging from 6–30 metres. The sea beds in the area vary, from rocky hard bottoms to soft bottoms, including one area sloping from a depth of 12 to a depth of 30 metres. Marine litter, including lost/discarded fishing gear, was found on all bottom types. The items were scattered and no major accumulations of marine litter were found. The sea beds were video-filmed by means of special underwater video equipment as an alternative to side-scan sonar. At the speed of 3 knots (ordinary trawling speed) an area of around 40,000 m2 can be filmed during one hour. The objective of the pilot survey, funded by the Swedish EPA, was twofold, to be used in the OSPAR Pilot Project on Monitoring Marine Beach Litter, and in the Swedish component of the SNS Fishing-for-litter project.46
46 Background Report on Fishing-for-litter Activities in the OSPAR Region OSPAR Commission 2007

109
Germany: SURVEYS/MONITORING/OTHER Name of the projects
1. OSPAR Pilot Project on Monitoring Marine Beach Litter 2. Beach monitoring programmes run by three nature conservation
organisations Organizations
1. OSPAR 2. Schutzstation Wattenmeer e.V.
Mellumrat e.V. Verein Jordsand zum Schutze der Seevögel und der Natur e.V.
Time periods
1. 2001-2009 2. (1980) 1991-2009
Methods
1. Collection and registration of litter items on reference beaches 4
times per year 2. Surveys of beached litter on four sandy beaches. (See table
below)
Type of Data collected
1. Number of items and type of items 2. Number of items, weight of items and type of items on some
beaches. (See table below). Publication/web addresses
1. OSPAR BDC 2007. 07/05/04 2. Fleet, D. M. (2003): Untersuchung der Verschmutzung der
Spülsäume durch Schiffsmüll an der deutschen Nordseeküste. Im Auftrag des Umweltbundesamtes. FAZ 202 96 183
The beach monitoring programmes run by nature conservation organisations in Germany were undertaken in the following areas: Surveys of beached litter on four sandy beaches on the Schleswig-Holstein coast carried out in winter by the Naturschutzgesellschaft Schutzstation Wattenmeer e.V., surveys of beached litter on one site on the island of Scharhörn carried out in summer by the Verein Jordsand e.V., surveys of beached litter on one site on the island of Minsener Oog carried out in summer by the Mellumrat e.V. and surveys of litter on two sites on the island of Mellum carried out in summer by the Mellumrat e.V. Survey site
Factors covered
Season
Frequency of the surveys
Length of site
Period
Months covered
Scharhörn (Jordsand)
Number and weight
Summer Once every three days
100 m 1991 – 2002 (+ 1980, 1983 & 1989)
May to Sept. (Oct.)
Mellum North beach (Mellumrat)
Number and weight
Summer Once every three days
100 m (1991) 1992 – 2002 (no data for 1995)
(March) April- Sept. (Oct.)
Mellum South beach (Mellumrat)
Number and weight
Summer Once every three days
100 m (1991) 1992 – 2002 (no data for 1995)
(March) April- Sept. (Oct.)
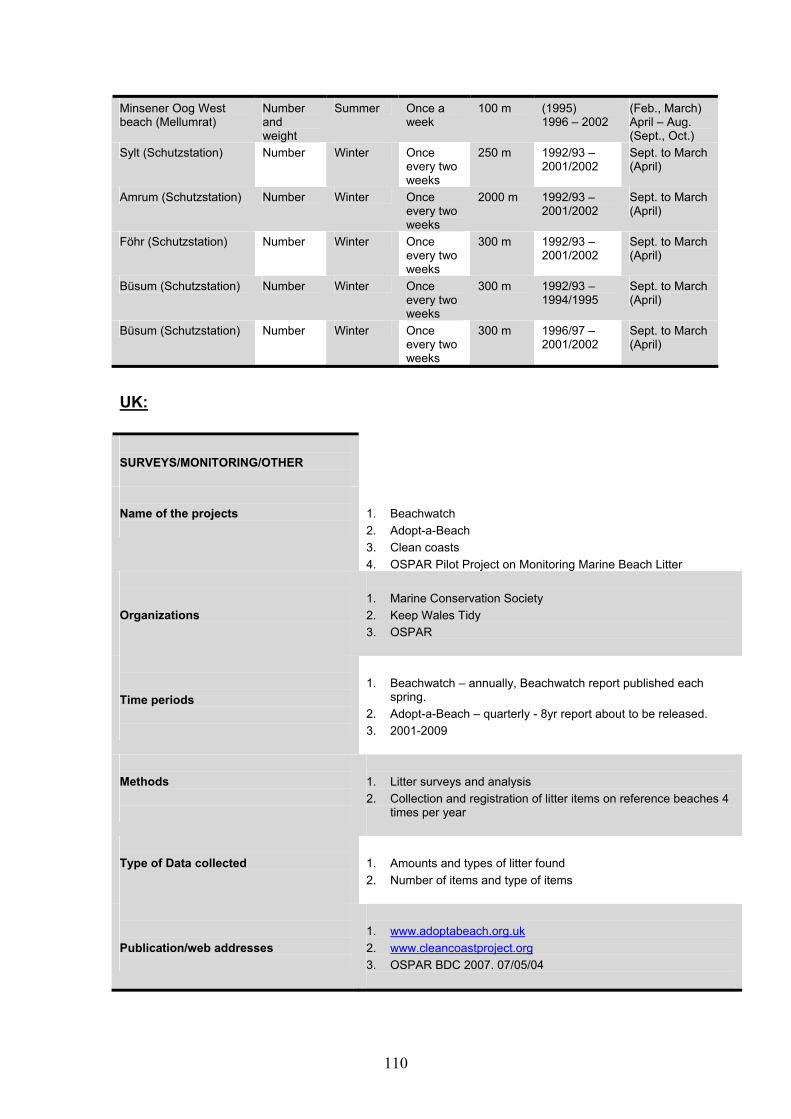
110
Minsener Oog West beach (Mellumrat)
Number and weight
Summer Once a week
100 m (1995) 1996 – 2002
(Feb., March) April – Aug. (Sept., Oct.)
Sylt (Schutzstation) Number Winter Once every two weeks
250 m 1992/93 – 2001/2002
Sept. to March (April)
Amrum (Schutzstation) Number Winter Once every two weeks
2000 m 1992/93 – 2001/2002
Sept. to March (April)
Föhr (Schutzstation) Number Winter Once every two weeks
300 m 1992/93 – 2001/2002
Sept. to March (April)
Büsum (Schutzstation) Number Winter Once every two weeks
300 m 1992/93 – 1994/1995
Sept. to March (April)
Büsum (Schutzstation) Number Winter Once every two weeks
300 m 1996/97 – 2001/2002
Sept. to March (April)
UK: SURVEYS/MONITORING/OTHER Name of the projects
1. Beachwatch 2. Adopt-a-Beach 3. Clean coasts 4. OSPAR Pilot Project on Monitoring Marine Beach Litter
Organizations
1. Marine Conservation Society 2. Keep Wales Tidy 3. OSPAR
Time periods
1. Beachwatch – annually, Beachwatch report published each
spring. 2. Adopt-a-Beach – quarterly - 8yr report about to be released. 3. 2001-2009
Methods
1. Litter surveys and analysis 2. Collection and registration of litter items on reference beaches 4
times per year
Type of Data collected
1. Amounts and types of litter found 2. Number of items and type of items
Publication/web addresses
1. www.adoptabeach.org.uk 2. www.cleancoastproject.org 3. OSPAR BDC 2007. 07/05/04

111
Adopt a Beach and Beachtwatch Programmes Marine Conservation Society has been collecting data on marine litter through Beachwatch since 1993 and Adopt-a-Beach since 1999 and has thus amassed a large bank of data detailing both type and source of litter to be found in the UK. The protocols and methodology used are compatible with other systems on a European and worldwide basis. Volunteer organisers are sent a detailed pack with instructions on how to carry out the surveys, and marine litter ID sheets are provided for uncommon items. Organisers carry out the survey 1 to 2 hours after high tide, along a stretch of beach a minimum 100m in length (or less if the total beach length was less than 100m). Litter is recorded between the current high water mark (along the strandline) and the upper edge of the usable part of the beach (e.g. up to the edge of the sand dunes, sea wall or promenade). Each piece of litter on the measured area of beach is removed and recorded on prepared Data Sheets which categorises the items according to material type, e.g. plastics, metal, sanitary. Each material type is then broken down into specific objects, e.g. bottle, crisp packet, cotton bud stick. Details of any items that are identifiably foreign or traceable to particular countries or companies are also recorded. Observations of dead, entangled or stranded animals are noted and the relevant authorities notified. Volunteers followed strict guidelines for ensuring the accuracy of data recording. The total number of litter items in each material category, total number of bags, weight of litter, length and width of beach surveyed and the number of volunteers are recorded. These records are then returned to MCS, along with the Data Sheets, for collation and analysis of the data. Volunteers follow strict guidelines for ensuring the accuracy of data recording and are asked not to remove any natural debris, such as seaweed and driftwood. All litter, once recorded and weighed, is left at a collection point for correct disposal (and recycling where possible). The organiser records the start and finish time of the survey, total number of litter items in each material category, total number of bags and weight of litter length and width of beach surveyed and the number of volunteers on the Survey Form (Appendix B), which is then returned to MCS, along with the Data Sheets, within 6 weeks of the survey for collation and analysis of the data. The data collected during surveys is analysed by MCS to identify the main sources of litter found, providing evidence that can be used to target specific polluters and pollutants at local, national and international levels. As well as traditional beach clean-ups, MCS works alongside Project AWARE and PADI (Professional Association of Dive Instructors) dive centres to organise underwater beach cleans. These underwater clean-ups are invaluable as they remove plastic, netting, cans, old buoys and general rubbish that has already made it into the marine ecosystem. The main aims of Beachwatch and Adopt-a-Beach are to: Increase awareness of marine and coastal litter, and its impacts. Identify and monitor quantities and sources of litter on UK beaches. Encourage action to reduce marine and coastal litter at its source. The main objectives of the projects are to: Maintain an effective long-term database on the amount, types and sources of litter on Britain's beaches. Produce evidence of the amount, types, sources and distribution of beach litter in the UK and identify temporal trends. Campaign for measures that reduce the input of the most common or harmful litter items from the key sources identified. Increase public and community participation in marine conservation projects.

112
Raise awareness of the issue of marine and coastal litter and its impacts on wildlife, human health and local economies. Highlight and publicise the need for reduction of marine pollution at source by making recommendations for action at local, national and international levels. Contribute to the International Coastal Cleanup and worldwide database on marine litter. Belgium: SURVEYS/MONITORING/OTHER Name of the projects
1. OSPAR Pilot Project on Monitoring Marine Beach Litter 2. Lenteprikkel 3. Fishing for litter 2007, however the data collected is not reliable,
this is merely a hidden subsidiary to local fisherman, to gain their (political) goodwill. However the format has been restarted in 2008 and there is good hope that the data will be more reliable.
Organizations
1. OSPAR 2. Organised by the Coordination centre for Integrated Coastal
Zone Management, with the support of many authorities
Time periods
1. Started in 2008, with no news yet about ongoing thereafter. 2. Once a year, before the Eastern holiday, from 2001 – 2008
Methods
1. Volunteer clean up of a stretch of beach 2. Collection and registration of litter items on reference beaches 4
times per year
Type of Data collected
1. Number of items and type of items 2. Plastics (including netting, package...) were the most common
items, followed by processed wood. In 2008 such wood was commonest due to the stranding of wood originating from the wrecked ICE PRINCE.
Publication/web addresses
1. OSPAR BDC 2007. 07/05/04 2. http://www.west-
vlaanderen.be/jahia/Jahia/site/kustbeheer_nl/pid/4656

113
Denmark: SURVEYS/MONITORING/OTHER
Name of the projects
OSPAR Beach Litter started in 2008
Organizations OSPAR
Time periods
2001-2009
Methods
Collection and registration of litter items on reference beaches 4 times per year
Type of Data collected
Number of items and type of items
Publication/web addresses
OSPAR BDC 2007. 07/05/04
Ireland: SURVEYS/MONITORING/OTHER Name of the projects
OSPAR Beach Litter started in 2008
Organizations
Mayo Co. Council Wexford Co. Council Department of Transport. Environmental Protection Agency Marine Institute Department of Environment, Heritage and Local Government.
Time periods
2008 – hopefully ongoing thereafter
Methods
Collection and registration of litter items on reference beaches 4 times per year
Type of Data collected
Types of litter on 4 beaches 4 time per year
Publication/web addresses
OSPAR BDC 2007. 07/05/04

114
Spain: SURVEYS/MONITORING/OTHER
Name of the projects
1. Aztercosta 2. Coastwatch Andalusia 3. Areais 4. Jellyfish campaign 5. OSPAR Pilot Project on Monitoring Marine Beach Litter
Organizations
1. CEIDA 2. Ollalomar 3. Environmental Ministry 4. OSPAR
Time periods
1. Annual campaign undertaken in the middle of October along
the Basque Country coast. 2. Annual campaign undertaken in the middle of October along
the Andalusian coast. 3. Annual campaign undertaken in Spring in some beaches along
Galicia. 4. Along the Spanish coast in Summer. 5. 2001-2009
Methods
1. Beach marine litter monitoring data. 2. Beach marine litter monitoring data. 3. Marine litter beach cleaning. 4. Clearing of jellyfish and also marine litter with mechanical
methods. 5. Collection and registration of litter items on reference beaches
4 times per year
Type of Data collected
1. Mainly data about composition of marine litter (presence or
absence of different kinds of marine litter) and some data about quantities (mainly containers)
2. Dido 3. Quantities of marine litter found on the beaches. 4. There is a network of observers that alert in case an
accumulation of marine litter is detected. If the level of accumulation is too high, the clearing of marine litter is undertaken from boats. There have been several cases in the Mediterranean but not yet in the Atlantic coasts.
5. Number of items and type of items
Publication/web addresses
1. OSPAR BDC 2007. 07/05/04

115
France: SURVEYS/MONITORING/OTHER Name of the projects
1. « Observatoire des déchets en milieu Aquatique » 2. OSPAR Pilot Project on Monitoring Marine Beach Litter
Organizations
1. NGO “Mer-Terre” 2. OSPAR
Time periods
1. All over the year 2. It joined in late 2005
Methods
1. Synthesis of information gathered by some NGO during beaches
clean-up 2. Collection and registration of litter items on reference beaches 4
times per year
Type of Data collected
1. Quantities and kinds of litters collected on shoreline. Description
of local initiatives 2. Number of items and type of items
Publication/web addresses
1. http://www.mer-terre.org/ 2. OSPAR BDC 2007. 07/05/04
Portugal: SURVEYS/MONITORING/OTHER Name of the projects
OSPAR Pilot Project on Monitoring Marine Beach Litter
Organizations
OSPAR
Time periods
2001-2009
Methods
Collection and registration of litter items on reference beaches 4 times per year
Type of Data collected
Number of items and type of items
Publication/web addresses
OSPAR BDC 2007. 07/05/04

116
Annex 3. Scientific studies and research in marine litter Various scientific analysis and research has been undertaken on marine litter, studying items such as small plastic fragments found in seabirds’ stomach (e.g. fulmar) or the ingestion and accumu- lation of microscopic plastic by marine organisms. These papers are outlined in this annex along with other research papers on marine litter that have been highlighted by Contracting Parties. France • AREDRA, 1991. Réseau d'observation des déchets échoués sur les plages du littoral aquitain,
campagne de mesures 1990-1991. Rapport de synthèse, 54pp. • GALGANI F., BURGEOT T., BOCQUENE G., VINCENT F., LEAUTE J-P., LABASTIE J.,
FOREST A., et GUICHET R., 1995. Distribution and abundance of debris on the continental shelf of the Bay of Biscay and in Seine Bay, in Marine Pollution Bulletin, vol 30, n°1, pp58-62.
• LEVHEDER J-L., 1983. Pollution du littoral armoricain par les macro-déchets, méthodologie d'évaluation et état de référence. CNEXO-ENITRTS, 167pp.
• LOUBERSAC L., 1982. Pollution par macro-déchets du littoral français, méthodologie et état
de référence. rapport CNEXO/MECV. • ANDRE Samuel, DUBOIS Laurent, Institut des Milieux Aquatiques, 2006 • Programme régional d’actions contre les macro-déchets sur le littoral aquitain. Rapport
d’activité 2005, 21 p. • CEDRE, Agences de l’eau, Juin 1997 • Inventaire et méthode d’évaluation des « petites » pollutions littorales : cas des macro-
déchets. • Convention pluriannuelle N°95 00 075 entre le CEDRE et les Agences de l’eau. 29 p • SCHWEIZER Ghislaine. Septembre 2002. • La gestion de la pollution par macro-déchets sur le littoral du golfe de Gascogne, 22 p • Observatoire de l’environnement, mai 2005 • Les macro-déchets en Corse : Enquête sur le rôle et modalité d’intervention des communes
littorales. Trimestriel d’information n°9, mai 2005, 4 p. • Association AQUACAUX, 2003 • Contre vents et marées : La transhumance des déchets en baie de Seine. Mars 2003, 28 p. • Conseil régional d’Aquitaine, 2002 • Lutte contre les déchets flottants du Golfe de Gascogne, programme d’expérimentation du
ramassage des déchets flottants en mer. Avril 2002, 29 p. • LOBBEDEY Stéphane, 1997 • Les pollutions littorales par macrodéchets, synthèse nationale et cas du littoral méditerranéen
français. Mémoire de DESS « Activités et Aménagements Littoraux et Maritimes », août 1997, 186 p.
• CEDRE, 2000 • Etude des stratégies de réponse au problème des macrodéchets rejetés sur le littoral, Rapport
final, Mars 2000, 44 p.

117
Germany CLEMENS, T. & E. HARTWIG (1993): Müll als Nistmaterial von Dreizehenmöwen (Rissa tridactyla) - Untersuchung einer Brutkolonie an der Jammerbucht, Dänemark. - Seevögel 14/1: 6-7. CLEMENS, T. (1992): Untersuchungen zur Müllbelastung der Insel Mellum 1991. - Seevögel 13/4: 55-60. CLEMENS, T., Z. BEDNAROVA & E. HARTWIG (2002): Zur Müllbelastung der Insel Minsener Oog (Außenjade) 1995 bis 2000. – Natur- und Umweltschutz (Zeitschrift Mellumrat) 1/1: 18-23. DAHLMANN, G. & E. HARTWIG (1996): Schiffsverkehr, Müll- und Ölverschmutzung. - LOZAN, J.L., R. LAMPE, W. MATTHÄUS, E. RACHOR, H. RUMOHR & H.VON WESTERNHAGEN (Hrsg.): Warnsignale aus der Ostsee. Parey Buchverlag Berlin: 98 - 104. DENKINGER, P., J. PRÜTER, C. LAMMEN & E. HARTWIG (1990): Häufigkeit und Verteilung von Rohplastikgranulaten („Pellets“) an der Westküste Schleswig-Holsteins. - Seevögel 11/ 1: 1-7. FLEET, D. M. (2003) Untersuchung der Verschmutzung der Spülsäume durch Schiffsmüll an der deutschen Nordseeküste - Untersuchung der Müllbelastung an den Spülsäumen der deutschen Nordseeküste – Umweltbundesamt - FAZ 202 96 183, ss. 166. This provided the Basis for the German contribution to the OSPAR Background Document. GERLACH, A. (1994): Müll im Winterspülsaum 1990 auf der Insel Mellum. - Seevögel 15/ 2: 27-30. GERLACH, A. (1999): Winter driftline debris on the wadden island of Mellum, Germany: distribution, quantity and decomposition. - Abh. Naturwiss. Verein Bremen 44/2-3: 707-724. HARTWIG, E. (1994): Belastungen des Wattenmeeres durch Müll. - In: LOZAN, J.L. et al. (Hrsg.), Warnsignale aus dem Wattenmeer, Blackwell Wissenschafts-Verlag, Berlin: 54 - 57. HARTWIG, E. (2000): Die Müllbelastung der Insel Scharhörn 1992-1994. - Seevögel 21/Sonderheft: 10-12. HARTWIG, E. (2001): Die Müllbelastung im Mündungsbereich der Elbe 1996. -Seevögel 22/3: 93 – 95. HARTWIG, E. (2001): Die Müllbelastung im Mündungsbereich der Elbe. - In: Nationalparkatlas Hamburgisches Wattenmeer, aus Schriftenreihe “Naturschutz und Landschaftspflege in Hamburg” Nr. 50/2001: 92 – 93. HARTWIG, E., & T. CLEMENS (1999): Die Müllbelastung im Mündungsbereich von Elbe, Weser und Jade. - In: Umweltatlas Wattenmeer/Nationalparkverwaltung Niedersächsisches Wattenmeer; Umweltbundesamt; Bd. 2: Wattenmeer zwischen Elb- und Emsmündung; Ulmer Verlag, Stuttgart: 116-117. HARTWIG, E., B. REINEKING, E. SCHREY & E. VAUK-HENTZELT (1985): Auswirkungen der Nordsee-Vermüllung auf Seevögel, Robben und Fische. - Seevögel 6/Sonderband (Festschrift Vauk): 57-62. HARTWIG, E., M. KORSCH & E. SCHREY (1992): Seevögel als Müllopfer in der Deutschen Bucht. - Seevögel 13/1: 1-4. HARTWIG, E., T. ESCHHOLZ & H. KOEHN (1998): Untersuchung zur Müllbelastung im NSG „Oehe-Schleimünde“ 1996. - Seevögel 19/4: 121-123. HARTWIG, E., T. KÖTH, J. PRÜTER, E. SCHREY, G. VAUK & E: VAUK-HENTZELT (1990): Seevögelverluste durch Schiffsmüll und Fischereigerät. - In: LOZAN, J. L., W. LENZ, E. RACHOR, B. WATERMANN & H. VON WESTERNHAGEN (Hrsg.): Warnsignale aus der Nordsee. Parey, Berlin, 305-319.

118
HÜPPOP, O., S. GARTHE, E. HARTWIG & U. WALTER (1994): Fischerei und Schiffsverkehr: Vorteil oder Problem für See- und Küstenvögel? - In: LOZAN, J., E. RACHOR, K. REISE, H. V. WESTERNHAGEN & W. LENZ (Hrsg.): Warnsignale aus dem Wattenmeer. Blackwell Wissenschafts-Verlag: 278-285. LIEDTKE, G. & E. HARTWIG (1990): Untersuchungen zur Müllbelastung der Insel Scharhörn 1989. - Seevögel 11/1: 8 - 12. NASSAUER, G. (1981): Untersuchungen zur Müllbelastung von Stränden der deutschen Nordseeküste. - Seevögel 2/3: 53 - 57. NIEDERNOSTHEIDE, N. & E. HARTWIG (1998): Die Müllbelastung der Insel Scharhörn 1991. - Seevögel 19/3: 89-91. SCHNEIDER, U. (1991): Baßtölpel - Opfer der Meeresverschmutzung - Seevögel 12/4: (42). SCHREY, E. & G. VAUK (1987): Records of entangled Gannets (Sula bassana) at Helgoland, German Bight. - Mar. Pollut. Bull. 18/6 B: 350-352. SCHREY, E. & K. GROSCH (1990): Garbage pollution by shipping in the seabird-reserve Oehe-Schleimünde (German Baltic Sea). - Baltic Birds 5: 127 - 131. SCHREY, E. (1987): Untersuchungen zur Belastung der Deutschen Bucht durch Schiffsmüll. - In: Vauk, G., G. DAHLMANN, E. HARTWIG, J.C. RANGER, B. REINEKING, E. SCHREY & E. VAUK-HENTZELT: Ölopfererfassung an der deutschen Nordseeküste und Ergebnisse der Ölanalysen sowie Untersuchungen zur Belastung der Deutschen Bucht durch Schiffsmüll. Umweltbundesamt-Texte 29/87: 79 - 152. UMWELTBUNDESAMT (1990): Sachstandsbericht „Schiffsmüll“. - Umweltbundesamt (UBA), Berlin, Bericht III 3.1-20 554/1: 1 - 18. VAUK, G. & E. SCHREY (1987): Litter pollution from ships in the German Bight. - Mar. Polut. Bull. 18: 350-352. VAUK, G. & E. SCHREY (1987): Vermüllung der Nordsee. - In: Umweltvorsorge Nordsee; Niedersächs. Umweltministerium: 67-73. VAUK, G. & E. SCHREY (1990): Animals as litter victims at the German North Sea coast. - NOAA-TM-NMFS-SWFSC-154: 1193.
Abstract: The OSPAR Pilot Project on Monitoring Marine Beach ran from 2000 to 2006. The results of the project provide a very good overview of marine litter pollution of the north-eastern Atlantic. The results of the project demonstrate that total litter pollution levels in the OSPAR region as a whole have remained stable at a high level during the project period 2000-2006.
Significant increases or decreases in litter levels were not found at the regional level; however, small non-significant increases in the total amount of litter were recorded for the Southern North Sea and the Iberian Sea regions from 2003 onwards.
The analysis of the occurrence of litter items which function as indicators for different sources of litter pollution, indicate that litter pollution originating from fisheries and aquaculture activities increased significantly in the north-eastern Atlantic in the project period. The analysis of the occurrence of indicator items for other sources (”non-operational litter from shipping, fisheries and offshore installations”/“operational litter from shipping and offshore installations”/”sanitary and sewage”/”tourism and recreation”) did not detect any trends over the project period.
With the exception of a significant decrease in the number of large litter items on the 1 km survey sites, no reduction in the number of litter items found on beaches was found in the period 2000-2006.
The proportion of plastic litter items in the total amount of litter found on beaches in the OSPAR-Region is very high, although the disposal of plastic litter from ships has been prohibited worldwide since 1988. Three quarters of the litter items registered during the project were made of plastic. The proportion of plastic litter items in the total amount of all items found on the survey beaches increased significantly during the project period from 68% in 2001 to 78% in 2006.

119
The results of the project show that the sources and magnitude of litter pollution vary greatly between regions within the OSPAR area.
On the whole small plastic and polystyrene items (<50cm) were the most common litter item recorded on the beaches and constituted 28% of the total number of litter items found on the survey beaches. A considerable proportion of the litter items originate from fisheries activities. The second most important litter item found on the survey beaches was small pieces of ropes, cords and nets, which constituted 14 % of the total number of litter items found. • Olaf Hartung, 1992: Weak-point analysis of ships’ garbage disposal (Publisher: Senator for
Ports, Shipping and Export Trades of the Free and Hanseatic City of Bremen) • Studies of the GAUSS (Association on Environmental Protection and Safety in Shipping):
• Optimisation of Waste Disposal of the German Maritime Rescue Service (DGzRS) • Waste Concepts for TRASMED (Waste management system for liners of the
TRASMED shipping company) • Maritime Waste Management (2002/2003 series of courses for ports managers and
shipping companies) • Diploma Thesis of Henning Schulz-Streek, 2001, with regard to ships’ waste disposal
on land. Netherlands: • Fishing for litter project figures (from North Sea Directorate)(Non Scientific) • Summary Anchor area’s (Non Scientific) • Report Anchor area’s • Report harbour porpoises • Marine litter for EcoQo Monitoring in the Netherlands 1982-2005 • Report Texel project (Clean Beach 2005) (Non Scientific) • Fishing for litter (from KIMO NL) (Non Scientific) • Coastwatch 2003-2006 (North Sea Foundation) (Non Scientific) • Data from OSPAR (North Sea Foundation) Spain: There are a few reports containing data about marine litter at sea collected during the Spanish Oceanographic Institute campaigns but there are no publications. UK: • ASH Consulting Group (1995). Beach litter management in Scotland. An assessment of
current procedures and recommendations for best practice. • ENCAMS (2003a). The management of Britains resort beaches. August 2003. • Keep Wales Tidy (2004). Clean Coasts. Progress Report 2002-2004. • Marine Conservation Society and Thames 21 - Aquatic litter in the UK – Recommendations to
the Department of Environment, Food and Rural Affairs for solutions to aquatic litter on UK beaches, rivers and canals.
• Somerville, S., Miller,K., and Mair, J (2003). Assessment of the aesthetic quality of a selection
of beaches in the Firth of Forth, Scotland. Marine Pollution Bulletin 46: 1184-1190. • South West Water (1998). A study of the benefits of a local publicity strategy as part of the
National Bag It and Bin It campaign.
120
• Tang, B (2005). Investigation into the distribution of seabed litter in the Irish Sea. Environment and Heritage Service.
• Thompson, R. and Hoare, C. (1997). Microscopic plastic - A shore thing. Marine Conservation
3 (11). • Thompson, R.C., Olsen Y., Mitchell, R.P., Davis, A., Rowland, S.J., John, A.W.G., McGonigle,
D. & Russell AE (2004) Lost at sea: Where does all the plastic go? Science 304 pp 838.
Microplastics
• Thompson, R., et al. 2004. Lost at Sea: Where Is All the Plastic? SCIENCE. Volume 304, Number 5672, pp 838
• Browne, M., et al. 2007. Microplastic-An Emerging Contaminant of Potential Concern?
University of Plymouth, UK. Integrated Environmental Assessment and Management. Volume 3, Number 4, pp 559-566
• Thompson, R., et al. 2005. New Directions in Plastic Debris. SCIENCE. Letters. Volume
310
• Browne, M., et al. 2008. Ingested Microscopic Plastic Translocates to the Circulatory System if the Mussel, Mytilus edulis (L.) Environmental Science and Technology.
• Teuten, E., et al. 2007. Potential for Plastics to Transport Hydrophobic Contaminants.
Environmental Science and Technology
• Norén, F., 2007. Small Plastic Particles in Coastal Swedish Waters. KIMO International

Bio
dive
rsity
Ser
ies
Marine litter in the North-East Atlantic regionAddendum
2009

Addendum 1 2
Extended executive summary This addendum provides an executive summary of OSPAR (2009) Marine litter in the North-East Atlantic Region: Assessment and priorities for response according to the Guidance on the preparation of JAMP thematic assessments intended to contribute to the Quality Status Report 2010 (Reference number: 2007-3). “Assessment of the Marine Litter Problem in the Northeast Atlantic Maritime Area and Priorities for Response” Marine litter is a problem that affects the entire marine environment. It has been defined as ‘any persistent, manufactured or processed solid material discarded, disposed of or abandoned in the marine and coastal environment. Marine litter consists of items that have been made or used by people and deliberately discarded into the sea or rivers or on beaches; brought indirectly to the sea with rivers, sewage, storm water or winds; or accidentally lost, including material lost at sea in bad weather’ 1. Marine Litter impacts a wide range of marine organisms including birds, mammals, cetaceans and turtles as well as, in the case of microplastics, filter and deposit feeders. Beach cleaning and other remediation measures create high costs in particular for local communities.
The pressure on the marine environment from marine litter remains high
Distribution of Litter on beaches
The highest levels of marine litter on beaches occur in the Greater North Sea Region. During the OPSPAR Pilot Project on Marine Beach Litter Monitoring 600 – 1400 items per 100 m of beach were surveyed in the Northern North Sea and 200 – 600 items per 100 m in the Southern North Sea. In the Celtic Seas levels were also high with 600 – 800 items per 100m. However levels were higher in the south, as shown by the MCS Beachwatch Survey 2007 where 3230 items per km were monitored in the south west of England compared to 1057 items per km in Northern Ireland this represents an increase on previous years.
Marine Litter levels on beaches in the Bay of Biscay and Iberian Coast were much lower with only 100 – 300 items per 100 m. In France anecdotal evidence from local authorities suggests that on average around 30 tonnes of marine litter are collected per km per year. Whilst the Wider Atlantic and Arctic Waters are likely to have the lowest levels, however due to lack of quantitative data for these areas it is not possible to carry out an assessment.
Floating litter and litter on the seabed require more monitoring
Information on amounts of marine litter at sea is limited but the studies that have been undertaken indicate amounts have remained constant but show varied spatial distribution with litter on the seabed varying significantly from 0 to 101 000 pieces of litter per km2, due to topological and tidal differences. In the Greater North Sea the Ecological Quality Objective (EcoQO) on plastic particles in Fulmars’ stomachs indicated a reduction in the amount of litter at sea during the late 1990’s with the average amount of plastic items per bird falling from 0.5 g to 0.3 g. This reduction levelled off around the year 2000 and there has been no downward trend in recent years. In the Bay of Biscay strong seasonal variation was noted with 7 times more litter found on the seabed in winter compared to summer.
Plastic is the predominant type of marine litter
Monitoring, both at the coastline and at sea, has confirmed that the predominant type of marine litter is plastic although the values at sea and on the coastline differed. There was little data for the wider Atlantic and Arctic Waters but on the Greater North Sea coast plastic predominated with the highest level in the north where it made up 80% of items monitored. This value reduced in southern waters with plastic making up 75% of items on the Southern North Sea coast, 70% in the Celtic sea and 62% on the Iberian Coast and Bay
1 http://www.unep.org/regionalseas/marinelitter/about/default.asp

Addendum 1 3
of Biscay. In these southern areas sanitary waste (16%) and paper and cardboard (13%) made up a larger percentage of the total.
In the monitoring of seabed marine litter in the various Fishing for Litter projects the proportion of plastic varied from 55% in the Celtic Seas to 38% in the Greater North Sea. Other items such as metal (23 –13%), rubber (25 – 9%) and wood (10 – 11%) made up a greater proportion of the total number of items compared to marine litter monitored on beaches. This is as expected as many types of plastic float and therefore are concentrated on the surface of the sea and at the coastline whereas heavier items sink to the seabed.
Sources of marine litter show few trends
Identifying sources of marine litter is difficult as many types of items can come from multiple sources. This is demonstrated in the Beachwatch survey, in the UK, where the largest source is non-sourced items at 42% of the total with recreation beach users at 35% and fishing at 14%. The OSPAR Pilot Project on Marine Beach Litter Monitoring identified several indicator items specific to different sources in an attempt to analyse trends. However analysis of the data for the whole of the OSPAR Region showed a consistent picture with no trends in shore based sources such as tourism or sanitary waste. There was also no trend for sea based sources galley waste and shipping, although fishing sources did show an increase from 2001 to 2006.
Microplastics are a cause for concern
One of the emerging issues for marine litter in the Greater North Sea is the discovery of microscopic plastic particles, in the μm to mm size range, in the marine environment at concentrations of 150 – 2400 particles per m3. These have been shown to be widespread and based on plankton records have been increasing in line with the production of synthetic fibres. The impact of this type of pollution on marine organisms is not yet known although several organisms have been shown to ingest the particles, which could potentially cause damage physically or by transport of hazardous substances into the food chain.
Marine litter has an economic impact on a range of sectors
The cost of cleaning marine litter from beaches can be significant with the cost usually falling to local authorities rather than national governments. For example in 2004 UK local authorities, industry and coastal communities spent approximately £14 million (€17.7 million) cleaning up marine litter. In tourist areas these figures are even higher: for example, Den Haag Municipality in the Netherlands (receiving 15 million visitors a year) spends €626 709 (approx £500 450) per year on coastal cleaning. However, the costs are far more significant if the financial impacts other than just cleaning are considered. KIMO estimated, in 2000, that in a worst case scenario the cost to the Shetland community (population 22 000) could be as much as £5.6 million (approx. €7.1 million) per year. In addition to the cost of beach cleaning (local authority and voluntary), this figure included the costs for aquaculture, power generation, farming, fishing, harbours and lifeboat launches.
A voluntary OSPAR Beach Litter Monitoring programme has been established
The OSPAR Pilot Project on Monitoring Marine Beach Litter (2000 – 2006) developed a standardised protocol for measuring and comparing relative amounts of beach litter to be compared across the OSPAR Maritime Area. The protocol also identified indicator items that could be used to analyse trends in specific sources such as tourism and shipping. The development of the Ecological Quality Objective on plastic particles in Fulmars stomachs has helped to understand trends in marine litter at sea.
Measures taken at the international and EU level include the designation of the North Sea as a Special Area for the purpose of Annex V to MARPOL 73/78 and the introduction of the EU Directive on port reception facilities for ship-generated waste and cargo residues 2000/59/EC. Some Contracting Parties have also taken steps to address the marine litter issue nationally through different national programmes and initiatives improving their waste management practices, supporting beach cleanup activities, national litter campaigns,

Addendum 1 4
as well as through the initiation of information, education and public awareness programmes. Fishing for Litter2 projects have also been instigated in several OSPAR countries.
It is clear that despite current initiatives taken to reduce the amount of marine litter in the OSPAR Maritime Area levels have remained consistent and in some cases increased. The results for the OSPAR Pilot Project on Marine Beach Litter Monitoring showed that from 2001 to 2006 there was no statistically significant increase or decrease in the amount of marine beach litter in the North East Atlantic and some national studies, such as Beachwatch in the UK, showed an increase.
Marine litter has significant impacts on a wide range of organisms
It is difficult to accurately assess the overall effect on the quality status of the marine ecosystem given that there is limited data for many of the OSPAR Maritime Areas. However marine litter is ubiquitous in the marine environment and has been shown to impact a wide range of marine organisms. The only quantitative data is from the background study into the EcoQO on plastic particles in Fulmars’ stomachs. Averaged for the whole North Sea, 94% of birds investigated contained plastic; on average 34 pieces and 0.30 gram mass and 55% of all birds exceeded the level of 0.1 gram of plastic in the stomach. This is much higher than the preliminary EcoQO target of 10%. Other anecdotal evidence shows that a wide range of organisms are effected by either entanglement in or ingestion of marine litter including; birds, seals, turtles, porpoises and whales. In addition to the direct impacts, there is evidence that invasive species have also been carried into the Maritime Area by marine litter as in the case of the exotic barnacle species Elminius modestus, which has been found on plastic on the shoreline of the Shetland Islands.
As marine litter is a pressure that affects the whole OPSAR maritime region and given the range of organisms impacted it can be concluded that marine litter is having a significant effect on the marine environment of the North East Atlantic.
More effort is needed to develop measures to stop litter entering the marine environment
When considering measures to reduce marine litter it is important to note that it is a diffuse and widespread problem and action at all levels is required to have any impact on the problem. These should include greater education of seafarers, greater efforts to prosecute those who break existing regulations and the implementation of more practical measure such as Fishing for Litter initiatives. Several areas that OSPAR Contracting Parties should consider addressing are outlined below:
• Implementation of a compulsory Marine Beach Litter Monitoring programme;
• The use of fisheries research vessels to undertake seabed monitoring of marine litter during scientific trawls;
• Identification of national lead agencies to collect and assess marine litter data nationally and report back to OSPAR;
• Promote monitoring programmes and further research on microscopic plastic particles;
• Promote initiatives at the International Maritime Organisation to have marine environmental awareness training included in the STCW Convention;
• Introduction of a harmonised indirect (or even no special) fee system for port reception facilities;
• Development of an OSPAR measure to implement Fishing for Litter projects across the OSPAR Maritime Area;
• Promote enforcement and prosecution of marine litter offences, inter alia through cooperation in the North Sea Network of Investigators and Prosecutors (NSN).
2 OSPAR Commission 2006. Background Report on Fishing-for-litter Activities in the OSPAR Region.

New Court48 Carey StreetLondon WC2A 2JQUnited Kingdom
t: +44 (0)20 7430 5200f: +44 (0)20 7430 5225e: [email protected]
© OSPAR Commission, 2009. Permission may be granted by the publishers for the report to be wholly or partly reproduced in publications provided that the source of the extract is clearly indicated.
© Commission OSPAR, 2009. La reproduction de tout ou partie de ce rapport dans une publication peut être autorisée par l’Editeur, sous réserve que l’origine de l’extrait soit clairement mentionnée.
ISBN 978-1-906840-26-6 Publication Number: 386/2009
OSPAR’s vision is of a clean, healthy and biologically diverse North-East Atlantic used sustainably