marine log transfer facilities - northwest coast energy...
TRANSCRIPT

MARINE LOG TRANSFER FACILITIES AND WOOD WASTE:
WHEN DREDGING IS NOT YOUR FINAL ANSWER J.D. Germano1 and D.G. Browning2
ABSTRACT
The north end of Thorne Bay is on Alaska's Section 303(d) list of impaired waterbodies because of bark and wood residues present on and in sediments. From the mid 1950s until 1997, Thorne Bay was the main site used to store logs destined for the Ketchikan Pulp Company pulp mill at Ward Cove, near Ketchikan. Dive surveys conducted in 1988 and 1990 to assess bark accumulation in the log storage area found approximately 55 acres of bark wastes varying from 6 to 24 inches in thickness. The documentation of bark wastes in these two surveys was the basis for the 303(d) listing of this portion of Thorne Bay as an impaired waterbody.
To support the development of a TMDL for this waterbody, a comprehensive monitoring survey was performed in June, 2005 that included water column profiling; sediment grabs for grain-size, chemistry, and benthic community analyses; diver observations and push probes to determine percent cover of wood waste and the presence of buried logs; and sediment profile imaging combined with underwater plan view photography to measure percent wood waste and assess recolonization and benthic community status. Despite confirmation that bark residues still did exist on the sediment surface (6.4 acres of continuous cover and 21.8 acres of discontinuous cover), there was no sign of ecosystem impairment in any of the multiple lines of evidence investigated, eliminating the need to dredge or cap the sediments. While it is true that substantial amounts of bark or wood waste can have deleterious effects on the marine ecosystem, the results from this study showed that any adverse impacts from the past have long since disappeared due to natural recovery and the normal process of infaunal succession. Keywords: TMDL, 303(d) list, Sediment Profile Imaging
INTRODUCTION
A survey of benthic conditions was conducted in June 2005 at and adjacent to the former log storage facility in Thorne Bay in Southeastern Alaska for the Alaska Department of Environmental Conservation (DEC). To characterize benthic conditions at the Thorne Bay site, the following data were collected:
• Sediment profile images • Plan-view underwater photographs • Benthic infauna • Sediments for conventional chemistry parameters • Diver observations including percent cover of bark and wood residues • Diver push probes to determine the presence of buried logs or wood debris • Diver-collected sediment cores for stratigraphic description • Water column profiles and water collections
A portion of the north end of Thorne Bay is on Alaska’s Section 303(d) list of impaired waterbodies because of bark and wood residues present on and in sediments. These wood residues are thought to be the result of past log storage and transfer operations by Ketchikan Pulp Company. In June 2003 DEC conducted a preliminary survey of bark and wood wastes in the study area using a remote video camera to photograph 98 points over 161 acres of the bottom; seven of these sites were examined in greater detail by dive assessment. Based on the data collected during the 2003 preliminary survey, DEC estimated that approximately 20 acres of northern Thorne Bay bottom sediments
1 President, Germano & Associates, Inc., 12100 SE 46th Place, Bellevue, WA, 98006, USA, (425) 865-0199 (phone),
(425) 865-0699 (fax), [email protected] 2 Senior Scientist, Germano & Associates, Inc., 5541 Keating Road NW, Olympia, WA, 98502, USA, (360) 866-
6806 (phone), (425) 865-0699 (fax), [email protected]

were covered by a continuous cover of aging bark that was estimated to have a thickness of a few inches. The survey also determined that the sediments underlying the bark consisted of a layer of silty, fine-grained sediments, presumably originating from the sediment load discharged by the Thorne River, which was estimated to have a thickness greater than 2 feet (ADEC 2003; Haggitt Consulting 2003).
To support the further development of a Total Maximum Daily Load (TMDL) for the pollutant parameter “Residues” (bark and wood wastes) in northern Thorne Bay, DEC was seeking to: 1) better characterize the areal extent and nature of wood residues currently present in Thorne Bay; 2) determine whether water quality standards are being exceeded in the water column above areas of differing wood residue coverage, and whether the measured parameters can be related to the pollutant loading of wood residues; 3) determine whether the benthic community is impaired through photographic analysis of surface sediments, measurement of selected chemical and physical parameters in sediments, and taxonomic enumeration of benthic organisms, and, if so, whether the impairment can be related to the pollutant loading of wood residues.
Site Description
Thorne Bay is located on the east side of Prince of Wales Island, approximately 45 miles northwest of Ketchikan. The bay is roughly four miles long and irregularly shaped with north and south arms. The Thorne Bay log transfer facility (LTF), presently inactive, sits at the northern end of the bay, with a tidelands bulkhead that formerly held an A-frame crane, and a log transfer and rafting area of a few acres immediately offshore. The former log storage area, site of the present study, is roughly 200 acres, located along the shoreline between the LTF and the community of Thorne Bay. The delta of the Thorne River lies at the southwest corner of the log storage area. The 109 sample points established for the 2005 survey (Figure 1) were selected primarily to provide expanded characterization in areas that were identified in 2003 as having continuous wood debris cover; the total area surveyed in 2005 was approximately 76 acres.
Figure 1. Sediment Profile and Plan View Imaging Stations Surveyed in Thorne Bay, June 2005

Site History
From the mid 1950s until 1997, Thorne Bay was the main site used to store logs destined for the Ketchikan Pulp Company pulp mill at Ward Cove, near Ketchikan. Saw logs went to sawmills at other destinations and to a saw mill that operated in Ward Cove from 1989 through 2000. Logs also were sent to a veneer mill that operated in Ward Cove briefly in 2000-2001. Log storage and transfer activities ceased in Thorne Bay after 2001. A large volume of logs, estimated at 4.5 billion board feet, moved through the Thorne Bay site. Many of the logs harvested on Prince of Wales Island were trucked to the Thorne Bay LTF site, sorted and graded, placed in the water, and formed into rafts. Logs rafted elsewhere were towed into Thorne Bay, removed from the water, sorted and graded, and placed back into rafts. Prior to the mid 1970s, logs apparently were "flat rafted" as single floating logs enclosed within rafts. After that time, logs were cabled into bundles of 10 to 15 logs before placement into water, and remained in bundles until they reached destinations (Figure 2). Bundles prevented single waterlogged logs from sinking. All log rafts were towed to destinations by tug boats.
1
Figu Dive suof log sthicknesufficie The barthe survsedimeremainesedimeCove, a The resbottomstatus, permitsfor the
Area shown in Figure
re 2. Historic Aerial Photo from the Late 1980’s Showing Extent of Log Storage Rafts in Thorne Bay
rveys were conducted in 1988 and 1990 to assess bark accumulation in the log storage area during the time torage activity. Those surveys found approximately 55 acres of bark wastes varying from 6 to 24 inches in ss. Some localized dredging of bottom sediments occurred within Thorne Bay in the mid-1990s to maintain nt water depth to float log bundles.
k survey in 2003 produced unexpected results. Rather than a substantial thickness of bark and wood wastes, ey found a thin layer of small bark pieces floating on the surface of and intermixed with a thick layer of silty
nt. It was assumed that silt discharged by the Thorne River had buried the bark and wood wastes that d at the cessation of log storage activity. The extent of logs and other large wood pieces buried within the
nt was unknown. However, it was known that an estimated 16,000 sunken logs exist on the bottom of Ward nd it was assumed that logs sank in Thorne Bay, as well.
idues standard of the Alaska Water Quality Standards prohibits the deposit of residues in the water, on the , or on shorelines without authorization through a Zone of Deposit (ZOD). Because of its “grandfather” the Thorne Bay log transfer and storage facilities never required or received federal or State discharge or a ZOD authorization. The documentation of bark wastes in the 1988 and 1990 dive surveys was the basis 303(d) listing of this portion of Thorne Bay as an impaired waterbody.
As required by the federal Clean Water Act, U.S. Environmental Protection Agency (EPA) Region 10 and DEC have begun preparing a TMDL for Thorne Bay. The purpose of this survey was to assess the nature and extent of continuous cover by bark and wood wastes in the log storage area, bottom sediments present, buried wood wastes, water quality, and the health of biological communities present compared to identified reference sites, in order to provide a reasonable basis on which to base the TMDL.
MATERIALS AND METHODS
Field Sampling
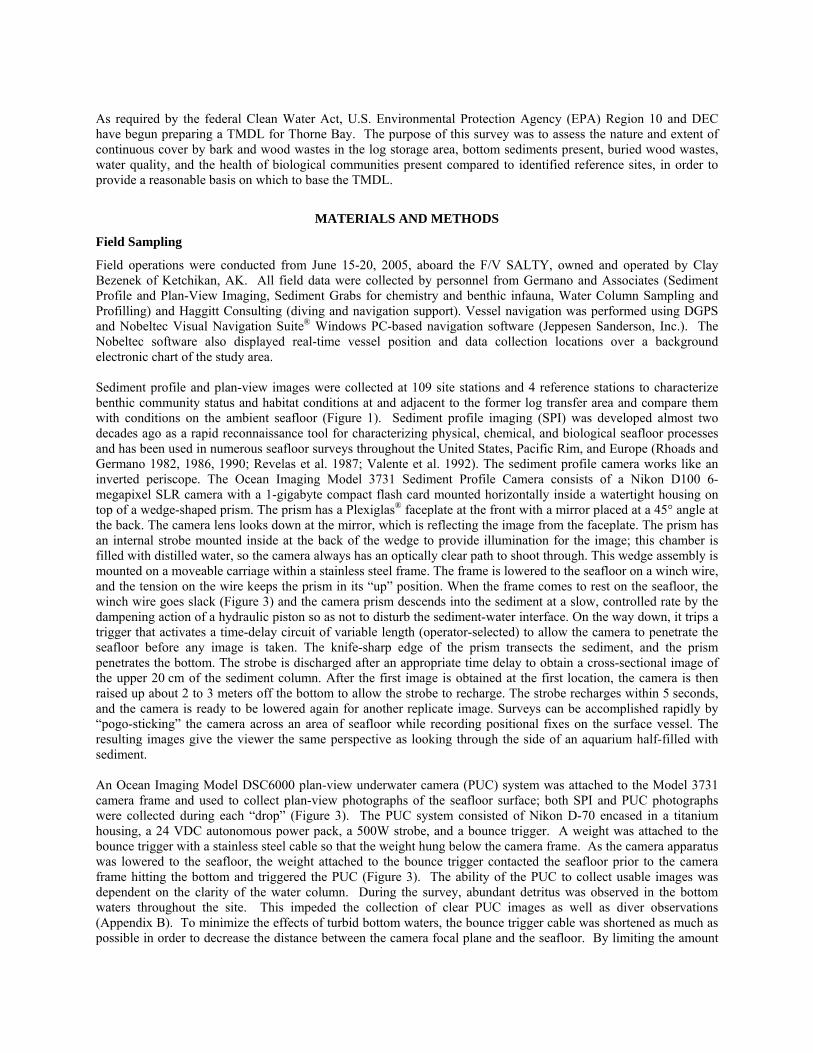
Field operations were conducted from June 15-20, 2005, aboard the F/V SALTY, owned and operated by Clay Bezenek of Ketchikan, AK. All field data were collected by personnel from Germano and Associates (Sediment Profile and Plan-View Imaging, Sediment Grabs for chemistry and benthic infauna, Water Column Sampling and Profilling) and Haggitt Consulting (diving and navigation support). Vessel navigation was performed using DGPS and Nobeltec Visual Navigation Suite® Windows PC-based navigation software (Jeppesen Sanderson, Inc.). The Nobeltec software also displayed real-time vessel position and data collection locations over a background electronic chart of the study area. Sediment profile and plan-view images were collected at 109 site stations and 4 reference stations to characterize benthic community status and habitat conditions at and adjacent to the former log transfer area and compare them with conditions on the ambient seafloor (Figure 1). Sediment profile imaging (SPI) was developed almost two decades ago as a rapid reconnaissance tool for characterizing physical, chemical, and biological seafloor processes and has been used in numerous seafloor surveys throughout the United States, Pacific Rim, and Europe (Rhoads and Germano 1982, 1986, 1990; Revelas et al. 1987; Valente et al. 1992). The sediment profile camera works like an inverted periscope. The Ocean Imaging Model 3731 Sediment Profile Camera consists of a Nikon D100 6-megapixel SLR camera with a 1-gigabyte compact flash card mounted horizontally inside a watertight housing on top of a wedge-shaped prism. The prism has a Plexiglas® faceplate at the front with a mirror placed at a 45° angle at the back. The camera lens looks down at the mirror, which is reflecting the image from the faceplate. The prism has an internal strobe mounted inside at the back of the wedge to provide illumination for the image; this chamber is filled with distilled water, so the camera always has an optically clear path to shoot through. This wedge assembly is mounted on a moveable carriage within a stainless steel frame. The frame is lowered to the seafloor on a winch wire, and the tension on the wire keeps the prism in its “up” position. When the frame comes to rest on the seafloor, the winch wire goes slack (Figure 3) and the camera prism descends into the sediment at a slow, controlled rate by the dampening action of a hydraulic piston so as not to disturb the sediment-water interface. On the way down, it trips a trigger that activates a time-delay circuit of variable length (operator-selected) to allow the camera to penetrate the seafloor before any image is taken. The knife-sharp edge of the prism transects the sediment, and the prism penetrates the bottom. The strobe is discharged after an appropriate time delay to obtain a cross-sectional image of the upper 20 cm of the sediment column. After the first image is obtained at the first location, the camera is then raised up about 2 to 3 meters off the bottom to allow the strobe to recharge. The strobe recharges within 5 seconds, and the camera is ready to be lowered again for another replicate image. Surveys can be accomplished rapidly by “pogo-sticking” the camera across an area of seafloor while recording positional fixes on the surface vessel. The resulting images give the viewer the same perspective as looking through the side of an aquarium half-filled with sediment. An Ocean Imaging Model DSC6000 plan-view underwater camera (PUC) system was attached to the Model 3731 camera frame and used to collect plan-view photographs of the seafloor surface; both SPI and PUC photographs were collected during each “drop” (Figure 3). The PUC system consisted of Nikon D-70 encased in a titanium housing, a 24 VDC autonomous power pack, a 500W strobe, and a bounce trigger. A weight was attached to the bounce trigger with a stainless steel cable so that the weight hung below the camera frame. As the camera apparatus was lowered to the seafloor, the weight attached to the bounce trigger contacted the seafloor prior to the camera frame hitting the bottom and triggered the PUC (Figure 3). The ability of the PUC to collect usable images was dependent on the clarity of the water column. During the survey, abundant detritus was observed in the bottom waters throughout the site. This impeded the collection of clear PUC images as well as diver observations (Appendix B). To minimize the effects of turbid bottom waters, the bounce trigger cable was shortened as much as possible in order to decrease the distance between the camera focal plane and the seafloor. By limiting the amount

of water the camera had to see through, picture clarity was improved. One major drawback to the short trigger cable length and close distance between the PUC and the seafloor was that the field of view of the PUC system was decreased so that a smaller area of the seafloor was photographed. Even with the short trigger cable, many PUC images were not usable due to the highly turbid bottom waters.
Figure 3: Operation of the Combined Sediment Profile and Plan-View Imaging Cameras Twelve site stations were selected for diver observation and intensive analysis in addition to the 4 reference stations (no diver observations were made at reference stations). Sediments were collected from each of these 16 stations. All sediments were collected with a 0.1 m2 stainless-steel vanVeen grab sampler following the protocols outlined in the study design (Tetra Tech 2005). The 12 site stations selected for diver observation, sediment collection, and conventional chemical analyses were chosen based on preliminary review of the SPI and PUC images. Stations were selected based on the apparent wood debris content on and within the sediment column. The 12 stations represented a range of low, medium and high wood residue content. The four reference stations selected from a total of seven potential stations sampled represented sediments with properties similar to site sediments but without the influence of wood debris accumulation attributable to log storage and transfer operations. The 16 stations for sediment sampling and benthic analyses were distributed among the various wood debris classification categories as follows:
• Five stations classified as “Continuous” (Stations 8, 34, 46, 55, and 77); • Three stations classified as “Discontinuous” (Stations 57, 83, and 96); • Eight stations classified as “Trace” (Stations 30, 37, 75, 97, Ref-1, Ref-2, Ref-3, and Ref-4)
For this study, the classes were defined in terms of percentage of coverage by bark and wood debris as follows: “Trace,” less 20 percent; ”Discontinuous,” 20 to 50 percent; “Continuous,” greater than 50 percent to 100 percent. This is a different scheme than used by DEC, which defines continuous cover as 100 percent cover.

Sediment Chemistry and Benthic Infauna Collections
Once the grab sample was brought onboard and determined to be of acceptable quality (minimal disturbance, overlying water), sediments were collected from the top 10 cm of the sediment column. Overlying water was decanted prior to subsampling and descriptions of the sediments were noted in the field log. Subsampled sediment was placed in a stainless steel bowl, homogenized and then packed into pre-cleaned sample jars. Jarred sediments were immediately placed on ice in the field and maintained at 4ºC up to and including delivery to the analytical laboratory. Chain of custody protocols defined in the study design were followed through delivery to the analytical laboratory.
Separate VanVeen grab samples were collected at the same 16 stations for analysis of benthic infauna. Each entire grab sample was sieved through nested 1.0 and 0.5 mm stainless steel sieves. Grab acceptability criteria were identical to those used for sediment chemistry collections. The combined fractions retained on the 1 and 0.5 mm sieves were placed in jars and immediately preserved using buffered formaldehyde that was brought to a 10 percent solution with the addition of filtered seawater. All seawater used to sieve the sample was filtered. Each benthic infaunal sample jar was labeled externally and internally. Samples were submitted to the analytical laboratory in good condition and transferred to a 70 percent ethyl/isopropyl alcohol solution prior to sorting and identification. Sample volume ranged from 2 to 8 liters. The sieved material was predominantly small bark and wood fragments, with varying minor amounts of shell, small rocks and sand greater than 0.5 mm in addition to the infaunal organisms. Water Column Profiling
Water column measurements were made using a Horiba U-22 water quality probe at the same 16 stations (12 site stations, 4 reference stations) sampled for sediment chemistry and benthic infauna. Measurements of temperature, salinity, turbidity and dissolved oxygen were made at 1-meter intervals over the entire depth range at each station sampled. All measurements were noted in the field log. The Horiba U-22 was calibrated prior to the field survey. In addition to the water column profiles, water samples were collected at each of the 16 stations 1 m above the seafloor and 1 m below the sea surface with a 2.5 L Niskin bottle. Once collected, water samples were carefully poured into a 300 mL BOD bottle so that no air or oxygen was entrained, fixed with manganous sulfate and alkaline iodide-azide reagent, and then stoppered for onboard Winkler titrations. Titrations for dissolved oxygen content were conducted using a Hach model 16900 digital titrator and a 0.2M sodium thiosulfate solution. Prior to titration, sulfamic acid was added to the fixed solution and an aliquot of sample was decanted into a beaker. At nine stations, a 100 mL aliquot was used for the titration; however, to conserve sodium thiosulfate solution because of the very high dissolved oxygen levels encountered (more dissolved oxygen in the sample equates to larger volumes of sodium thiosulfate being consumed), a 50 mL aliquot was used for 7 of 16 stations. Analytical Methods
Sediment profile images were analyzed from this survey using Sigma Scan® software (Aspire Software International). Calibration information was determined by measuring 1-cm gradations from the Kodak® Color Separation Guide (Publication No. Q-13) photographed in the field through the profile camera. This calibration information was applied to all SPI images analyzed. Linear and area measurements were recorded as number of pixels and converted to scientific units using the calibration information. Details on the type of measurements made from sediment profile images can be found in Rhoads and Germano (1982, 1986). Plan-view underwater camera (PUC) images were converted from Nikon Exchange Format (*.nef ) to Joint Photographic Experts Group (*.jpg) format prior to analysis. A photograph of the Kodak® Color Separation Guide (Publication No. Q-13) was taken on deck with the PUC at the final trigger wire length setting, and the imaged scale on this card was used to calibrate the area represented in the plan-view images. The plan view images were analyzed for percent cover of wood residues. Percent cover was determined by comparing the observed wood particles at the sediment-water interface to the same standard petrographic estimators used to estimate wood content in SPI images (Browning 2004). Additional information such as physical process, sediment topography, and the presence of epifauna was also noted during analysis.

Sediment Chemistry Analysis
Conventional chemistry analyses were conducted in accordance with the study design (Tetra Tech 2005). All laboratory analyses were conducted by Columbia Analytical Systems (CAS) of Kelso, WA. Conventional sediment chemistry measurements included total organic carbon (TOC), total volatile solids (TVS), total solids (TS), biological oxygen demand (BOD) and chemical oxygen demand (COD). Sediments were also analyzed for particle size distribution; all samples were analyzed within required holding times. Benthic Infaunal Analysis
The benthic samples were re-inventoried and checked against chain-of-custody forms upon arrival at Marine Taxonomic Services. When a sample consisted of multiple containers, all containers were located and processed as a group. The samples were re-screened from formalin to 70 percent ethanol by repeated washing over a 500 micron (0.5 mm) sieve. All material retained on the sieve was returned to the originally labeled jar and preserved with 70 percent ethanol. Standard and accepted techniques were used for sorting organisms from the sediments. Small fractions of a sample were placed in a petri dish under a 10 power magnification dissecting microscope. The petri dish was scanned systematically and all organisms and fragments were removed using forceps. Each petri dish was sorted at least twice to ensure removal of all organisms. Sorted organisms were placed in a vial containing 70 percent ethanol prior to taxonomic identification and enumeration. Sorted benthic organisms were counted and identified to two taxonomic levels: the first was to major taxonomic group and the second was to the lowest practical taxonomic level (usually species). If animal fragments were present, only anterior portions were counted. Identifications were performed by regional taxonomic experts using stereo dissecting and high-power compound microscopes. Taxonomic checks were performed by comparing any questionable or unusual organisms to reference collection specimens previously archived. Five percent of the samples identified were also sent out for external verification, and a voucher collection was prepared for this project. The final benthic identifications and counts were entered into Excel® spreadsheets.
RESULTS
Diver Survey Results
A summary of the diver observations is presented in Table 1: Table 1. Diver Observations, Thorne Bay Survey, June 2005
Station
Estimated % surface wood cover
Bark cover thickness (inches)
Average probe depth to next horizon (inches)
3A-P-8 50 2 34.8
4B-P-30 80 6 27.0
5A-P-34 Trace <1 42.4
5A-P-37 50 3 30.4
5B-P-46 100 2 29.8
5B-P-55 20 <1 25.0
6A-P-57 0 0 36.4
7A-P-75 0 0 51.6
7B-P-77 100 3 30.0
8A-P-83 0 0 51.2
9B-P-96 80 4 9.6
9B-P-97 30 2 9.2

Sediment Profile Image Results
Sediment Grain-Size
Surface sediments in the survey area were primarily silts and clays (>4 Φ; <0.063 mm major mode) with varying proportions of fine to medium sand mixed within the silt/clay matrix. In addition to typical lithic and clastic sediment particles, allochthonous particles such as wood, bark, and leaves along with authigenic biological particles such as shells were present within the sediment column at many stations. The distribution of sediment grain-size major modes from SPI images at site and reference stations is shown in Figure 4. It is important to note that wood residues were not considered when estimating grain-size major-mode. For example, if a station consisted of large wood particles in a silt/clay matrix, the grain-size major mode would be reported as >4 Φ, or silt/clays.
Figure 4: Sediment Grain-Size Major Mode (phi units)
Eighty-three percent of the site stations were composed of sediments with a >4 Φ major-mode particle size. The northeast and eastern portions of the survey area, designated Area 1, were almost exclusively composed of silt/clays (94 percent of the stations). Small amounts of sand were present in nearly all stations. Although the base substratum remained consistent, the amount of wood and shell particles in the sediment column varied. In addition to the amount of wood and shell fragments varying, the distribution or location of these particles within the sediment column was also variable. The other notable characteristic of stations in Area 1 was that they often had a mantling of recently deposited detritus at the sediment-water interface (Figure 5).

Figure 5: These two profile images from Area 1 show a thick coating of settled detritus at the sediment-water
interface (Scale: width of each image = 14.6 cm)
The southwestern portion of the survey area, designated Area 2, consisted of a much more variable bottom, with gravels and sands present in association with silts and clays. Of the 22 stations in Area 2, only 9 stations (41 percent) had a >4 Φ major mode throughout the entire sediment column. The coarse-grained sands and gravels in Area 2 transitioned to sands and silt/clays (Figure 6). The range of particle sizes as well as the syntactical relationship between stations strongly indicate that this portion of Area 2 was dominated by physical processes, presumably due to fluvial transport from the Thorne River, in some combination with tidal circulation and wind-generated waves. There were also stations in Area 2 that exhibited accumulations of wood particles. However, wood particles in Area 2 appeared to be primarily small sticks, twigs, leaves, and needles deposited by the river, rather than bark fragments associated with log storage and transfer operations. The sediments at three of the four reference stations were predominantly a silt and clay substratum; Reference Stations 1-3 were composed of silts and clays with small amounts of very fine-grained wood, leaves or conifer needle particles (1-5 percent). Reference Station 4 was composed dominantly of 4-3 Φ sediments (very fine sands) with a high proportion of silts and clays admixed with the sands and similar amounts of wood particles. Wood Residue Distribution and Content
To assess the amount and distribution of wood residues, the in-situ volume of wood residues within the sediment column was estimated by comparing observed wood particles in the SPI images to standard petrographic comparators (Browning 2004). In addition to the volume of wood residues in the sediment column, the maximum depth at which wood particles were present was measured, along with whether the wood particles were present as a distinct layer or whether they were admixed within the sediment column. The maximum depth of wood particles in the sediment column is presented in Figure 6 along with the location and form of wood residues in the sediment column. Wood residues were present in the sediment column in numerous forms including bark fragments, wood chips and fragments, wood fibers, sticks and limbs, logs, deciduous leaves, and conifer needles. Wood components were

primarily small fragments and particles measured in millimeters, with occasional bark pieces or sticks measuring anywhere from five to forty centimeters in length. Occasional limbs appeared in plan-view photos. No logs were seen on the sediment surface, but one log was detected at Station 5B-P-55 through the diver's probe. The location of wood particles within the sediment column also varied, with some stations having wood particles distributed throughout the sediment column and other stations having wood particles present only in the upper portion of the sediment column or at the sediment-water interface.
Figure 6: Distribution of depth and form of wood debris in Thorne Bay
Overall, 75 percent of stations exhibited wood particle content of 0 to 15 percent within the sediment column. Two groups of stations had higher wood residue contents. A group of stations in the far northeastern corner of Area 1 exhibited wood particle content of 15-30 percent, and one station contained 30-40 percent. A group in the southwestern portion of Area 2 exhibited wood particle content of 15-30 percent; three stations contained 50-100 percent (Figure 6). Depth of the Mean Apparent Redox Potential Discontinuity(RPD)
The depth of the apparent RPD across the survey area was generally substantial, with the vast majority of measured RPD values being greater than 3 cm. Area 1 is dominated by RPD depths in excess of 3 cm thickness (93 percent of the stations), with 65 percent of those stations having RPD depths in excess of 4 cm. Only two stations in the entire survey exhibited RPD depths less than 1 cm in thickness (Stations 9B-P-94 and 9B-P-99). The relatively thick surface layer of oxidized sediment in this area is due to a combination of many factors, including abundant detrital

sedimentation (providing a ready source of available food for infauna), intense subsurface biological activity, and well-oxygenated overlying water with good tidal circulation, as well as some artifacts in the RPD measurements because of sampling-related disturbance associated with wood particles. In the southwestern region of the survey (Area 2), 12 of the 22 stations (55 percent) had mean apparent RPD depths greater than 3 cm, with 5 stations having RPD values greater 4 cm; no stations had RPD depths less than 1 cm in this area. All of the reference stations exhibited RPD depths greater than 3 cm, with three of the four reference stations having RPD values in excess of 4 cm. Infaunal Successional Stage
The surveyed area was dominated by mature, Stage III assemblages (Rhoads and Germano, 1982), with secondary succession of both Stage I and Stage II taxa present. The vast majority of stations within the east and northeastern Area 1 showed evidence of Stage III fauna (72 percent of the stations). Of the remaining stations, 17 percent were characterized by Stage II assemblages transitioning to Stage III seres, and another 6 percent showed evidence of well-developed Stage II assemblages. Only one station (9B-P-94) showed evidence of opportunistic Stage I fauna exclusively. Clearly, the benthic infaunal community in this portion of the survey area appeared quite robust given the frequency of mature successional assemblages across Area 1. In Area 2, half of the stations exhibited evidence of Stage III fauna, also in association with either Stage I or Stage II taxa, and 23 percent of the stations showed Stage II seres transitioning into a Stage III community (indicated as Stage II→III in Figure 18). Only one station in Area 2 exhibited an exclusively Stage I community (Station 7B-P-77). This station was dominated by accumulations of wood particles at the sediment-water interface. In the far western portion of Area 2, the infaunal successional stage could not be determined from the sediment profile images; at four of these five stations, the sediments were coarse sands and gravels (minimal prism penetration and no successional model is available for these kind of sediments). At the fifth station (5A-P-33), the accumulation of wood particles obscured the sediment, thus precluding the determination of an infaunal successional stage. All of the reference stations showed evidence of Stage III fauna, with either well-developed Stage III communities or Stage II seres transitioning to Stage III assemblages. Plan View Underwater Camera
Plan-view underwater camera (PUC) images were also analyzed for the percentage of the sediment surface covered by wood residues. Similar to the results from the SPI images, PUC results were categorized into trace cover (0-20 percent), discontinuous cover (20-50 percent) and continuous cover (>50 percent). The wood residues distributed throughout the northeastern portion of Area 1 were typically wood and bark fragments interspersed with some wood fibers. Wood residues in Area 2 consisted of fragments of wood, sticks, branches, conifer needles and leaves (Figure 7). In addition, the wood residues were free of the detritus-mantling observed in Area 1 and also were colonized by epizoans and/or algae. Many of the wood particles such as conifer needles and sticks do not appear to be associated with log rafting and storage activities, but instead represent natural deposition of woody materials carried into the bay by either land run-off or through Thorne River fluvial processes. In terms of the distribution of the percent cover data in Area 1, 5 percent of the stations exhibited continuous cover, 33 percent of the stations had discontinuous cover, and 46 percent of the stations exhibited trace cover. No stations in Area 1 showed 100 percent cover. At 14 of the 87 stations (16 percent) in Area 1, the percent cover could not be determined because of the highly turbid bottom waters. All of the stations that showed continuous cover were located in the northeastern corner of Area 1, in the vicinity of the most frequently-used portion of the former log storage area. This area also had the highest proportion of stations exhibiting discontinuous cover in Area 1. Away from the northeastern corner of Area 1, most stations had only a trace cover of wood residues. In Area 2, there was no systematic distribution of stations that showed continuous, discontinuous, or trace cover of wood residues. In terms of frequency, 23 percent of the Area 2 stations exhibited continuous cover, 27 percent of the stations had discontinuous cover, and 50 percent of the stations showed only a trace cover of wood residues. Two stations exhibited 100 percent cover in one of the two plan-view images. There were no stations within Area 2 where wood residue cover designations could not be determined due to turbid water conditions. Very little detritus

was encountered in Area 2 relative to Area 1, and this likely contributed to the better visibility (less turbid waters) encountered in Area 2.
Figure 7: This plan-view image from Area 2 shows a mixture of wood fragments, sticks, needles and leaves.
Scale of image = 33 cm by 50 cm (0.165 square meters).
All four of the reference stations had only trace amounts of wood residue at the sediment-water interface. The reference stations were selected to represent sediment types similar to site sediments without significant influence from wood residues. Water Column Profiling Results
Water column conductivity, dissolved oxygen, salinity, total dissolved solids, temperature and turbidity were measured at 1-meter depth intervals at the same 16 stations sampled for sediment chemistry and benthic infauna. The water quality parameter of primary concern in Thorne Bay was dissolved oxygen. Dissolved oxygen in bottom waters can be reduced through the decomposition of accumulated organic matter, including wood residues, and depleted dissolved oxygen can have significant impact on aquatic life and benthic organisms. Dissolved oxygen at all stations and depths sampled in Thorne Bay were well above the state water quality standard of 5 mg/L. Most measurements indicated dissolved oxygen concentrations between 10 mg/L and 12 mg/L with several readings greater than 12 mg/L. The levels of dissolved oxygen and other measured parameters at site stations were comparable to those at the four reference stations. Benthic Infaunal Results
A total of 4,086 individuals from 188 species was counted and identified from the 16 stations sampled in Thorne Bay; the animals were distributed among 3 major phyla: Annelida (67 percent), Mollusca (20 percent), and Arthropoda (9 percent), with the remaining 4 percent of the fauna belonging to miscellaneous taxa. The complete species list and abundance counts per grab are summarized in Table 2. The number of species needed to achieve 90 percent of the total abundance was 75; these “numerically dominant” species were used in the subsequent analyses. The most common species found throughout the site was the polychaete Nepthys cornuta; it was found at every station and comprised 12 percent of the total abundance, with an average density of 24 for site stations and 46 for reference stations. Except for this Stage III polychaete, no other

Table 2. Summary of taxa recorded in the 16 grab stations in Thorne Bay
Phylum Total Number of Species
Identified Total Number of
Individuals Recorded
Annelida 107 2,752
Arthropoda 31 365
Mollusca 39 801
Miscellaneous 11 168
Total 188 4,086
taxon accounted for more than 4 percent of the total abundance. Total faunal densities per square meter at all stations ranged from approximately 1,200 to 4,200 individuals; the ranges for both the abundance and diversity of the faunal assemblages sampled at all 16 stations are typical for benthic communities that have recovered from organic loading stress and are at the tail end (Stage III) of the successional continuum (Figure 8).
Figure 8: Soft-bottom benthic community response to disturbance (top panel) or organic enrichment (bottom
panel). From Rhoads and Germano, 1982. Polychaetes were the most abundant class present in all the samples and were the dominant species at all stations with the exception of Reference-4, where the mollusk Parvilucina tenuisculpta was the numerically dominant individual. The average polychaete abundance was 159 for the site stations and 211 for the reference stations. The average mollusk abundance, on the other hand, was only 24 for the site stations and 128 for the reference stations.

The three most abundant mollusk species at the reference stations were: Axinopsida serricata (average 34/station), Parvilucina tenuisculpta (average 31/station), and Ennucula tenuis (average 17/station). Crustaceans averaged 21 individuals per site station sample and 28 for reference stations; the remaining miscellaneous taxa were dominated by indeterminate species of nematodes and nemerteans. Non-metric Multi-dimensional Scaling (N-MDS)
Results of the N-MDS analysis for 75 dominant species (comprising 90 percent of total abundance) are shown in Figure 9. This is simply a different way of portraying the distance relationships shown in the dendrograms from the cluster analysis. The DEC regulatory classifications for the amount of bark cover do not necessarily explain why the stations have clustered in the patterns shown. An N-MDS analysis that included conventional variables BOD, COD and TVS resulted in very little change in the ordination pattern displayed in Figure 9. The only real differences when these conventional variables were added were:
• Stations 3A-P-8 and 5B-P-55 were more extreme on the negative end of the MDS2 axis, because they had higher TVS (which was strongly correlated with TOC).
• Stations 3A-P-8 and 5B-P-46 were less extreme on the positive end of the MDS1 axis; the basic
relationship among all the stations stayed unchanged.
Figure 9: Scatterplot for the non-metric MDS based on Bray-Curtis distance metric on fourth-root
transformed abundance data for the 75 numerically dominant species (comprising 90% total abundance). Station labels are shown, and stations are linked based on their DEC regulatory classification. The centroid
for each DEC classification group is the average MDS value for stations in that group.

CONCLUSIONS
Up until this survey, diver observations had been the standard method employed by DEC for both measuring the amount of wood waste in Alaskan coastal waters and assessing impacts. The results from the SPI and Plan-View cameras allowed a greater area of bottom to be surveyed with much more accurate measurements of wood waste volume and percent surface cover than diver visual estimates. The survey results showed few areas where wood residue cover was considered to be continuous (the far northeastern section of Area 1 and in isolated areas in Area 2). The total estimated area of wood waste cover from the plan-view images in Thorne Bay was calculated (Table 3):
Table 3: Area of Thorne Bay Sediments Covered, DEC Classification Continuous Discontinuous Trace Indeterminate
m² Acres m² Acres m² Acres m² Acres
Area 1 11,752 2.9 75,634 18.7 128,420 31.7 24,979 6.2
Area 2 13,149 3.2 14,811 3.7 36,816 9.1 2,425 0.6
TOTAL 24,901 6.2 90,445 22.3 165,235 40.8 27,405 6.8
The thickness of the wood residue cover was variable throughout the Area 1 survey region. Many stations that did not exhibit continuous cover at the sediment surface did show the presence of an intact or diffuse layer of wood residues either at the sediment-water interface or in the upper portion of the sediment column. Although a layer of wood residues was discernible, it is important to note that with the exception of Stations 5A-P-33, 5B-P-46, and 7B-P-77, the wood residue layer was mixed with sediment and did not act as a barrier to burrowing infaunal organisms.
The nature of the wood residues was quite different between Area 1 and Area 2. Wood residues in Area 1 were dominantly small bark and wood fragments, consistent with the historical use of the northeastern portion of the survey area as a log storage facility. Furthermore, the wood residues found within Area 1 were often covered with a layer of detritus or seston. The detrital covering indicated that the wood particles had been deposited for a period of time and were being slowly covered by subsequent sedimentation. The wood residues found in Area 2 consisted of small fragments of wood, sticks, conifer needles, and leaves. The wood residues in Area 2 appeared to be the result of natural run-off/deposition from the Thorne River and surrounding forest, based on the high proportion of twigs, sticks, needles, and leaves mixed with the other wood fragments. Also, the wood residues at Area 2 were present as surface deposits and were not admixed in the sediment column to the extent Area 1 residues were. Depositional and hydrodynamic processes appear to be very different in Area 2 relative to Area 1. In Area 2, the sediments showed a range of particle sizes in SPI images, from gravels to fine silts and clays. The gravels were observed at the stations closest to Thorne River and transition to sands, then sands over mud, and finally silts and clays at the outermost stations. The transition of particle size in Area 2, from coarsest sediment near the mouth of the Thorne River to fine grained sediments distal from the mouth was consistent with deltaic sedimentation patterns. As hydrodynamic forces decrease (presumably to variations in fluvial flow), the ability of the fluid to carry or transport large particles decreases, which is the likely cause of the depositional pattern observed in Area 2. Another important feature of sediments and wood residues observed in Area 2 was the lack or scarcity of a detrital mantling at the sediment-water interface. A great deal of the detritus observed at the Area 1 stations appeared to be planktonic seston. For the detritus to be absent or scarce in Area 2, either primary productivity was much reduced in Area 2 relative to Area 1 (highly unlikely) or the detritus was transported elsewhere by hydrodynamic forces (likely). Lastly, the depositional regime observed in Area 2 in concert with the types of wood residues observed in Area 2 strongly suggested that the primary origin of wood residues in Area 2 is from natural sedimentation from the Thorne River, which may or may not have been supplemented with minor amounts of wood residue from historical log rafting and transfer activity within Thorne Bay.
There were several notable features of the sediment chemistry results; the TOC values (ranging from 4.4 – 12.5 percent) were elevated compared to what is considered normal for marine sediments. Average concentrations for marine shelf sediments are between 1.5 and 2 percent (Tyson and Pearson 1991), and any amount over 4 percent is considered enriched (Purdy 1964). Recent studies on sediment organic carbon content as an indicator of stress in marine communities have shown that community effects are usually seen at concentrations above 3.5 percent

(Hyland et al. 2005), except when organic carbon is in a refractory form (commonly the case with wood residue) or when there are other mitigating factors (good circulation and high dissolved oxygen concentrations in the water column). All of these mitigating factors were present in Thorne Bay; the benthic community did not show signs of adverse stress, and the corroborating evidence from the sediment profile images (deep RPD, mature successional communities) supported this argument. The three northeastern stations in Area 1 in the former log storage area show the most influence of wood residue on the sediment properties of TVS, COD, and TOC. However, given the surrounding landscape, the embayment is naturally affected by wood residue from nonpoint source runoff from the surrounding forest. While the mean values of the conventional chemistry parameters at the reference stations were good representations of what “background values” should be for these parameters in fine-grained sediments in upper Thorne Bay, one could argue that the TOC values were still elevated (4.7 – 8 percent), and it is notable that the highest BOD concentration was found at Reference Station 4 (13,600 mg/kg). Ultimately, these data, in conjunction with the water quality data collected during the survey could be used to support the calculation of a TMDL for Thorne Bay. An important feature to note in conjunction with the conventional chemistry data is that although COD and BOD values were high throughout the bay, there was no evidence of low dissolved oxygen in the benthic boundary layer or anoxic, reduced sediment at the sediment-water interface. This was one of the most important findings from the survey; combined with the water column profiles and dissolved oxygen measurements, it demonstrated that the supply of oxygenated water in the water column was much greater than the sediment-oxygen demand, allowing an extremely healthy benthic community to exist throughout the entire area surveyed. Compared to other sites in Alaska (those affected with and without wood waste), the benthic community results from Thorne Bay reflected the high degree of recovery and overall health of the benthic ecosystem in this embayment (Table 4). Direct comparisons are somewhat difficult due to differences in sampler size, processing method, and time of year when the samples were collected.
Table 4. Comparable Benthic Studies in Alaska
Study Location Size of grab
used (m²) Sieve
Size (mm)Abundance
Range (#/m²)# of
Stations Species Richness
(per grab) Time of Study
Thorne Bay 0.1 0.5 1,200–4,200 16 35–79 June 2005
Sitka (APC) 0.1 1.0 20–2,660 37 NA* August 2000
Ward Cove (KPC)
0.06 1.0 200–16,000 47 3–27 July 2004
Ward Cove (KPC)
0.1 1.0 510–14,500 7 2–43 January 1992
Port Valdez 0.1 1.0 60–1,200 55 11–28 December 1971
*NA – benthos identified to family level only While the sieve size used in the Thorne Bay study was smaller than those used in the others presented in Table 4 (affecting both abundance and species counts), the striking difference in the Thorne Bay study is the high species richness, characteristic of mature benthic communities in low-disturbance regimes (Rhoads and Germano, 1982, 1986). This is still true even if we cut the number in half to conservatively estimate the effect of the smaller sieve size. The overall mean abundance recorded from the Thorne Bay survey is comparable to data collected from other southeast Alaskan embayments with and without wood waste from which significant amounts of chemical contamination were absent. Benthic community assessments were conducted in Sitka, Alaska, in 2000 (EVS 2001) as well as Ward Cove, Alaska, in both 2004 and 1992 to assess the environmental impacts of organic enrichment of wood waste from the Ketchikan Pulp Company (Exponent 2005; EVS 1992). The Ward Cove surveys found stations in the shallow water depths that were not capped (natural recovery areas) to be organically enriched with TOC concentrations ranging

from 7 to 24 percent in 2004 (including reference stations; Exponent 2005) and 14 to 37 percent (EVS 1992). Total abundance values ranged from 200 to over 10,000 animals per m2, with the high abundance counts found at those stations in the early stages of recovery and occupied by dense assemblages of the opportunistic polychaete, Capitella capitata. At these stations, molluscs and arthropods were rare; polychaetes and nematodes were the dominant taxa. The Sitka survey also had organically enriched sediments with TOC concentrations ranging from 5 to 32 percent; while comparable species richness figures were not available (organisms were only identified to family), the benthic population densities ranged from 20 to 2,660 animals per m2. Various parts of the areas surveyed were in different stages of recovery; 16 percent of the area of concern was fully recovered (Stage III community), 22 percent was in transition (Stage II), and the remaining area was still in the very early stages of recovery (Stage I). It is important to note that the nature and quality of the wood waste in Ward Cove and Sitka are very different than that found in Thorne Bay. These other areas are affected mainly by pulp residues discharged from mill operations in addition to bark/wood debris from log rafting, while the wood residues in Thorne Bay are largely bark/wood debris from log rafting in Area 1 and natural riverine wood debris in Area 2. The relationship of organic loading on benthic community recovery is shown in Figure 10; as can be seen in this figure, the community in Thorne Bay is in a
Figure 10: The relationship of benthic community abundance and species richness with organic loading rate
and infaunal successional stages; note the range in status for the Thorne Bay benthic community as compared with those found at wood waste sites in Sitka (Sawmill Cove) and Ketchikan (Ward Cove).

distinctly different position on the recovery scale than those found at other wood waste sites in Ward and Sawmill Coves. A series of exploratory data analyses also were performed to investigate the relationships between measured sediment parameters and the relationship between bark coverage designations (both in plan-view and cross-sectional images) and benthic infaunal successional status. Because the benthic community throughout the site was extremely healthy and no gradients of stress impacts were detected (regardless of the amount of wood residues detected), there were no apparent relationships between any of the wood waste measurements (on either the sediment surface or in the cross-sectional images) that could be related to benthic community status in either the grab samples or the sediment profile images. While the north end of Thorne Bay had been placed on Alaska’s 303(d) list as an impaired waterbody because of the presence of bark residues, there was not a single line of evidence of the multiple ones (sediment, infaunal community, or water column) investigated during the course of this study that showed any adverse impacts. While it is true that substantial amounts of bark or wood waste can have deleterious effects on the marine ecosystem (e.g., Pearson 1972; Conlan and Ellis 1979; Kurau 1975; Freese et al. 1988), it was also clear from the results found in this study that any adverse impacts from the past have long since disappeared due to sediment accumulation, decomposition of bark/wood residues, and the normal process of natural recovery and infaunal succession (Figure 8). The benthic community at the majority of the stations sampled was characterized by late-stage successional taxa that were actively bioturbating the sediments. Dissolved oxygen concentrations were at or near saturation at all stations, and there was no evidence of high SOD at any of the stations related to the presence of wood debris. Given the landscape ecology of this region of the state, there will always be a detectable amount of wood residue, leaves, bark, conifer needles, etc. on the seafloor from natural runoff in coastal areas; while the historical accumulations of bark residue in Thorne Bay that were the result of anthropogenic activities may have caused biological or ecological resource impairment in the past, the effects of any remaining wood deposits from these historical activities have merged with those from natural source inputs and become part of the normal substratum in this extremely healthy coastal embayment. As a result of these findings, DEC is currently in the process of removing Thorne Bay from the 303(d) list.
REFERENCES
ADEC (Alaska Department of Environmental Conservation). (2003). “Field Report, Thorne Bay Bark Survey.” June 18-20, 2003.
Browning, D.G. (2004). “A SPI-based technique for determining wood waste volumes in marine sediments.”
Presentation made at Sediment Profile Imagery Colloquium of Experts, University of Galway, April 5-7, 2004. Conlan, K.E. and D.V. Ellis. (1979). “Effects of wood waste on sandbed benthos.” Marine Pollution Bulletin
10:262-267. EVS. (1992). “Preliminary Environmental Assessment of Ward Cove.” Report to Ketchikan Pulp Company,
September 1992. EVS Environment Consultants, Seattle, WA. EVS. (2001). “Silver Bay Baseline Environmental Monitoring.” Report to City and Borough of Sitka, Alaska,
February, 2001. EVS Environment Consultants, Seattle, WA. Exponent. (2005). “2004 Monitoring Report for Sediment Remediation in Ward Cove, Alaska.” Submitted to
Ketchikan Pulp Company, Ketchikan, AK. 100 pp. Exponent, Inc., Bellevue, WA. Freese, J. L., R.P. Stone, and C.E. O’Clair. (1988). “Factors affecting benthic deposition of bark debris at log
transfer facilities in southeastern Alaska: A short-term retrospective evaluation.” National Marine Fisheries Service, Alaska Region, NOAA Technical Memorandum NMFS F/NWC-136, Juneau, AK.

Haggitt Consulting. (2003). “2003 bark monitoring survey report: Thorne Bay log storage area.” Prepared for Alaska Department of Environmental Conservation. Haggitt Consulting, GigHarbor, WA.
Hyland, J., L. Balthis, I. Karakassis, P. Magni, A. Petrov, J. Shine, O. Vestergaard, and R. Warwick. (2005).
“Organic carbon content of sediments as an indicator of stress in the marine benthos.” Marine Ecology Progress Series 295: 91-103.
Kurau, J. (1975). “Water transport of wood: the current situation.” Report No. EPS3-WP-75-3. Environmental
Protection Service, Water Pollution Control Directorate, Ottawa, Ontario. 72 pp.
Pearson, T. H. (1972). “The effects of industrial effluent from pulp and paper mills on the marine benthic environment.” Proceedings of the Royal Society of London 180: 469-485.
Purdy, M. (1964). “Sediments as substrates”, pp 238-271 In: J. Imbrie and N. Newell (eds). Approaches to Paleoecology. John Wiley & Sons, New York, NY. 432 pp.
Revelas, E.C., J.D. Germano, and D.C. Rhoads. (1987). REMOTS reconnaissance of benthic environments. pp. 2069-2083. In: Coastal Zone ‘87 Proceedings, ASCE, WW Division, May 26-29, Seattle, WA.
Rhoads, D.C. and J.D. Germano. (1982). “Characterization of benthic processes using sediment profile imaging:
An efficient method of remote ecological monitoring of the seafloor (REMOTS™ System).” Marine Ecology Progress Series 8:115-128.
Rhoads, D.C. and J.D. Germano. (1986). “Interpreting long-term changes in benthic community structure: A new
protocol.” Hydrobiologia 142:291-308. Rhoads, D.C. and J.D. Germano. (1990). “The use of REMOTS® imaging technology for disposal site selection
and monitoring.” pp. 50-64. In: Geotechnical Engineering of Ocean Waste Disposal, K. Demars and R. Chaney (eds). ASTM Symposium Volume, January, 1989. Orlando, FL.
Tetra Tech. (2005). “Final Project Study Design: 2005 Thorne Bay Bark and Benthic Assessment.” Prepared for
Alaska Department of Environmental Conservation, Juneau, AK. June, 2005. Tyson, R. V. and T. H. Pearson. (1991). “Modern and ancient continental shelf anoxia: An overview”, pp 1-24 In:
R.V. Tyson and T.H. Pearson (eds). Modern and Ancient Continental Shelf Anoxia. Geological Society of London Special Publication #58. 470 pp.
Valente, R.M., D.C. Rhoads, J.D. Germano, and V.J. Cabelli. (1992). “Mapping of benthic enrichment patterns in Narragansett Bay, RI.” Estuaries 15:1-17.