marine mammal and sea turtle monitoring during … · marine mammal and sea turtle monitoring...
TRANSCRIPT
MARINE MAMMAL AND SEA TURTLE MONITORING DURING A RICE UNIVERSITY SEISMIC SURVEY IN THE NORTHWEST ATLANTIC OCEAN,
AUGUST 2009
Prepared by
22 Fisher St., POB 280, King City, Ont. L7B 1A6, Canada
for
Rice University, Department of Earth Science
6100 Main Street, MS 126, Houston, TX 77005
Lamont-Doherty Earth Observatory of Columbia University
61 Route 9W, P.O. Box 1000, Palisades, NY 10964-8000
and
National Marine Fisheries Service, Office of Protected Resources 1315 East-West Hwy, Silver Spring, MD 20910-3282
LGL Report TA4760-3
23 December 2009


MARINE MAMMAL AND SEA TURTLE MONITORING DURING A RICE UNIVERSITY SEISMIC SURVEY IN THE NORTHWEST ATLANTIC OCEAN,
AUGUST 2009
by
Meike Holst and Frances C. Robertson
LGL Ltd., environmental research associates P.O. Box 280, 22 Fisher Street, King City, Ont. L7B 1A6, Canada
for
Rice University, Department of Earth Science
6100 Main Street, MS 126, Houston, TX 77005
Lamont-Doherty Earth Observatory of Columbia University 61 Route 9W, P.O. Box 1000, Palisades, NY 10964-8000
and
National Marine Fisheries Service, Office of Protected Resources
1315 East-West Hwy, Silver Spring, MD 20910-3282
LGL Report TA4760-3
23 December 2009
ii
Suggested format for citation: Holst, M. and F.C. Robertson. 2009. Marine mammal and sea turtle monitoring during a Rice University
seismic survey in the Northwest Atlantic Ocean, August 2009. LGL Rep. TA4760-3. Rep. from LGL Ltd., King City, Ont., for Rice University, Houston, TX, Lamont-Doherty Earth Observatory of Columbia Univ., Palisades, NY, and Nat. Mar. Fish. Serv., Silver Spring, MD. 66 p.
Table of Contents
iii
TABLE OF CONTENTS
ACRONYMS AND ABBREVIATIONS ..................................................................................................... v EXECUTIVE SUMMARY ........................................................................................................................vii
Introduction ..........................................................................................................................................vii Seismic Program Described .................................................................................................................vii Monitoring and Mitigation Description and Methods..........................................................................vii Monitoring Results ..............................................................................................................................viii Number of Marine Mammals Present and Potentially Affected ........................................................... ix
1. INTRODUCTION ................................................................................................................................... 1 Incidental Harassment Authorization ..................................................................................................... 2 Mitigation and Monitoring Objectives ................................................................................................... 3 Report Organization ............................................................................................................................... 3
2. SEISMIC PROGRAM DESCRIBED...................................................................................................... 5 Operating Areas, Dates, and Navigation ................................................................................................ 5 Sparker Characteristics........................................................................................................................... 7 Dual-Frequency Echosounder ................................................................................................................ 8
3. MONITORING AND MITIGATION METHODS.................................................................................. 9 Monitoring Tasks ................................................................................................................................... 9 Safety and Potential Disturbance Radii .................................................................................................. 9 Mitigation Measures as Implemented .................................................................................................. 10 Visual Monitoring Methods ................................................................................................................. 11 Analyses ............................................................................................................................................... 11
Categorization of Data ................................................................................................................... 11 Line Transect Estimation of Densities ........................................................................................... 12 Estimating Numbers of Marine Mammals Potentially Affected.................................................... 13
4. MONITORING RESULTS ................................................................................................................... 14 Introduction .......................................................................................................................................... 14 Status of Marine Mammals in the NWA.............................................................................................. 14 Status of Sea Turtles in the NWA ........................................................................................................ 14 Visual Monitoring Effort...................................................................................................................... 14 Marine Mammal Sighting Results........................................................................................................ 16
Numbers Observed......................................................................................................................... 16 Sightings by Seismic State............................................................................................................. 16 Detection Rates .............................................................................................................................. 16 Densities......................................................................................................................................... 18 Other Vessels ................................................................................................................................. 19
Marine Mammal Distribution and Behavior ........................................................................................19 Closest Point of Approach ............................................................................................................. 20 First Observed Behavior ................................................................................................................ 20 Movement ...................................................................................................................................... 20 Distribution .................................................................................................................................... 20
Sea Turtle Sighting Results .................................................................................................................. 21 Numbers Observed......................................................................................................................... 21 Sightings by Seismic State............................................................................................................. 22
Table of Contents
iv
Sea Turtle Distribution and Behavior................................................................................................... 22 Closest Point of Approach ............................................................................................................. 22 Movement and Behavior................................................................................................................ 22 Distribution .................................................................................................................................... 22
Mitigation Measures Implemented....................................................................................................... 23 Implementation of the Terms and Conditions of the Incidental Take Statement ................................. 25 Estimated Number of Marine Mammals Potentially Affected ............................................................. 25
Disturbance and Safety Criteria ..................................................................................................... 26 Estimates from Direct Observations .............................................................................................. 27 Estimates Extrapolated from Marine Mammal Density ................................................................ 28
Summary and Conclusions ................................................................................................................... 30 5. ACKNOWLEDGEMENTS................................................................................................................... 32 6. LITERATURE CITED .......................................................................................................................... 33 APPENDIX A: Incidental Harassment Authorization Issued to Rice University ...................................... 36 APPENDIX B: Development and Implementation of Safety Radii ........................................................... 47 APPENDIX C: Details Of Monitoring, Mitigation, and Analysis Methods............................................... 54 APPENDIX D: Background on Marine Mammals in the NWA ................................................................ 61 APPENDIX E: Visual Effort and Sightings ............................................................................................... 64

Acronyms & Abbreviations
v
ACRONYMS AND ABBREVIATIONS 3-D Three Dimensional Bf Beaufort Wind Force CITES Convention on International Trade in Endangered Species CPA Closest (Observed) Point of Approach CV Coefficient of Variation dB decibels EA Environmental Assessment EEZ Exclusive Economic Zone ESA (U.S.) Endangered Species Act f(0) sighting probability density at zero perpendicular distance from survey track; equivalent
to 1/(effective strip width) ft feet GI Generator Injector GIS Geographic Information System GMT Greenwich Mean Time g(0) probability of seeing a group located directly on a survey line h hours hp horsepower Hz Hertz (cycles per second) IHA Incidental Harassment Authorization (under U.S. MMPA) in3 cubic inches IODP Integrated Ocean Drilling Program ITS Incidental Take Statement IUCN International Union for the Conservation of Nature J Joules kHz kilohertz km kilometer km2 square kilometers km/h kilometers per hour kt knot (1 knot = 1.853 km/h) L-DEO Lamont-Doherty Earth Observatory (of Columbia University) µPa micro Pascal m meters min minutes MMC (U.S.) Marine Mammal Commission MMO Marine Mammal (and Sea Turtle) Observer MMPA (U.S.) Marine Mammal Protection Act n sample size NWA Northwest Atlantic Ocean NMFS (U.S.) National Marine Fisheries Service No. Number NSF (U.S.) National Science Foundation
Acronyms & Abbreviations
vi
pk-pk peak-to-peak psi pounds per square inch PTS Permanent Threshold Shift re in reference to Rice Rice University, Department of Earth Science RL Received (sound) Level rms root-mean-square rpm revolutions per minute s seconds SD Shut Down of GI gun(s) or sparker not associated with mitigation s.d. standard deviation SPL Sound Pressure Level SZ Shut Down of GI gun(s) or sparker because of a marine mammal or sea turtle sighting
near or within the safety radius TTS Temporary Threshold Shift UNEP United Nations Environmental Programme U.K. United Kingdom U.S. United States of America “Useable” Visual effort or sightings made under the following observation conditions: daylight
periods within the study area, excluding periods 90 s to 2 h after GI gun(s) or sparker were turned off (recently exposed), nighttime observations, poor visibility conditions (visibility <3.5 km), and periods with Beaufort Wind Force >5 (>2 for cryptic species). Also excluded were periods when the Endeavor’s speed was <3.7 km/h (2 kt) or with >60º of severe glare between 90º left and 90º right of the bow. Sightings outside of the truncation distance (used for density calculations) were also considered “non-useable”.

Executive Summary
vii
EXECUTIVE SUMMARY
Introduction
This document serves to meet reporting requirements specified in an Incidental Harassment Authorization (IHA) issued to Rice University (Rice) by the National Marine Fisheries Service (NMFS) on 11 August 2009. The IHA (Appendix A) authorized non-lethal takes of certain marine mammals incidental to a seismic survey by the R/V Endeavor off New England in the Northwest Atlantic Ocean (NWA). Behavioral disturbance to marine mammals is considered to be “take by harassment” under the provisions of the U.S. Marine Mammal Protection Act (MMPA). NMFS considers that marine mammals exposed to airgun sounds with received levels ≥160 dB re 1 µParms might be sufficiently disturbed to be “taken by harassment”. “Taking” would also occur if marine mammals close to the seismic activity experienced a temporary or permanent reduction in their hearing sensitivity, or reacted behaviorally to the seismic sounds in a biologically significant manner.
It has not been confirmed whether, under realistic field conditions, seismic exploration sounds are strong enough to cause temporary or permanent hearing impairment in any marine mammals or sea turtles that occur close to the seismic source. Nonetheless, NMFS requires measures to minimize the possibility of any injurious effects (auditory or otherwise), and to document the extent and nature of any disturbance effects. In particular, NMFS requires that seismic programs conducted under IHAs include provisions to monitor for marine mammals and turtles, and to power down the airgun array to a single operating airgun or shut down all seismic sources when mammals or turtles are detected within designated safety radii.
Seismic Program Described
Rice conducted a low-energy seismic survey over the continental shelf south of Martha’s Vineyard and Nantucket, MA. The seismic survey area was located between 40º and 41.3ºN and between 69.7º and 70.7ºW, within the U.S. Exclusive Economic Zone (EEZ). The closest approach to shore during seismic operations was ~7 km south of Martha’s Vineyard. Water depths in the survey area ranged from ~25 to 200 m, but were typically <100 m. The cruise occurred from 12 to 25 August 2009.
The purpose of the seismic survey was to examine the distribution and amounts of freshwater sequestered within the continental shelf off New England. The program also provided site survey data for an Integrated Ocean Drilling Program (IODP) proposal to drill into these freshwater resources for hydrogeochemical, biological, and climate studies. On a global scale, vast quantities of freshwater have been sequestered in continental shelves, and this may represent an increasingly valuable resource for humans.
The Endeavor deployed, at various times, one or two low-energy Generator Injector (GI) guns or a sparker as the energy source during the survey. The GI guns had a discharge volume of 45 in3 each or a total of 90 in3 when two GI guns were deployed. The GI guns were towed at a depth of 2 m. The sparker had an output power level of ~200 J. The acoustic receiving system consisted of one digital, high-resolution streamer, varying in length from 0.6 to 1 km, towed at a depth of ~3 m. A Knudsen 3260 dual-frequency (3.5 and 12 kHz) echosounder was also used during most of the survey.
Monitoring and Mitigation Description and Methods
Three trained marine mammal (and sea turtle) observers (MMOs) were aboard the Endeavor during the period of operations for visual monitoring. The primary purposes of the monitoring and mitigation effort were the following: (A) Document the occurrence, numbers and behaviors of marine mammals and

Executive Summary
viii
sea turtles near the seismic source. (B) Implement a shut down of the GI gun(s)/sparker when marine mammals or turtles were sighted near or within the designated safety radii. (C) Monitor for marine mammals and sea turtles before start up and during ramp-up periods.
At least one MMO, but most often two MMOs, watched for marine mammals and sea turtles at all times while the GI gun(s) or sparker operated during daylight periods and whenever the vessel was underway in daytime but the GI gun(s) or sparker were not firing. The MMOs used 7x50 binoculars and the naked eye to scan the surface of the water around the vessel for marine mammals and sea turtles. The distance from the observer to the sighting was estimated using reticles in the binoculars or a clinometer. When a marine mammal or turtle was detected within or approaching the safety radius, the MMO called for a shut down of the GI gun(s) or sparker.
Primary mitigation procedures, as required by the IHA, included the following: (A) Ramp ups consisting of a gradual increase in the volume of the operating GI guns, whenever the two GI guns were started after periods without GI gun operations. (B) Immediate shut downs of the GI gun(s) or sparker whenever marine mammals or sea turtles were detected within or about to enter the then-applicable safety radius. The safety radii for cetaceans and sea turtles during the survey were based on the distances within which the received levels of GI gun or sparker sounds were expected to diminish to 180 dB re 1 µParms, averaged over the pulse duration with no frequency weighting. The safety radius for pinnipeds was based on the distance within which the received levels of GI gun or sparker sounds were expected to diminish to 190 dB re 1 µParms.
Monitoring Results
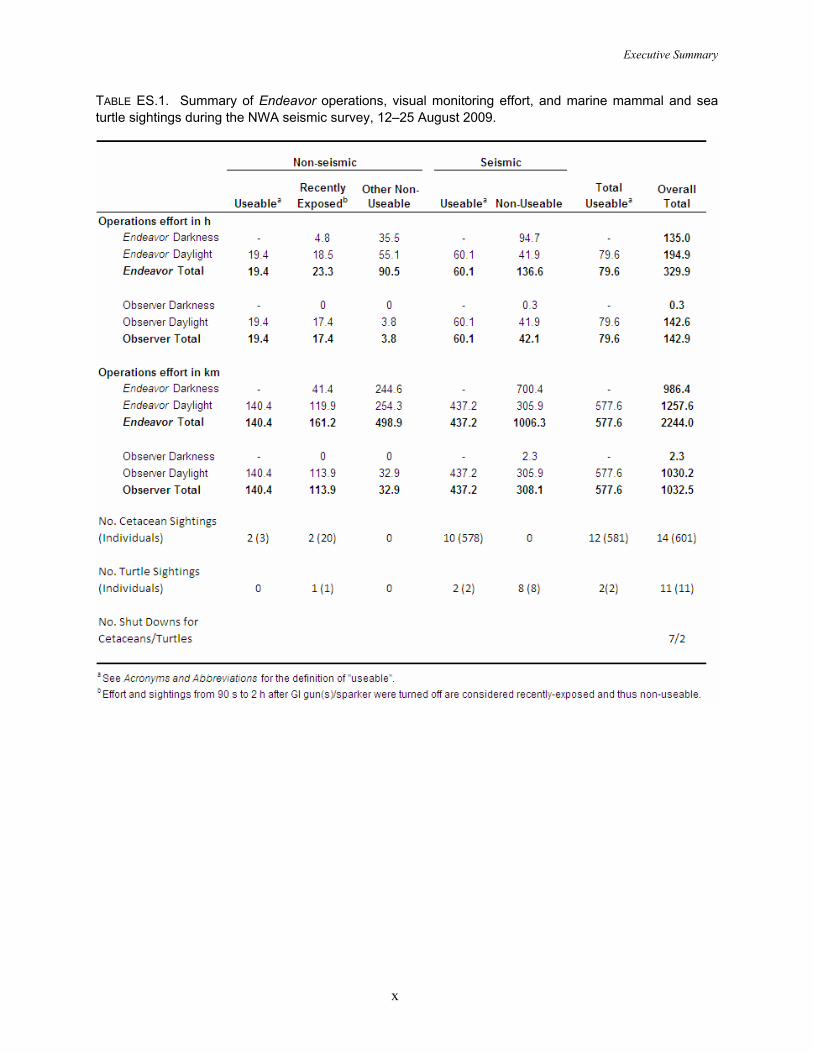
The Endeavor traveled a total of 2244 km off New England during this project, and ~1443 km of seismic operations occurred (Table ES.1). In total, 143 h of visual observations were undertaken (Table ES.1). Nearly all (>99%) visual effort occurred during daylight. MMOs were on visual watch during all daytime seismic operations including ramp ups, as well as during 0.3 h at dusk (Table ES.1).
Mitigation decisions were based on all marine mammal and sea turtle sightings, but analyses focused on sightings and survey effort in the study area during “useable” survey conditions. “Useable” conditions represented 56% of the total visual effort (Table ES.1). “Useable” effort excluded periods 90 s to 2 h after the seismic source was turned off (recently exposed), poor visibility (<3.5 km) conditions, and periods with Beaufort Wind Force >5. Also excluded were periods when the Endeavor’s speed was <3.7 km/h (2 kt) or periods with >60° of severe glare between 90º left and right of the bow.
Fourteen sightings of cetaceans totaling 601 individuals were recorded during the survey. Two species of delphinids were identified; the majority of sightings (64% or 9 groups) involved short-beaked common dolphins, while the bottlenose dolphin constituted the rest of the delphinid sightings (29% or 4 groups). One unidentified baleen whale was also seen. No pinnipeds were encountered during the study. The detection rate, based on 12 useable sightings, was ~1.5x greater during seismic (23/1000 km, n = 10) compared with non-seismic (14/1000 km, n = 2) periods. Observed densities of cetaceans were higher during seismic compared with non-seismic periods. However, sighting rate and density for non-seismic periods were based on too few sightings to be very meaningful. For dolphins, the mean closest observed point of approach (CPA) was 1076 m (n = 10) during seismic operations and 3695 m for a single group seen during non-seismic periods.
Eleven sightings of single sea turtles were also recorded during the cruise. Two species of sea turtle were sighted; the leatherback turtle was the most frequently sighted species (91% or 10 groups), and one loggerhead turtle was seen. The sighting rate for turtles was 4.6/1000 km (n = 2).
Executive Summary
ix
Number of Marine Mammals Present and Potentially Affected
During this project, the “safety radii” required by NMFS for cetaceans and sea turtles were the best estimates of the 180-dB radii for either one or two GI guns or the sparker. These radii varied with water depth. The GI gun was shut down six times because of the presence of four cetacean groups (totaling 93 individuals) and two turtles within or near the designated safety zone. The sparker was shut down once due to the presence of a group of 10 bottlenose dolphins near the designated safety zone. Because of the small size of the seismic source, full shut downs rather than power downs were implemented. Shut downs were necessary for short-beaked common and bottlenose dolphin sightings, as well as one leather-back and one loggerhead turtle. Only four of the seven sightings for which a shut down was implemented involved animals within the safety zone; those four sightings consisted of two turtles and 20 dolphins that were likely exposed to GI gun sounds with received levels ≥180 dB re 1 µParms before mitigation measures could be implemented. Based on direct observations, six dolphin groups totaling 115 individuals were exposed to received sound levels ≥160 dB re 1 µParms. In addition, nine turtles were exposed to GI gun sounds ≥160 dB.
Minimum and maximum numbers of cetaceans exposed to ≥160 and ≥170 dB re 1 µParms were also estimated based on densities of cetaceans derived by line-transect procedures. These estimates allowed for animals not seen by MMOs. Based on daytime observations during seismic periods, 477 to 584 cetaceans (mostly dolphins) might have been in the areas exposed to airgun sounds with received levels ≥160 dB re 1 µParms. When areas with received levels ≥170 dB re 1 µParms are considered, 232 to 263 dolphins might have been exposed. The estimates based on actual density data during seismic periods exceed the number of exposures estimated prior to the survey, based on the 160-dB criterion, because observed densities were generally higher than expected densities in the survey area. However, exposure estimates based on direct observations were lower than expected.
During the survey, there was no indication that cetaceans may have been avoiding the area around the seismic vessel. In fact, dolphins frequently approached the Endeavor, requiring mitigation action (shut down of the seismic source). Given the small size of the seismic source, lack of noticeable avoidance, and the fact that mitigation measures were implemented immediately for marine mammals and sea turtles sighted close to the source vessel, effects were very likely localized and transient, without significant impact on either individuals or their populations.
Executive Summary
x
TABLE ES.1. Summary of Endeavor operations, visual monitoring effort, and marine mammal and sea turtle sightings during the NWA seismic survey, 12–25 August 2009.

§1. Introduction 1
1. INTRODUCTION
Rice University (Rice), Department of Earth Sciences, conducted a low-energy seismic survey in the Northwest Atlantic Ocean (NWA) from 12–25 August 2009. The survey was conducted aboard the R/V Endeavor, which is operated by the University of Rhode Island and owned by the National Science Foundation (NSF). Rice conducted a high-resolution multi-channel seismic (MCS) survey over the continental shelf south of Martha’s Vineyard and Nantucket, MA. The purpose of the seismic survey was to provide data integral to advancing scientific understanding of the distribution and abundance of freshwater sequestered beneath the continental shelf of New England. The data collected from this survey will help constrain process-based mathematical models for more precise estimations of the abundance and distribution of freshwater wells on the continental shelf. The study used one or two Generator Injector (GI) guns or a sparker as the energy source. The GI guns had a discharge volume of 45 in³ each or a total of 90 in³ for two GI guns. The geophysical investigation was under the direction of Dr. Brandon Dugan of Rice.
Marine seismic surveys emit strong sounds into the water (Greene and Richardson 1988; Tolstoy et al. 2004a,b, 2009; Breitzke et al. 2008) and have the potential to affect marine mammals, given the known auditory and behavioral sensitivity of many such species to underwater sounds (Richardson et al. 1995; Gordon et al. 2004; Nowacek et al. 2007; Southall et al. 2007). The effects could consist of behavioral and/or distributional changes, and perhaps (for animals close to the sound source), temporary or permanent reduction in hearing sensitivity. Either behavioral/distributional effects or (if they occur) auditory effects could constitute “taking” under the provisions of the U.S. Marine Mammal Protection Act (MMPA) and the U.S. Endangered Species Act (ESA), at least if the effects are considered to be “biologically significant”. However, a low-energy small-source seismic survey such as this one has less potential to cause such effects than would a higher-energy survey with a larger energy source.
Numerous species of marine mammals and sea turtles inhabit the waters of the NWA. Thirty species of cetaceans and four species of pinnipeds are known to occur in the waters off New England. Several of these species are listed as endangered under the ESA, including the North Atlantic right, humpback, sei, fin, blue, and sperm whales. The Western North Atlantic Coastal Morphotype Stock of common bottlenose dolphin is listed as depleted under the MMPA. Sea turtle species that occur off New England include the endangered leatherback and Kemp’s ridley turtles, and the threatened loggerhead and green turtles.
On 21April 2009, Rice requested that the National Marine Fisheries Service (NMFS) issue an Incidental Harassment Authorization (IHA) to authorize non-lethal “takes” of marine mammals incidental to the seismic operations off New England (LGL Ltd. 2009a). The IHA was requested pursuant to Section 101(a)(5)(D) of the MMPA. A supporting environmental assessment (EA) was also submitted (LGL Ltd. 2009b). The IHA was issued to Rice by NMFS on 11August 2009 (Appendix A).
The IHA authorized “potential take by harassment” of marine mammals during the seismic program described in this report. The Endeavor survey vessel departed Narragansett, RI, on 12 August 2009 and returned on 25 August. GI gun operations commenced on 12 August and concluded on 22 August. The sparker was used on 13, 14, 17, and 24 August. The majority (62%) of seismic operations were undertaken with a single GI gun, ~24% used two GI guns, and the sparker was in operation for ~13% of the survey.
This document serves to meet reporting requirements specified in the IHA. The primary purposes of this report are to describe the seismic program off New England, to describe the associated marine

§1. Introduction 2
mammal and sea turtle monitoring and mitigation programs and their results, and to estimate the numbers of marine mammals potentially affected by the project.
Incidental Harassment Authorization IHAs issued under the provisions of the MMPA to seismic operators include provisions to
minimize the possibility that marine mammals close to the seismic source might be exposed to levels of sound high enough to cause hearing damage or other injuries, and to reduce other effects insofar as practicable. During this project, sounds were generated by the GI gun(s) and sparker used during the seismic study, and by a dual-frequency echosounder and general vessel operations. No serious injuries or deaths of marine mammals (or sea turtles) were anticipated from the seismic survey, given the nature of the operations and the mitigation measures implemented. No such effects were identified. Nonetheless, the seismic survey operations described in Chapter 2 had the potential to disturb some marine mammals. Behavioral disturbance to marine mammals is considered to be “take by harassment” under the provisions of the MMPA. Appendix B provides further background on the issuance of IHAs relative to seismic operations and “take”.
Under current NMFS guidelines (e.g., NMFS 2000), “safety radii” for marine mammals around airgun arrays are customarily defined as the distances within which the received pulse levels are ≥180 dB re 1 µParms
1 for cetaceans and ≥190 dB re 1 µParms for pinnipeds. Those safety radii assume that seismic pulses received at lower received levels are unlikely to injure these mammals or impair their hearing abilities, but that higher received levels might have some such effects. The mitigation measures required by IHAs are, in large part, designed to avoid or minimize exposure of cetaceans and pinnipeds to sound levels exceeding 180 and 190 dB re 1 µParms, respectively. In addition, for this project, the 180 dB re 1 µParms criterion was also used as the safety (shut down) criterion for sea turtles.
Disturbance to marine mammals could occur at distances beyond the safety (=shut down) radii if the mammals were exposed to moderately strong pulsed sounds generated by the airgun array (Richardson et al. 1995). NMFS assumes that marine mammals exposed to airgun sounds with received levels ≥160 dB re 1 µParms are likely to be disturbed appreciably. That assumption is based mainly on data concerning behavioral responses of baleen whales, as summarized by Richardson et al. (1995), Gordon et al. (2004), and Southall et al. (2007). Dolphins and most pinnipeds are generally less responsive (e.g., Stone 2003; Gordon et al. 2004; Bain and William 2006), and 170 dB re 1 µParms may be a more appropriate criterion of behavioral disturbance for those groups (see LGL Ltd. 2009a,b). In general, disturbance effects are expected to depend on the species of marine mammal, the activity of the animal at the time, its distance from the sound source, and the received level of the sound and the associated water depth. Some individuals respond behaviorally at received levels somewhat below 160- or 170-dB re 1 µParms, but others tolerate levels somewhat above those levels without reacting in a substantial manner.
1 “rms” means “root mean square”, and represents a form of average across the duration of the sound pulse as
received by the animal. Received levels of airgun pulses measured on an “rms” basis are generally 10–12 dB lower than those measured on the “zero-to-peak” basis, and 16–18 dB lower than those measured on a “peak-to-peak” basis (Greene 1997; McCauley et al. 1998, 2000). The latter two measures are the ones commonly used by geophysicists. Unless otherwise noted, all airgun pulse levels quoted in this report are rms levels with equal weighting for all frequencies.

§1. Introduction 3
A notice regarding the proposed issuance of an IHA for the seismic study off New England was published by NMFS in the Federal Register on 18 June 2009, and public comments were invited (NMFS 2009a). The Marine Mammal Commission (MMC) submitted comments.
On 11August 2009, Rice received the IHA that had been requested for the seismic study. On 17 August 2009, NMFS published a second notice in the Federal Register to announce the issuance of this IHA (NMFS 2009b). The second notice responded to the received comments and provided additional information concerning the IHA and any changes from the originally proposed IHA. A copy of the issued IHA and associated Incidental Take Statement (ITS) are included in this report as Appendix A.
The IHA was granted to Rice on the assumptions that
• the numbers of marine mammals potentially harassed (as defined by NMFS criteria) during seismic operations would be “small”,
• the effects of such harassment on marine mammal populations would be negligible,
• no marine mammals would be seriously injured or killed, and
• the agreed upon monitoring and mitigation measures would be implemented, including provisions of the ITS.
Mitigation and Monitoring Objectives The objectives of the mitigation and monitoring program were described in detail in Rice’s IHA
Application (LGL Ltd. 2009a) and in the IHA issued by NMFS to Rice (Appendix A). Explanatory material about the monitoring and mitigation requirements was published by NMFS in the Federal Register (NMFS 2009a,b).
The main purpose of the mitigation program was to avoid or minimize potential effects of Rice’s seismic study on marine mammals and sea turtles. This required that ― during daytime GI gun or sparker operations ― Rice detect marine mammals and sea turtles within or about to enter the safety radius, and in such cases initiate an immediate shut down of the seismic source. An additional mitigation objective was to detect marine mammals or sea turtles within or near the safety radii prior to starting the GI gun or sparker or during ramp up to two GI guns. In these cases, the start of seismic operations was to be delayed or ramp up discontinued until the safety radius was free of marine mammals or sea turtles (see Appendix A and Chapter 3).
The primary objectives of the monitoring program were as follows:
1. Provide real-time sighting data needed to implement the mitigation requirements.
2. Estimate the numbers of marine mammals potentially exposed to strong seismic pulses.
3. Determine the reactions (if any) of potentially exposed marine mammals and sea turtles.
Specific mitigation and monitoring objectives identified in the IHA are listed in Appendix A. Mitigation and monitoring measures that were implemented during the seismic study are described in detail in Chapter 3.
Report Organization The primary purpose of this report is to describe the seismic study that occurred off New England
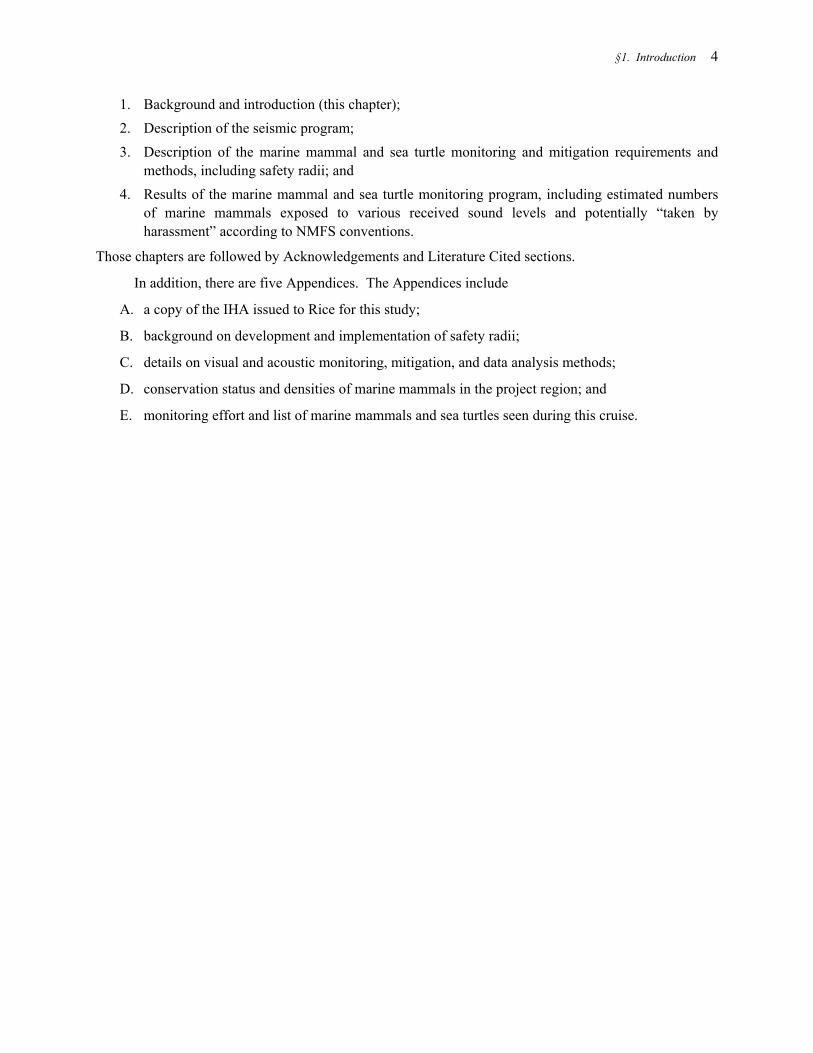
from 12 to 25 August 2009, including the associated monitoring and mitigation programs, and to present results as required by the IHA (see Appendix A). This report includes four chapters:
§1. Introduction 4
1. Background and introduction (this chapter); 2. Description of the seismic program; 3. Description of the marine mammal and sea turtle monitoring and mitigation requirements and
methods, including safety radii; and 4. Results of the marine mammal and sea turtle monitoring program, including estimated numbers
of marine mammals exposed to various received sound levels and potentially “taken by harassment” according to NMFS conventions.
Those chapters are followed by Acknowledgements and Literature Cited sections.
In addition, there are five Appendices. The Appendices include
A. a copy of the IHA issued to Rice for this study;
B. background on development and implementation of safety radii;
C. details on visual and acoustic monitoring, mitigation, and data analysis methods;
D. conservation status and densities of marine mammals in the project region; and
E. monitoring effort and list of marine mammals and sea turtles seen during this cruise.
§2. Seismic Program Described 5
2. SEISMIC PROGRAM DESCRIBED
This seismic program consisted of a high-resolution MCS survey over the New England continental shelf south of Martha’s Vineyard and Nantucket, MA (Fig. 2.1). The Endeavor source vessel deployed one or two low-energy GI guns (with a discharge volume of 45 in3 each) or a sparker as the energy source. The Endeavor also towed a digital, high-resolution streamer, 0.6–1 km in length, at a depth of ~3 m. As the GI gun(s) or sparker were towed along the survey lines, the hydrophone streamer received the returning acoustic signals and transferred the data to on-board processing systems. A total of ~1443 km of seismic operations were conducted off New England. The majority (62%) of seismic operations were undertaken with a single GI gun, ~24% used two GI guns, and the sparker was in use for ~13% of operations. Only one seismic source was in use at a time; the sparker was not used simultaneously with the GI gun(s). Along with the seismic operations, a Knudsen 3260 dual-frequency echosounder was also operated during the cruise. The echosounder was used to provide additional sub-bottom data to complement the seismic data.
Operating Areas, Dates, and Navigation
The study occurred within the area between 40º and 41.3ºN and between 69.7º and 70.7ºW within the Exclusive Economic Zone (EEZ) of the northeastern U.S. (Fig. 2.1). Water depths in the survey area ranged from ~25–200 m. The Endeavor left Narragansett, RI, on 12 August 2009. Following a 4-h transit to the study site and deployment of the streamer and GI guns, seismic operations commenced the same day, 12 August 2009. The last GI gun operations occurred 22 August. The sparker was operated on 13, 14, 17, and 24 August. After equipment recovery, the vessel returned to Narragansett on 25 August 2009. Seismic operations occurred during the day and night. A summary of the total distances traveled by the Endeavor during the survey, distinguishing periods with and without seismic operations, are presented in Table ES.1 (in the Executive Summary).
Throughout the study, position, speed, and activities of the Endeavor were logged digitally every minute. In addition, the position of the Endeavor, water depth, and information on the seismic operations were logged while the Endeavor was collecting geophysical data. The geophysics crew kept a written log of events, as did the marine mammal (and turtle) observers (MMOs) while on duty. The MMOs, when on duty, also recorded the number and volume of GI guns that were firing, when the sparker was in use, and when the Endeavor was offline (e.g., turning from one line to the next), or was online but not recording data (e.g., during technical or computer problems).
Source Vessel Specifications
Rice used the R/V Endeavor to tow the seismic source and hydrophone streamer along pre-determined lines. The Endeavor is self-contained, with the crew living aboard the vessel. The Endeavor has a length of 56.4 m, a beam of 10.1 m, and a full load draft of 5.6 m. The ship is powered by one GM/EMD diesel engine, producing 3050 hp, which drives the single propeller directly at a maximum of 900 rpm. The vessel also has a 320-hp bowthruster, which is not used during seismic acquisition. An operation speed of 7.4 km/h (4 kt) is used during seismic acquisition. When not towing seismic survey gear, the Endeavor cruises at 18.5 km/h (10 kt). It has a normal operating range of ~14,816 km.
Other details of the Endeavor include the following:

§2. Seismic Program Described 6
FIGURE 2.1. Map of the study area showing ship tracks with and without observer effort and acquired seismic lines (“Ship track exposed”) in the Northwest Atlantic Ocean, 12–25 August 2009.

§2. Seismic Program Described 7
Owner: National Science Foundation Operator: University of Rhode Island Flag: United States of America Launch Date: 1976 (Refit in 1993) Gross Tonnage: 298
Accommodation Capacity: 30 including ~17 scientists The Endeavor also served as a platform from which MMOs watched for marine mammals and sea
turtles.
GI Gun Characteristics
One or two GI guns were used, at various times, during the seismic survey. The generator chamber of each GI gun, the one responsible for introducing the sound pulse into the ocean, was 45 in³. The 105-in³ injector chamber injects air into the previously-generated bubble to maintain its shape, and does not introduce more sound into the water. Thus, the total discharge volume was 90 in³ when two GI guns were firing. Compressed air supplied by compressors aboard the source vessel powered the GI gun(s). Seismic pulses were emitted at intervals of ~5–6 s or ~10 m. The GI gun(s) were towed 2.4 m apart ~25 m behind the ship at a depth of ~2 m.
The nominal source level for downward propagation of low-frequency energy from the GI gun(s) is shown below. The nominal source level would be somewhat higher if the small amount of energy at higher frequencies were considered. Because the 2-GI gun array is a distributed sound source rather than a single point source, the highest sound level measurable at any location in the water is less than the nominal source level (Caldwell and Dragoset 2000). In addition, because of the slightly directional nature of the dominant low-frequency sound from the GI gun(s), the effective source level for sound propagating in some near-horizontal directions would be somewhat lower. The source level expressed on the rms basis used elsewhere in this report would be lower than the peak-to-peak and zero-to-peak source levels listed below, but source levels of airguns and airgun arrays are not normally determined on an rms basis by airgun manufacturers or geophysicists.
GI Gun Specifications
Energy source: One or two GI guns, 45 in3 each Source output, 2 guns (downward): 0-pk is 3.4 bar-m (230.7 dB re 1 µPa · mp); pk-pk is 6.2 bar-m (235.9 dB re 1 µPa · mp-p )
Source output, 1 gun (downward): 0-pk is 1.8 bar-m (225.3 dB re 1 µPa · mp); pk-pk is 3.4 bar-m (230.7 dB re 1 µPa · mp-p)
Towing depth of energy source: ~2 m Air discharge volume: ~45 or 90 in3 Dominant frequency components: 2–188 Hz Gun positions used: one GI gun or two GI guns in line, 2.4 m apart
Sparker Characteristics
The sparker is a sound source dependent on an electrical arc that vaporizes water between two electrodes. The resulting collapsing bubbles produce a broadband (50 Hz–4 kHz) omnidirectional pulse that can penetrate several hundred meters below the surface. The system used during the NWA survey was the Applied Acoustics Energy Source CSP1000 with a SIG seismic marine ELC1200 sparker electrode and cable. The receiving system used was the Geopulse receiver 5210A with a single channel
§2. Seismic Program Described 8
streamer hydrophone. During the NWA study, the sparker trigger rate was ~1.5 s at a power output of 200 J. The pulse duration was ~0.8 ms. The source level is estimated to be <205 dB re 1 µPa· m when used with a low (200 J) power output.
Dual-Frequency Echosounder
Along with the seismic operations, a Knudsen 3260 echosounder was operated throughout most of the cruise. The Knudsen 3260 is a deep-water, dual-frequency echosounder with operating frequencies of 3.5 and 12 kHz. The high frequency (12 kHz) is used to record water depth or to track pingers attached to various instruments deployed over the side. The low frequency (3.5 kHz) is used for sub-bottom profiling; this was the mode primarily used during the NWA survey. The echosounder was operated at 12 kHz for a short time period. The echosounder was used with a hull-mounted, downward-facing trans-ducer. A pulse up to 24 ms in length was emitted every several seconds with a nominal beam width of 80°. Maximum output power at 3.5 kHz is 10 kW and at 12 kHz it is 2 kW. The maximum source output (downward) for the 3260 is estimated to be 211 dB re 1 μPa· m at 10 kW.

§3. Monitoring and Mitigation Methods 9
3. MONITORING AND MITIGATION METHODS
This chapter describes the marine mammal and sea turtle monitoring and mitigation measures implemented for Rice’s seismic study, addressing the requirements specified in the IHA (Appendix A). The section begins with a brief summary of the monitoring tasks relevant to mitigation for marine mammals and sea turtles. The acoustic measurements and modeling results used to identify the safety radii for marine mammals and turtles are then described. A summary of the mitigation measures required by NMFS is then presented. The chapter ends with a description of the monitoring methods implemented for this cruise from aboard the Endeavor and a description of data analysis methods.
Monitoring Tasks
The main purposes of the vessel-based monitoring program were to ensure that the provisions of the IHA issued to Rice by NMFS were satisfied, effects on marine mammals and sea turtles were minimized, and residual effects on animals were documented. The monitoring objectives were listed in Chapter 1, Mitigation and Monitoring Objectives. Tasks specific to monitoring are listed below (also see Appendix A):
• Provide qualified MMOs for the Endeavor source vessel throughout the seismic study.
• Visually monitor the occurrence and behavior of marine mammals and sea turtles near the GI gun(s) or sparker during daytime whether the systems were operating or not.
• Record (insofar as possible) the effects of the GI gun and sparker operations and the resulting sounds on marine mammals and turtles.
• Use the monitoring data as a basis for implementing the required mitigation measures.
• Estimate the number of marine mammals potentially exposed to seismic sounds.
Safety and Potential Disturbance Radii
Under NMFS guidelines (e.g., NMFS 2000), the “safety radii” for marine mammals around airgun arrays are customarily defined as the distances within which received pulse levels are ≥180 dB re 1 µParms for cetaceans and ≥190 dB re 1 µParms for pinnipeds. These safety criteria are based on an assumption that seismic pulses received at lower received levels are unlikely to injure these animals or impair their hearing abilities, but that higher received levels might have some such effects. Marine mammals exposed to ≥160 dB re 1 µParms are assumed by NMFS to be potentially subject to behavioral disturbance. However, for certain groups (dolphins, some porpoises, and some pinnipeds), this is unlikely to occur unless received levels are higher, perhaps ≥170 dB re 1 µParms for an average animal (see Chapter 1). In this report, all frequencies are weighted equally (i.e., the levels are flat-weighted).
Radii within which received levels from the one or two GI guns or the sparker were expected to diminish to various values (i.e., 190, 180, 170, and 160 dB re 1 µParms) were estimated by Lamont-Doherty Earth Observatory (L-DEO; Table 3.1) and incorporated into the IHA (Appendix A). The 180-dB distance was used as the safety radius for cetaceans and sea turtles, and the 190-dB distance was used as the safety radius for pinnipeds. The radii depend on water depth (see Tolstoy et al. 2004a,b, 20092) 2The recent empirical results of Tolstoy et al. (2009) were not available when mitigation radii for this project were
proposed and adopted by NMFS. In any case, those results pertain to a much larger array of airguns than used in the present project.
§3. Monitoring and Mitigation Methods 10
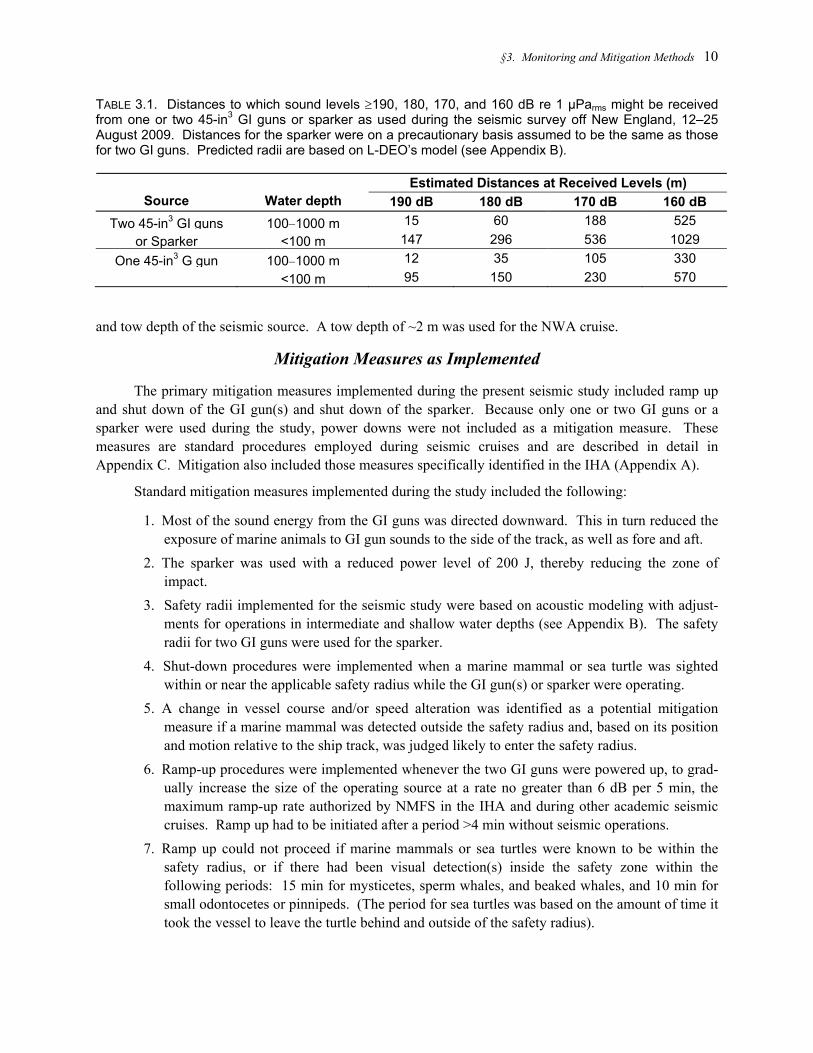
TABLE 3.1. Distances to which sound levels ≥190, 180, 170, and 160 dB re 1 µParms might be received from one or two 45-in3 GI guns or sparker as used during the seismic survey off New England, 12–25 August 2009. Distances for the sparker were on a precautionary basis assumed to be the same as those for two GI guns. Predicted radii are based on L-DEO’s model (see Appendix B).
Estimated Distances at Received Levels (m) Source Water depth 190 dB 180 dB 170 dB 160 dB
Two 45-in3 GI guns 100–1000 m 15 60 188 525 or Sparker <100 m 147 296 536 1029
One 45-in3 G gun 100–1000 m 12 35 105 330 <100 m 95 150 230 570
and tow depth of the seismic source. A tow depth of ~2 m was used for the NWA cruise.
Mitigation Measures as Implemented
The primary mitigation measures implemented during the present seismic study included ramp up and shut down of the GI gun(s) and shut down of the sparker. Because only one or two GI guns or a sparker were used during the study, power downs were not included as a mitigation measure. These measures are standard procedures employed during seismic cruises and are described in detail in Appendix C. Mitigation also included those measures specifically identified in the IHA (Appendix A).
Standard mitigation measures implemented during the study included the following:
1. Most of the sound energy from the GI guns was directed downward. This in turn reduced the exposure of marine animals to GI gun sounds to the side of the track, as well as fore and aft.
2. The sparker was used with a reduced power level of 200 J, thereby reducing the zone of impact.
3. Safety radii implemented for the seismic study were based on acoustic modeling with adjust-ments for operations in intermediate and shallow water depths (see Appendix B). The safety radii for two GI guns were used for the sparker.
4. Shut-down procedures were implemented when a marine mammal or sea turtle was sighted within or near the applicable safety radius while the GI gun(s) or sparker were operating.
5. A change in vessel course and/or speed alteration was identified as a potential mitigation measure if a marine mammal was detected outside the safety radius and, based on its position and motion relative to the ship track, was judged likely to enter the safety radius.
6. Ramp-up procedures were implemented whenever the two GI guns were powered up, to grad-ually increase the size of the operating source at a rate no greater than 6 dB per 5 min, the maximum ramp-up rate authorized by NMFS in the IHA and during other academic seismic cruises. Ramp up had to be initiated after a period >4 min without seismic operations.
7. Ramp up could not proceed if marine mammals or sea turtles were known to be within the safety radius, or if there had been visual detection(s) inside the safety zone within the following periods: 15 min for mysticetes, sperm whales, and beaked whales, and 10 min for small odontocetes or pinnipeds. (The period for sea turtles was based on the amount of time it took the vessel to leave the turtle behind and outside of the safety radius).
§3. Monitoring and Mitigation Methods 11
Additional mitigation measures were put in place for species of particular concern. These procedures were as follows:
1. The GI gun(s)/sparker were to be shut down if a North Atlantic right whale was sighted at any distance from the vessel. This provision was a result of the rarity and conservation status of the North Atlantic right whale.
2. If concentrations of humpback, fin, sperm, blue, or sei whales were observed prior to or during seismic operations, and did not appear to be traveling, then operations were to be shut down, delayed, and/or moved to another location, if possible, based on recommendations by the on-duty MMO aboard the Endeavor. A typical concentration was understood to be a group of three or more individuals visually sighted. If the group appeared to be traveling, then Rice was to shut down operations and wait for 30 min for the individuals to move out of the study area before seismic operations could resume.
Visual Monitoring Methods
Visual monitoring methods were designed to meet the requirements identified in the IHA (see above and Appendix A). The primary purposes of MMOs aboard the Endeavor were as follows: (1) Conduct monitoring and implement mitigation measures to avoid or minimize exposure of cetaceans and sea turtles to seismic sounds with received levels >180 dB re 1 µParms and pinnipeds to received levels >190 dB re 1 µParms, and to implement the other requirements of the IHA. (2) Document numbers of marine mammals and sea turtles present, and any reactions to seismic activities. The data collected were used to estimate the number of marine mammals potentially affected by the project. Results of the monitoring program are presented in Chapter 4.
During the present seismic study, at least one but at most times two MMOs maintained a visual watch for marine mammals and sea turtles during all daylight hours from dawn to dusk. Two or more MMOs were on watch during 87% of the visual observation periods. Visual observations occurred mostly from the Endeavor’s flying bridge. Observers focused search effort forward of the vessel but also searched aft of the vessel while it was underway. Watches were conducted with the naked eye and Fujinon 7×50 reticle binoculars. Nighttime visual watches were only required before and during any nighttime startups of the seismic source, and nighttime visual observations made up <1% of observation effort within the study area. Appendix C provides further details regarding visual monitoring methods.
Analyses
Categorization of Data
Visual effort and marine mammal and turtle sightings were divided into several analysis categories related to vessel and seismic activity. The categories used were similar to those used during previous low-energy NSF-funded seismic cruises (e.g., Haley and Koski 2004; MacLean and Haley 2004; MacLean and Koski 2005; Holst et al. 2005a; Ireland et al. 2005; Smultea and Holst 2008).
In general, data were categorized as “seismic”, “non-seismic”, or “post-seismic”. “Seismic” included all data collected while the GI gun(s)/sparker were operating, including ramp ups, and periods up to 90 s after the GI gun(s)/sparker were shut off. Non-seismic included all data obtained before GI gun(s)/sparker were turned on (pre-seismic) or >2 h after the GI gun(s)/sparker were turned off. Data collected during post-seismic periods from 90 s to 2 h after cessation of seismic were considered “recently

§3. Monitoring and Mitigation Methods 12
exposed” (90 s–2 h) to seismic. The “recently exposed” sub-category was not included in either the “seismic” or “non-seismic” categories and was excluded from all analyses.
This categorization system was designed primarily to distinguish situations with ongoing seismic surveys from those where any seismic surveys were sufficiently far in the past that it could be assumed that they had no effect on current behavior and distribution of animals. The rate of recovery toward “normal” during the post-seismic period is uncertain. Therefore, the post-seismic period was defined so as to be sufficiently long (2 h in the case of the GI guns/sparker) to ensure that any carry-over effects of exposure to the sounds from this configuration surely would have waned to zero or near-zero. The reasoning behind these categories was explained in MacLean and Koski (2005) and Smultea et al. (2005) and is discussed in Appendix C.
Line Transect Estimation of Densities
Sightings during the “seismic” and “non-seismic” periods were used to calculate sighting rates (no./1000 km). Sighting rates were then used to calculate the corresponding densities (no./km2) of marine mammals and turtles near the survey ship during seismic and non-seismic periods. Density calculations were based on line-transect principles (Buckland et al. 2001). Because of assumptions associated with line-transect surveys [sightability, f(0), g(0), etc.], only “useable” effort and sightings were included in density calculations. Effort and sightings were defined as “useable” when made under the following conditions: daylight periods both within the seismic survey area and during transit to and from that area, excluding post-seismic periods 90 s to 2 h after the GI gun(s)/sparker were turned off, when ship speed was <3.7 km/h (2 kt), or when sightability was seriously impaired. The latter included all nighttime observations and daytime periods with one or more of the following: visibility <3.5 km, Beaufort Wind Force (Bf)>5 (or >2 for cryptic species), or >60º severe glare between 90º left and 90º right of the bow. Also, sightings beyond the truncation distance (used for density calculations) were considered non-useable. Although “non-useable” sightings (and associated survey effort) were not considered when calculating densities, such sightings were taken into account when determining the need for real-time mitigation measures.
Correction factors for missed cetaceans and turtles, i.e., f(0) and g(0), were taken from other related studies (e.g., Koski et al. 1998; Barlow 1999). This was necessary because the number of sightings of any individual species during the present study was too low to allow direct estimation of f(0), and because g(0), the trackline sighting probability, cannot be assessed during a study of this type. It is acknowledged that f(0) and g(0) values derived from other studies probably are not exactly applicable to the circumstances of the present study. However, use of “best available” approximate f(0) and g(0) factors from other studies is expected to result in more realistic density estimates than would be obtained by using uncorrected (“raw”) densities without any allowance for f(0) and g(0) effects.
Densities during non-seismic periods are normally used to estimate the numbers of animals that presumably would have been present in the absence of seismic activities. However, in this case, only densities during seismic periods were used to estimate the numbers of animals present near the seismic operation and exposed to various sound levels. Normally, the difference between the two estimates could be taken as an estimate of the number of animals that moved in response to the operating seismic vessel, or that changed their behavior sufficiently to affect their detectability to visual observers. Further details on the line-transect methodology used during the survey are provided in Appendix C.
§3. Monitoring and Mitigation Methods 13
Estimating Numbers of Marine Mammals Potentially Affected
For purposes of the IHA, NMFS assumes that any marine mammal that might have been exposed to seismic pulses with received sound levels ≥160 dB re 1 µParms may have been disturbed. When calcu-lating the number of mammals potentially affected, the nominal 160-dB radii for the GI gun(s)/sparker were applied (Table 3.1).
Two approaches were applied to estimate the numbers of marine mammals that either were exposed to sound levels ≥160 dB re 1 µParms or avoided such exposure by moving away:
1. Estimates of the numbers of potential exposures of marine mammals, and
2. Estimates of the number of different individual mammals exposed (one or more times).
The first method (“exposures”) was obtained by multiplying the “corrected” densities of marine mammals (as estimated by line transect methods) by the area assumed to be ensonified to ≥160 dB re 1 µParms. The second approach (“individuals”) involved multiplying the same corrected density of marine mammals by the area exposed to ≥160 dB re 1 µParms one or more times during the course of the study. In the latter method, areas ensonified to ≥160 dB on more than one occasion, e.g., when seismic lines crossed or were repeated, were counted only once.
The two approaches can be interpreted as providing maximum and minimum (respectively) estimates of the number of marine mammals exposed to sound levels ≥160 dB re 1 µParms, or that would have been so exposed had they not moved away from the approaching seismic vessel. The actual number exposed and/or moving away is probably somewhere between these two estimates. This approach was originally developed to estimate numbers of seals potentially affected by seismic surveys (Harris et al. 2001). This approach has recently been used in various reports to NMFS (e.g., Haley and Koski 2004; Smultea et al. 2004, 2005; MacLean and Koski 2005; Holst et al. 2005a,b; Holst and Beland 2008; Holst and Smultea 2008; Hauser et al. 2008; Hauser and Holst 2009). The methodology is described in detail in these past reports and in Appendix C.

§4. Monitoring Results 14
4. MONITORING RESULTS
Introduction
This chapter provides background information on the occurrence of marine mammals and sea turtles in the project area, and describes the results of the marine mammal and sea turtle monitoring program. In addition, this chapter estimates numbers of marine mammals that were exposed to (or avoided) various sound levels and were potentially affected during project operations.
Status of Marine Mammals in the NWA
Thirty cetacean species are known to occur in the waters off New England, excluding extralimital sightings or strandings. These 30 species include 23 odontocete species (toothed cetaceans, such as dolphins and sperm whales) and seven mysticete species (baleen whales). Six of these species are listed under the ESA as endangered, including the North Atlantic right, humpback, sei, fin, blue, and sperm whales. In addition, the Western North Atlantic coastal morphotype stock of common bottlenose dolphins is listed as depleted under the MMPA. Of the four pinniped species that are known to occur along the northeastern coast of the U.S., only the harbor and gray seals regularly inhabit the study area. However, few seals occur in the area in summer, and none were seen during the survey. Appendix D summarizes the abundance, habitat, and conservation status of the marine mammal species known to occur in the area.
Status of Sea Turtles in the NWA
Of the seven species of sea turtle recognized worldwide, four occur off the U.S. East coast: the leatherback, loggerhead, Kemp’s ridley, and green turtles. The loggerhead and leatherback turtles are considered common in the region (e.g., Shoop and Kenney 1992), but are listed as threatened and endangered, respectively. The Kemp’s ridley and green turtles occur at much lower densities and are listed as endangered. The IUCN-World Conservation Union Red List (IUCN 2009) classifies Kemp’s ridley and leatherback turtles as critically endangered, and loggerhead and green turtles as endangered.
Sea turtles spend most of their time at sea and generally only return to land to nest. Most species are widely distributed, but their habitat preferences vary. All except the leatherback turtle, and some populations of green turtles, are believed to be primarily coastal when not breeding (EuroTurtle 2006). The leatherback sea turtle is highly oceanic and only occurs in coastal areas during the breeding season.
Visual Monitoring Effort
The Endeavor traveled a total of 2244 km during 330 h off New England, and visual observations were obtained for a total of ~1032 km or 143 h (Fig. 4.1; Table ES.1). One or more observers (usually two) were on watch during all daytime seismic operations and most daytime periods when the vessel was underway but not operating seismic equipment; at least two observers were on duty during 87% of visual watches. A total of 0.3 h of visual observation effort occurred at dusk during GI gun operations. The number of hours of observation per day varied according to the schedule of operations, but observations typically occurred from sunrise to sunset.
About 72% of all visual effort (in km) occurred during seismic periods. The majority of seismic operations (93%) occurred in shallow (<100 m) water, and 7% took place in intermediate-depth (100–

§4. Monitoring Results 15
FIGURE 4.1. The New England study area showing the ship tracks, seismic lines (“Ship track exposed”), and sightings of marine mammals and sea turtles, 12–25 August 2009.
§4. Monitoring Results 16
1000 m) water; operations were not conducted in water deeper than 200 m. The majority (62%) of seismic operations were undertaken with a single GI gun, ~24% used two GI guns, and the sparker was in operation for ~13% of the survey. Observation effort in various water depth categories and with various seismic sources is shown in Appendix E.
Survey conditions “useable” for estimating animal densities in “non-seismic” and “seismic” conditions included 56% of total visual effort in km (Table ES.1; Fig. 4.2). “Useable” effort excluded nighttime observations, periods 90 s to 2 h after GI gun(s)/sparker were turned off, poor visibility condi-tions (visibility <3.5 km or extensive glare), Bf >5 for most marine mammal species and Bf >2 for cryptic species, and ship speed <3.7 km/h (2 kt). Also, sightings beyond the truncation distance (used to determine densities) were considered non-useable. Bf during observations ranged from zero to five; the majority of “useable” observations occurred during Bf 1–3 (Fig. 4.3; Appendix E). Sightings and survey effort during “non-useable” conditions were excluded when calculating densities, but were used to determine when shut downs were necessary. Detailed data summaries are presented in Appendix E, including visual survey effort subdivided by seismic activity, Bf, and water depth.
Marine Mammal Sighting Results
Numbers Observed
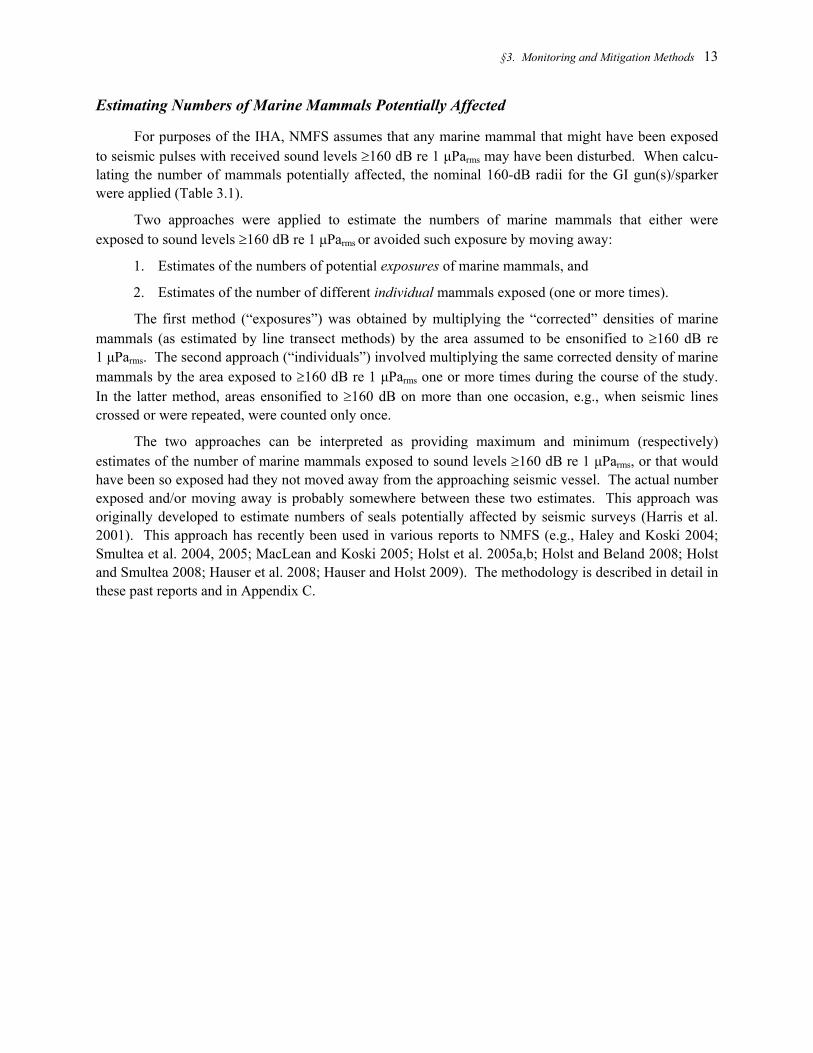
A total of 14 groups of ~601 marine mammals were sighted during the NWA survey. Two species of delphinid were identified (short-beaked common and bottlenose dolphins), and there was one sighting of an unidentified mysticete (Table 4.1). The short-beaked common dolphin was the most frequently sighted species (n = 9 groups), followed by the bottlenose dolphin (n = 4 groups).
All sightings during seismic and non-seismic periods (12 groups totaling 581 individuals) occurred during “useable” observation effort (Table 4.1). These “useable” sightings, along with the corresponding useable effort data, are considered in the ensuing analyses of behavior, detection rates, and densities of marine mammals.
Sightings by Seismic State
During the survey, there was ~3 times more useable effort during seismic (437 km) than during non-seismic periods (140 km) (Table ES.1). Of the 12 useable sightings, most (83%) were recorded during seismic operations (n = 10). Only one sighting of a group of 10 bottlenose dolphins was made during sparker operations; all other sightings during seismic were made during operations with the single GI gun. The two non-useable sightings were made during recently-exposed periods. Five shut downs were required due to marine mammals being sighted within or near the 180-dB re 1 µParms safety radius around the operating GI gun/sparker. Further details on these encounters are provided later in this chapter (see Table 4.5 under Mitigation Measures Implemented).
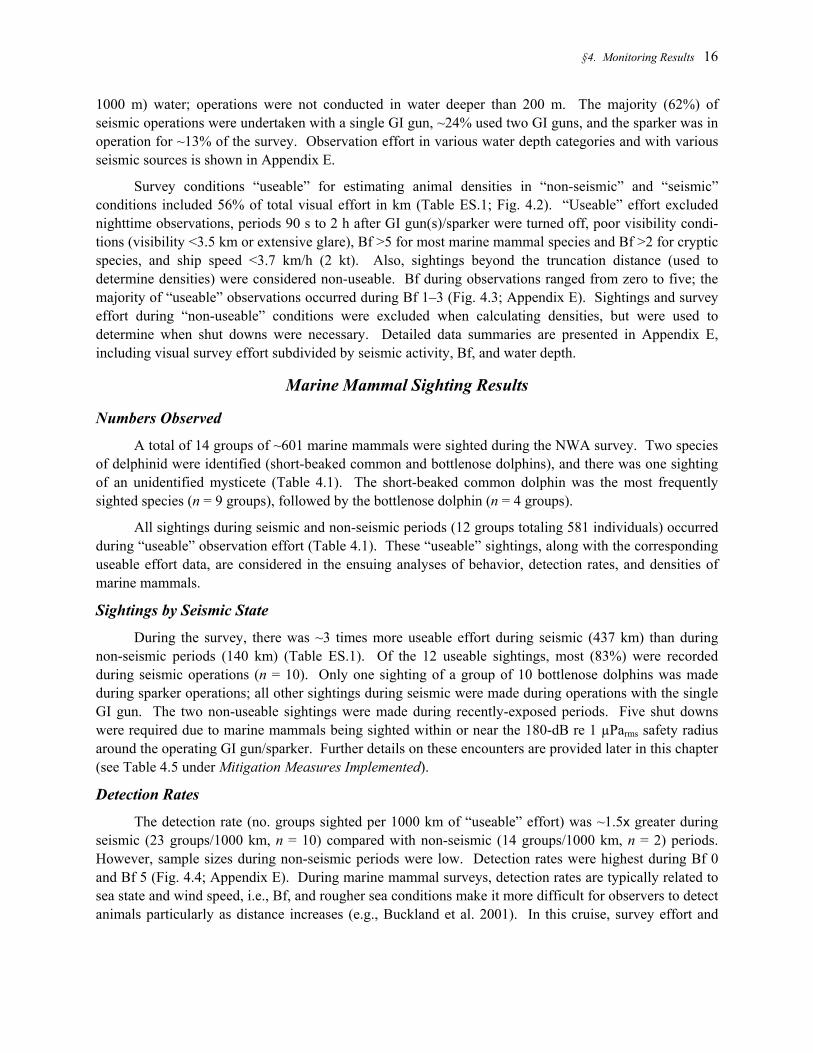
Detection Rates
The detection rate (no. groups sighted per 1000 km of “useable” effort) was ~1.5x greater during seismic (23 groups/1000 km, n = 10) compared with non-seismic (14 groups/1000 km, n = 2) periods. However, sample sizes during non-seismic periods were low. Detection rates were highest during Bf 0 and Bf 5 (Fig. 4.4; Appendix E). During marine mammal surveys, detection rates are typically related to sea state and wind speed, i.e., Bf, and rougher sea conditions make it more difficult for observers to detect animals particularly as distance increases (e.g., Buckland et al. 2001). In this cruise, survey effort and

§4. Monitoring Results 17
0
200
400
600
800
1000
Exposed Recently Exposed Not Exposed
Seismic Activity
MM
O E
ffor
t (km
)Non-useable
Useable
FIGURE 4.2. Total observer effort, categorized by seismic activity, during operations of the Endeavor off New England, 12–25 August 2009. Recently exposed = 90 s to 2 h after termination of seismic operations.
0
100
200
300
400
500
0 1 2 3 4 5Beaufort Wind Force (Bf)
MM
O E
ffor
t (km
)
Non-useable
Useable
FIGURE 4.3. Total observer effort, categorized by Beaufort wind force, during operations of the Endeavor off New England, 12–25 August 2009. All effort with Bf>2 was considered non-useable when considering sightings of cryptic species, though there were no such sightings in this study.
§4. Monitoring Results 18
TABLE 4.1. Numbers of marine mammals observed from the Endeavor during the NWA cruise, 12–25 August 2009. All sightings during seismic and non-seismic periods were “useable”.
0
10
20
30
40
50
60
70
80
Beaufort Wind Force (Bf)
Det
ectio
n R
ate
(Sig
htin
gs/1
000
km)
FIGURE 4.4. Marine mammal detection rates (based on useable sightings and effort) from the Endeavor during different Beaufort Wind Force conditions during the NWA cruise, 12–25 August 2009. X = no survey effort in this Bf state. Number of sightings above bars.
numbers of sightings with most categories of Bf were low, limiting what can be said about the relation-ship of sighting rate to Bf.
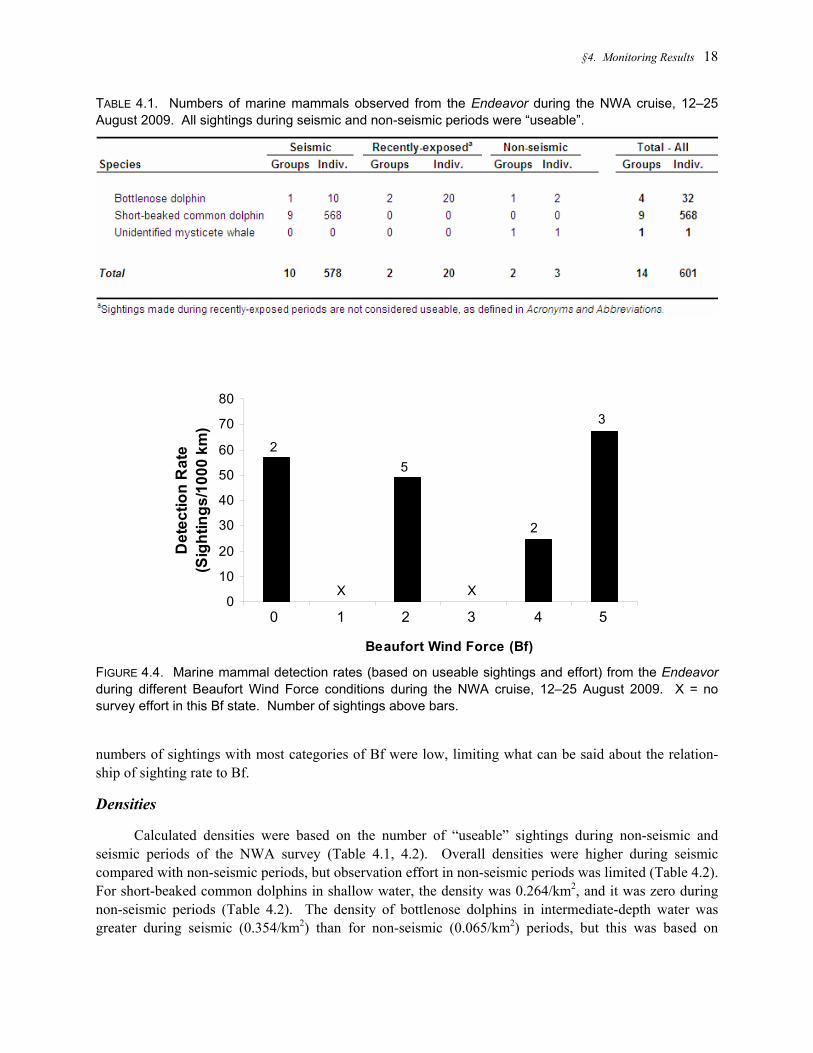
Densities
Calculated densities were based on the number of “useable” sightings during non-seismic and seismic periods of the NWA survey (Table 4.1, 4.2). Overall densities were higher during seismic compared with non-seismic periods, but observation effort in non-seismic periods was limited (Table 4.2). For short-beaked common dolphins in shallow water, the density was 0.264/km2, and it was zero during non-seismic periods (Table 4.2). The density of bottlenose dolphins in intermediate-depth water was greater during seismic (0.354/km2) than for non-seismic (0.065/km2) periods, but this was based on
0 1 2 3 4 5
X X
2 5
2
3
§4. Monitoring Results 19
TABLE 4.2. Sightings and densities of cetaceans in water depths (A) <100 m and (B) 100–1000 m during “useable” survey effort in the study area off New England, 12–25 August 2009. Effort is shown for seismic/non-seismic periods. Cetacean densities were corrected for f(0) and g(0) using values from Koski et al. (1998) and Barlow (1999). No operations occurred in water deeper than 200 m.
limited survey effort (Table 4.2). Only 8% of useable effort occurred in intermediate-depth water (see Appendix E).
Other Vessels
A number of small sport fishing boats and commercial fishing vessels were present in the study area during the survey, especially in nearshore areas. On 16 August, one small sport fishing vessel was seen ~700 m off the starboard side of the Endeavor while a group of 50 short-beaked common dolphins was milling ~750 m off the bow of the Endeavor. At the time of the sighting, 1 GI gun was in operation, and the Endeavor was making a turn to port. The dolphins were sighted for ~5 min, and the sport fishing vessel was traveling towards the dolphins. The dolphins remained outside of the safety radius while the single GI gun was firing, and no interaction between the sport fishing vessel and dolphins was observed.
Several hours later on 16 August, a group of 18 short-beaked common dolphins was seen traveling towards the Endeavor while one GI gun was in operation. At the same time, a lobster boat was seen 1 km ahead of the Endeavor. As the dolphins came within ~30 m of the bow, the GI gun was shut down. The dolphins swam towards the stern of the vessel and were then seen swimming away.
Marine Mammal Distribution and Behavior
Data collected during visual observations provide information about behavioral responses of marine mammals to the seismic survey. The relevant data collected from the Endeavor include the closest observed point of approach (CPA) to the seismic source, movement relative to the vessel, and behavior of animals at the time of the initial sighting.
Marine mammal behavior is difficult to observe, especially from a seismic vessel, because individ-uals and/or groups are often at the surface only briefly, and there may be avoidance behavior. This causes difficulties in resighting those animals, and in determining whether two sightings some minutes apart are repeat sightings of the same individual(s). Also, low sample sizes during any single cruise (including this one) make many of the results from an individual cruise difficult to interpret. However, at least some of these results will be meaningful when combined with similar results from other related seismic surveys.
§4. Monitoring Results 20
The position of MMOs on the vessel, and where they focused their observation efforts, yielded a distribution of animal sightings relative to the Endeavor that was skewed towards the front of the vessel. Nearly all sightings were of animals in the forward 180° relative to the vessel.
Closest Point of Approach
The mean CPA calculations are based on very small sample sizes, particularly for non-seismic periods (n = 2; Table 4.3). For delphinids, the mean CPA during seismic periods was 1076 m (n = 10 sightings) compared with a CPA of 3695 m for one delphinid group seen during non-seismic periods (Table 4.3). The CPA for the one unidentified mysticete seen during non-seismic was 613 m (Table 4.3).
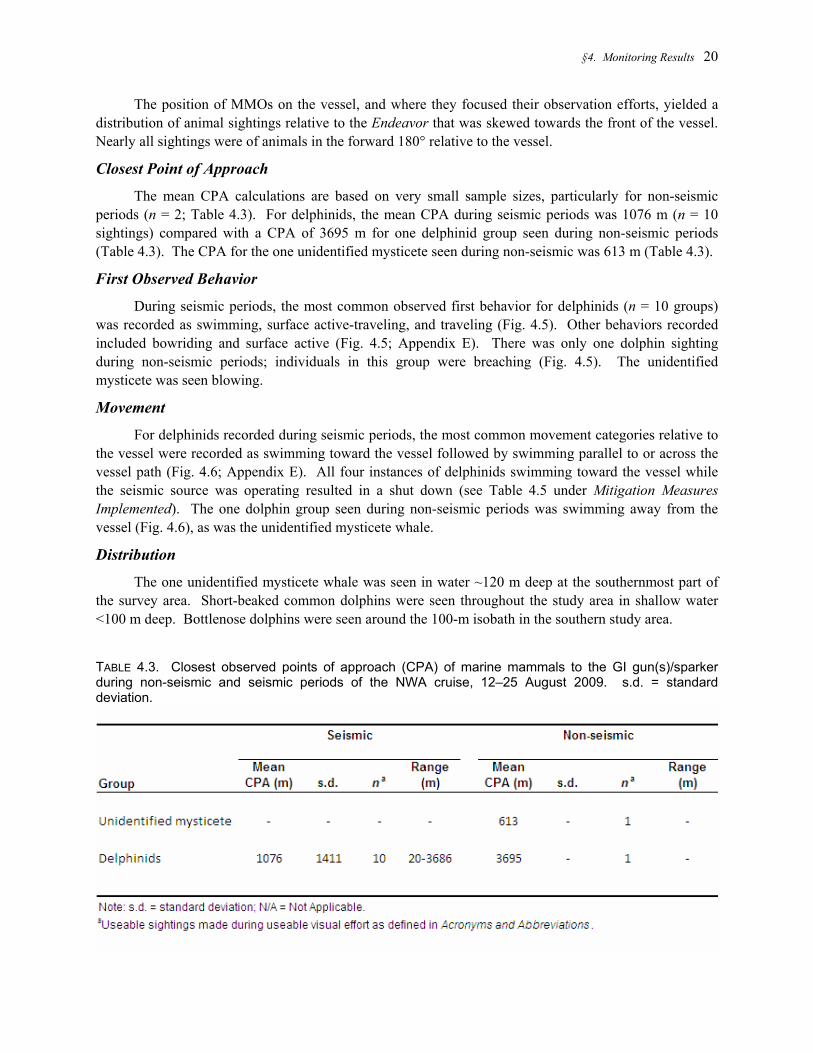
First Observed Behavior
During seismic periods, the most common observed first behavior for delphinids (n = 10 groups) was recorded as swimming, surface active-traveling, and traveling (Fig. 4.5). Other behaviors recorded included bowriding and surface active (Fig. 4.5; Appendix E). There was only one dolphin sighting during non-seismic periods; individuals in this group were breaching (Fig. 4.5). The unidentified mysticete was seen blowing.
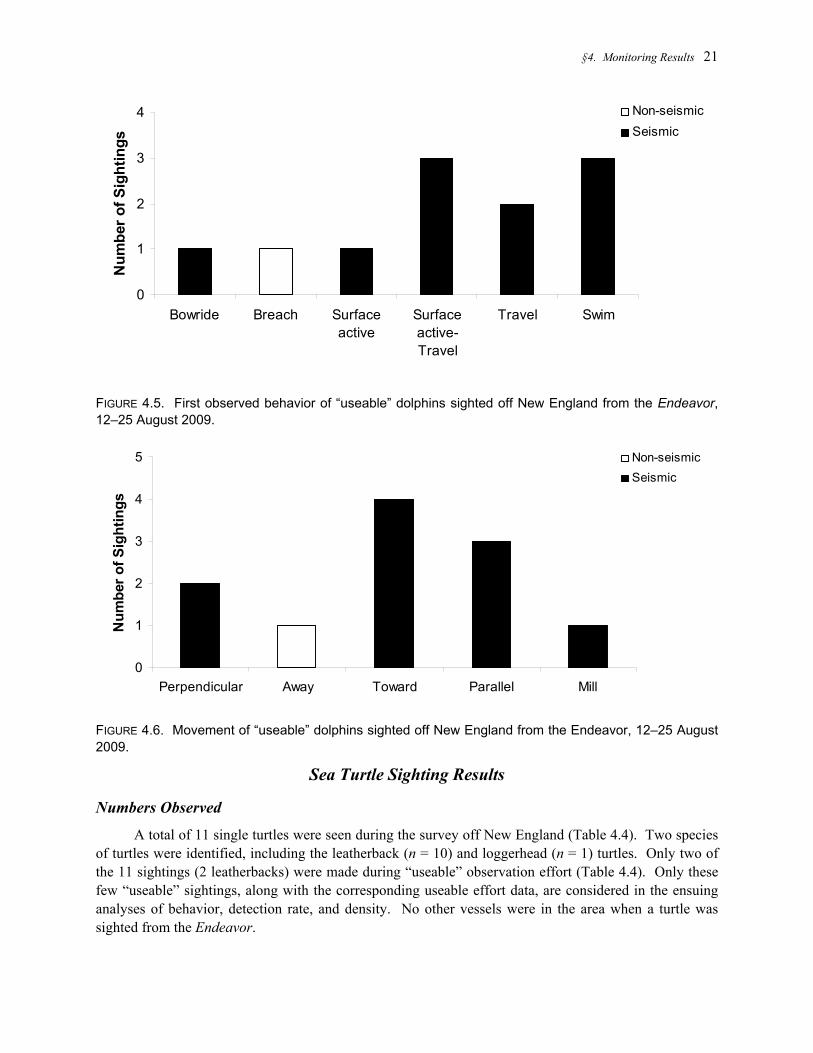
Movement
For delphinids recorded during seismic periods, the most common movement categories relative to the vessel were recorded as swimming toward the vessel followed by swimming parallel to or across the vessel path (Fig. 4.6; Appendix E). All four instances of delphinids swimming toward the vessel while the seismic source was operating resulted in a shut down (see Table 4.5 under Mitigation Measures Implemented). The one dolphin group seen during non-seismic periods was swimming away from the vessel (Fig. 4.6), as was the unidentified mysticete whale.
Distribution
The one unidentified mysticete whale was seen in water ~120 m deep at the southernmost part of the survey area. Short-beaked common dolphins were seen throughout the study area in shallow water <100 m deep. Bottlenose dolphins were seen around the 100-m isobath in the southern study area.
TABLE 4.3. Closest observed points of approach (CPA) of marine mammals to the GI gun(s)/sparker during non-seismic and seismic periods of the NWA cruise, 12–25 August 2009. s.d. = standard deviation.
§4. Monitoring Results 21
0
1
2
3
4
Bowride Breach Surfaceactive
Surfaceactive-Travel
Travel Swim
Num
ber o
f Sig
htin
gsNon-seismicSeismic
FIGURE 4.5. First observed behavior of “useable” dolphins sighted off New England from the Endeavor, 12–25 August 2009.
0
1
2
3
4
5
Perpendicular Away Toward Parallel Mill
Num
ber o
f Sig
htin
gs
Non-seismicSeismic
FIGURE 4.6. Movement of “useable” dolphins sighted off New England from the Endeavor, 12–25 August 2009.
Sea Turtle Sighting Results
Numbers Observed
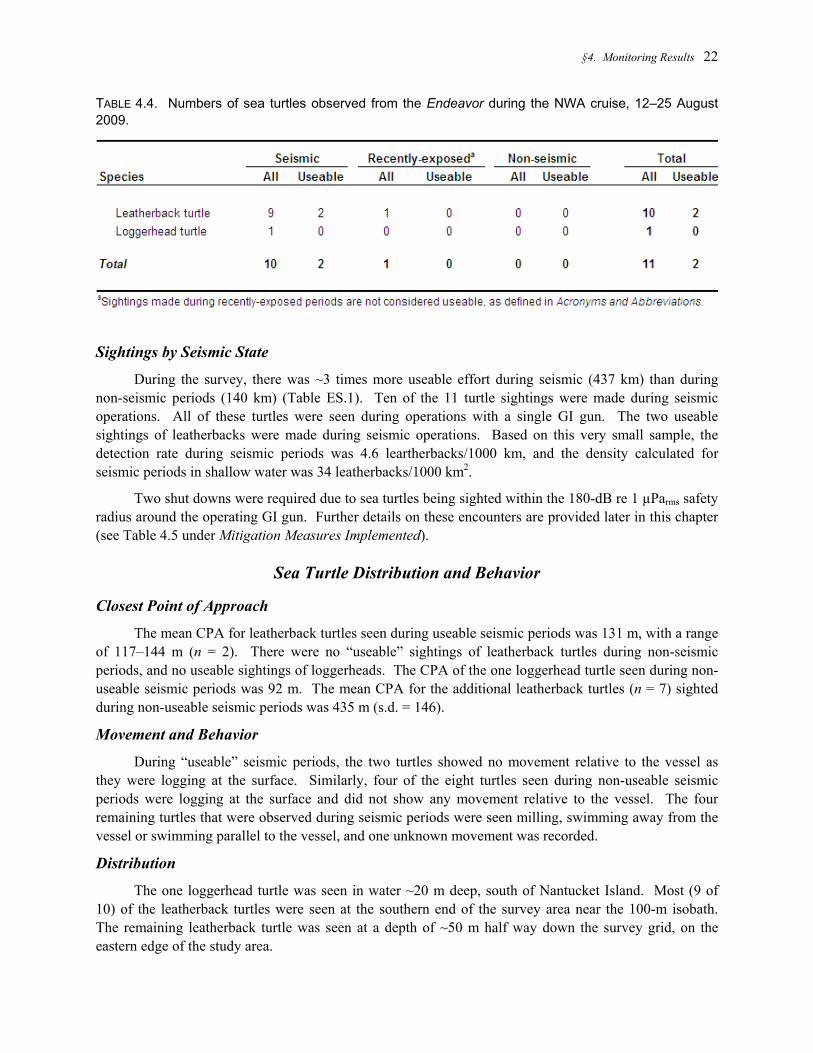
A total of 11 single turtles were seen during the survey off New England (Table 4.4). Two species of turtles were identified, including the leatherback (n = 10) and loggerhead (n = 1) turtles. Only two of the 11 sightings (2 leatherbacks) were made during “useable” observation effort (Table 4.4). Only these few “useable” sightings, along with the corresponding useable effort data, are considered in the ensuing analyses of behavior, detection rate, and density. No other vessels were in the area when a turtle was sighted from the Endeavor.
§4. Monitoring Results 22
TABLE 4.4. Numbers of sea turtles observed from the Endeavor during the NWA cruise, 12–25 August 2009.
Sightings by Seismic State
During the survey, there was ~3 times more useable effort during seismic (437 km) than during non-seismic periods (140 km) (Table ES.1). Ten of the 11 turtle sightings were made during seismic operations. All of these turtles were seen during operations with a single GI gun. The two useable sightings of leatherbacks were made during seismic operations. Based on this very small sample, the detection rate during seismic periods was 4.6 leartherbacks/1000 km, and the density calculated for seismic periods in shallow water was 34 leatherbacks/1000 km2.
Two shut downs were required due to sea turtles being sighted within the 180-dB re 1 µParms safety radius around the operating GI gun. Further details on these encounters are provided later in this chapter (see Table 4.5 under Mitigation Measures Implemented).
Sea Turtle Distribution and Behavior
Closest Point of Approach
The mean CPA for leatherback turtles seen during useable seismic periods was 131 m, with a range of 117–144 m (n = 2). There were no “useable” sightings of leatherback turtles during non-seismic periods, and no useable sightings of loggerheads. The CPA of the one loggerhead turtle seen during non-useable seismic periods was 92 m. The mean CPA for the additional leatherback turtles (n = 7) sighted during non-useable seismic periods was 435 m (s.d. = 146).
Movement and Behavior
During “useable” seismic periods, the two turtles showed no movement relative to the vessel as they were logging at the surface. Similarly, four of the eight turtles seen during non-useable seismic periods were logging at the surface and did not show any movement relative to the vessel. The four remaining turtles that were observed during seismic periods were seen milling, swimming away from the vessel or swimming parallel to the vessel, and one unknown movement was recorded.
Distribution
The one loggerhead turtle was seen in water ~20 m deep, south of Nantucket Island. Most (9 of 10) of the leatherback turtles were seen at the southern end of the survey area near the 100-m isobath. The remaining leatherback turtle was seen at a depth of ~50 m half way down the survey grid, on the eastern edge of the study area.
§4. Monitoring Results 23
Mitigation Measures Implemented
Ramp ups and shut downs of the two GI guns, and shut downs of the single GI gun/sparker were implemented as mitigation measures during the NWA cruise. Ramp ups were conducted whenever the two GI guns were started up after >4 min of inactivity.
Shut downs occurred for five dolphin groups (totaling 103 individuals) seen within or near the safety radius (Table 4.5). One shut down occurred during sparker operations, and the other four shut downs occurred when 1 GI gun was operating. Only two of the five dolphin groups for which a shut down was implemented were in the safety zone when first observed and had presumably been exposed to strong GI gun pulses before the initial sighting. These two groups of short-beaked common dolphins were very likely exposed to GI gun sounds with received levels ≥190 dB re 1 µParms prior to shut down (Table 4.5). This assumes that the animals, while inside the safety radius, were well below the surface when one or more of the GI gun pulses were received. The other three dolphin groups were likely exposed to sounds ≥170 dB but <180 dB re 1 µParms before shut down (Table 4.5).
1. A group of 10 bottlenose dolphins was seen at dawn on 14 August in intermediate-depth water while the sparker was in use (safety radius assumed to be the same as for 2 GI guns or 60 m). The dolphins came to bowride, and their CPA to the sparker was ~95 m. As the dolphins did not enter the safety radius, it is likely that they, when below the surface, were exposed to sound levels ≥170 dB re 1 µParms (flat-weighted) but <180 dB.
2. A group of 25 short-beaked common dolphins was seen in the afternoon of 16 August in shallow water while the single GI gun was in operation (safety radius was 150 m). The dolphins were seen swimming parallel to the vessel, and ~163 m from the GI gun. As the dolphins did not enter the safety radius, it is likely that they, when below the surface, were exposed to sound levels ≥170 dB re 1 µParms (flat-weighted) but <180 dB.
3. Another group of short-beaked common dolphins (40 individuals) was seen in the afternoon of 16 August in shallow water while the single GI gun was in operation (safety radius was 150 m). They were first seen at a distance of 1066 m swimming towards the vessel. As two of the dolphins approached the safety radius, a shut down was called for. However, due to a failure of the communication system, the GI gun was not shut down until the dolphins were 20 m from the operating GI gun. The other 38 dolphins remained outside of the safety radius. As the two dolphins came well within the safety radius, it is likely that they, when below the surface, were exposed to sound levels ≥190 dB re 1 µParms. As the rest of the group was seen outside of the safety radius, at a distance of ~400 m from the GI gun, it is likely that they were exposed to sound levels >160 dB but <170 dB.
4. A group of 18 short-beaked common dolphins was seen on the afternoon of 16 August in shallow water while one GI gun was in use (safety radius was 150 m). Initially, a group of eight dolphins was seen 200 m off the bow and swimming towards the vessel. A second group of 10 individuals was then seen 30 m off the bow and the GI gun was shut down. The two groups joined aft of the vessel and swam away from the ship. As the group of eight dolphins came well within the safety radius and slightly inside the estimated 190-dB radius, it is possible that they, when below the surface, were exposed to sound levels ≥190 dB re 1 µParms. Also, the other group of 10 dolphins was nearby, and although it was not seen to be within the safety radius, it is possible that it also was exposed to sound levels >190 dB.
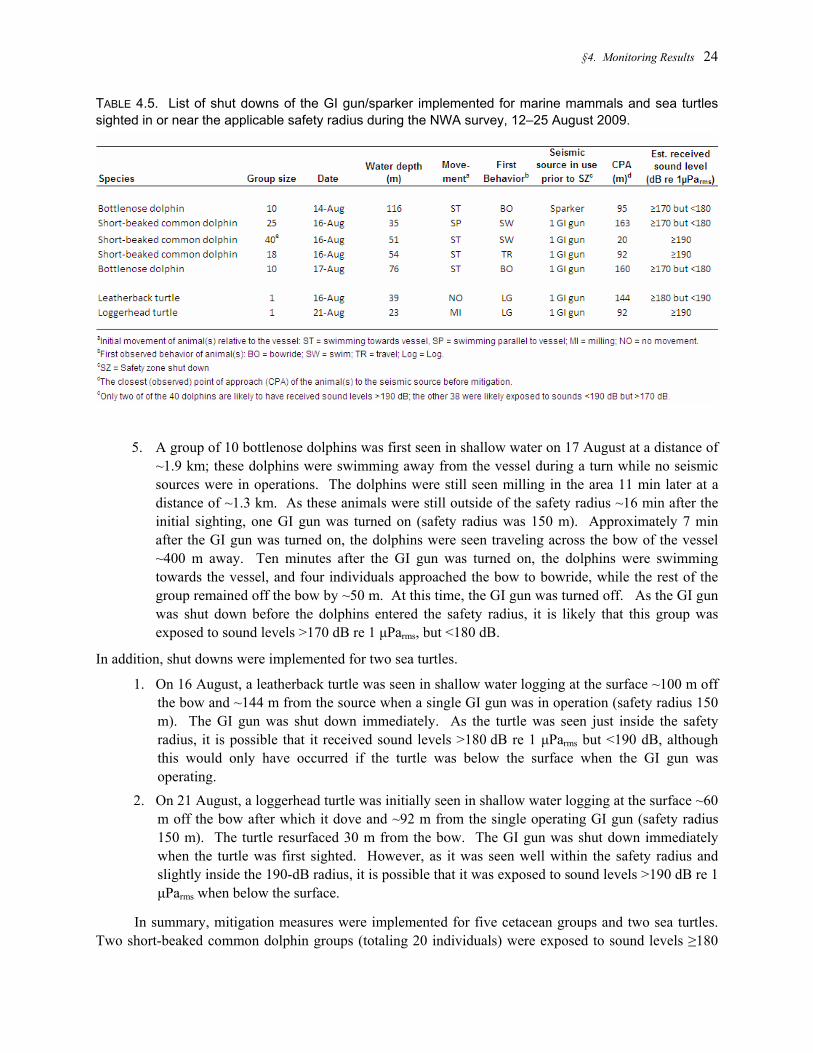
§4. Monitoring Results 24
TABLE 4.5. List of shut downs of the GI gun/sparker implemented for marine mammals and sea turtles sighted in or near the applicable safety radius during the NWA survey, 12–25 August 2009.
5. A group of 10 bottlenose dolphins was first seen in shallow water on 17 August at a distance of ~1.9 km; these dolphins were swimming away from the vessel during a turn while no seismic sources were in operations. The dolphins were still seen milling in the area 11 min later at a distance of ~1.3 km. As these animals were still outside of the safety radius ~16 min after the initial sighting, one GI gun was turned on (safety radius was 150 m). Approximately 7 min after the GI gun was turned on, the dolphins were seen traveling across the bow of the vessel ~400 m away. Ten minutes after the GI gun was turned on, the dolphins were swimming towards the vessel, and four individuals approached the bow to bowride, while the rest of the group remained off the bow by ~50 m. At this time, the GI gun was turned off. As the GI gun was shut down before the dolphins entered the safety radius, it is likely that this group was exposed to sound levels >170 dB re 1 µParms, but <180 dB.
In addition, shut downs were implemented for two sea turtles.
1. On 16 August, a leatherback turtle was seen in shallow water logging at the surface ~100 m off the bow and ~144 m from the source when a single GI gun was in operation (safety radius 150 m). The GI gun was shut down immediately. As the turtle was seen just inside the safety radius, it is possible that it received sound levels >180 dB re 1 µParms but <190 dB, although this would only have occurred if the turtle was below the surface when the GI gun was operating.
2. On 21 August, a loggerhead turtle was initially seen in shallow water logging at the surface ~60 m off the bow after which it dove and ~92 m from the single operating GI gun (safety radius 150 m). The turtle resurfaced 30 m from the bow. The GI gun was shut down immediately when the turtle was first sighted. However, as it was seen well within the safety radius and slightly inside the 190-dB radius, it is possible that it was exposed to sound levels >190 dB re 1 µParms when below the surface.
In summary, mitigation measures were implemented for five cetacean groups and two sea turtles. Two short-beaked common dolphin groups (totaling 20 individuals) were exposed to sound levels ≥180
§4. Monitoring Results 25
dB re 1 µParms during the NWA survey (Table 4.4). Typically, only one or a few shots were fired between the initial detection and the time when the seismic source was shut down. However, due to a failure in the communication system, two short-beaked common dolphins may have received multiple pulses from the single GI gun at a received level >180 dB as they approached the seismic source. Both groups of short-beaked common dolphins were also inside the nominal 190-dB radius prior to mitigation; these animals were presumably exposed to strong airgun pulses. The sound levels received by these dolphins may have been ≥190 dB re 1 µParms, for some of the GI gun pulses prior to the shut down. This assumes that the animals, while inside the safety radius, were at some point well below the surface when one or more of the GI gun pulses were received. Received levels when the animals were at or near the surface would have been substantially lower due to the effects of pressure-release at the surface. One leatherback turtle was sighted within the safety radius and likely exposed to sound levels ≥180 dB re 1 µParms, and one loggerhead turtle likely received sound levels ≥190 dB re 1 µParms.
These estimates of numbers exposed to various sound levels are minima; they do not allow for animals present during daytime seismic operations but not seen by the MMOs, or for animals approached during seismic operations at night. Estimates of numbers potentially exposed to various sound levels under those and other circumstances, allowing for missed animals, are provided in a subsequent section.
Implementation of the Terms and Conditions of the Incidental Take Statement
In order to minimize the incidental ‘taking’ of ESA-listed species, Rice implemented the above-mentioned mitigation measures for marine mammals and sea turtles sighted near or within the safety radius. No humpback, blue, fin, sei, North Atlantic right, or sperm whales were identified during the NWA survey, and few if any individuals of these species are likely to have occurred within the safety radii. Similarly, no green or Kemp’s ridley turtles were seen during the survey. One unidentified baleen whale was seen in the study area, but neither the sparker nor GI gun(s) were in operation at the time.
In addition to the typical monitoring and mitigation measures, such as ramp ups and shut downs (see Chapter 3), the Biological Opinion also specified the following mitigation measures: (1) avoidance of areas with known concentrations of ESA-listed species, such as blue, fin, humpback, sei or sperm whales, and (2) immediate shut down of all seismic sources in the event a North Atlantic right whale is sighted at any distance from the vessel. No concentrations of marine mammals were seen during the survey, and no Atlantic right whales were sighted.
However, 11 sea turtles were seen during the study, including 10 endangered leatherback turtles and one threatened loggerhead turtle. Ten turtles (including the loggerhead) were seen during seismic operations with a single GI gun, and another turtle was seen ~20 min after the two GI guns were shut down. Nine of these turtles were likely exposed to received sound levels ≥160 dB re 1 µParms. Two turtles were seen within the safety zone; one leatherback and one loggerhead turtle were likely exposed to received sound levels of 180 dB and 190 dB re 1 µParms, respectively. These turtles did not appear to react to the GI gun sounds in a biologically significant manner.
Estimated Number of Marine Mammals Potentially Affected
It is difficult to obtain meaningful estimates of “take by harassment” for several reasons: (1) The relationship between numbers of marine mammals that are observed and the number actually present is uncertain. (2) The most appropriate criteria for “take by harassment” are uncertain and presumably vari-able among species and situations. (3) The distance to which a received sound level exceeds a specific
§4. Monitoring Results 26
criterion such as 190 dB, 180 dB, 170 dB, or 160 dB re 1 µParms is variable. It depends on water depth, airgun depth, and aspect for directional sources (e.g., Greene 1997; Greene et. al. 1998; Burgess and Greene 1999; Caldwell and Dragoset 2000; Tolstoy et al. 2004a,b). (4) The sounds received by marine mammals vary depending on their depth in the water, and will be considerably reduced for animals at or near the surface (Greene and Richardson 1988; Tolstoy et al. 2004a,b). Also, in a short survey such as this one, the observation effort by MMOs is limited and often inadequate to provide reliable estimates of animal abundance. This limits the ability to estimate numbers of individual marine mammals or sea turtles exposed to various sound levels.
Disturbance and Safety Criteria
Any marine mammal that might have been exposed to sound pulses with received sound levels ≥160 dB re 1 µParms (flat-weighted) was assumed to have been potentially disturbed. Such disturbance was authorized by the IHA issued to Rice. However, the 160-dB criterion was developed by NMFS from studies of baleen whale reactions to seismic pulses (Richardson et al. 1995). That criterion likely is not scientifically defensible for delphinids, some porpoises, or most pinnipeds. The hearing of small odontocetes is relatively insensitive to low frequencies, and behavioral reactions of small odontocetes and pinnipeds to airgun sounds indicate that they are usually less responsive than are some baleen whales (Richardson et al. 1995; Gordon et al. 2004; Southall et al. 2007). We estimate the numbers of all cetaceans that were exposed to ≥160 dB re 1 µParms as required by the IHA, but we also estimate numbers of delphinids that might have been exposed to ≥170 dB re 1 µParms, an alternative and more realistic criterion of disturbance to delphinids.
Table 3.1 shows the predicted received sound levels at various distances from the seismic sources deployed from the Endeavor. The ≥160-dB radius is an assumed behavioral disturbance criterion. The ≥180 dB- and ≥190-dB distances are the safety radii for cetaceans and pinnipeds, respectively, used in determining when mitigation measures are required. During this project, NMFS required that mitigation measures be applied to avoid, or minimize, the exposure of cetaceans (and sea turtles) to impulse sounds with received levels ≥180 dB re 1 µParms and of pinnipeds to received levels ≥190 dB re 1 µParms. During this study, several shut downs were required (as described above) due to marine mammals (and sea turtles) being sighted within or near the applicable safety radii around the operating seismic source. However, additional estimates of the numbers of marine mammals potentially exposed to various received sound levels were also derived based on observed densities and the assumed 160-, 170-, and 180-dB re 1 µParms distances. These additional estimates allow for animals not seen by the MMOs as well as for the animals that were seen.
This section applies two methods to estimate the number of marine mammals possibly exposed to seismic sound levels strong enough that they might have caused a disturbance or other potential impacts. The procedures include (A) minimum estimates based on marine mammals observed by MMOs during the survey, and (B) estimates based on marine mammal densities obtained during this study. The actual numbers of individual marine mammals exposed to, and potentially affected by, seismic survey sounds were likely between the minimum and maximum estimates provided in the following sections. The estimates provided here are based on observations during this project. In contrast, the estimates provided in the IHA Application and EA for this project (LGL Ltd. 2009a,b) were based on survey and other information available prior to the fieldwork.
§4. Monitoring Results 27
Estimates from Direct Observations
The number of marine mammals observed close to the Endeavor during the seismic study provides a minimum estimate of the number potentially affected by seismic sounds. This likely underestimates the actual number potentially affected. Some animals may have moved away before coming within visual range of MMOs, and it is unlikely that MMOs were able to detect all of the marine mammals near the vessel trackline. During daylight, animals cannot be seen if they are below the surface when the ship is nearby. Some other marine mammals, even if they surface near the vessel, are missed because of limited visibility (e.g., fog), glare, or other factors limiting sightability. Furthermore, marine mammals cannot be seen effectively during periods of darkness.
Cetaceans Potentially Exposed to Sounds ≥180 dB re 1 µParms.—During the survey off New England, five dolphin groups totaling 103 individuals were sighted within or near the safety radius around the seismic source; a shut down was implemented on each of those occasions (Table 4.5). The sound levels received by two of the five dolphin groups (or 20 individuals) likely exceeded 180 dB re 1 µParms prior to mitigation (Table 4.5). All 20 individuals were short-beaked common dolphins.
The estimated 180-dB radii are the maximum distances from the seismic source where sound levels were expected to be ≥180 dB re 1 µParms. These distances would apply at the water depth with maximum received level and in the direction (from the seismic source) where the sounds were strongest. Thus, there are complications in assessing the maximum level to which any specific individual mammal might have been exposed:
• Near the water surface, received sound levels are considerably reduced because of pressure-release effects. In many cases, it is unknown whether animals seen at the surface were earlier (or later) exposed to the maximum levels that they would receive if they dove.
• For bow- or wake-riding dolphins observed at or near the surface for extended periods, the received seismic sounds are reduced relative to levels at deeper depths. However, dolphins observed bow- or wake-riding may be at depth for portions of the time while within the safety radius.
• Some cetaceans may have been within the predicted 180-dB radii and/or within the safety radii while underwater and not visible to observers, and subsequently seen outside these radii. The direction of movement as noted by MMOs can give some indication of this.
Seismic operations occurred at night as well as during daytime, but MMOs were generally not on duty at night (and had much reduced ability to sight mammals on occasions when they were on duty at night). During this project, ~44% of the seismic operations occurred at night. If marine mammals were encountered at similar rates by night as by day, then the total numbers exposed to various sound levels were presumably almost twice the numbers estimated by direct observation in daytime. However, in the absence of the nighttime sighting data that would be needed as a basis for initiating shut downs at night, on a per-encounter basis, the frequency of exposure to high sound levels would be somewhat higher by night than by day. In addition, ~13% of daytime observation effort during seismic occurred during periods of poor visibility.
Cetaceans Potentially Exposed to Sounds ≥160 dB re 1 µParms.—Ten sightings totaling ~578 cetaceans were made during seismic periods (Table 4.1; Appendix E). Of these, six groups totaling 115 dolphins were seen within the ≥160-dB radius (as specified in Table 3.1) of the operating seismic source. However, most dolphins exposed to received levels of ~160–170 dB re 1 µParms may not have been

§4. Monitoring Results 28
disturbed significantly, as previously noted. Additional marine mammals would be exposed during seismic operations at night and in periods of poor visibility. Missed animals are accounted for in estimates presented later in this section based on densities of animals during “useable” seismic periods.
Delphinids Potentially Exposed to Sounds ≥170 dB 1 µParms.—For delphinids, exposure to seismic sounds with received levels ≥170 dB may be a more appropriate criterion of disturbance than exposure to ≥160 dB, as discussed above. All six groups of dolphins (totaling 115 individuals) that were exposed to received levels >160 dB re 1 µParms were exposed to levels ≥170 dB re 1 µParm (flat-weighted) based on the radii listed in Table 3.1. There would have been additional exposures at night and in periods of poor visibility.
Estimates Extrapolated from Marine Mammal Density
The methodology used to estimate the areas exposed to received levels ≥160 dB, ≥170 dB, and ≥180 dB re 1 µParms, and to estimate corrected marine mammal densities, was described briefly in Chapter 3 Analyses and in further depth in Appendix C. Densities were based on the number of “useable” sightings during the survey and were calculated for both non-seismic and seismic periods (Table 4.2). However, only densities for seismic periods were used to estimate the number of marine mammal potentially affected, as sightings and effort during non-seismic periods were limited. The densities calculated from useable sightings and effort during seismic periods represent the densities of mammals that apparently remained within the area exposed to strong seismic pulses.
The corrected densities were used to estimate the number of marine mammal exposures to 160 dB and 170 dB, and the number of different individuals exposed. These numbers provide estimates of the number of animals potentially affected by seismic operations, as described in Chapter 3 and Appendix D.
Estimated Numbers of Marine Mammals Exposed to ≥160 or ≥170 dB re 1 µParms.—For all types of marine mammals, Table 4.6 shows numbers estimated to be exposed to ≥160 dB re 1 µParms; the table also shows estimated numbers of delphinids exposed to ≥170 dB. It is assumed that large non-delphinid cetaceans such as baleen whales are likely to be disturbed appreciably if exposed to received levels of seismic pulses ≥160 dB re 1 µParms. It is assumed that delphinids are unlikely to be disturbed appreciably unless exposed to received levels ≥170 dB, but we also estimate the (larger) numbers of delphinids exposed to ≥160 dB. These are not considered to be “all-or-nothing” criteria; some individual mammals may react strongly at lower received levels, but others are unlikely to react strongly unless levels are substantially above 160 or 170 dB.
Estimates Based on Densities during Seismic Periods: “Corrected” estimates of the densities of marine mammals present during seismic periods are given in Table 4.6. These corrected densities were used to estimate the number of marine mammals that were exposed to ≥160 and ≥170 dB, and thus potentially disturbed by seismic operations (Table 4.6).
(A) 160 dB re 1 µParms: Results from seismic periods indicate that an estimated 584 exposures to levels ≥160 dB, totaling 477 individuals (mostly dolphins), may have occurred (Table 4.6). These estimates include one exposure of an unidentified baleen whale.
(B) 170 dB re 1 µParms: On average, delphinids may be disturbed only if exposed to received levels of airgun sounds ≥170 dB re 1 µParms. Results from seismic periods indicate that an estimated 263 exposures to levels ≥160 dB, totaling ~232 dolphins, may have occurred during the NWA survey (Table 4.6).
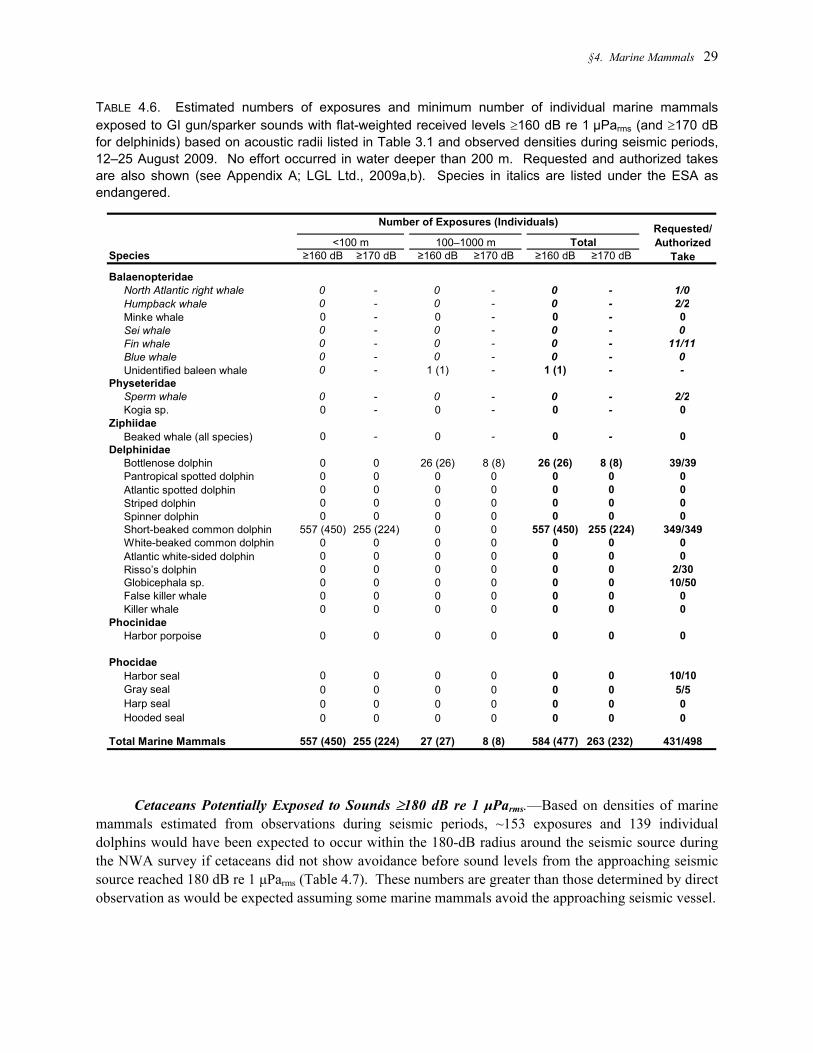
§4. Marine Mammals 29
TABLE 4.6. Estimated numbers of exposures and minimum number of individual marine mammals exposed to GI gun/sparker sounds with flat-weighted received levels ≥160 dB re 1 µParms (and ≥170 dB for delphinids) based on acoustic radii listed in Table 3.1 and observed densities during seismic periods, 12–25 August 2009. No effort occurred in water deeper than 200 m. Requested and authorized takes are also shown (see Appendix A; LGL Ltd., 2009a,b). Species in italics are listed under the ESA as endangered.
≥160 dB ≥170 dB ≥160 dB ≥170 dB ≥160 dB ≥170 dB
BalaenopteridaeNorth Atlantic right whale 0 - 0 - 0 - 1/0Humpback whale 0 - 0 - 0 - 2/2Minke whale 0 - 0 - 0 - 0Sei whale 0 - 0 - 0 - 0Fin whale 0 - 0 - 0 - 11/11Blue whale 0 - 0 - 0 - 0Unidentified baleen whale 0 - 1 (1) - 1 (1) - -
PhyseteridaeSperm whale 0 - 0 - 0 - 2/2Kogia sp. 0 - 0 - 0 - 0
ZiphiidaeBeaked whale (all species) 0 - 0 - 0 - 0
DelphinidaeBottlenose dolphin 0 0 26 (26) 8 (8) 26 (26) 8 (8) 39/39Pantropical spotted dolphin 0 0 0 0 0 0 0Atlantic spotted dolphin 0 0 0 0 0 0 0Striped dolphin 0 0 0 0 0 0 0Spinner dolphin 0 0 0 0 0 0 0Short-beaked common dolphin 557 (450) 255 (224) 0 0 557 (450) 255 (224) 349/349White-beaked common dolphin 0 0 0 0 0 0 0Atlantic white-sided dolphin 0 0 0 0 0 0 0Risso’s dolphin 0 0 0 0 0 0 2/30Globicephala sp. 0 0 0 0 0 0 10/50False killer whale 0 0 0 0 0 0 0Killer whale 0 0 0 0 0 0 0
PhocinidaeHarbor porpoise 0 0 0 0 0 0 0
PhocidaeHarbor seal 0 0 0 0 0 0 10/10Gray seal 0 0 0 0 0 0 5/5Harp seal 0 0 0 0 0 0 0Hooded seal 0 0 0 0 0 0 0
Total Marine Mammals 557 (450) 255 (224) 27 (27) 8 (8) 584 (477) 263 (232) 431/498
Requested/Authorized
Take
Number of Exposures (Individuals)
TotalSpecies
100–1000 m<100 m
Cetaceans Potentially Exposed to Sounds ≥180 dB re 1 µParms.—Based on densities of marine
mammals estimated from observations during seismic periods, ~153 exposures and 139 individual dolphins would have been expected to occur within the 180-dB radius around the seismic source during the NWA survey if cetaceans did not show avoidance before sound levels from the approaching seismic source reached 180 dB re 1 µParms (Table 4.7). These numbers are greater than those determined by direct observation as would be expected assuming some marine mammals avoid the approaching seismic vessel.
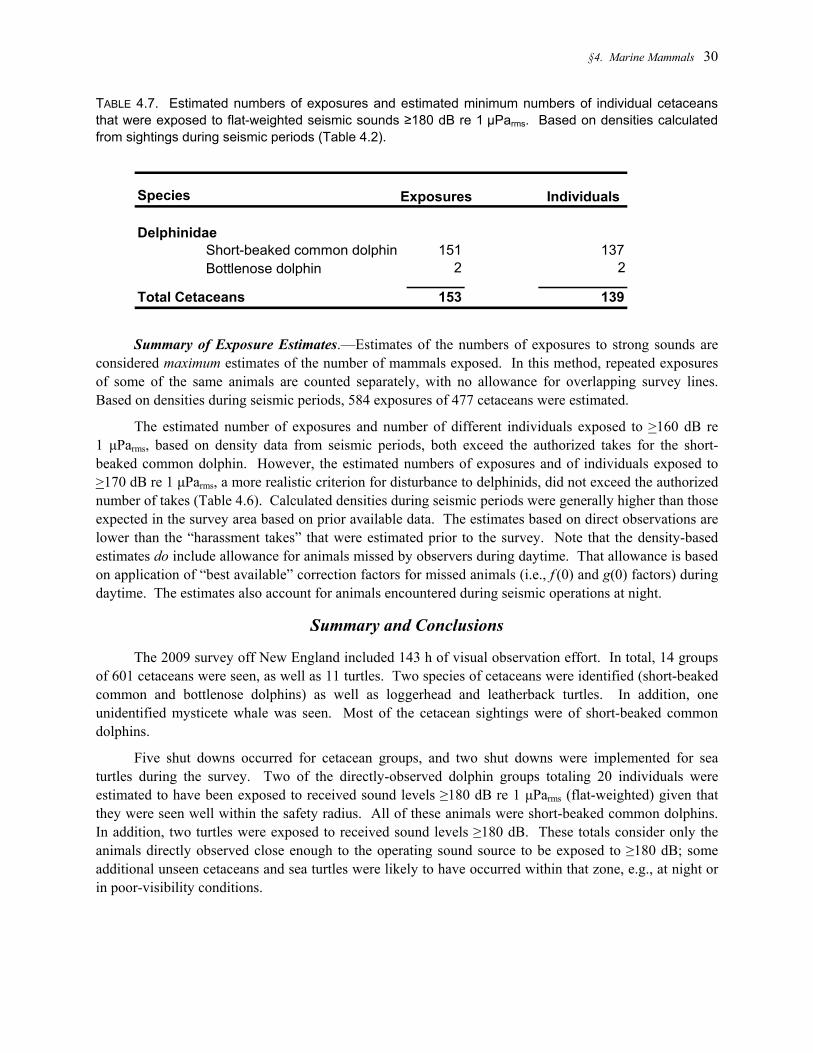
§4. Marine Mammals 30
TABLE 4.7. Estimated numbers of exposures and estimated minimum numbers of individual cetaceans that were exposed to flat-weighted seismic sounds ≥180 dB re 1 µParms. Based on densities calculated from sightings during seismic periods (Table 4.2).
Species Exposures Individuals
DelphinidaeShort-beaked common dolphin 151 137Bottlenose dolphin 2 2
Total Cetaceans 153 139
Summary of Exposure Estimates.—Estimates of the numbers of exposures to strong sounds are considered maximum estimates of the number of mammals exposed. In this method, repeated exposures of some of the same animals are counted separately, with no allowance for overlapping survey lines. Based on densities during seismic periods, 584 exposures of 477 cetaceans were estimated.
The estimated number of exposures and number of different individuals exposed to >160 dB re 1 µParms, based on density data from seismic periods, both exceed the authorized takes for the short-beaked common dolphin. However, the estimated numbers of exposures and of individuals exposed to >170 dB re 1 µParms, a more realistic criterion for disturbance to delphinids, did not exceed the authorized number of takes (Table 4.6). Calculated densities during seismic periods were generally higher than those expected in the survey area based on prior available data. The estimates based on direct observations are lower than the “harassment takes” that were estimated prior to the survey. Note that the density-based estimates do include allowance for animals missed by observers during daytime. That allowance is based on application of “best available” correction factors for missed animals (i.e., f (0) and g(0) factors) during daytime. The estimates also account for animals encountered during seismic operations at night.
Summary and Conclusions
The 2009 survey off New England included 143 h of visual observation effort. In total, 14 groups of 601 cetaceans were seen, as well as 11 turtles. Two species of cetaceans were identified (short-beaked common and bottlenose dolphins) as well as loggerhead and leatherback turtles. In addition, one unidentified mysticete whale was seen. Most of the cetacean sightings were of short-beaked common dolphins.
Five shut downs occurred for cetacean groups, and two shut downs were implemented for sea turtles during the survey. Two of the directly-observed dolphin groups totaling 20 individuals were estimated to have been exposed to received sound levels ≥180 dB re 1 µParms (flat-weighted) given that they were seen well within the safety radius. All of these animals were short-beaked common dolphins. In addition, two turtles were exposed to received sound levels ≥180 dB. These totals consider only the animals directly observed close enough to the operating sound source to be exposed to ≥180 dB; some additional unseen cetaceans and sea turtles were likely to have occurred within that zone, e.g., at night or in poor-visibility conditions.
§4. Marine Mammals 31
The analyses considered only “useable” survey effort totaling 80 h or 578 km and “useable” sightings (n = 12). Densities of cetaceans near the ship during seismic and non-seismic periods were difficult to compare, as only two sightings were made during non-seismic periods. In general, densities were greater during seismic compared to non-seismic periods. The detection rate was ~1.5x greater during seismic (23/1000 km, n = 10) compared with non-seismic periods (14/1000 km, n = 2). Given the limited duration of observations in non-seismic conditions and the correspondingly low number of sightings in those conditions, these differences should be interpreted cautiously. However, these data contribute to the overall accumulation of data across this and NSF-funded seismic surveys. In any case, the estimated number of cetaceans exposed to strong seismic sounds during the NWA survey was lower than that authorized by NMFS based on direct observation. Similarly, based on densities derived from the survey, the numbers of exposures and individuals exposed to >170 dB re 1 µParms, a more realistic disturbance criterion for delphinids, were also under the take limit.

§5. Acknowledgements 32
5. ACKNOWLEDGEMENTS
Rice University’s Department of Earth Science and the National Science Foundation (NSF) provided the funding for this survey and the associated marine mammal and sea turtle monitoring program. Lamont-Doherty Earth Observatory (L-DEO) also provided logistical support for the survey. We thank Meagan Cummings and Dr. John Diebold of L-DEO, Dr. William Lang and Holly Smith of NSF, and Dr. Brandon Dugan of Rice for assistance during planning and preparation for the cruise. William Cross of LGL was primarily responsible for preparing the IHA Application and associated Environmental Assessment.
The crew on the seismic source vessel Endeavor was supportive of the marine mammal monitoring and mitigation effort. The vessel-based fieldwork was made possible by the dedicated participation of three marine mammal observers from LGL: MH (team leader), Lee Shepherd, and Frances Robertson.
Mark Fitzgerald of LGL helped develop and implement procedures to estimate numbers of cetaceans that might have been exposed to seismic sounds, assisted with processing and analyzing data, and produced the maps and figures. Dr. W. John Richardson, LGL’s project director for the marine mammal monitoring, assisted at various stages during planning and fieldwork, and contributed and reviewed the draft report. Dr. Dugan and Holly Smith also reviewed a draft of this report.
This work was conducted under an Incidental Harassment Authorization issued by the U.S. National Marine Fisheries Service (NMFS), Office of Protected Resources. We thank Howard Goldstein and others of NMFS for processing the application, addressing the comments, and working with L-DEO and Rice to define the monitoring and mitigation requirements for this project.
§6. Literature Cited 33
6. LITERATURE CITED Bain, D.E. and R. Williams. 2006. Long-range effects of airgun noise on marine mammals: responses as a function
of received sound level and distance. Working Pap. SC/58/E35. Int. Whal. Comm., Cambridge, U.K. 13 p.
Barlow, J. 1999. Trackline detection probability for long-diving whales. p. 209-221 In: G.W. Garner, S.C. Amstrup, J.L. Laake, B.F.J. Manly, L.L. McDonald and D.G. Robertson (eds.), Marine mammal survey and assessment methods. A.A. Balkema, Rotterdam. 287 p.
Breitzke, M., O. Boebel, S.E. Naggar, W. Jokat and B. Werner. 2008. Broad-band calibration of marine seismic sources used by R/V Polarstern for academic research in polar regions. Geophys. J. Intern. 174(2):505-524.
Buckland, S.T., D.R. Anderson, K.P. Burnham, J.L. Laake, D.L. Borchers and L. Thomas. 2001. Introduction to distance sampling/Estimating abundance of biological populations. Oxford Univ. Press, Oxford, U.K. 432 p.
Burgess, W.C. and C.R. Greene, Jr. 1999. Physical acoustics measurements. p. 3-1 to 3-63 In: W.J. Richardson (ed.), Marine mammal and acoustical monitoring of Western Geophysical’s open-water seismic program in the Alaskan Beaufort Sea, 1998. LGL Rep. TA2230-3. Rep. from LGL Ltd., King City, Ont., and Greene-ridge Sciences Inc., Santa Barbara, CA, for Western Geophysical, Houston, TX, and U.S. Nat. Mar. Fish. Serv., Anchorage, AK, and Silver Spring, MD. 390 p.
Caldwell, J. and W. Dragoset. 2000. A brief overview of seismic air-gun arrays. The Leading Edge 2000(8, Aug.): 898-902.
EuroTurtle. 2006. Sea turtle outlines. http://www.euroturtle.org/outline/outline.htm
Gordon, J., D. Gillespie, J. Potter, A. Frantzis, M.P. Simmonds, R. Swift, and D. Thompson. 2004. A review of the effects of seismic surveys on marine mammals. Mar. Technol. Soc. J. 37(4):16-34.
Greene, C.R., Jr. 1997. Physical acoustics measurements. p. 3-1 to 3-63 In: W.J. Richardson (ed.), Northstar marine mammal monitoring program, 1996: marine mammal and acoustical monitoring of a seismic program in the Alaskan Beaufort Sea. LGL Rep. 2121-2. Rep. from LGL Ltd., King City, Ont., and Greeneridge Sciences Inc., Santa Barbara, CA, for BP Explor. (Alaska) Inc., Anchorage, AK, and Nat. Mar. Fish. Serv., Anchorage, AK, and Silver Spring, MD. 245 p.
Greene, C.R., Jr. and W.J. Richardson. 1988. Characteristics of marine seismic survey sounds in the Beaufort Sea. J. Acoust. Soc. Am. 83(6):2246-2254.
Greene, C.R., Jr., R. Norman and J.S. Hanna. 1998. Physical acoustics measurements. p. 3-1 to 3-64 In: W.J. Richardson (ed.), Marine mammal and acoustical monitoring of BP Exploration (Alaska)’s open-water seismic program in the Alaskan Beaufort Sea, 1997. LGL Rep. TA2150-3. Rep. from LGL Ltd., King City, Ont., and Greeneridge Sciences Inc., Santa Barbara, CA, for BP Explor. (Alaska) Inc., Anchorage, AK, and U.S. Nat. Mar. Fish. Serv., Anchorage, AK, and Silver Spring, MD. 318 p.
Haley, B. and W.R. Koski. 2004. Marine mammal monitoring during Lamont-Doherty Earth Observatory's ADWBC seismic program in the Northwest Atlantic Ocean, July–August 2004. LGL Rep. TA2822-27. Rep. from LGL Ltd., King City, Ont., for Lamont-Doherty Earth Observatory of Columbia Univ., Palisades, NY, and Nat. Mar. Fish. Serv., Silver Spring, MD. 80 p.
Harris, R.E., G.W. Miller and W.J. Richardson. 2001. Seal responses to airgun sounds during summer seismic surveys in the Alaskan Beaufort Sea. Mar. Mamm. Sci. 17(4):795-812.
Hauser, D.D.W. and M. Holst. 2009. Marine mammal monitoring during Lamont-Doherty Earth Observatory’s marine seismic program in the Gulf of Alaska, September–October 2008. LGL Rep. TA4412-3. Rep. from LGL Ltd., King City, Ont. and St. John’s, Nfld, for Lamont-Doherty Earth Observatory of Columbia Univ., Palisades, NY, and Nat. Mar. Fish. Serv., Silver Spring, MD. 78 p.
§6. Literature Cited 34
Hauser, D.D.W., M. Holst, and V.D. Moulton. 2008. Marine mammal and sea turtle monitoring during Lamont-Doherty Earth Observatory’s marine seismic program in the Eastern Tropical Pacific, April–August 2008. LGL Rep. TA4656/7-1. Rep. from LGL Ltd., King City, Ont. and St. John’s, Nfld, for Lamont-Doherty Earth Observatory of Columbia Univ., Palisades, NY, and Nat. Mar. Fish. Serv., Silver Spring, MD. 98 p.
Holst, M. and J. Beland. 2008. Marine mammal and sea turtle monitoring during Lamont-Doherty Earth Observatory’s seismic testing and calibration study in the northern Gulf of Mexico, November 2007–February 2008. LGL Rep. TA4295-2. Rep. from LGL Ltd., King City, Ont., for Lamont-Doherty Earth Observatory of Columbia Univ., Palisades, NY, and Nat. Mar. Fish. Serv., Silver Spring, MD. 77 p.
Holst, M. and M.A. Smultea. 2008. Marine mammal and sea turtle monitoring during Lamont-Doherty Earth Observatory’s marine seismic program off Central America, February–April 2008. LGL Rep. TA4342-3. Rep. from LGL Ltd., King City, Ont., for Lamont-Doherty Earth Observatory of Columbia Univ., Palisades, NY, and Nat. Mar. Fish. Serv., Silver Spring, MD. 133 p.
Holst, M., M.A. Smultea, W.R. Koski, and B. Haley. 2005a. Marine mammal and sea turtle monitoring during Lamont-Doherty Earth Observatory’s marine seismic program in the Eastern Tropical Pacific Ocean off Central America, November–December 2004. LGL Rep. TA2822-30. Rep. from LGL Ltd., King City, Ont., for Lamont-Doherty Earth Observatory of Columbia Univ., Palisades, NY, and Nat. Mar. Fish. Serv., Silver Spring, MD. 125 p.
Holst, M., M.A. Smultea, W.R. Koski, and B. Haley. 2005b. Marine mammal and sea turtle monitoring during Lamont-Doherty Earth Observatory’s marine seismic program off the Northern Yucatán Peninsula in the Southern Gulf of Mexico, January–February 2005. LGL Rep. TA2822-31. Rep. from LGL Ltd., King City, Ont., for Lamont-Doherty Earth Observatory of Columbia Univ., Palisades, NY, and Nat. Mar. Fish. Serv., Silver Spring, MD. 96 p.
Ireland, D., Holst, M., and W.R. Koski. 2005. Marine mammal monitoring during Lamont-Doherty Earth Observa-tory’s seismic program off the Aleutian Islands, Alaska, July–August 2005. LGL Rep. TA4089-3. Rep. from LGL Alaska Res. Assoc., Anchorage, AK, and LGL Ltd., King City, Ont., for Lamont-Doherty Earth Observatory of Columbia Univ., Palisades, NY, and Nat. Mar. Fish. Serv., Silver Spring, MD. 67 p.
IUCN (The World Conservation Union). 2009. IUCN Red List of Threatened Species. Version 2009.2. www.iucnredlist.org.
Koski, W.R., J.W. Lawson, D.H. Thomson, and W.J. Richardson. 1998. Point Mugu Sea Range marine mammal technical report. Rep. from LGL Ltd., King City, Ont., for Naval Air Warfare Cent., Weapons Div., Point Mugu, CA. 322 p.
LGL Ltd. 2009a. Request by Rice University for an incidental harassment authorization to allow the incidental take of marine mammals during a low-energy marine seismic survey in the Northwest Atlantic Ocean, August 2009. LGL Rep. TA4760-2. Rep. from LGL Ltd., King City Ont., for Rice University, Department of Earth Science, Houston, TX, and Nat. Sci. Found., Arlington, VA. 80 p.
LGL Ltd. 2009b. Environmental assessment of a marine geophysical survey by the R/V Endeavor in the Northwest Atlantic Ocean, August 2009. LGL Rep. TA4760-1. Rep. from LGL Ltd., King City Ont., for Rice University, Department of Earth Science, Houston, TX, and Nat. Sci. Found., Arlington, VA. 187 p.
MacLean, S.A. and B. Haley. 2004. Marine mammal monitoring during Lamont-Doherty Earth Observatory's seismic study in the Støregga Slide area of the Norwegian Sea, August–September 2003. LGL Rep. TA2822-28. Rep. from LGL Alaska Res. Assoc., Anchorage, AK, for Lamont-Doherty Earth Observatory of Columbia Univ., Palisades, NY, and Nat. Mar. Fish. Serv., Silver Spring, MD. 59 p.
MacLean, S.A. and W.R. Koski. 2005. Marine mammal monitoring during Lamont-Doherty Earth Observatory's seismic program in the Gulf of Alaska, August–September 2004. LGL Rep. TA2822-28. Rep. from LGL Ltd., King City, Ont., for Lamont-Doherty Earth Observatory of Columbia Univ., Palisades, NY, and Nat. Mar. Fish. Serv., Silver Spring, MD. 102 p.
§6. Literature Cited 35
McCauley, R.D., M.-N. Jenner, C. Jenner, K.A. McCabe, and J. Murdoch. 1998. The response of humpback whales (Megaptera novaeangliae) to offshore seismic survey noise: preliminary results of observations about a working seismic vessel and experimental exposures. APPEA (Austral. Petrol. Product. Explor. Assoc.) Journal 38:692-707.
McCauley, R.D., J. Fewtrell, A.J. Duncan, C. Jenner, M.-N. Jenner, J.D. Penrose, R.I.T. Prince, A. Adhitya, J. Murdoch, and K. McCabe. 2000. Marine seismic surveys: Analysis of airgun signals; and effects of air gun exposure on humpback whales, sea turtles, fishes and squid. Rep. from Centre for Marine Science and Technology, Curtin Univ., Perth, W.A., for Austral. Petrol. Prod. Assoc., Sydney, N.S.W. 188 p.
NMFS. 2009a. Small takes of marine mammals incidental to specified activities; low energy marine seismic survey in the Northwest Atlantic Ocean, August 209. Fed. Regist. 74(116, 18 June): 28890-28910
NMFS. 2009b. Incidental takes of marine mammals during specified cctivities; low-energy marine seismic survey in the Northwest Atlantic Ocean, August 2009. Fed. Regist. 74(157,17 Aug.): 41382-41397.
Nowacek, D.P., L.H. Thorne, D.W. Johnston and P.L. Tyack. 2007. Responses of cetaceans to anthropogenic noise. Mamm. Rev. 37(2):81-115.
Richardson, W.J. 1995. Marine mammal hearing. p. 205-240 In: W.J. Richardson, C.R. Greene, Jr., C.I. Malme, and D.H. Thomson, Marine mammals and noise. Academic Press, San Diego, CA. 576 p.
Shoop, C.R. and R.D. Kenney. 1992. Seasonal distributions and abundances of loggerhead and leatherback sea turtles in waters of the northeastern United States. Herp. Monogr. 6:43-67.
Smultea, M.A. and M. Holst. 2008. Marine mammal monitoring during a University of Texas Institute for Geophysics seismic survey in the Northeast Pacific Ocean, July 2008. LGL Rep. TA4584-2. Rep. from LGL Ltd., King City, Ont., for University of Texas, Austin, TX, Lamont-Doherty Earth Observatory, Columbia Univ., Palisades, NY, and Nat. Mar. Fish. Serv., Silver Spring, MD. 65 p.
Smultea, M.A., W.R. Koski and T.J. Norris. 2005. Marine mammal monitoring during Lamont-Doherty Earth Observatory’s marine seismic study of the Blanco Fracture Zone in the Northeastern Pacific Ocean, October-November 2004. LGL Rep. TA2822-29. Rep. From LGL Ltd., King City, Ont., for Lamont-Doherty Earth Observatory of Columbia Univ., Palisades, NY, and Nat. Mar. Fish. Serv., Silver Spring, MD. 89 p.
Smultea, M.A., M. Holst, W.R. Koski, and S. Stoltz. 2004. Marine mammal monitoring during Lamont-Doherty Earth Observatory’s seismic program in the Southeast Caribbean Sea and adjacent Atlantic Ocean, April–June 2004. LGL Rep. TA2822-26. Rep. From LGL Ltd., King City, Ont., for Lamont-Doherty Earth Observatory of Columbia Univ., Palisades, NY, and Nat. Mar. Fish. Serv., Silver Spring, MD. 106 p.
Southall, B.L., A.E. Bowles, W.T. Ellison, J.J. Finneran, R.L. Gentry, C.R. Greene Jr., D. Kastak, D.R. Ketten, J.H. Miller, P.E. Nachtigall, W.J. Richardson, J.A. Thomas, and P.L. Tyack. 2007. Marine mammal noise exposure criteria: initial scientific recommendations. Aquat. Mamm. 33(4):411-522.
Stone, C.J. 2003. The effects of seismic activity on marine mammals in UK waters 1998-2000. JNCC Report 323. Joint Nature Conservancy, Aberdeen, Scotland. 43 p.
Tolstoy, M., J. Diebold, S. Webb, D. Bohnenstiehl, and E. Chapp. 2004a. Acoustic calibration measurements. Chapter 3 In: W.J. Richardson (ed.), Marine mammal and acoustic monitoring during Lamont-Doherty Earth Observatory's acoustic calibration study in the northern Gulf of Mexico, 2003. Revised ed. Rep. from LGL Ltd., King City, Ont., for Lamont-Doherty Earth Observ., Palisades, NY, and Nat. Mar. Fish. Serv., Silver Spring, MD. [Advance copy of updated Chapter 3.]
Tolstoy, M., J.B. Diebold, S.C. Webb, D.R. Bohenstiehl, E. Chapp, R.C. Holmes, and M. Rawson. 2004b. Broadband calibration of R/V Ewing seismic sources. Geophys. Res. Lett. 31:L14310.
Tolstoy, M., J. Diebold, L. Doermann, S. Nooner, S.C. Webb, D.R. Bohenstiehl, T.J. Crone and R.C. Holmes. 2009. Broadband calibration of R/V Marcus G. Langseth four-string seismic sources. Geochem. Geophys. Geosyst., 10, Q08011, doi:10.1029/2009GC002451.
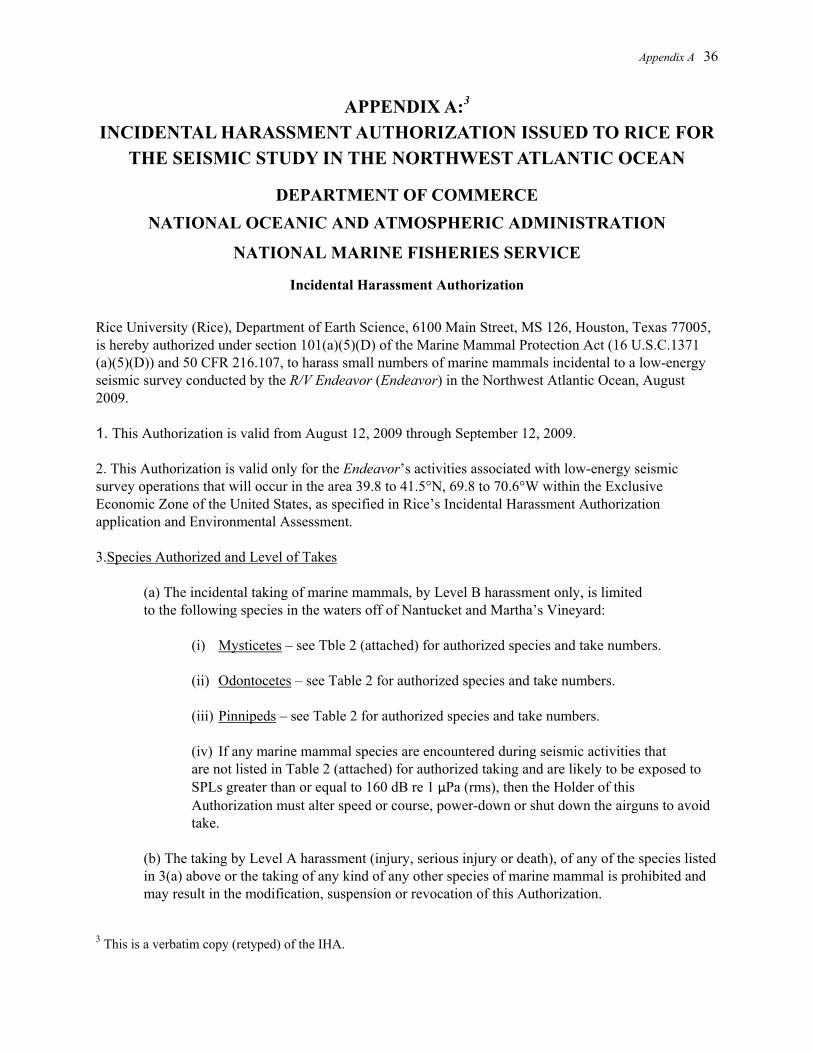
Appendix A 36
APPENDIX A:3 INCIDENTAL HARASSMENT AUTHORIZATION ISSUED TO RICE FOR
THE SEISMIC STUDY IN THE NORTHWEST ATLANTIC OCEAN
DEPARTMENT OF COMMERCE NATIONAL OCEANIC AND ATMOSPHERIC ADMINISTRATION
NATIONAL MARINE FISHERIES SERVICE
Incidental Harassment Authorization
Rice University (Rice), Department of Earth Science, 6100 Main Street, MS 126, Houston, Texas 77005, is hereby authorized under section 101(a)(5)(D) of the Marine Mammal Protection Act (16 U.S.C.1371 (a)(5)(D)) and 50 CFR 216.107, to harass small numbers of marine mammals incidental to a low-energy seismic survey conducted by the R/V Endeavor (Endeavor) in the Northwest Atlantic Ocean, August 2009. 1. This Authorization is valid from August 12, 2009 through September 12, 2009. 2. This Authorization is valid only for the Endeavor’s activities associated with low-energy seismic survey operations that will occur in the area 39.8 to 41.5°N, 69.8 to 70.6°W within the Exclusive Economic Zone of the United States, as specified in Rice’s Incidental Harassment Authorization application and Environmental Assessment. 3.Species Authorized and Level of Takes
(a) The incidental taking of marine mammals, by Level B harassment only, is limited to the following species in the waters off of Nantucket and Martha’s Vineyard:
(i) Mysticetes – see Tble 2 (attached) for authorized species and take numbers.
(ii) Odontocetes – see Table 2 for authorized species and take numbers. (iii) Pinnipeds – see Table 2 for authorized species and take numbers. (iv) If any marine mammal species are encountered during seismic activities that are not listed in Table 2 (attached) for authorized taking and are likely to be exposed to SPLs greater than or equal to 160 dB re 1 μPa (rms), then the Holder of this Authorization must alter speed or course, power-down or shut down the airguns to avoid take.
(b) The taking by Level A harassment (injury, serious injury or death), of any of the species listed in 3(a) above or the taking of any kind of any other species of marine mammal is prohibited and may result in the modification, suspension or revocation of this Authorization.
3 This is a verbatim copy (retyped) of the IHA.
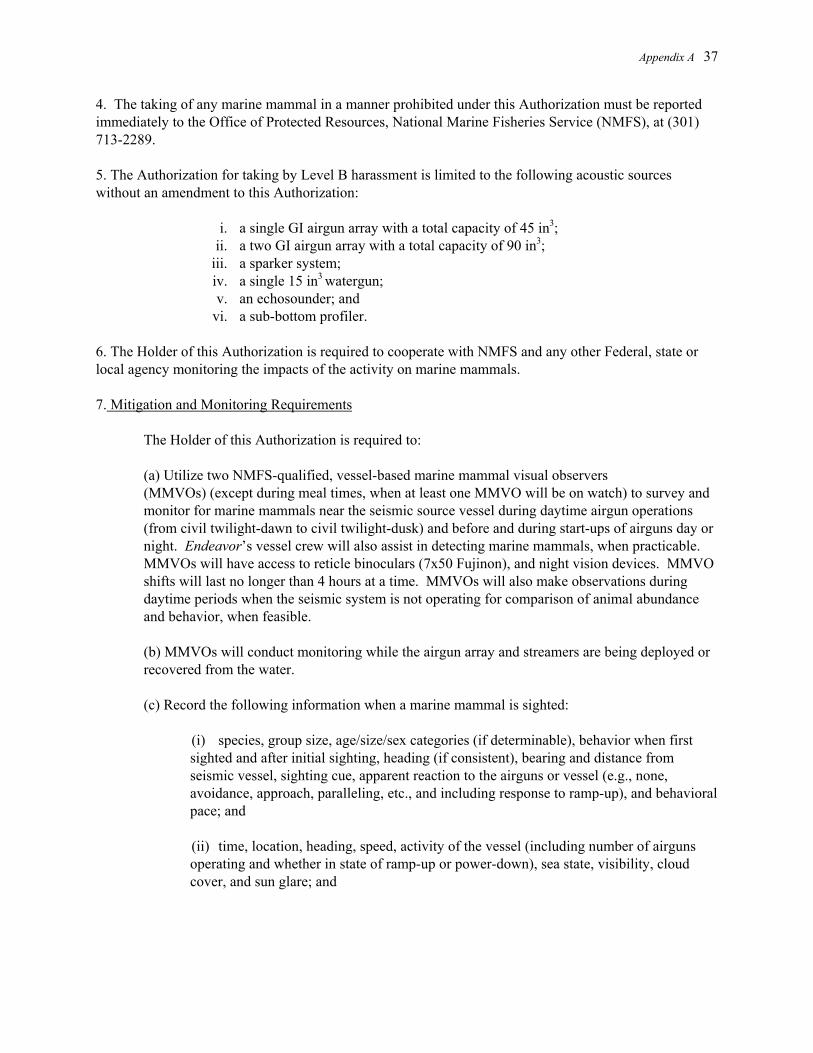
Appendix A 37
4. The taking of any marine mammal in a manner prohibited under this Authorization must be reported immediately to the Office of Protected Resources, National Marine Fisheries Service (NMFS), at (301) 713-2289. 5. The Authorization for taking by Level B harassment is limited to the following acoustic sources without an amendment to this Authorization:
i. a single GI airgun array with a total capacity of 45 in3; ii. a two GI airgun array with a total capacity of 90 in3;
iii. a sparker system; iv. a single 15 in3 watergun; v. an echosounder; and
vi. a sub-bottom profiler. 6. The Holder of this Authorization is required to cooperate with NMFS and any other Federal, state or local agency monitoring the impacts of the activity on marine mammals. 7. Mitigation and Monitoring Requirements
The Holder of this Authorization is required to:
(a) Utilize two NMFS-qualified, vessel-based marine mammal visual observers (MMVOs) (except during meal times, when at least one MMVO will be on watch) to survey and monitor for marine mammals near the seismic source vessel during daytime airgun operations (from civil twilight-dawn to civil twilight-dusk) and before and during start-ups of airguns day or night. Endeavor’s vessel crew will also assist in detecting marine mammals, when practicable. MMVOs will have access to reticle binoculars (7x50 Fujinon), and night vision devices. MMVO shifts will last no longer than 4 hours at a time. MMVOs will also make observations during daytime periods when the seismic system is not operating for comparison of animal abundance and behavior, when feasible.
(b) MMVOs will conduct monitoring while the airgun array and streamers are being deployed or recovered from the water.
(c) Record the following information when a marine mammal is sighted:
(i) species, group size, age/size/sex categories (if determinable), behavior when first sighted and after initial sighting, heading (if consistent), bearing and distance from seismic vessel, sighting cue, apparent reaction to the airguns or vessel (e.g., none, avoidance, approach, paralleling, etc., and including response to ramp-up), and behavioral pace; and (ii) time, location, heading, speed, activity of the vessel (including number of airguns operating and whether in state of ramp-up or power-down), sea state, visibility, cloud cover, and sun glare; and

Appendix A 38
(iii) the data listed under 7(c)(ii) will also be recorded at the start and end of each observation watch and during a watch whenever there is a change in one or more of the variables.
(d) Visually observe the entire extent of the safety radius (190 dB for pinnipeds, 180 dB for cetaceans, see Table 1 [attached] for distances) using NMFS-qualified MMVOs, for at least 30 minutes prior to starting the airguns (day or night). If the MMVO finds a marine mammal within the safety zone, Rice must delay the seismic survey until the marine mammal(s) has left the area. If the MMVO sees a marine mammal that surfaces, then dives below the surface, the observer shall wait 30 minutes. If the MMVO sees no marine mammals during that time, they should assume that the animal has moved beyond the safety zone. If for any reason the entire radius cannot be seen for the entire 30 minutes (min) (i.e. rough seas, fog, darkness), or if marine mammals are near, approaching, or in the safety radius, the airguns may not be started up.
(e) Establish 180 dB and 190 dB safety zones for cetaceans and pinnipeds, respectively, before the single and two GI airgun array (45 in3 and 90 in3) is in operation. The relevant safety zones for the two GI airgun array will be used for the sparker system and watergun. See Table 1 (attached) for distances and safety radii
(f) Alter speed or course during seismic operations if a marine mammal, based on its position and relative motion, appears likely to enter the safety zone. If speed or course alteration is not safe or practical, or if after alteration the marine mammal still appears likely to enter the safety zone, further mitigation measures, such as a shut-down, will be taken.
(g) Power-down or shut-down the airgun(s), watergun, and/or sparker if a marine mammal is detected within, approaches, or enters the relevant safety-radius (as defined in Table 1, attached). A shut-down means the operating airgun is turned off. The relevant safety radii for the two GI airguns (90 in3 ) will be used for the watergun (15 in3) or the sparker. A power-down means reducing the number of operating airguns to a single operating (45 in3) airgun, which reduces the safety radius to the degree that he animal(s) is outside of it.
(h) During operations using two GI airgun array, a single 45 in3 GI airgun will be operated during turns between successive survey lines. The continued operation of one airgun is intended to alert marine mammals to the presence of the survey vessel in the area.
(i) Following a power-down, if the marine mammal approached the smaller designated safety radius, the airguns must then be completely shut-down. Airgun activity shall not resume until the marine mammal has cleared the safety zone, which means it was visually observed to have left the safety zone, or has not been seen within the safety zone for 10 min for species with shorter dive durations (small odontocetes and pinnipeds) or 15 min for species with longer dive durations (mysticetes and large odontocetes, including sperm, pygmy sperm, dwarf sperm, killer and beaked whales).
(j) Low-energy marine seismic surveys may continue into night and low-light hours if such segment(s) of the survey is initiated when the entire relevant safety zones are visible and can be effectively monitored.
Appendix A 39
(k) No initiation of airgun array or other sound source operations is permitted from a shut-down position at night or during low-light hours (such as in dense fog or heavy rain) when the entire relevant safety zone cannot be effectively monitored by the MMVOs on duty,
(l) When operating the sound source(s), minimize approaches to slopes, submarine canyons, seamounts, and other underwater geological features, if possible, to avoid possible beaked whale habitat.
(m) If concentrations or groups of humpback (Megaptera novaeangliae), fin (Balaenoptera physalus), blue (B. musculus), sei (B. borealis), and sperm whales (Physeter macrocephalus) are observed (by visual detection) prior to or during the airgun operations, and do not appear to be traveling (i.e., feeding, socializing, breeding), then those operations will be powered-down, shut-down, delayed, and/or moved to another location, if possible, based on recommendations by the on-duty MMVO aboard the Endeavor . A typical concentration or group of whales for this survey consists of three or more individuals visually sighted. If the concentration or group of whales appears to be traveling, then Rice will power-down or shut-down seismic operations and wait for approximately 30 min for the individuals to move out of the study area before reinitiating seismic operations.
(n) If a North Atlantic right whale (Eubalaena glacialis) is visually sighted, the airgun array, watergun, or sparker will be shut-down regardless of the distance of the animal(s) to the sound source. The array will not resume firing until 30 min after the last documented whale visual sighting.
(o) To maximum extent practicable, seismic surveys (especially inshore) will be conducted from the coast (inshore) and proceed towards the sea (offshore) in order to avoid trapping marine mammals in shallow water.
8. Reporting Requirements
The Holder of this Authorization is required to: (a) Submit a draft report on all activities and monitoring results to the Office of Protected Resources, NMFS, within 90 days of the completion of the Endeavor’s cruise. This report must contain and summarize the following information:
(i) Dates, times, locations, heading, speed, weather during, sea conditions (including Beaufort Sea State and Wind Force), and associated activities during all seismic operations and marine mammal sightings;
(ii) Species, number, location, distance from vessel, and behavior of any marine mammals, as well as associated seismic activity (number of shut-downs), observed throughout all monitoring activities.
(iii) An estimate of the number (by species) of marine mammals that: (A) are known to have been exposed to the seismic activity (based visual observation) at received levels greater than or equal to 160 dB re 1 μPa (rms) and/or 180 dB re 1 μPa (rms) with a discussion of any specific behaviors those individuals exhibited; and (B) may have been

Appendix A 40
exposed (based on modeling results) to the seismic activity at received levels greater than or equal to 160 dB re 1 μPa (rms) and/or 180 dB re 1 μPa (rms) with a discussion of the nature of the probable consequences of that exposure on the individuals that have been exposed.
(iv) A description of the implementation and effectiveness of the: (A) terms and conditions of the Biological Opinion’s Incidental Take Statement (ITS) (attached); and (B) mitigation measures of the Incidental Harassment Authorization. For the Biological Opinion, the report will confirm the implementation of each term and condition, as well as any conservation recommendations, and describe their effectiveness, for minimizing the adverse effects of the action on listed marine mammals.
(b) Submit a final report to the Chief, Permits, Conservation, and Education Division, Office of Protected Resources, NMFS, within 30 days after receiving comments from NMFS on the draft report. If NMFS decides that the draft needs no comments, the draft report will be considered to be the final report.
9. In the unanticipated event that any taking of a marine mammal in a manner prohibited by this Authorization occurs, such as an injury, serious injury, or mortality, and are judged to result from these activities, Rice will immediately report the incident tot eh Chief of Permits, Conservation, and Education Division, Office of Protected Resources, NMFS, at 301-713-2289. Rice will postpone the research activities until NMFS is able to review the circumstances of the take. NMFS will work with Rice to determine whether modifications in the activities are appropriate and necessary, and notified the permit holder that they may resume sound source operations. In the event that Rice discovers an injured or dead marine mammal that is judged to not have resulted from these activities, Rice will contact and report the incident to the Chief of the Permits, Conservation, and Education Division, Office of Protected Resources, NMFS, at 301-713-2289 within 24 hours of discovery. 10. Rice is required to comply with the Terms and Conditions of the ITS corresponding to NMFS’ Biological Opinion issued to both NSF and NMFS’ Office of Protected Resources (attached). 11. A copy of this Authorization and the ITS must be in the possession of all contractors and marine mammal monitors operating under the authority of this Incidental Harassment Authorization.
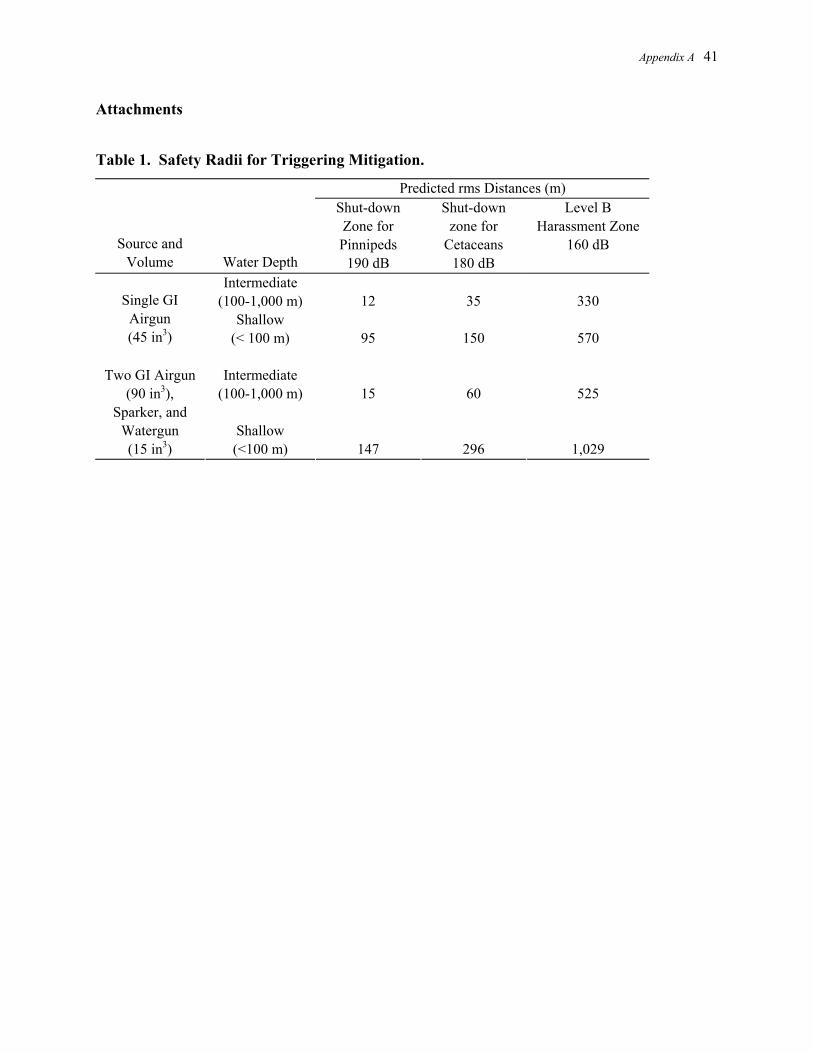
Appendix A 41
Attachments
Table 1. Safety Radii for Triggering Mitigation.
Predicted rms Distances (m)
Source and Volume
Water Depth
Shut-down Zone for Pinnipeds
190 dB
Shut-down zone for
Cetaceans 180 dB
Level B Harassment Zone
160 dB
Intermediate (100-1,000 m) 12 35 330 Single GI
Airgun (45 in3)
Shallow (< 100 m) 95 150 570
Intermediate
(100-1,000 m) 15 60 525 Two GI Airgun
(90 in3), Sparker, and
Watergun (15 in3)
Shallow (<100 m) 147 296 1,029
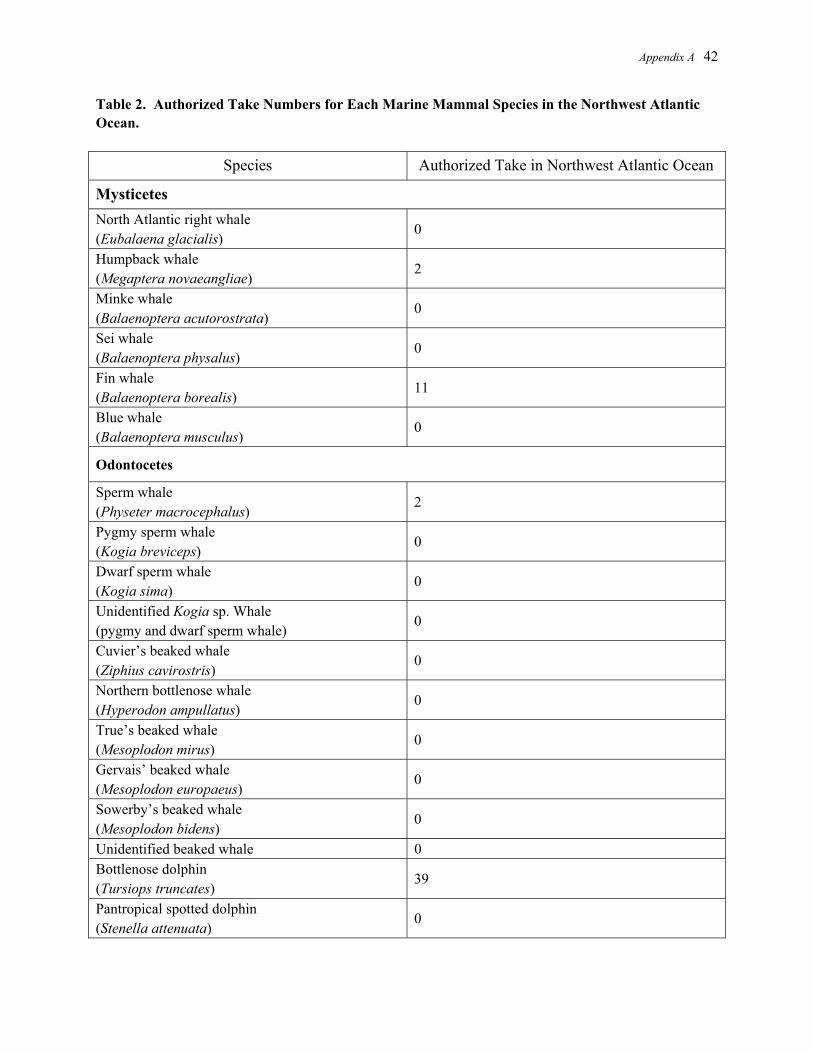
Appendix A 42
Table 2. Authorized Take Numbers for Each Marine Mammal Species in the Northwest Atlantic Ocean.
Species Authorized Take in Northwest Atlantic Ocean
Mysticetes North Atlantic right whale (Eubalaena glacialis)
0
Humpback whale (Megaptera novaeangliae)
2
Minke whale (Balaenoptera acutorostrata)
0
Sei whale (Balaenoptera physalus)
0
Fin whale (Balaenoptera borealis)
11
Blue whale (Balaenoptera musculus)
0
Odontocetes
Sperm whale (Physeter macrocephalus)
2
Pygmy sperm whale (Kogia breviceps)
0
Dwarf sperm whale (Kogia sima)
0
Unidentified Kogia sp. Whale (pygmy and dwarf sperm whale)
0
Cuvier’s beaked whale (Ziphius cavirostris)
0
Northern bottlenose whale (Hyperodon ampullatus)
0
True’s beaked whale (Mesoplodon mirus)
0
Gervais’ beaked whale (Mesoplodon europaeus)
0
Sowerby’s beaked whale (Mesoplodon bidens)
0
Unidentified beaked whale 0 Bottlenose dolphin (Tursiops truncates)
39
Pantropical spotted dolphin (Stenella attenuata)
0

Appendix A 43
Atlantic spotted dolphin (Stenella frontalis)
0
Striped dolphin (Stenella coeruleoalba)
0
Spinner dolphin (Stenella longirostris)
0
Short-beaked common dolphin (Delphinus delphis)
349
White-beaked dolphin (Lagenorhynchus albirostris)
0
Atlantic white-sided dolphin (Lagenorhynchus albirostris)
0
Risso’s dolphin (Grampus griseus)
30
False killer whale (Pseudorca crassidens)
0
Killer whale (Orcinus orca)
0
Long-finned pilot whale (Globicephala melas)
-
Short-finned pilot whale (Globicephala macrorhynchus)
-
Unidentified pilot whale (Globicephala sp.)
50
Harbour porpoise (Phocoena phocoena)
0
Pinnipeds
Harbor seal (Phoca vitulina)
10
Gray seal (Halochoerus grypus)
5
Harp seal (Pagophilius groenlandicus)
0
Hooded seal (Cystophora cristata)
0
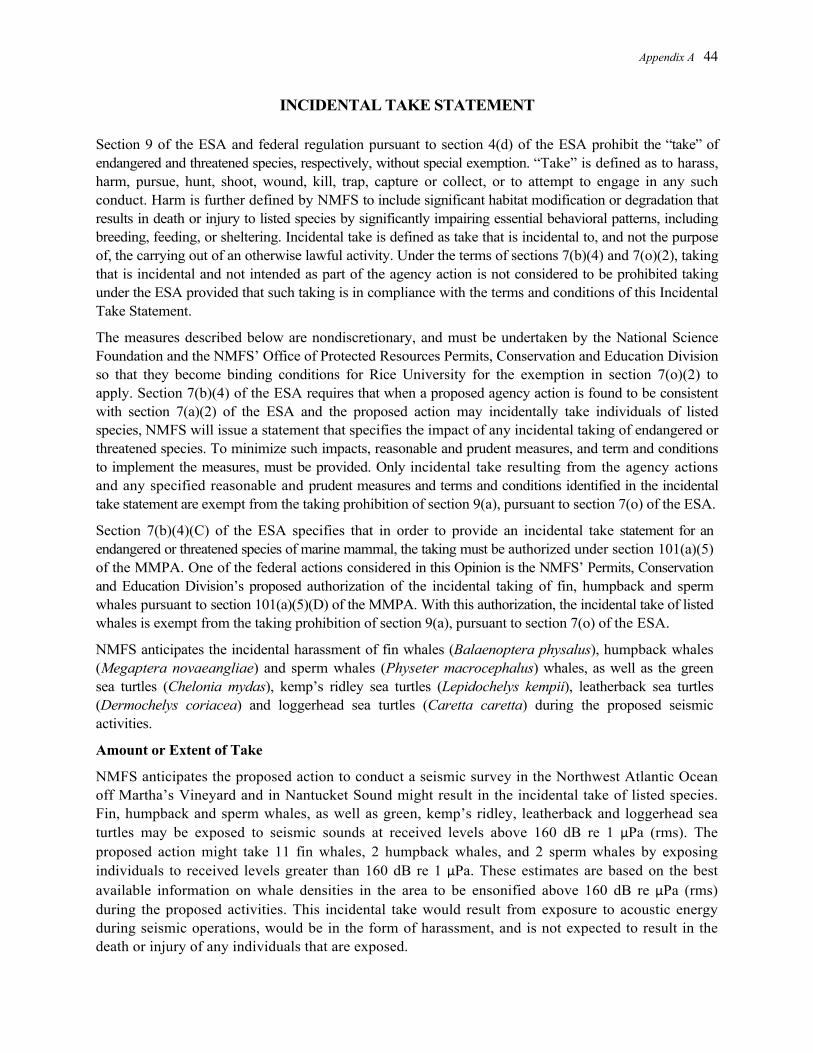
Appendix A 44
INCIDENTAL TAKE STATEMENT
Section 9 of the ESA and federal regulation pursuant to section 4(d) of the ESA prohibit the “take” of endangered and threatened species, respectively, without special exemption. “Take” is defined as to harass, harm, pursue, hunt, shoot, wound, kill, trap, capture or collect, or to attempt to engage in any such conduct. Harm is further defined by NMFS to include significant habitat modification or degradation that results in death or injury to listed species by significantly impairing essential behavioral patterns, including breeding, feeding, or sheltering. Incidental take is defined as take that is incidental to, and not the purpose of, the carrying out of an otherwise lawful activity. Under the terms of sections 7(b)(4) and 7(o)(2), taking that is incidental and not intended as part of the agency action is not considered to be prohibited taking under the ESA provided that such taking is in compliance with the terms and conditions of this Incidental Take Statement.
The measures described below are nondiscretionary, and must be undertaken by the National Science Foundation and the NMFS’ Office of Protected Resources Permits, Conservation and Education Division so that they become binding conditions for Rice University for the exemption in section 7(o)(2) to apply. Section 7(b)(4) of the ESA requires that when a proposed agency action is found to be consistent with section 7(a)(2) of the ESA and the proposed action may incidentally take individuals of listed species, NMFS will issue a statement that specifies the impact of any incidental taking of endangered or threatened species. To minimize such impacts, reasonable and prudent measures, and term and conditions to implement the measures, must be provided. Only incidental take resulting from the agency actions and any specified reasonable and prudent measures and terms and conditions identified in the incidental take statement are exempt from the taking prohibition of section 9(a), pursuant to section 7(o) of the ESA.
Section 7(b)(4)(C) of the ESA specifies that in order to provide an incidental take statement for an endangered or threatened species of marine mammal, the taking must be authorized under section 101(a)(5) of the MMPA. One of the federal actions considered in this Opinion is the NMFS’ Permits, Conservation and Education Division’s proposed authorization of the incidental taking of fin, humpback and sperm whales pursuant to section 101(a)(5)(D) of the MMPA. With this authorization, the incidental take of listed whales is exempt from the taking prohibition of section 9(a), pursuant to section 7(o) of the ESA.
NMFS anticipates the incidental harassment of fin whales (Balaenoptera physalus), humpback whales (Megaptera novaeangliae) and sperm whales (Physeter macrocephalus) whales, as well as the green sea turtles (Chelonia mydas), kemp’s ridley sea turtles (Lepidochelys kempii), leatherback sea turtles (Dermochelys coriacea) and loggerhead sea turtles (Caretta caretta) during the proposed seismic activities.
Amount or Extent of Take
NMFS anticipates the proposed action to conduct a seismic survey in the Northwest Atlantic Ocean off Martha’s Vineyard and in Nantucket Sound might result in the incidental take of listed species. Fin, humpback and sperm whales, as well as green, kemp’s ridley, leatherback and loggerhead sea turtles may be exposed to seismic sounds at received levels above 160 dB re 1 μPa (rms). The proposed action might take 11 fin whales, 2 humpback whales, and 2 sperm whales by exposing individuals to received levels greater than 160 dB re 1 μPa. These estimates are based on the best available information on whale densities in the area to be ensonified above 160 dB re μPa (rms) during the proposed activities. This incidental take would result from exposure to acoustic energy during seismic operations, would be in the form of harassment, and is not expected to result in the death or injury of any individuals that are exposed.
Appendix A 45
We expect the proposed action might also take individual sea turtles as a result of exposure to acoustic energy during seismic studies, and we expect this take would also be in the form of harassment, with no death or injury expected for individuals exposed. Harassment of sea turtles is expected to occur at received levels above 166 dB re 1 μPa (rms). Because density estimates of sea turtles in the survey area are unknown, we estimate take as the number of turtles exposed to seismic operations above 166 dB re 1 μPa during the proposed activities. These turtles could be of all ages and life stages in the survey area.
Harassment of fin, humpback and sperm whales exposed to seismic sounds at levels less than 160 dB re 1 μPa (rms), or of sea turtles at levels less than 166 dB re 1 μPa (rms), is not expected. We do not expect listed species to be taken by operation of the sonars. However, if overt adverse reactions (for example, startle responses, dive reactions, or rapid departures from the area) by listed whales or sea turtles are observed outside of the 160 dB or 166 dB re 1 μPa (rms) isopleths, respectively, while airguns, watergun or sparker are operating, incidental take may be exceeded. If such reactions by listed species are observed while sonars are in operation, this may constitute take that is not covered in this Incidental Take Statement. National Science Foundation and the NMFS’ Permits, Conservation, and Education Division must contact the Endangered Species Division to determine whether reinitation of consultation is required because of such operations.
Any incidental take of fin whales, humpback whales, sperm whales, green sea turtles, kemp’s ridley sea turtles, leatherback sea turtles and loggerhead sea turtles is restricted to the permitted action as proposed. If the actual incidental take meets or exceeds the predicted level, National Science Foundation and NMFS’ Permits, Conservation and Education Division must reinitiate consultation. All anticipated takes would be "takes by harassment", as described previously, involving temporary changes in behavior.
Reasonable and Prudent Measures
NMFS believes the reasonable and prudent measures described below are necessary and appropriate to minimize the amount of incidental take of listed whales and sea turtles resulting from the proposed action. These measures are non-discretionary and must be binding conditions of the NSF funding of the proposed seismic studies and NMFS’ authorization for the exemption in section 7(o)(2) to apply. If the National Science Foundation or NMFS’ Permits, Conservation and Education Division fail to ensure compliance with these terms and conditions, the protective coverage of section 7(o)(2) may lapse.
1. All activities must comply with the reasonable and prudent measures for sea turtles and whales listed in this biological opinion. For listed sea turtle and marine mammal species these measures include the following: avoidance of concentrations of species (3 or more individuals of blue, fin, humpback, sei or sperm whales whether feeding or stationary) as practicable ; immediate shutdown of all seismic sources in the event a western North Atlantic right whale is detected; vessel-based visual monitoring by marine mammal and sea turtle observers; speed or course alteration as practicable; implementation of a marine mammal and sea turtle exclusion zone within the 180 dB re 1 µPa (rms) isopleth for power-down and shut-down procedures; emergency shutdown procedures in the event of an injury or mortality of a listed marine mammal or sea turtle; and ramp-up procedures. The measures for marine mammals are required to be implemented through the terms of the IHA issued under section 101(a)(5)(D) and 50 CFR 216.107.
2. The implementation and effectiveness of mitigation measures incorporated as part of the Reasonable and Prudent Measure mentioned above and the associated Terms and Conditions must be monitored.
Appendix A 46
Terms and Conditions
In order to be exempt from the prohibitions of section 9 of the ESA, the National Science Foundation, NMFS’ Permits, Conservation and Education Division, and Rice University must comply with the following terms and conditions, which implement the Reasonable and Prudent Measures described above. These terms and conditions are non-discretionary.
To implement the Reasonable and Prudent Measures National Science Foundation and NMFS’ Permits, Conservation and Education Division shall ensure that:
1. Rice University implements the mitigation, monitoring, and reporting conditions contained in the IHA and this Biological Opinion.
2. The Chief of the Endangered Species Division is immediately informed of any changes or deletions to any portions of the monitoring plan or IHA.
3. Rice University immediately reports all sightings and locations of injured or dead endangered and threatened species (e.g., sea turtles and blue, fin, humpback, sei and sperm whales) to NMFS’ Permits, Conservation, and Education Division and to NSF.
4. National Science Foundation and NMFS’ Permits, Conservation and Education Division provide a summary of the implementation and effectiveness of the terms of the IHA to the Chief of the Endangered Species Division. This report shall confirm the implementation of each term and summarize the effectiveness of the terms for minimizing the adverse effects of the project on listed whales and sea turtles.
Appendix B 47
APPENDIX B: DEVELOPMENT AND IMPLEMENTATION OF SAFETY RADII
This appendix provides additional background information on the development and implemen-tation of safety radii as relevant to the seismic study discussed in this report. The safety radii used for the current survey were based on modeling and empirical data from L-DEO’s 2003 calibration study conducted with various configurations of the Ewing’s airgun arrays (see Smultea et al. 2003, Tolstoy 2004a,b). The empirical data from the 2007/8 calibration study of the Langseth’s airgun configurations were not available at the time of the NWA, but some of the key data have now been published by Tolstoy et al. (2009).
There has been considerable speculation about the potential for strong pulses of low-frequency underwater sound from marine seismic exploration to injure marine mammals (e.g., Richardson et al. 1995:372ff). This was based initially on what was known about hearing impairment to humans and other terrestrial mammals exposed to impulsive low-frequency airborne sounds (e.g., artillery noise). It is not known whether exposure to a sequence of airgun pulses can, under practical field conditions, cause hearing impairment or non-auditory injuries in marine mammals. However, studies on captive odontocetes and pinnipeds suggest that, as a minimum, temporary threshold shift (TTS) is a possibility (Finneran et al. 2002; Kastak et al. 2005; Southall et al. 2007; Lucke et al. 2009). The 180-dB “do not exceed” criterion for cetaceans was established by NMFS (1995) before any data were available on TTS in marine mammals. NMFS (1995, 2000) concluded that there are unlikely to be any physically-injurious effects on cetaceans exposed to received levels of seismic pulses up to 180 dB re 1 µParms. The corresponding NMFS “do not exceed” criterion for pinnipeds is 190 dB re 1 µPa (rms). For sea turtles, NMFS specified a criterion of 180 dB re 1 µPa (rms) for this project as well as for most other NSF-funded seismic surveys (e.g., Smultea et al. 2004, 2005; Holst et al. 2005; Holst and Beland 2008; Holst and Smultea 2008; Hauser et al. 2008).
The rms pressure of an airgun pulse is often quoted based on the sound pressure level (SPL) averaged over the pulse duration (see Greene 1997; Greene et al. 1998). The rms level of a seismic pulse is typically about 10 dB less than its peak level (Greene 1997; McCauley et al. 1998, 2000). The sound exposure level (SEL) is a measure of the received energy in the pulse and represents the SPL (or rms) that would be measured if the pulse energy were spread evenly across a 1-s period. Because actual seismic pulses are less than 1 s in duration near the source, and usually are <1 s in duration even at much longer distances, this means that the SEL value for a given pulse is usually lower than the SPL calculated for the actual duration of the pulse. Thus, the rms received levels used as impact criteria for marine mammals are not directly comparable to pulse energy (SEL). For receivers about 0.1 to 10 km from an airgun array, the SPL (i.e., rms sound pressure) for a given pulse is typically 10–15 dB higher than the SEL value for the same pulse as measured at the same location (Greene 1997; McCauley et al. 1998, 2000). However, there is considerable variation, and the difference tends to be larger close to the airgun array, and less at long distances (Blackwell et al. 2007; MacGillivray and Hannay 2007a,b).
Finneran et al. (2002) found that the onset of mild TTS in a beluga whale (odontocete) exposed to a single watergun pulse occurred at a received level of 226 dB re 1 µPa pk-pk and a total energy flux density of 186 dB re 1 µPa2 · s (but see 4, below). The corresponding rms value for TTS onset upon 4 If the low frequency components of the watergun sound used in the experiments of Finneran et al. (2002) are
downweighted as recommended by Miller et al. (2005) and Southall et al. (2007) using their Mmf-weighting curve, the effective exposure level for onset of mild TTS was 183 dB re 1 µPa2 · s (Southall et al. 2007).
Appendix B 48
exposure to a single watergun pulse would be intermediate between these values. It is assumed (though data are lacking) that TTS onset would occur at lower received rms levels if the animals received a series of pulses. However, no specific results confirming this are available yet. On the other hand, the levels necessary to cause injury would exceed, by an uncertain degree, the levels eliciting TTS onset. According to Southall et al. (2007), permanent threshold shift (PTS) might occur at SEL levels 15 dB above the TTS onset, or at a SEL of 198 dB re 1 µPa2 · s. Southall et al. (2007) also indicate that PTS onset might occur upon exposure to an instantaneous peak pressure as little as 6 dB above the peak pressure, eliciting onset of TTS; PTS onset might occur at a peak pressures ≥230 dB re 1 µPa. Recent data from a harbor porpoise was exposed to an operating airgun suggest that its TTS threshold (and thus, by implication, its PTS threshold) was considerabley lower than that found by Finneran et al. in the beluga (Lucke et al. 2009).
In pinnipeds, TTS thresholds associated with exposure to brief pulses (single or multiple) of under-water sound have not been measured. Initial evidence from more prolonged (non-pulse) exposures sug-gested that some pinnipeds (harbor seals in particular) incur TTS at somewhat lower received levels than do small odontocetes exposed for similar durations (Kastak et al. 1999, 2005; Ketten et al. 2001; cf. Au et al. 2000). The TTS threshold for pulsed sounds has been indirectly estimated as being an SEL of ~171 dB re 1 µPa2 · s (Southall et al. 2007), equivalent to a single pulse with received level ~181–186 dB re 1 µParms, or a series of pulses for which the highest rms values are a few dB lower. Corresponding values for California sea lions and northern elephant seals are likely higher (Kastak et al. 2005).
The advantage of working with SEL is that the SEL measure accounts for the total received energy in the pulse, and biological effects of pulsed sounds probably are most directly dependent on pulse energy (Southall et al. 2007). However, we consider rms pressure because current NMFS criteria are based on that method. NMFS is developing new noise exposure criteria for marine mammals that account for the now-available scientific data on TTS, the expected offset between the TTS and PTS thresholds, differences in the acoustic frequencies to which different marine mammal groups are sensitive, and other relevant factors.
The sound pressure field of two 45-in3 GI guns has not been modeled, but those for two 45-in3 Nucleus G guns (Fig. B.1) and one 45-in3 GI gun (Fig. B.2) have been modeled by L-DEO in relation to distance and direction from the guns. The GI gun is essentially two G guns that are joined head to head. The G-gun signal has more energy than the GI-gun signal, but the peak energy levels are equivalent and appropriate for modeling purposes. The L-DEO model does not allow for bottom interactions, and is most directly applicable to deep water. Based on the modeling, estimates of the maximum distances from the GI guns where sound levels of 190, 180, 170, and 160 dB re 1 µParms are predicted to be received in shallow (<100 m) and intermediate-depth (100–1000 m) water are shown in Table B.1. The distances for the sparker were assumed to be the same as those for the two GI guns. Because the model results are for two G guns which have more energy than two GI guns of the same size, those distances are overestimates.
Empirical data concerning the 180-, 170-, and 160-dB distances for various airgun configurations, including a pair of 105 in3 GI-guns, have been acquired based on measurements during an acoustic verifi-cation study conducted by L-DEO in the northern Gulf of Mexico in 2003 (Tolstoy et al. 2004a,b). Although the results are limited, data showed that radii around the airguns where the received level would be 180 dB re 1 µParms, the safety criterion applicable to cetaceans (NMFS 2000), vary with water depth. Similar depth-related variation is likely in the 190-dB distances applicable to pinnipeds. Correction factors were developed for water depths 100–1000 m and <100 m. For waters 100–100 m deep, it was assumed that the various radii would be 1.5× the corresponding radii in deep (>1000 m) water.
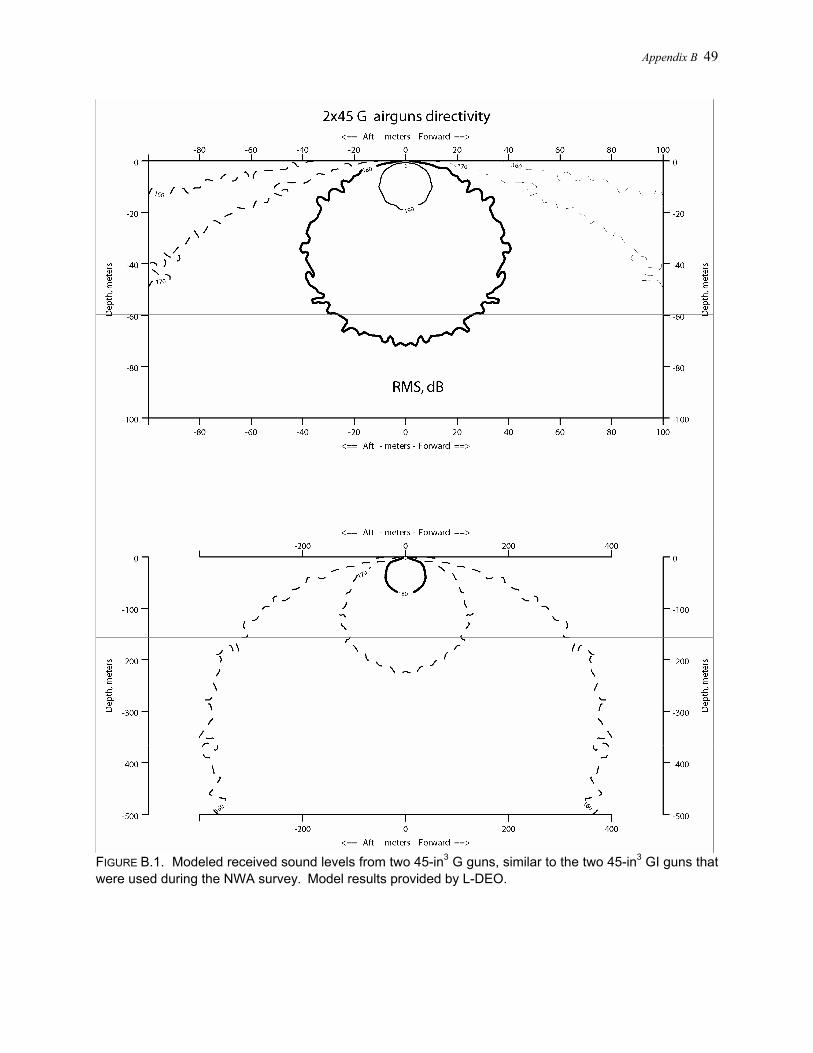
Appendix B 49
FIGURE B.1. Modeled received sound levels from two 45-in3 G guns, similar to the two 45-in3 GI guns that were used during the NWA survey. Model results provided by L-DEO.

Appendix B 50
FIGURE B.2. Modeled received sound levels from the 45-in3 GI gun that was used during the NWA survey. Model results provided by L-DEO.

Appendix B 51
TABLE B.1. Distances to which sound levels ≥190, 180, 170, and 160 dB re 1 µPa (rms) might be received from one or two 45-in3 GI guns and sparker as used during the NWA seismic survey. Predicted radii for two GI guns are based on similar 45-in3 G guns.
Estimated Distances at Received Levels (m) Source Water depth 190 dB 180 dB 170 dB 160 dB
Two 45-in3 GI guns 100–1000 m 15 60 188 525 or Sparker <100 m 147 296 536 1029
One 45-in3 GI gun 100–1000 m 12 35 105 330
<100 m 95 150 230 570
• The empirical data indicated that, for deep water (>1000 m), the L-DEO model tends to overestimate the received sound levels at a given distance (Tolstoy et al. 2004a,b). The estimated radii during airgun operations in deep water during all recent L-DEO cruises were predicted by L-DEO’s model, and thus are likely to somewhat overestimate the actual radii for corresponding received sound levels.
• For shallow water (<100 m deep), the radii are based on the empirical data of Tolstoy et al. (2004a,b) for 160, 170 and 180 dB, and are extrapolated to estimate the radii for 190 dB. The safety radii were typically based on measured values in shallow water, and ranged from 3× to 15× higher than the modeled values depending on the sound level measured).
• Empirical measurements were not conducted for intermediate depths (100–1000 m). On the expectation that results would be intermediate between those from shallow and deep water, 1.1× to 1.5× correction factors have been applied to the estimates provided by the model for deep-water situations. The 1.5× factor was applied to model estimates during L-DEO cruises in 2003, and 1.1× to 1.5× factors were applied to estimates for intermediate-depth water during all subsequent cruises
The GI gun(s)/sparker were to be shut down immediately when cetaceans or sea turtles were detected within or about to enter the 180-dB re 1 µParms radius, or when pinnipeds were detected within or about to enter the 190-dB re 1 µParms radius. The 180- and 190-dB shut-down criteria are consistent with NMFS guidelines listed for cetaceans and pinnipeds, respectively (NMFS 2000).
The depth at which the source is towed has a major effect on the maximum near-field output and on the shape of its frequency spectrum. If the source is towed at a relatively deep depth, the effective source level for sound propagating in near-horizontal directions is substantially greater than if the array is towed at shallower depths. During the current seismic program, the tow depth was ~2 m.
References
Au, W.W.L., A.N. Popper, and R.R. Fay. 2000. Hearing by Whales and Dolphins. Springer-Verlag, New York, NY. 458 p.
Blackwell, S.B., R.G. Norman, C.R. Greene Jr., and W.J. Richardson. 2007. Acoustic measurements. p. 4-1 to 4-52 In: Marine mammal monitoring and mitigation during open water seismic exploration by Shell Offshore Inc. in the Chukchi and Beaufort Seas, July-September 2006: 90-day report. LGL Rep. P891-1. Rep. from LGL Alaska Res. Assoc. Inc., Anchorage, AK, and Greeneridge Sciences Inc., Santa Barbara,
Appendix B 52
CA, for Shell Offshore Inc., Houston, TX, Nat. Mar. Fish. Serv., Silver Spring, MD, and U.S. Fish & Wildl. Serv., Anchorage, AK. 199 p.
Finneran, J.J., C.E. Schlundt, R. Dear, D.A. Carder, and S.H. Ridgway. 2002. Temporary shift in masked hearing thresholds in odontocetes after exposure to single underwater impulses from a seismic watergun. J. Acoust. Soc. Am. 111(6):2929-2940.
Greene, C.R., Jr., with J.S. Hanna and R.W. Blaylock. 1997. Physical acoustics measurements. p. 3-1 to 3-63 In: W.J. Richardson (ed.), Northstar marine mammal monitoring program, 1996: marine mammal and acoustical monitoring of a seismic program in the Alaskan Beaufort Sea. LGL Rep. TA2121-2. Rep. from LGL Ltd., King City, Ont., and Greeneridge Sciences Inc., Santa Barbara, CA, for BP Explor. (Alaska) Inc., Anchorage, AK, and Nat. Mar. Fish. Serv., Anchorage, AK, and Silver Spring, MD. 245 p.
Greene, C.R., Jr., R. Norman and J.S. Hanna. 1998. Physical acoustics measurements. p. 3-1 to 3-64 In: W.J. Richardson (ed.), Marine mammal and acoustical monitoring of BP Exploration (Alaska)’s open-water seismic program in the Alaskan Beaufort Sea, 1997. LGL Rep. TA2150-3. Rep. from LGL Ltd., King City, Ont., and Greeneridge Sciences Inc., Santa Barbara, CA, for BP Explor. (Alaska) Inc., Anchorage, AK, and U.S. Nat. Mar. Fish. Serv., Anchorage, AK, and Silver Spring, MD. 318 p.
Hauser, D.D.W., M. Holst, and V.D. Moulton. 2008. Marine mammal and sea turtle monitoring during Lamont-Doherty Earth Observatory’s marine seismic program in the Eastern Tropical Pacific, April–August 2008. LGL Rep. TA4656/7-1. Rep. from LGL Ltd., King City, Ont. and St. John’s, Nfld, for Lamont-Doherty Earth Observatory of Columbia Univ., Palisades, NY, and Nat. Mar. Fish. Serv., Silver Spring, MD. 98 p.
Holst, M. and J. Beland. 2008. Marine mammal and sea turtle monitoring during Lamont-Doherty Earth Observatory’s seismic testing and calibration study in the northern Gulf of Mexico, November 2007–February 2008. LGL Rep. TA4295-2. Rep. from LGL Ltd., King City, Ont., for Lamont-Doherty Earth Observatory of Columbia Univ., Palisades, NY, and Nat. Mar. Fish. Serv., Silver Spring, MD. 77 p.
Holst, M. and M.A. Smultea. 2008. Marine mammal and sea turtle monitoring during Lamont-Doherty Earth Observatory’s marine seismic program off Central America, February–April 2008. LGL Rep. TA4342-3. Rep. from LGL Ltd., King City, Ont., for Lamont-Doherty Earth Observatory of Columbia Univ., Palisades, NY, and Nat. Mar. Fish. Serv., Silver Spring, MD. 133 p.
Holst, M., M.A. Smultea, W.R. Koski, and B. Haley. 2005. Marine mammal and sea turtle monitoring during Lamont-Doherty Earth Observatory’s marine seismic program off the Northern Yucatán Peninsula in the Southern Gulf of Mexico, January–February 2005. LGL Rep. TA2822-31. Rep. by LGL Ltd., King City, Ont., for Lamont-Doherty Earth Observatory of Columbia Univ., Palisades, NY, and Nat. Mar. Fish. Serv., Silver Spring, MD. 96 p.
Kastak, D., R.L. Schusterman, B.L. Southall and C.J. Reichmuth. 1999. Underwater temporary threshold shift induced by octave-band noise in three species of pinnipeds. J. Acoust. Soc. Am. 106(2):1142-1148.
Kastak, D., B.L. Southall, R.J. Schusterman and C. Reichmuth Kastak. 2005. Underwater temporary threshold shift in pinnipeds: effects of noise level and duration. J. Acoust. Soc. Am. 118(5):3154-3163.
Ketten, D.R., J. O'Malley, P.W.B. Moore, S. Ridgway and C. Merigo. 2001. Aging, injury, disease, and noise in marine mammal ears. J. Acoust. Soc. Am. 110(5, Pt. 2):2721.
Lucke, K., U. Siebert, P.A. Lepper and M.-A. Blanchet. 2009. Temporary shift in masked hearing thresholds in a harbor porpoise (Phocoena phocoena) after exposure to seismic airgun stimuli. J. Acoust. Soc. Am. 125(6):4060-4070.
MacGillivray, A.O. and D. Hannay. 2007a. Summary of noise assessment. p. 3-1 to 3-21 In: Marine mammal monitoring and mitigation during open water seismic exploration by ConocoPhillips Alaska, Inc., in the Chukchi Sea, July-October 2006. LGL Rep. P903-2 (Jan. 2007). Rep. from LGL Alaska Res. Assoc. Inc.,
Appendix B 53
Anchorage, AK, and JASCO Res. Ltd., Victoria, B.C., for ConocoPhillips Alaska Inc., Anchorage, AK, and Nat. Mar. Fish. Serv., Silver Spring, MD. 116 p.
MacGillivray, A. and D. Hannay. 2007b. Field measurements of airgun array sound levels. p. 4-1 to 4-19 In: Marine mammal monitoring and mitigation during open water seismic exploration by GX Technology in the Chukchi Sea, October-November 2006: 90-day report. LGL Rep. P891-1 (Feb. 2007). Rep. from LGL Alaska Res. Assoc. Inc., Anchorage, AK, and JASCO Res. Ltd., Victoria, B.C., for GX Technology, Houston, TX, and Nat. Mar. Fish. Serv., Silver Spring, MD. 118 p.
McCauley, R.D., M.-N. Jenner, C. Jenner, K.A. McCabe and J. Murdoch. 1998. The response of humpback whales (Megaptera novaeangliae) to offshore seismic survey noise: preliminary results of observations about a working seismic vessel and experimental exposures. APPEA (Austral. Petrol. Product. Explor. Assoc.) Journal 38:692-707.
McCauley, R.D., J. Fewtrell, A.J. Duncan, C. Jenner, M.-N. Jenner, J.D. Penrose, R.I.T. Prince, A. Adhitya, J. Murdoch and K. McCabe. 2000. Marine seismic surveys: Analysis of airgun signals; and effects of air gun exposure on humpback whales, sea turtles, fishes and squid. Report by Centre for Marine Science and Technology, Curtain University, Australia for Australian Petroleum Producers Association, Australia. 188 p.
Miller, J.H., A.E. Bowles, R.L. Gentry, W.T. Ellison, J.J. Finneran, C.R. Greene Jr., D. Kastak, D.R. Ketten, P.E. Nachtigall, W.J. Richardson, B.L. Southall, J.A. Thomas, and P.L. Tyack. 2005. Strategies for weighting exposure in the development of acoustic criteria for marine mammals. J. Acoust. Soc. Am. 118(3, Pt.2): 2019. Presentation to 150th Meet. Acoust. Soc. Am., Minneapolis, MN, Oct. 2005. Available at http://www.oce.uri.edu/faculty_pages/miller/Noise_Weighting_10_18_2005.ppt.
Richardson, W.J., C.R. Greene, Jr., C.I. Malme and D.H. Thomson. 1995. Marine mammals and noise. Academic Press, San Diego. 576 p.
Smultea, M.A., M. Holst, et al. 2003. Marine mammal monitoring during Lamont-Doherty Earth Observatory's acoustic calibration study in the northern Gulf of Mexico, 2003. LGL Rep. TA2822-12. Rep. from LGL Ltd., King City, Ont., for Lamont-Doherty Earth Observatory, Columbia Univ., Palisades, NY, and Nat. Mar. Fish. Serv., Silver Spring, MD.
Smultea, M.A., M. Holst, W.R. Koski and S. Stoltz. 2004. Marine mammal monitoring during Lamont-Doherty Earth Observatory’s seismic program in the Southeast Caribbean Sea and adjacent Atlantic Ocean, April–June 2004. LGL Rep. TA2822-26. Rep. From LGL Ltd., King City, Ont., for Lamont-Doherty Earth Observatory of Columbia Univ., Palisades, NY, and Nat. Mar. Fish. Serv., Silver Spring, MD. 106 p.
Smultea, M.A., W.R. Koski and T.J. Norris. 2005. Marine mammal monitoring during Lamont-Doherty Earth Observatory’s marine seismic study of the Blanco Fracture Zone in the Northeastern Pacific Ocean, October-November 2004. LGL Rep. TA2822-29. Rep. From LGL Ltd., King City, Ont., for Lamont-Doherty Earth Observatory of Columbia Univ., Palisades, NY, and Nat. Mar. Fish. Serv., Silver Spring, MD. 89 p.
Southall, B.L., A.E. Bowles, W.T. Ellison, J.J. Finneran, R.L Gentry, C.R. Greene, Jr., D. Kastak, D.R. Ketten, J.H. Miller, P.E. Nachtigall, W.J. Richardson, J.A. Thomas and P.L. Tyack. 2007. Marine mammal noise exposure criteria: initial scientific recommendations. Aquat. Mamm. 33: 1-521.
Tolstoy, M., J. Diebold, S. Webb, D. Bohnenstiehl and E. Chapp. 2004a. Acoustic calibration measurements. Chapter 3 In: W.J. Richardson (ed.), Marine mammal and acoustic monitoring during Lamont-Doherty Earth Observatory's acoustic calibration study in the northern Gulf of Mexico, 2003. Revised ed. Rep. from LGL Ltd., King City, Ont., for Lamont-Doherty Earth Observ., Palisades, NY, and Nat. Mar. Fish. Serv., Silver Spring, MD.
Tolstoy, M., J.B. Diebold, S.C. Webb, D.R. Bohenstiehl, E. Chapp, R.C. Holmes and M. Rawson. 2004b. Broad-band calibration of R/V Ewing seismic sources. Geophys. Res. Lett. 31:L14310. doi: 10.1029/2004GL020234
Appendix C 54
APPENDIX C: DETAILS OF MONITORING, MITIGATION, AND ANALYSIS METHODS
This appendix provides details on the standard visual monitoring methods and data analysis techniques implemented for this project and some other NSF-funded seismic studies.
Résumés documenting the qualifications of the MMOs were provided to NMFS prior to com-mencement of the study. All MMOs participated in a review meeting before the start of the study, designed to familiarize them with the operational procedures and conditions for the cruise, reporting protocols, and IHA stipulations. In addition, implementation of the IHA requirements was explained to the Captain, Science Officer, and the Science Party aboard the vessel. MMO duties included
• watching for and identifying marine mammals and sea turtles and recording their numbers, distances and behavior;
• noting possible reactions of marine mammals and sea turtles to the seismic operations;
• initiating mitigation measures when appropriate; and
• reporting the results.
Visual Monitoring Methods
Visual watches occurred during all daytime seismic operations and at most times during the daytime when the source vessel was underway but the GI gun(s)/sparker were not firing. This included (1) periods during transit to and from the seismic survey area, (2) a “pre-seismic period” while equipment was being deployed, (3) periods when the seismic source stopped firing while equipment was being repaired, and (4) a “post-seismic” period.
Visual observations were made from the Endeavor’s flying bridge, which is the highest suitable vantage point on the Endeavor. When stationed on the flying bridge, the eye level is ~11 m above sea level (asl), and the observer has a good view around the entire vessel.
Three observers trained in marine mammal identification and observation methods were present on the Endeavor. Onboard visual watches were usually conducted in 1–3 h shifts (max. 4 h), alternating with 1–2 h breaks, for a total of ~10 h per day per MMO. Daytime watches were conducted from dawn until dusk. MMO(s) scanned around the vessel, alternating between unaided eyes and 7×50 Fujinon binoculars to detect animals and to identify species or group size during sightings. The Fujinon binoculars were equipped with reticles on the ocular lens to measure depression angles relative to the horizon, an indicator of distance. For close sightings, a clinometer was used to determine distances. During the day, at least one and (if possible) two MMOs were on duty, especially during the 30 min before start ups and during ramp ups. Visual observations were also required at night 30 min before start up of seismic operations and during ramp ups. Night-vision devices were available for observations in the dark.
When MMO(s) were not on active duty at night, the Endeavor flying bridge personnel were asked to watch for marine mammals and turtles during their regular watches. They were provided with a copy of the observer instruction manual and marine mammal identification guides that were kept on the bridge. Bridge crew were given instruction on how, if they sighted marine mammals or sea turtles at night, they were to fill out specific marine mammal and sea turtle sighting forms in order to collect pertinent infor-mation on sightings when MMOs were not on active duty. Bridge personnel would also look for marine mammals and turtles during the day, when MMO(s) were on duty.

Appendix C 55
While on watch, MMOs kept systematic written records of the vessel’s position and activity, and environmental conditions. Codes that were used for this information are shown in Table D.1. Watch data were entered into an Excel database every ~30 min, as activities allowed. Additional data were recorded when marine mammals or sea turtles were observed. For all records, the date and time (in GMT), vessel position (latitude, longitude), water depth, and environmental conditions were recorded. Environmental conditions also were recorded whenever they changed and with each sighting record. Standardized codes were used for the records, and written comments were usually added as well.
For each sighting, the following information was recorded: species, number of individuals seen, direction of movement relative to the vessel, vessel position and activity, sighting cue, behavior when first sighted, behavior after initial sighting, heading (relative to vessel), bearing (relative to vessel), distance, behavioral pace, species identification reliability, and environmental conditions. Codes used to record this information during the cruise are shown in Table D.1. Distances to sightings were estimated from where the MMO was stationed rather than from the nominal center of the seismic source (the distance from the sighting to the GI gun(s)/sparker was calculated during analyses). However, for sightings near or within the safety radius in effect at the time, the distance from the sighting to the GI gun(s)/sparker was estimated and recorded for the purposes of implementing shut downs. The bearing from the observation vessel to the nearest member of the group was estimated using positions on a clock face, with the bow of the vessel taken to be 12 o’clock and the stern at 6 o’clock.
Operational activities that were recorded by MMOs included the number of GI guns or sparker in use, total volume of the GI guns in use, and type of vessel/seismic activity. The position of the vessel was automatically logged every minute by the Endeavor's navigation system. Those data were used when detailed position information was required. In addition, the following information was recorded, if possible, for other vessels within 5 km at the time of a marine mammal or turtle sighting: vessel type, size, heading (relative to study vessel), bearing (relative to study vessel), distance, and activity. A squawk box was used by the MMOs for communication between the flying bridge and the ship’s science lab to request a shut down when needed.
All data were entered into a Microsoft Excel database. The database was constructed to prevent entry of out-of-range values and codes. Data entries were checked manually by comparing listings of the computerized data with the original handwritten datasheets, both in the field and upon later analyses. Data collected by the MMOs were also checked against the navigation and shot logs collected automatically by the vessel’s computers.
Mitigation
Ramp-up and shut-down procedures are described in detail below. These were the primary forms of mitigation implemented during seismic operations. A ramp up consisted of a gradual increase in the number of operating GI guns, not to exceed an increase of 6 dB in source level per 5 min-period, the maximum ramp-up rate authorized by NMFS in the IHA (Appendix A). A ramp up could not be implemented for the sparker. A shut down occurred when all GI guns or the sparker were turned off.
Ramp-up Procedures
A “ramp-up” procedure was followed at the commencement of seismic operations with two GI guns and anytime after the GI guns were shut down for a specified duration (>4 min). The IHA required that, during the daytime, the entire safety radius be visible (i.e., not obscured by fog, etc.), and monitored for 30 min prior to and during ramp up, and that the ramp up could only commence if no marine

Appendix C 56
TABLE D.1. Summary of data codes used during the seismic survey. LOCATION BR Bridge FB Flying Bridge WS Watch Start WE Watch End
LINE Enter Line ID or leave blank
SEISMIC ACTIVITY LS Line Shooting ST Seismic Testing SZ Safety Zone Shut-Down SD Shut-Down OT Other (comment and describe) RC Recovering equipment DP Deploying equipment
# GUNS Enter Number of Operating Airguns, or X Unknown
ARRAY VOLUME Enter operating volume, or X Unknown
(BEAUFORT) SEA STATE See Beaufort Scale sheet.
VISIBILITY (# KM) # of km or <3.5 If variable and <3.5 km >3.5 If variable and >3.5 km V If variable (between 1-10 km)
LIGHT OR DARK L Light (day) D Darkness
GLARE AMOUNT NO None LI Little MO Moderate SE Severe
POSITION Clock Position, or V Variable (vessel turning)
WATER DEPTH (in m)
VESSEL SPEED <2 KTS YES Speed is <2 kts NO Speed is >2 kts
MARINE MAMMAL SPECIES
Baleen Whales BLW Blue Whale BRW Bryde’s Whale FW Fin Whale SW Sei Whale HW Humpback Whale MW Minke Whale NARW North Atlantic Right Whale
UMW Unidentified Mysticete Whale UW Unidentified Whale
Toothed Whales DSW Dwarf Sperm Whale FKW False Killer Whale KW Killer Whale LFPW Long-finned Pilot Whale MHW Melon-headed Whale PKW Pygmy Killer Whale PSW Pygmy Sperm Whale SPW Sperm Whale SFPW Short-finned Pilot Whale UTW Unidentified Tooth Whale UW Unidentified Whale
Beaked Whales BBW Blainville's Beaked Whale CBW Cuvier's Beaked Whale GBW Gervais' Beaked Whale NBW Northern Bottlenose Whale SBW Sowerby's Beaked Whale TBW True’s Beaked Whale UBW Unidentified Beaked Whale Dolphins ASD Atlantic Spotted Dolphin AWD Atlantic White-sided Dolphin BD Bottlenose Dolphin FD Fraser’s Dolphin LCD Long-beaked Common
Dolphin RD Risso's Dolphin SCD Short-beaked Common
Dolphin SPD Spinner Dolphin STD Striped Dolphin UD Unidentified Dolphin WBD White-beaked Dolphin Porpoise HP Harbor Porpoise
Pinnipeds GSL Gray Seal HPS Harp Seal HBS Harbor Seal HDS Hooded Seal
TURTLE SPECIES GR Green Turtle HB Hawksbill Turtle LH Loggerhead Turtle LB Leatherback Turtle UT Unidentified Turtle
MOVEMENT PE Across Bow ST Swim Toward SA Swim Away FL Flee SP Swim Parallel MI Mill NO No movement
UN Unknown
INDIVIDUAL BEHAVIOR MA Mating SI Sink FD Front Dive TH Thrash Dive DI Dive LO Look LG Logging SW Swim BR Breach LT Lobtail SH Spyhop FS Flipper Slap FE Feeding FL Fluking BL Blow BO Bow Riding PO Porpoising RA Rafting WR Wake Riding AG Approaching Guns DE Dead OT Other (describe) NO None (sign seen only) UN Unknown
GROUP BEHAVIOR (BEHAVIORAL STATES) TR Travel SA Surface Active ST Surface Active-Travel MI Milling FG Feeding RE Resting OT Other (describe) UN Unknown
# RETICLES, ANGLE or ESTIMATE (of Initial Distance, etc.) 0 to 20 Number of reticles E Estimate, by eye
SIGHTING CUE BO Body HE Head SP Splash FL Flukes DO Dorsal Fin BL Blow BI Birds
IDENTIFICATION RELIABILITY MA Maybe PR Probably PO Positive
BEHAVIOR PACE SE Sedate MO Moderate VI Vigorous
Appendix C 57
mammals or sea turtles were detected within the safety radius during this period. During a ramp up, the safety zone was taken to be that appropriate for both GI guns and the water depth at the time. First, a single GI gun was turned on, and 5 min later, the second GI gun was started up. Thus, the source level of the GI guns was increased by no more than 6 dB per 5-min period (Appendix A).
Shut-down Procedures
GI gun or sparker operations were immediately shut down when one or more marine mammals or sea turtles were detected within, or judged about to enter, the appropriate safety radius. A shut down was to be accomplished within several seconds (or a “one-shot” period) of the determination that a marine mammal or sea turtle was within or about to enter the safety radius. Seismic operations were not to resume until the animal was seen outside the safety radius, had not been seen for a specified amount of time (10 min for dolphins and pinnipeds, 15 min for whales), or was assumed to have been left behind (and outside the safety radius) by the vessel (e.g., turtles). Once the safety radius was judged to be clear of marine mammals or sea turtles based on those criteria, the MMOs advised the geophysicists that seismic surveys could re-commence.
The MMOs were stationed on the flying bridge ahead of the seismic source, which was located aft of the Endeavor’s stern. The decision to initiate a shut down was based on the distance from the observers rather than from the seismic source, unless the animals were sighted close to the GI gun(s)/sparker. This was a precautionary measure, given that most sightings were ahead of the vessel.
Analyses
This section describes the analyses of the marine mammal and sea turtle sightings and survey effort as documented during the cruise. It also describes the methods used to calculate densities of marine mammals (and sea turtles) and estimate the number of marine mammals potentially exposed to seismic sounds associated with the seismic study. The analysis categories were identified in Chapter 3. The primary analysis categories used to assess potential effects of seismic sounds on marine mammals and turtles were “seismic” (including 90 s after cessation of operations) and “non-seismic” (before seismic started and >2 h after the seismic source was turned off). The analyses (for effort, marine mammals, and sea turtles), excluded the “recently exposed” period 1.5 min to 2 h after the GI guns were turned off. The justification for the selection of these criteria is based on the size of the seismic source in use and is provided below. These criteria were discussed in earlier cruise reports to NMFS (see Haley and Koski 2004; Smultea et al. 2004, 2005; MacLean and Koski 2005; Holst et al. 2005a,b; Holst and Beland 2008; Holst and Smultea 2008; Hauser et al. 2008):
• The period up to 1.5 min after the last seismic shot/spark is typically ~10× the normal shot interval. Mammal and turtle distribution and behavior during that short period are assumed to be similar to those while seismic surveying is ongoing.
• It is likely that any marine mammals and turtles near the Endeavor between 1.5 min and 2 h after the cessation of seismic activities would have been “recently exposed” (i.e., within the past 2 h) to sounds from the seismic survey. During at least a part of that period, the distribution and perhaps behavior of the animals probably would still be influenced by the (previous) sounds.
• By 2 h after the cessation of seismic operations with a small source, the distribution and behavior of marine mammals and turtles would be expected to be indistinguishable from “normal” because of (a) waning of responses to past seismic activity, (b) re-distribution of
Appendix C 58
mobile animals, and (c) movement of the ship and MMOs. Given those considerations, plus the limited observed responses of marine mammals to seismic surveys (e.g., Stone 2003; Gordon et al. 2004; and NSF-funded surveys), it is unlikely that the distribution or behavior of marine mammals or turtles near the Endeavor >2 h post-seismic would be appreciably different from “normal” even if they had been exposed to seismic sounds earlier. Therefore, we consider animals seen >2 h after cessation of operations by a small source to be unaffected by the seismic operations.
Marine mammal density was one of the parameters examined to assess differences in the distribution of marine mammals and sea turtles relative to the seismic vessel between seismic and non-seismic periods. Line-transect procedures for vessel-based visual surveys were followed. To allow for animals missed during daylight, we corrected our visual observations for missed animals by using approximate correction factors derived from previous studies. (It was not practical to derive study-specific correction factors during a survey of this type and duration.) It is recognized that the most appropriate correction factors will depend on specific observation procedures during different studies, ship speed, and other variables. Thus, use of correction factors derived from other studies is not ideal, but it provides more realistic estimates of numbers present than could be obtained without using data from other studies.
The formulas for calculating densities using this procedure were briefly described in Chapter 3 and are further described below. As standard for line-transect estimation procedures, densities were corrected for the following two parameters before they were further analyzed:
• g(0), a measure of detection bias. This factor allows for the fact that less than 100% of the animals present along the trackline are detected.
• f(0), the reduced probability of detecting an animal with increasing distance from the track-line.
The g(0) and f(0) factors used in this study for cetaceans and sea turtles were taken from results of previous work, not from observations made during this study. Sighting rates during the present study were either too small or, at most, marginal to provide meaningful data on f(0) based on group size. Further, this type of project cannot provide data on g(0). Estimates of these correction factors for cetaceans were derived from Koski et al. (1998). Marine mammal and turtle sightings were subjected to species-specific truncation criteria obtained from the above studies.
Number of Marine Mammal Exposures
Estimates of the numbers of potential exposures of marine mammals to sound levels ≥160 dB re 1 µParms were calculated by multiplying the following two values. These calculations were done separately for times when different seismic sources were in use, and the results were summed:
• area assumed to be ensonified to ≥160 dB (depending on the airgun(s) in use at the time; (Table B.1), and
• “corrected” densities of marine mammals estimated by line transect methods as summarized above.
For this calculation, areas ensonified to ≥160 dB on two or more occasions were counted two or more times, as appropriate. This occurred when two survey lines intersected, part or all of a survey line was repeated, or two parallel survey lines were close enough together such that the ≥160 dB zones around those lines overlapped.
Appendix C 59
Number of Individuals Exposed
The estimated number of individual exposures to levels ≥160 dB obtained by the method described above likely overestimates the number of different individual mammals exposed to the seismic sounds at received levels ≥160 dB. This occurs because some exposure incidents may have involved the same individuals previously exposed, given that some seismic lines crossed other lines or were spaced closely together (see Fig. 2.1).
A minimum estimate of the number of different individual marine mammals potentially exposed (one or more times) to ≥160 dB re 1 µParms was calculated. That involved multiplying the corrected density of marine mammals by the area exposed to ≥160 dB one or more times during the course of the study. The area was calculated using MapInfo Geographic Information System (GIS) software by creating a “buffer” that extended on both sides of the vessel’s trackline to the predicted 160-dB radius. The buffer includes areas that were exposed to seismic sounds sounds ≥160 dB multiple times (as a result of crossing tracklines or tracklines that were close enough for their 160-dB zones to overlap). The buffer area only counts the repeated-coverage areas once, as opposed to the “exposures” method outlined above. The calculated number of different individual marine mammals exposed to ≥160 dB re 1 µParms is considered a minimum estimate because it does not account for the movement of marine mammals during the course of the study.
The buffer process outlined above was repeated for delphinids, assuming that for those animals, the estimated 170 dB-radius (see Table 3.1) was a more realistic estimate of the maximum distance at which significant disturbance would occur. That radius was used to estimate both the number of exposures and the number of individuals exposed to seismic sounds with received levels ≥170 dB re 1 µParms. The process was also repeated for marine mammals based on the estimated 180-dB radius. That was done to estimate the numbers of animals that would have been subjected to sounds with received levels ≥180 dB re 1 µParms if they had not altered their course to avoid those sound levels (or the ship).
References
Gordon, J., D. Gillespie, J. Potter, A. Frantzis, M.P. Simmonds, R. Swift and D. Thompson. 2004. A review of the effects of seismic surveys on marine mammals. Mar. Technol. Soc. J. 37(4):16-34.
Haley, B., and W.R. Koski. 2004. Marine mammal monitoring during Lamont-Doherty Earth Observatory’s seismic program in the Northwest Atlantic Ocean, July–August 2004. LGL Rep. TA2822-27. Rep. from LGL Ltd., King City, Ont., for Lamont-Doherty Earth Observatory of Columbia Univ., Palisades, NY, and Nat. Mar. Fish. Serv., Silver Spring, MD. 80 p.
Hauser, D.D.W., M. Holst, and V.D. Moulton. 2008. Marine mammal and sea turtle monitoring during Lamont-Doherty Earth Observatory’s marine seismic program in the Eastern Tropical Pacific, April–August 2008. LGL Rep. TA4656/7-1. Rep. from LGL Ltd., King City, Ont. and St. John’s, Nfld, for Lamont-Doherty Earth Observatory of Columbia Univ., Palisades, NY, and Nat. Mar. Fish. Serv., Silver Spring, MD. 98 p.
Holst, M. and J. Beland. 2008. Marine mammal and sea turtle monitoring during Lamont-Doherty Earth Observatory’s seismic testing and calibration study in the northern Gulf of Mexico, November 2007–February 2008. LGL Rep. TA4295-2. Rep. from LGL Ltd., King City, Ont., for Lamont-Doherty Earth Observatory of Columbia Univ., Palisades, NY, and Nat. Mar. Fish. Serv., Silver Spring, MD. 77 p.
Holst, M. and M.A. Smultea. 2008. Marine mammal and sea turtle monitoring during Lamont-Doherty Earth Observatory’s marine seismic program off Central America, February–April 2008. LGL Rep. TA4342-3. Rep. from LGL Ltd., King City, Ont., for Lamont-Doherty Earth Observatory of Columbia Univ., Palisades, NY, and Nat. Mar. Fish. Serv., Silver Spring, MD. 133 p.

Appendix C 60
Holst, M., M.A. Smultea, W.R. Koski, and B. Haley. 2005a. Marine mammal and sea turtle monitoring during Lamont-Doherty Earth Observatory’s marine seismic program in the Eastern Tropical Pacific Ocean off Central America, November–December 2004. LGL Rep. TA2822-30. Rep. by LGL Ltd., King City, Ont., for Lamont-Doherty Earth Observatory of Columbia Univ., Palisades, NY, and Nat. Mar. Fish. Serv., Silver Spring, MD. 125 p.
Holst, M., M.A. Smultea, W.R. Koski, and B. Haley. 2005b. Marine mammal and sea turtle monitoring during Lamont-Doherty Earth Observatory’s marine seismic program off the Northern Yucatán Peninsula in the Southern Gulf of Mexico, January–February 2005. LGL Rep. TA2822-31. Rep. by LGL Ltd., King City, Ont., for Lamont-Doherty Earth Observatory of Columbia Univ., Palisades, NY, and Nat. Mar. Fish. Serv., Silver Spring, MD. 96 p.
Koski, W.R., D.H. Thomson and W.J. Richardson. 1998. Descriptions of Marine Mammal Populations. p. 1-182 plus Appendices In: Point Mugu Sea Range Marine Mammal Technical Report. Rep. from LGL Ltd., King City, Ont., for Naval Air Warfare Center, Weapons Div., Point Mugu, CA, and Southwest Div. Naval Facilities Engin. Command, San Diego, CA. 322 p.
MacLean, S.A. and W.R. Koski. 2005. Marine mammal monitoring during Lamont-Doherty Earth Observatory’s seismic program in the Gulf of Alaska, August–September 2004. LGL Rep. TA2822-28. Rep. from LGL Ltd., King City, Ont., for Lamont-Doherty Earth Observatory of Columbia Univ., Palisades, NY, and Nat. Mar. Fish. Serv., Silver Spring, MD. 102 p.
Smultea, M.A., M. Holst, W.R. Koski and S. Stoltz. 2004. Marine mammal monitoring during Lamont-Doherty Earth Observatory’s seismic program in the Southeast Caribbean Sea and adjacent Atlantic Ocean, April–June 2004. LGL Rep. TA2822-26. Rep. From LGL Ltd., King City, Ont., for Lamont-Doherty Earth Observatory of Columbia Univ., Palisades, NY, and Nat. Mar. Fish. Serv., Silver Spring, MD. 106 p.
Smultea, M.A., W.R. Koski and T.J. Norris. 2005. Marine mammal monitoring during Lamont-Doherty Earth Observatory’s marine seismic study of the Blanco Fracture Zone in the Northeastern Pacific Ocean, October-November 2004. LGL Rep. TA2822-29. Rep. From LGL Ltd., King City, Ont., for Lamont-Doherty Earth Observatory of Columbia Univ., Palisades, NY, and Nat. Mar. Fish. Serv., Silver Spring, MD. 89 p.
Stone, C.J. 2003. The effects of seismic activity on marine mammals in UK waters 1998-2000. JNCC Report 323. Joint Nature Conservancy, Aberdeen , Scotland. 43 p.

Appendix D 61
APPENDIX D: BACKGROUND ON MARINE MAMMALS IN THE NWA
TABLE D.1. The habitat, occurrence, and conservation status of marine mammals occurring in the NWA study area. Species
Habitat
Occurrence in
Study Area
Regional BestAbundance
Est.1
ESA2
IUCN3
CITES4
Mysticetes North Atlantic right whale (Eubalaena glacialis)
Coastal and shelf
waters
Common
3255
EN
EN I
Humpback whale (Megaptera novaengliae)
Mainly nearshore waters and banks
Common
11,5706
EN
LC
I Minke whale (Balaenoptera acutorostrata) Coastal waters Common
~188,0007 NL LC I
Bryde’s whale (Balaenoptera brydei)
rimarily offshore, pelagic
Rare
N.A.
NL
DD
I Sei whale (Balaenoptera borealis)
Primarily offshore,pelagic Uncommon
~10,3008 EN EN I
Fin whale (Balaenoptera physalus)
Continental slope, mostly pelagic
Common
~35,5009
EN
EN
I Blue whale (Balaenoptera musculus)
Coastal, shelf, andcoastal waters Uncommon?
Up to 140010 EN EN I
Odontocetes Sperm whale (Physeter macrocephalus)
Pelagic
Common?
13,19011
EN
VU
I
Pygmy sperm whale (Kogia breviceps)
Deep waters off theshelf
Uncommon
N.A.
NL
DD
II Dwarf sperm whale (Kogia sima)
Deep waters off the shelf
Uncommon
N.A.
NL
DD
II Cuvier’s beaked whale (Ziphius cavirostris)
Pelagic
Uncommon
N.A.
NL
DD
II Northern bottlenose whale (Hyperoodon ampullatus)
Pelagic
Rare
40,00012
NL
DD
II True’s beaked whale (Mesoplodon mirus)
Pelagic
Rare
N.A.
NL
DD
II Gervais’ beaked whale (Mesoplodon europaeus)
Pelagic Rare
N.A.
NL
DD
II Sowerby’s beaked whale (Mesoplodon bidens)
Pelagic
Rare
N.A
NL
DD
II Blainville’s beaked whale (Mesoplodon densirostris)
Pelagic
Rare
N.A.
NL
DD
N.A. Bottlenose dolphin (Tursiops truncatus)
Shelf, coastal, and offshore
Common 81,58813
NL^
LC
II Pantropical spotted dolphin (Stenella attenuata)
Coastal and pelagic Rare N.A. NL LC II
Atlantic spotted dolphin (Stenella frontalis) ainly coastal waters
Uncommon?
50,978
NL
DD
II Spinner dolphin (Stenella longirostris)
Coastal and pelagic Rare N.A. NL DD II
Striped dolphin (Stenella coeruleoalba)
Off the continentalshelf
Common?
94,462
NL
LC
II Short-beaked common dolphin (Delphinus delphis)
ontinental shelf and pelagic
Common
120,743
NL
LC
II White-beaked dolphin (Lagenorhynchus albirostris)
Continental shelf <200 m
Uncommon? 10s to 100s of
1000s14
NL
LC
II Atlantic white-sided dolphin (Lagenorhynchus acutus)
Shelf and slope waters
Common 10s to 100s of
1000s15
NL
LC
II

Appendix D 62
TABLE D.1 (concluded). Species
Habitat
Occurrence in
Study Area
Regional BestAbundance
Est.1
ESA2
IUCN3
CITES4
Risso’s dolphin (Grampus griseus)
Waters 400–1000 m
Common
20,479
NL
LC
II
False killer whale (Pseudorca crassidens)
Tropical, temperate,
Extralimital
N.A.
NL
DD
II
Killer whale (Orcinus orca)
Coastal, widely distributed
Rare
N.A.
NL*
DD
II Long-finned pilot whale (Globicephala melas)
Mostly pelagic
Common?
~810,00016
NL
DD
II Short-finned pilot whale (Globicephala macrorhynchus) Mostly pelagic Common? ~810,00016 NL DD II Harbor porpoise (Phoecena phocoena)
Coastal
Common? ~500,00017
NL
LC
II Pinnipeds Harbor seal (Phoca vitulina)
Coastal
Common
99,340
NL
LC
N.A.
Gray seal (Halichoerus grypus)
Coastal
Common 52,50018
NL
LC
N.A. Harp seal (Pagophilius groenlandicus)
Coastal
Uncommon 5.5 million19
NL
LC
N.A. Hooded seal (Cystophora cristata)
Coastal
Uncommon 592,10020
NL
VU
N.A. N.A. = Data not available or species status was not assessed. ? indicates uncertainty 1 Abundance estimates are given from Waring et al. (2008), typically for U.S. Western North Atlantic stocks unless otherwise indicated. For species whose distribution is primarily offshore or not known, we do not consider estimates for the U.S. EEZ in Waring et al. (2008) to be valid estimates for the NWA and the regional population is given as N.A. unless it is available from another source. 2 U.S. Endangered Species Act; EN = Endangered, NL = Not listed
3 Codes for IUCN classifications from the IUCN Red List of Threatened Species (IUCN 2009): CR = Critically Endangered; EN = Endangered; VU = Vulnerable; NT = Near Threatened; LC = Least Concern; DD = Data Deficient. 4 Convention on International Trade in Endangered Species of Wild Fauna and Flora (UNEP-WCMC 2009): Appendix I = Threaten-ed with extinction; Appendix II = not necessarily now threatened with extinction but may become so unless trade is closely controlled. 5 Estimate updated in NMFS 2008 Draft stock assessment report, available at http://www.nmfs.noaa.gov/pr/pdfs/sars/ao2008_ draft_summary.pdf. 6 Estimate for the western North Atlantic (IWC 2007). 7 Estimate for the North Atlantic (IWC 2007; Waring et al. 2008). 8 Estimate for the Northeast Atlantic (Cattanach et al. 1993). 9 Estimate for the North Atlantic (IWC 2007; Waring et al. 2008). 10 Estimate for the North Atlantic (NMFS 1998). 11 Estimate for North Atlantic (Whitehead 2002). 12 Estimate for Northeast Atlantic (NAMMCO 1995). 13 Estimate for the Western North Atlantic and Offshore stock, and may include coastal forms. 43,951 animals estimated for all management units of the Coastal morphotype (Waring et al. 2008). 14 Tens to low hundreds of thousands (Reeves et al. 1999a). 15 High tens to low hundreds of thousands (Reeves et al. 1999b). 16 Estimate may include both long- and short-finned pilot whales. 17 Estimate for the North Atlantic (Jefferson et al. 2008). 18 Estimate for the northwest Atlantic Ocean in the Gulf of St. Lawrence and along the Nova Scotia eastern shore (Hammill 2005). 19 Estimate for the northwest Atlantic Ocean (DFO 2007). 20 Estimate for the northwest Atlantic Ocean (ICES 2006). * Killer whales in the eastern Pacific Ocean, near Washington state, are listed as endangered under the U.S. ESA but not in the Atlantic Ocean. ^ The Western North Atlantic Coastal Morphotype stock, ranging from NJ to FL, is listed as depleted under the U.S. Marine Mammal Protection Act.
Appendix D 63
References
Cattanach, K.L., J. Sigurrjonsson, S.T. Buckland, and T. Gunnlaugsson. 1993. Sei whale abundance in the North Atlantic, estimated from NASS-87 and NASS-89 data. Rep. Int. Whal. Comm. 43:315-321.
DFO. 2007. A review of ice conditions and potential impact on harp seal neonatal mortality in March 2007. Science Advisory Science Response 2007/008. Department of Fisheries and Oceans Canadian Science Advisory Secretariat. 8 p.
Hammill, M.O. 2005. Abundance of northwest Atlantic grey seals in the Gulf of St. Lawrence and along the Nova Scotian eastern shore. Research Document 2005/036. Canadian Department of Fisheries and Oceans. 11 p.
ICES (International Council for the Exploration of the Sea). 2006. Report of the ICES/NAFO working group on harp and hooded seals (WGHARP). ICES CM 2006/ACFM:32. ICES Advisory Committee on Fishery Management. 28 p.
IUCN (The World Conservation Union). 2009. IUCN Red List of Threatened Species. Version 2009.2. www.iucnredlist.org.
IWC. 2007. Whale population estimates: population table. Last updated 09/01/09. Accessed on 25 February 2009 at http://www.iwcoffice.org/conservation/estimate.htm#table.
Jefferson, T.A., M.A. Webber, and R.L. Pitman. 2008. Marine mammals of the world: a comprehensive guide to their identification. Elsevier, London, U.K. 573 p.
NAMMCO (North Atlantic Marine Mammal Commission). 1995. Report of the third meeting of the Scientific Committee. P. 67-71 In: NAMMCO Annual Report 1995, NAMMCO, Tromso, Norway.
NMFS (National Marine Fisheries Service). 1998. Recovery plan for the blue whale (Balaenoptera musculus). Prepared by R.R. Reeves, P.J. Clapham, R.L. Brownell, Jr., and G.K. Silber for the National Marine Fisheries Service, Silver Spring, MD. 42 p.
Reeves, R.R., C. Smeenk, C.C. Kinze, R.L. Brownell, Jr., and J. Lien. 1999a. White-beaked dolphin Lagenorhynchus albirostris Gray, 1846). p. 1-30 In S.H. Ridgeway and R. Harrison (eds.) Handbook of marine mammals, Vol. 6: The second handbook of dolphins and the porpoises. Academic Press, San Diego, CA. 486 p.
Reeves, R.R., C. Smeenk, R.L. Brownell, Jr., and C.C. Kinze. 1999b. Atlantic white-sided dolphin Lagenorhynchus acutus (Gray, 1828). p. 31-58 In S.H. Ridgeway and R. Harrison (eds.) Handbook of marine mammals, Vol. 6: The second handbook of dolphins and the porpoises. Academic Press, San Diego, CA. 486 p.
UNEP-WCMC. 2009. UNEP-WCMC species database: CITES-listed species. www.cites.org/eng/app/ appendices.shtml.
Waring, G.T., E. Josephson, C.P. Fairfield-Walsh, and K. Maze-Foley (eds.). 2008. U.S. Atlantic and Gulf of Mexico Marine Mammal Stock Assessments–2007. NOAA Tech. Memo. NMFS NE 205. Northeast Fish-eries Science Center, National Marine Fisheries Service, Woods Hole, MA. 415 p.
Whitehead, H. 2002. Estimates of the current global population size and historical trajectory for sperm whales. Mar. Ecol. Prog. Ser. 242:295-304.
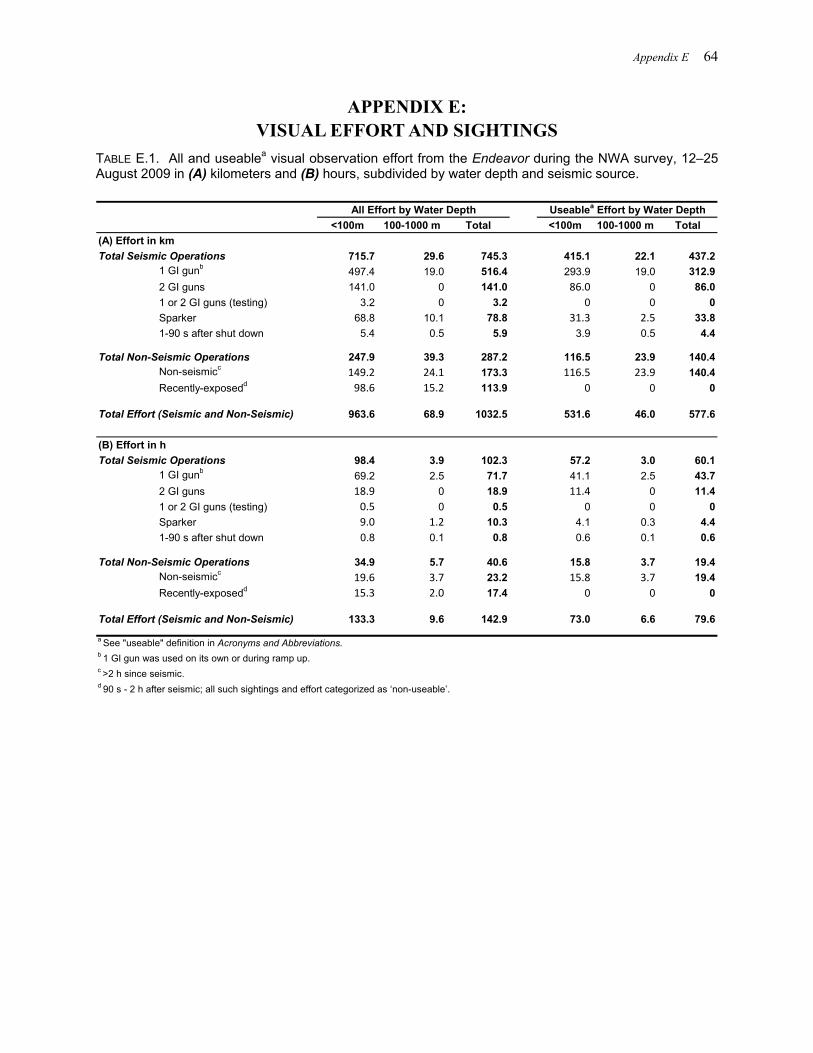
Appendix E 64
APPENDIX E: VISUAL EFFORT AND SIGHTINGS
TABLE E.1. All and useablea visual observation effort from the Endeavor during the NWA survey, 12–25 August 2009 in (A) kilometers and (B) hours, subdivided by water depth and seismic source.
<100m 100-1000 m Total <100m 100-1000 m Total(A) Effort in kmTotal Seismic Operations 715.7 29.6 745.3 415.1 22.1 437.2
1 GI gunb 497.4 19.0 516.4 293.9 19.0 312.92 GI guns 141.0 0 141.0 86.0 0 86.01 or 2 GI guns (testing) 3.2 0 3.2 0 0 0Sparker 68.8 10.1 78.8 31.3 2.5 33.81-90 s after shut down 5.4 0.5 5.9 3.9 0.5 4.4
Total Non-Seismic Operations 247.9 39.3 287.2 116.5 23.9 140.4Non-seismicc 149.2 24.1 173.3 116.5 23.9 140.4
98.6 15.2 113.9 0 0 0
Total Effort (Seismic and Non-Seismic) 963.6 68.9 1032.5 531.6 46.0 577.6
(B) Effort in hTotal Seismic Operations 98.4 3.9 102.3 57.2 3.0 60.1
1 GI gunb 69.2 2.5 71.7 41.1 2.5 43.72 GI guns 18.9 0 18.9 11.4 0 11.41 or 2 GI guns (testing) 0.5 0 0.5 0 0 0Sparker 9.0 1.2 10.3 4.1 0.3 4.41-90 s after shut down 0.8 0.1 0.8 0.6 0.1 0.6
Total Non-Seismic Operations 34.9 5.7 40.6 15.8 3.7 19.4Non-seismicc 19.6 3.7 23.2 15.8 3.7 19.4
15.3 2.0 17.4 0 0 0
Total Effort (Seismic and Non-Seismic) 133.3 9.6 142.9 73.0 6.6 79.6
a See "useable" definition in Acronyms and Abbreviations. b 1 GI gun was used on its own or during ramp up.c >2 h since seismic.d 90 s - 2 h after seismic; all such sightings and effort categorized as ‘non-useable’.
All Effort by Water Depth Useablea Effort by Water Depth
Recently-exposedd
Recently-exposedd
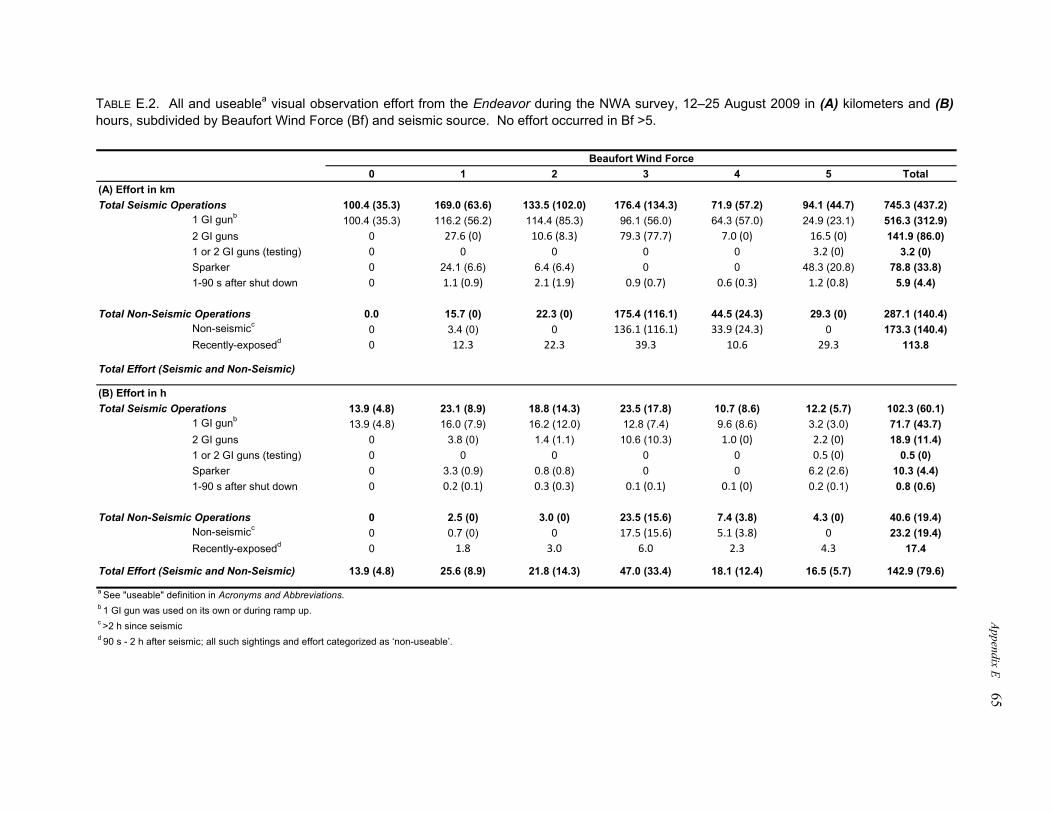
Appendix E 65
TABLE E.2. All and useablea visual observation effort from the Endeavor during the NWA survey, 12–25 August 2009 in (A) kilometers and (B) hours, subdivided by Beaufort Wind Force (Bf) and seismic source. No effort occurred in Bf >5.
0 1 2 3 4 5 Total(A) Effort in kmTotal Seismic Operations 100.4 (35.3) 169.0 (63.6) 133.5 (102.0) 176.4 (134.3) 71.9 (57.2) 94.1 (44.7) 745.3 (437.2)
1 GI gunb 100.4 (35.3) 116.2 (56.2) 114.4 (85.3) 96.1 (56.0) 64.3 (57.0) 24.9 (23.1) 516.3 (312.9)2 GI guns 0 27.6 (0) 10.6 (8.3) 79.3 (77.7) 7.0 (0) 16.5 (0) 141.9 (86.0)1 or 2 GI guns (testing) 0 0 0 0 0 3.2 (0) 3.2 (0)Sparker 0 24.1 (6.6) 6.4 (6.4) 0 0 48.3 (20.8) 78.8 (33.8)1-90 s after shut down 0 1.1 (0.9) 2.1 (1.9) 0.9 (0.7) 0.6 (0.3) 1.2 (0.8) 5.9 (4.4)
Total Non-Seismic Operations 0.0 15.7 (0) 22.3 (0) 175.4 (116.1) 44.5 (24.3) 29.3 (0) 287.1 (140.4)Non-seismicc 0 3.4 (0) 0 136.1 (116.1) 33.9 (24.3) 0 173.3 (140.4)
0 12.3 22.3 39.3 10.6 29.3 113.8
Total Effort (Seismic and Non-Seismic)
(B) Effort in hTotal Seismic Operations 13.9 (4.8) 23.1 (8.9) 18.8 (14.3) 23.5 (17.8) 10.7 (8.6) 12.2 (5.7) 102.3 (60.1)
1 GI gunb 13.9 (4.8) 16.0 (7.9) 16.2 (12.0) 12.8 (7.4) 9.6 (8.6) 3.2 (3.0) 71.7 (43.7)2 GI guns 0 3.8 (0) 1.4 (1.1) 10.6 (10.3) 1.0 (0) 2.2 (0) 18.9 (11.4)1 or 2 GI guns (testing) 0 0 0 0 0 0.5 (0) 0.5 (0)Sparker 0 3.3 (0.9) 0.8 (0.8) 0 0 6.2 (2.6) 10.3 (4.4)1-90 s after shut down 0 0.2 (0.1) 0.3 (0.3) 0.1 (0.1) 0.1 (0) 0.2 (0.1) 0.8 (0.6)
Total Non-Seismic Operations 0 2.5 (0) 3.0 (0) 23.5 (15.6) 7.4 (3.8) 4.3 (0) 40.6 (19.4)Non-seismicc 0 0.7 (0) 0 17.5 (15.6) 5.1 (3.8) 0 23.2 (19.4)
0 1.8 3.0 6.0 2.3 4.3 17.4
Total Effort (Seismic and Non-Seismic) 13.9 (4.8) 25.6 (8.9) 21.8 (14.3) 47.0 (33.4) 18.1 (12.4) 16.5 (5.7) 142.9 (79.6)
a See "useable" definition in Acronyms and Abbreviations. b 1 GI gun was used on its own or during ramp up.c >2 h since seismicd 90 s - 2 h after seismic; all such sightings and effort categorized as ‘non-useable’.
Recently-exposedd
Beaufort Wind Force
Recently-exposedd
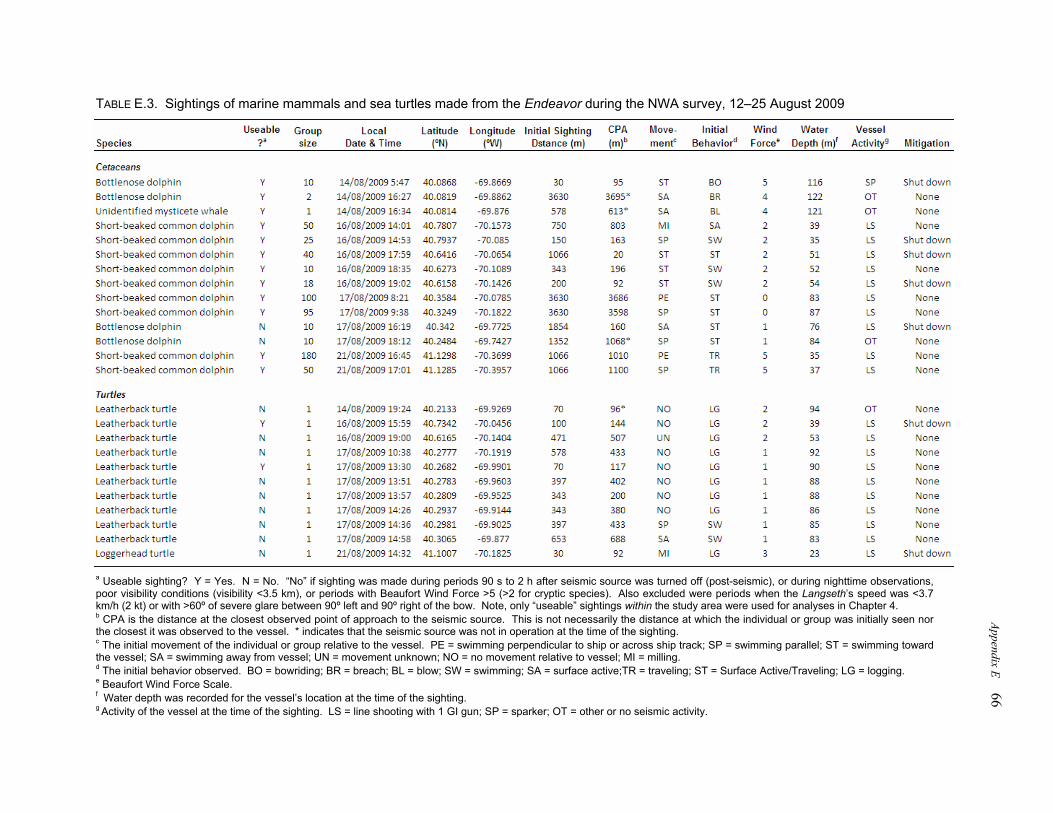
Appendix E 66
TABLE E.3. Sightings of marine mammals and sea turtles made from the Endeavor during the NWA survey, 12–25 August 2009
a Useable sighting? Y = Yes. N = No. “No” if sighting was made during periods 90 s to 2 h after seismic source was turned off (post-seismic), or during nighttime observations, poor visibility conditions (visibility <3.5 km), or periods with Beaufort Wind Force >5 (>2 for cryptic species). Also excluded were periods when the Langseth’s speed was <3.7 km/h (2 kt) or with >60º of severe glare between 90º left and 90º right of the bow. Note, only “useable” sightings within the study area were used for analyses in Chapter 4. b CPA is the distance at the closest observed point of approach to the seismic source. This is not necessarily the distance at which the individual or group was initially seen nor the closest it was observed to the vessel. * indicates that the seismic source was not in operation at the time of the sighting. c The initial movement of the individual or group relative to the vessel. PE = swimming perpendicular to ship or across ship track; SP = swimming parallel; ST = swimming toward the vessel; SA = swimming away from vessel; UN = movement unknown; NO = no movement relative to vessel; MI = milling. d The initial behavior observed. BO = bowriding; BR = breach; BL = blow; SW = swimming; SA = surface active;TR = traveling; ST = Surface Active/Traveling; LG = logging. e Beaufort Wind Force Scale. f Water depth was recorded for the vessel’s location at the time of the sighting. g Activity of the vessel at the time of the sighting. LS = line shooting with 1 GI gun; SP = sparker; OT = other or no seismic activity.