marine protected areas lesson plan protect …...marine protected areas designing marine protected...
TRANSCRIPT
oceanservice.noaa.gov/education 1
MARINE PROTECTED AREAS LESSON PLAN
Protect This!
ThemeDesigning Marine Protected Areas
Links to Overview Essays and Resources Needed for Student Research
http://oceanservice.noaa.gov/topics/oceans/mpa/http://mpa.gov
Subject AreaLife Science
Grade Level9-12
Focus Question What criteria should be considered when designing marine reserves to protect biodiversity?
Learning Objectives • Students will be able to describe the general meaning of
biodiversity.
• Students will be able to describe four criteria for marine reserves designed to protect biodiversity.
• Students will be able to discuss the advantages and disad-vantages of clustered vs. scattered sites in marine reserves.
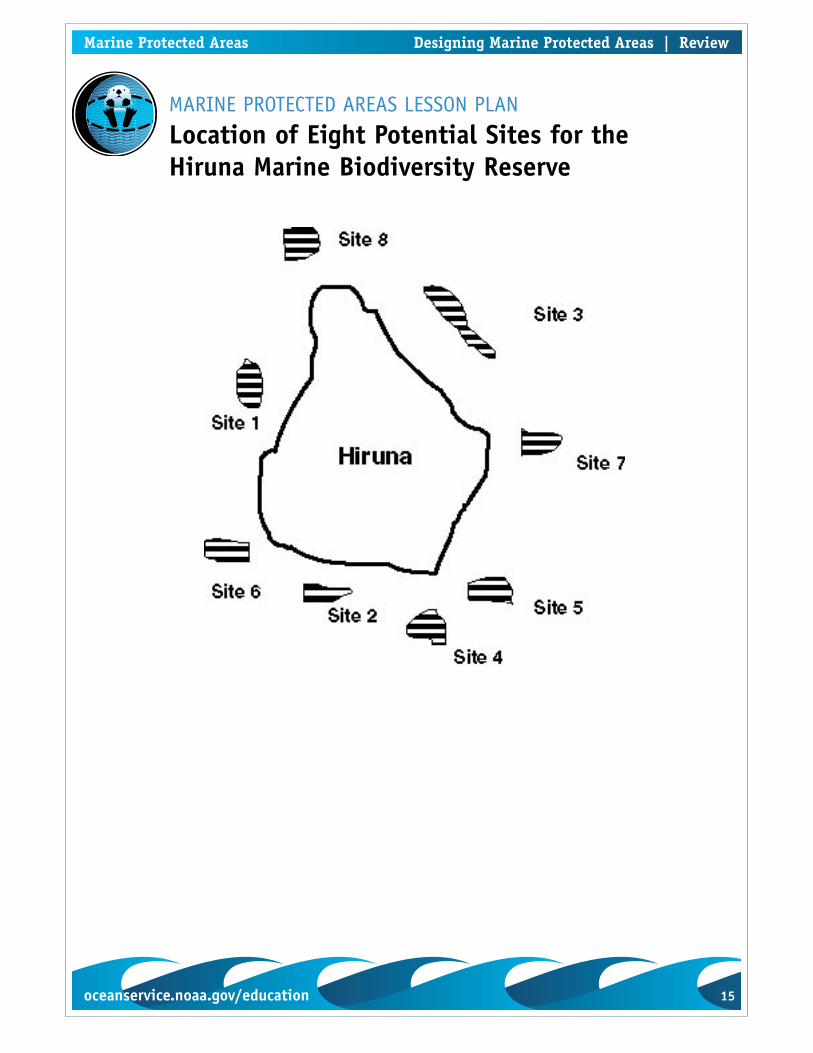
Materials Needed • Copies of “Location of Eight Potential Sites for the Hiruna
Marine Biodiversity Reserve” and “Species Abundance at Eight Potential Sites for the Hiruna Marine Biodiversity Reserve,” one copy for each student or student group
• (optional) Computers with internet access; if students do not have access to the internet, download copies of materi-als cited under “Learning Procedure” and provide copies of these materials to each student or student group.
Designing Marine Protected Areas Marine Protected Areas | Lesson Plan
Designing Marine Protected Areas | Lesson Plan Marine Protected Areas
2 oceanservice.noaa.gov/education oceanservice.noaa.gov/education 3
Marine Protected Areas Designing Marine Protected Areas | Lesson Plan
Audio/Visual Materials Needed None
Teaching Time One or two 45-minute class periods
Seating Arrangement Classroom style, or in groups of 3-4 students
Maximum Number of Students 32
Key WordsBiodiversity Biodiversity protection reserveComprehensive RepresentativeAdequateEfficient
Background Information “Biodiversity” is a commonly-used term among conservation-ists and scientists. But while many people have a general understanding of what biodiversity means, there is no spe-cific, widely accepted definition for the word. Biodiversity is usually understood to refer to variety of ecosystems as well as variety of species. In general, an area with a large number of species is considered to be more diverse than an area with fewer species. Similarly, an area that includes many types of ecosystems is thought of as being more diverse than an area with only one or two ecosystems. For example, a coastal area that includes a maritime forest ecosystem, a mangrove ecosys-tem, a beach ecosystem, and a coral reef ecosystem would be considered more diverse than an isolated coral reef. In the past twenty years, there has been growing awareness that human activities can have serious negative impacts on individual spe-cies as well as entire ecosystems. This awareness has resulted in worldwide concern for the Earth’s biodiversity. As a result, many countries have begun efforts to conserve and protect the ecosystems and living organisms that contribute to their native biodiversity.
Designing Marine Protected Areas | Lesson Plan Marine Protected Areas
2 oceanservice.noaa.gov/education oceanservice.noaa.gov/education 3
Marine Protected Areas Designing Marine Protected Areas | Lesson Plan
One of the most popular strategies for protecting biodiver-sity is to establish protected areas or reserves. But most exist-ing reserves were not designed specifically for this purpose. Many were established to protect scenic or cultural resources or a few species that are particularing appealing to the public, but not to protect the entire native biodiversity of the area. A reserve that successfully prevents overfishing on a coral reefs will not necessarily be equally successful at protecting the native biodiversity from other impacts (such as tour boats dropping anchors on living corals). Recent research suggests that many existing reserves may not provide efficient protec-tion of biodiversity. The purpose of this lesson is to intro-duce students to some of the considerations and techniques involved in designing reserves whose primary purpose is to protect biodiversity.
To be successful, a biodiversity protection reserve should be:• Comprehensive, meaning that the reserve includes all of
the species and ecosystems to be protected;• Representative, meaning that the reserve provides a reason-
able sample of the variation that occurs in each species and ecosystem;
• Adequate, meaning that the reserve can maintain the viability of populations, species, and communities for an extended period of time; and
• Efficient, meaning that the reserve uses the minimum amount of area needed to be comprehensive, representative, and adequate.
Designing biodiversity protection reserves usually involves selecting from a number of prospective sites. If conservation were the only consideration, reserve designers might simply select all of the available sites. But all reserves have limited budgets and may not be able to afford the equipment and staff needed to operate a large number of sites. In addition, many reserves must deal with potential competing uses that are not compatible with biodiversity protection. A reserve intended to preserve shallow marine habitats, for example, would not be compatible with large numbers of tourist boats dropping anchors in the same area. Since these problems usu-ally increase as the area of the reserve increases, efficiency has considerable practical importance. Selecting the minimum area
Designing Marine Protected Areas | Lesson Plan Marine Protected Areas
4 oceanservice.noaa.gov/education oceanservice.noaa.gov/education 5
Marine Protected Areas Designing Marine Protected Areas | Lesson Plan
needed for a successful reserve typically involves two key con-siderations.
The first consideration has been called the “minimum repre-sentation problem.” This means choosing the minimum num-ber of sites that together contain at least one example of every vegetation type and/or one population of every species native to the region.
The second consideration is how the individual sites are arranged in relation to each other. If the individual sites are widely separated from each other, the reserve will probably be more difficult and expensive to manage than if the sites are adjacent. Moreover, some species require larger areas of suit-able habitat, and small, isolated sites may not be able to meet this requirement.
Reserve planners often calculate the ratio of the perimeter of a site to its area. Sites with high perimeter to area ratios tend to be long and thin. These sites are more vulnerable to invasions by competing species or predators because they have a longer “border” across which invaders may enter. For these reasons, planners often reject potential reserve sites that have a high perimeter to area ratio. These considerations seem to point toward a few closely clustered sites as the best design for a biodiversity protection reserve; but clustering can cause other problems. Single-site or tightly clustered reserves are vulner-able to disasters such as oil spills or storms that may result in local extinctions. Where such disasters are likely, it may be less risky to conserve each species in several separate areas.
In this lesson, students will analyze a group of prospective sites for inclusion in a biodiversity protection reserve and select the sites that provide the most efficient reserve sys-tem. If you want to explore the idea of diversity a little more, you may have students calculate a diversity index for each of the prospective sites as part of their analysis. Additional “Background Information on Diversity Indices” is included in the Worksheets section (reprinted from the Ocean Explorer “How Diverse is That?” lesson at http://oceanexplorer.noaa.gov/explorations/03windows/background/education/media/03win_hdiverse.pdf)
Designing Marine Protected Areas | Lesson Plan Marine Protected Areas
4 oceanservice.noaa.gov/education oceanservice.noaa.gov/education 5
Marine Protected Areas Designing Marine Protected Areas | Lesson Plan
Learning Procedure 1. If your students have not completed the “Water Parks” lesson, direct students to “MPA Education Poster Site Descriptions” and “A User’s Guide to Marine Protected Area Types and Terms“ at http://mpa.gov/information_tools/education/pdfs/Poster04companion.pdf and http://mpa.gov/what_is_an_mpa/MPA_UsersGuide.pdf. Have each student complete one version of the MPA Subject Review, then lead a discussion to review the answers. Be sure students understand the distinctions between “natural heritage,” “cultural heritage,” and “sustainable pro-duction” MPAs:
In natural heritage and cultural heritage MPAs, the primary mis-sion is to protect natural and/or cultural resources. Varying types and degrees of human uses may be allowed, but these activities are secondary to the primary purpose of resource protection.
In contrast, allowing certain uses as well as protecting resourc-es are both part of the primary purpose of sustainable produc-tion MPAs. These MPAs allow resources to be used, as long as the resources can also be maintained and conserved. For exam-ple, in an area where local fishing has traditionally provided an important food supply to coastal communities a sustainable production MPA might allow local fishermen to continue to use fishery resources, but might limit fishing by non-residents. Or, in an area where recreational fishing by visitors is impor-tant to the local economy, a sustainable production MPA might allow recreational uses to continue as long as fishery resources are not depleted. A common misconception is that protected areas are synonymous with severely restricted use, but this is not true of many MPAs.
2. Discuss the meaning of biodiversity and why there is wide-spread concern for the Earth’s biodiversity. Introduce the idea of reserves as a strategy for protecting and conserving biodi-versity, and ask students to brainstorm the characteristics that should be found in a successful biodiversity protection reserve. Collectively, they should recognize that such a reserve is com-prehensive, representative, adequate, and efficient. Briefly dis-cuss the importance of spatial arrangement between sites.
Designing Marine Protected Areas | Lesson Plan Marine Protected Areas
6 oceanservice.noaa.gov/education oceanservice.noaa.gov/education 7
Marine Protected Areas Designing Marine Protected Areas | Lesson Plan
If you want to have students calculate diversity as part of their analysis, review “Background Information on Diversity Indices.” Show students the sample data, and ask them which of the two communities they intuitively feel is most diverse. This should lead to the concepts of species richness and even-ness. State that a diversity index is a way to give a number to the idea of diversity. A diversity index may be used to com-pare several sites, or to monitor a single site to see how diver-sity changes over time. Tell students that the Shannon-Weaver information function is a commonly used index of diversity that incorporates both concepts of species richness and even-ness. Work through the sample calculation, and be sure stu-dents understand the steps involved.
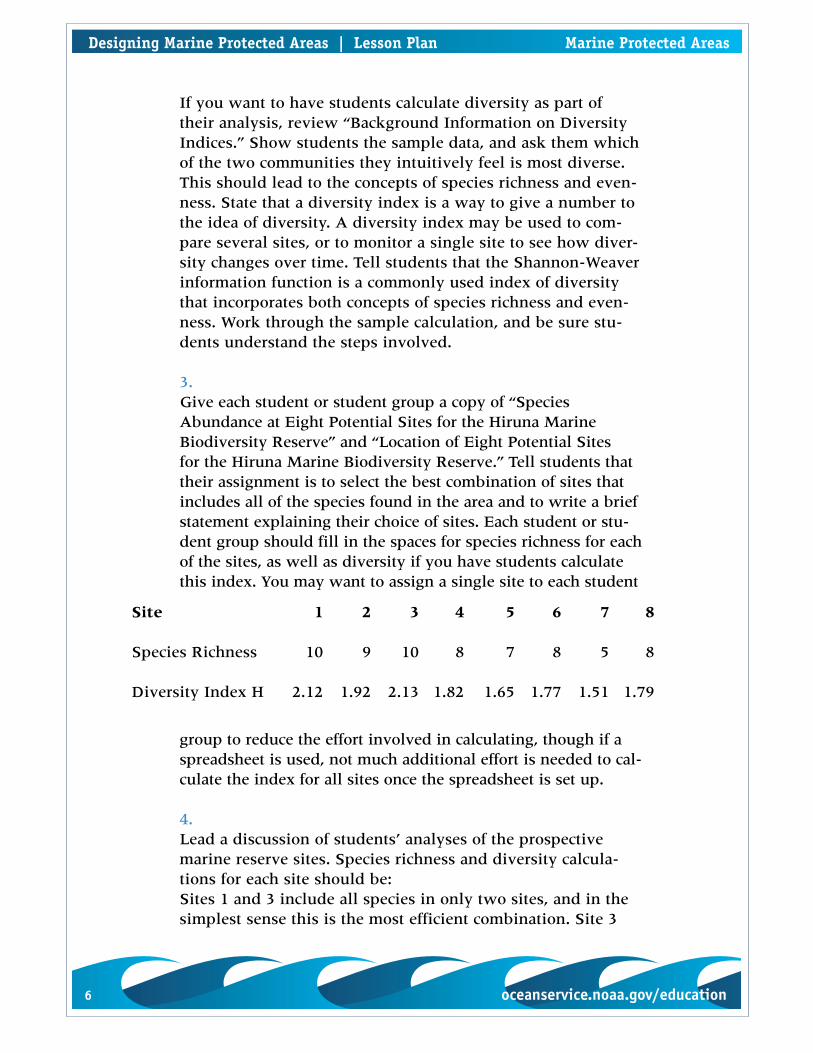
3. Give each student or student group a copy of “Species Abundance at Eight Potential Sites for the Hiruna Marine Biodiversity Reserve” and “Location of Eight Potential Sites for the Hiruna Marine Biodiversity Reserve.” Tell students that their assignment is to select the best combination of sites that includes all of the species found in the area and to write a brief statement explaining their choice of sites. Each student or stu-dent group should fill in the spaces for species richness for each of the sites, as well as diversity if you have students calculate this index. You may want to assign a single site to each student
group to reduce the effort involved in calculating, though if a spreadsheet is used, not much additional effort is needed to cal-culate the index for all sites once the spreadsheet is set up.
4. Lead a discussion of students’ analyses of the prospective marine reserve sites. Species richness and diversity calcula-tions for each site should be:Sites 1 and 3 include all species in only two sites, and in the simplest sense this is the most efficient combination. Site 3
Site 1 2 3 4 5 6 7 8
Species Richness 10 9 10 8 7 8 5 8
Diversity Index H 2.12 1.92 2.13 1.82 1.65 1.77 1.51 1.79
Designing Marine Protected Areas | Lesson Plan Marine Protected Areas
6 oceanservice.noaa.gov/education oceanservice.noaa.gov/education 7
Marine Protected Areas Designing Marine Protected Areas | Lesson Plan
has the highest species diversity of any site. But site 3 also has high perimeter to area ratio and may be vulnerable to external disturbances. In fact, periodic disruption of an ecosystem can sometimes lead to higher diversity than more stable ecosys-tems. Since our primary objective is to conserve biodiversity, sites that offer maximum protection to the species present are more desirable than sites that may temporarily have a high diversity index but are vulnerable to catastrophic loss of species.
Four other site combinations include all species in three sites. Sites 1, 4, and 5 and Sites 1, 2, and 5 are rather spread out, so managing a reserve composed of these sites would involve more people or more travelling time, either of which adds to the cost of operation. On the other hand, if there is concern over the potential impact of catastrophic events (such as hur-ricanes or oil spills), there could be an advantage to having a reserve composed of scattered sites. Notice, also, that sites 1 and 2 include all species except the Southern stingray. Since this species is able to move around over considerable distanc-es, its presence or absence in a given site may be a matter of chance rather than actual preference for a certain site.
Sites 2, 4, and 5 are quite close together and include all spe-cies. If catastrophic events are not a major concern, this might be the best choice.
Sites 4, 5, and 7 are also fairly close together, though less so than sites 2, 4, and 5. But site 7 has the lowest diversity and species richness of any of the sites, and for this reason is not as desirable as some of the other combinations.
State that for the purpose of this exercise, we assumed that, together, the eight sites listed on the worksheet included all of the species present in the marine environments of Hiruna (a fictitious country in the Caribbean). In reality, marine bio-diversity reserve sites contain hundreds of species, and this makes comparisons so cumbersome that computers become essential. See Extensions for more information on one of these computer methods. Another simplification is that only spe-cies are considered in the analysis; most biodiversity protec-tion reserves are also concerned with protecting representative habitats as well as species.
Designing Marine Protected Areas | Lesson Plan Marine Protected Areas
8 oceanservice.noaa.gov/education oceanservice.noaa.gov/education 9
Marine Protected Areas Designing Marine Protected Areas | Lesson Plan
Students should also realize that this lesson focuses primar-ily on the criteria of comprehensiveness (including all species) and efficiency (minimizing the number of sites). To address the criterion of representativeness, we would need to know how much variability there is within each of the species (and habitats, if habitats were also considered). To assess the ade-quacy of various site combinations, we would need to know the particular ecological requirements of each species. Both of these criteria require a great deal of additional information, which often is simply not available. This fact highlights the reality that designing biodiversity protection reserves is usu-ally an approximation. The analytical techniques help avoid many problems, but there is never a 100% guarantee that a reserve will protect every species and habitat included in it.
The Bridge Connection www.vims.edu/bridge/ – Enter “diversity” in the “Search” box, then click “Search” to display entries on the Bridge Web site for biodiversity.
The Me Connection “Diversity” is a phrase often encountered in discussions of human communities. Have students write a brief essay describing the differences and similarities of social “diver-sity” in this context and “diversity” as it applies to marine reserves. Ask students to consider whether there are examples of “reserves” that are intended to protect social diversity, and how such reserves could be beneficial or harmful.
Extensions Visit http://www.ecology.uq.edu.au/marxan.htm for the MARXAN software, tutorial, and marine reserve design game that shows one way to manage the complexity of decisions involved in designing marine reserves.
Resources http://mpa.gov/ – website for the National MPA Center, with
definitions, program descriptions, list of MPA sites, virtu-al library, tools, and links to regional information centers
http://www.ecology.uq.edu.au/marxan.htm – website for the MARXAN software that provides decision support for reserve system design; the site includes a tutorial and
Designing Marine Protected Areas | Lesson Plan Marine Protected Areas
8 oceanservice.noaa.gov/education oceanservice.noaa.gov/education 9
Marine Protected Areas Designing Marine Protected Areas | Lesson Plan
marine reserve design gamehttp://www.cees.iupui.edu/Outreach/SEAM/Biodiversity_Exercise.htm
– The Arbor Project’s web page on bird biodiversityPossingham, H., I. Ball, and S. Andelman. 2000. Mathematical
methods for identifying representative reserve net-works. pp 291-305. In: A. Ferson, and M. Burgman (eds). Quantitative Methods for Conservation Biology. Springer-Verlag. New York. (available online at http://www.ecology.uq.edu.au/links/CH17Reprint.pdf)
National Science Education Standards Content Standard A: Science as Inquiry
• Abilities necessary to do scientific inquiry• Understandings about scientific inquiry
Content Standard C: Life Science• Interdependence of organisms
Content Standard E: Science and Technology • Abilities of technological design• Understandings about science and technology
Content Standard F: Science in Personal and Social Perspectives
• Natural resources• Environmental quality• Natural and human-induced hazards
Links to AAAS “Oceans Map” (aka benchmarks) 5D/H1 – Ecosystems can be reasonably stable over hundreds or thousands of years. As any population of organisms grows, it is held in check by one or more environmental factors: depletion of food or nesting sites, increased loss to increased numbers of predators, or parasites. If a disaster such as flood or fire occurs, the damaged ecosystem is likely to recover in stages that eventually results in a system similar to the origi-nal one.
5D/H3 – Human beings are part of the earth’s ecosystems. Human activities can, deliberately or inadvertently, alter the equilibrium in ecosystems. N
ATI
ON
AL
OC
EA
NICAND ATMOSPHERIC
ADMIN
IST
RA
TIO
N
U.S. DEPARTMENT OF COMMER
CE
10 oceanservice.noaa.gov/education oceanservice.noaa.gov/education 11
Marine Protected Areas Designing Marine Protected Areas | Review
MARINE PROTECTED AREAS LESSON PLAN
Marine Protected Areas Worksheet
Marine Protected Areas | Worksheet Designing Marine Protected Areas
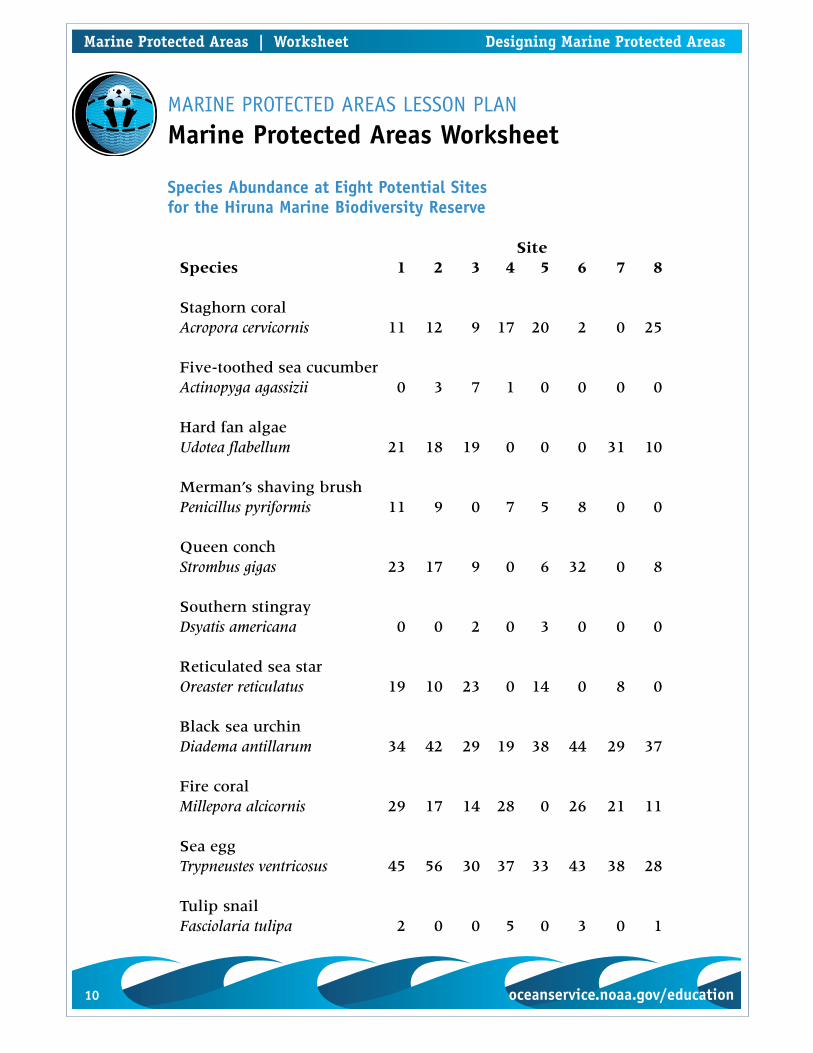
Species Abundance at Eight Potential Sitesfor the Hiruna Marine Biodiversity Reserve
SiteSpecies 1 2 3 4 5 6 7 8
Staghorn coralAcropora cervicornis 11 12 9 17 20 2 0 25
Five-toothed sea cucumberActinopyga agassizii 0 3 7 1 0 0 0 0
Hard fan algaeUdotea flabellum 21 18 19 0 0 0 31 10
Merman’s shaving brushPenicillus pyriformis 11 9 0 7 5 8 0 0
Queen conchStrombus gigas 23 17 9 0 6 32 0 8
Southern stingrayDsyatis americana 0 0 2 0 3 0 0 0
Reticulated sea starOreaster reticulatus 19 10 23 0 14 0 8 0
Black sea urchinDiadema antillarum 34 42 29 19 38 44 29 37
Fire coralMillepora alcicornis 29 17 14 28 0 26 21 11
Sea eggTrypneustes ventricosus 45 56 30 37 33 43 38 28
Tulip snailFasciolaria tulipa 2 0 0 5 0 3 0 1
10 oceanservice.noaa.gov/education oceanservice.noaa.gov/education 11
Marine Protected Areas Designing Marine Protected Areas | Review
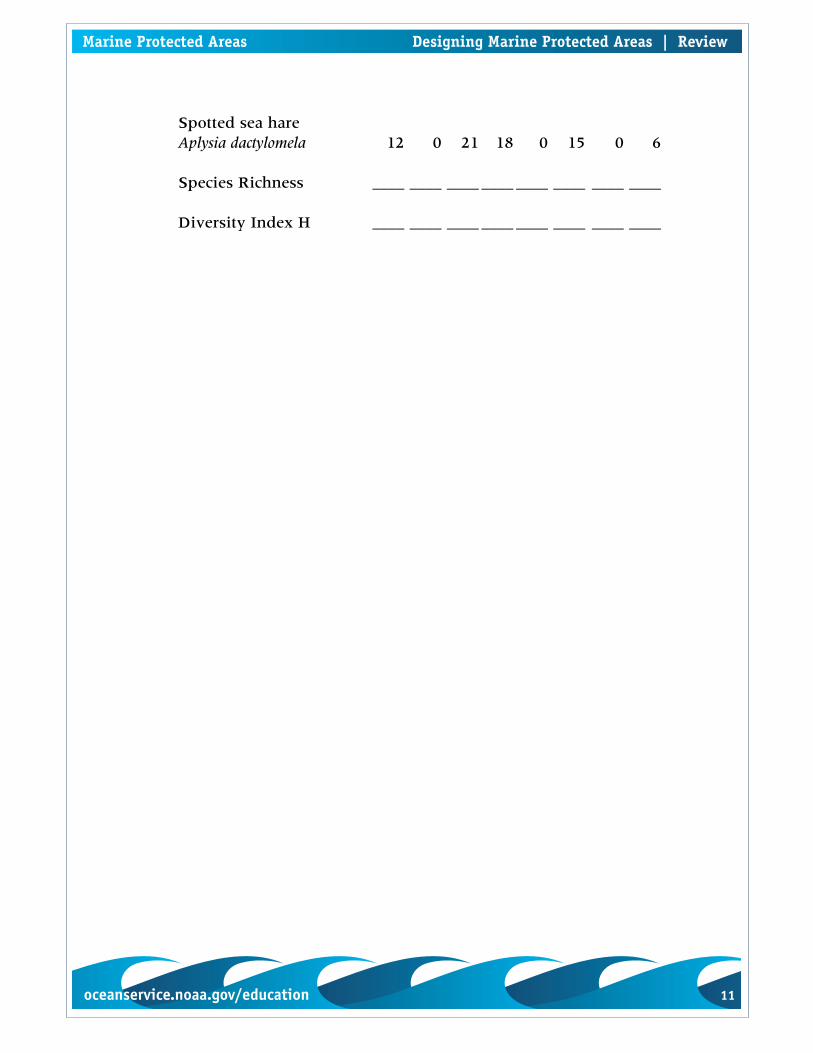
Spotted sea hareAplysia dactylomela 12 0 21 18 0 15 0 6
Species Richness ____ ____ ____ ____ ____ ____ ____ ____
Diversity Index H ____ ____ ____ ____ ____ ____ ____ ____
12 oceanservice.noaa.gov/education oceanservice.noaa.gov/education 13
Marine Protected Areas Designing Marine Protected Areas | Review
MARINE PROTECTED AREAS LESSON PLAN
Background on Diversity Indices
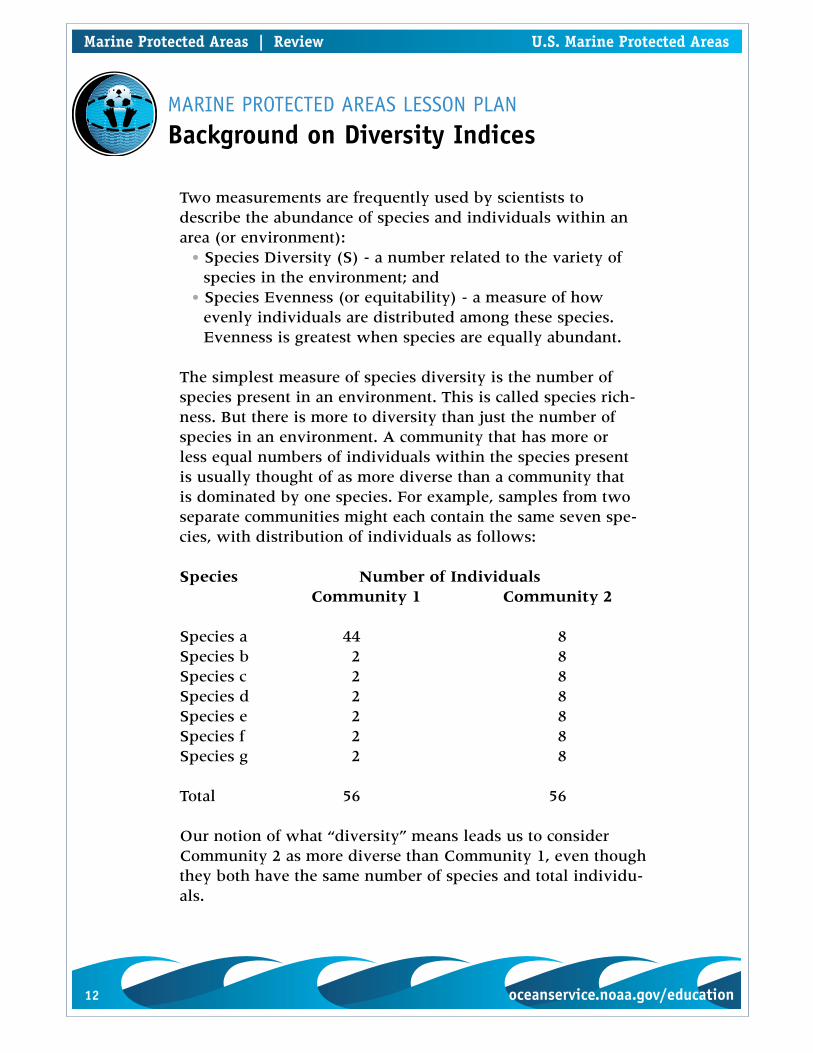
Two measurements are frequently used by scientists to describe the abundance of species and individuals within an area (or environment):
• Species Diversity (S) - a number related to the variety of species in the environment; and
• Species Evenness (or equitability) - a measure of how evenly individuals are distributed among these species. Evenness is greatest when species are equally abundant.
The simplest measure of species diversity is the number of species present in an environment. This is called species rich-ness. But there is more to diversity than just the number of species in an environment. A community that has more or less equal numbers of individuals within the species present is usually thought of as more diverse than a community that is dominated by one species. For example, samples from two separate communities might each contain the same seven spe-cies, with distribution of individuals as follows:
Species Number of Individuals Community 1 Community 2
Species a 44 8Species b 2 8Species c 2 8Species d 2 8Species e 2 8Species f 2 8Species g 2 8
Total 56 56
Our notion of what “diversity” means leads us to consider Community 2 as more diverse than Community 1, even though they both have the same number of species and total individu-als.
Marine Protected Areas | Review U.S. Marine Protected Areas
12 oceanservice.noaa.gov/education oceanservice.noaa.gov/education 13
Marine Protected Areas Designing Marine Protected Areas | Review
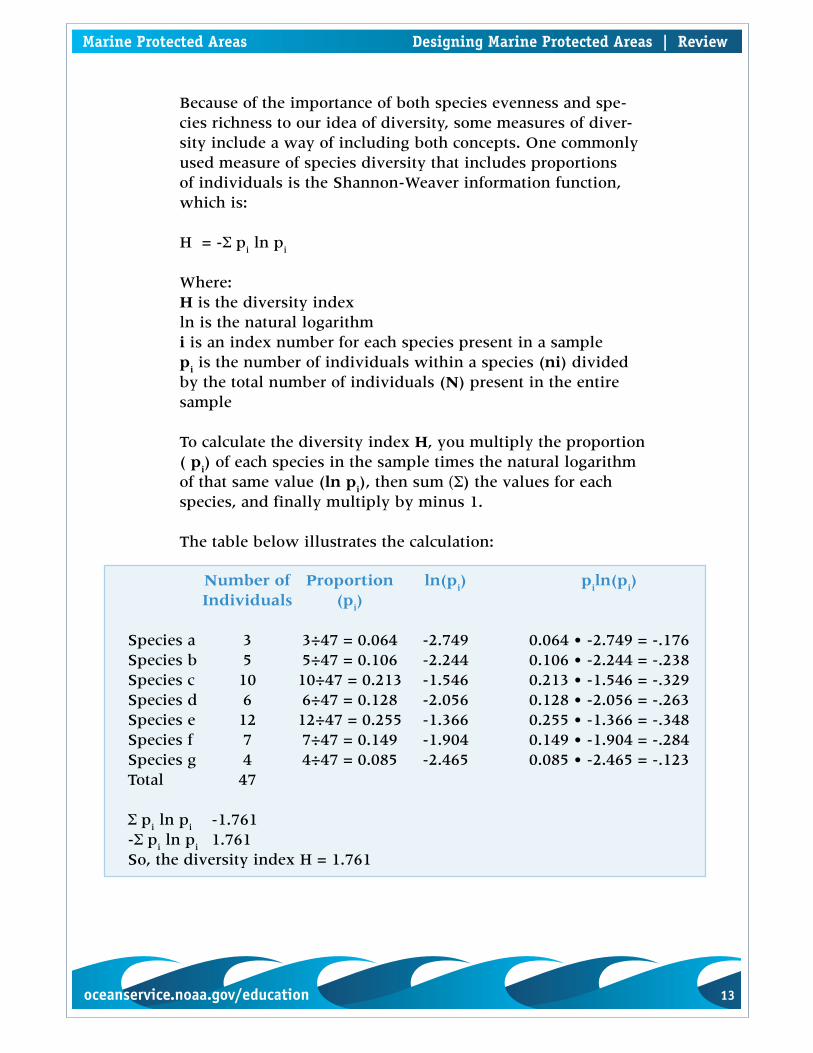
Because of the importance of both species evenness and spe-cies richness to our idea of diversity, some measures of diver-sity include a way of including both concepts. One commonly used measure of species diversity that includes proportions of individuals is the Shannon-Weaver information function, which is:
H = -Σ pi ln p
i
Where: H is the diversity indexln is the natural logarithmi is an index number for each species present in a samplep
i is the number of individuals within a species (ni) divided
by the total number of individuals (N) present in the entire sample
To calculate the diversity index H, you multiply the proportion ( p
i) of each species in the sample times the natural logarithm
of that same value (ln pi), then sum (Σ) the values for each
species, and finally multiply by minus 1.
The table below illustrates the calculation:
Number of Proportion ln(pi) p
iln(p
i)
Individuals (pi)
Species a 3 3÷47 = 0.064 -2.749 0.064 • -2.749 = -.176Species b 5 5÷47 = 0.106 -2.244 0.106 • -2.244 = -.238Species c 10 10÷47 = 0.213 -1.546 0.213 • -1.546 = -.329Species d 6 6÷47 = 0.128 -2.056 0.128 • -2.056 = -.263Species e 12 12÷47 = 0.255 -1.366 0.255 • -1.366 = -.348Species f 7 7÷47 = 0.149 -1.904 0.149 • -1.904 = -.284Species g 4 4÷47 = 0.085 -2.465 0.085 • -2.465 = -.123Total 47
Σ pi ln p
i -1.761
-Σ pi ln p
i 1.761
So, the diversity index H = 1.761
14 oceanservice.noaa.gov/education
Designing Marine Protected Areas | Review Marine Protected Areas
oceanservice.noaa.gov/education 15
Marine Protected Areas Designing Marine Protected Areas | Review
You may want to suggest that students use a spreadsheet pro-gram to speed the calculation process. One approach is to set up columns in the spreadsheet to make the calculations described above, then enter the species data for the appropri-ate communities. If students (or you) are comfortable with set-ting up spreadsheet functions, p
iln(p
i) can be calculated with a
single formula.
Species diversity is often used as a measure of environmental health. A stressed environment typically has a lower number of species with one or two species (those adapted to the stress) having many more individuals than the other species. Species diversity tends to increase at the edges of environments (eco-tones) where conditions are more variable. For more back-ground on species diversity, visit the Arbor Project’s web page on bird biodiversity at http://www.cees.iupui.edu/Outreach/SEAM/Biodiversity_Exercise.htm.
14 oceanservice.noaa.gov/education
Designing Marine Protected Areas | Review Marine Protected Areas
oceanservice.noaa.gov/education 15
Marine Protected Areas Designing Marine Protected Areas | Review
MARINE PROTECTED AREAS LESSON PLAN
Location of Eight Potential Sites for the Hiruna Marine Biodiversity Reserve