mario izquierdo, juan f. jimeno, and aitor lacuesta … · 1 spain: from (massive) immigration to...
TRANSCRIPT

1
Spain: From (massive) immigration to (vast) emigration?
Mario Izquierdo, Juan F. Jimeno, and Aitor Lacuesta1
(Banco de España)
May 2013
(Preliminary and incomplete. Please do not circulate/ quote)
Abstract
Since the start of the Great Recession the unemployment rate in Spain has increased by almost
20 percentage points. This unemployment crisis, which is affecting to all population groups,
including the highly educated, is even more acute for the foreign population, whose
unemployment rate is close to 40%. This situation follows a period of very high immigration
flows (1995-2007) that brought the proportion of foreigners in the population living in Spain
up to 11%. In this paper we document the characteristics of the recent migration inflows to
and outflows from Spain. In particular, we focus on the different responses to unemployment
differentials of recent immigrants and Spaniards with regards to migrating abroad and across
Spanish regions. We also shed some insights on the selection of migrants by educational level
and draw some conjectures on the implications of the observed migration outflows during the
recent years for future potential growth in Spain.
1 Paper prepared for the IZA/Center of Human Capital Workshop on Migration and Human Capital, IZA, Bonn, May 23-24, 2013.

2
1. Introduction
During the years previous to the Great Recession, Spain received massive migration inflows
(averaging about 1.4% of total domestic population per year during 2000-2007). In fact, these
inflows continued to be high during the first phase of the recession (about 1.2% per year
during 2008-2010). Outflows were negligible during 2000-2007 and about 0.4% per year during
2008-2010). In 2012, when Spain suffered a double dip, inflows decreased to 0.8% (although
being still notable) and outflows increased to 1.2% of domestic population.
The immigration flows of the expansion period significantly changed the composition of the
Spanish population: the proportion of non-Spanish nationals was 11.7% on January 2013, while
the proportion of residents in Spain born-abroad is above 3.3% (see Table 1). The foreign
population in Spain is mostly from other EU countries, Latin America, and North Africa.
Immigrants (and foreign workers) are relatively younger than the Spanish population,
especially in the case of females (Table 2).
The labor market effects of the Great Recession in Spain have been remarkable. Since 2008Q1
the loss of employment has been almost 18.5% and the average unemployment rate has
increased to 27.2%, being the incidence of unemployment much higher among the youths
(57.2%) and immigrants (39.2%). Nevertheless, the increases in unemployment rates have
been quite general and have affected all regions and population groups, even those with high
educational attainments and skills (Figure 1).
Hence, given the high weight of recent immigrants and the high unemployment rates for all
population groups, it seems likely that Spain is in transition from a massive immigration regime
to vast emigration. This seems to be an appropriate context to test some of the existing
theories about migration, both in regards to return migration and to the importance of pull
factors on emigration by nationals, which, in the case of advanced economies, it is not a well
documented issue in the migration literature. Some questions that may be addressed in this
context are, for instance: i) what is the propensity to migrate abroad of recent immigrants and
of nationals in the case of an unemployment crisis?, ii) are the elasticities of migration
outflows with respect to unemployment differentials different in a recession than those
observed during an expansion?, and iii) is the selection of migrants different among the foreign
and the domestic population in such a context?
This paper builds on the description of migration flows in Spain (inwards and outwards) during
the Great Recession to drawing some conclusions about the role played by unemployment
differentials as a driver of migration flows, and to the important of positive selection of
migrants, both regarding return migration of recent immigrants and emigration by nationals.
We use some of these findings to draw some conjectures about the Spanish “emigration
potential” in the near future and to advance some cost-benefit analysis of the likely migration
flows.
The structure of the paper is as follows. First, we describe the data sources being used for the
measurement of inflows and outflows. Then, we briefly revisit the history of international
migration in Spain since the mid-1900s to put the analysis of the current situation into a wider
context. Then, we focus, alternatively, on the inflows, outflows, and inter-regional (within

3
Spain) flows of immigrants and Spaniards since the start of the Great Recession. Finally, in the
concluding section, we advance some conjectures about the implications of recently observed
migration flows for future potential growth in Spain.
2. Data
Data on gross migration flows in Spain are neither abundant nor extending long into the past.
Historically, information on migration flows was limited to statistics drawn from registers of
passengers that leave the country by ship and airplane, or from information of bilateral official
programs of organized emigration to Europe. This is the reason why most of the studies on
Spanish emigration used information from destination countries2. It is only after 1998 that
there is some organized attempts at keeping registers of migration inflows and outflows (since
2002) based on municipality registers. However, this is subject to some drawbacks. Whereas
foreigners have an incentive to enroll in the register, they do not have any incentive to drop
from it when they leave the country. This is the reason why data on exits of foreigners is only
reliable since 2006, moment in which a two year period renewal of the register is imposed on
foreigners. Instead, emigration and immigration by Spaniards should be better captured.
The data from municipality registers provide information on gender, age, nationality, country
of birth and the province of origin. One important piece of information that is lacking in the
abovementioned dataset is the country of origin of immigrants and the country of destination
of emigrants. In the case of foreigners we might assume that this should coincide with either
the nationality or the country of birth3. In the case of Spaniards, that information is completely
unknown.
Alternatively, data on stocks of foreigners in Spain is obtained by municipal registers. If one
wants to add the educational dimension it is required to access Labour Force Survey data.
Information on the stock of nationals living abroad might be taken from the registers of
Spanish embassies, which, gathered by the Statistical Office since 2009 (Padrón de Españoles
Residentes en el Extranjero). It provides information on the country of birth, province of last
residence, province of birth and country of destination. If one wants to obtain more socio-
demographic information on the emigrants must go to statistics of the main destination
countries. Driven by anecdotal evidence and given availability restrictions, we do so using the
French, British and Argentinian Labor Force Surveys.
Finally internal migration is gathered by municipal registers and the Labor Force Survey.
Indeed, information on this particular flow is very comprehensive in terms of socio-
demographic characteristics.
2 See, for instance, Garcia Fernandez (1965), Nadal (1984), and Instituto Español de Emigración (1973).
3 Indeed, according to the New Immigration Survey conducted in 2007, more than 85% of immigrants
with a plan of leaving the country in the following five years reported the intention to go back home.

4
3. Migration flows in Spain since 1950: A brief review
Spain was an emigration country through most of the XXth Century. At the beginning of the
century there were large outflows of migrants to South America (mostly to Argentina). Those
movements were motivated by i) the pass of free movement laws in both Spain and
destination countries at the second half of the XIX century, ii) an increasing population, due to
decrease in mortality at the end of the XIX century that was followed by a later decrease in
fertility (population in Spain doubled from 1857 – 15 million- to 1950 – 27 million-), and iii)
economic stagnation (GDP per capita in real terms is estimated to have increased slightly less
than 1% between 1850 and 1950 whereas it increased an average of 5% during the following
50 years) and a weakened political situation after the loss of the American colonies.
However those movements froze after the First World War and the global crisis of the 1930s.
And after the civil war (1936-1939) emigration was banned from Spain. When emigration is
again freely allowed in 1946, outflows were smaller than those registered at the beginning of
the Century. The main destination region was still South America.
Since 1950, just by looking at net migration outflows, three periods can be identified.
The early emigration period (1950-1989). Early in this period it was the times of emigration to
South America, of about 50 thousands per year, and then, later on during the 1960s, to Europe
(mostly France, Germany and Switzerland), with average annual flows of around 170
thousands (Table 3). In the 1960s around 80% of total emigrants went to Europe, and, on
aggregate, they amounted at around 7 per thousand of the total population in the mid-1960s,
when it reached its maximum. Emigration to Europe was mostly driven by the shortages of
unskilled workers to fill jobs in agriculture or in manufacturing in the destination countries.
Since the mid-1960s, these emigration flows decreased, first, due to economic growth in Spain,
and, then, due to the increased protectionism in destination countries that followed the oil
crisis in the early 1970s. However net emigration was still observed, although at a lower rate,
during the first half of the 1980s, when Spain still was suffering important losses of
employment.
The immigration boom (1990-2007). Starting at the early 1990s and, most noticeably, after
1997, Spain became a destination country for emigrates. Inflows increased steadily from less
than 30 thousands per year in 1996 to 958 thousands in 2007, when they amounted to more
than 2% of the total population. During this period inflows of foreigners are mainly driven by
Romanians, Moroccans, Bolivians and Peruvians, but there were also many with Spanish
nationality. Traditionally inflows of Spaniards represented returning migration. However,
during the 1990s, these were Spaniards born abroad, who, under the Spanish legislation,
acquired the nationality via their parents or even grandparents. Therefore, it is likely that
many foreigners (in the sense that never lived in Spain before) were immigrating as Spaniards.
Instead, inflows of Spaniards born in Spain but residents abroad were relatively inelastic to
recent economic conditions. Finally, there was also an important component of retiree
migration, mostly from Germany and the UK.
Emigration during the crisis (2008-2012). Emigration flows start increasing again since 2007,
moment at which GDP growth in Spain started to decelerate. However the magnitude of those

5
flows was small up to 2011. Since then, outflows amounted to 500 thousands in 2011-2012
(more than 1% of the population), which is, both in absolute levels and in percentage of the
population, the highest in the Spanish history. This is the case because of the high mobility of
foreigners (group that now accounted for a bigger fraction of the total population). Indeed, the
big majority of those outflows are composed by foreigners (in 2012 about 9% of foreigners
residing in Spain left the country), while less than 0.1% of Spaniards born in Spain have
emigrated. This level is smaller than the intensity of emigration by nationals observed in the
1960s (when return migration by foreigners was inexistent). Since 2011, those outflows have
not been compensated by inflows so that net emigration is observed again for the first time
since the 1970s (net outflows are estimated at around 180 thousands during 2012).
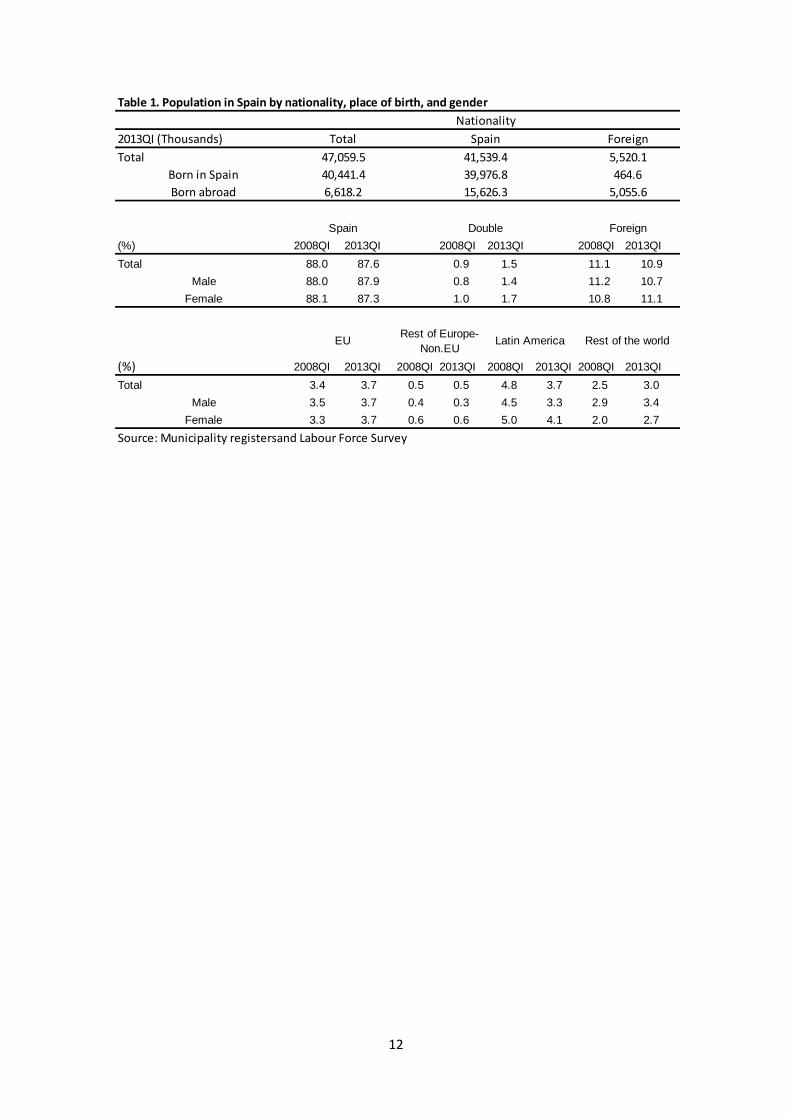
Table 5 gives some characteristics of the foreigners moving abroad in comparison with the
recent immigrants, those moving across Spanish regions, and the total stock of foreigners
living in Spain. Among recent emigrates, males, young, foreigners born in Spain and those who
came from America, Asia and Africa are overrepresented. On the contrary, non-Spanish
Europeans living in Spain are less likely to move abroad, something consistent with the idea
that an important fraction of them are retirees. The fact that male foreigners are more likely to
emigrate may be the result of male employment being most negatively affected by the crisis
and that emigration by men is the usual starting point of emigration by other member of the
household.
As for the characteristics of Spaniards-born in Spain who have emigrated recently (Table 6)
males, the overrepresented groups are males, children, and young4. By region, it is mostly
Madrid and Catalonia, together with Galicia (a region with high emigration to America in the
early half of the XXth Century), those with higher relative shares in the migration outflows. As
for the country of destination, which can only be approximated by the changes in the stock of
Spanish population registered in Spanish Embassies, UK (31%), USA (23.1%) and Germany
(7.6%) are the countries receiving the highest shares of Spanish emigrates, although there is
also a surprisingly high share in the case of China (5.2%).
Inter-regional migration flows in Spain (2008-2012)
A less costly alternative to international emigration is internal migration. During previous
decades, the degree of inter-regional mobility in Spain was quite low, despite significant
differences in unemployment rates and wages5. During the expansion and in more recent years
foreigners had a higher likelihood to move internally than Spaniards. Indeed, the observed
increased in internal migration during the 1990’s can be fully associated to the higher share of
foreigners in the population. However, more recently, the fraction of foreigners who move
internally (about 0.35%) is lower than the fraction of then who move abroad (about 0.8%). In
fact, internal movements of foreigners have decreased as opposed to the big increase of
external emigration, resulting in a constant fraction of foreigners that either moves internally
4 The significant increase in children emigration, which has to do with the fact that Spanish nationality
can be obtained after the first year of residence in Spain, for those born in Spain who had foreign parents, and, therefore, children of recent migrants are moving with their parents after having obtained the nationality 5 See Bentolila and Dolado (1991), Antolín and Bover (1997), Bover and Velilla (2000) and Bover and
Arellano (2002).
6
or externally. As for Spaniards, they had a clear preference to move internally (1.1%) respect to
do it abroad (0.17%). However, during the Great Recession internal emigration has remained
constant, while external movements have increased.
As for the characteristics of internal migrants (third column in Tables 5 and 6), in the case of
foreigners the overrepresented groups are similar to those in the composition of international
migration outflows (males, young -16-29-, and those with nationalities of American, Asian, and
African countries). On the contrary, in the case of Spaniards born in Spain, there seems to be
some differences between the compositions of international and regional migration outflows.
In the case of the latter, females have a higher relative share and the regions of origins with
more migrants, in relative terms, to other regions are Castilla-La Mancha, Castilla and Leon,
and the Ballearic Islands.
4. Migration flows and unemployment differentials
Typically the log odds of residing in country h for a person from country s is thought to be
determined by absolute differences on earnings between the two countries and a cost of
emigrating that is idiosyncratic to that particular pair of countries (see, for instance, Grogger
and Hanson, 2011). However, when considering immigration to or from Spain, earnings do not
appear to be a good proxy for economic opportunities, since high unemployment rates have
been prevalent: 8% at the peak of the cycle, and, currently, 27%. Indeed, changes in
unemployment appear to be more appropriate than changes in wages to approximate relative
economic opportunities over time, in particular, during the current recession when wages
reacted slowly to the worsening of the economic situation, showing, once more, significant
real and relative rigidities6.
Also, it is usual to assume that migration flows respond symmetrically to changes in relative
economic opportunities. This means that an improvement in relative economic conditions of
one country should be fully compensated when economic conditions come back to the initial
level. On this regard, Figure 2 shows that this is not the case in the Spanish current situation.
The figure graphs the share of foreigners in Spain and the evolution of the unemployment rate.
Between 1995 and 2001 there was a big decrease in unemployment (from 22.9% to 10.6%)
that brought an increase in the share of foreigners in the Spanish economy. From that moment
on unemployment did not change much but the share continued increasing. Since 2007 the
Spanish unemployment rate went back to their previous high levels (even higher), but the
share continued increasing during several years to only decrease slightly during 2012.
Hence, it seems that analyzing the stock of foreigners in Spain in the current scenario needs a
more flexible specification. In this vain, we adapt Grogger and Hanson (2011) scale
specification relating the log odds of residing in Spain to unemployment differentials, allowing
for a time-varying elasticity coefficient, and to a time varying migration cost, as in the following
equation:
6 On the adjustment of unemployment and wages across Spanish regions in previous recessions, see
Bentolila and Jimeno (1998).
7
(1)
where Fsh is the fraction of foreign population of country origin s in region h, Ui is the
unemployment rate (i=s,h), and Csh is the cost of migrating from s to h. This generalized scale
regression will be also estimated for the stock of Spaniards born in Spain that currently reside
abroad7.
Given the big disparities in unemployment rates shown in Figure 1 across Spanish regions, we
consider the log odds of residing in a Spanish region (we have access to data on 17 regions) for
one person of a particular country (we have access to data on around 80 countries). The
specification will be estimated for three periods (1995-2001 – period of decreasing
unemployment; 2001-2007 – period of stabilization of unemployment; 2008-2012 – period of
increasing unemployment). Within each range of years, the coefficients of the previous
regression will be kept fixed. The cost of emigration will be a dummy for each pair of country
and region of destination. Therefore, the variation that we are exploiting is the time dimension
within each pair of country of origin and region of destination. To avoid small sample problems
for particular countries, we also run the specification for grouping countries in bigger
geographical areas (EU-15, rest of Europe, Africa, North America, Center America, South
America, Asia and Oceania). For the stock of Spaniards abroad, everything applies the same
way noticing that now the origin is a region in Spain and the destination an international
country.
In order to get some insights on the selection of migrants by education we exploit the variation
of the log odds of emigration by country of origin and characteristics of migrants of that
particular origin in each Spanish region (average over the last decade) by incorporating, as co-
variates, only fixed effects by country of origin and the average years of schooling of migrants
in each region8:
(2)
Thus, the coefficient on the education variable gives information on the concentration of
immigrants and the costs of emigration by educational levels.
Despite bilateral inflows and outflows might react as the theory predicts to economic
conditions, changes in either costs of immigration or emigration may somehow blur the
contemporaneous responses of the stock of migrants to economic conditions. For that reason,
we also estimate the sensitivity of migration inflows (I), and migration outflows (E) to
unemployment differentials between origin (h) and destination (s)9
(3a)
7 In that case, since Spanish emigration is a recent phenomenon and data only covers the stock of
Spaniards born in Spain since 2009 we restrict the coefficients to be fixed during the period 2009-2013. 8 Notice that, in the case of foreigners, we cannot estimate equation (1) by skill groups since we do not
have access to unemployment rates by skill at the origin country. For the case of Spaniards we do not have information on the stock of migrants abroad by skills. 9 This estimation can only be done for foreigners since the destination of the migration outflows of
Spaniards is not available.

8
(3b)
Finally, we also analyze internal movements within Spanish across regions. As previously, we
relate the log odds of migrate from one region to another residing in Spain to unemployment
differentials, allowing both for an age/skill-varying elasticity coefficient and migration costs, as
in the following equation:
(4)
where Fshj is the fraction of population of region of origin s in region h of the age-skill groups j,
is the unemployment rate (i=s,h) group j, and Cshj is the cost of migrating from s to h for
group j10.
4.1. Foreigners: Immigration and migration outflows
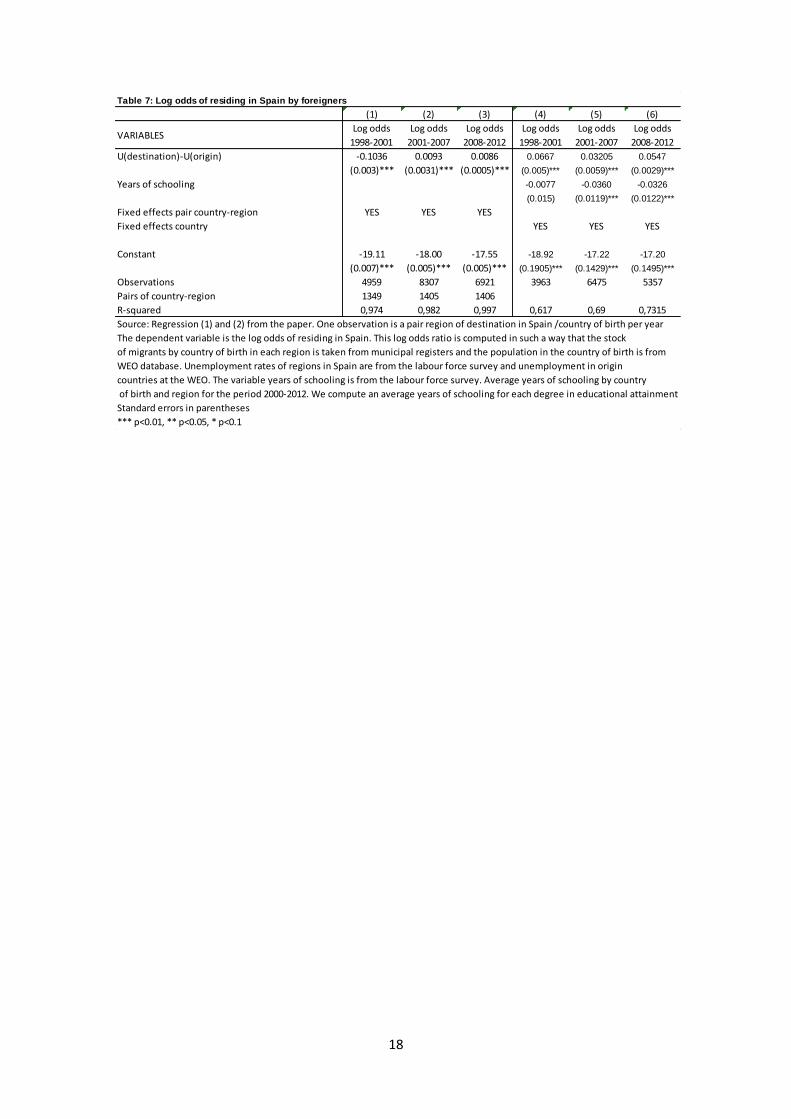
Table 7 reports the results of estimating how the log odds of foreigners living in Spain change
with respect to the differences between the unemployment rates of origin country and that of
the Spanish region of residence. The estimation has been obtained separately for three
periods 1998-2001 (columns 1 and 4), 2001-2007 (columns 2 and 5), and 2008-2012 (columns
3 and 6). The first specification (columns 1 to 3) correspond to equation (1) in the which there
are country-region fixed effects, while the second one corresponds to equation (2) in which
the co-variates are fixed effects by country of origin and the average years of schooling of
immigrants from the same country in the region of destination. While during the early period,
immigrants seemed to choose the region of destination taking into account the differences in
unemployment rates, in more recent periods the log odds are positively associated with
relative unemployment rates in the destination regions. As for education, the log odds are
higher in those regions where the educational level of immigrants is lower, which suggest that
recent inflows and outflows are decreasing the skill level of immigrants living in Spain.
As a result, as Figure 2 shows, despite the big increase in unemployment rate the proportion of
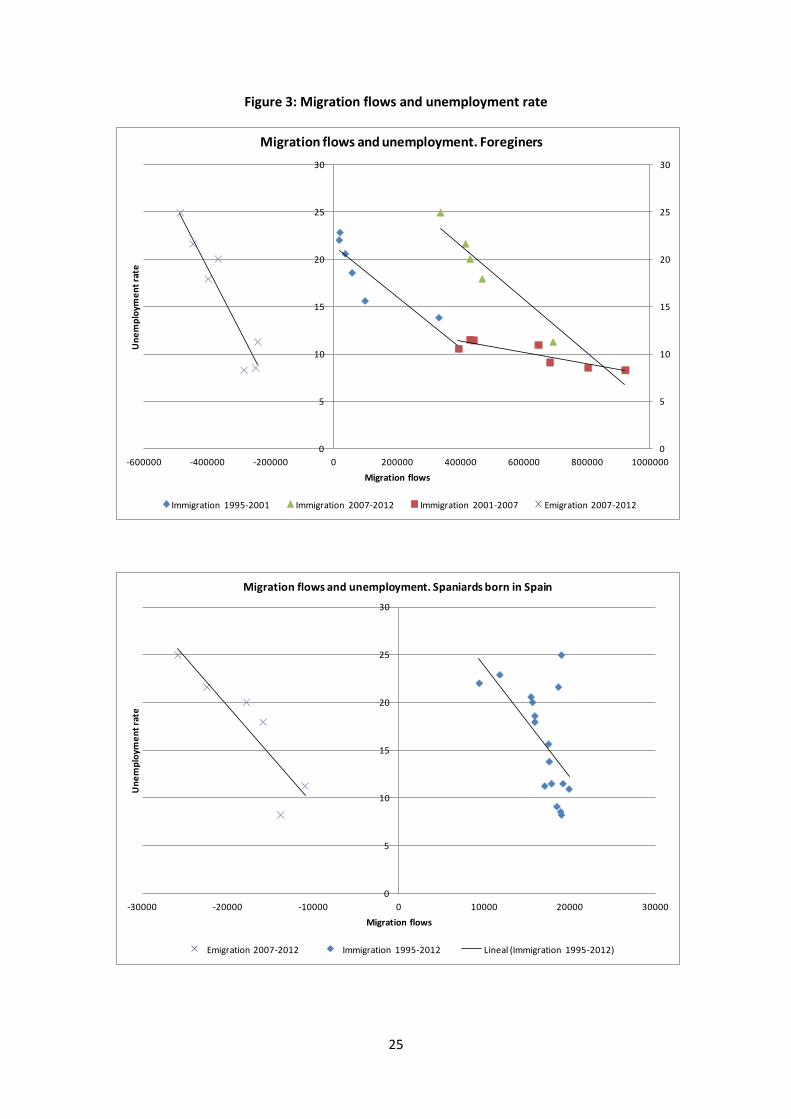
foreigners living of Spain has barely decreased up to now. Figure 3 plots the relationship
between unemployment in Spain and migration flows. The big decrease in unemployment
between 1995 and 2001 brought an increase in the number of inflows of foreigners in Spain.
From that moment and since 2007 unemployment did not change much but immigration flows
continued increasing. Since 2007 inflows decreased with the increase in unemployment. One
must notice that the sensitivity of inflows to changes in unemployment is similar to that
observed in the 90’s but at a higher level. On the other hand, during these last 4 years, there is
also an increase in outflows of foreigners that follows the unemployment rise.
A possible interpretation of the evolution of migration inflows to Spain since 1995 is that,
starting with and sustained by the housing boom, over time the willingness to enter Spain
increased notably trough network effects or reduction in costs due to different factors such as
10
We consider the interactions of three age groups (16-29, 30-44, and 45-64 years of age) with three skill groups (low, medium, and high education).

9
the entry into the EMU, or policy friendly actions (amnesties and regularizations). Therefore,
when unemployment starts increasing, inflows decreased but remained at a much higher level
than in the past at the same level of unemployment, and outflows start increasing but from a
at very low levels since costs of returning for those who migrated were high. The fact that the
educational level of foreigners living in Spain is decreasing is consistent with the hypothesis on
the positive selection of international migrants by educational levels.
Nevertheless, as said above, estimating log odds from the stock of the total population may
not convey all the information about the driving forces and directions of the recent migration
flows. Hence, using inflows and outflows, we perform a similar estimation of the impact of
unemployment -equation (3)-. Results, reported in Table 9, show that recent immigrants are
reacting slightly more to unemployment differentials than in the immediately preceding (2001-
2007) but not as much as in the early period (1998-2001). As for migration outflows, the
corresponding semi-elasticity is positive which indicates higher flows from relatively low
Spanish unemployment regions, which also points to foreigners living in Spain moving abroad
being positively selected in terms of labor market potentials11.
4.2. Spaniards: Migration outflows
Emigration of Spaniards is a relatively new phenomenon so that changes in the stock are
mainly the reflection of gross outflows. Figure 3 shows that this relationship is somehow
similar when comparing inflows, for 1995-2012, and outflows, for 2007-2012, of Spaniards
born in Spain. Table 8 reports the relationship between the log odds of Spaniards residing
abroad and the unemployment differentials between the destination country and the Spanish
region of origin. Although the semi-elasticity is estimated to be negative, it is only statistically
significant in the first specification while the second one, which takes into account the
educational level in the origin region, indicates a positive selection of migrants by educational
levels.
To investigate further the individual characteristics of Spaniards who have recently emigrated
abroad, we take advantage of the information provided by the Labor Force Surveys of the main
destination countries which are available to us (UK, France, and Argentina). Using that
information we perform two types of comparisons (Table 10): i) between Spaniards emigrates
to each of those countries in 2008-2012 versus 1998-2007, and ii) between Spaniards who
have recently emigrated to the UK and other immigrants into the UK during the same period.
As can be seen in the Table, the recent migration inflows into these three countries are
different in terms of age and educational levels from previous inflows and, in the case of the
UK, from the inflows from other countries. Spaniards emigrates are younger and more
educated than they used to be. Those going to the UK are more educated tan immigrants from
other countries but in this case there is an important share of emigrates aged 45-64 years.
11
Regarding characteristics of foreigners international migrants, the literature finds that the option of returning migration exacerbates the selection of migration See, for instance, Borjas and Bratsberg (1996) and Lacuesta (2010). For instance, if migrants were positively selected, returning migrants would be in the lower part of this positive selection.

10
These findings suggest that emigration from Spain is taking place mostly among those with
high skill levels.
4.3. Foreigners and Spaniards: Cross-regional migration within Spain
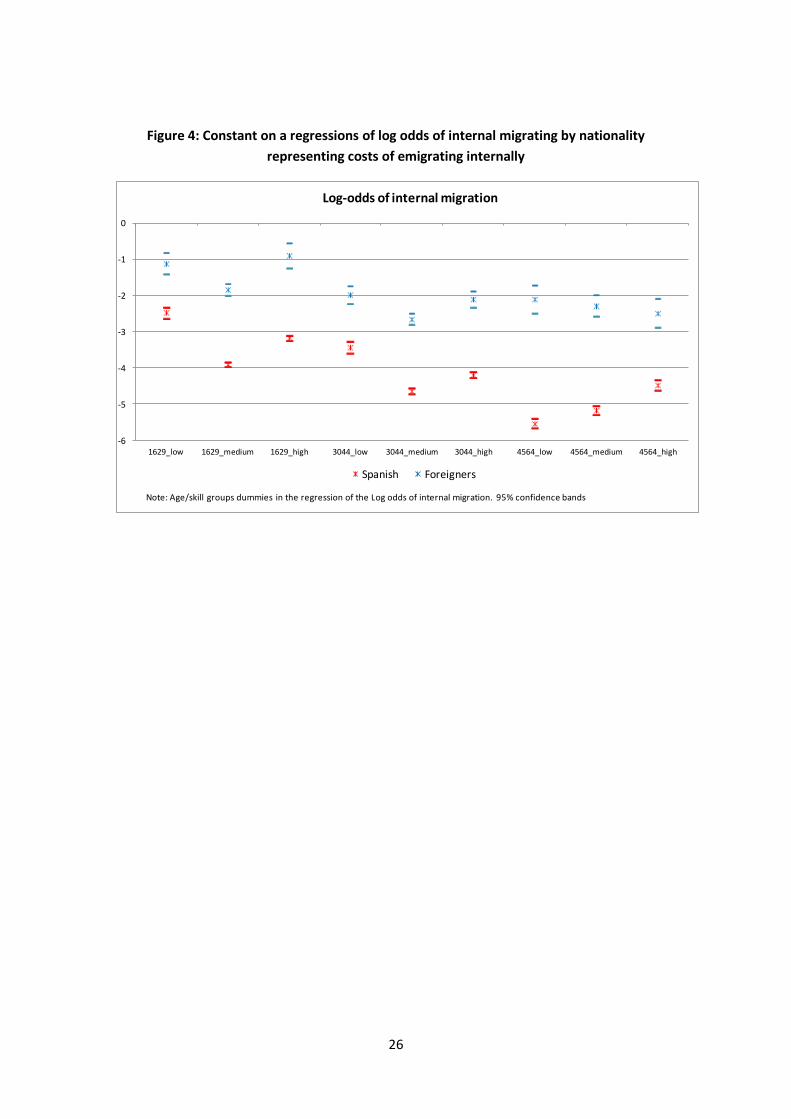
The results of the estimation of the impact of unemployment differentials across Spanish
regions on the log odds of internal migration for foreigners and Spaniards are reported in
Figure 4. As seen in the first panel of Figure, Spaniards are less likely to migrate to another
region than foreigners, whatever the age/education group. Moreover, in the case of Spaniards
the log odds are decreasing with age, and increasing with education only in the case of older
workers. As for foreigners, the log odds are less different across age/education group, being
highest for the youngest with low and high education.
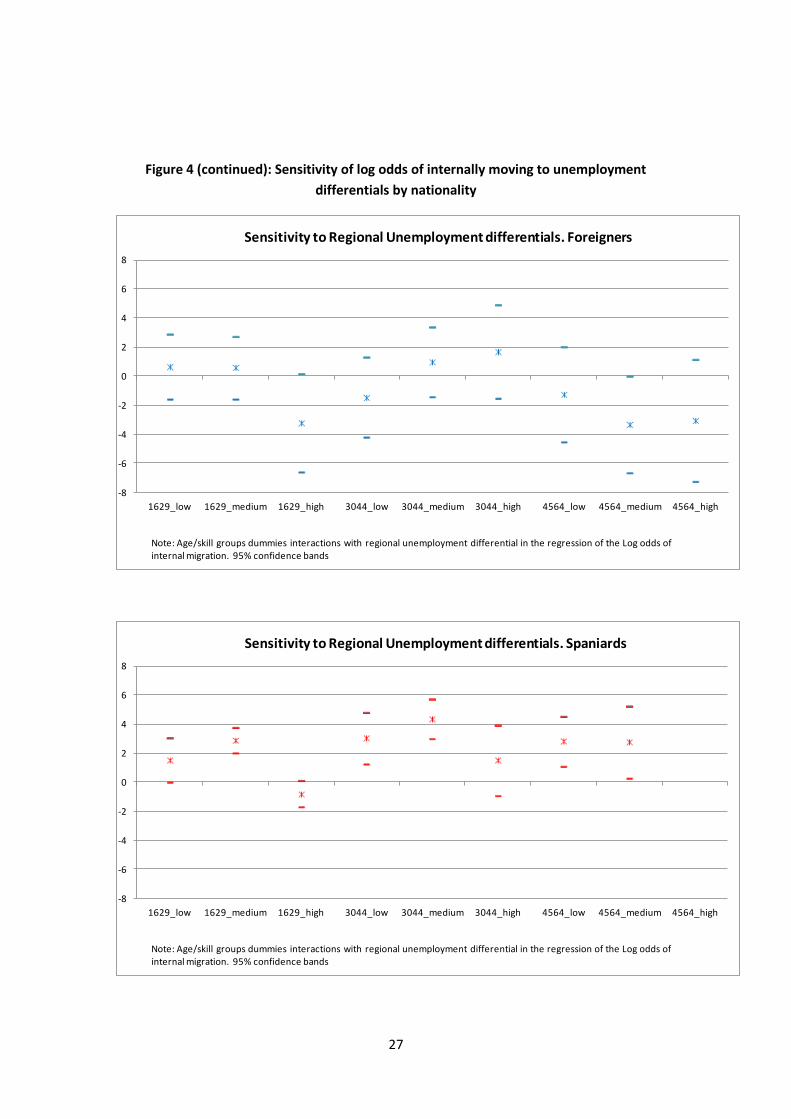
The other two panels of the Figure show that these log odds do not necessarily increase with
unemployment differentials across regions. In the case of foreigners, their responses to
unemployment differentials are negative and barely statistically significant in the case of young
migrants with high level of education and older workers with a medium level of education. In
the case of Spaniards, that response is positive and statistically significant for most
age/education groups, which indicates that, as happened in the past is Spain, interregional
migration flows are not contributing to the convergence of regional unemployment rates.
5. Concluding remarks
This paper provides a first look at the data on migration flows in Spain during the Great
Recession. Given the high proportion of recent immigrants to Spain and the high
unemployment rates for all population groups and regions, one may expect significant
migration flows and varying composition among them depending on recent immigration
status. Our results are still preliminary but we can already hint at significant changes in the size
and composition of migration inflows and outflows. In particular, emigrates, both Spaniards
and recent foreign immigrants, seem to be positive selected on education, while this does not
seem to be the case regarding the composition of internal migration flows. This finding needs
to be further investigated, as more data become available, but hints at the possibility of the
start of a significant brain drain that, if extended too long, as the crisis persists, or if Spanish
emigrates remain in their destination country, could create grave consequences for future
potential growth.

11
References
Antolín, Pablo and Olympia Bover (1997) "Regional Migration in Spain: The Effect of Personal
Characteristics and of Unemployment, Wage and House Price Differentials using Pooled Cross-
Sections", Oxford Bulletin of Economics and Statistics, 215-235.
Bentolila, Samuel and Juan J. Dolado (1991): “Mismatch and Internal Migration in Spain, 1962-
1986”, in Fiorella Padoa-Schioppa (ed.), Mismatch and Labour Mobility, Cambridge, Cambridge
University Press.
Bentolila, Samuel and Juan F. Jimeno (1998): “Regional Unemployment Persistence (Spain,
1976-1994)”, Labour Economics 5.
Borjas, George and B. Bratsberg (1996): "Who leaves? The Outmigration of the Foreign Born,"
Review of Economics and Statistics, 78(1),pp. 165-176.
Bover, Olympia and Manuel Arellano (2002) "Learning About Migration Decisions From the
Migrants", Journal of Population Economics, 15, 357-380.
Bover, Olympia and Pilar Velilla (2000) "Migration in Spain: Historical Background and Current
Trends", in Klaus Zimmermann (ed.), European Migration: What Do We Know?, CEPR and
Oxford University Press.
Garcia Fernandez, J (1965), La Emigración Exterior de España. Editorial Ariel, Madrid.
Grogger, Jeffrey and Gordon H. Hanson (2011): “Income maximization and the selection and
sorting of international migrants”, Journal of Development Economics, 95, 42-57.
Lacuesta, Aitor (2010) “A Revision of the Self-Selection of Migrants Using Returning Migrants’
Earnings”, Annals of Economics and Statistics 97/98, January/June. pp. 235-259.
Nadal, J. (1984), La Población Española (Siglos XVI a XX). Editorial Ariel.
Instituto Español de Emigración (1973), Panorámica de la Emigración. Editorial Ministerio de
Trabajo.
Prados de la Escosura, L. (2003), El Progreso Económico de España: 1850-2000, Fundación
BBVA.
12
Table 1. Population in Spain by nationality, place of birth, and gender
2013QI (Thousands)
Total
Born in Spain
Born abroad
(%) 2008QI 2013QI 2008QI 2013QI 2008QI 2013QI
Total 88.0 87.6 0.9 1.5 11.1 10.9
Male 88.0 87.9 0.8 1.4 11.2 10.7
Female 88.1 87.3 1.0 1.7 10.8 11.1
(%) 2008QI 2013QI 2008QI 2013QI 2008QI 2013QI 2008QI 2013QI
Total 3.4 3.7 0.5 0.5 4.8 3.7 2.5 3.0
Male 3.5 3.7 0.4 0.3 4.5 3.3 2.9 3.4
Female 3.3 3.7 0.6 0.6 5.0 4.1 2.0 2.7
Source: Municipality registersand Labour Force Survey
Rest of Europe-
Non.EULatin America Rest of the world
Nationality
5,520.1
464.6
5,055.6
Spain Double Foreign
Total
47,059.5
40,441.4
6,618.2
Foreign
EU
39,976.8
15,626.3
Spain
41,539.4

13
Table 2. Population and employment shares by age and gender
(differences between foreigners and nationals)
(%) 2008Q1 2013Q1 2008Q1 2013Q1
All All
16-24 4.8 4.2 16-24 2.4 1.9
25-34 19 12.8 25-34 14.8 9
35-44 7.1 10.1 35-44 1.7 6.5
45-54 -4.6 -2.1 45-54 -10.3 -8.8
Over 55 -26.3 -24.9 Over 55 -8.6 -8.5
Males Males
16-24 2.9 3.8 16-24 2 2.1
25-34 17.9 8.3 25-34 15.4 6.3
35-44 7.9 11.7 35-44 3.1 8.9
45-54 -4.5 -1.6 45-54 -10.3 -8.3
Over 55 -24.1 -22.2 Over 55 -10.2 -9
Females Females
16-24 6.5 4.5 16-24 2.7 1.5
25-34 20.1 16.9 25-34 14 11.4
35-44 6.2 8.8 35-44 -0.2 4.2
45-54 -4.6 -2.5 45-54 -10.1 -9.2
Over 55 -28.3 -27.6 Over 55 -6.4 -7.8
Source: Labour Force Survey
Population Employed

14
Table 3: Emigration in the 60's and recent flows by nationality and country of birth
Spanish
nationality
Foreign
nationality
Spanish
nationality
Foreign
nationality
Born in
SpainBorn abroad
Total Total
Born in
SpainBorn abroad
Total Total
1960 105.420 3,5
1961 176.821 5,7
1962 216.381 6,9
1963 200.539 6,3
1964 230.124 7,2
1965 203.609 6,3
1966 155.093 4,8
1967 89.484 2,7
1996 29.895 9.359 3.850 13.209 16.686 0,8 0,2 6,8 0,3 28,6
1997 57.877 15.401 6.860 22.261 35.616 1,4 0,3 10,3 0,5 59,2
1998 81.227 15.876 8.156 24.032 57.195 2,0 0,4 13,7 0,6 89,8
1999 127.364 17.494 10.800 28.294 99.070 3,2 0,5 18,2 0,7 132,3
2000 362.468 17.592 13.995 31.587 330.881 8,9 0,5 21,8 0,8 358,1
2001 414.772 9.517 11.207 20.724 394.048 10,1 0,2 16,7 0,5 287,5
2002 483.260 17.826 22.349 40.175 443.085 11,6 0,5 31,7 1,0 224,0
2003 470.010 19.201 21.285 40.486 429.524 11,0 0,5 28,4 1,0 161,2
2004 684.561 19.934 18.783 38.717 645.844 15,8 0,5 23,9 1,0 212,8
2005 719.284 18.468 18.105 36.573 682.711 16,3 0,5 21,9 0,9 183,0
2006 840.844 18.936 18.937 37.873 802.971 18,8 0,5 21,5 0,9 193,8
2007 958.266 18.997 18.735 37.732 920.534 21,2 0,5 19,9 0,9 203,7
2008 726.009 17.044 16.737 33.781 692.228 15,7 0,4 16,1 0,8 131,4
2009 498.977 15.841 13.794 29.635 469.342 10,7 0,4 12,2 0,7 83,1
2010 464.443 15.628 17.481 33.109 431.334 9,9 0,4 14,3 0,8 75,0
2011 454.686 18.617 19.787 38.404 416.282 9,6 0,5 14,8 0,9 72,4
2012* 376.696 39.164 337.532 8,0 0,9 61,1
2002 26.092 26.092 0,67
2003 13.867 13.867 0,35
2004 10.980 10.980 0,28
2005 15.910 15.910 0,40
2006 17.895 17.895 0,45
2007 312.987 22.517 5.574 28.091 284.896 6,9 0,57 5,92 0,69 63,04
2008 276.727 25.863 8.590 34.453 242.274 6,0 0,65 8,28 0,84 45,98
2009 433.681 25.532 9.840 35.372 398.309 9,3 0,64 8,69 0,86 70,51
2010 403.324 26.675 10.603 37.278 366.046 8,6 0,67 8,69 0,90 63,69
2011 497.970 37.890 14.951 52.841 445.129 10,6 0,94 11,21 1,28 77,39
2012* 560.199 73.215 486.984 11,9 1,76 88,22
Sources: Emigration from Spain during the period of early migration is from Nadal () and Garcia Fernández ().
It is computed as the sum of emigration to America based on passengers on ships and planes and emigration to Europe based on destination countries statistics
Population in that period is from census data 1960 and 1970. The years in between are the result of a geometric interpolation
Immigration and emigration flows in all the following periods but 2012 from municipal registers (Encuesta de Variaciones Residenciales)
Immigration and emigration in 2012 comes from Nowcast (Población actual). Real time data on population constructed from municipal registers
Population since 1996 comes from municipal registers (Padrón Continuo)
PERIOD OF EARLY EMIGRATION 60'S
PERIOD OF RECENT IMMIGRATION
PERIOD OF RECENT EMIGRATION
Flow (persons)
Spanish nationality Spanish nationality
Total
Ratio respect to population ('000)
Total

15
Table 4: Internal migration
Spanish
nationality
Foreign
nationality
Spanish
nationality
Foreign
nationality
Born in
SpainBorn abroad
Total Total
Born in
SpainBorn abroad
Total Total
2002 533.445 407593 15966 423559 109886 12,8 10,4 22,7 10,6 55,6
2003 586.987 436143 17901 454044 132943 13,7 11,1 23,9 11,3 49,9
2004 619.461 434179 18339 452518 166943 14,3 11,0 23,3 11,3 55,0
2005 626.324 428054 18147 446201 180123 14,2 10,8 21,9 11,1 48,3
2006 682.606 463270 20287 483557 199049 15,3 11,7 23,0 11,9 48,0
2007 744.716 470812 22694 493506 251210 16,5 11,8 24,1 12,1 55,6
2008 684.384 432492 23984 456476 227908 14,8 10,9 23,1 11,2 43,3
2009 669.573 430840 26119 456959 212614 14,3 10,8 23,1 11,1 37,6
2010 671.198 444581 27526 472107 199091 14,3 11,1 22,5 11,4 34,6
2011 672.003 447626 30329 477955 194048 14,2 11,2 22,7 11,5 33,7
Source: Flows in all periods from municipal registers (Encuesta de Variaciones Residenciales)
Total
Spanish nationality
Total
Spanish nationality
INTERNAL MIGRATION
Flow (persons) Ratio respect to population ('000)
16
Table 5: Characteristics of foreigners depending on their moving status
Recent
immigrants
2008-2011
Recent
emigrants
2008-2011
Internal
migrants
2008-2011
Stock of
foreigners
2008-2011
Gender
Males 51.9% 58.7% 57.7% 52.7%
Females 48.1% 41.3% 42.3% 47.3%
Age structure
Less than 16 15.0% 10.7% 34.4% 14.4%
Over 16 85.0% 89.3% 65.6% 85.6%
Age of those above 16
16-29 45.1% 32.8% 64.6% 32.3%
30-44 35.9% 44.7% 17.1% 41.7%
45-64 15.3% 18.4% 16.8% 19.8%
>=65 3.6% 4.2% 1.5% 6.1%
Country of birth
Spain 12.3% 9.4% 4.5% 6.0%
Rest of the world 87.7% 90.6% 95.5% 94.0%
Within the rest
Europe 25.4% 22.7% 22.3% 42.9%
Romania 14.0% 10.4% 10.2% 15.3%
Bulgaria 2.6% 2.3% 2.1% 3.1%
Germany 2.2% 1.9% 0.7% 3.3%
UK 4.3% 2.4% 1.0% 6.8%
America 40.1% 46.9% 39.7% 34.7%
Argentina 2.9% 4.9% 3.2% 3.6%
Ecuador 4.3% 6.4% 6.4% 7.6%
Bolivia 2.2% 7.1% 4.8% 4.2%
Colombia 6.0% 5.3% 8.8% 5.4%
Peru 3.9% 2.8% 2.7% 2.5%
Asia 11.8% 9.2% 12.3% 5.3%
Africa 22.5% 21.1% 30.4% 17.0%
Morocco 13.9% 12.3% 19.1% 11.9%
Oceania 0.1% 0.1% 0.0% 0.1%
Source: Municipal registers (Encuesta de Variaciones Residenciales and padrón continuo)

17
Table 6: Characteristics of Spaniards born in Spain depending on their moving status
Recent
immigrants
2008-2011
Recent
emigrants
2008-2011
Internal
migrants
2008-2011
Stock of
Spaniards
2008-2011
Gender
Males 51.1% 51.9% 49.0% 49.1%
Females 48.9% 48.1% 51.0% 50.9%
Children
Less than 16 11.0% 21.9% 25.3% 14.9%
Over 16 89.0% 78.1% 74.7% 85.1%
Age of those above 16
16-29 14.3% 24.4% 44.1% 20.0%
30-44 32.6% 46.0% 20.7% 27.9%
45-64 30.0% 19.0% 20.9% 30.2%
>=65 23.1% 10.6% 14.3% 21.9%
Region
Andalucía 12.1% 12.4% 17.5% 19.1%
Aragón 1.9% 2.2% 2.9% 2.9%
Asturias, Principado de 2.7% 2.0% 1.8% 2.5%
Balears, Illes 1.5% 2.1% 3.7% 2.1%
Canarias 4.5% 4.6% 4.2% 4.3%
Cantabria 1.1% 1.0% 1.4% 1.3%
Castilla - La Mancha 1.9% 2.1% 8.4% 4.6%
Castilla y León 4.7% 4.3% 6.8% 5.9%
Cataluña 15.8% 16.9% 14.1% 15.2%
Comunitat Valenciana 9.2% 9.0% 8.9% 10.2%
Extremadura 1.2% 1.1% 2.8% 2.6%
Galicia 13.1% 8.4% 5.8% 6.4%
Rioja, La 0.4% 0.5% 0.8% 0.7%
Madrid, Comunidad de 22.4% 24.2% 13.9% 12.8%
Murcia, Región de 1.9% 2.3% 2.3% 3.0%
Navarra, Comunidad Foral de 1.0% 1.3% 1.2% 1.4%
País Vasco 4.6% 5.6% 3.5% 5.0%
Country of destination (*)
Europe 62.4%
UK 31.0%
Germany 7.6%
France 4.1%
Switzerland 3.5%
America 12.2%
USA 23.1%
Asia 18.3%
China 5.2%
Africa 2.1%
Oceania 4.9%
Source: Municipal registers (Encuesta de Variaciones Residenciales and padrón continuo)
(*)Destination is from the change in the stock by country of destination 2008-2012 in
Embassy registers
18
Table 7: Log odds of residing in Spain by foreigners
(1) (2) (3) (4) (5) (6)
VARIABLESLog odds
1998-2001
Log odds
2001-2007
Log odds
2008-2012
Log odds
1998-2001
Log odds
2001-2007
Log odds
2008-2012
U(destination)-U(origin) -0.1036 0.0093 0.0086 0.0667 0.03205 0.0547
(0.003)*** (0.0031)*** (0.0005)*** (0.005)*** (0.0059)*** (0.0029)***
Years of schooling -0.0077 -0.0360 -0.0326
(0.015) (0.0119)*** (0.0122)***
Fixed effects pair country-region YES YES YES
Fixed effects country YES YES YES
Constant -19.11 -18.00 -17.55 -18.92 -17.22 -17.20
(0.007)*** (0.005)*** (0.005)*** (0.1905)*** (0.1429)*** (0.1495)***
Observations 4959 8307 6921 3963 6475 5357
Pairs of country-region 1349 1405 1406
R-squared 0,974 0,982 0,997 0,617 0,69 0,7315
The dependent variable is the log odds of residing in Spain. This log odds ratio is computed in such a way that the stock
WEO database. Unemployment rates of regions in Spain are from the labour force survey and unemployment in origin
countries at the WEO. The variable years of schooling is from the labour force survey. Average years of schooling by country
of birth and region for the period 2000-2012. We compute an average years of schooling for each degree in educational attainment
Standard errors in parentheses
*** p<0.01, ** p<0.05, * p<0.1
Source: Regression (1) and (2) from the paper. One observation is a pair region of destination in Spain /country of birth per year
of migrants by country of birth in each region is taken from municipal registers and the population in the country of birth is from

19
Table 8: Log odds of Spaniards living abroad
(1) (2)
VARIABLESLog odds
2008-2012
Log odds
2008-2012
U(destination)-U(origin) -0.0372 -0.019
(0.0023)*** (0.0020)
Years of schooling 0.6690
(0.0275)***
Fixed effects pair country-region YES
Fixed effects country YES
Constant -20.39 -16.29
(0.0202)*** (0.2871)***
Observations 4488 3777
Pairs of country-region 1281
R-squared 0,9939 0,8689
Standard errors in parentheses
*** p<0.01, ** p<0.05, * p<0.1
in origin countries at the WEO. The variable years of schooling is from the labour force survey. Average years of schooling by country
of birth and region for the period 2000-2012. We compute an average years of schooling for each degree in educational attainment
Source: Regression (1) and (2) from the paper. One observation is a pair country of destination /region of origin in Spain per year
The dependent variable is the log odds of residing abroad Spain. This log odds ratio is computed in such a way that the stock
of Spaniards by country of destination and region of origin is taken from embassy registers and the population in the region
in Spain is from municipal registers. Unemployment rates of regions in Spain are from the labour force survey and unemployment

20
Table 9: Log odds of immigrating and emigrating to/from Spain
(1) (2) (3) (4) (5) (6)
VARIABLESLog odds
1998-2001
Log odds
2001-2007
Log odds
2008-2012
Log odds
1998-2001
Log odds
2001-2007
Log odds
2008-2012
U(destination)-U(origin) -0.2418 -0.0241 -0.0378 -0.0372
(0.004)*** (0.0054)*** (0.0017)*** (0.0023)***
Fixed effects pair country-region YES YES YES YES
Constant -20.40 -19.49 -19.22 -20.39
(0.0155)*** (0.008)*** (0.0149)*** (0.0202)***
Observations 5584 7210 4941 4488
Pairs of country-region 1203 1338 1321 1281
R-squared 0,898 0,949 0,982 0,9721
The dependent variable is the log odds of moving to/from Spain. This log odds ratio is computed in such a way that the flow
WEO database. Unemployment rates of regions in Spain are from the labour force survey and unemployment in origin
countries at the WEO.
Standard errors in parentheses
*** p<0.01, ** p<0.05, * p<0.1
Source: Regression (3) and (4) from the paper. One observation is a pair region of destination in Spain /country of birth per year
of migrants by country of birth in each region is taken from municipal registers and the population in the country of birth is from
Immigration of foreigners Emigration of foreigners

21
Table 10: Composition of recent Spanish Emigrants to UK, France and Argentina.
UNITED KINGDOM
1998-2007 2008-2012 1998-2007 2008-2012 2003-2007 2008-2012
Total Emigrants 24,052 42,775 4,413 12,319 11,507 18,002
<16 23.2 15.9 0.0 0.0 1.2 32.6
16-29 42.7 41.6 100.0 91.6 17.6 13.0
30-44 10.3 12.7 0.0 8.4 10.8 26.6
45-64 0.0 29.7 0.0 0.0 23.1 9.4
>65 0.0 0.0 0.0 0.0 47.3 18.5
High 48.1 60.0 40.8 61.9 5.1 31.7
Medium 19.2 6.6 50.4 21.1 42.2 8.6
Low 8.9 6.1 8.7 17.0 52.7 59.7
NA 23.8 27.4
Compostition of recent emigrants to UK (2008-2012)
<16 16-29 30-44 45-64 >65
Euro Area 21.1 28.5 53.8 15.3 1.9 0.6
Rest of Europe 24.6 17.4 54.1 24.2 4.2 0.1
North America 3.8 17.8 34.4 38.2 8.3 1.3
Rest of America 13.7 27.1 38.4 24.2 5.3 5.0
Asia 34.2 20.3 58.0 17.5 4.0 0.3
Oceanía 2.5 14.4 38.7 35.5 9.6 1.8
SPAIN 0.04 15.9 41.6 12.7 29.7 0.0
Unknown High Medium Low
Euro Area 21.1 25.7 49.0 10.4 14.9
Rest of Europe 24.6 16.4 25.9 12.7 45.0
North America 3.8 15.2 55.8 16.5 12.5
Rest of America 13.7 28.7 34.1 12.7 24.5
Asia 34.2 17.8 50.7 11.1 20.4
Oceanía 2.5 14.4 75.8 3.7 6.1
SPAIN 0.04 27.4 60.0 6.6 6.1
Source: LFS from UK and France, and Encuesta Permanente de Hogares Argentina
Age distribution
FRANCE ARGENTINA
Year of arrival Year of arrival Recent emigrants (less than 5 years)
Skill distribution
Share in total recent
emigrants (%)
By age group
Share in total recent
emigrants (%)
By educational attainment

22
Figure 1. Unemployment rates
0 5 10 15 20 25 30 35 40
Cantabria
País Vasco
Rioja, La
Aragón
Castilla y León
Navarra, Comunidad Foral de
Asturias, Principado de
Madrid, Comunidad de
Castilla - La Mancha
Cataluña
Galicia
Total Nacional
Murcia, Región de
Comunitat Valenciana
Balears, Illes
Extremadura
Andalucía
Ceuta
Canarias
Melilla
Unemployment rate (%), by region (males)
2008Q1 Variation 2008Q1-2013Q1
-5 5 15 25 35 45
Navarra, Comunidad Foral de
País Vasco
Aragón
Cataluña
Rioja, La
Madrid, Comunidad de
Cantabria
Galicia
Comunitat Valenciana
Asturias, Principado de
Murcia, Región de
Total Nacional
Castilla y León
Balears, Illes
Castilla - La Mancha
Canarias
Andalucía
Extremadura
Ceuta
Melilla
Unemployment rate (%), by region (females)
2008Q1 Variation 2008Q1-2013Q1

23
Figure 1 (continued)
0 10 20 30 40 50 60 70 80 90
Total-Males
Males, 16-19 years old
Males, 20-24 years old
Males, 25-29 years old
Males, 30-44 years old
Males, 45-54 years old
Males, 55 and above
Total-Females
Females, 16-19 years old
Females, 20-24 years old
Females, 25-29 years old
Females, 30-44 years old
Females, 45-54 years old
Females, 55 and above
2008Q1 Variation 2008Q1-2013Q1
0 10 20 30 40 50 60
Total-Males-Universitary degree
Males, 20-24 years old-Universitary degree
Males, 25-29 years old-Universitary degree
Males, 30-44 years old-Universitary degree
Males, 45-54 years old-Universitary degree
Males, 55 and above-Universitary degree
Total-Females, Universitary degree
Females, 20-24 years old-Universitary degree
Females, 25-29 years old-Universitary degree
Females, 30-44 years old-Universitary degree
Females, 45-54 years old-Universitary degree
Females, 55 and above-Universitary degree
2008Q1 Variation 2008Q1-2013Q1

24
Figure 2: Share of foreigners in Spain and evolution of unemployment rate
0
5
10
15
20
25
30
0%
2%
4%
6%
8%
10%
12%
14%
Immigrants Unemployment rate (right)
25
Figure 3: Migration flows and unemployment rate
0
5
10
15
20
25
30
0
5
10
15
20
25
30
-600000 -400000 -200000 0 200000 400000 600000 800000 1000000
Un
em
plo
yme
nt
rate
Migration flows
Migration flows and unemployment. Foreginers
Immigration 1995-2001 Immigration 2007-2012 Immigration 2001-2007 Emigration 2007-2012
0
5
10
15
20
25
30
-30000 -20000 -10000 0 10000 20000 30000
Un
em
plo
yme
nt
rate
Migration flows
Migration flows and unemployment. Spaniards born in Spain
Emigration 2007-2012 Immigration 1995-2012 Lineal (Immigration 1995-2012)
26
Figure 4: Constant on a regressions of log odds of internal migrating by nationality
representing costs of emigrating internally
-6
-5
-4
-3
-2
-1
0
1629_low 1629_medium 1629_high 3044_low 3044_medium 3044_high 4564_low 4564_medium 4564_high
Log-odds of internal migration
Spanish Foreigners
Note: Age/skill groups dummies in the regression of the Log odds of internal migration. 95% confidence bands
27
Figure 4 (continued): Sensitivity of log odds of internally moving to unemployment
differentials by nationality
-8
-6
-4
-2
0
2
4
6
8
1629_low 1629_medium 1629_high 3044_low 3044_medium 3044_high 4564_low 4564_medium 4564_high
Sensitivity to Regional Unemployment differentials. Foreigners
Note: Age/skill groups dummies interactions with regional unemployment differential in the regression of the Log odds of internal migration. 95% confidence bands
-8
-6
-4
-2
0
2
4
6
8
1629_low 1629_medium 1629_high 3044_low 3044_medium 3044_high 4564_low 4564_medium 4564_high
Sensitivity to Regional Unemployment differentials. Spaniards
Note: Age/skill groups dummies interactions with regional unemployment differential in the regression of the Log odds of internal migration. 95% confidence bands