marion county, mississippi · marion county, mississippi and incorporated areas community name...
TRANSCRIPT
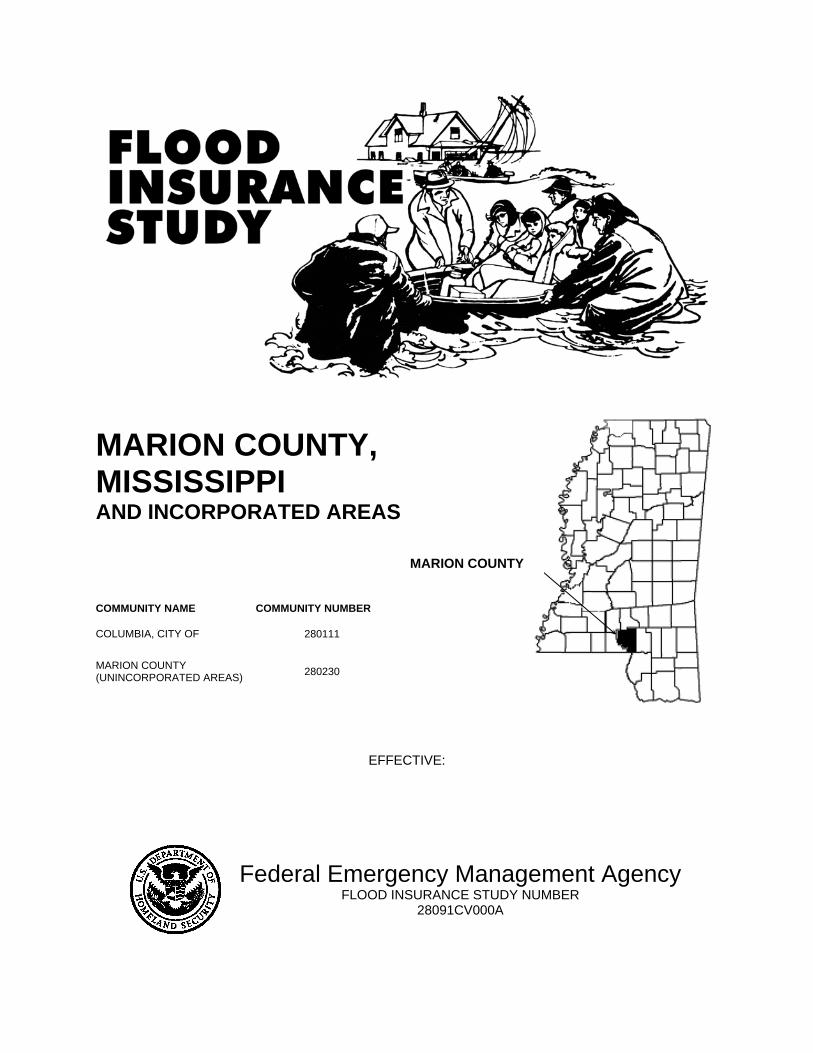
MARION COUNTY, MISSISSIPPI AND INCORPORATED AREAS
COMMUNITY NAME COMMUNITY NUMBER
COLUMBIA, CITY OF
280111
MARION COUNTY (UNINCORPORATED AREAS)
280230
EFFECTIVE:
Federal Emergency Management AgencyFLOOD INSURANCE STUDY NUMBER
28091CV000A
MARION COUNTY
NOTICE TO
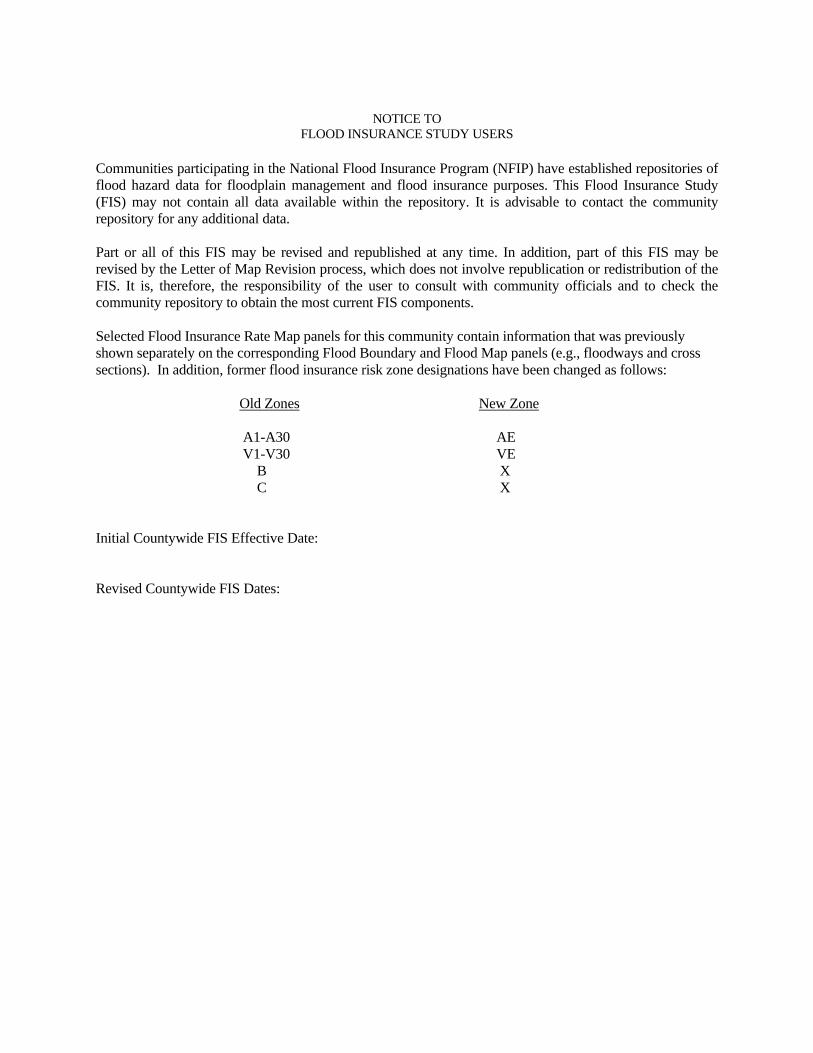
FLOOD INSURANCE STUDY USERS Communities participating in the National Flood Insurance Program (NFIP) have established repositories of flood hazard data for floodplain management and flood insurance purposes. This Flood Insurance Study (FIS) may not contain all data available within the repository. It is advisable to contact the community repository for any additional data. Part or all of this FIS may be revised and republished at any time. In addition, part of this FIS may be revised by the Letter of Map Revision process, which does not involve republication or redistribution of the FIS. It is, therefore, the responsibility of the user to consult with community officials and to check the community repository to obtain the most current FIS components. Selected Flood Insurance Rate Map panels for this community contain information that was previously shown separately on the corresponding Flood Boundary and Flood Map panels (e.g., floodways and cross sections). In addition, former flood insurance risk zone designations have been changed as follows: Old Zones New Zone A1-A30 AE V1-V30 VE B X C X Initial Countywide FIS Effective Date: Revised Countywide FIS Dates:
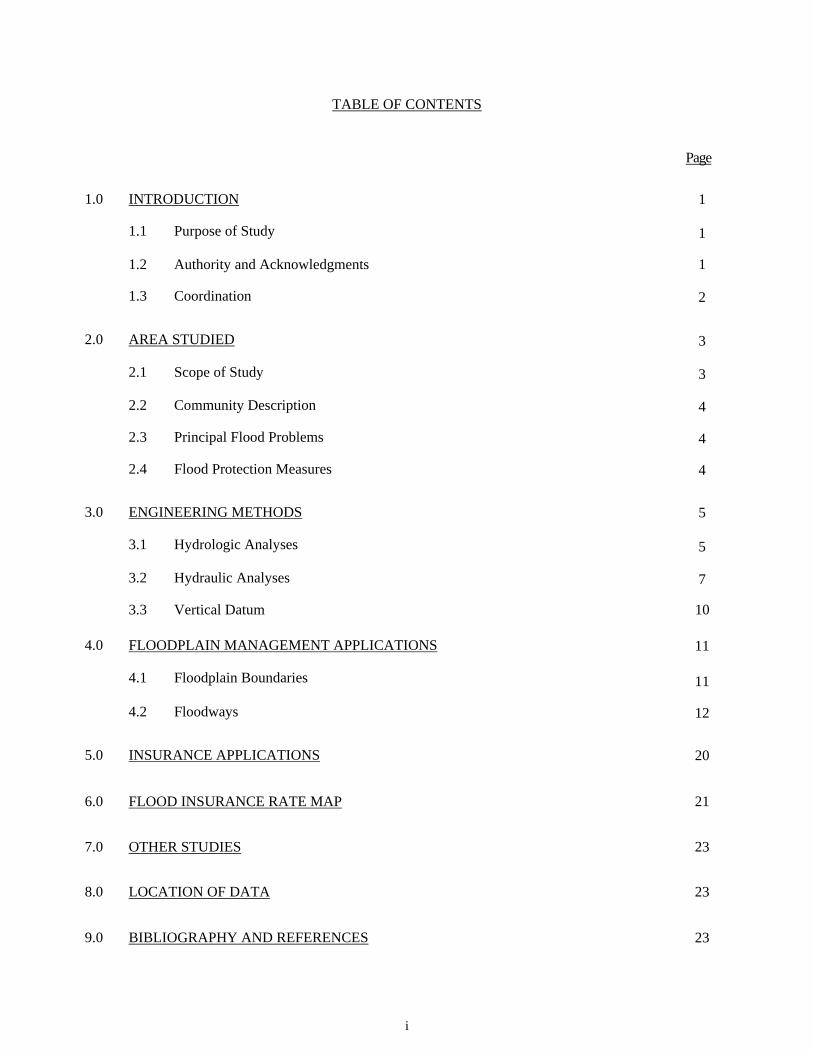
TABLE OF CONTENTS
Page
1.0 INTRODUCTION 1
1.1 Purpose of Study 1
1.2 Authority and Acknowledgments 1
1.3 Coordination 2
2.0 AREA STUDIED 3
2.1 Scope of Study 3 2.2 Community Description 4 2.3 Principal Flood Problems 4 2.4 Flood Protection Measures 4
3.0 ENGINEERING METHODS 5
3.1 Hydrologic Analyses 5 3.2 Hydraulic Analyses 7 3.3 Vertical Datum 10
4.0 FLOODPLAIN MANAGEMENT APPLICATIONS 11
4.1 Floodplain Boundaries 11 4.2 Floodways 12
5.0 INSURANCE APPLICATIONS 20
6.0 FLOOD INSURANCE RATE MAP 21
7.0 OTHER STUDIES 23
8.0 LOCATION OF DATA 23
9.0 BIBLIOGRAPHY AND REFERENCES 23
i
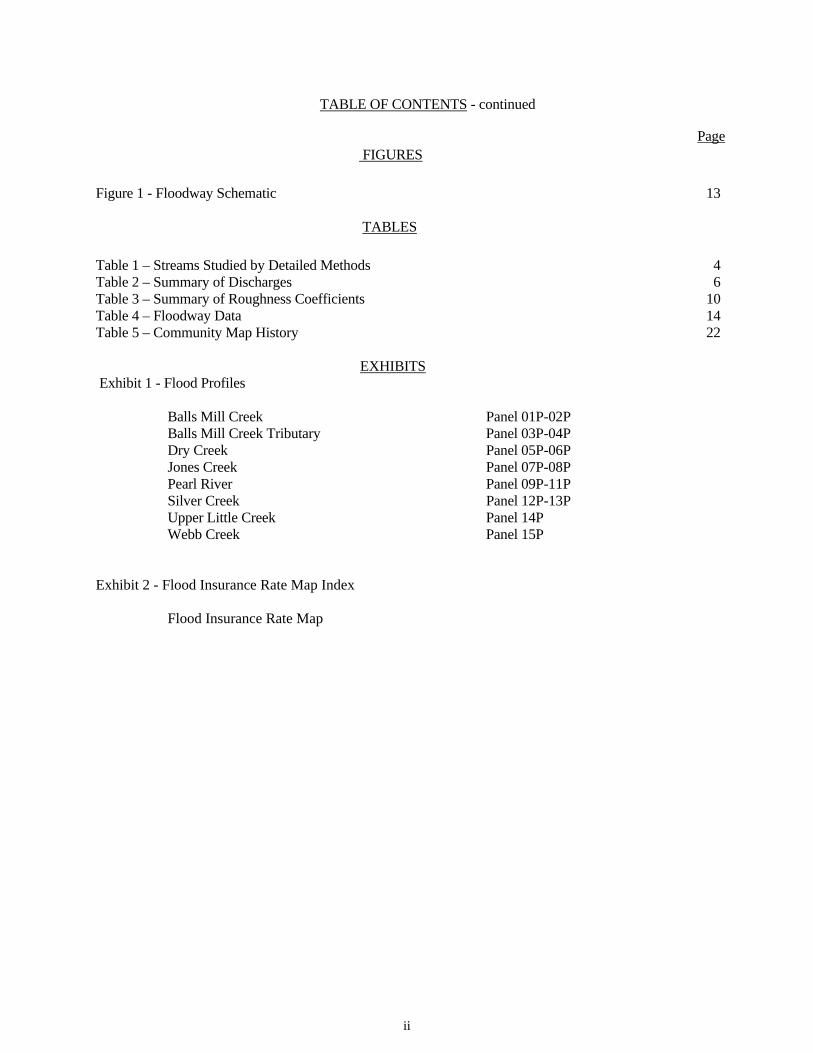
TABLE OF CONTENTS - continued
Page FIGURES
Figure 1 - Floodway Schematic 13
TABLES Table 1 – Streams Studied by Detailed Methods 4 Table 2 – Summary of Discharges 6 Table 3 – Summary of Roughness Coefficients 10 Table 4 – Floodway Data 14 Table 5 – Community Map History 22 EXHIBITS Exhibit 1 - Flood Profiles
Balls Mill Creek Panel 01P-02P Balls Mill Creek Tributary Panel 03P-04P Dry Creek Panel 05P-06P Jones Creek Panel 07P-08P Pearl River Panel 09P-11P Silver Creek Panel 12P-13P Upper Little Creek Panel 14P Webb Creek Panel 15P
Exhibit 2 - Flood Insurance Rate Map Index
Flood Insurance Rate Map
ii
FLOOD INSURANCE STUDY MARION COUNTY, MISSISSIPPI AND INCORPORATED AREAS 1.0 INTRODUCTION
1.1 Purpose of Study
This Flood Insurance Study (FIS) revises and supersedes the FIS reports and/or Flood Insurance Rate Maps (FIRMs) in the geographic area of Marion County, Mississippi, including the City of Columbia and unincorporated areas of Marion County (hereinafter referred to collectively as Marion County). This FIS aids in the administration of the National Flood Insurance Act of 1968 and the Flood Disaster Protection Act of 1973. This study has developed flood risk data for various areas of the community that will be used to establish actuarial flood insurance rates. This information will also be used by Marion County to update existing floodplain regulations as part of the Regular Phase of the National Flood Insurance Program (NFIP), and by local and regional planners to further promote sound land use and floodplain development. Minimum floodplain management requirements for participation in the NFIP are set forth in the Code of Federal Regulations at 44 CFR, 60.3. In some States or communities, floodplain management criteria or regulations may exist that are more restrictive or comprehensive than the minimum Federal requirements. In such cases, the more restrictive criteria take precedence and the State (or other jurisdictional agency) will be able to explain them.
1.2 Authority and Acknowledgments
The sources of authority for this FIS report are the National Flood Insurance Act of 1968 and the Flood Disaster Protection Act of 1973. March 1979, FIS Marion County (Unincorporated Areas) The hydrologic and hydraulic analyses for this study were performed by Smith and Sanders, Inc., for the Federal Insurance Administration under Contract No. H-4057. This work, which was completed in April 1978, covered all significant flooding sources in Marion County.
March 1979, City of Columbia, FIS The hydrologic and hydraulic analyses for this study were performed by Smith and Sanders, Inc., for the Federal Insurance Administration under Contract No. H-4057. This work, which was completed in January 1978, covered all significant flooding sources in the City of Columbia. This Countywide FIS The hydrologic and hydraulic analyses for this countywide FIS were performed by the State of Mississippi for the Federal Emergency Management Agency (FEMA), under Contract No. EMA-2007-CA-5774. This study was completed in September 2009.
The digital base map information files were provided by the U.S. Army Corps of Engineers—Vicksburg District, 4155 East Clay Street, Vicksburg, MS 39183. The digital orthophotography was acquired in March 2006, with the imagery processed to a 2-foot pixel resolution. The digital FIRM was produced using the Mississippi State Plane Coordinate System, West Zone, FIPSZONE 2302. The horizontal datum was the North American Datum of 1983, GRS 80 spheroid. Distance units were measured in U.S. feet.
1.3 Coordination
An initial Consultation Coordination Officer's (CCO) meeting is held with representatives from FEMA, the community, and the study contractor to explain the nature and purpose of a FIS, and to identify the streams to be studied by detailed methods. A final CCO meeting is held with representatives from FEMA, the community, and the study contractor to review the results of the study. March 1979, Marion County (Unincorporated Areas) FIS The community base map was prepared from U.S. Geological Survey (USGS) quadrangle maps. The identification of streams requiring study was made in a meeting attended by representatives of the Federal Insurance Administration, Smith and Sanders, Inc., and Marion County in July 1976. Coordination activities in connection with this study include meetings or discussions with representatives of the U.S. Army Corps of Engineers (USACE), USGS, U.S. Soil Conservation Service, South Mississippi Economic and Development District, and the Mississippi Research and Development Center. Notice of intent to perform the Flood Insurance Study was published on three separate occasions in a local newspaper in February and March 1977. March 1979, City of Columbia, FIS The community base map was developed from maps furnished by the Mississippi Research and Development Center and USGS quadrangle maps, and the identification of streams requiring detailed study was made in a meeting attended by representatives of the FIA, the City of Columbia, and Smith and Sanders, Inc., in July 1976. Other coordination activities include meetings or contacts with the Mississippi Research Development Center, the South Mississippi Economic Development District, the USACE, the U.S. Soil Conservation Service, and the USGS. Notice of intent to perform the Flood Insurance Study was published on three separate occasions in a local newspaper in February and March, 1977. This Countywide FIS For this countywide FIS, the Project Scoping Meeting was held on March 19, 2008 in Columbia, MS. Attendees for these meetings included representatives from the Mississippi Department of Environmental Quality, Mississippi Emergency Management Agency, FEMA National Service Provider, Marion County, the City of Columbia, the State, and the Study Contractor. Coordination with county officials and Federal, State, and regional agencies produced a variety of information pertaining to floodplain
2
regulations, available community maps, flood history, and other hydrologic data. All problems raised in the meetings have been addressed.
2.0 AREA STUDIED 2.1 Scope of Study
This FIS covers the geographic area of Marion County, Mississippi, and its incorporated communities listed in Section 1.1 Several flooding sources within the county were studied by approximate methods. Approximate analyses are used to study those areas having a low development potential or minimal flood hazards. The scope and methods of study were proposed to, and agreed upon, by FEMA and the State of Mississippi. March 1979, Marion County (Unincorporated Areas) FIS Floods caused by the overflow of reaches of the Pearl River, Upper Little Creek, Silver Creek, and Balls Mill Creek were studied in detail. The reach of the Pearl River studied in detail extends from a point approximately fifteen miles downstream of the southern corporate limit of Columbia to a point approximately eight miles upstream of the northern corporate limit of the city. Upper Little Creek was studied in detail from its confluence with the Pearl River approximately five miles upstream. Silver Creek was studied in detail from its confluence with the Pearl River approximately five miles upstream to a county road crossing. Balls Mill Creek was studied in detail from its confluence with Pearl River approximately 4.5 miles upstream to a point just east of Columbia. The reaches of the Pearl River within Marion County not studied in detail were studied by approximate methods. Additionally, other tributaries of the Pearl River were studied by approximate methods. March 1979, City of Columbia, FIS The March 1979, Flood Insurance Study covered the entire incorporated area of the City of Columbia. Floods caused by the overflow of the Pearl River, Balls Mill Creek Tributary, Dry Creek, Webb Creek, and Jones Creek were studied in detail. Flooding on the upper reaches (drainage area less than one square mile) of Balls Mill Creek Tributary and Webb Creek was studied by approximate methods. This Countywide FIS For this countywide FIS, Pearl River and Balls Mill Creek Tributary were studied by detailed methods. This study type entails collecting basic field measurements of hydraulic structures and channel geometry. Vertical control is determined by the survey crew using USGS benchmarks. Roughness values are estimated from aerial photography and photographs collected during survey. Channel and overbank reach lengths are computed using GIS methods. Model results are calibrated to known stage values, as they are available and deemed reliable. Table 1 lists the flooding sources, which were revised or newly studied by detailed methods.
3
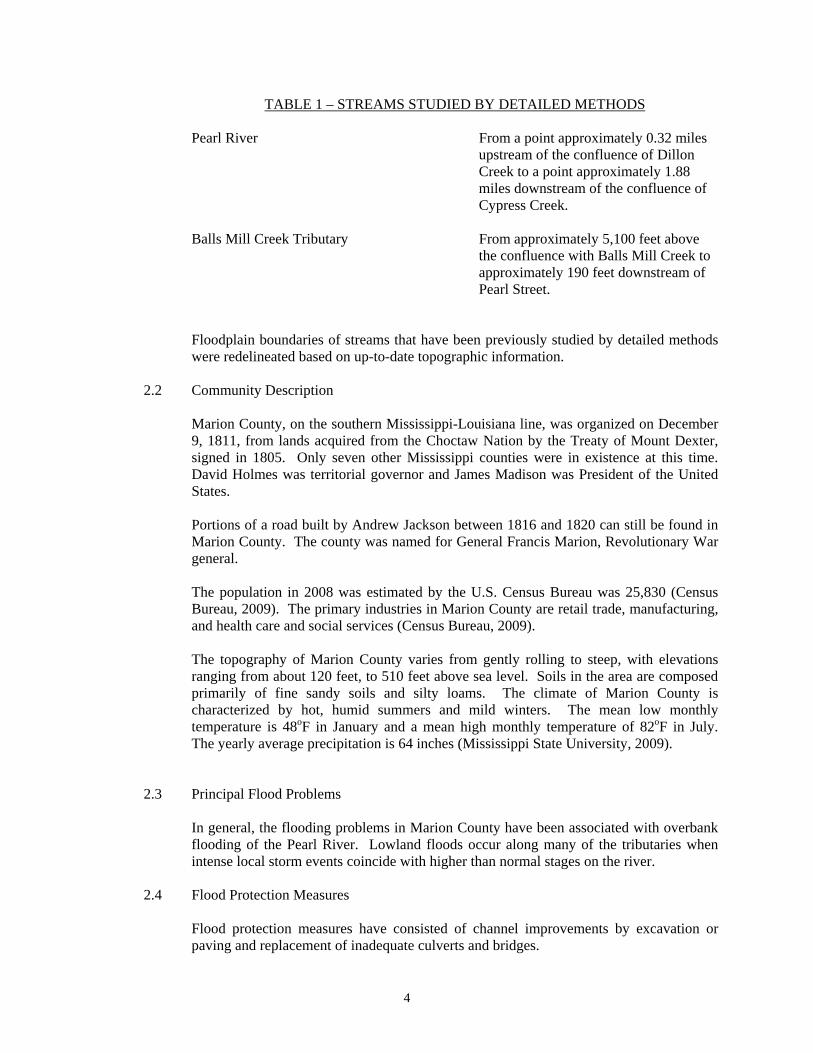
TABLE 1 – STREAMS STUDIED BY DETAILED METHODS
Pearl River From a point approximately 0.32 miles upstream of the confluence of Dillon Creek to a point approximately 1.88 miles downstream of the confluence of Cypress Creek.
Balls Mill Creek Tributary From approximately 5,100 feet above
the confluence with Balls Mill Creek to approximately 190 feet downstream of Pearl Street.
Floodplain boundaries of streams that have been previously studied by detailed methods were redelineated based on up-to-date topographic information.
2.2 Community Description Marion County, on the southern Mississippi-Louisiana line, was organized on December 9, 1811, from lands acquired from the Choctaw Nation by the Treaty of Mount Dexter, signed in 1805. Only seven other Mississippi counties were in existence at this time. David Holmes was territorial governor and James Madison was President of the United States. Portions of a road built by Andrew Jackson between 1816 and 1820 can still be found in Marion County. The county was named for General Francis Marion, Revolutionary War general. The population in 2008 was estimated by the U.S. Census Bureau was 25,830 (Census Bureau, 2009). The primary industries in Marion County are retail trade, manufacturing, and health care and social services (Census Bureau, 2009). The topography of Marion County varies from gently rolling to steep, with elevations ranging from about 120 feet, to 510 feet above sea level. Soils in the area are composed primarily of fine sandy soils and silty loams. The climate of Marion County is characterized by hot, humid summers and mild winters. The mean low monthly temperature is 48oF in January and a mean high monthly temperature of 82oF in July. The yearly average precipitation is 64 inches (Mississippi State University, 2009).
2.3 Principal Flood Problems
In general, the flooding problems in Marion County have been associated with overbank flooding of the Pearl River. Lowland floods occur along many of the tributaries when intense local storm events coincide with higher than normal stages on the river.
2.4 Flood Protection Measures
Flood protection measures have consisted of channel improvements by excavation or paving and replacement of inadequate culverts and bridges.
4
3.0 ENGINEERING METHODS For the flooding sources studied by detailed methods in the communities, standard hydrologic and hydraulic study methods were used to determine the flood hazard data required for this study. Flood events of a magnitude that are expected to be equaled or exceeded once on the average during any 10-, 50-, 100-, or 500-year period (recurrence interval) have been selected as having special significance for floodplain management and for flood insurance rates. These events, commonly termed the 10-, 50-, 100-, and 500-year floods, have a 10-, 2-, 1-, and 0.2-percent chance, respectively, of being equaled or exceeded during any year. Although the recurrence interval represents the long-term, average period between floods of a specific magnitude, rare floods could occur at short intervals or even within the same year. The risk of experiencing a rare flood increases when periods greater than 1 year are considered. For example, the risk of having a flood that equals or exceeds the 1-percent-annual-chance flood in any 50-year period is approximately 40 percent (4 in 10); for any 90-year period, the risk increases to approximately 60 percent (6 in 10). The analyses reported herein reflect flooding potentials based on conditions existing in the community at the time of completion of this study. Maps and flood elevations will be amended periodically to reflect future changes.
3.1 Hydrologic Analyses
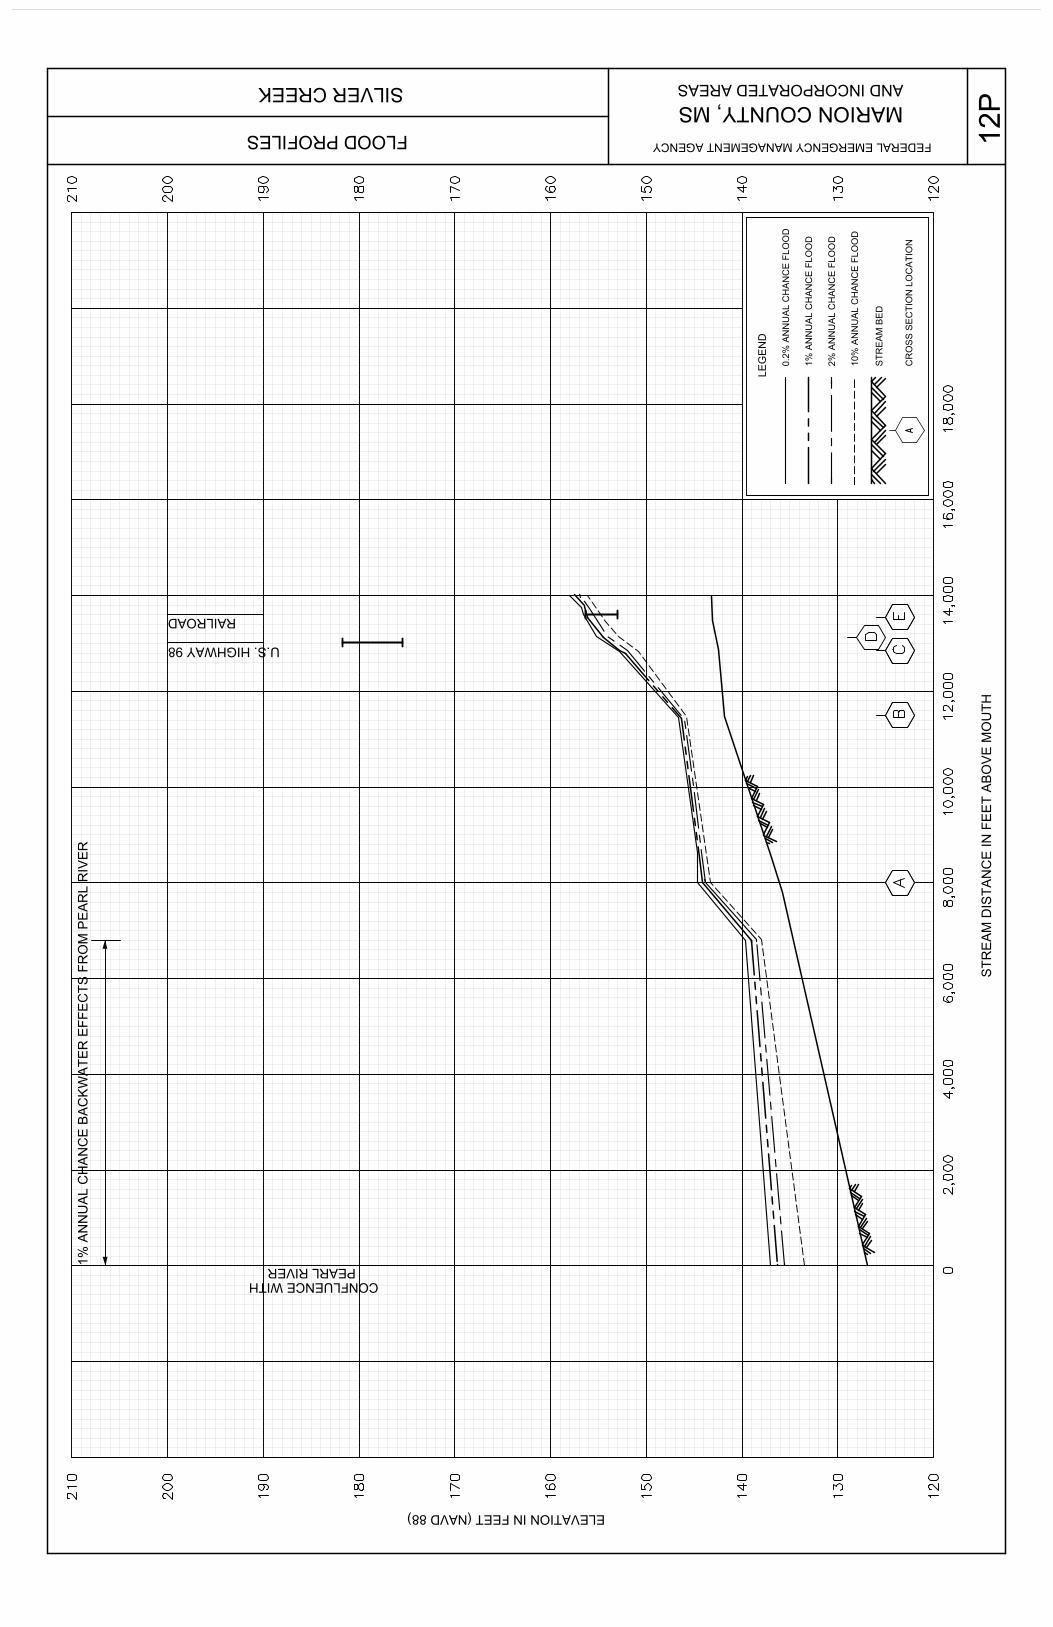
Hydrologic analyses were carried out to establish peak discharge-frequency relationships for each flooding source studied by detailed methods affecting the community. March 1979, Marion County (Unincorporated Areas) FIS Analyses The gaging station on the Pearl River at U.S. Highway 98 at Columbia was the principal source of data for defining discharge-frequency relationships for the river. The gage has been operated by the USGS since 1905. Values for the 10-, 2- 1-, and 0.2-percent annual chance peak discharges were obtained from a log-Pearson Type III distribution of annual peak-flow data for the period 1905-1976. Those computations were performed according to “Guidelines for Determining Flood Flow Frequency” by the U.S. Water Resources Council (United States Water Resources Council, 1976). Peak discharge-frequency data for the other streams studied in detail were computed using regional relationships relating basin characteristics to stream flow characteristics developed by the USGS. This methodology is defined in “Flood Frequency of Mississippi Streams” (Department of the Interior, 1976). During high flows on Silver Creek, some of the flow on the reach of the stream immediately upstream of U.S. Highway 98 is diverted from the natural flood plain and flows overland in an easterly direction through the Town of Foxworth. This flow ultimately discharges into the Pearl River. It was assumed that the high natural ground along the east (right) overbank of Silver Creek forming the divide between stream flow and overland flow created a very broad crested weir. The weir equation was used to compute the amount of flow diverted from the Silver Creek flood plain into overland flow through Foxworth. Consequently, peak flows on Silver Creek decrease in the vicinity of U.S. Highway 98.
5
6
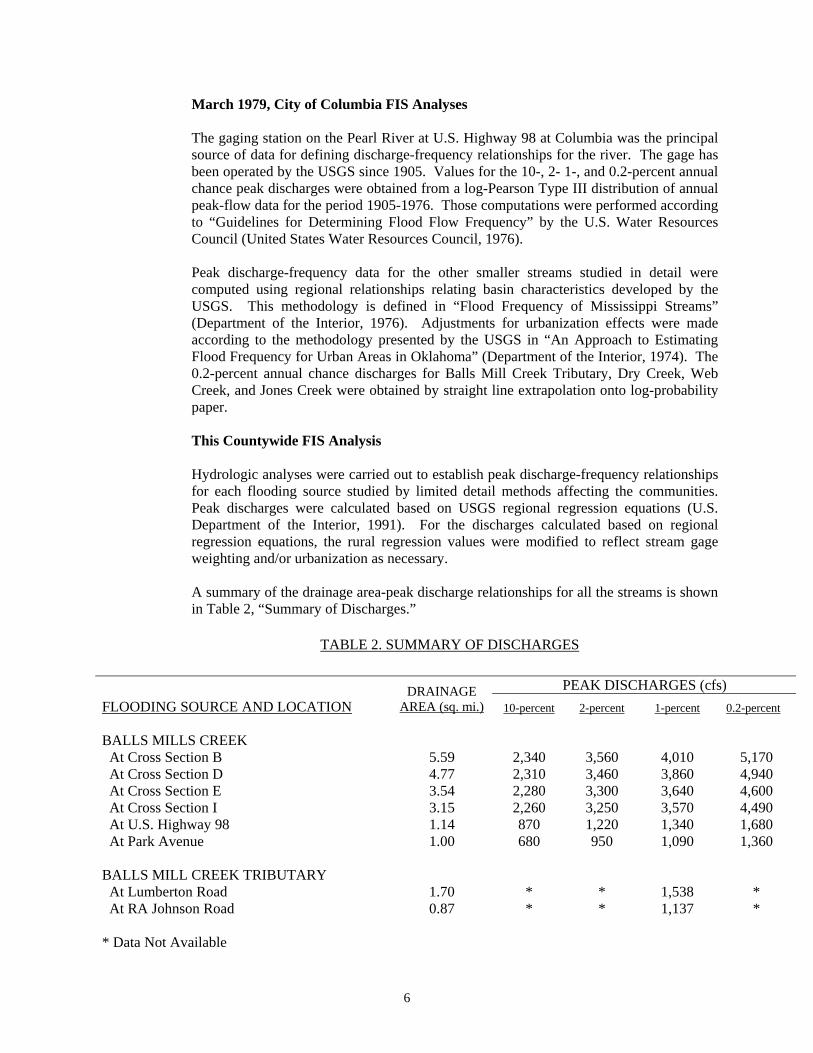
March 1979, City of Columbia FIS Analyses The gaging station on the Pearl River at U.S. Highway 98 at Columbia was the principal source of data for defining discharge-frequency relationships for the river. The gage has been operated by the USGS since 1905. Values for the 10-, 2- 1-, and 0.2-percent annual chance peak discharges were obtained from a log-Pearson Type III distribution of annual peak-flow data for the period 1905-1976. Those computations were performed according to “Guidelines for Determining Flood Flow Frequency” by the U.S. Water Resources Council (United States Water Resources Council, 1976). Peak discharge-frequency data for the other smaller streams studied in detail were computed using regional relationships relating basin characteristics developed by the USGS. This methodology is defined in “Flood Frequency of Mississippi Streams” (Department of the Interior, 1976). Adjustments for urbanization effects were made according to the methodology presented by the USGS in “An Approach to Estimating Flood Frequency for Urban Areas in Oklahoma” (Department of the Interior, 1974). The 0.2-percent annual chance discharges for Balls Mill Creek Tributary, Dry Creek, Web Creek, and Jones Creek were obtained by straight line extrapolation onto log-probability paper. This Countywide FIS Analysis Hydrologic analyses were carried out to establish peak discharge-frequency relationships for each flooding source studied by limited detail methods affecting the communities. Peak discharges were calculated based on USGS regional regression equations (U.S. Department of the Interior, 1991). For the discharges calculated based on regional regression equations, the rural regression values were modified to reflect stream gage weighting and/or urbanization as necessary. A summary of the drainage area-peak discharge relationships for all the streams is shown in Table 2, “Summary of Discharges.”
TABLE 2. SUMMARY OF DISCHARGES
PEAK DISCHARGES (cfs) FLOODING SOURCE AND LOCATION
DRAINAGE AREA (sq. mi.) 10-percent 2-percent 1-percent 0.2-percent
BALLS MILLS CREEK At Cross Section B 5.59 2,340 3,560 4,010 5,170 At Cross Section D 4.77 2,310 3,460 3,860 4,940 At Cross Section E 3.54 2,280 3,300 3,640 4,600 At Cross Section I 3.15 2,260 3,250 3,570 4,490 At U.S. Highway 98 1.14 870 1,220 1,340 1,680 At Park Avenue 1.00 680 950 1,090 1,360 BALLS MILL CREEK TRIBUTARY At Lumberton Road 1.70 * * 1,538 * At RA Johnson Road 0.87 * * 1,137 * * Data Not Available

TABLE 2. SUMMARY OF DISCHARGES
PEAK DISCHARGES (cfs) FLOODING SOURCE AND LOCATION
DRAINAGE AREA (sq. mi.) 10-percent 2-percent 1-percent 0.2-percent
DRY CREEK At Mouth 5.06 2,120 3,170 3,540 4,510 At Dewey Street 3.94 1,620 2,430 2,710 3,470 At West Avenue 3.71 1,470 2,260 2,520 3,260 At Cross Section L 3.52 1,390 2,140 2,390 3,090 JONES CREEK At Mouth 5.52 1,800 2,730 3,090 3,950 At Evergreen Street 4.93 1,580 2,420 2,770 3,570 At State Highway 13 4.73 1,540 2,400 2,740 3,550 PEARL RIVER At U.S. Highway 98 5,690 53,200 64,190 102,200 114,700 SILVER CREEK At U.S. Highway 98 37.4 8,200 10,700 11,400 13,300 At Cross Section F 37.0 9,000 13,000 14,500 18,000 At State Highway 587 36.8 9,510 15,400 17,300 22,600 At Cross Section K 35.6 9,200 14,900 16,700 21,900 At Water Valley Road 33.2 9,030 14,600 16,400 21,500 UPPER LITTLE CREEK At Cross Section B 125 14,000 22,800 25,900 33,800 At Cross Section E 122 13,700 22,300 25,300 33,100 WEBB CREEK At Mouth 1.08 690 970 1,100 1,380 At Owens Street 0.92 560 800 920 1,150
3.2 Hydraulic Analyses
Analyses of the hydraulic characteristics of flooding from the sources studied were carried out to provide estimates of the elevations of floods of the selected recurrence intervals. Users should be aware that flood elevations shown on the FIRM represent rounded whole-foot elevations and may not exactly reflect the elevations shown on the Flood Profiles or in the Floodway Data table in the FIS report. Flood elevations shown on the FIRM are primarily intended for flood insurance rating purposes. For construction and/or floodplain management purposes, users are cautioned to use the flood elevation data presented in this FIS report in conjunction with the data shown on the FIRM.
7
March 1979, Marion County (Unincorporated Areas) FIS Analyses Cross section data fro the streams in the study area were obtained by field measurements. All bridges and culverts were field surveyed to obtain elevation data and structural geometry. Cross sections were located at close intervals upstream and downstream of bridges and culverts to compute significant backwater effects of these structures. Roughness coefficients (Manning’s “n”) were estimated by field inspection at each cross section. Roughness values for the main channels of Silver Creek, Balls Mill Creek, and Upper Little Creek varied from 0.050 to 0.080; roughness values for their flood plains ranged from 0.070 to 0.200. Water-surface profiles were developed on all streams studied by detailed methods using a HEC-2 computer step-backwater model (USACE, 1976). The model for the Pearl River was calibrated with a log-Pearson Type III distribution of annual peak stage data at the gage at U.S. Highway 98 for the period 1905-1976. High water records of Pearl River floods of 1962 and 1972 obtained from the USGS also were used to refine the model. Profiles were determined for the 10-, 2-, 1-, and 0.2-percent annual chance floods. Water-surface elevations in the portion of Marion County east of State Highway 35 and north of the Pearl River near northwest Columbia were determined from the computed elevations on the Pearl River west of the highway and form high water marks of the April 1974 flood. The high water marks, obtained from the USGS, were taken along both the upstream (west) and downstream (east) sides of the highway embankment. These marks indicated an elevation differential of approximately 1.5 feet between the upstream and downstream sides of the embankment. Based on the computed elevations along the Pearl River and this elevation differential, water-surface elevations were determined in this area which is flooded by the Pearl River. Flood boundaries along certain reaches of the Pearl River and some of its tributaries not studied by detailed methods were determined from USGS publications, “Map of Flood Prone Areas, Columbia North, Columbia South, and Morgantown, Mississippi (USGS, 1973). These maps depict approximate 1-percent annual chance flood boundaries delineated through the use of readily available information on past floods and regional studies rather than from detailed field surveys and engineering computations. No water-surface elevations were published. Other approximate flood boundaries in this study were determined from past flood data and field and map reconnaissance. March 1979, City of Columbia FIS Analyses Cross section data for the streams in the study area were obtained by field inspection. All bridges and culverts were field surveyed to obtain elevation data and structural geometry. Cross sections were located at close intervals upstream and downstream of bridges and culverts to compute significant backwater effects of these structures. Roughness coefficients (Manning’s “n”) were estimated by field inspection at each cross section. Roughness values for the main channels of Dry Creek, Webb Creek, and Jones Creek varied from 0.040 to 0.080; roughness values for their flood plains ranged from 0.060 to 0.200.
8
Water-surface profiles were developed on all streams studied by detailed methods using a HEC-2 computer step-backwater model (USGS, 1976). The model for the Pearl River was calibrated with a log-Pearson Type III distribution of annual peak stage data at the gage at U.S. Highway 98 for the period of 1905-1976. Profiles were determined for the 10-, 2-, 1-, and 0.2-percent annual chance floods. Water surface elevations in northwest Columbia east of State Highway 35 were determined from the computed elevations on the Pearl River west of the highway and high water marks from the April 1974 flood. The high water marks, obtained from the USGS, were taken along both the upstream (west) and downstream (east) sides of the highway embankment. These marks indicated an elevation differential of approximately 1.5 feet between the upstream and downstream sides of the embankment. Based on the computed elevation differential, water-surface elevations were determined for the area of northwest Columbia, east of State Highway 35, which is flooded by the Pearl River.
Starting water-surface elevations for the streams studied in detail were determined by the slope-area method. Flood boundaries along the upper reaches of Balls Mill Creek Tributary and Webb Creek within the study area were determined by approximate methods. These boundaries were determined by USGS Topographic Maps and inspection of the areas. Flood elevations in the City of Columbia may be raised by debris blockage of the streams in the study area. The hydraulic analyses for this study, however, are based only on the effect of unobstructed flow.
This Countywide FIS Analysis Cross section geometries were obtained from a combination of terrain data and field surveys. Bridges and culverts located within the detailed study limits were field surveyed to obtain elevation data and structural geometry. Downstream boundary conditions for the hydraulic models were set to normal depth using a starting slope calculated from values taken from topographic data, or where applicable, derived from the water-surface elevations. Water-surface profiles were computed through the use of the USACE HEC-RAS version 3.1.3 computer program (USACE, 2003). The model was run for the 1-and 0.2-percent annual chance storms for the detailed and the 1-percent annual chance storm for approximate studies. Channel roughness factors (Manning’s “n” values) used in the hydraulic computations for both channels and overbank areas were based on recent digital orthophotography and field investigations. Table 3, “Summary of Roughness Coefficients”, shows the range of the channel and overbank roughness factors used in the computations for all of the streams studied by detailed methods.
9
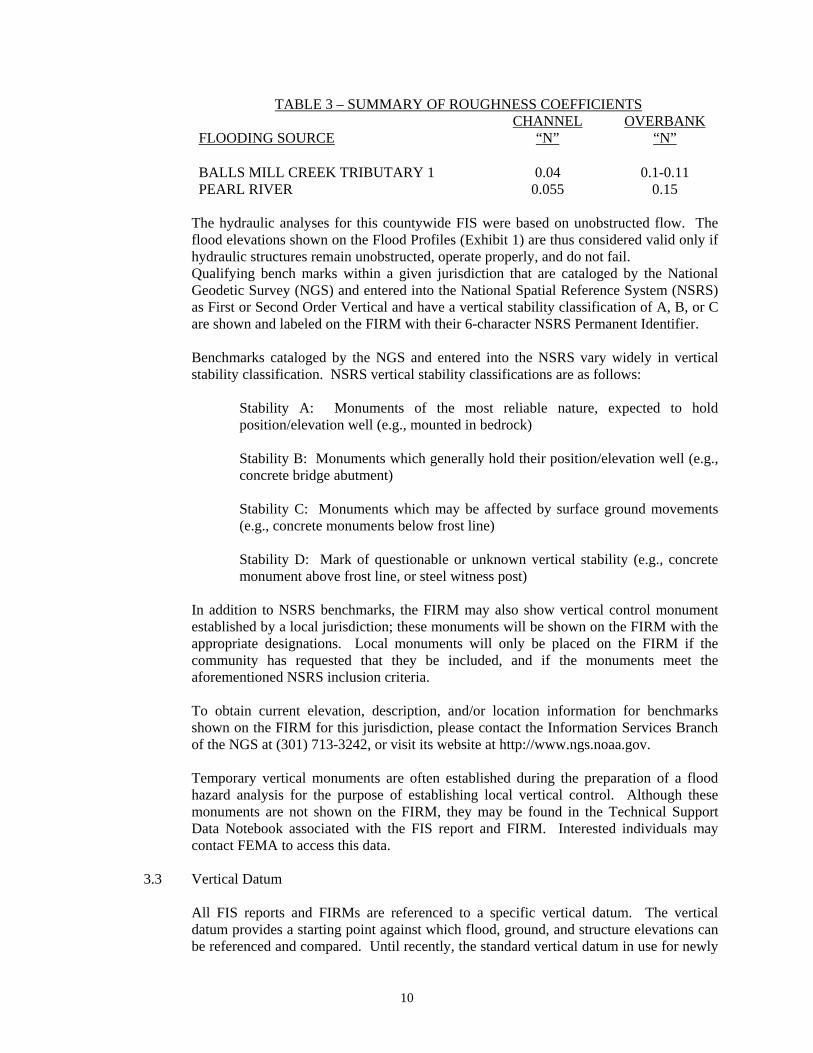
TABLE 3 – SUMMARY OF ROUGHNESS COEFFICIENTS FLOODING SOURCE
CHANNEL “N”
OVERBANK “N”
BALLS MILL CREEK TRIBUTARY 1 0.04 0.1-0.11 PEARL RIVER 0.055 0.15
The hydraulic analyses for this countywide FIS were based on unobstructed flow. The flood elevations shown on the Flood Profiles (Exhibit 1) are thus considered valid only if hydraulic structures remain unobstructed, operate properly, and do not fail. Qualifying bench marks within a given jurisdiction that are cataloged by the National Geodetic Survey (NGS) and entered into the National Spatial Reference System (NSRS) as First or Second Order Vertical and have a vertical stability classification of A, B, or C are shown and labeled on the FIRM with their 6-character NSRS Permanent Identifier. Benchmarks cataloged by the NGS and entered into the NSRS vary widely in vertical stability classification. NSRS vertical stability classifications are as follows:
Stability A: Monuments of the most reliable nature, expected to hold position/elevation well (e.g., mounted in bedrock)
Stability B: Monuments which generally hold their position/elevation well (e.g., concrete bridge abutment)
Stability C: Monuments which may be affected by surface ground movements (e.g., concrete monuments below frost line)
Stability D: Mark of questionable or unknown vertical stability (e.g., concrete monument above frost line, or steel witness post)
In addition to NSRS benchmarks, the FIRM may also show vertical control monument established by a local jurisdiction; these monuments will be shown on the FIRM with the appropriate designations. Local monuments will only be placed on the FIRM if the community has requested that they be included, and if the monuments meet the aforementioned NSRS inclusion criteria. To obtain current elevation, description, and/or location information for benchmarks shown on the FIRM for this jurisdiction, please contact the Information Services Branch of the NGS at (301) 713-3242, or visit its website at http://www.ngs.noaa.gov. Temporary vertical monuments are often established during the preparation of a flood hazard analysis for the purpose of establishing local vertical control. Although these monuments are not shown on the FIRM, they may be found in the Technical Support Data Notebook associated with the FIS report and FIRM. Interested individuals may contact FEMA to access this data.
3.3 Vertical Datum
All FIS reports and FIRMs are referenced to a specific vertical datum. The vertical datum provides a starting point against which flood, ground, and structure elevations can be referenced and compared. Until recently, the standard vertical datum in use for newly
10
created or revised FIS reports and FIRMs was the National Geodetic Vertical Datum of 1929 (NGVD29). With the finalization of the North American Vertical Datum of 1988 (NAVD88), many FIS reports and FIRMs are being prepared using NAVD88 as the referenced vertical datum. All flood elevations shown in this FIS report and on the FIRM are referenced to NAVD88. Structure and ground elevations in the community must, therefore, be referenced to NAVD88. It is important to note that adjacent communities may be referenced to NGVD29. This may result in differences in Base Flood Elevations (BFEs) across the corporate limits between the communities. The elevations shown in the FIS report and on the FIRM for Marion County are referenced to NAVD88.
Ground, structure, and flood elevations may be compared and/or referenced to NGVD29 by applying a conversion factor. To convert elevations from NAVD88 to NGVD29, add 0.10 feet to the NAVD88 elevation. The 0.10 feet value is an average for the entire county. The adjustment value was determined using the USACE Corpscon 6.0.1 computer program (USACE, 2004) and topographic maps (U.S. Department of the Interior, 1972). The BFE’s shown on the FIRM represent whole-foot rounded values. For example, a BFE of 12.4 feet will appear as 12 feet on the FIRM, and 12.6 feet as 13 feet. Users who wish to convert the elevations in this FIS report to NGVD29 should apply the stated conversion factor to elevations shown on the Flood Profiles and supporting data tables in the FIS report, which are shown at a minimum to the nearest 0.1-foot. For more information regarding conversion between the NGVD and the NAVD, see the FEMA publication entitled Converting the National Flood Insurance Program to the North American Vertical Datum of 1988 or contact the Vertical Network Branch, National Geodetic Survey, Coast and Geodetic Survey, National Oceanic and Atmospheric Administration, Rockville, Maryland 20910 (Internet address http://www.ngs.noaa.gov).
4.0 FLOODPLAIN MANAGEMENT APPLICATIONS
The NFIP encourages State and local governments to adopt sound floodplain management programs. Therefore, each FIS provides 1-percent-annual-chance flood elevations and delineations of the 1- and 0.2-percent-annual-chance floodplain boundaries and 1-percent-annual-chance floodway to assist communities in developing floodplain management measures. This information is presented on the FIRM and in many components of the FIS report, including Flood Profiles, Floodway Data Table and Summary of Stillwater Elevations Table. Users should reference the data presented in the FIS report as well as additional information that may be available at the local map repository before making flood elevation and/or floodplain boundary determinations. 4.1 Floodplain Boundaries
To provide a national standard without regional discrimination, the 1-percent-annual-chance flood has been adopted by FEMA as the base flood for floodplain management purposes. The 0.2-percent-annual-chance flood is employed to indicate additional areas of flood risk in the community. For each stream studied by
11
detailed methods, the 1- and 0.2-annual-chance floodplain boundaries have been delineated using the flood elevations determined at each cross section. The 1- and 0.2-percent-annual-chance floodplain boundaries are shown on the FIRM (Exhibit 2), On this map, the 1-percent-annual-chance floodplain boundary corresponds to the boundary of the areas of special flood hazards (Zones A and AE), and the 0.2-percent-annual-chance floodplain boundary corresponds to the boundary of areas of moderate flood hazards. In cases where the 1- and 0.2-percent-annual-chance floodplain boundaries are close together, only the 1-percent-annual-chance floodplain boundary has been shown. Small areas within the floodplain boundaries may lie above the flood elevations but cannot be shown due to limitations of the map scale and/or lack of detailed topographic data. For the streams studied by limited detailed and approximate methods, only the 1-percent-annual-chance floodplain boundary is shown on the FIRM (Exhibit 2). Floodplain boundaries for these streams, as well as those streams that have been previously studied by detailed methods, were generated using USGS 10-meter Digital Elevation Models (USGS), then refined using detailed hydrographic data (Dept. of Interior, 1972).
4.2 Floodways
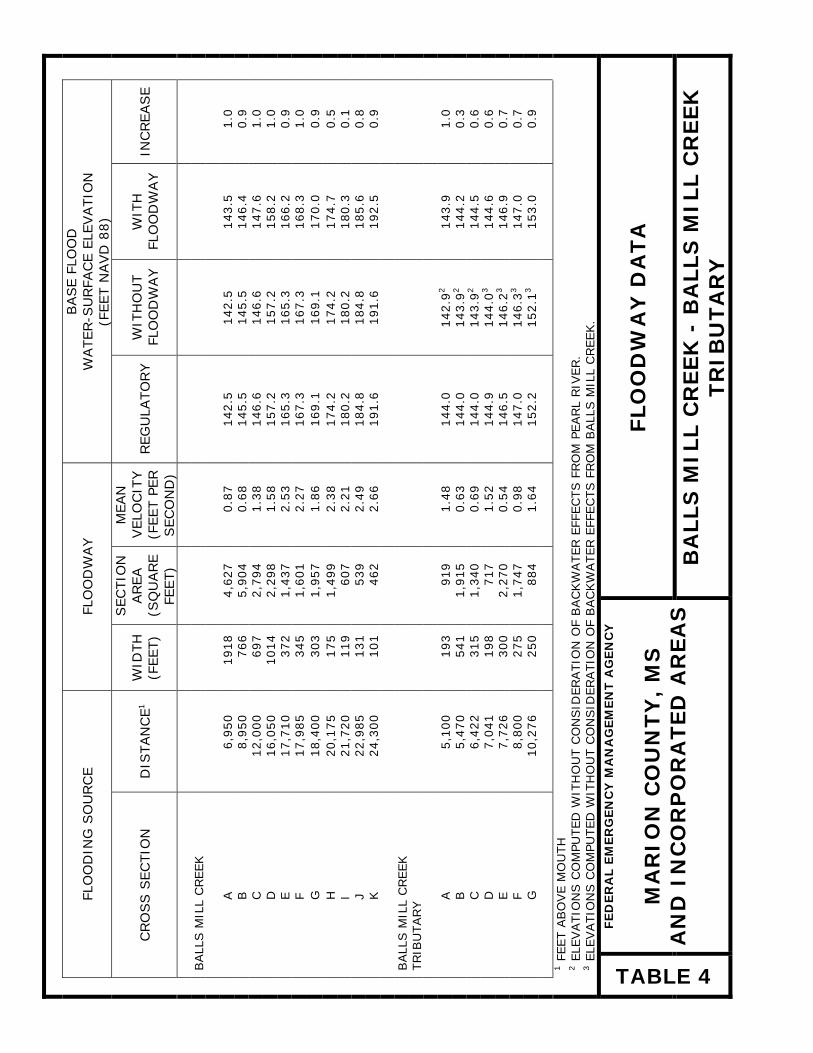
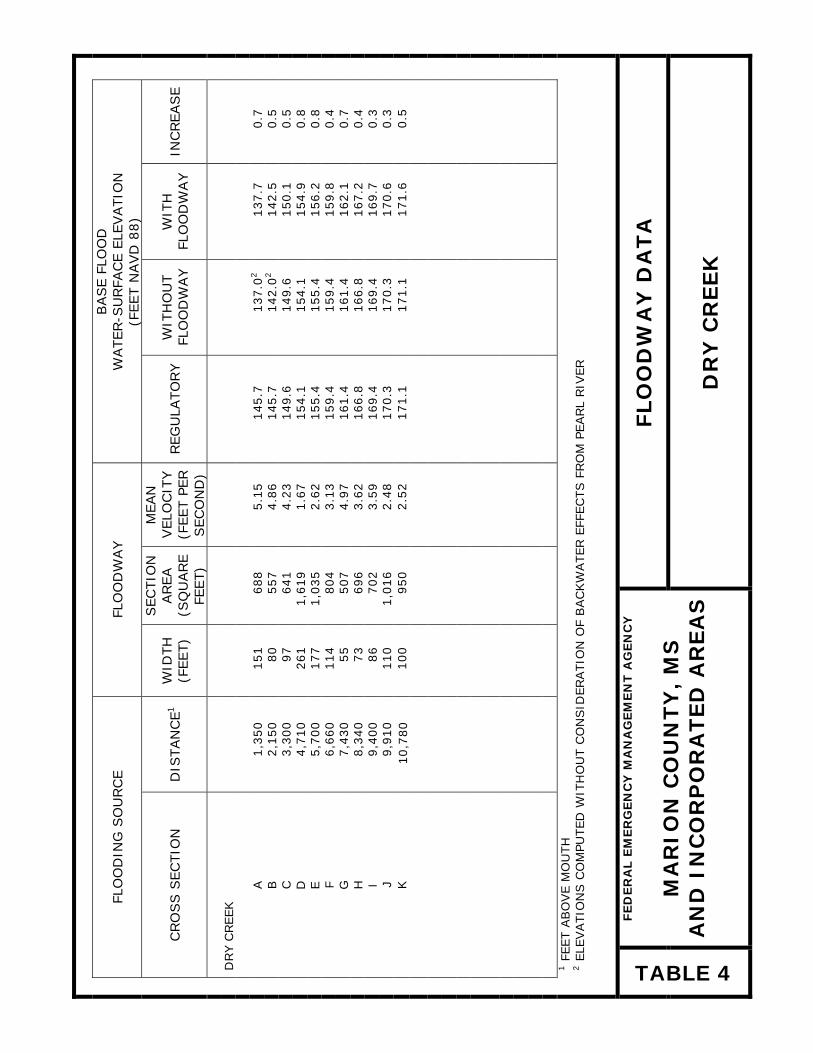
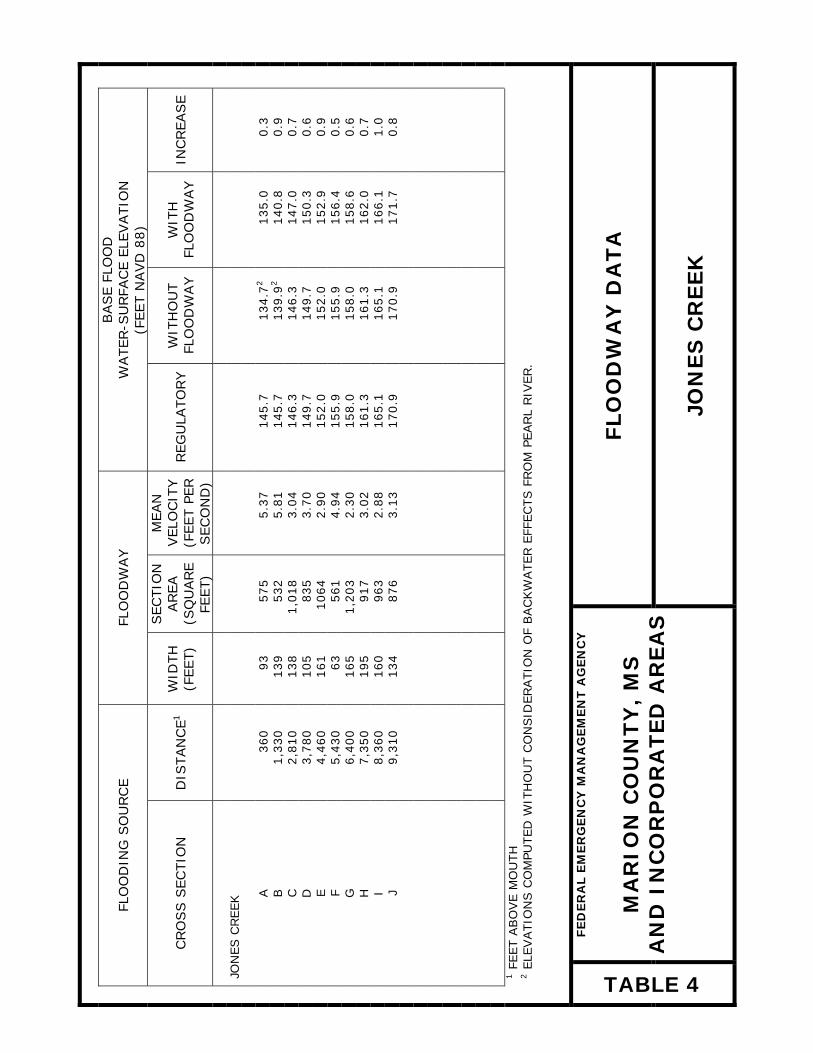
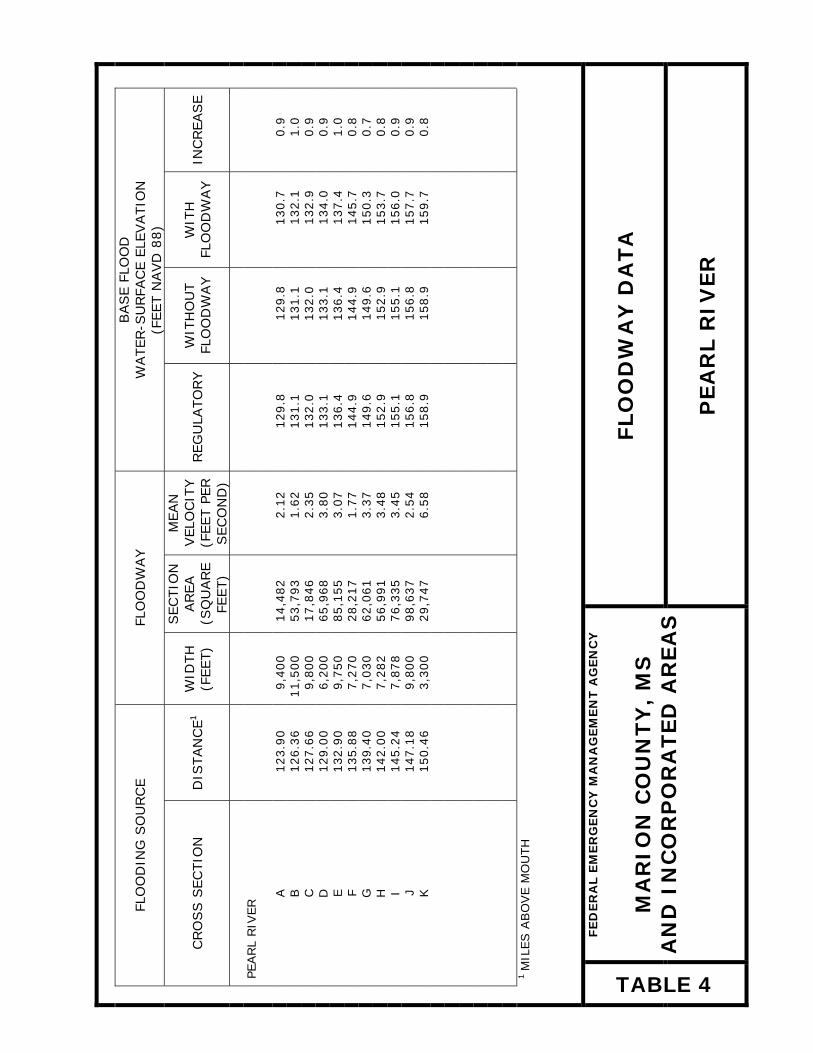
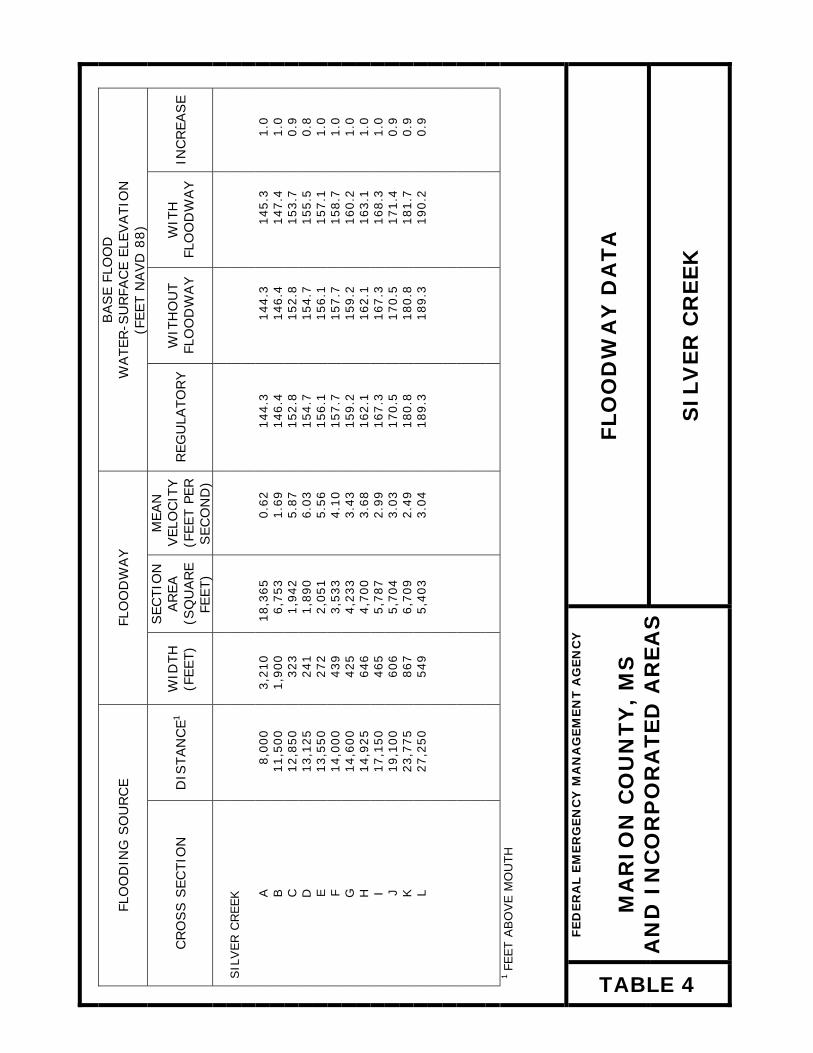
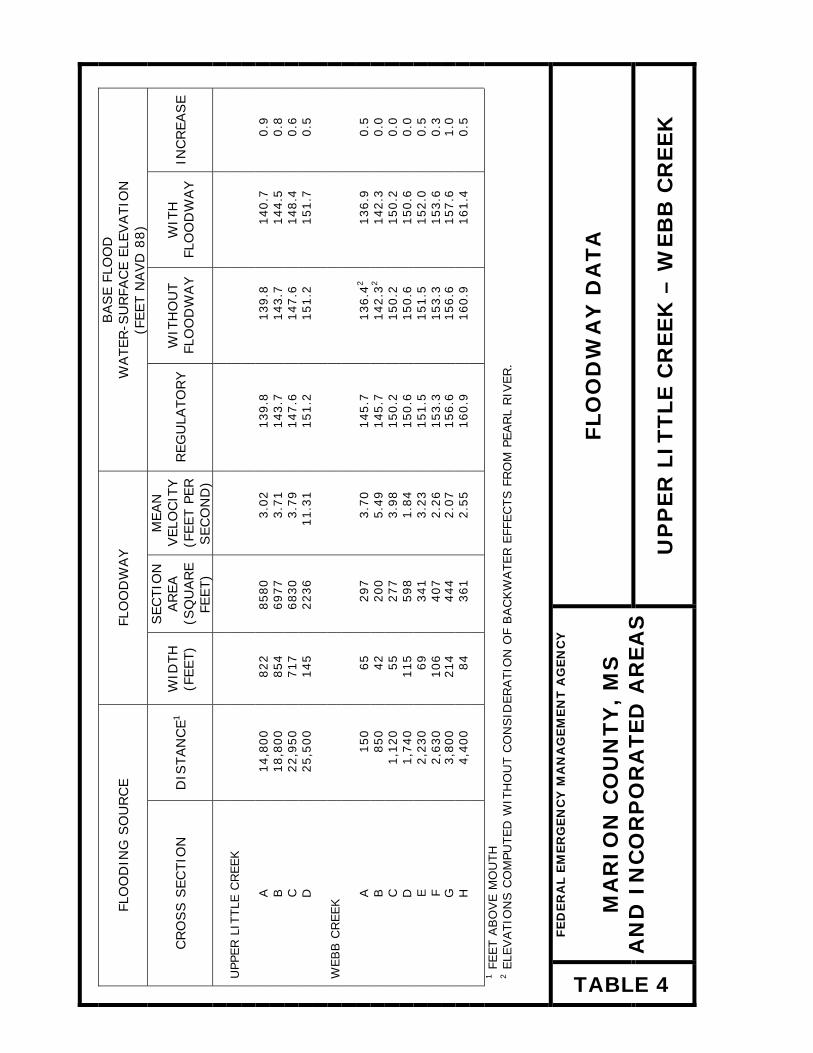
Encroachment on floodplains, such as structures and fill, reduces flood-carrying capacity, increases flood heights and velocities, and increases flood hazards in areas beyond the encroachment itself. One aspect of floodplain management involves balancing the economic gain from floodplain development against the resulting increase in flood hazard. For purposes of the NFIP, a floodway is used as a tool to assist local communities in this aspect of floodplain management. Under this concept, the area of the 1-percent-annual-chance floodplain is divided into a floodway and a floodway fringe. The floodway is the channel of a stream, plus any adjacent floodplain areas, that must be kept free of encroachment so that the 1-percent-annual-chance flood can be carried without substantial increases in flood heights. Minimum Federal standards limit such increases to 1.0 foot, provided that hazardous velocities are not produced. The floodways in this study are presented to local agencies as minimum standards that can be adopted directly or that can be used as a basis for additional floodway studies.
The floodway presented in this FIS report and on the FIRM was computed for certain stream segments on the basis of equal-conveyance reduction from each side of the floodplain. Floodway widths were computed at cross sections. Between cross sections, the floodway boundaries were interpolated. The results of the floodway computations have been tabulated for selected cross sections of detailed study streams (Table 4). For detailed study streams, in cases where the floodway and 1-percent-annual-chance floodplain boundaries are either close together or collinear, only the floodway boundary is shown. Near the mouths of streams studied in detail, floodway computations are made without regard to flood elevations on the receiving water body. Therefore, “Without Floodway” elevations presented in Table 4, “Floodway Data,” for certain downstream cross sections are lower than the regulatory flood elevations in that area, which must take into account the 1-percent-annual-chance flooding due to backwater from other sources.
12
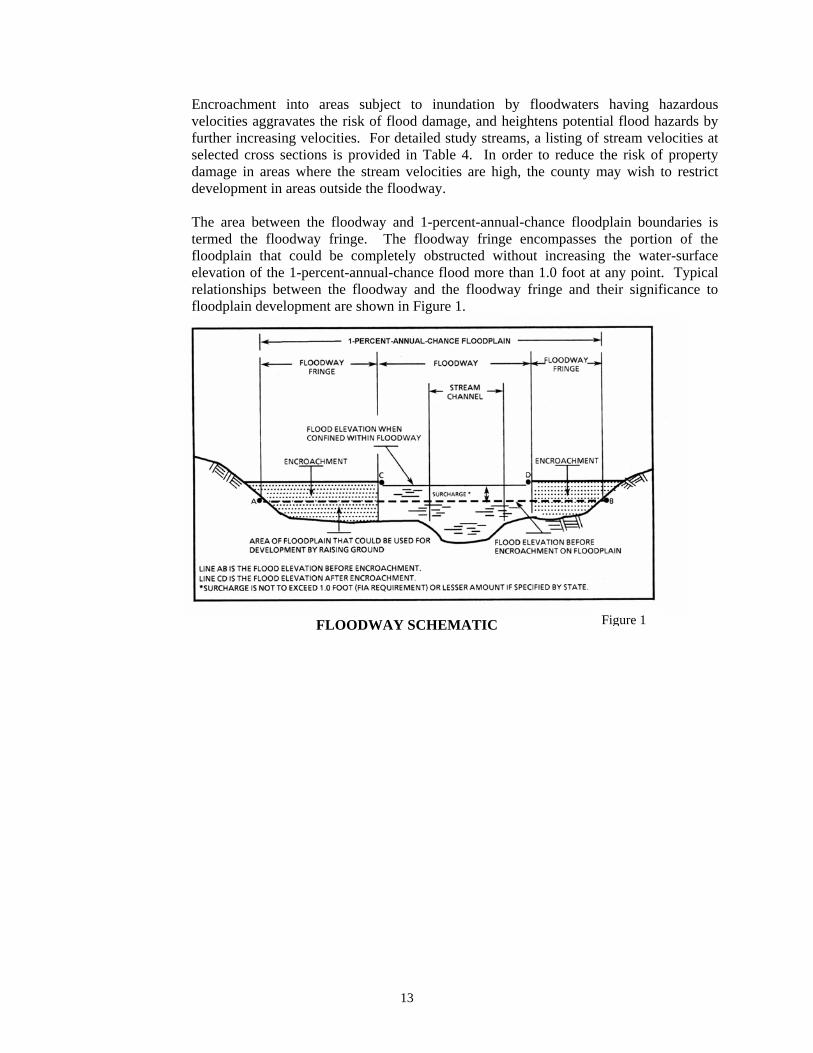
Encroachment into areas subject to inundation by floodwaters having hazardous velocities aggravates the risk of flood damage, and heightens potential flood hazards by further increasing velocities. For detailed study streams, a listing of stream velocities at selected cross sections is provided in Table 4. In order to reduce the risk of property damage in areas where the stream velocities are high, the county may wish to restrict development in areas outside the floodway.
The area between the floodway and 1-percent-annual-chance floodplain boundaries is termed the floodway fringe. The floodway fringe encompasses the portion of the floodplain that could be completely obstructed without increasing the water-surface elevation of the 1-percent-annual-chance flood more than 1.0 foot at any point. Typical relationships between the floodway and the floodway fringe and their significance to floodplain development are shown in Figure 1.
Figure 1 FLOODWAY SCHEMATIC
13
FL
OO
DIN
G S
OU
RCE
FLO
OD
WAY
BASE F
LOO
D
WATER-S
URFA
CE E
LEVATIO
N
(FEET N
AVD
88)
CRO
SS S
ECTIO
N
DIS
TAN
CE
1
WID
TH
(F
EET)
SECTIO
N
AREA
(SQ
UARE
FEET)
MEAN
VELO
CIT
Y
(FEET P
ER
SECO
ND
)
REG
ULA
TO
RY
WIT
HO
UT
FLO
OD
WAY
WIT
H
FLO
OD
WAY
INCREASE
BALL
S M
ILL
CREEK
A
6,9
50
1918
4,6
27
0.8
7
142.5
142.5
143.5
1.0
B
8,9
50
766
5,9
04
0.6
8
145.5
145.5
146.4
0.9
C
12,0
00
697
2,7
94
1.3
8
146.6
146.6
147.6
1.0
D
16,0
50
1014
2,2
98
1.5
8
157.2
157.2
158.2
1.0
E
17,7
10
372
1,4
37
2.5
3
165.3
165.3
166.2
0.9
F
17,9
85
345
1,6
01
2.2
7
167.3
167.3
168.3
1.0
G
18,4
00
303
1,9
57
1.8
6
169.1
169.1
170.0
0.9
H
20,1
75
175
1,4
99
2.3
8
174.2
174.2
174.7
0.5
I
21,7
20
119
607
2.2
1
180.2
180.2
180.3
0.1
J
22,9
85
131
539
2.4
9
184.8
184.8
185.6
0.8
K
24,3
00
101
462
2.6
6
191.6
191.6
192.5
0.9
BALL
S M
ILL
CREEK
TRIB
UTARY
A
5,1
00
193
919
1.4
8
144.0
142.9
2
143.9
1.0
B
5,4
70
541
1,9
15
0.6
3
144.0
143.9
2
144.2
0.3
C
6,4
22
315
1,3
40
0.6
9
144.0
143.9
2
144.5
0.6
D
7,0
41
198
717
1.5
2
144.9
144.0
3
144.6
0.6
E
7,7
26
300
2,2
70
0.5
4
146.5
146.2
3
146.9
0.7
F
8,8
00
275
1,7
47
0.9
8
147.0
146.3
3
147.0
0.7
G
10,2
76
250
884
1.6
4
152.2
152.1
3
153.0
0.9
1 F
EET A
BO
VE M
OU
TH
2 E
LEVATIO
NS C
OM
PUTED
WIT
HO
UT C
ON
SID
ERATIO
N O
F BACKW
ATER E
FFECTS F
RO
M P
EARL
RIV
ER.
3 E
LEVATIO
NS C
OM
PUTED
WIT
HO
UT C
ON
SID
ERATIO
N O
F BACKW
ATER E
FFECTS F
RO
M B
ALL
S M
ILL
CREEK.
FLO
OD
WA
Y D
ATA
TABLE 4
FED
ER
AL E
MER
GEN
CY
MA
NA
GEM
EN
T A
GEN
CY
M
AR
ION
CO
UN
TY
, M
S
AN
D I
NC
OR
PO
RA
TED
AR
EA
S
BA
LLS
MIL
L C
REEK
- B
ALLS
MIL
L C
REEK
TR
IBU
TA
RY
FL
OO
DIN
G S
OU
RCE
FLO
OD
WAY
BASE F
LOO
D
WATER-S
URFA
CE E
LEVATIO
N
(FEET N
AVD
88)
CRO
SS S
ECTIO
N
DIS
TAN
CE
1
WID
TH
(F
EET)
SECTIO
N
AREA
(SQ
UARE
FEET)
MEAN
VELO
CIT
Y
(FEET P
ER
SECO
ND
)
REG
ULA
TO
RY
WIT
HO
UT
FLO
OD
WAY
WIT
H
FLO
OD
WAY
INCREASE
DRY C
REEK
A
1,3
50
151
688
5.1
5
145.7
137.0
2
137.7
0.7
B
2,1
50
80
557
4.8
6
145.7
142.0
2
142.5
0.5
C
3,3
00
97
641
4.2
3
149.6
149.6
150.1
0.5
D
4,7
10
261
1,6
19
1.6
7
154.1
154.1
154.9
0.8
E
5,7
00
177
1,0
35
2.6
2
155.4
155.4
156.2
0.8
F
6,6
60
114
804
3.1
3
159.4
159.4
159.8
0.4
G
7,4
30
55
507
4.9
7
161.4
161.4
162.1
0.7
H
8,3
40
73
696
3.6
2
166.8
166.8
167.2
0.4
I
9,4
00
86
702
3.5
9
169.4
169.4
169.7
0.3
J
9,9
10
110
1,0
16
2.4
8
170.3
170.3
170.6
0.3
K
10,7
80
100
950
2.5
2
171.1
171.1
171.6
0.5
1 F
EET A
BO
VE M
OU
TH
2 E
LEVATIO
NS C
OM
PUTED
WIT
HO
UT C
ON
SID
ERATIO
N O
F BACKW
ATER E
FFECTS F
RO
M P
EARL
RIV
ER
FLO
OD
WA
Y D
ATA
TABLE 4
FED
ER
AL E
MER
GEN
CY
MA
NA
GEM
EN
T A
GEN
CY
M
AR
ION
CO
UN
TY
, M
S
AN
D I
NC
OR
PO
RA
TED
AR
EA
S
DR
Y C
REEK
FL
OO
DIN
G S
OU
RCE
FLO
OD
WAY
BASE F
LOO
D
WATER-S
URFA
CE E
LEVATIO
N
(FEET N
AVD
88)
CRO
SS S
ECTIO
N
DIS
TAN
CE
1
WID
TH
(F
EET)
SECTIO
N
AREA
(SQ
UARE
FEET)
MEAN
VELO
CIT
Y
(FEET P
ER
SECO
ND
)
REG
ULA
TO
RY
WIT
HO
UT
FLO
OD
WAY
WIT
H
FLO
OD
WAY
INCREASE
JON
ES C
REEK
A
360
93
575
5.3
7
145.7
134.7
2
135.0
0.3
B
1,3
30
139
532
5.8
1
145.7
139.9
2
140.8
0.9
C
2,8
10
138
1,0
18
3.0
4
146.3
146.3
147.0
0.7
D
3,7
80
105
835
3.7
0
149.7
149.7
150.3
0.6
E
4,4
60
161
1064
2.9
0
152.0
152.0
152.9
0.9
F
5,4
30
63
561
4.9
4
155.9
155.9
156.4
0.5
G
6,4
00
165
1,2
03
2.3
0
158.0
158.0
158.6
0.6
H
7,3
50
195
917
3.0
2
161.3
161.3
162.0
0.7
I
8,3
60
160
963
2.8
8
165.1
165.1
166.1
1.0
J
9,3
10
134
876
3.1
3
170.9
170.9
171.7
0.8
1 F
EET A
BO
VE M
OU
TH
2 E
LEVATIO
NS C
OM
PUTED
WIT
HO
UT C
ON
SID
ERATIO
N O
F BACKW
ATER E
FFECTS F
RO
M P
EARL
RIV
ER.
FLO
OD
WA
Y D
ATA
TABLE 4
FED
ER
AL E
MER
GEN
CY
MA
NA
GEM
EN
T A
GEN
CY
MA
RIO
N C
OU
NTY
, M
S
AN
D I
NC
OR
PO
RA
TED
AR
EA
S
JON
ES
CR
EEK
FLO
OD
ING
SO
URCE
FLO
OD
WAY
BASE F
LOO
D
WATER-S
URFA
CE E
LEVATIO
N
(FEET N
AVD
88)
CRO
SS S
ECTIO
N
DIS
TAN
CE
1
WID
TH
(F
EET)
SECTIO
N
AREA
(SQ
UARE
FEET)
MEAN
VELO
CIT
Y
(FEET P
ER
SECO
ND
)
REG
ULA
TO
RY
WIT
HO
UT
FLO
OD
WAY
WIT
H
FLO
OD
WAY
INCREASE
PEARL
RIV
ER
A
123.9
0
9,4
00
14,4
82
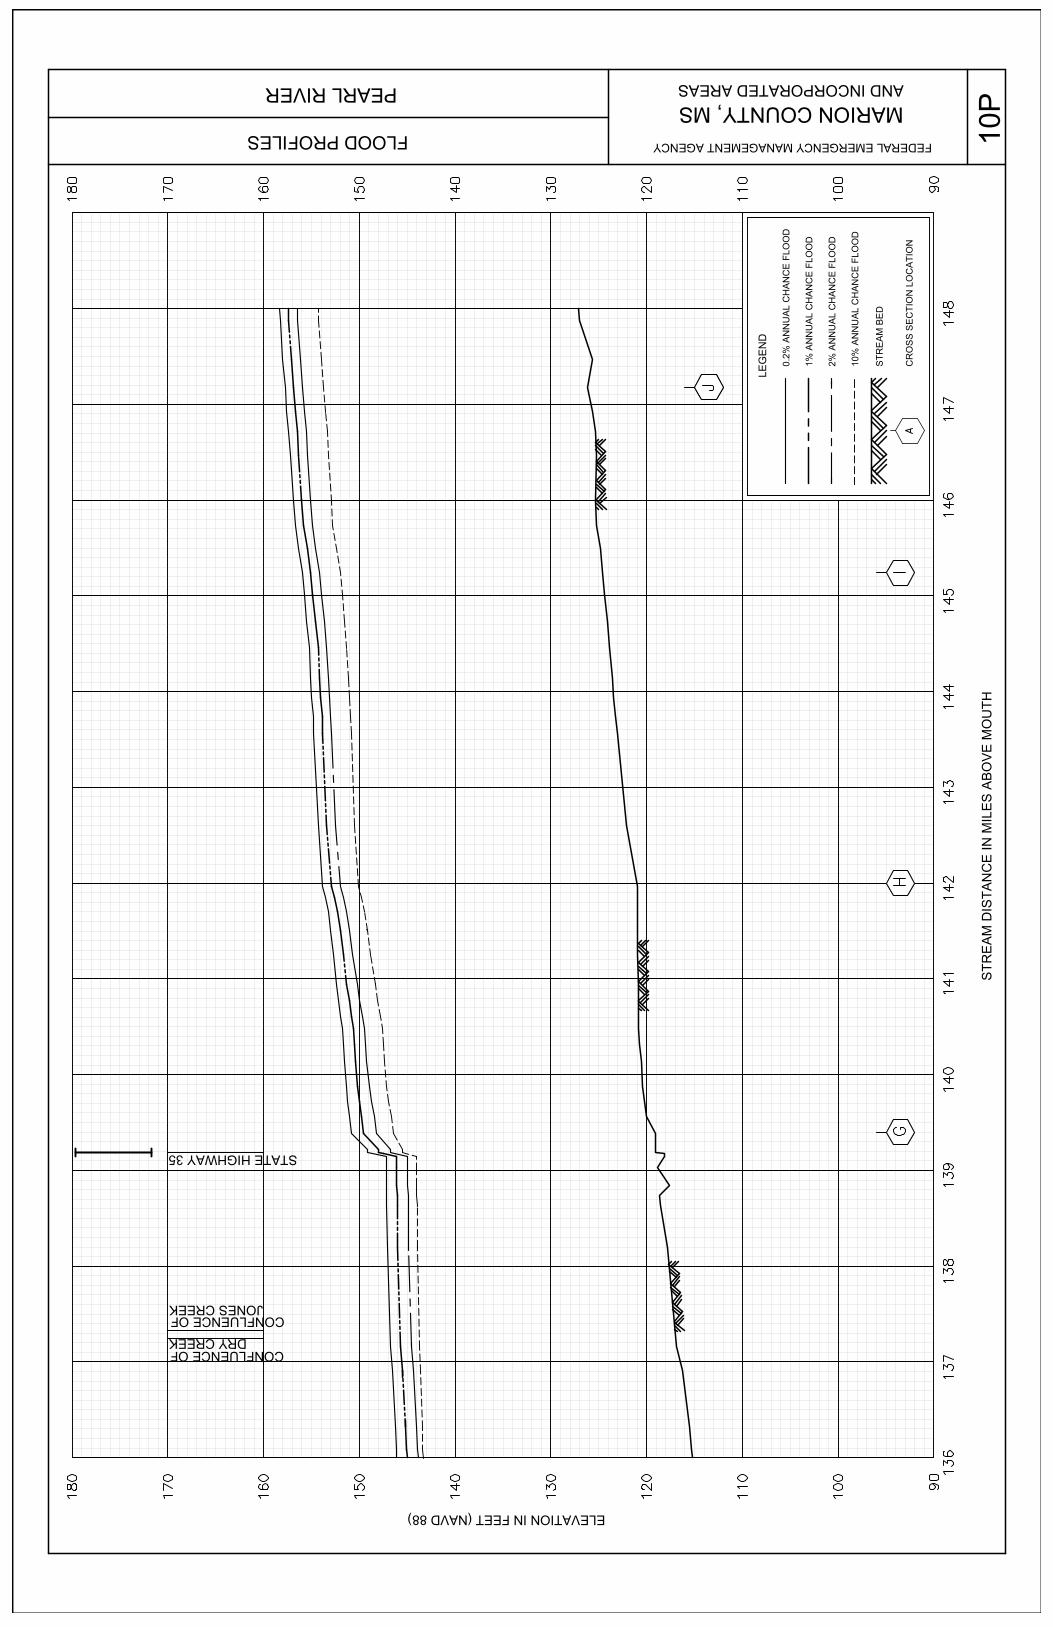
2.1
2
129.8
129.8
130.7
0.9
B
126.3
6
11,5
00
53,7
93
1.6
2
131.1
131.1
132.1
1.0
C
127.6
6
9,8
00
17,8
46
2.3
5
132.0
132.0
132.9
0.9
D
129.0
0
6,2
00
65,9
68
3.8
0
133.1
133.1
134.0
0.9
E
132.9
0
9,7
50
85,1
55
3.0
7
136.4
136.4
137.4
1.0
F
135.8
8
7,2
70
28,2
17
1.7
7
144.9
144.9
145.7
0.8
G
139.4
0
7,0
30
62,0
61
3.3
7
149.6
149.6
150.3
0.7
H
142.0
0
7,2
82
56,9
91
3.4
8
152.9
152.9
153.7
0.8
I
145.2
4
7,8
78
76,3
35
3.4
5
155.1
155.1
156.0
0.9
J
147.1
8
9,8
00
98,6
37
2.5
4
156.8
156.8
157.7
0.9
K
150.4
6
3,3
00
29,7
47
6.5
8
158.9
158.9
159.7
0.8
1 M
ILES A
BO
VE M
OU
TH
FLO
OD
WA
Y D
ATA
TABLE 4
FED
ER
AL E
MER
GEN
CY
MA
NA
GEM
EN
T A
GEN
CY
MA
RIO
N C
OU
NTY
, M
S
AN
D I
NC
OR
PO
RA
TED
AR
EA
S
PEA
RL R
IVER
FL
OO
DIN
G S
OU
RCE
FLO
OD
WAY
BASE F
LOO
D
WATER-S
URFA
CE E
LEVATIO
N
(FEET N
AVD
88)
CRO
SS S
ECTIO
N
DIS
TAN
CE
1
WID
TH
(F
EET)
SECTIO
N
AREA
(SQ
UARE
FEET)
MEAN
VELO
CIT
Y
(FEET P
ER
SECO
ND
)
REG
ULA
TO
RY
WIT
HO
UT
FLO
OD
WAY
WIT
H
FLO
OD
WAY
INCREASE
SIL
VER C
REEK
A
8,0
00
3,2
10
18,3
65
0.6
2
144.3
144.3
145.3
1.0
B
11,5
00
1,9
00
6,7
53
1.6
9
146.4
146.4
147.4
1.0
C
12,8
50
323
1,9
42
5.8
7
152.8
152.8
153.7
0.9
D
13,1
25
241
1,8
90
6.0
3
154.7
154.7
155.5
0.8
E
13,5
50
272
2,0
51
5.5
6
156.1
156.1
157.1
1.0
F
14,0
00
439
3,5
33
4.1
0
157.7
157.7
158.7
1.0
G
14,6
00
425
4,2
33
3.4
3
159.2
159.2
160.2
1.0
H
14,9
25
646
4,7
00
3.6
8
162.1
162.1
163.1
1.0
I
17,1
50
465
5,7
87
2.9
9
167.3
167.3
168.3
1.0
J
19,1
00
606
5,7
04
3.0
3
170.5
170.5
171.4
0.9
K
23,7
75
867
6,7
09
2.4
9
180.8
180.8
181.7
0.9
L
27,2
50
549
5,4
03
3.0
4
189.3
189.3
190.2
0.9
1 F
EET A
BO
VE M
OU
TH
FLO
OD
WA
Y D
ATA
TABLE 4
FED
ER
AL E
MER
GEN
CY
MA
NA
GEM
EN
T A
GEN
CY
MA
RIO
N C
OU
NTY
, M
S
AN
D I
NC
OR
PO
RA
TED
AR
EA
S
SIL
VER
CR
EEK
FL
OO
DIN
G S
OU
RCE
FLO
OD
WAY
BASE F
LOO
D
WATER-S
URFA
CE E
LEVATIO
N
(FEET N
AVD
88)
CRO
SS S
ECTIO
N
DIS
TAN
CE
1
WID
TH
(F
EET)
SECTIO
N
AREA
(SQ
UARE
FEET)
MEAN
VELO
CIT
Y
(FEET P
ER
SECO
ND
)
REG
ULA
TO
RY
WIT
HO
UT
FLO
OD
WAY
WIT
H
FLO
OD
WAY
INCREASE
UPP
ER L
ITTLE
CREEK
A
14,8
00
822
8580
3.0
2
139.8
139.8
140.7
0.9
B
18,8
00
854
6977
3.7
1
143.7
143.7
144.5
0.8
C
22,9
50
717
6830
3.7
9
147.6
147.6
148.4
0.6
D
25,5
00
145
2236
11.3
1
151.2
151.2
151.7
0.5
WEBB C
REEK
A
150
65
297
3.7
0
145.7
136.4
2
136.9
0.5
B
850
42
200
5.4
9
145.7
142.3
2
142.3
0.0
C
1,1
20
55
277
3.9
8
150.2
150.2
150.2
0.0
D
1,7
40
115
598
1.8
4
150.6
150.6
150.6
0.0
E
2,2
30
69
341
3.2
3
151.5
151.5
152.0
0.5
F
2,6
30
106
407
2.2
6
153.3
153.3
153.6
0.3
G
3,8
00
214
444
2.0
7
156.6
156.6
157.6
1.0
H
4,4
00
84
361
2.5
5
160.9
160.9
161.4
0.5
1 F
EET A
BO
VE M
OU
TH
2 E
LEVATIO
NS C
OM
PUTED
WIT
HO
UT C
ON
SID
ERATIO
N O
F BACKW
ATER E
FFECTS F
RO
M P
EARL
RIV
ER.
FLO
OD
WA
Y D
ATA
TABLE 4
FED
ER
AL E
MER
GEN
CY
MA
NA
GEM
EN
T A
GEN
CY
MA
RIO
N C
OU
NTY
, M
S
AN
D I
NC
OR
PO
RA
TED
AR
EA
S
UP
PER
LIT
TLE C
REEK
– W
EB
B C
REEK
5.0 INSURANCE APPLICATION For flood insurance rating purposes, flood insurance zone designations are assigned to a community based on the results of the engineering analyses. These zones are as follows:
Zone A Zone A is the flood insurance risk zone that corresponds to the 1-percent annual chance floodplains that are determined in the FIS by approximate methods. Because detailed hydraulic analyses are not performed for such areas, no base (1-percent annual chance) flood elevations (BFEs), or base flood depths are shown within this zone. Zone AE Zone AE is the flood insurance risk zone that corresponds to the 1-percent annual chance floodplains that are determined in the FIS by detailed methods. In most instances, whole-foot BFEs derived from the detailed hydraulic analyses are shown at selected intervals within this zone.
Zone AH Zone AH is the flood insurance rate zone that corresponds to the areas of 1-percent annual chance shallow flooding (usually areas of ponding) where average depths are between 1 and 3 feet. Whole-foot base flood elevations derived from the detailed hydraulic analyses are shown at selected intervals within the zone. Zone AO Zone AO is the flood insurance rate zone that corresponds to the areas of 1-percent annual chance shallow flooding (usually sheet flow on sloping terrain) where the average depths are between 1 and 3 feet. Average whole-foot depths derived from the detailed hydraulic analyses are shown within the zone. Zone A99 Zone A99 is the flood insurance rate zone that corresponds to areas of the 1-percent floodplain that will be protected by a Federal flood protection system where construction has reached specified statutory milestones. No base flood elevations or depths are shown within this zone. Zone V Zone V is the flood insurance rate zone that corresponds to the 1-percent coastal floodplains that have additional hazards associated with storm waves. Because approximate hydraulic analyses are performed for such areas, no base flood elevations are shown within this zone. Zone VE Zone VE is the flood insurance rate zone that corresponds to the 1-percent coastal floodplains that have additional hazards associated with storm waves. Whole-foot base flood elevations derived from the detailed hydraulic analyses are shown at selected intervals within this zone.
20
21
Zone X Zone X is the flood insurance risk zone that corresponds to areas outside the 0.2-percent annual chance floodplain, areas within the 0.2-percent annual chance floodplain, areas of 1-percent annual chance flooding where average depths are less than 1 foot, areas of 1-percent annual chance flooding where the contributing drainage area is less than 1 square mile, and areas protected from the base flood by levees. No BFEs or depths are shown within this zone. Zone D Zone D is the flood insurance rate zone that corresponds to unstudied areas where flood hazards are undetermined, but possible.
6.0 FLOOD INSURANCE RATE MAP
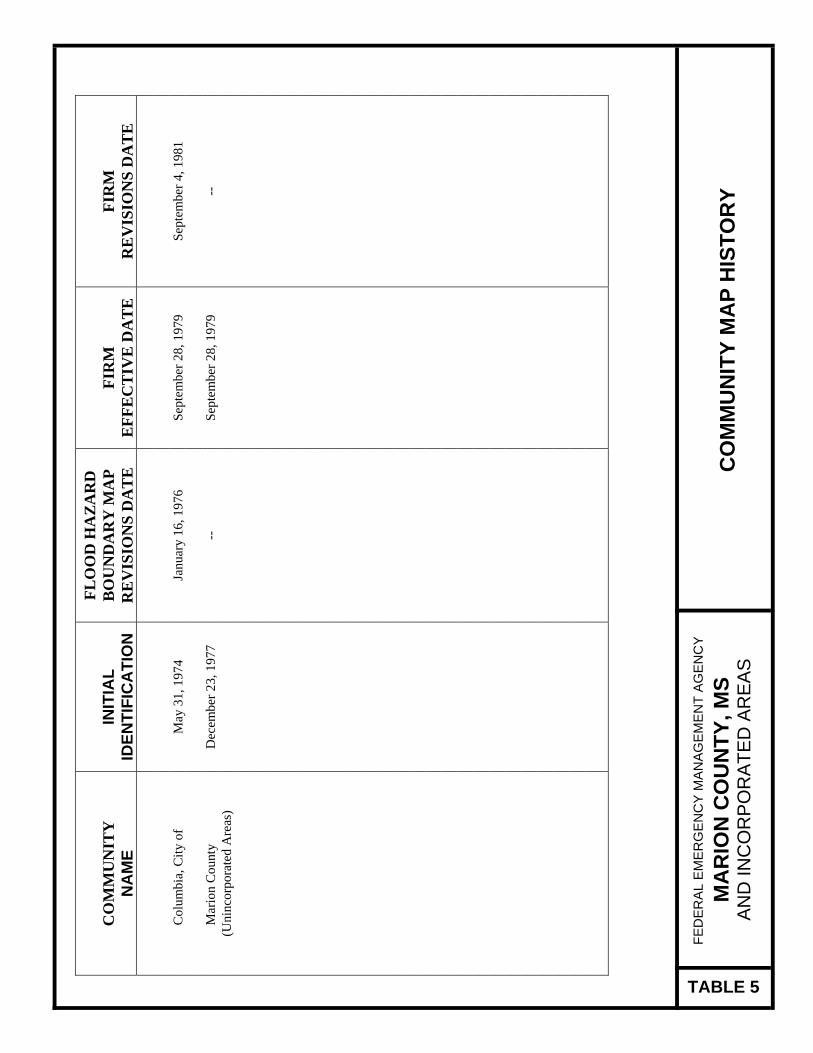
The FIRM is designed for flood insurance and floodplain management applications. For flood insurance applications, the map designates flood insurance risk zones as described in Section 5.0 and, in the 1-percent-annual-chance floodplains that were studied by detailed methods, shows selected whole-foot BFEs or average depths. Insurance agents use the zones and BFEs in conjunction with information on structures and their contents to assign premium rates for flood insurance policies. For floodplain management applications, the map shows by tints, screens, and symbols, the 1- and 0.2-percent-annual-chance floodplains, floodways, and the locations of selected cross sections used in the hydraulic analyses and floodway computations. The countywide FIRM presents flooding information for the entire geographic area of Marion County. Previously, FIRMs were prepared for each incorporated community and the unincorporated areas of the County identified as flood-prone. This countywide FIRM also includes flood-hazard information that was presented separately on Flood Boundary and Floodway Maps (FBFMs), where applicable. Historical data relating to the maps prepared for each community, up to and including this countywide FIS are presented in Table 5, “Community Map History.”
CO
MM
UN
ITY
N
AM
E IN
ITIA
L ID
ENTI
FIC
ATI
ON
FLO
OD
HA
ZAR
D
BO
UN
DA
RY
MA
P R
EV
ISIO
NS
DA
TE
FI
RM
E
FFE
CT
IVE
DA
TE
FI
RM
R
EV
ISIO
NS
DA
TE
C
olum
bia,
City
of
May
31,
197
4 Ja
nuar
y 16
, 197
6 Se
ptem
ber 2
8, 1
979
Sept
embe
r 4, 1
981
M
ario
n C
ount
y
Dec
embe
r 23,
197
7 --
Se
ptem
ber 2
8, 1
979
--
(Uni
ncor
pora
ted
Are
as)
TABLE 5
FED
ER
AL
EM
ER
GE
NC
Y M
AN
AG
EM
EN
T A
GE
NC
Y
MA
RIO
N C
OU
NTY
, MS
AN
D IN
CO
RP
OR
ATE
D A
RE
AS
CO
MM
UN
ITY
MA
P H
ISTO
RY
7.0 OTHER STUDIES Information pertaining to revised and unrevised flood hazards for each jurisdiction within Marion County has been compiled into this FIS. Therefore, this FIS supersedes all previously printed FIS reports, FIRMs, and/or FBFMs for all of the incorporated and unincorporated jurisdictions within Marion County.
8.0 LOCATION OF DATA
Information concerning the pertinent data used in the preparation of this study can be obtained by contacting Federal Insurance and Mitigation Division, FEMA Region IV, Koger-Center — Rutgers Building, 3003 Chamblee Tucker Road, Atlanta, GA 30341.
9.0 BIBLIOGRAPHY AND REFERENCES
National Weather Service (November, 2009). Website, Jackson, MS, monitoring station, http://www.srh.noaa.gov/jan/climate_connection.php
United States Water Resources Council, “Guidelines for Determining Flood Flow Frequency,”
Bulletin 17, 1976. U.S. Army Corps of Engineers, Hydrologic Engineering Center, HEC-2 Water Surface Profiles, Generalized Computer Program, Davis California, October 1973
U.S. Army Corps of Engineers, Hydrologic Engineering Center, HEC-2 Water Surface Profiles, Generalized Computer Program, Davis, California, May 1991 U.S. Army Corps of Engineers Hydrologic Engineering Center, HEC-2 Water Surface Profiles Generalized Computer Program, Davis, California, November 1976. U.S. Army Corps of Engineers (May 2003). Hydrologic Engineering Center, HEC-RAS River Analysis System, User’s Manual, version 3.1.3, Davis, California.
U.S. Army Corps of Engineers, Topographic Engineering Center, Corpscon Version 6.0.1,
Alexandria, Virginia, August 2004
U.S. Census Bureau (November 2009). Website–2008 Population Estimate. U.S. Census Bureau (November 2009). Website–2008 Economic Fact Sheet. U.S Department of the Interior, Geological Survey, 7.5 Minute Series Topographic Maps, Scale 1:24,000, Contour Interval 10 Feet: Brookhaven, Mississippi, 1972. U.S Department of the Interior, Geological Survey, Water Resources Division, An Approach to Estimating Flood Frequency for Urban Areas in Oklahoma, Oklahoma City, Oklahoma, July 1974. U.S Department of the Interior, Geological Survey, Flood Frequency of Mississippi Streams, B.E. Colson and J.W. Hudson, 1976.
23
24
U.S. Department of the Interior, Geological Survey, Flood Characteristics of Mississippi Streams, Water-Resources Investigations Report 91-4037, Jackson, MS, 1991. U.S. Department of the Interior, U.S. Geological Survey, Map of Flood Prone Areas, Columbia North, Columbia South, Morgantown, Mississippi, 1973.
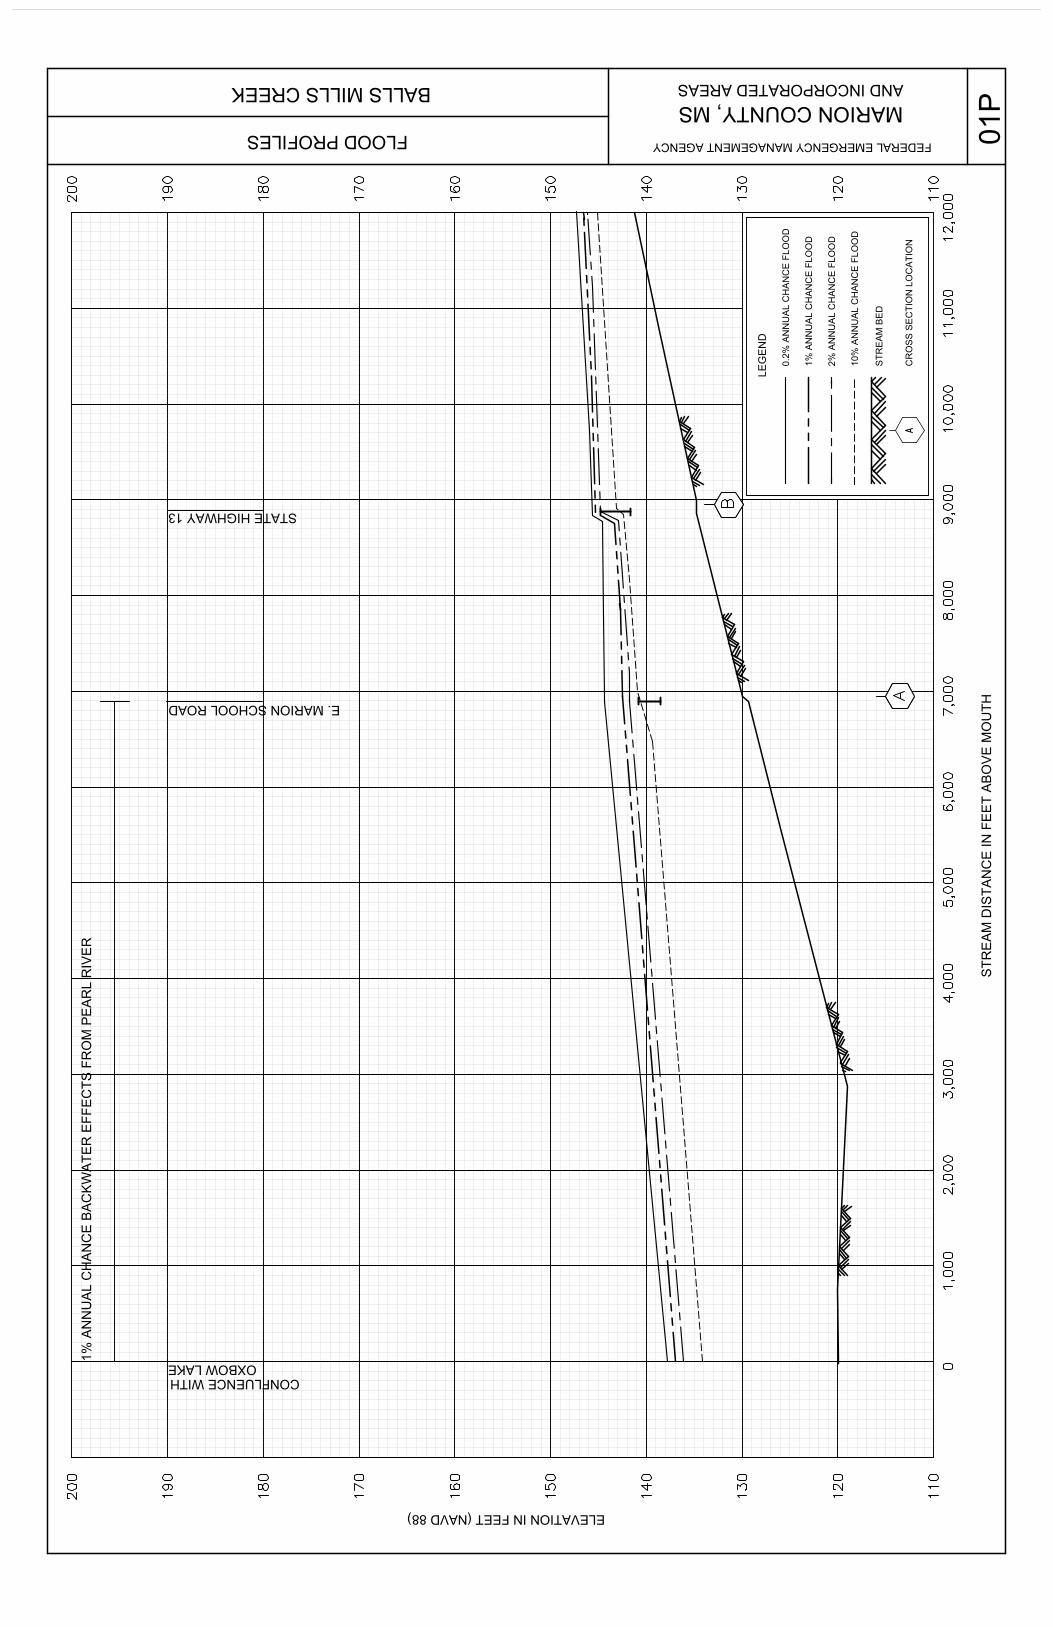
CONFLUENCE WITH OXBOW LAKE1%
AN
NU
AL
CH
AN
CE
BA
CK
WA
TER
EFF
EC
TS F
RO
M P
EA
RL
RIV
ER
ELEVATION IN FEET (NAVD 88)
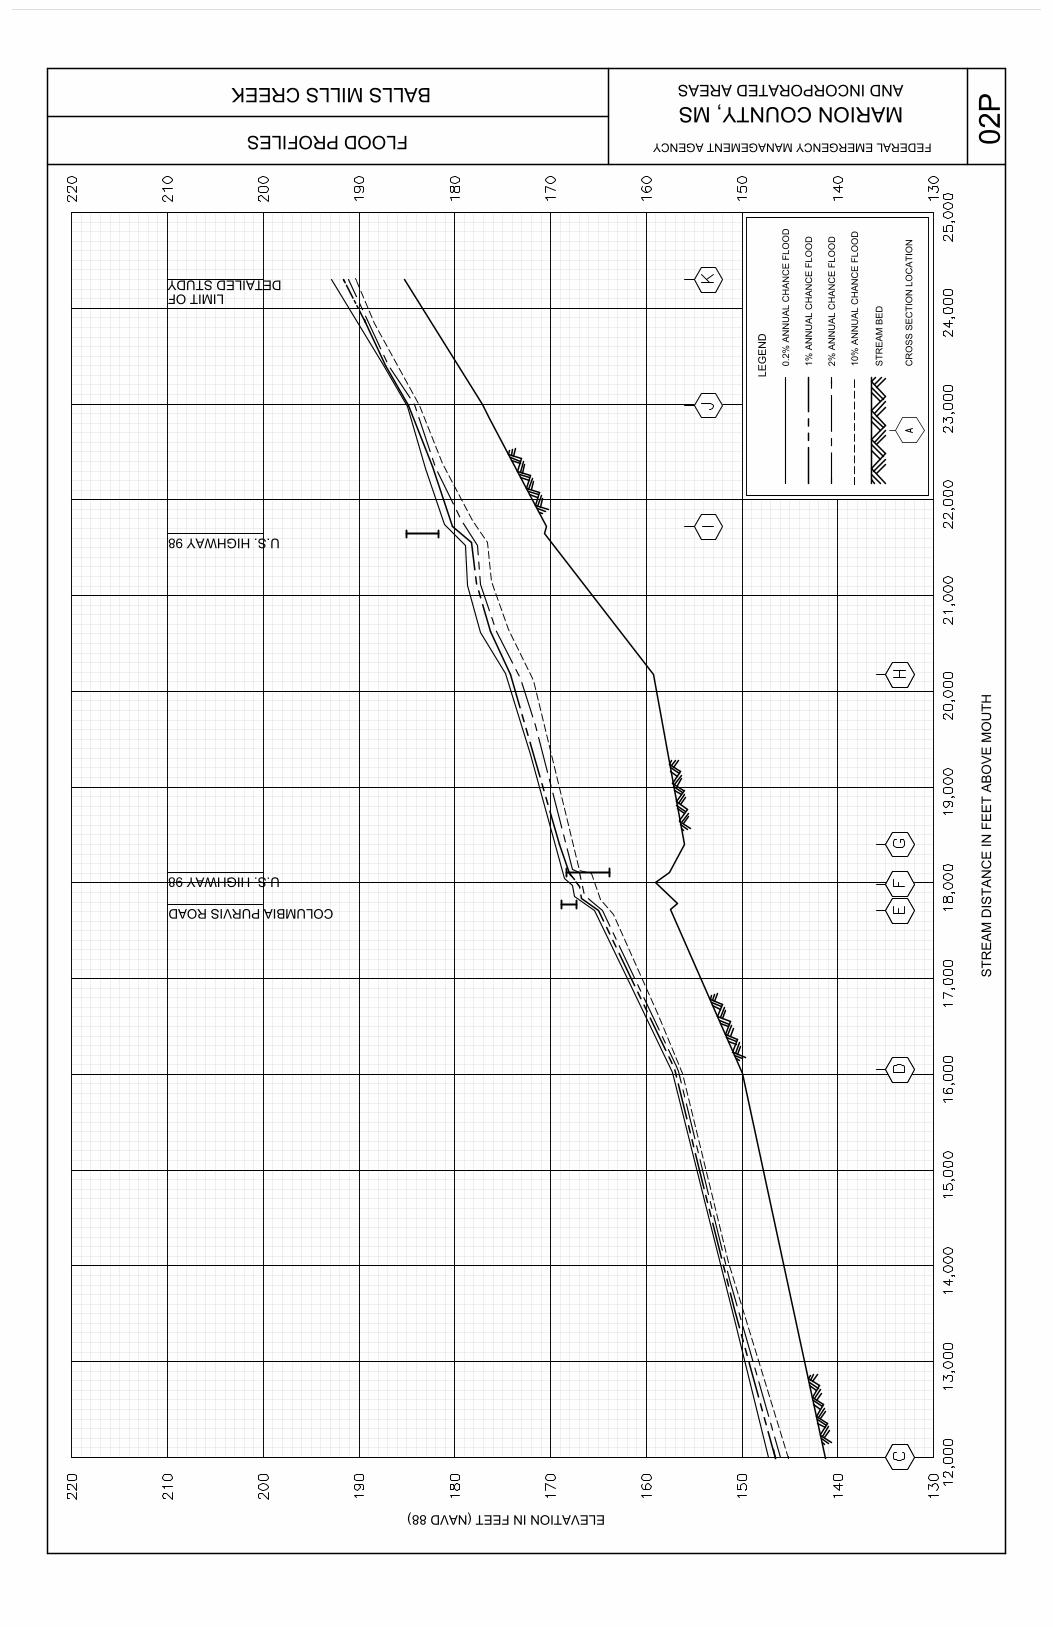
MARION COUNTY, MSBALLS MILLS CREEK
FLOOD PROFILES FEDERAL EMERGENCY MANAGEMENT AGENCY
AND INCORPORATED AREAS
A
LEG
EN
D
0.2%
AN
NU
AL
CH
AN
CE
FLO
OD
1% A
NN
UA
L C
HA
NC
E F
LOO
D
STR
EA
M B
ED
CR
OS
S S
EC
TIO
N L
OC
ATI
ON
10%
AN
NU
AL
CH
AN
CE
FLO
OD
2% A
NN
UA
L C
HA
NC
E F
LOO
D
01,000
2,000
3,000
4,000
5,000
6,000
7,000
8,000
9,000
10,000
11,000
12,000
110
110
120
120
130
130
140
140
150
150
160
160
170
170
180
180
190
190
200
200
STR
EA
M D
ISTA
NC
E IN
FE
ET
AB
OV
E M
OU
TH
STATE HIGHWAY 13
E. MARION SCHOOL ROAD A
B
01P
ELEVATION IN FEET (NAVD 88)
MARION COUNTY, MSBALLS MILLS CREEK
FLOOD PROFILES FEDERAL EMERGENCY MANAGEMENT AGENCY
AND INCORPORATED AREAS
A
LEG
EN
D
0.2%
AN
NU
AL
CH
AN
CE
FLO
OD
1% A
NN
UA
L C
HA
NC
E F
LOO
D
STR
EA
M B
ED
CR
OS
S S
EC
TIO
N L
OC
ATI
ON
10%
AN
NU
AL
CH
AN
CE
FLO
OD
2% A
NN
UA
L C
HA
NC
E F
LOO
D
12,000
13,000
14,000
15,000
16,000
17,000
18,000
19,000
20,000
21,000
22,000
23,000
24,000
25,000
130
130
140
140
150
150
160
160
170
170
180
180
190
190
200
200
210
210
220
220
STR
EA
M D
ISTA
NC
E IN
FE
ET
AB
OV
E M
OU
TH
COLUMBIA PURVIS ROAD
U.S. HIGHWAY 98
U.S. HIGHWAY 98
DETAILED STUDYLIMIT OF
CD
EF
GH
IJ
K
02P
LIMIT OFDETAILED STUDY
LUMBERTON ROAD
ELEVATION IN FEET (NAVD 88)
MARION COUNTY, MSBALLS MILL CREEK TRIBUTARY
FLOOD PROFILES FEDERAL EMERGENCY MANAGEMENT AGENCY
AND INCORPORATED AREAS
A
LEG
EN
D
0.2%
AN
NU
AL
CH
AN
CE
FLO
OD
1% A
NN
UA
L C
HA
NC
E F
LOO
D
STR
EA
M B
ED
CR
OS
S S
EC
TIO
N L
OC
ATI
ON
10%
AN
NU
AL
CH
AN
CE
FLO
OD
2% A
NN
UA
L C
HA
NC
E F
LOO
D
STR
EA
M D
ISTA
NC
E IN
FE
ET
AB
OV
E M
OU
TH
3,500
4,000
4,500
5,000
5,500
6,000
6,500
7,000
7,500
8,000
8,500
9,000
9,500
10,000
110
110
120
120
130
130
140
140
150
150
160
160
170
170
180
180
190
190
200
200
1% A
NN
UA
L C
HA
NC
E B
AC
KW
ATE
R E
FFE
CTS
FR
OM
PE
AR
L R
IVE
R1%
AN
NU
AL
CH
AN
CE
BA
CK
WA
TER
EFF
EC
TS F
RO
M B
ALL
S M
ILLS
CR
EE
K
EAGLE DAY AVENUE
EA
BC
D
F
03P
LIMIT OFDETAILED STUDY
ELEVATION IN FEET (NAVD 88)
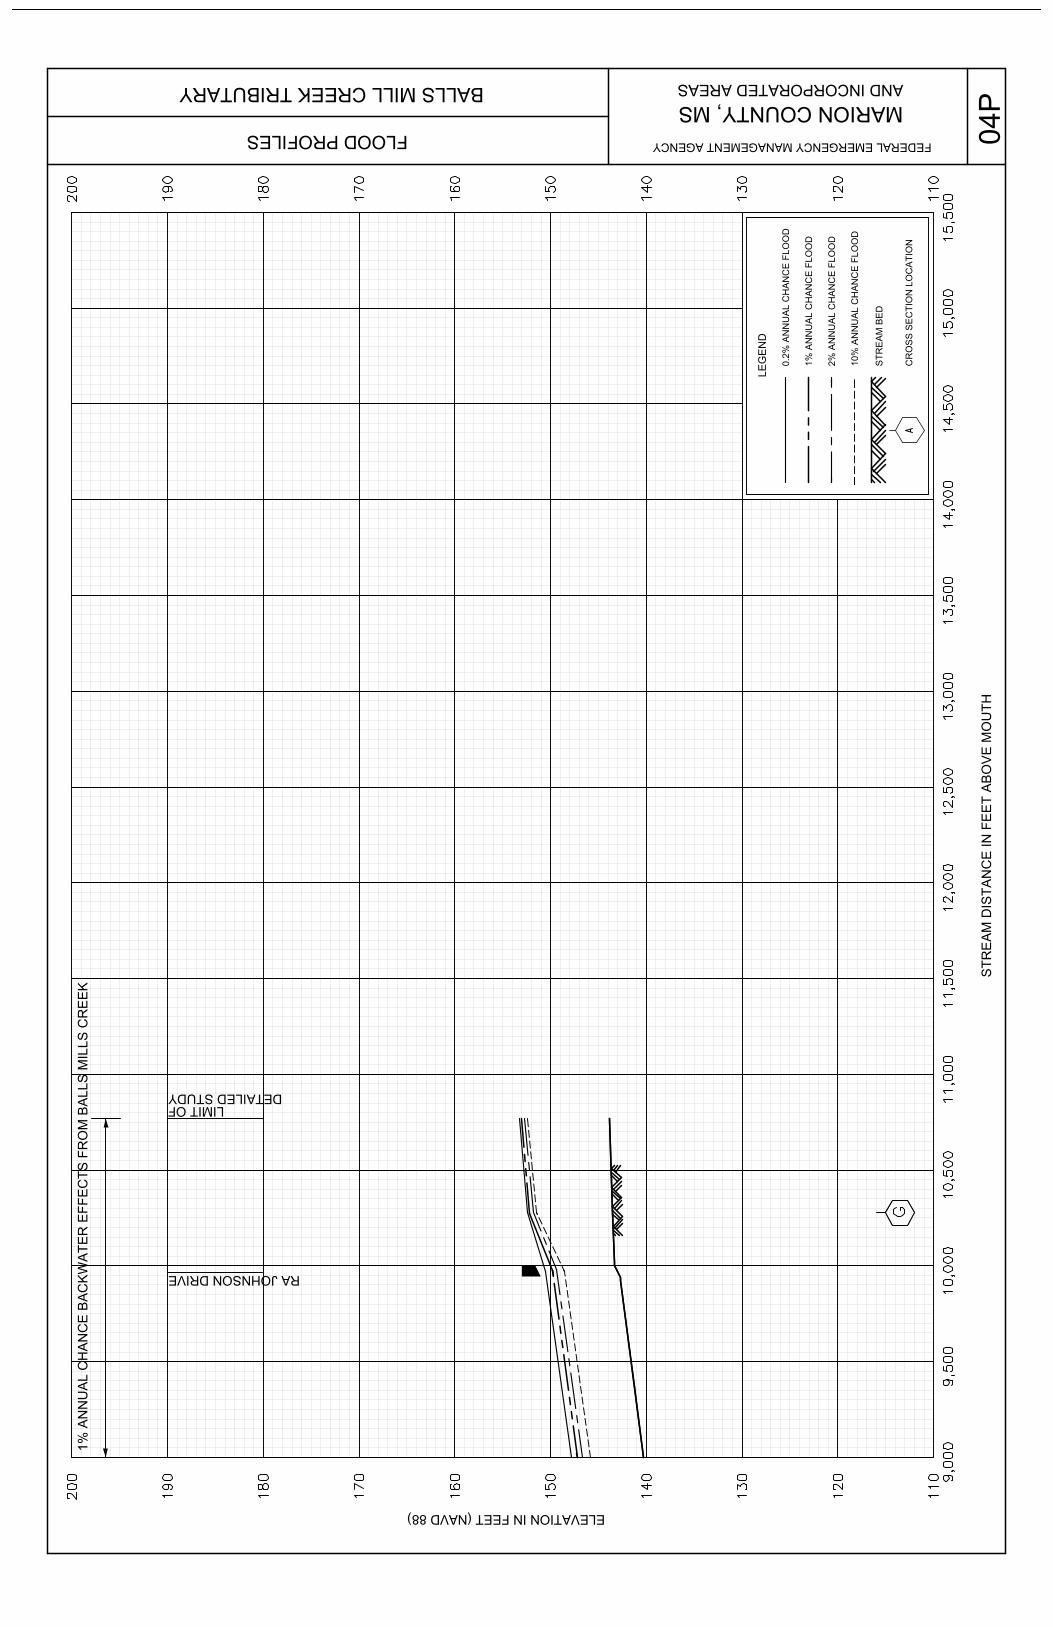
MARION COUNTY, MSBALLS MILL CREEK TRIBUTARY
FLOOD PROFILES FEDERAL EMERGENCY MANAGEMENT AGENCY
AND INCORPORATED AREAS
A
LEG
EN
D
0.2%
AN
NU
AL
CH
AN
CE
FLO
OD
1% A
NN
UA
L C
HA
NC
E F
LOO
D
STR
EA
M B
ED
CR
OS
S S
EC
TIO
N L
OC
ATI
ON
10%
AN
NU
AL
CH
AN
CE
FLO
OD
2% A
NN
UA
L C
HA
NC
E F
LOO
D
STR
EA
M D
ISTA
NC
E IN
FE
ET
AB
OV
E M
OU
TH
9,000
9,500
10,000
10,500
11,000
11,500
12,000
12,500
13,000
13,500
14,000
14,500
15,000
15,500
110
110
120
120
130
130
140
140
150
150
160
160
170
170
180
180
190
190
200
200
G
1% A
NN
UA
L C
HA
NC
E B
AC
KW
ATE
R E
FFE
CTS
FR
OM
BA
LLS
MIL
LS C
RE
EK
RA JOHNSON DRIVE
04P
1% A
NN
UA
L C
HA
NC
E B
AC
KW
ATE
R E
FFE
CTS
FR
OM
PE
AR
L R
IVE
RELEVATION IN FEET (NAVD 88)
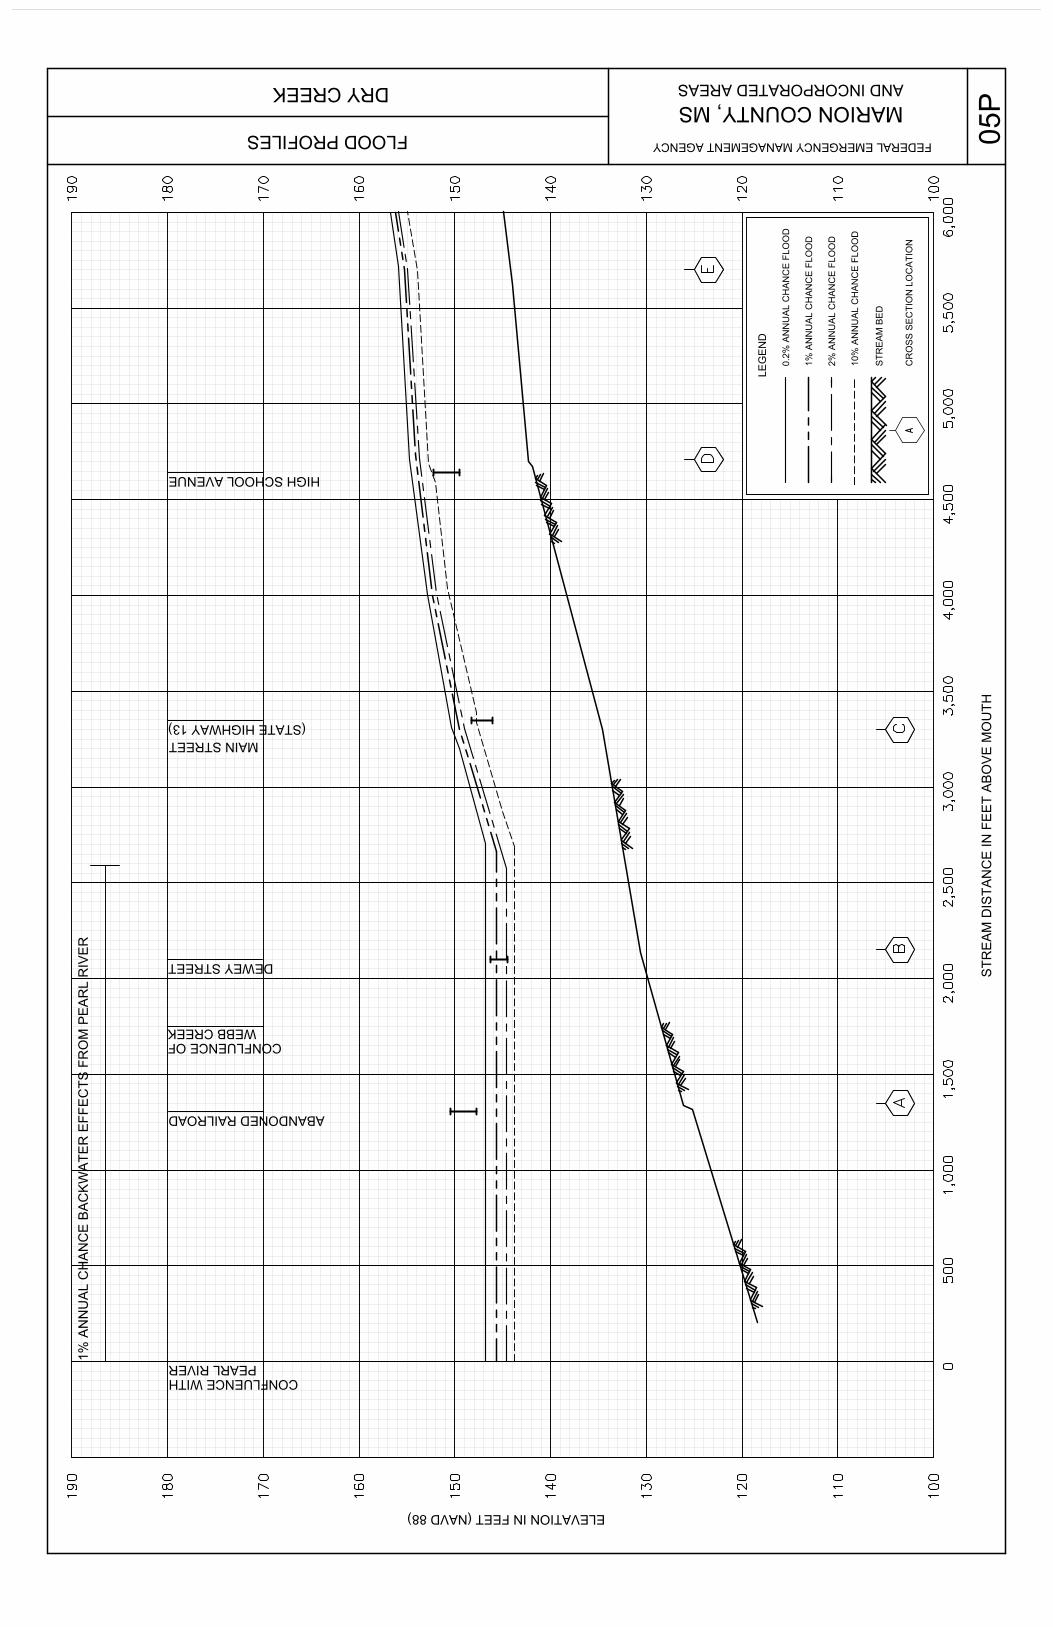
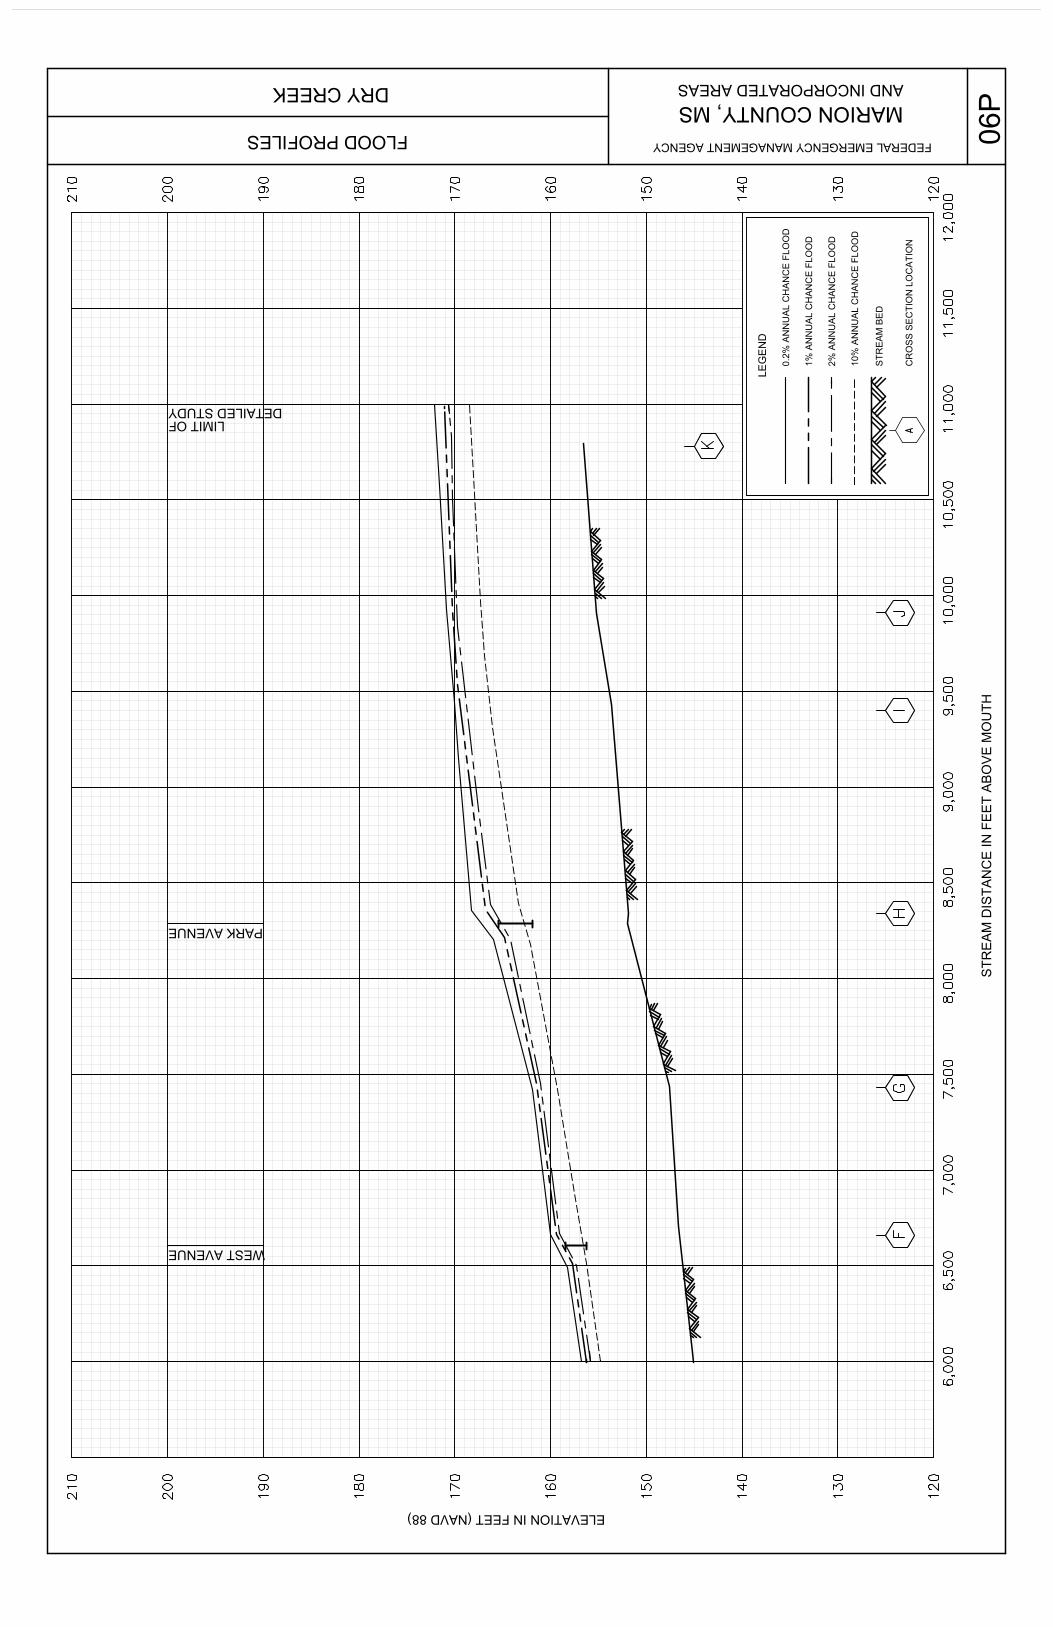
MARION COUNTY, MSDRY CREEK
FLOOD PROFILES FEDERAL EMERGENCY MANAGEMENT AGENCY
AND INCORPORATED AREAS
A
LEG
EN
D
0.2%
AN
NU
AL
CH
AN
CE
FLO
OD
1% A
NN
UA
L C
HA
NC
E F
LOO
D
STR
EA
M B
ED
CR
OS
S S
EC
TIO
N L
OC
ATI
ON
10%
AN
NU
AL
CH
AN
CE
FLO
OD
2% A
NN
UA
L C
HA
NC
E F
LOO
D
0500
1,000
1,500
2,000
2,500
3,000
3,500
4,000
4,500
5,000
5,500
6,000
100
100
110
110
120
120
130
130
140
140
150
150
160
160
170
170
180
180
190
190
STR
EA
M D
ISTA
NC
E IN
FE
ET
AB
OV
E M
OU
TH
ABANDONED RAILROAD
DEWEY STREET
(STATE HIGHWAY 13)
HIGH SCHOOL AVENUE
CONFLUENCE WITH PEARL RIVER
MAIN STREET
AB
C
DE
WEBB CREEKCONFLUENCE OF
05P
ELEVATION IN FEET (NAVD 88)
MARION COUNTY, MSDRY CREEK
FLOOD PROFILES FEDERAL EMERGENCY MANAGEMENT AGENCY
AND INCORPORATED AREAS
A
LEG
EN
D
0.2%
AN
NU
AL
CH
AN
CE
FLO
OD
1% A
NN
UA
L C
HA
NC
E F
LOO
D
STR
EA
M B
ED
CR
OS
S S
EC
TIO
N L
OC
ATI
ON
10%
AN
NU
AL
CH
AN
CE
FLO
OD
2% A
NN
UA
L C
HA
NC
E F
LOO
D
6,000
6,500
7,000
7,500
8,000
8,500
9,000
9,500
10,000
10,500
11,000
11,500
12,000
120
120
130
130
140
140
150
150
160
160
170
170
180
180
190
190
200
200
210
210
STR
EA
M D
ISTA
NC
E IN
FE
ET
AB
OV
E M
OU
TH
WEST AVENUE
PARK AVENUE
DETAILED STUDYLIMIT OF
FG
HI
J
K
06P
ELEVATION IN FEET (NAVD 88)
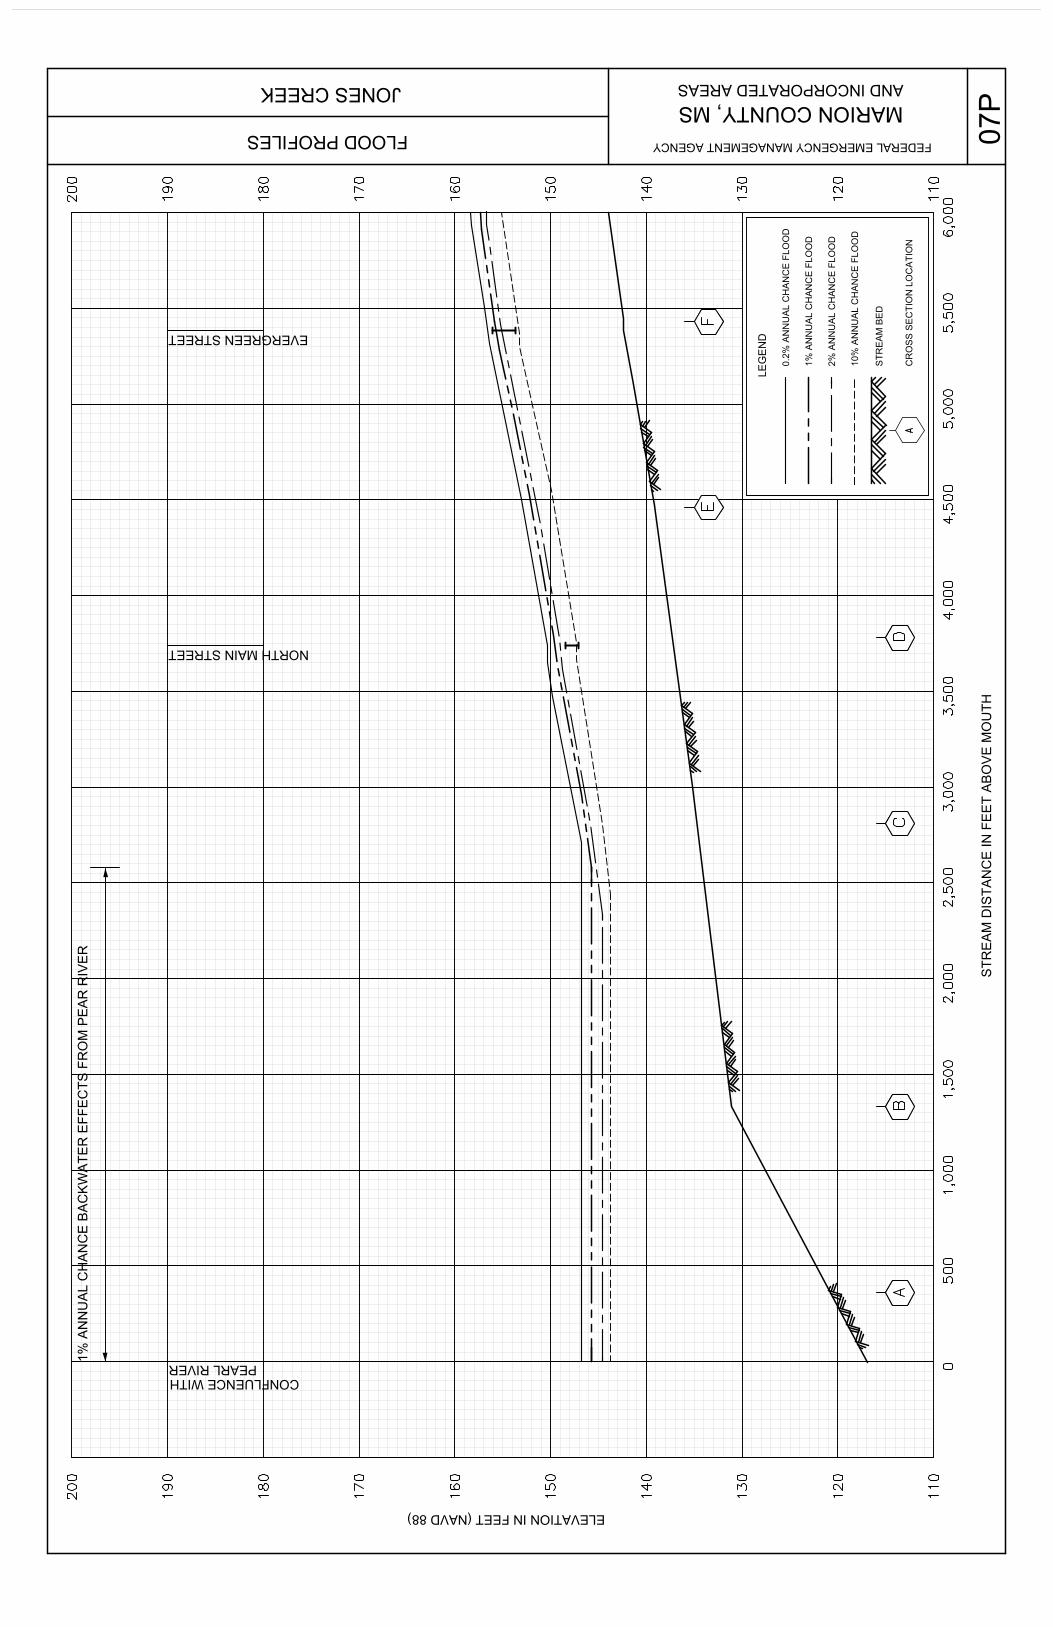
MARION COUNTY, MSJONES CREEK
FLOOD PROFILES FEDERAL EMERGENCY MANAGEMENT AGENCY
AND INCORPORATED AREAS
A
LEG
EN
D
0.2%
AN
NU
AL
CH
AN
CE
FLO
OD
1% A
NN
UA
L C
HA
NC
E F
LOO
D
STR
EA
M B
ED
CR
OS
S S
EC
TIO
N L
OC
ATI
ON
10%
AN
NU
AL
CH
AN
CE
FLO
OD
2% A
NN
UA
L C
HA
NC
E F
LOO
D
0500
1,000
1,500
2,000
2,500
3,000
3,500
4,000
4,500
5,000
5,500
6,000
110
110
120
120
130
130
140
140
150
150
160
160
170
170
180
180
190
190
200
200
STR
EA
M D
ISTA
NC
E IN
FE
ET
AB
OV
E M
OU
TH
C
NORTH MAIN STREET
EVERGREEN STREET
AB
CD
FE
CONFLUENCE WITH PEARL RIVER1%
AN
NU
AL
CH
AN
CE
BA
CK
WA
TER
EFF
EC
TS F
RO
M P
EA
R R
IVE
R
07P
ELEVATION IN FEET (NAVD 88)
MARION COUNTY, MSJONES CREEK
FLOOD PROFILES FEDERAL EMERGENCY MANAGEMENT AGENCY
AND INCORPORATED AREAS
A
LEG
EN
D
0.2%
AN
NU
AL
CH
AN
CE
FLO
OD
1% A
NN
UA
L C
HA
NC
E F
LOO
D
STR
EA
M B
ED
CR
OS
S S
EC
TIO
N L
OC
ATI
ON
10%
AN
NU
AL
CH
AN
CE
FLO
OD
2% A
NN
UA
L C
HA
NC
E F
LOO
D
6,000
6,500
7,000
7,500
8,000
8,500
9,000
9,500
10,000
10,500
11,000
11,500
12,000
130
130
140
140
150
150
160
160
170
170
180
180
190
190
200
200
210
210
220
220
STR
EA
M D
ISTA
NC
E IN
FE
ET
AB
OV
E M
OU
TH
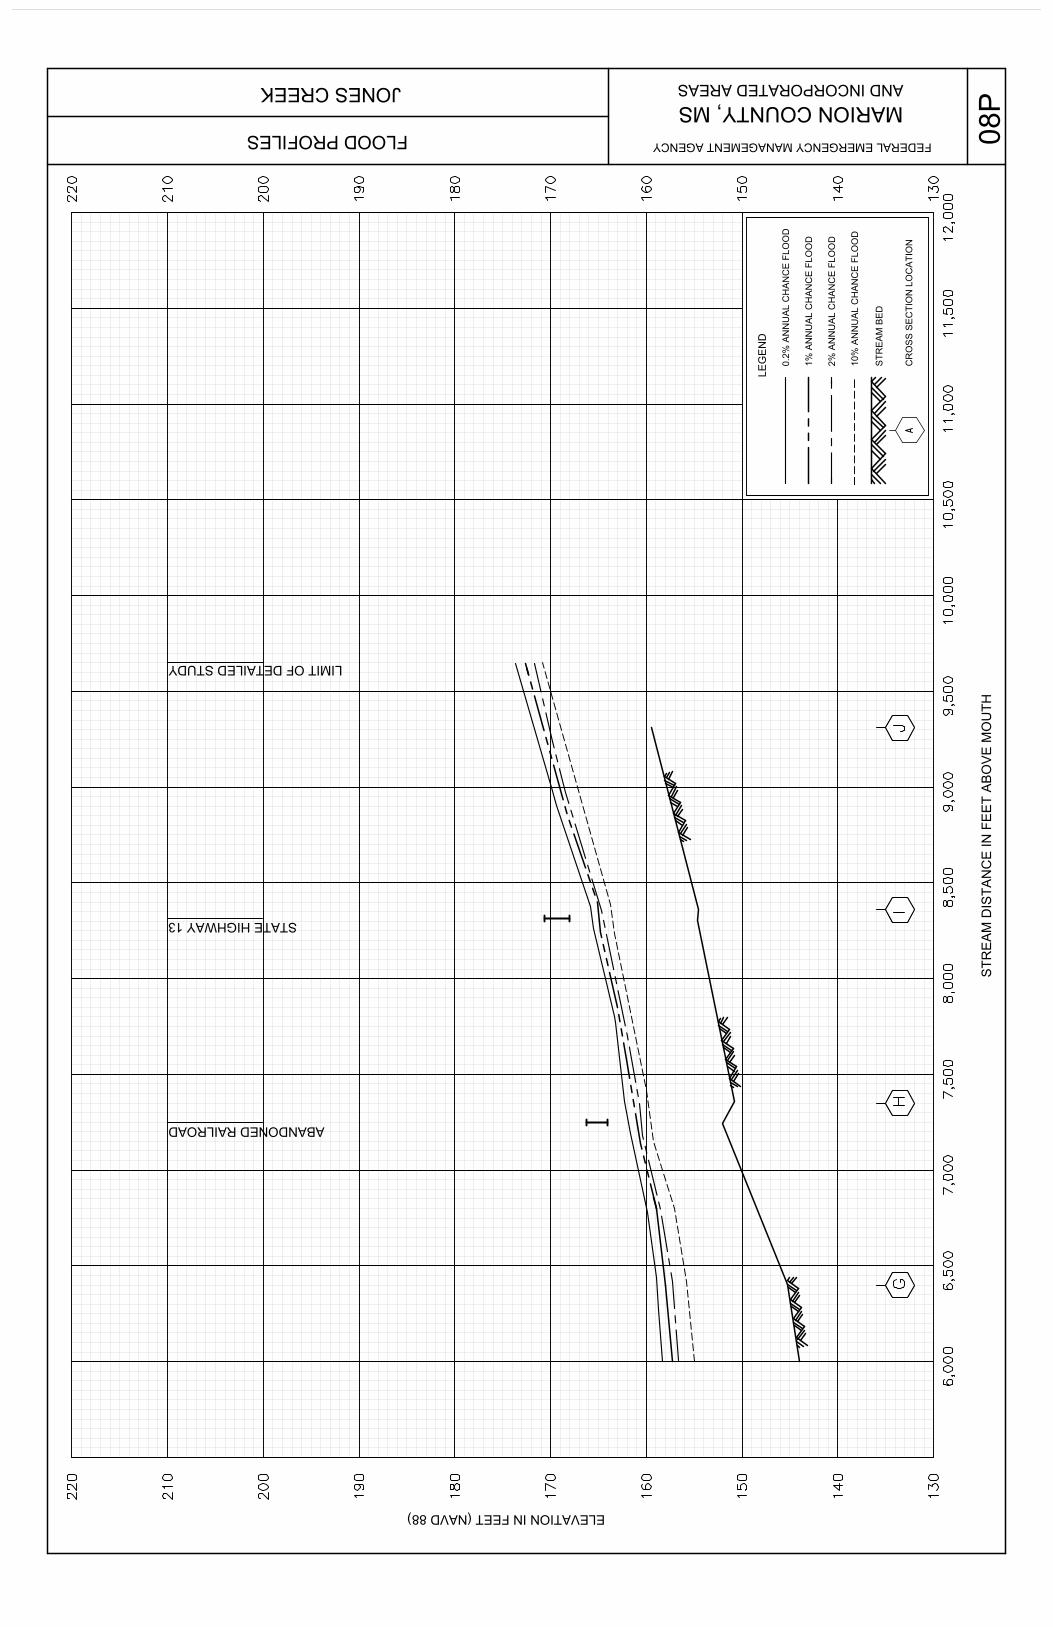
GH
IJ
ABANDONED RAILROAD
STATE HIGHWAY 13
GH
IJ
LIMIT OF DETAILED STUDY
08P
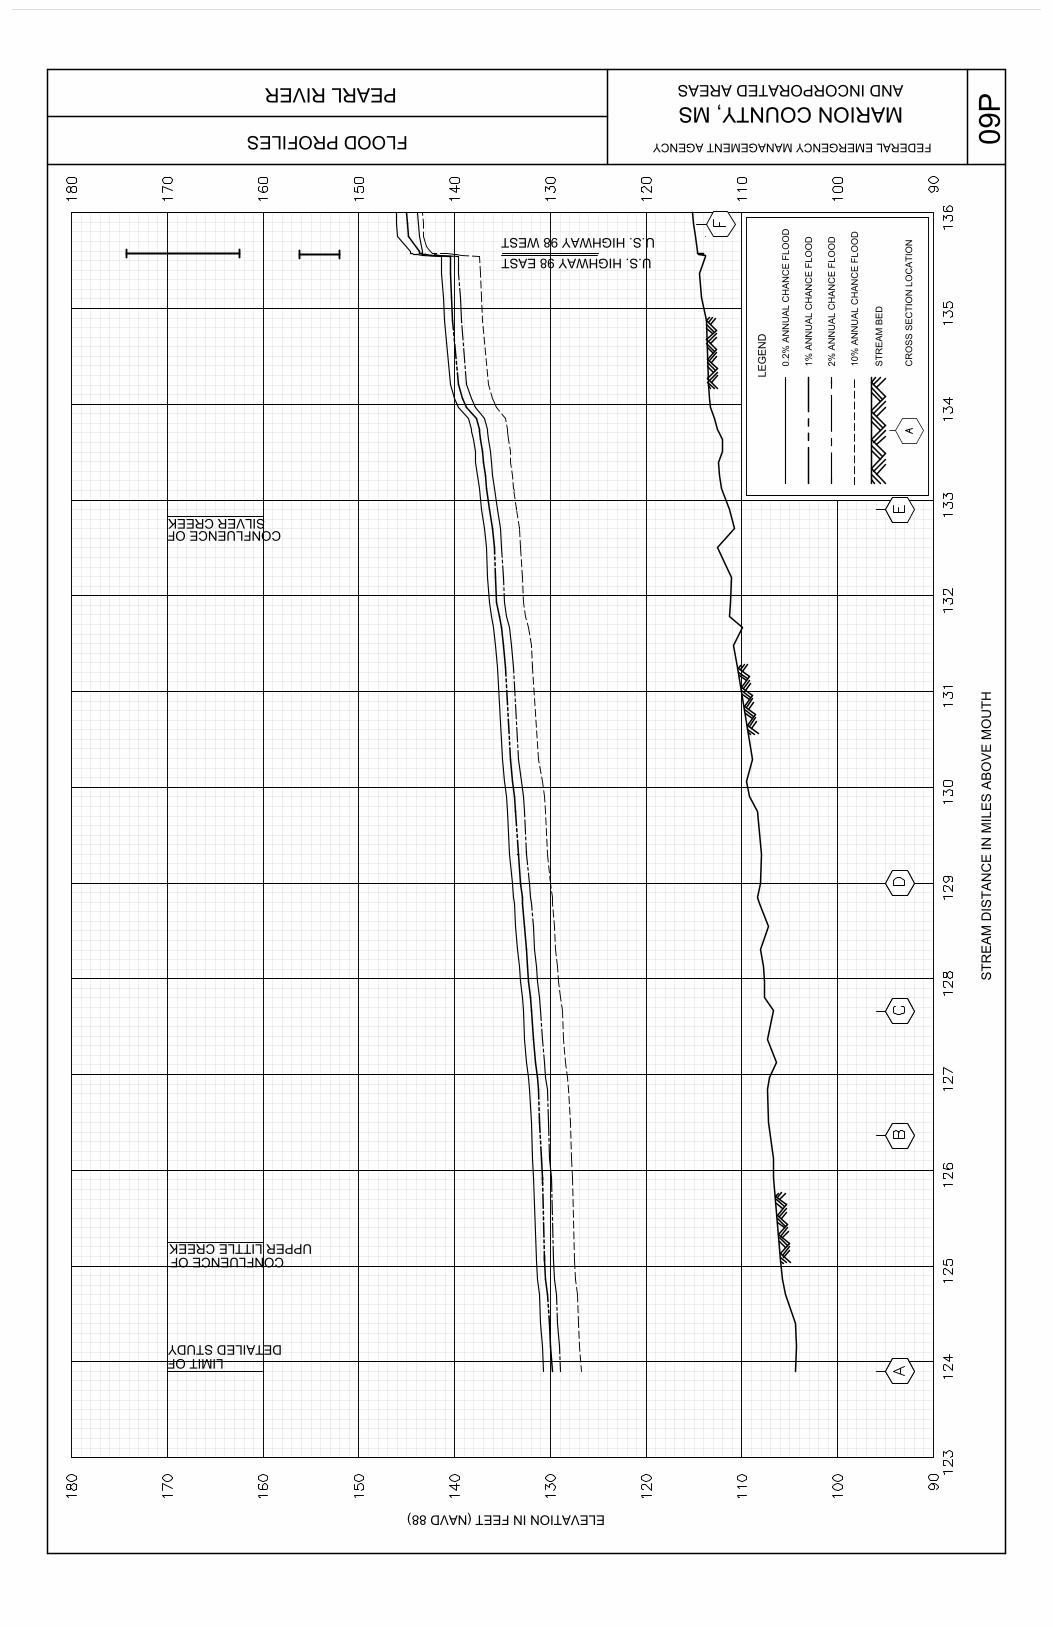
PEARL RIVER
STR
EA
M D
ISTA
NC
E IN
MIL
ES
AB
OV
E M
OU
TH
ELEVATION IN FEET (NAVD 88)
MARION COUNTY, MSFLOOD PROFILES FEDERAL EMERGENCY MANAGEMENT AGENCY
AND INCORPORATED AREAS
A
LEG
EN
D
0.2%
AN
NU
AL
CH
AN
CE
FLO
OD
1% A
NN
UA
L C
HA
NC
E F
LOO
D
STR
EA
M B
ED
CR
OS
S S
EC
TIO
N L
OC
ATI
ON
10%
AN
NU
AL
CH
AN
CE
FLO
OD
2% A
NN
UA
L C
HA
NC
E F
LOO
D
123
124
125
126
127
128
129
130
131
132
133
134
135
136
90
90
100
100
110
110
120
120
130
130
140
140
150
150
160
160
170
170
180
180
U.S. HIGHWAY 98 EASTU.S. HIGHWAY 98 WEST
LIMIT OFDETAILED STUDY
AB
CD
E
UPPER LITTLE CREEKCONFLUENCE OF
SILVER CREEKCONFLUENCE OF
F
09P
ELEVATION IN FEET (NAVD 88)
JONES CREEK
CONFLUENCE OFDRY CREEK
CONFLUENCE OF
136
137
138
139
140
141
142
143
144
145
146
147
148
90
90
100
100
110
110
120
120
130
130
140
140
150
150
160
160
170
170
180
180
STR
EA
M D
ISTA
NC
E IN
MIL
ES
AB
OV
E M
OU
TH
PEARL RIVERMARION COUNTY, MS
FLOOD PROFILES FEDERAL EMERGENCY MANAGEMENT AGENCY
AND INCORPORATED AREAS
A
LEG
EN
D
0.2%
AN
NU
AL
CH
AN
CE
FLO
OD
1% A
NN
UA
L C
HA
NC
E F
LOO
D
STR
EA
M B
ED
CR
OS
S S
EC
TIO
N L
OC
ATI
ON
10%
AN
NU
AL
CH
AN
CE
FLO
OD
2% A
NN
UA
L C
HA
NC
E F
LOO
D
J
STATE HIGHWAY 35
GH
I
J
10P
148
149
150
151
152
153
154
155
156
157
158
159
160
161
90
90
100
100
110
110
120
120
130
130
140
140
150
150
160
160
170
170
180
180
STR
EA
M D
ISTA
NC
E IN
MIL
ES
AB
OV
E M
OU
TH
PEARL RIVER
ELEVATION IN FEET (NAVD 88)
MARION COUNTY, MSFLOOD PROFILES FEDERAL EMERGENCY MANAGEMENT AGENCY
AND INCORPORATED AREAS
A
LEG
EN
D
0.2%
AN
NU
AL
CH
AN
CE
FLO
OD
1% A
NN
UA
L C
HA
NC
E F
LOO
D
STR
EA
M B
ED
CR
OS
S S
EC
TIO
N L
OC
ATI
ON
10%
AN
NU
AL
CH
AN
CE
FLO
OD
2% A
NN
UA
L C
HA
NC
E F
LOO
D
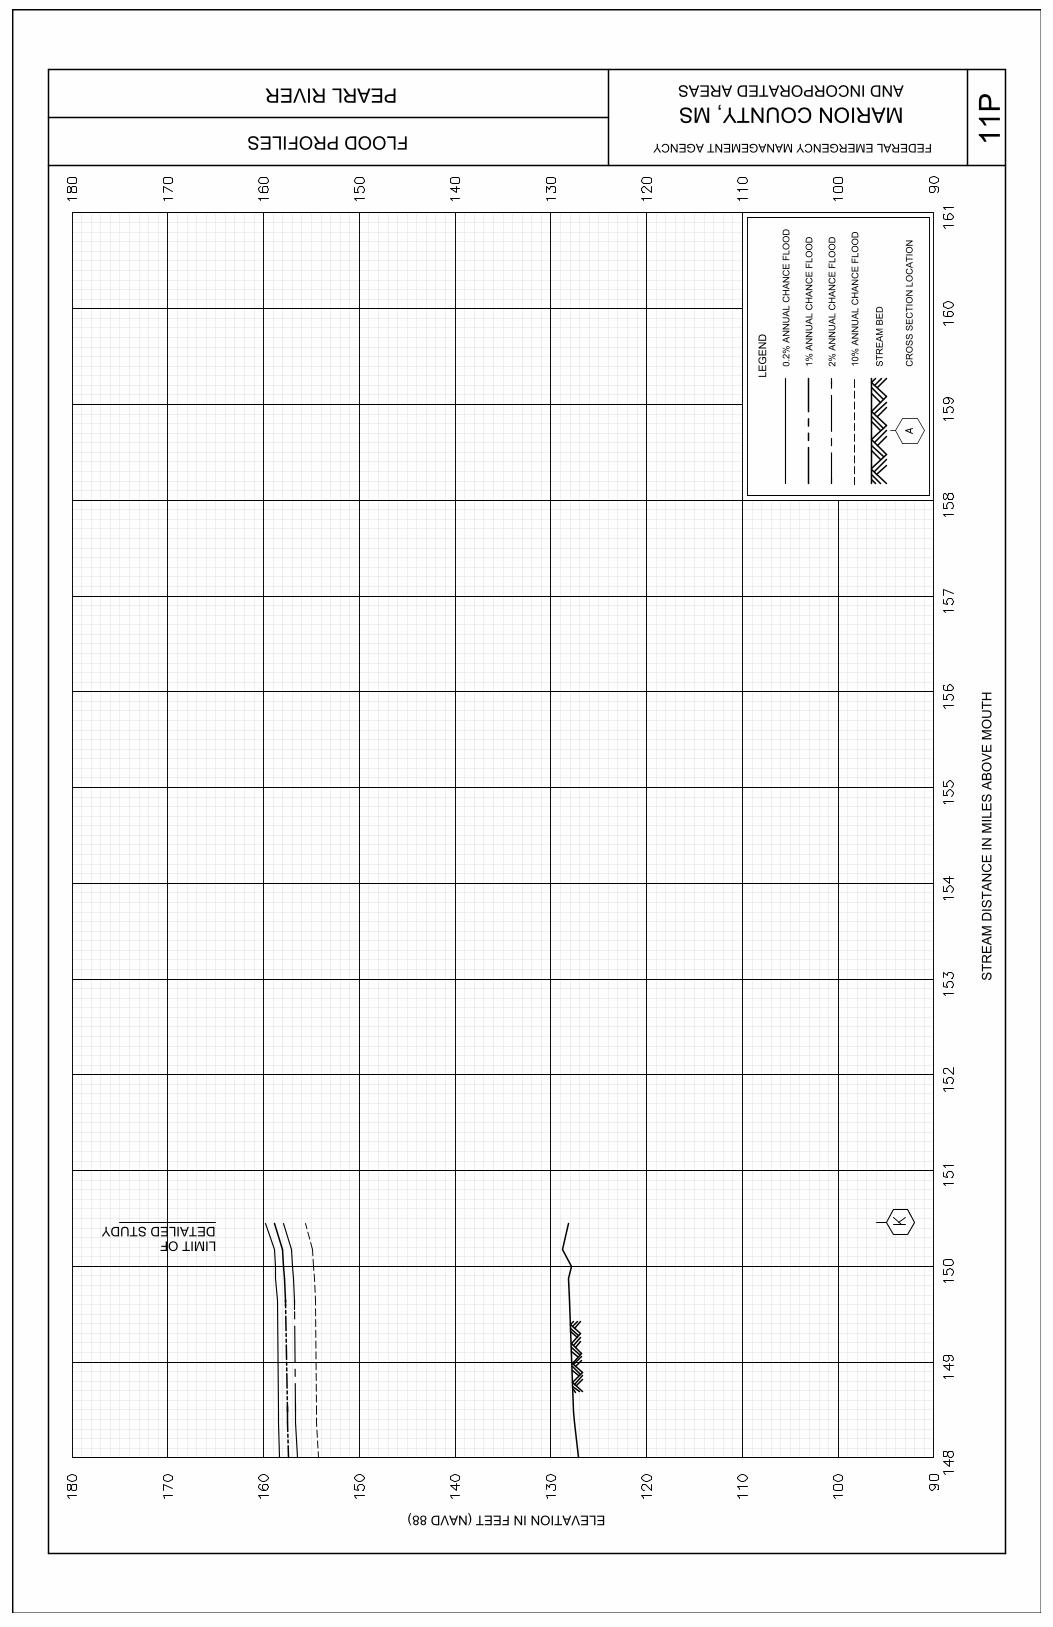
DETAILED STUDYLIMIT OF
K
11P
CONFLUENCE WITH PEARL RIVER
ELEVATION IN FEET (NAVD 88)
MARION COUNTY, MSSILVER CREEK
FLOOD PROFILES FEDERAL EMERGENCY MANAGEMENT AGENCY
AND INCORPORATED AREAS
A
LEG
EN
D
0.2%
AN
NU
AL
CH
AN
CE
FLO
OD
1% A
NN
UA
L C
HA
NC
E F
LOO
D
STR
EA
M B
ED
CR
OS
S S
EC
TIO
N L
OC
ATI
ON
10%
AN
NU
AL
CH
AN
CE
FLO
OD
2% A
NN
UA
L C
HA
NC
E F
LOO
D
STR
EA
M D
ISTA
NC
E IN
FE
ET
AB
OV
E M
OU
TH
02,000
4,000
6,000
8,000
10,000
12,000
14,000
16,000
18,000
120
120
130
130
140
140
150
150
160
160
170
170
180
180
190
190
200
200
210
210
U.S. HIGHWAY 98
RAILROAD
AB
C
D
E
1% A
NN
UA
L C
HA
NC
E B
AC
KW
ATE
R E
FFE
CTS
FR
OM
PE
AR
L R
IVE
R
12P
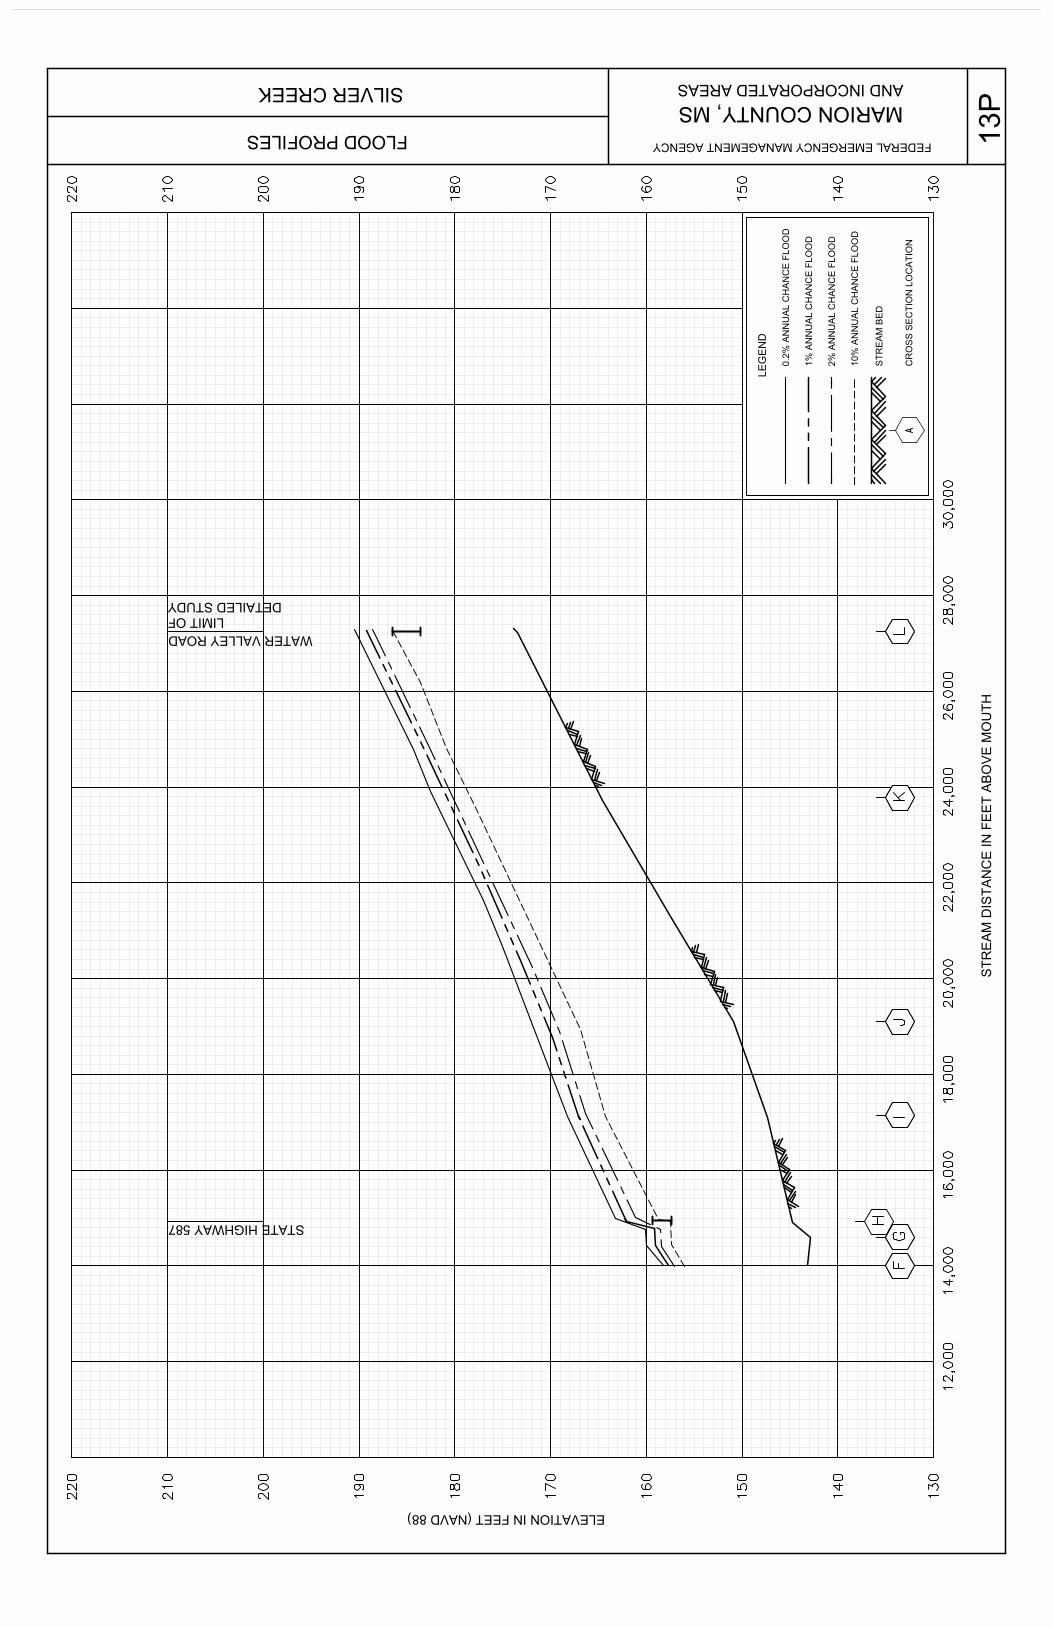
ELEVATION IN FEET (NAVD 88)
MARION COUNTY, MSSILVER CREEK
FLOOD PROFILES FEDERAL EMERGENCY MANAGEMENT AGENCY
AND INCORPORATED AREAS
A
LEG
EN
D
0.2%
AN
NU
AL
CH
AN
CE
FLO
OD
1% A
NN
UA
L C
HA
NC
E F
LOO
D
STR
EA
M B
ED
CR
OS
S S
EC
TIO
N L
OC
ATI
ON
10%
AN
NU
AL
CH
AN
CE
FLO
OD
2% A
NN
UA
L C
HA
NC
E F
LOO
D
12,000
14,000
16,000
18,000
20,000
22,000
24,000
26,000
28,000
30,000
130
130
140
140
150
150
160
160
170
170
180
180
190
190
200
200
210
210
220
220
STR
EA
M D
ISTA
NC
E IN
FE
ET
AB
OV
E M
OU
TH
STATE HIGHWAY 587
WATER VALLEY ROAD
F
LIMIT OFDETAILED STUDY
G
H
IJ
KL
13P
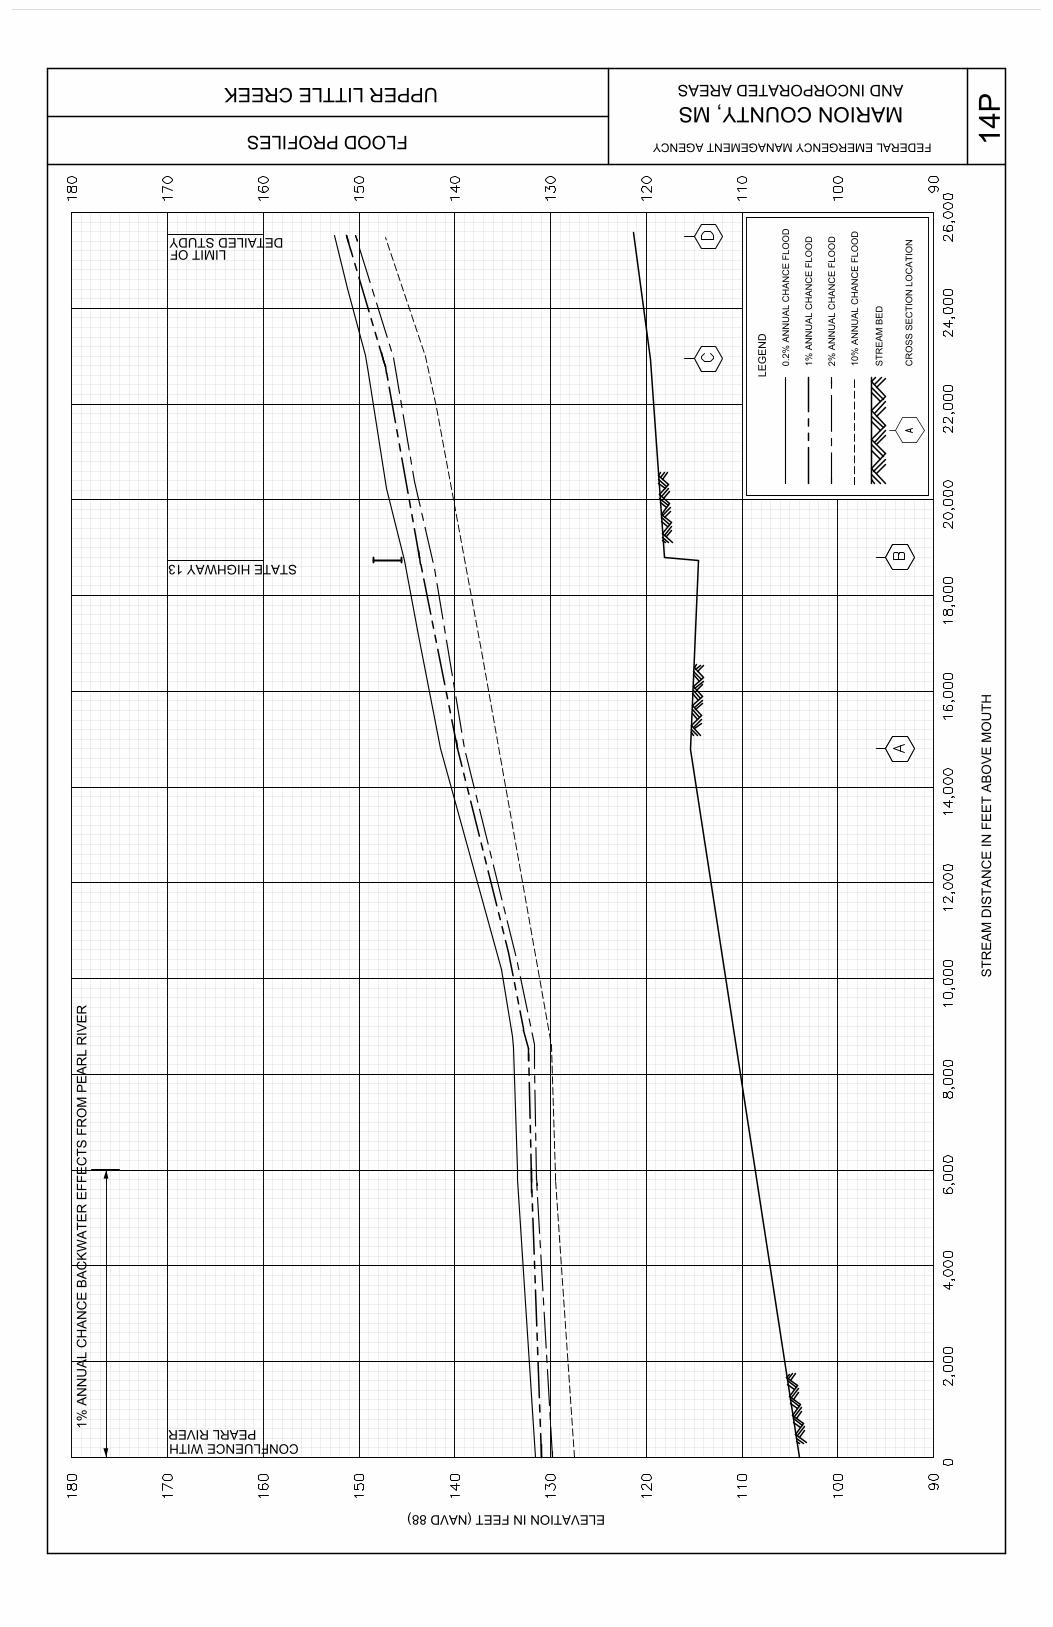
PEARL RIVER
STR
EA
M D
ISTA
NC
E IN
FE
ET
AB
OV
E M
OU
TH
CONFLUENCE WITH
ELEVATION IN FEET (NAVD 88)
MARION COUNTY, MSUPPER LITTLE CREEK
FLOOD PROFILES FEDERAL EMERGENCY MANAGEMENT AGENCY
AND INCORPORATED AREAS
A
LEG
EN
D
0.2%
AN
NU
AL
CH
AN
CE
FLO
OD
1% A
NN
UA
L C
HA
NC
E F
LOO
D
STR
EA
M B
ED
CR
OS
S S
EC
TIO
N L
OC
ATI
ON
10%
AN
NU
AL
CH
AN
CE
FLO
OD
2% A
NN
UA
L C
HA
NC
E F
LOO
D
C
02,000
4,000
6,000
8,000
10,000
12,000
14,000
16,000
18,000
20,000
22,000
24,000
26,000
90
90
100
100
110
110
120
120
130
130
140
140
150
150
160
160
170
170
180
180
STATE HIGHWAY 13
AB
DDETAILED STUDYLIMIT OF
1% A
NN
UA
L C
HA
NC
E B
AC
KW
ATE
R E
FFE
CTS
FR
OM
PE
AR
L R
IVE
R
14P
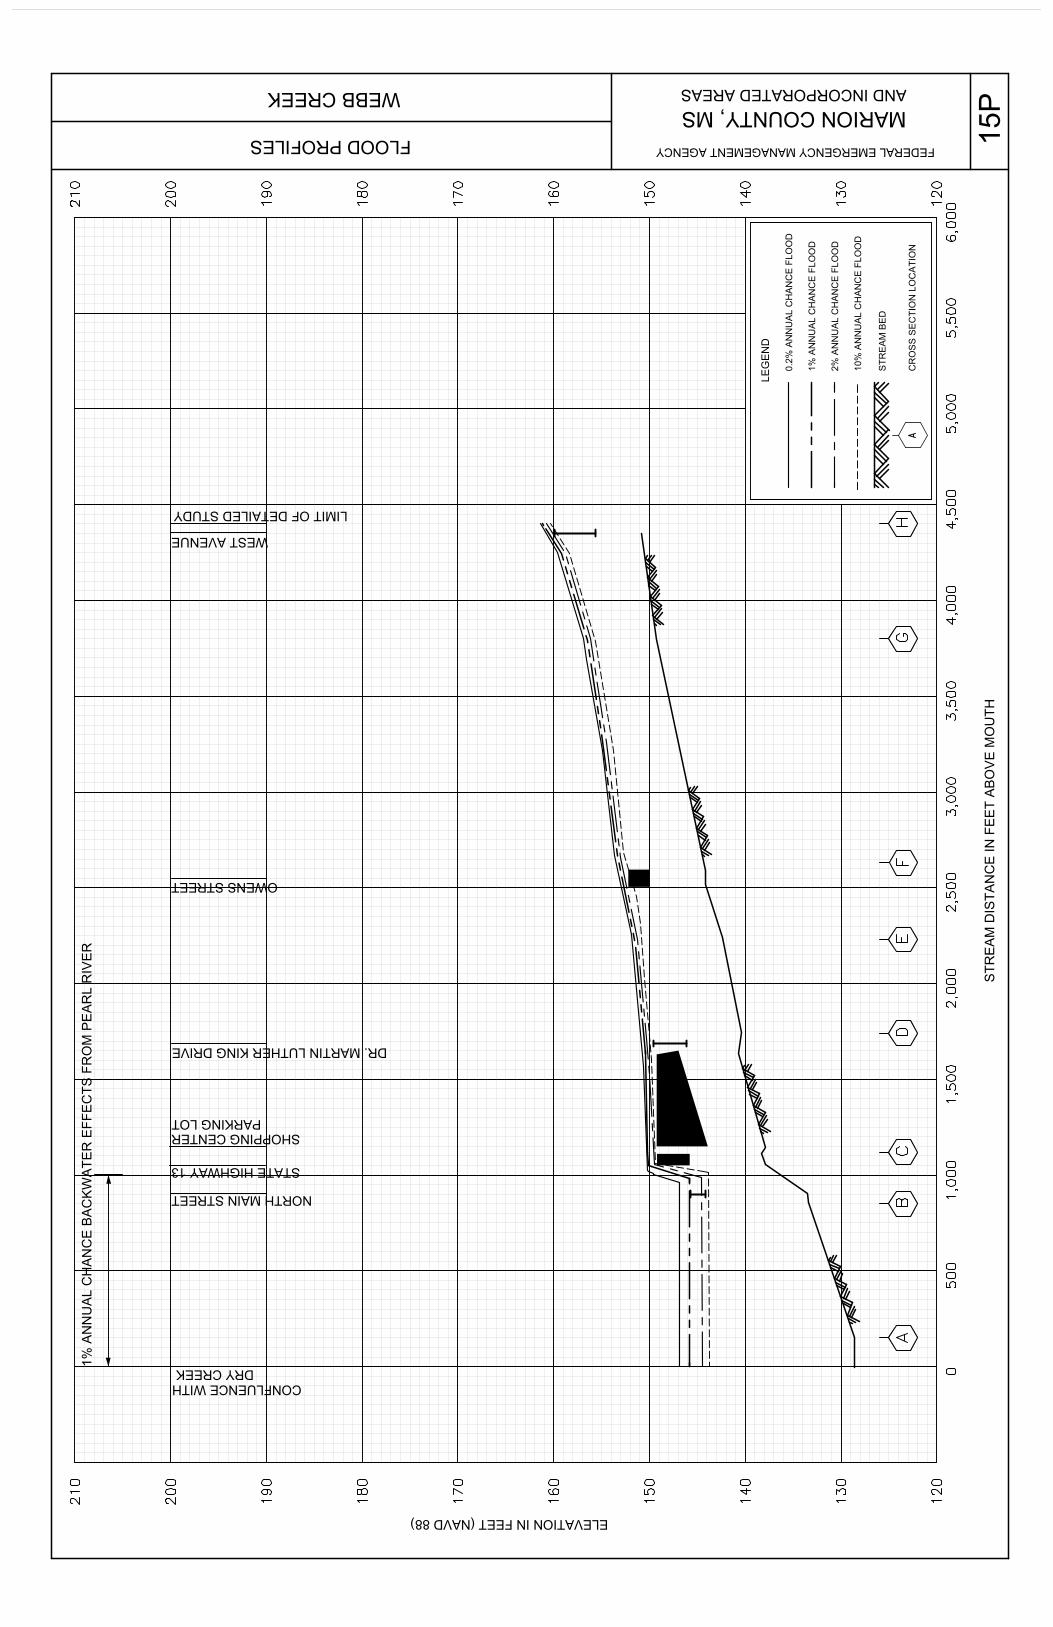
ELEVATION IN FEET (NAVD 88)
MARION COUNTY, MSWEBB CREEK
FLOOD PROFILES FEDERAL EMERGENCY MANAGEMENT AGENCY
AND INCORPORATED AREAS
A
LEG
EN
D
0.2%
AN
NU
AL
CH
AN
CE
FLO
OD
1% A
NN
UA
L C
HA
NC
E F
LOO
D
STR
EA
M B
ED
CR
OS
S S
EC
TIO
N L
OC
ATI
ON
10%
AN
NU
AL
CH
AN
CE
FLO
OD
2% A
NN
UA
L C
HA
NC
E F
LOO
D
0500
1,000
1,500
2,000
2,500
3,000
3,500
4,000
4,500
5,000
5,500
6,000
120
120
130
130
140
140
150
150
160
160
170
170
180
180
190
190
200
200
210
210
STR
EA
M D
ISTA
NC
E IN
FE
ET
AB
OV
E M
OU
TH
NORTH MAIN STREET
STATE HIGHWAY 13
SHOPPING CENTER
DR. MARTIN LUTHER KING DRIVE
OWENS STREET
WEST AVENUE
PARKING LOT
LIMIT OF DETAILED STUDY
DRY CREEKCONFLUENCE WITH
1% A
NN
UA
L C
HA
NC
E B
AC
KW
ATE
R E
FFE
CTS
FR
OM
PE
AR
L R
IVE
R
AB
CD
EF
GH
15P