maritime knowledge discovery and anomaly detection ... · maritime knowledge discovery and anomaly...
TRANSCRIPT

Maritime Knowledge Discovery and Anomaly Detection Workshop, 5-6 July 2016
1
Edited by Michele Vespe and Fabio Mazzarella
Ispra, 5-6 July 2016
Maritime Knowledge Discovery and
Anomaly Detection Workshop Proceedings
2016

Maritime Knowledge Discovery and Anomaly Detection Workshop, 5-6 July 2016
2
This publication is a Conference and Workshop report by the Joint Research Centre (JRC), the European Commission’s in-house science and
knowledge service. It aims to provide evidence-based scientific support to the European policy-making process. The scientific output expressed
does not imply a policy position of the European Commission. Neither the European Commission nor any person acting on behalf of the
Commission is responsible for the use which might be made of this publication.
Contact information
Name: Michele Vespe, Fabio Mazzarella
Address: European Commission – Joint Research Centre, Via Enrico Fermi 2749, 21021 Ispra (VA)
E-mail: [email protected], [email protected]
Tel.: +39 0332 785024 ; +39 0332 789154
JRC Science Hub
https://ec.europa.eu/jrc
JRC102513
ISBN 978-92-79-61301-2 doi:10.2788/025881
© Luxembourg: Publications Office of the European Union, 2016.
Reproduction is authorised provided the source is acknowledged.
How to cite: Michele Vespe, Fabio Mazzarella; Maritime Knowledge Discovery and Anomaly Detection Workshop; doi:10.2788/025881
All images © Luxembourg: Publications Office of the European Union, 2016.

Maritime Knowledge Discovery and Anomaly Detection Workshop, 5-6 July 2016
3
TABLE OF CONTENTS
FOREWORD ________________________________________________________________________ 5
SECTION I: OPERATIONAL AUTHORITIES _________________________________________________ 6
STATISTICAL ANOMALY DETECTION FOR MARITIME SURVEILLANCE AND MONITORING ____________ 7
A. Holst, P. Ryman, A. Linse __________________________________________________________________7
PORTUGUESE NAVY PERSPECTIVE IN MARITIME SITUATIONAL AWARENESS – THE ANOMALY DETECTION _______________________________________________________________________ 10
P. Serafim _____________________________________________________________________________ 10
AUTOMATED BEHAVIOUR MONITORING (ABM) ALGORITHMS – OPERATIONAL USE AT EMSA ______ 12
European Maritime Safety Agency __________________________________________________________ 12
SENSORS IN NATO MARITIME SITUATIONAL AWARENESS __________________________________ 17
D. Severino ____________________________________________________________________________ 17
SECTION II: PRIVATE SECTOR _________________________________________________________ 21
ANALYSIS OF VESSEL TRAJECTORIES FOR MARITIME SURVEILLANCE AND FISHERIES MANAGEMENT _ 22
P. Gaspar, R. Lopez, M. Marzuki, R. Fablet, P. Gros, J.-M. Zigna, G. Fabritius _________________________ 22
EXPLOITING THE POTENTIAL OF THE FUTURE “MARITIME BIG DATA” _________________________ 24
B. Garnier, A. Napoli _____________________________________________________________________ 24
GENERATING AND EVALUATING LONG-TERM COMPLEX MARITIME TRAFFIC RELATIONSHIPS FOR RISK ASSESSMENT AND MISSION PLANNING VIA NEAR-REAL-TIME BIG-DATA ANALYTICS _____________ 28
H. J. Paulino Pinto _______________________________________________________________________ 28
SEA SURFACE CURRENTS CALCULATION USING VESSEL TRACKING DATA _______________________ 31
Y. Guichoux, M. Lennon, N. Thomas _________________________________________________________ 31
DETECTING ANOMALIES IN STREAMS OF AIS VESSEL DATA __________________________________ 36
D. Zissis _______________________________________________________________________________ 36
SECTION III: RESEARCH CENTRES & ACADEMIA ___________________________________________ 39
REAL TIME INTELLIGENCE OF AIS DATA _________________________________________________ 40
N. Nikitakos ____________________________________________________________________________ 40
VISUAL ANALYSIS OF VESSEL TRAFFIC SAFETY BY EXTRACTING EVENTS AND ORCHESTRATING INTERACTIVE FILTERS _______________________________________________________________ 44
G. Andrienko, N. Andrienko, C. Claramunt, G. Fuchs, C. Ray ______________________________________ 44
Maritime Knowledge Discovery and Anomaly Detection Workshop, 5-6 July 2016
4
SCALABLE ESTIMATION OF PORT AREAS FROM AIS DATA ___________________________________ 48
L. M. Millefiori, L. Cazzanti, D. Zissis, G. Arcieri _________________________________________________ 48
DATA REQUIREMENTS FOR ANOMALY DETECTION ________________________________________ 52
S. Horn, C. Eisler, P. Dobias, J. Collins ________________________________________________________ 52
A FISHING MONITORING USE CASE IN SUPPORT TO COLLABORATIVE RESEARCH ________________ 57
A.-L. Jousselme, E. Camossi, M. Hadzagic, C. Ray, C. Claramunt, E. Reardon, K. Bryan, M. Ilteris __________ 57
CONTEXTUAL ANOMALOUS DESTINATION DETECTION FOR MARITIME SURVEILLANCE ___________ 62
M. Hadzagic, A.-L. Jousselme ______________________________________________________________ 62
AUTOMATED PROCESSING SYSTEM FOR SAR TARGET DETECTION AND IDENTIFICATION IN NEAR REAL TIME APPLICATIONS FOR MARITIME SITUATIONAL AWARENESS _____________________________ 66
S. Voinov, E. Schwarz, D. Krause ____________________________________________________________ 66
DATA DRIVEN IDENTIFICATION OF MIGRANT VESSELS AT SEA _______________________________ 69
C. Langford, T. Cheng, M. Vespe ____________________________________________________________ 69
METHODOLOGY FOR REAL-TIME DETECTION OF AIS FALSIFICATION __________________________ 74
C. Ray, C. Iphar, A. Napoli _________________________________________________________________ 74
IMPROVING THE MARITIME TRAFFIC SITUATION ASSESSMENT FOR A SINGLE TARGET IN A MULTISENSOR ENVIRONMENT ________________________________________________________ 78
G. Siegert, P. Banyś, F. Heymann ___________________________________________________________ 78
A HYBRID APPROACH FOR THE ANALYSIS OF ABNORMAL SHIP BEHAVIORS _____________________ 83
A. Napoli ______________________________________________________________________________ 83
MARITIME SITUATIONAL AWARENESS IN THE HIGH NORTH _________________________________ 87
T. Eriksen, A. Ommundsen, B. Gade, M. Aronsen _______________________________________________ 87
ANOMALY DETECTION AND KNOWLEDGE DISCOVERY USING VESSEL TRACKING DATA ____________ 91
A. Alessandrini, M. Alvarez, H. Greidanus, V. Gammieri, V. Fernandez Arguedas, F. Mazzarella, C. Santamaria, M. Stasolla, D. Tarchi and M. Vespe _________________________________________________________ 91
CONCLUSIONS AND RECOMMENDATIONS _______________________________________________ 95

Maritime Knowledge Discovery and Anomaly Detection Workshop, 5-6 July 2016
5
FOREWORD
Thousands of vessels cross EU waters and hundreds enter into EU ports every day, generating an
overwhelming amount of tracking data and reports that make it possible to disguise illegal operations.
Detecting steadily changing deceptive behaviours at sea is becoming like trying to find a needle in a
haystack and calls for advanced automatic and adaptive tools to discover useful information from the
data.
Data mining, information fusion and visual analytics are becoming central to the discovery of
knowledge from the increasingly available information on vessels and their movements (e.g. Automatic
Identification System - AIS, Long Range Identification and Tracking - LRIT, radar tracks, Earth
Observation) at global scale. This enables the automatic detection of structured anomalies, the prediction
of vessel routes up to a few days in advance, the behavioural characterisation of vessels, the
understanding and mapping of activities at sea and the analysis of their trends over time. Such
knowledge provides a new set of possibilities for improving Maritime Situational Awareness and safety
of navigation, understanding what is happening and might be happening at sea.
This event brought together technology and research providers (academia, industry) and users
(operational authorities) in the field of Maritime Knowledge Discovery to identify current capability
gaps and highlight the most promising research strands.
Authorities set the scene either through presentations (Section I), speeches and live demos introducing
the current operational capabilities. This was followed up by industry (Section II), showing the latest
state-of-the-art on big data services in the maritime domain. Finally, academia and research centres
introduced the latest research efforts and methods to improve knowledge discovery in the maritime
domain (Section III).
A final round-table discussion helped collecting suggestions from authorities and industry to highlight
the most promising and relevant areas of research and identified, together with research providers,
possible solutions. This is summarized in the Conclusions and Remarks Section.

Maritime Knowledge Discovery and Anomaly Detection Workshop, 5-6 July 2016
6
SECTION I: OPERATIONAL AUTHORITIES
Maritime Knowledge Discovery and Anomaly Detection Workshop, 5-6 July 2016
7
STATISTICAL ANOMALY DETECTION FOR MARITIME SURVEILLANCE
AND MONITORING
Anders Holst1, Peter Ryman
2, Anders Linse
3
1SICS Swedish ICT
2Swedish Coast Guard
3HiQ
ABSTRACT
In a six year research collaboration between authorities,
academy and industry, a module for anomaly detection has
been developed, the SADV module, which is since 2016 in
operation in the maritime surveillance system SjöBASIS
used by Swedish authorities. The SADV module detects
anomalies in the maritime situational awareness picture,
which increases the maritime authorities capacity to
discover, react and prevent risks at sea.
The module is generic, in the sense that it can be adapted
for several maritime surveillance systems, and it can be
extended with new statistical, rule based, or hybrid anomaly
detection capabilities. Currently implemented anomaly
detection functions include detection of unusual movement
patterns, meetings at sea, and risk of grounding. The
interface between the anomaly detection module and the
surveillance system is thin to make adaptation easy.
Index Terms— Maritime surveillance, Anomaly
detection, Movement pattern, Meetings at sea, Risk of
grounding
1. BACKGROUND
Maritime traffic is constantly increasing, and is expected to
continue to grow. Only around the coasts of Sweden there
are around 8000 maritime vessels at any instant. It is a
demanding task for the maritime surveillance operators to
monitor all these vessels and find those that are involved in
incidents, hazardous behaviour, or illegal activities. The
purpose of the six year research collaboration SADV,
“Statistical Anomaly Detection and Visualization for
Maritime Domain Awareness”, has been to develop a tool
that can support the operators by finding and highlighting
vessels with anomalous or suspicious behaviour. To solve
this, a module for anomaly detection for use within maritime
surveillance platforms was developed. The project was
jointly lead by the Swedish Coast Guard responsible for
development of SjöBASIS, HiQ that implements and
maintains the SjöBASIS system, and the computer science
research institute SICS with over 15 years experience of
developing and applying methods for anomaly detection.
Other participants were the Swedish Customs Service, the
Swedish Armed Forces, Saab AB, the Swedish Space
Company, and Blekinge University.
2. SADV MODULE ARCHITECTURE
The SADV module is designed to be highly generic, in the
sense that it can be adapted for several maritime
surveillance systems, and it can be extended with several
different anomaly detection capabilities. To make it easy to
adapt to different surveillance systems, the module
communicates via a restful web interface, which is kept
minimal for simplicity: In essence, maritime situational data
is fed from the surveillance system to the module, which
analyses it and sends back generated alarms for presentation
in the surveillance system. It is also possible to configure
the module via the interface, to control which kind of
detection is activated and with what parameters.
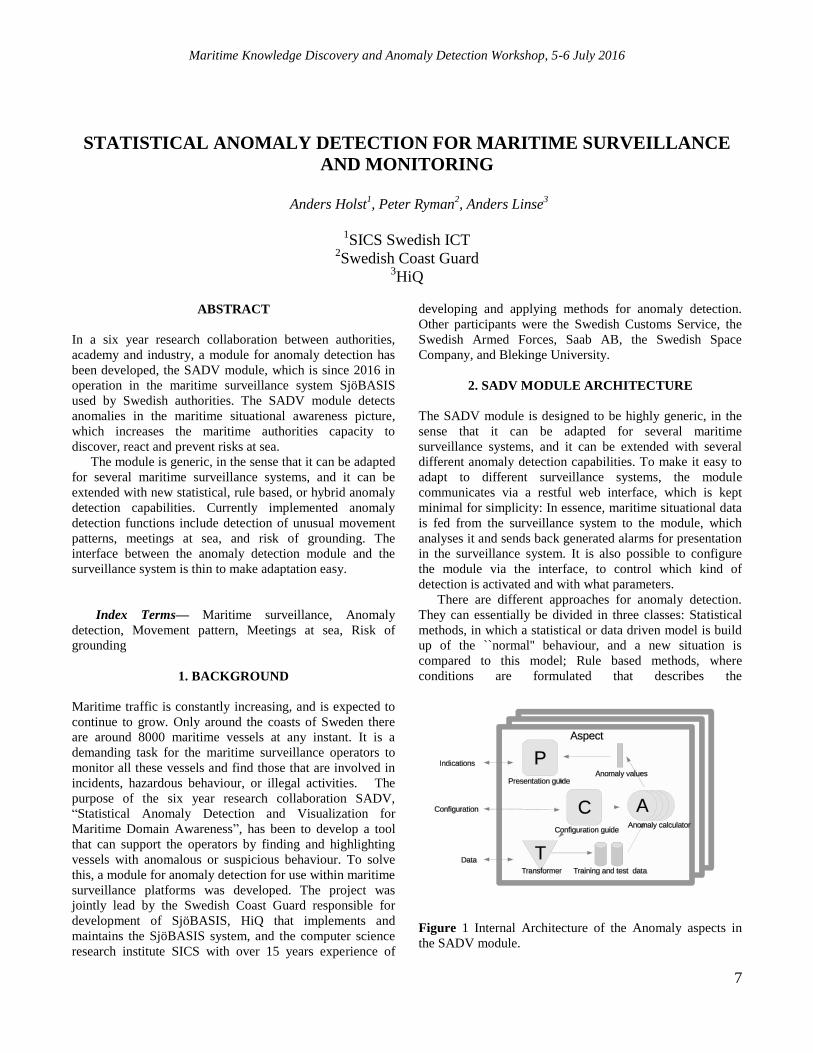
There are different approaches for anomaly detection.
They can essentially be divided in three classes: Statistical
methods, in which a statistical or data driven model is build
up of the ``normal'' behaviour, and a new situation is
compared to this model; Rule based methods, where
conditions are formulated that describes the
Figure 1 Internal Architecture of the Anomaly aspects in
the SADV module.
Maritime Knowledge Discovery and Anomaly Detection Workshop, 5-6 July 2016
8
anomalous situations of interest; and Model based methods,
in which a physical model or simulator is created to mimic
the real system, and when the real system diverges from the
simulation there is an anomaly. The most common approach
in maritime surveillance has been rule based, i.e conditions
can be formulated for ships to detect. When statistical
methods are used they are often quite simple, such as
focusing on momentary speed and direction. The goal in the
SADV project has been to create a framework that can
handle all the approaches [1] and to significantly advance
the use of statistical anomaly detection.
There are different ways for a vessel to be anomalous.
Which anomalies that are found by a specific detector
depend on which features in the data that are considered.
The SADV module uses the concept of Anomaly Aspects,
each of which focuses on a specific type of anomaly, i.e.
checks for anomalies with respect to a certain set of
features, using one or a combination of the anomaly
detection approaches. Figure 1 shows the internal structure
of an Aspect. The most critical part of an Aspect for what
anomalies are found is the Transformer, which converts the
stream of raw situational data into the relevant high level
features. The Anomaly calculator assesses the anomaly
score based on those features, and the Presentation guide
maintains a set of anomaly indications based on those
scores.
3. IMPLEMENTED ANOMALY DETECTORS
Currently there are three Anomaly Aspects implemented
and used in operation today. They are described here. The
SADV module is designed to make it easy to add new
aspects in the future.
3.1 Movement pattern
The Movement pattern aspect is a statistical anomaly
detector. Rather than focusing on momentary speed and
course, it characterises a vessel in terms of how many stops
and turns it performs during a journey. The idea is that each
vessel type has a certain probability of performing different
movements at any instant, and the movements will give
some indication of the activities of the vessel. Based on
previously reported data there is an estimation of an
expected number of movements, during a certain period of
time, connected to a certain type of vessel. If the number of
movements exceeds the accepted statistical variation, this is
considered an anomaly that could be worth checking
manually. The aspect takes into consideration various
movements typical of standard vessels, such as speed
changes, stopping, waiting still, turnings and rotation, and
also whether the movement was performed close to the
shore or in open sea. The aspect uses the ISC framework for
statistical anomaly detection [2], based on parametric
models and Bayesian statistics.
When a ship starts to move in an uncharacteristic way,
e.g. turns unexpectedly or stops too many times, the alarm
will go off. One example is a container ship which in
October 2015 was en route from Poland to Ystad in the
south of Sweden in rough weather. The system detected that
the ship had lost the ability to steer and started to drift, due
to its irregular movements.
Patterns of movement that does not match the boat type
can also reveal that the ship is doing something illegal, such
as a recreational boat who behaves like a fishing boat can
try to escape the fishing quotas.
3.2 Meetings at sea
When two boats meet at sea, it may be indicative of
fraudulent activity. It may be smuggling, attempted piracy,
or unloading the catches to avoid fishing quotas. Another
kind of meeting is two boats running in parallel, which may
indicate trawling, which is not permitted everywhere.
Most surveillance systems offer the opportunity to check
for meetings with an in advance specified vessel. However,
the Meeting aspect is a rule based detector which employs
an indexing scheme to be able to quickly detect meetings
between any two vessels not of a type that are expected to
meet. Especially interesting are meetings when one of the
vessels is lacking any transponder signal such as AIS.
3.2 Risk of grounding
The Grounding aspects is a combination between a rule
based and statistical detector which tries to predict if there is
a risk of running aground. A vessel that moves off the
fairway and approaches waters shallower than the draught of
the vessel will generate an alarm. The rule based part
compares the draught with the depth ahead of the vessel
according the sea chart. The statistical part compares the
vessels position and course with how other vessels have
moved to see if it is significantly different.
A grounding alarm is generated about 3 minutes before
the grounding will happen, which will give the vessel time
to react and steer away. Since the grounding of tankers is
one of the most serious threats to our oceans, the possibility
of real-time monitoring of grounding risk is an important
functionality.
4. DISCUSSION
The SADV module is used in operation since January 2016
at the Swedish Coast Guard. The basic principles are based
in more than 15 years research. Yet it is a major endeavour
to actually make these methods work in practice.
Maritime Knowledge Discovery and Anomaly Detection Workshop, 5-6 July 2016
9
First, of course, real world data is never clean. There are
missing data, noisy data, and even deliberate misinformation
in the data, all of which must be handled. This requires
robust methods that do not rely on perfect data. Unrealistic
or improbable sensor readings, such as rapidly fluctuating
speeds or positions, should be filtered out. It is otherwise a
common phenomenon that issues with the data quality will
give rise to false alarms, i.e. the vessel is quite normal but
noise in the data make it appear strange (like rapidly
jumping between two distant locations).
Much work has been done to minimise the number of
false alarms. A system that gives too many false alarms is
not trusted by the operators and will soon be ignored.
Therefore, the goal has been that the number of false alarms
must be in the same order as the number of real interesting
events. This is a very high ambition in fact, as the number of
interesting events is so much smaller than the number of
evaluated events, and there are so many artifacts in the data
that may give rise to false alarms.
The sampling frequency differs much between different
sources. Some sources are sampled in the order of once
every ten seconds, whereas others are only sampled once
every six minutes. To be able to detect the risk of grounding
with three minutes margin, or detect vessels that are drifting
by noting their irregular movements, six minutes is clearly
too long. Furthermore, data from some sources are delayed,
sometimes up to 20 minutes, before they reach the
surveillance system, which poses a similar problem. When
designing future surveillance systems this should be kept in
mind.
Many surveillance systems offer the possibility for the
operators to design rules for what to detect. One experience
from this project is that designing a useful detection rule
takes considerable effort, and knowledge both of the
maritime surveillance domain and of anomaly detection
methodology. Fine tuning the rule to avoid false alarms take
even longer. It is not feasible to assume that the operators
can spend their time to design such rules. Useful rules need
to be provided for the operators by the system.
There is currently a strong demand for tools and decision
support in surveillance and monitoring, and development
within statistical machine learning and anomaly detection is
very rapid. There will be many more systems appearing for
maritime anomaly detection in the near future. No doubt
there is much more to do, but the SADV project has given
many valuable insights and experiences in this process.
5. REFERENCES
[1] A. Holst, B. Bjurling, J. Ekman, Å Rudström, K. Wallenius, M.
Björkman, F. Fooladvandi, R. Laxhammar, and J. Trönninger, “A
Joint Statistical and Symbolic Anomaly Detection System:
Increasing performance in maritime surveillance,” in 15 th
International Conference on Information Fusion (FUSION), 2012
pp.1919-1926.
[2] A. Holst, J. Ekman, “Incremental stream clustering for anomaly
detection and classification,” in 11th Scandinavian Conference on
Artificial Intelligence, 2011 pp.100-107.

Maritime Knowledge Discovery and Anomaly Detection Workshop, 5-6 July 2016
10
PORTUGUESE NAVY PERSPECTIVE IN MARITIME SITUATIONAL
AWARENESS – THE ANOMALY DETECTION
LCDR Pedro Serafim
Portuguese Navy
1. INTRODUCTION
In the last few years, a significant increase in marine
traffic has been registered in the Portuguese Sea Lines of
Communication. A 65%-fold increase1 in Automatic
Identification System (AIS) contacts alone has been
reported. This kind of heavy traffic brings a whole new
challenge in the management and tracking of the full
spectrum of marine activity. An increased flow in activity
brings an increased number of subsequent illegal
activities. To face this situation, the Portuguese Navy
is committed in the development of its maritime systems,
preparing itself to face new challenges in the maritime
security domain, in order to control, protect and act in its
areas of interest. Portugal has a large maritime area of
responsibility and therefore a high effectiveness is
required to the Portuguese Navy, in terms of surveillance.
The Portuguese Navy Maritime Operations Centre
(COMAR) performs an important role in this regard, in
order to develop a full Maritime Situational Awareness.
In terms of law enforcement, the Portuguese Navy
major tasks range from patrol and surveillance of
maritime activities, to direct combat of illicit activities
(such as illegal fishing, drug trafficking, illegal
immigration or piracy) never forgetting the sustainability
of the ocean and its resources.
2. COMAR AND THE MARITIME SITUATIONAL
AWARENESS
COMAR was created in June of 2008, under the
Portuguese Navy’s Command Fleet structure. The Centre
is co-located with the Maritime Rescue Coordination
Centre Lisboa. The mission of COMAR is to support
the operations of the Portuguese Navy, the Maritime
Authority activities and the Hydrographic Institute in
conducting operations, exercises and other activities at
sea, in order to ensure the freedom of navigation and
protection of the sea lines of communication as well as a
more effective and efficient
12014 – 198 028 AIS Contacts
2015 – 305 690 AIS Contacts
State Authority in the areas under national sovereignty
and jurisdiction.
On the other hand, COMAR is also responsible for
collecting, processing and sharing the information
required for the acquisition and maintenance of a
maritime situational awareness in the Portuguese State
area of interest, in coordination with the Joint HQ
(EMGFA) and other national and international operational
centers.
To accomplish its mission, COMAR has a diverse
array of technological systems (military and civilian) and
the necessary human resources and organization. The
centre is equipped with many information systems that
can be divided in two broad categories:
Coastal Systems: A network of Automatic Identification
System (AIS) Support Structures, Vessel Monitoring
System (VMS), Vessel Traffic Services (with Coastal
Radars), Integrated Maritime Data Environment
(IMDatE) from EMSA;
Offshore Systems: Which include Satellite AIS (SAT
AIS), the Long Range Identification and Tracking (LRIT)
the VRMTC coordinated by Italian Navy, and NATO
Military Systems (MCCIS, C2PC, and MMHS).Both of
those systems rely heavily on the information and
validation gathered by the Navy and Air Force assets. The
management of all the information in a coherent decision
making support structure is crucial. Therefore, all the
processes ranging from analysis to validation, contribute
cumulatively to the overall superiority of information for
decision making, in all three levels of operational activity
(tactical, operational and strategic). This constitutes the
main mission and purpose of COMAR: to provide a
coherent and integrated support for decision making.
In terms of human resources, the complement of the
Centre is comprised of teams of 7 people in 12-hour
shifts, on a 24/7 basis. The modular arrangement of the
centre allows the installment of several extra
workstations, which upgrade the planning and execution
capacity for a large spectrum of operations and other
actions at sea.
Maritime Knowledge Discovery and Anomaly Detection Workshop, 5-6 July 2016
11
2.1. The anomaly detection
Since 2012, COMAR use a system developed by
Portuguese Navy and the National Company Critical
Software, OVERSEE.
OVERSEE is a system of systems that provides a geo-
referenced display of traffic information (AIS, SAT AIS
and VMS), Global Maritime Distress System (GMDSS)
distress alerts (COSPAS - SARSAT) and Meteorological
information, all spread out in cartographic and
hydrographic layers, available in a single screen. This
system is based on three pillars: Law Enforcement,
Search and Rescue and Environmental Protection.
To support the Law Enforcement, the system creates
and manages different alarms, based on parameters such
as vessel characteristics, position and status, cartographic
elements such as Economic Exclusive Zone, Search and
Rescue Area, Territorial Waters, or a specific area defined
by the operator. This tool, allows operators to set up
alarms to trigger when the system detects a vessel-related
event based on a set of conditions:
Listed vessels enters area: will trigger an alarm whenever
one of the vessels specified on a list enters one of the
specified areas (e.g. whenever vessels X,W or Z enter the
Portuguese EEZ).
Vessel with set of characteristics enters area: will trigger
an alarm whenever a vessel with one of the specified set
of characteristics (Type, Subtype, Flag, Length, Breadth,
Deadweight, or Gross Tonnage) enters one of the
specified areas (e.g. whenever a non-national fishing
vessel enters the Portuguese EEZ).
To Analyse Track Records, it’s possible to view the
historical positions of a vessel, and navigational data,
from the last 12 hours (past data ranging up until a 6
month period).The system also has a Time Machine Tool,
that allows operators to navigate back and forth in time on
the Maritime Picture, for instance to review the past
position and movement of vessels and other objects on the
map or to preview the weather conditions in the near
future.
To support Search and Rescue Operations, the system,
provides an estimate of the risk of the vessel being
overdue, using an algorithm that assesses if the vessel is
taking unusually long time to report its position, by taking
into account the time of the last position report received,
the distance to the coastline and other factors.
OVERSEE automatically creates an alert when a
COSPAS- SARSAT distress alert is received in the
Centre, showing the position, the details and the casualty
of the distressed vessel.
The Time Machine Tool is also very valuable in
Environmental Protection scenarios. In most cases,
EMSA broadcasts a notification, regarding pollution spots
(detected in CLEANSEANET). The Time Machine Tool
is then used to investigate and correlate the spot with a
specific contact.
2.2. Fusing and mining vessel traffic data
With so many Information Systems, the eyes of operators
are no longer enough, and that is the reason why navies
are actually developing systems capable to integrate
multiple sources.
COMAR explores actually two systems with data fusion:
VTS and OVERSEE.
The VTS, provided by the Directorate General for
Natural Resources Safety and Maritime Services (DGRM)
fuses the information of Coastal Radars and AIS, and
offers an integrated Picture of all the Portuguese Coast.
The OVERSEE, fuses the information of Maritime
Traffic Systems (AIS, AIS (S) and VMS) and integrates
several sources of information into a aggregate product
with cartography, emergency alerting system, weather and
oceanographic data. In the near future this system will
receive LRIT Data and Radar Information (currently
being developed through a partnership between Navy and
Maritime Authority).
3. CONCLUSION
The solution found by the Portuguese Navy, to fulfill its
mission, and the national commitments assumed by
Portugal under the framework of the International
Maritime Organization results from a systemic approach,
and can be translated in an effective gain of efficiency in
the State action in the areas under the national sovereignty
and jurisdiction.
Conceptually, COMAR is a Maritime Operations
Centre which is also a Maritime Rescue Coordination
Centre, that produces Maritime Situational Awareness
and is able to command and control Naval Operations and
to plan and coordinate Maritime Security Operations, in
close support to external Agencies, if required.
Since 2013, COMAR has been using successfully the
OVERSEE system to promote anomaly detection in
support of military and non-military operations
(operations planning, abnormal behaviour detection and
operations conduction).
Maritime Knowledge Discovery and Anomaly Detection Workshop, 5-6 July 2016
12
AUTOMATED BEHAVIOUR MONITORING (ABM) ALGORITHMS –
OPERATIONAL USE AT EMSA
European Maritime Safety Agency (EMSA)
ABSTRACT
The European Maritime Safety Agency’s (EMSA)
Automated Behaviour Monitoring (ABM) tool is a
computer rule-based system analysing vessel positions
(approximately 18 million daily) for the detection and
alerting of abnormal and/or user specific vessel
behaviours. The aim of the ABMs is to support Integrated
Maritime Service users in their maritime surveillance
functions, by providing an enhanced situational awareness
picture in real-time. Currently the set of abnormal and/or
user specific behaviours includes: entering an area,
encounters at sea, close approach to shore or an area,
sudden changes in heading, speed or reporting frequency;
are operationally used. When specific, user-defined
criteria are met, operators can be automatically alerted via
warnings in the graphical interface, e-mails or S2S
connections. With the growing number of ABM users and
the operational experience gathered within the context of
EMSA’s Integrated Maritime Services (IMS), a number
of challenges and requirements for new user defined
abnormal/specific vessel behaviours have been identified.
These include: detection of transponders switched-off or
vessels deviating from the usual routes, especially in the
remote areas. Fake position or fake identity reports are
also difficult to discover. Use of the Earth Observation
(EO) based (Vessel Detection System - VDS)
technologies as well as the operational use of the
statistically aggregated position reports may be worth
exploring for further enhancements of the ABM services.
Index Terms— Maritime surveillance, Anomaly
detection
1. EMSA
The idea of a European Maritime Safety Agency (EMSA)
originated in the late 1990s along with a number of other
important European maritime safety initiatives (‘Erika’
package). EMSA was set up as the regulatory agency that
provides support to the European Commission (EC) and
the EU Member States (MS) in the field of maritime
safety and prevention of pollution from ships. EMSA was
established by Regulation (EC) No 1406/2002 and
subsequent amendments. Among other tasks, EMSA
facilitates the technical cooperation between EU Member
States and the EC for the exchange of EU vessel traffic
information, the long-range identification and tracking of
vessels and to support EU operational reporting services.
Consequently, EMSA operates and manages a suite of
maritime applications which receive, process, and
distribute information on, inter-alia, vessel traffic reports
(LRIT, SafeSeaNet), Earth Observation (EO) satellite
monitoring (CleanSeaNet), and Port State Control
(THETIS). The services provided by these maritime
applications are shared with EU Member States the EC,
and other EU Bodies.
EMSA has also developed a platform to guarantee the
performance, availability and reliability of all the
maritime information systems it hosts. This platform
integrates and correlates different types of data, including
data provided by the end-users, to produce customised
services tailored to specific requirements. These services
are called Integrated Maritime Services (IMS), and are
used by MS authorities to obtain the most complete
maritime situational awareness, building a common
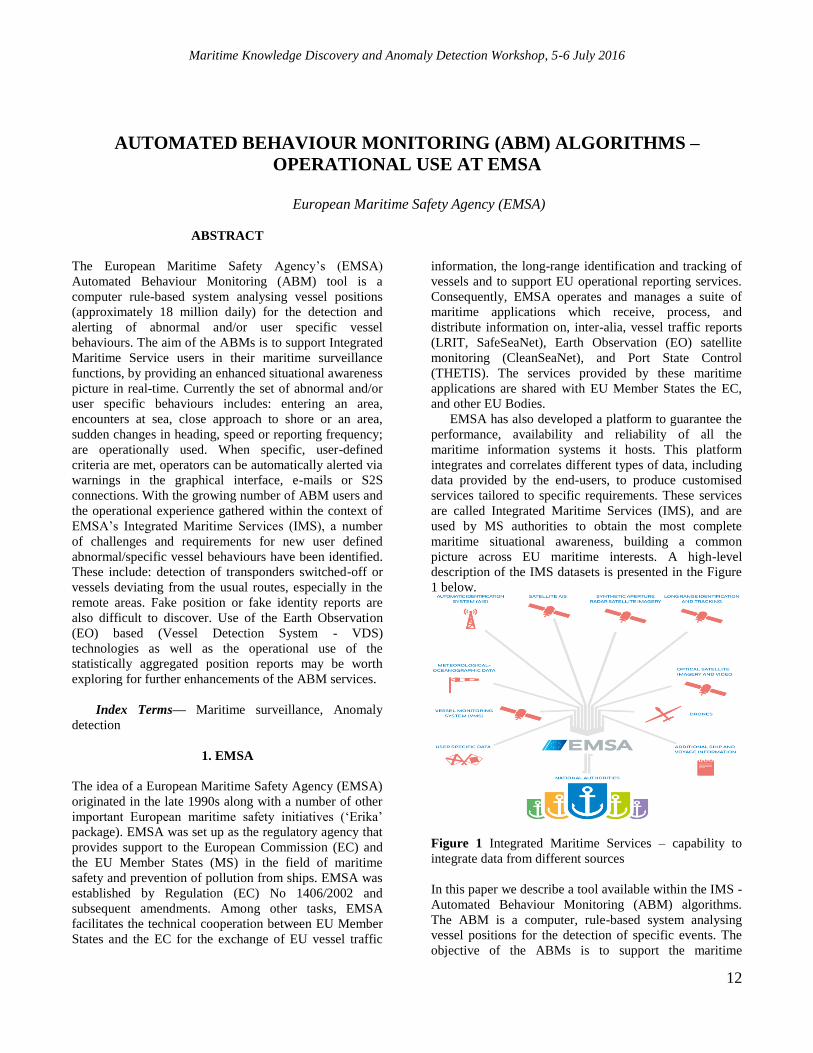
picture across EU maritime interests. A high-level
description of the IMS datasets is presented in the Figure
1 below.
Figure 1 Integrated Maritime Services – capability to
integrate data from different sources
In this paper we describe a tool available within the IMS -
Automated Behaviour Monitoring (ABM) algorithms.
The ABM is a computer, rule-based system analysing
vessel positions for the detection of specific events. The
objective of the ABMs is to support the maritime
Maritime Knowledge Discovery and Anomaly Detection Workshop, 5-6 July 2016
13
surveillance operators, by automatically analysing
position reports and alerting upon detection of abnormal
events.
2. AUTOMATED BEHAVIOUR MONITORING
(ABM) ALGORITHMS IN IMS
As previously stated, ABMs are a functionality of IMS
which analyses real time vessel position reports provided
for a specific time period and area of interest (AOI), as
defined by the users. The system focuses on the detection
of specific events, and therefore may be categorized as
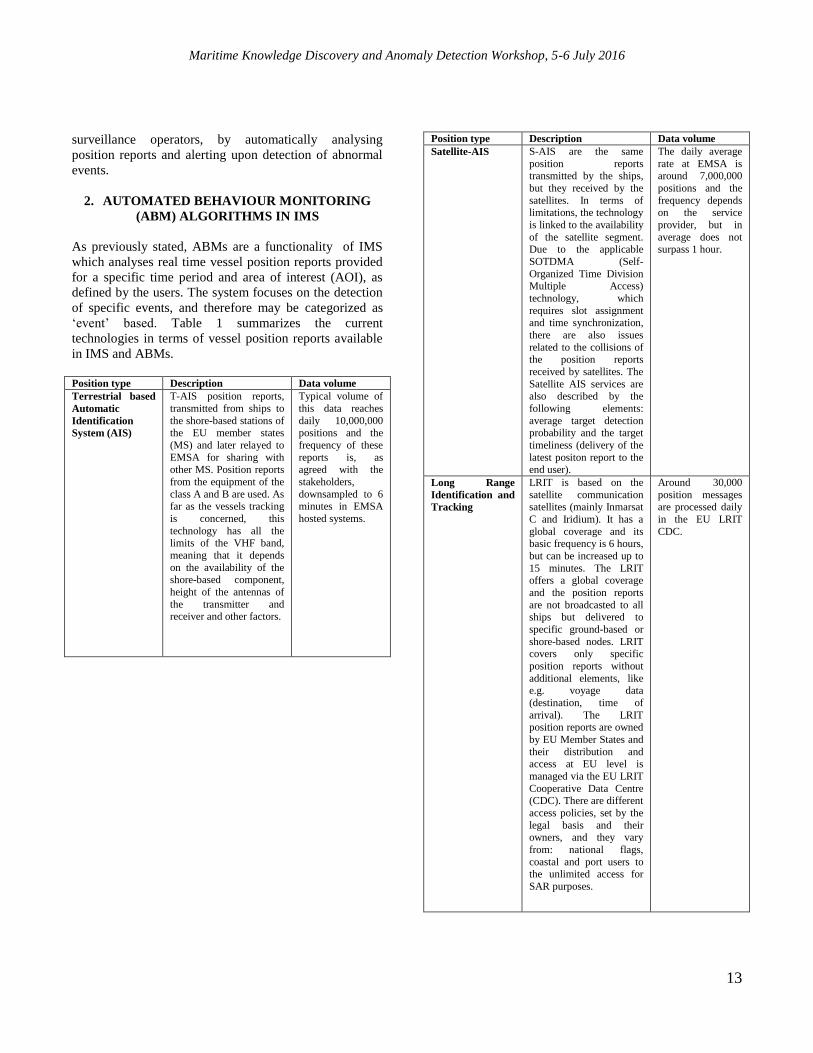
‘event’ based. Table 1 summarizes the current
technologies in terms of vessel position reports available
in IMS and ABMs.
Position type Description Data volume
Terrestrial based
Automatic
Identification
System (AIS)
T-AIS position reports,
transmitted from ships to
the shore-based stations of the EU member states
(MS) and later relayed to
EMSA for sharing with other MS. Position reports
from the equipment of the
class A and B are used. As
far as the vessels tracking
is concerned, this
technology has all the limits of the VHF band,
meaning that it depends
on the availability of the shore-based component,
height of the antennas of
the transmitter and receiver and other factors.
Typical volume of
this data reaches
daily 10,000,000 positions and the
frequency of these
reports is, as agreed with the
stakeholders,
downsampled to 6
minutes in EMSA
hosted systems.
Position type Description Data volume
Satellite-AIS S-AIS are the same
position reports transmitted by the ships,
but they received by the
satellites. In terms of limitations, the technology
is linked to the availability
of the satellite segment. Due to the applicable
SOTDMA (Self-
Organized Time Division Multiple Access)
technology, which
requires slot assignment and time synchronization,
there are also issues
related to the collisions of the position reports
received by satellites. The
Satellite AIS services are also described by the
following elements:
average target detection probability and the target
timeliness (delivery of the
latest positon report to the end user).
The daily average
rate at EMSA is around 7,000,000
positions and the
frequency depends on the service
provider, but in
average does not surpass 1 hour.
Long Range
Identification and
Tracking
LRIT is based on the
satellite communication
satellites (mainly Inmarsat
C and Iridium). It has a
global coverage and its basic frequency is 6 hours,
but can be increased up to
15 minutes. The LRIT offers a global coverage
and the position reports
are not broadcasted to all ships but delivered to
specific ground-based or
shore-based nodes. LRIT covers only specific
position reports without
additional elements, like e.g. voyage data
(destination, time of
arrival). The LRIT position reports are owned
by EU Member States and
their distribution and access at EU level is
managed via the EU LRIT
Cooperative Data Centre (CDC). There are different
access policies, set by the
legal basis and their owners, and they vary
from: national flags,
coastal and port users to the unlimited access for
SAR purposes.
Around 30,000
position messages
are processed daily
in the EU LRIT
CDC.

Maritime Knowledge Discovery and Anomaly Detection Workshop, 5-6 July 2016
14
Position type Description Data volume
Vessel Monitoring
System
VMS uses similar
satellite-based communication
technology as LRIT,
presenting similar limitations in terms of
availability and frequency.
Its basic frequency is 2 hours, but can be
increased up to 15
minutes. VMS is limited to fishing vessels (or
vessels involved in the
fishing operations) only. In EU, these position
reports are made available
to the flag states and shared, as decided by each
member state, based on
the cooperation between European Fisheries
Control Agency (EFCA)
and EMSA. The information is usually
made available only to the
flag users.
EMSA processes
around 5,000 VMS messages daily.
Table 1 - Position reports in the EMSA hosted systems
4. ABM TYPES
The ‘event’ based ABM technology currently used
obliges the user to select the type of event to be detected,
in addition to the AOI and time definition. Patterns, such
as entering an area of interest, encounters at sea, approach
to shore or ports, changes in the heading, speed and
reporting frequency, and others, are analysed and
detected. Table 2 illustrates the available ABMs and
provides a concise description of the events detected.
ABM Type – description which events
are automatically detected
ABM name
Entry of a particular vessel(s) to an area of interest
InArea
Passage of a vessel close to the shore DistanceToShore
Vessels entering or leaving ports AtPortAtSea
Anchored vessels Anchorage
Frequency of vessels’ position reports
higher or lower than expected
UnderOverReporting
Vessels approaching one another closer
than an indicated distance, with a speed
below defined threshold
AtSeaEncounter
Change of heading higher than a
threshold (e.g. more than 20 deg.)
SuddenChangeOfHeading
Sudden change of speed SuddenChangeOfSpeed
Change of speed above or below a limit
set
SpeedAnomallyOverPeriod
Passage of a vessel close to an area of
interest
DistancetoArea
Vessels entering a closed area at a
specific time
TimeAndPeriodOfDay
Table 2 - ABMs available to users via EMSA’s
interfaces, June 2016
5. ALERTING TECHNIQUES
Following the detection of particular events, end-users are
automatically alerted. One of the advantages of the ABM
related functionalities is that the system distributes the
alerts in different forms:
• By email or via system-to-system (S2S)
interface, to the off-line users;
• Via alerts (visual and audio) to online users of
the IMS graphical interface (GI).
The operational experience proves that the alerts are
produced and delivered to the users via the
aforementioned interfaces rapidly – the minimum time for
the delivery is ≤ 2 minutes in case of non-complex events
and maximum time is ≥ 1 hour for the very complex
algorithms or in case of delayed position reports.
As previously mentioned, the detection of the specific
events, as well as the related alerting, depends on the
presence and timeliness of the position reports and the
complexity of the algorithms applied. For example, in
remote areas where only infrequent LRIT or S-AIS
reports are available, the related detection and reporting
may require more time in comparison to the areas of high
traffic density and proximity of the receivers (i.e. shore-
based stations – like AIS stations). Additionally, detection
of a single position report in a small area of interest is less
computationally intensive than the analysis of multiple
positions for the ‘close encounters’ or ‘drifting’ in large
areas.
6. ABM OPERATIONAL USE CASES
As of June 2016 there are 56 different ABM instances
actively running for users within the EU Member States
and the EU Bodies. Due to the positive feedback from the
operational users, as well as the validation in the real case
scenarios, EMSA noted an increasing interest of the EU
Member States and EU Bodies in the use of the ABMs.
Some use cases of their operational application by

Maritime Knowledge Discovery and Anomaly Detection Workshop, 5-6 July 2016
15
different user communities are presented further below
(see also the reference made to the ABM types listed in
Table 2). It is important to underline that the definition of
communities is linked with the functional approach (it is
independent of the governmental department/authority in
which users are based) and is used by the authors for
illustrating the use cases only.
6.1. Security community
‘Security communities’ dealing, for example, with the
tobacco smuggling, drug trafficking, or population mass
movements may be concerned about vessels that approach
one another and remain at a close distance for a period of
time. Such behaviour may indicate routine ship-to-ship
operations (transhipment of goods or fuel) which are
normally reported in advance to the shore-based
authorities. Unreported encounters at sea may however
suggest some illicit activities. Security communities profit
from using the AtSeaEncounter ABM for the automatic
detection of these events. In this context it is important to
exclude the port areas from the analysis, in order to avoid
the detection and reporting on the routine arrivals or
departures, which in turn may be detected by other,
existing ABM type (AtPortAtSea).
6.1. Safety community
Typical use case scenario for the maritime ‘safety
community’ may be related to the monitoring of the areas
of interest, like: sensitive or protected areas, vulnerable
ecosystems or its own flag ships. In such cases, operations
of vessels may be restricted or regulated by the
responsible authorities. ABMs support the related
monitoring activities, for example, by providing alerting
for ships passing at a specific distance (DistanceToShore;
DistancetoArea) or simply entering the area (InArea).
Additional factors may be considered in the automatic
analysis, such as: entries to the areas temporarily closed
for navigation (TimeAndPeriodOfDay) or decrease or
increase of the position reporting frequencies
(UnderOverReporting).
6.2. Traffic monitoring community
For the 'traffic monitoring' communities which are, for
example, engaged in the management of the Mandatory
Reporting Systems (MRS), recommended sea routes or
traffic separation schemes (TSS) ABMs may offer
detection of the events related to: sudden change of
heading (SuddenChangeOfHeading), anchoring in non-
designated places or locations of the underwater
infrastructure (Anchorage). As for the 'safety community'
mentioned before, the authorities responsible for the
traffic monitoring also profit from the simple detection of
the position reports (InArea) applying specific filters per
ship types (e.g. verifying only tankers) or flag of the ship
(by monitoring its own fleet or fleets flying the ‘high risk’
flags).
6.2. Fisheries
The 'fisheries' communities may, for example, focus on
specific vessels or specific types. Using the InArea ABMs
combined with filters, on geographical area and vessel
types, it is possible to effectively monitor presence of the
specific fishing gears or activities in the fishing grounds.
The ‘fisheries’ communities may be also interested in
detecting specific behaviours that may indicate launching
of the fishing gears (SuddenChangeOfSpeed,
SpeedAnomallyOverPeriod).
7. NEW REQUIREMENTS
Recent developments linked with the operational
experience gained by the users have led to the definition
of new requirements. These reflect new situations
encountered or the development of new types of activities
at sea. They can be divided into two main groups: the first
one expanding the existing, ‘event’ based ABMs and the
second one applying a new, ‘statistical’ based approach.
For the latter one, specific behaviours could be modelled
based on the statistical data and later used as a reference
(e.g. model usual routes, behaviours for specific ships).
The following requirements were noted, during a dialogue
conducted by EMSA with users, at various forums.
I - Expanding the ‘event’ based ABMs
• Use of the Earth Observation (EO) data for the
detection of vessels with inactive identification
transponders;
• Detection of vessels spoofing (deliberately
altering) their position reports or identification.
•
II- Applying the ‘statistical’ based approach
• Reproduction of the routes and behaviours, per
type of ship, destination or cargo carried on-
board and a detection of a deviation from the
usual route;
• Modelling of the impact of meteorological
conditions on the ship behaviour or routes;
• Profiling of the vessels (e.g. vessels prone to
specific incidents) based on the past safety or
security record or other available, reference data.

Maritime Knowledge Discovery and Anomaly Detection Workshop, 5-6 July 2016
16
8. WHAT’S NEXT?
The precondition for the effective ABM operations is the
availability of the ship detection techniques (using active
detection sensors like radars, or passive ones like
cameras); tracking data (use of the active identification
transponders); as well as the additional, reference data
sets (e.g. statistical record of the trading areas, cargoes
carried, incidents or accidents, security issues) for the
analysis and detection of specific events.
As the use of the ABM aims at easing the work of the
maritime surveillance operators, and supporting an early,
automatic detection of specific events, other aspects have
to be considered for the future developments. These are
related to the capability of processing large sets of
information. There are around 90,000 vessels engaged in
the international trade worldwide (out of which around
20,000 at any given time around Europe) and
approximately another 100,000 equipped with the active
AIS transponders. This results in over 17,000,000 AIS
position reports detected/ processed on a daily basis.
Consequently, ABMs should be capable of rapidly
analysing big data sets, in order to detect events and
notify end-users in a timely manner.
Maritime Knowledge Discovery and Anomaly Detection Workshop, 5-6 July 2016
17
SENSORS IN NATO MARITIME SITUATIONAL AWARENESS
Lt Cdr Davide Severino
NATO Shipping Centre
ABSTRACT
NATO Maritime situation awareness is defined as the
enabling capability which seeks to deliver the required
information superiority in the maritime environment, to
achieve a common understanding of the maritime
situation, in order to increase effectiveness in the planning
and conduct of the operations. NATO MSA is based on
MSA Concept development plan issued in 2008 and,
since then, it is drastically evolving along with technology
evolution. Although MSA was initially focused on
specific areas of interest, the CD plan has recognized it as
a global challenge, requiring a good engagement among
national, international, industry and academy players.
Many coastal nations are, indeed, developing their
national MSA plans, to satisfy their operational needs and
positively contribute to alliance’s MSA.
NATO MARCOM MSA is currently based on AIS, LRIT
and the contribution from assets under NATO or national
operational control. A key role is played by the satellite
based AIS: companies are improving both satellite and
ground based networks in order to reduce data latency,
revisit time and increase satellite detection capability.
Both incumbents and newcomer companies declare they
will have the new network fully operational by 2nd to 4th
quarter 2017. By that time the quality of S/AIS is
expected to be closer to T/AIS one. Being AIS (as well as
LRIT and VMS) a cooperative source it is assessed not to
have the highest level of confidence among sources. AIS
data should be correlated with non-cooperative sources
such as satellite radar or electro-optical, in order to be
validated. Satellite network provided with radar and
electro-optical sensors would greatly improve data
confidence level.
A third source, the most reliable, being non cooperative
and non-sensor based, is the one provided by the assets in
the area which can visually confirm the accuracy of data
received by sensors.
Index Terms— Maritime surveillance, Anomaly
detection, Movement pattern, Meetings at sea, Risk of
grounding
1. INTRODUCTION
Although NATO is by definition focused on North
Atlantic, NATO MSA is of course a global challenge.
Indeed vessels sail at increasingly faster speeds
throughout the oceans often changing flag, name and,
most importantly, owners and operators; therefore no
MSA can ever be effective if not under a global
perspective.
According to a study conducted by a commercial
company, 27% of vessels provided with class A AIS do
not transmit for at least the 10% of their activity and 19%
of ships “going dark” are involved in some sort of illicit
activity or activities which might potentially include
threats to freedom of navigation and to security of
navigation or ways for funding criminal or even terrorist
organizations.
Of course, most of those vessels involved in illicit
activities are not even provided with transceivers, being
below the 300 GT threshold and many other vessels
purposely alter their transmissions not to be detectable or
recognizable. Therefore a sensor based non cooperative
MSA or even specific assets (aircraft, surface or
submarine) might be required.
Shipping is assessed being composed by nearly
150.000 class A AIS units plus other classes, not to
mention the so called “small vessels”, for which each
country develop a specific strategies (e.g. the SMSS small
vessel security strategy in the US, estimating nearly 20
million vessels smaller than 300 GT all over the country)
to prevent, disrupt and prosecute illicit activities
perpetrated with small vessels (let’s just think about
smuggling or migrant trafficking).
NATO MSA doesn’t aim to know everything about
each and every single civilian vessel but to build
awareness by knowing general trends for merchant
vessels as well as for fishing and leisure vessels. This
would help understanding maritime patterns and the
relevance of each pattern on global economy, to assess the
impact of maritime security related threats on maritime
activities.

Maritime Knowledge Discovery and Anomaly Detection Workshop, 5-6 July 2016
18
2. NATO MARITIME SITUATIONAL
AWARENESS
NATO MSA is defined as the Enabling capability … to
deliver the required information superiority in the
marine environment, to achieve a common
understanding of the maritime situation, in order to
increase effectiveness in the planning and conduct of
operations.
In its role as primary advisor to merchant shipping
regarding potential risks and possible interference with
maritime operations NATO Shipping Centre role builds,
maintains and analyses the “white” portion of MSA,
composed generically of all civilian vessels, craft and
boats sailing through the oceans. This way NSC also
supports NATO Operations (OCEAN SHIELD and
ACTIVE ENDEAVOUR) as well as national and
multinational operations and exercises.
White MSA is delivered by processing sensor based data,
non-sensor based data, network information and reports
from assets.
Sensor based data represent the main pillar of white
shipping MSA and can be classified as either cooperative
or non-cooperative, depending whether any form of
cooperation from target is needed (AIS, LRIT, VMS etc.)
or not (e.g. radar etc.). Additionally NATO Shipping
Centre relies on assets which can provide both sensor and
non-sensor based data.
In general terms, sensor based MSA requires:
a sensor (and multi-sensor)based network,
adequate to maintain the appropriate level of
awareness linked to a constantly updated and
reliable database
a proper database of usual patterns of behaviors
(often referred to as patterns of life – POL). This
is essential to recognize, based on specific areas
and seasons, what should be considered “usual”,
what “unusual” and what “suspect”
an analysis tool capable to process, identify and
classify those “anomalous” behaviors,
considered relevant for the specific needs
a list of tailored maritime situational indicators
to recognize suspicious behaviors within their
areas of interest.
The main sources of data NATO Shipping Centre uses for
building and managing the white shipping picture are:
2.1 AIS
Terrestrial AIS provides a fairly homogeneous coverage,
limited to roughly 50 nm from the coast, extended to all
AIS classes and with a virtually unlimited capability.
Each coastal nation has its own official network, mostly
used for traffic monitoring, collision avoidance and MSA
purposes. Although nations are not commercially
marketing their data, those are shared within international
community to participate in data sharing initiatives and
experimentations. VOLPE MSSIS is an important
example of data sharing: it is based on agreements
between the fusing center and each single nation. The
level of contribution is measurable to assess its quality
and each contributor is also requested to provide stations
lists to understand the coverage.
Additionally several private companies have established
terrestrial AIS networks by means of owned stations and /
or data purchased from other station owners. Most
terrestrial AIS providers fuse their data with satellite AIS
providers to offer more commercially valuable monitoring
services on the market.
Being NATO Shipping Centre focused on broad portions
of high seas, the recent developments of Satellite AIS are
closely monitored to understand the level of improvement
providers are achieving with regards to satellite networks,
orbits and ground based stations in order to
reduce latency to minimum
reduce data rejection
improve satellite passages
To achieve the required level of MSA, NATO Maritime
Command receives AIS satellite and terrestrial data from
commercial satellite AIS providers and from national and
commercial terrestrial AIS providers.
The main concern MARCOM faces regarding AIS data is
about confidentiality assessment as it requires a deep
knowledge of stations’ distribution along the coastline,
signals’ quality, coverage and status of transmission. On
the other hand, as satellite AIS providers have developed
their networks improvement plans, MSA team in
MARCOM is constantly assessing data quality
improvements in terms of latency, satellite revisiting time,
orbits and passages. Still about satellite AIS, a critical
issue is sensor’s capacity limits with regards to the risk
for it to get crammed and to start rejecting new data.
The combination of delays related to latency, satellite
passages and messages rejections affect satellite AIS
network reliability. However all providers MARCOM
deals with (ORBCOMM, EXACTEARTH, SPIRE) state
network improvements should see the light within 2017,
when the quality gap between terrestrial and satellite AIS
is expected to be significantly reduced.
Maritime Knowledge Discovery and Anomaly Detection Workshop, 5-6 July 2016
19
Lastly, satellite AIS is only limited to class A and class
B/SO messages, therefore its contribution to MSA is
somehow limited, although MARCOM is following the
development of new commercial products such as
EXACTEARTH ABSEA allowing to track also vessels
smaller than 300 GT.
2.2 LRIT
For operation Ocean Shield NATO gets LRIT data from
compliant nations. Such data are cross-examined with
other data and information available to improve data
confidentiality. As expected, the correlation of two
sensors based, cooperative data has marginally improved
white shipping picture’s quality.
2.3 Satellite radar (used for experimentation purposes)
Correlation of AIS and/ or LRIT with satellite radar is
very effective in improving MSA and white picture
compilation. Satellite radar is indeed a powerful system
for non-shiners detection and target recognition even with
some caveats: marine target recognition from satellite
indeed could be more difficult than ground one. While
ground targets (vehicles) are represented only on two
dimensions, targets at sea are often represented on three
dimensions being third dimension the vessels’ height,
which is affected (in imagery capturing) by pitch, yaw
and roll. Vessels wakes as detected from satellite can also
reveal much information about vessels’ movements and
conditions.
2.4 Assets as non-sensor based data
The trend in NATO MSA is of course a shift from
platform (assets) to sensor based MSA, this implies a
decrease in assets centrality for MSA building.
Nevertheless, when enhanced posture is required, the use
of assets becomes central to validate anomalies. NATO
assets are indeed deployed on areas of operations and
areas of interest in order to support operations and are
sometime determinant in anomalies validation processes.
3. MARITIME ALLIED COMMAND MSA
DOCTRINE – THE WAY AHEAD
Technology achievements have determined NATO
Maritime Command to reconsider its MSA doctrine.
Although the new MSA has not been published yet, the
new approach to global MSA is likely going to split the
maritime domain in three postures:
a general one based mostly on sensor cooperative
data
two enhanced postures for smaller areas, in
which a deeper level of MSA is required.
The lowest posture is likely going to rely mostly on AIS
while posture two and three request a variable level of
awareness based on data correlation, networking
information and even reports from assets.
In general terms the correlation of sensor-based
cooperative with sensor-based non cooperative data (e.g.
terrestrial and satellite AIS with terrestrial or satellite
radar), is a form of multisensory data fusion, allowing
performing inferences not achievable from a single sensor
alone to enhance knowledge over surveillance areas,
enabling the detection, tracking and identification of a
target including target identity, activities and history.
The highest posture should be focused on even smaller
areas and involves the use of assets (ships, maritime
patrol aircraft, AWACS) to achieve a deep knowledge of
the traffic over the area and being able to detect those
behaviors considered relevant for the situation.
4. THE ANALYSIS TOOLS: BRITE and TRITON.
CMRE SUPPORT
4.1 NATO
NATO has developed its own analysis tool, the BRITE
(baseline for rapid iterative transformational
experimentation), a dedicated software created by ACT.
The concentration of data in some areas might saturate the
fusion software; to prevent this MARCOM sometimes
requires the capability to throttle data refresh time. Under
an operational point to view, indeed, there is no need for a
real-time data refreshing. The system is capable of
processing (correlating and fusing) multiple data format
to compile the white shipping picture to fulfill NATO
MARCOM operational requirements. The picture is then
analyzed by means of smart agents to detect anomalies to
expected patterns of behavior. Such agents can detect
static anomalies -by comparing displayed data with
available database- as well as dynamic ones –such as
destination inconsistencies-.
BRITE’s advantages consist in being the software fully in
house built; this allows tailoring fusing criteria and smart
agents on specific operational needs.
4.2 TRITON
The alliance is developing a new comprehensive MSA
tool, including all display and analysis functionalities.

Maritime Knowledge Discovery and Anomaly Detection Workshop, 5-6 July 2016
20
The project, named TRITON, is still under development
and will see the light in 3 to 4 years; it is based on open
architecture and will incorporate the broad experience
collected into BRITE as well as many functionalities. To
system implementation NATO will outsource most of
system development.
4.3 CMRE SUPPORT
A key role in the development of baseline analysis is
played by NATO CMRE based in La Spezia. Its support
consists in developing pattern of life analysis tools
considered extremely valuable under both an operational
and an experimentation point to view. Particularly the
port analysis and the TREAD (traffic route extraction and
anomaly detection) acquire and process info and
positional data defining the traffic paths, creating density
maps, analyzing routes in support to operational planning
and execution. Such background information are
moreover useful for detecting the anomalies.

Maritime Knowledge Discovery and Anomaly Detection Workshop, 5-6 July 2016
21
SECTION II: PRIVATE SECTOR
Maritime Knowledge Discovery and Anomaly Detection Workshop, 5-6 July 2016
22
ANALYSIS OF VESSEL TRAJECTORIES FOR MARITIME SURVEILLANCE
AND FISHERIES MANAGEMENT
Philippe Gaspar1, Rémy Lopez
1, Marza Marzuki
2,3, Ronan Fablet
2, Philippe Gros
1, Jean-Michel Zigna
1 and
Gaetan Fabritius1
1Collecte Localisation Satellites (CLS), Ramonville, France
2Telecom Bretagne, Department Signal and Communications, Plouzané, France
3Ministry of Marine Affairs and Fisheries (KKP), Jakarta, Indonesia
ABSTRACT
During the last decade, CLS, the operator of the ARGOS
positioning and data collection system, has developed
several tools to analyze the trajectories of satellite-tracked
vessels to add value to the information provided by
ARGOS but also other positioning systems (AIS/SAT-
AIS, LRIT ...). In 2010, CLS started to work, as a
contractor for the European Maritime Safety Agency
(EMSA), on an Integrated Maritime Data Environment
(IMDatE) and specifically on a module dedicated to run
different algorithms to identify patterns, generate alerts,
and ultimately support the maritime surveillance missions
of the European Member States. Through this project and
in close cooperation with EMSA, CLS has developed and
continues to develop services driven by new regulations,
and user communities relying on IMDatE. During the
same period, CLS also collaborated with research
laboratories to develop fishing vessel trajectory analysis
tools designed to support fisheries monitoring and
management activities. These tools focus on the
identification of the different behaviours displayed by
fishing vessels at sea (cruising, tracking fish, fishing,
resting...). A clear-cut identification of these different
activities, allows a precise estimation of the spatial and
temporal distribution of the fishing effort, a main input in
fish stock assessment model. Clear identification of the
different activities carried at sea by fishing vessels also
allows the detection of illegal activities (such as fishing in
protected areas) or frauds (such as using prohibited or not
properly licensed fishing gears). Results obtained for
different fisheries management organisations will be
presented here.
Index Terms— Automatic Identification system
(AIS), Vessel Monitoring System (VMS), behavior
analysis, anomaly detection.
1. INTRODUCTION
During the last decade, CLS has developed several tools
to analyze the trajectories of satellite-tracked vessels to
add value to the information provided by ARGOS but
also other positioning systems (AIS/SAT-AIS, LRIT ...).
Vessel trajectory analysis can serve multiple purposes.
Here we concentrate on two major domains: maritime
surveillance and fisheries management.
2. MARITIME SURVEILLANCE
The detection of abnormal behavior is a permanent
demand of the administrations in charge of the Maritime
Domain Awareness, with the following main concerns:
Prevent accidents that could occur on ships
carrying hazardous material or polluting cargo;
Detect oil spills and generate alert for agencies in
charge of oil spill operations;
Support anti-piracy operations;
Monitor maritime borders;
Monitor fishery and detect Illegal, Unregulated
and Unreported (IUU) fishing activity;
Detect illegal trafficking and smuggling;
Support authorities in Search and Rescue
operations.
For these purposes, CLS implemented a set a algorithms
operating in EMSA’s IMDatE. Inputs of these algorithms
are AIS, SAT-AIS, VMS and LRIT messages but also
satellite images (optical and Synthetic Aperture Radar).
These algorithms are designed to detect the following
events:
a) Vessel entering or leaving a specific area (marine
protected area, military area, piracy high risk
area…);
b) At sea encounter of 2 vessels (indication of
possible transhipment or pirate attack);
c) Drastic change in ETA;

Maritime Knowledge Discovery and Anomaly Detection Workshop, 5-6 July 2016
23
d) Vessel off track with regard to declared voyage;
e) Under or over reporting of positions with
mandatory terminals (e.g. LRIT);
f) Sudden change of speed;
g) Sudden change of heading;
h) Sudden change of port of destination;
i) Vessels in harbors: entering, at anchor or
leaving.
These algorithms are currently used for day-to-day
operations by EMSA. The parameters of each algorithm
can be tuned by the user to account for the type of vessels
monitored or the specific targeted event.Different alert
broadcast strategies can be specified depending on the
detected event. Alerts can be issued: “at start”, “at start
and at end” or “at each occurrence” of an event.
3. FISHERIES MANAGEMENT
Satellite-tracking of fishing vessels was originally
imposed, in the nineties, to verify that fishing activities
were carried out only during the period and within the
geographic areas where they were permitted. But fisheries
scientists soon recognized that fishing vessel trajectories
were actually providing more information about the
fishing activity than simply the area and period of fishing
[1, 2].
A major goal is to precisely identify whether a fishing
vessel is cruising or fishing. At first sight, this can be
done using a simple speed filter (low speed = fishing;
high speed = cruising). This simple approach has been
extensively used, in particular for analyzing the activity of
trawlers [3].
Unfortunately, this method provides rather inaccurate
estimates of the fishing effort for most fishing gears. For
example, Bertrand et al. [4] report that the speed-
threshold method tends to overestimate the number of
fishing sets by as much as 182 % in Peruvian purse
seiners targeting anchovy. This overestimation is due to
similarities in vessel speeds when fishing, drifting and
searching. Several more elaborate methods have then
been developed to refine the detection of the fishing
activities with different fishing gears. Neural networks
and Hidden Markov Models (HMM) have been used in
various situations [2, 4]. More recently, Hidden semi-
Markov models (HSMM), random forests (RF) and
Support Vector Machines (SVM) have been successfully
used, allowing identification of the various fishing
activities with relative errors in the range 10-30 % [5].
Such levels of error can only be reached with supervised
learning but obtaining learning data sets is difficult in
many fisheries where very few fishing cruises are
documented by on-board observers. Systematic
deployment of Electronic Reporting Systems (ERS) shall
help reduce this problem.
The low sampling rate of most VMS systems is
another issue. With a typical 1-hour sampling period,
various fishing actions are inevitably undetected or
“aliased” in VMS data. The use of high-frequency AIS
data will undoubtedly help improve the situation.
Another potential use of VMS data is the detection of
quite subtle frauds such as a false declaration of the used
fishing gear. We recently reported results on this topic
[6]. Using VMS data from the Indonesian Ministry of
Marine Affairs and Fisheries (KKP), we used various data
mining techniques for the automated recognition of the
used fishing gear (trawl, pole and line, purse seine or
longline). The different tested methods provided high
rates (95 to 97.5 %) of correct classification. Interestingly
a small number (near 4%) of vessels systematically
displayed high misclassification rates. Such cases were
further scrutinized. In some instances, the origin of the
misclassification was related to discrepancies between the
VMS and registration databases. In other cases, visual
analysis of recorded trajectories strongly suggests an
erroneous gear declaration.
Further work dedicated to the analysis of the
longliners’ activity is on-going and preliminary results
will be shown. Pelagic longliners operate in all oceans.
They are responsible for over 10 % of the worldwide tuna
catches. Still, their VMS tracks have, so far, been little
investigated and used for the management and control of
their fishing activity.
4. REFERENCES
[1] S. Bertrand, A. Bertrand, R. Guevara-Carrasco and F. Gerlotto:
Scale-invariant movements of fishermen: the same foraging strategy
as natural predators. Ecological Applications, 17, 331-337, 2007.
[2] N. Bez, E. Walker, D. Gaertner, J. Rivoirard, and P. Gaspar :
Fishing activity of tuna purse seiners estimated from vessel
monitoring system (VMS) data. Canadian Journal of Fisheries and
Aquatic Sciences. , 68, 1998-2010, 2011.
[3] N. Lee, A.B. South and S. Jennings: Developping reliable,
repeatable, and accessible methods to provide high-resolution
estimates of fishing-effort distributions from vessel monitoring
systems (VMS) data. ICES Journal of Marine Science,
doi: 10.1093/icesjms/fsq010, 2010.
[4] S. Bertrand, E. Diaz and M. Lengaigne: Patterns in the spatial
distribution of Peruvian anchovy (Engraulis ringens) revealed by
spatial explicit fishing data. Progress in Oceanography,
vol.79,pp.379-389,2008.
[5] R. Joo, S. Bertrand, J. Tam and R. Fablet: Hidden Markov
models : the best models for forager movements PLoS ONE,
8(8):e71246, doi:10.1371/journal.pone.0071246, 2013.
[6] M. I. Marzuki, R. Garello, R. Fablet, V. Kerbaol and P. Gaspar,
"Fishing gear recognition from VMS data to identify illegal fishing
activities in Indonesia," OCEANS
2015 - Genoa.
Maritime Knowledge Discovery and Anomaly Detection Workshop, 5-6 July 2016
24
EXPLOITING THE POTENTIAL OF THE FUTURE “MARITIME BIG DATA”
Bernard GARNIER*, Aldo NAPOLI**
*BlueSolutions Consulting SAS, Sophia Antipolis, France
**MINES ParisTech, PSL Research University, CRC, Sophia Antipolis, France
ABSTRACT
Today, most of the operational “abnormal behaviour”
detection algorithms primarily operate kinematic rules on
the vessel tracks provided by the AIS [1], [2], [3]. To be
more effective, they must be associated to additional
“context data”, however insuring this data access is today a
challenge, due to the disparity of registers and the
fragmentation of actors… For example, detecting suspicious
“associations of ships” requires already a complex data
mining to detect indirect common ownership through the
myriad of cascaded legal entities used for formal ownership
and registration; as another example, maritime security
actors know the importance of environmental factors (sea
state, fog, clouds, moon etc) when assessing the risk of
illegal passages or piracy attacks at night – but gathering the
right local weather forecast data in association with
abnormal behaviour detection algorithms for maritime radar
systems is also a challenge.
While many more data and metadata should be browsed
from all the existing maritime reporting systems and data
repositories to cross-check systematically the declared
versus actual behaviour of commercial, fishing and leisure
ships, we shall start developing a new data access thinking
to benefit from the progressive deployment of the EU-wide
CISE which is approaching its pre-operational validation
milestone and should be largely mature by 2020,
materializing a break-through in terms of data access for the
maritime security communities. In parallel, another key
enabler is the capacity to collect the “local picture” gathered
by genuinely cooperating shipping (sightings and nav radar)
with the “big picture” (VMS, AIS, S-AIS, LRIT, satellite
imaging…). The VDES will provide a very effective data
uplink as an alternative to broadband maritime SatComs at
the same 2020 horizon. Other planned technological gap-
fillers deserve to be integrated in future data processing
strategies: new space projects aim at solving the data
synchronicity challenge by co-locating SAR, S-AIS and
VDES payloads for specialized maritime surveillance
constellations; EDRS allows downloading LEO maritime
surveillance data streams in near real-time from anywhere
on Earth; smart and fast embarked data processing will
downsize the “rising tide” of data, extracting and tagging
straight away the mere fraction of data requiring prompt
human attention…
This paper will aim at delivering a sort of “wake-up call”
to integrate this new data access paradigm in the current
research on maritime knowledge discovery associated to the
detection of safety and security threats: 2020 is tomorrow,
we shall think, develop and test our toolbox at the whole
scale of this “Big Data”.
Index Terms— Maritime surveillance, early detection,
heterogeneous correlation, CISE, weak signals analysis
1. CURRENT STATE OF PLAY
While maritime surveillance has been radically transformed
by the introduction of the Automatic Identification System
(AIS) in 2002 through the IMO SOLAS Agreement –
suddenly populating the screen of the vessel traffic
management systems (VTMS) well beyond the range of the
coastal radars, the operational maritime surveillance
capabilities have not much evolved since. Voluntary
reporting systems (mainly AIS, VMS for fishery vessels and
LRIT in distant sea lanes) remain the essential source of
vessel monitoring, leaving in the shade the smaller boats…
and the deliberately cheating ones. Furthermore, non-
cooperative ship detection provided by maritime radars (on
board ships and on the coast) is now automatically fused
with AIS, no more supported by additional VHF voice
contact and binoculars to confirm the vessel identity and its
planned route.
The recent development of commercial satellite payloads
designed to collect AIS signals from ships well beyond
coastal VHF horizon (S-AIS) is a welcomed “plus” to
overcome the deficient cover of coastal AIS receivers in
some regions, but remains overall a moderate contribution
to the VTMS operation as S-AIS largely recoups LRIT.
International cooperation has become routine, but again
most if not all maritime traffic data exchange agreements
relate to the data of these voluntary reporting systems; as
they are often faulty and sometimes cheated, this means
building the common operational maritime traffic picture on
sand!
Space observation systems have been promoted as a new
way to ascertain the maritime traffic data. Indeed, medium
and high resolution synthetic aperture radar (SAR) on low
Earth orbit (LEO) satellites provide a theoretical capability
of ship detection anywhere in high seas, but its use as a
daily maritime traffic monitoring tool remains problematic

Maritime Knowledge Discovery and Anomaly Detection Workshop, 5-6 July 2016
25
(no persistence, limited refresh, significant cost, latency of
several hours). It is technically impossible to acquire
synchronously SAR radar and S-AIS, rendering the
correlation of these data tedious and often uncertain. As a
consequence, its operational use is limited to specific fishing
grounds and trafficking areas (where and what to look are
known ahead of data collection and processing).
With these limitations, the blue borders remain largely
porous to all sorts of trafficking (drugs, arms, migrants…)
while endangered fishing species are still poached at high
scale (IUU fishing remains as high as 25 to 30% of all
catches).
In the field of Defence, Intelligence Agencies are
actively seeking for illegal arms trade, intrusions in
territorial waters and security threats of all sorts; however
cross-border information exchanges (e.g. under the auspices
of NATO) are most often limited to share a “list of usual
suspects” designating about 2000 vessels of specific interest
to be jointly monitored. In parallel, anti-drug operations are
also most of the time driven by human intelligence
(HUMINT), leaving 90% of the traffic undetected. In short,
the challenge relate to the large number of “unknown
unknown” threats.
To overcome the incapacity of the current state-of-play
to anticipate the creativity and flexibility of criminal
schemes, there is a clear need for changing the maritime
surveillance paradigm: monitoring ship tracks on big
screens is not enough!
2. LOOKING FOR WEAK SIGNALS
Time is long gone where seas appeared as the ultimate area
of freedom, where the Master was invested of every
power… after God. All maritime activities are today
explicitly regulated, even in High Seas, as a result of
international treaties and agreements (IMO…), regional
agreements (Baltic…), national and local regulations. The
respective authority of Flag States, Port States, Coastal
States etc. is internationally agreed and results into massive
data collection from all operators: every ship voyage
generates dozens of massive files on the ship itself, the
voyage, the cargo and the people on board.
Each of these files is directed to a particular Maritime
Authority which screens the documents, clears the
corresponding ship operation and triggers possible controls.
Criminal gangs are thus used to provide “clean”
documents to avoid controls, e.g. cargo or fish catch
declarations that will look “business as usual” for the
custom officer or fishery inspector respectively. In the same
time, these data are not today available in parallel to the
serious crime investigators that could detect inconsistencies
or possible correlations with their own investigations.
This “fragmentation” of the State controls of maritime
activities is inherited from the absence of an holistic vision
of the maritime economy common to almost all States: a
comprehensive survey undertaken by DG Mare confirmed a
split of the maritime authority prerogatives between more
than 10 different administrations all across the 21 EU
maritime nations, with many different Ministries involved
(Transport, Energy, Environment, Agriculture, Interior,
Economy, Defence…). Furthermore, this organizational mix
differs significantly form a country to the next, with hardly a
cross-border match between mandates and legal
prerogatives, hence making inter-administration cooperation
furthermore complex. This results into what is usually called
“data silos”, each of them only exploited under a single
angle.
In essence, maritime surveillance operations are not
distinct from any business, and the general approach of
“Strategic Early Warning Systems” theorized from 1975 ref
[4, 5] to provide on-time strategic reaction capabilities is
perfectly applicable. The central element is that disruptions
do not emerge without warning, however these warnings
remain most often undetected as they don’t come from the
expected channels of business information. These warning
signs are described as "weak signals" [4], a concept aimed at
early detection of those signals which could lead to strategic
surprises -- events which have the potential to jeopardise an
organization’s strategy. Brison and Wybo [6] represent the
life cycle of weak signals as four successive steps associated
with barriers that the weak signal has to overcome. These
four steps are: Detection, Interpretation, Transmission and
Priority setting. The extraction of such weak signals from
the massive data and meta-data collected on Internet by the
GAFA turns to be potentially extremely profitable –
currently turning as the 21th century gold rush… Everyone
has experienced already how effectively e-advertising can
be targeted by processing the heterogeneous navigation data
and metadata of your internet browser.
There are already demonstrative contributions of Open
Source data mining and weak signals analysis in the
maritime security domain, such as the ConTraffic web-
service of the JRC able to alert Custom Authorities on
particular containers associated with “abnormal” voyage
histories (https://contraffic.jrc.ec.europa.eu/).
The largest potential relate to the application of weak
signals detection over widely heterogeneous data possibly
correlated. Ref [7] proposes an interesting application of this
approach to the detection of cyber-intrusions, which is not
dissimilar to our own preoccupation. Proper “Features
Detection” comes as a cornerstone of efficient
heterogeneous correlation.
(http://journalofbigdata.springeropen.com/articles/10.1186/s
40537-015-0013-4 ).
As another inspiring example, heterogeneous
correlation will soon offer a totally secure substitute to
traditional passwords: a very clear signal has been given by
Google at its annual I/O conference 2016, announcing the
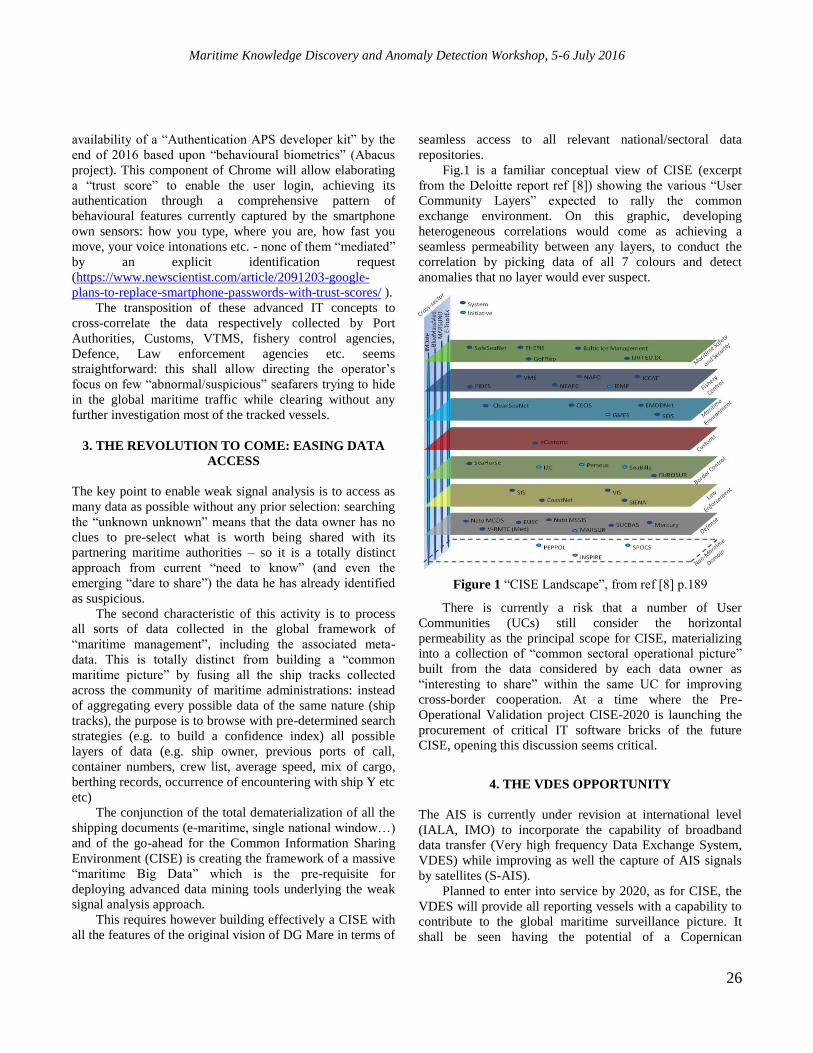
Maritime Knowledge Discovery and Anomaly Detection Workshop, 5-6 July 2016
26
availability of a “Authentication APS developer kit” by the
end of 2016 based upon “behavioural biometrics” (Abacus
project). This component of Chrome will allow elaborating
a “trust score” to enable the user login, achieving its
authentication through a comprehensive pattern of
behavioural features currently captured by the smartphone
own sensors: how you type, where you are, how fast you
move, your voice intonations etc. - none of them “mediated”
by an explicit identification request
(https://www.newscientist.com/article/2091203-google-
plans-to-replace-smartphone-passwords-with-trust-scores/ ).
The transposition of these advanced IT concepts to
cross-correlate the data respectively collected by Port
Authorities, Customs, VTMS, fishery control agencies,
Defence, Law enforcement agencies etc. seems
straightforward: this shall allow directing the operator’s
focus on few “abnormal/suspicious” seafarers trying to hide
in the global maritime traffic while clearing without any
further investigation most of the tracked vessels.
3. THE REVOLUTION TO COME: EASING DATA
ACCESS
The key point to enable weak signal analysis is to access as
many data as possible without any prior selection: searching
the “unknown unknown” means that the data owner has no
clues to pre-select what is worth being shared with its
partnering maritime authorities – so it is a totally distinct
approach from current “need to know” (and even the
emerging “dare to share”) the data he has already identified
as suspicious.
The second characteristic of this activity is to process
all sorts of data collected in the global framework of
“maritime management”, including the associated meta-
data. This is totally distinct from building a “common
maritime picture” by fusing all the ship tracks collected
across the community of maritime administrations: instead
of aggregating every possible data of the same nature (ship
tracks), the purpose is to browse with pre-determined search
strategies (e.g. to build a confidence index) all possible
layers of data (e.g. ship owner, previous ports of call,
container numbers, crew list, average speed, mix of cargo,
berthing records, occurrence of encountering with ship Y etc
etc)
The conjunction of the total dematerialization of all the
shipping documents (e-maritime, single national window…)
and of the go-ahead for the Common Information Sharing
Environment (CISE) is creating the framework of a massive
“maritime Big Data” which is the pre-requisite for
deploying advanced data mining tools underlying the weak
signal analysis approach.
This requires however building effectively a CISE with
all the features of the original vision of DG Mare in terms of
seamless access to all relevant national/sectoral data
repositories.
Fig.1 is a familiar conceptual view of CISE (excerpt
from the Deloitte report ref [8]) showing the various “User
Community Layers” expected to rally the common
exchange environment. On this graphic, developing
heterogeneous correlations would come as achieving a
seamless permeability between any layers, to conduct the
correlation by picking data of all 7 colours and detect
anomalies that no layer would ever suspect.
Figure 1 “CISE Landscape”, from ref [8] p.189
There is currently a risk that a number of User
Communities (UCs) still consider the horizontal
permeability as the principal scope for CISE, materializing
into a collection of “common sectoral operational picture”
built from the data considered by each data owner as
“interesting to share” within the same UC for improving
cross-border cooperation. At a time where the Pre-
Operational Validation project CISE-2020 is launching the
procurement of critical IT software bricks of the future
CISE, opening this discussion seems critical.
4. THE VDES OPPORTUNITY
The AIS is currently under revision at international level
(IALA, IMO) to incorporate the capability of broadband
data transfer (Very high frequency Data Exchange System,
VDES) while improving as well the capture of AIS signals
by satellites (S-AIS).
Planned to enter into service by 2020, as for CISE, the
VDES will provide all reporting vessels with a capability to
contribute to the global maritime surveillance picture. It
shall be seen having the potential of a Copernican
Maritime Knowledge Discovery and Anomaly Detection Workshop, 5-6 July 2016
27
revolution: moving from the era of unilateral reporting
toward VTMS operators with little if no feedback, ship
masters will be able to exchange all sorts of maritime safety
and security notices with the neighbouring ships (via VHF)
and with the whole community (via S-AIS) at no cost
(compared to the SatCom broadband links currently
needed). EU Maritime Authorities should monitor more
closely and possibly influence the current phase of standard
VDES messaging definition to secure the effective
contribution of every cooperative ship to report its local
environment as a contribution to the grand picture currently
compiled by National Authorities, Regional Commissions,
EMSA and NATO. Early reporting of the sighting by a
cargo or a ferry of “strange” ships around her (fishing
vessels out of fishing grounds, old cargo much too low over
the water, towed pateras or RHIBs, unusual routes, apparent
rendez-vous at sea, low flying plane etc) could help
directing patrols well before incidents might trigger alerts.
VDES has the potential to turn every cooperative ship as an
“in-situ” maritime surveillance sensor, able to transmit
messages, pictures, radar screenshots, open comments etc.
5. RECOMMENDATIONS
Maritime authorities will not transform their data sharing
and data access policies overnight. In the same time, major
enablers of a new way to think the maritime surveillance
data analysis are at stake now depending on short term
decisions at EU level (CISE) or UN/IMO (VDES) to freeze
the technical requirements of these new systems.
Our R&D community has the duty to launch now very
imaginative and convincing “vertical” data mining
experiments (wrt Fig.1) to demonstrate the power of weak
signal analysis, the way to build unprecedented “trust
scores” and the consequence of this transformation of the
notion of “abnormal behaviour detection” on the
requirements (including at some stage underlying legal
agreements) of both CISE and VDES. Without offering
attractive use-cases, we might miss this challenging 2020
milestone, with the risk of not meeting again before long
such opportunity.
6. REFERENCES
[1] Pallotta G., Vespe M. and Bryan K. (2013), “Vessel pattern
knowledge discovery from AIS data: a framework for anomaly
detection and route prediction”, Entropy 2013, 15, 22218-2245.
[2] Vandecasteele A., Devillers R. and Napoli A. (2014), “From
Movement Data to Objects Behavior Using Semantic Trajectory
and Semantic Events”, Marine Geodesy, Taylor & Francis, 2014,
37 (2 - Special Issue: Special Issue on Coastal and Marine
Geographic Information Systems), pp.126-144.
[3] Idiri B. and Napoli A. (2012), “The automatic identification system
of maritime accident risk using rule-based reasoning”, 7th
International Conference on System Of Systems Engineering -
IEEE SOSE 2012, Jul 2012, Genoa, Italy. pp.125-130.
[4] Ansoff, H. I. (1975), “Managing Strategic Surprise by Response to
Weak Signals”, California Management Review, vol. XVIII no. 2,
pp. 21–33.
[5] Gilad, B. (2003), “Early Warning: Using Competitive Intelligence
to Anticipate Market Shifts, Control Risk, and Create Powerful
Strategies", AMACOM.
[6] Brizon, A. and Wybo, J-L. (2009), “The life cycle of weak signals
related to safety”, Int. J. Emergency Management, Vol. 6, No. 2,
pp.117–135
[7] Zuech R., Taghi M Khoshgoftaar and Randall Wald (2015),
“Intrusion detection and Big Heterogeneous Data: a Survey”,
Journal of Big Data, Springer 2015.
[8] Deloitte Consulting (2012), “Study on the current surveillance IT
landscape and the resulting options for the Common Information
Sharing Environment for Surveillance in the Maritime Domain”,
ISA/DG Mare/DIGIT.
Maritime Knowledge Discovery and Anomaly Detection Workshop, 5-6 July 2016
28
GENERATING AND EVALUATING LONG-TERM
COMPLEX MARITIME TRAFFIC RELATIONSHIPS
FOR RISK ASSESSMENT AND MISSION PLANNING
VIA NEAR-REAL-TIME BIG-DATA ANALYTICS
Hugo José P. B. Paulino Pinto
Inovaworks Command & Control, Lisbon, Portugal
ABSTRACT
Detailed real-time analysis of a large-scale (continental-
scale) operational maritime pictures can nowadays be
achieved via commercial-off-the-shelf hardware and
software components with minimal investment in both time
and engineering effort. However, establishing the de facto
relationships between the entities present in the scenario and
deriving meaningful information from them so that it can be
used in operational contexts such as route risk assessment
and mission planning and forecasting requires both the
evaluation of the instant maritime picture and its correlation
with past events and movement patterns.
The research herein presented used latest-generation big
data processing and automated deep learning techniques to
analyze 5 years’ worth of terrestrial AIS (Automatic
Identification System) movement data and derive
meaningful information in an experimental information
system that continuously evaluates the current maritime
picture against historical trends, matching relevant events
and allowing a trained operator (either automated or in real
time) to further interrogate the system for deeper extraction
of both past trends and future probabilistic evaluations. The
research is being pursued under Inovaworks Command and
Control’s private R&D center, and preliminarily
demonstrates how historical information consulted and
further enriched in real-time provides predictive value to a
mission-planning system and is crucial for meaningful data
analytics. The work presented also provides insights into the
best direction for future work in this area.
Index Terms— Maritime Traffic, Anomaly detection,
risk assessment
1. INTRODUCTION
Performing mission planning and risk assessment activities
in large-scale, complex endeavors over vast geographical
territories implicitly inhibits human-scale situational
awareness analysis, while at the same time greatly
amplifying the margin for error of most uncorrected
automated analytics approaches. Crucial to creating a
reliable, self-validating Consolidated Operational Picture is
the reliance on multi-method validation of both input data
and consolidated picture results, and in the correct
identification of anomaly events and their significance for a
decision maker’s sense making.
As unassisted construction of a Consolidated
Operational Picture is paramount for the establishment of
valid Situational Awareness, so is unassisted detection of
any given environment’s abnormal vessel behaviors.
Nonetheless, a major challenge in detecting automated
anomalous vessel behavior in is the high rate of false alarms
(due to the use of mainly geospatial – implicitly kinetical –
information from indirect vessel data acquisition).
However, manually modeling what is and is not
abnormal in a large-scale scenario with dozens of thousands
of moving entities is not only humanly impossible but also
heavily limiting, as the derived heuristics would only cover
a subset of the potential real-world use cases.
For such purpose, we started exploring using vessel
traffic history information as a training baseline for deriving
abnormal cases and then using the trained system to detect
vessel traffic anomalies on a control set. Moreover, such
history traffic information could be used to derive and
establish the de facto relationships between vessels present
in a given scenario and deriving meaningful information
from them so that it can be used in operational contexts such
as association assessment for risk and mission planning.
2. INPUT DATA SET
In order to support the algorithms being developed, we used
a large data set containing 5 years’ worth of terrestrial AIS
traffic around the European maritime shores for 2011 to
2015. This data set included non-downsampled AIS data
frames in approximately 6 minute intervals per vessel.
These data packets identity their target vessel via the ITU’s
Vessel MMSI number.

Maritime Knowledge Discovery and Anomaly Detection Workshop, 5-6 July 2016
29
As such, and to additionally be able to further infer
anomalies based on the vessel’s own context and physical
features (and not exclusively on movement data), IMO-
provided data for a vessel’s particulars (DWT, GT, Service
Speed, MCR, etc.) was fused into the AIS traffic as it was
loaded onto the system via our own internal systems Fusion
and sense making capabilities:
Figure 1 The Data Ingestion pipeline on the left
The system received every AIS movement data tick and
processed it against well-known databased for IMO Number
– MMSI Number mapping, as well as third-party vessel
particulars enrichment sources. Then, each movement was
stored in a fourth-dimensional spatiotemporal database for
later retrieval and calculation.
In total, the data set is comprised of 10.929.973.310
vessel AIS movement data points, of which we correctly
attributed 7.196.639.922 to valid IMO numbers that
correspond to 78.055 distinct MMSI vessels. This averages
to just under 6 million AIS movement data points per day of
consolidated Situational Awareness data.
The data set was split in two: odd years
(2011/2013/2015) for training, even years (2012, 2014) for
validation.
2. ANOMALIES AND CLASSIFICATION
Shipping vessels involved in commercial business tend to
follow set patterns of behavior depending on the activities in
which they are engaged. If a vessel exhibits anomalous
behavior, this could indicate it is being used for abnormal
and/or illicit activities. With the wide availability of
automatic identification system (AIS) data it is possible to
systematically search and detect some of these behavioral
patterns using algorithms appropriate for the target detection
problem.
In [1], then further consolidated in [2], an Anomaly
Taxonomy is suggested for maritime events derived from
movement (kinetic) observations. Based on either Motion or
Location information, it classifies maritime anomalies based
on the evaluation of motion against its speed and track, and,
based on its Location, it suggests classifications evaluation
the vessels’ data against history information, specific
geospatial areas, or other vessels.
Figure 2Anomaly Taxonomy [1]
In our research, we focused of first-order and second-order
events that could be directly or indirectly derived from the
vessel’s Speed or Location.
For each of the focus areas, a modified machine learning
detection algorithm was developed; for each potential
detection, we determine the probability that it is indeed
anomalous; finally, for complex events the probabilities are
combined using a Bayesian network to calculate the
aggregated probability for the event.
We then use elastic, big data processing techniques to
process the input data set and try to derive meaningful
information in an experimental information system that
continuously evaluates the current maritime picture against
historical trends, matching relevant events (candidate
abnormalities) and allowing for a trained operator (either
automated or in real time) to further interrogate the system
for deeper extraction of the probabilistic evaluation.
5. RESULTS AND ONGOING WORK
Work is still ongoing regarding long-term insights to be
taken from the input data being processed with the system
presented herein. Still, can preliminarily demonstrate how
Sensor Adapters
Sensing
Perception(Fusion)
4DCOP
Entity CatalogReal Time Analysis
Mission PlanningIncident
Management
Mission Executionand Monitoring
Mission Logistics& Supply Chain
Actuator Adapters
Command IntentTransmission
Immediate Mode
Visual Reporting

Maritime Knowledge Discovery and Anomaly Detection Workshop, 5-6 July 2016
30
historical information consulted and further enriched in real-
time provides predictive value for mission-planners and is
crucial for meaningful large-scale data analytics.
Figure 3 Inovaworks’ running prototype
In our running prototype, the system is now configured to
detect and validate:
Unusual unexplained high speed
Unusual unexplained slow speed
Unusual unexplained turn
Unusual course region
Vessel Loitering
Vessel outside historical route
Vessel outside traffic lanes
High-seas Vessel Rendezvous
Littoral proximity Rendezvous
Recurrent proximity with other Vessel(s)
6. FUTURE WORK
Inovaworks is now working on second-level inferences
regarding vessel kinematic information that will further
deepen the analysis possibilities for the dataset provided,
which should be further enriched accordingly with
correlatable data to allow for such questioning.
As an example, such analysis will allow for our
technology to answer complex, derived questions such as
“which distinct-type vessels came together for near littoral
Rendezvous and are for whom the Captains were already
previously part of the same crew?”
Also, our team will be complementing the system’s
probabilistic capabilities in order to allow of questioning
regarding the probability of a future event (e.g., a piracy act)
to occur for a given cargo on a given route, based not only
on history movements, but more so on the association of
historic data with concrete contributive vessels on the give
route’s area at the projected timeframe.
7. REFERENCES [1] Davenport, M., Kinematic Behaviour Anomaly Detection (KBAD)
– Final Report, MacDonald Dettwiler and Associates Ltd, DRDC
CORA CR 2008-002, DRDC CORA, 2008.
[2] E. Martineau and J. Roy, “Maritime anomaly detection: Domain
introduction and review of selected literature,” Defence R&D
Canada Valcartier, Tech. Rep., 2011.

Maritime Knowledge Discovery and Anomaly Detection Workshop, 5-6 July 2016
31
SEA SURFACE CURRENTS CALCULATION USING VESSEL TRACKING
DATA
Yann Guichoux, Marc Lennon, Nicolas Thomas
e-Odyn
ABSTRACT
The first charts showing information on surface oceanic
currents were based on logs of both military and
merchant ships. At the time, ships navigated through dead
reckoning. Once or twice a day, a ship noted its
position based on celestial navigation, and recorded its
speed, and compass direction. If currents are
present, they will likely push the ship off course and alter its
speed. One can estimate the direction and
speed of these currents by subtracting the predicted vector
based on dead reckoning from the vector
representing the ships actual speed and direction. Now,
merchant ships transmit the position, the
compass direction and the speed through AIS (Automatic
Identification System) messages.
Therefore it is potentially possible to compute surface
current at finer scales. Preliminary
experiments show that this approach is able to reveal
mesoscale structures as eddies or filaments that can
escape to satellite altimetry techniques. This paper aims to
provide an overview of results in the Mediterranean area,
showing the good correlation between AIS surface currents
and chlorophyll concentration.
1. INTRODUCTION
Near-surface ocean currents play a variety of roles in the
marine environment and are considered as a key parameter
for many applications. Search and rescue, ship routing,
global warming analysis: all these domains and many others
require to get information related to ocean surface currents.
Therefore, complex and heavy systems are deployed to
measure or estimate currents in coastal areas and high sea
regions. Unfortunately, conventional methods for measuring
near-surface currents may be subject to problems. While a
surface drifter is uncontrollable in its spatial and temporal
coverage, making such a system difficult to use to
caracterize the ocean circulation in wide areas, especially in
convergent and divergent flow regimes, HF radars are very
complex systems which require substantial maintenance
work to estimate ocean surface currents in coastal zones
only and in small areas (up to 200 km² for the more efficient
systems). Other conventional techniques such as Vessel
Mounted Adcp and gliders have also limitations related to
their deployment and maintenance complexity, spatial
coverage and service life. Altimetry satellites such as the
Jason series can also be used to approximate geostrophic
currents at global scales. However, a limitation of the nadir
altimetry from space, is the 200- to 300-kilometer spacing
between satellite orbital tracks, which is unable to resolve
small-scale features in oceanography.
From an historical point of view the first charts showing
information on surface oceanic currents were based on logs
of both military and merchant ships. At the time, ships
navigated through dead reckoning. Once or twice a day, a
ship noted its position based on celestial navigation, and
recorded its speed, and compass direction. If currents are
present, they will likely push the ship off course and alter its
speed. One can estimate the direction and speed of these
currents by subtracting the predicted vector based on dead
reckoning from the vector representing the ships actual
speed and direction. Nowadays, merchant ships transmit the
position, the compass direction and the speed through AIS
(Automatic Identification System) messages. Therefore
taking advantage of the data about ship navigation of the
AIS system an innovative algorithm called e-Motion has
been developed by e-Odyn to derive surface currents. Our
preliminary experiments [1] shew that this approach is able
to reveal mesoscale structures as eddies or filaments that can
escape the altimetry techniques.
AIS[2] is a communication system based on a protocol
using the VHF maritime mobile band, for the exchange of
navigation data. AIS uses an open protocol and is not
intended for secure communications. It enables the
automatic exchange of shipboard information from the
vessels' sensors (dynamic data), as well as manually entered
static and voyage related data, between one vessel and
another or a shore station. AIS devices are required
internationally on most commercial vessels as identified by
the International Maritime Organization (IMO) in the Safety
of Life at Sea Convention (SOLAS), Chapter V. [3]
AIS receivers are subject to line-of-sight limitations
where range is depending on height of the antenna. In
normal weather conditions, one can expect to collect AIS
messages transmitted from ship located about 40 Nm from
the receiver , while sometimes, due to duct effects , the
range can increase up to several hundreds of Nm.

Maritime Knowledge Discovery and Anomaly Detection Workshop, 5-6 July 2016
32
The subject of this study starts with the observation of
meso-scale and sub-mesocale features along the south and
east coast of Sicily by using AIS data processed using the e-
Motion algorithm. The position and the size and of these
observed features are compared, from a qualitative point of
view only, with one satellite observation dataset used as
surface tracers : Aqua/Modis Chlorophyll concentration.
Moreover, the analysis of the bathymetry in the area reveals
other particulars of the surface circulation which can be
related to e-Motion surface currents.
2. STUDY AREA
Figure 1 A simplified vue of the summer circulation in the
Sicily Chanel (SC) Omrani et al. 2016. The main features
are represented : Atlantic Ionian Stream (AIS), Adventure
Bank Vortex (ABV), Maltese Channel Crest (MCC), Ionian
Shelf Break Vortex (ISV) , Medina Gear (MG), Messina
Rise Vortex (MRV), Ionian Front (IF).
The proposed method used to calculate ocean surface
currents using AIS messages could be used in any area
where ships are navigating, including areas where the tide
effect is important. However, tide currents are nowadays
well known and numerical models are quite efficient to
restitute the currents in regions where this type of signal is
prominent. Moreover, preliminary results from e-Odyn
already shown the relevance of e-Motion to estimate tidal
ocean surface currents [1]. Therefore, it is more interesting
to analyze the method by comparing our results with other
datasets, especially in micro-tidal area and where altimetry
satellites fail in detecting eddies (near the coast for
instance). This type of area can illustrate the potential of the
proposed method as a complement to other techniques to
observe ocean surface currents at a global scale.
The study area is mainly located south and east to the
Sicily and is represented on figure 1. It was chosen mainly
because of the great variety of circulation features. From a
marine traffic point of view, the Sicily Channel (SC) is an
intensively used area and the main gateway for ships which
are navigating between the strait of Gibraltar and the Suez
Canal. That area is then very valuable to analyze the
currents estimated from AIS data using e-Motion. The SC
connects the Mediterranean's eastern and western sub-
bassins and represents a key area for the general
Mediterranean sea circulation. This strait has a very
irregular bottom topography characterized in the southwest
by the Tunisian continental shelf and in the northeast by the
Sicilian shelf. The circulation in the area is governed by
density gradients [4]. An eastward surface flow if formed by
the Algerian current [5]. This flow is modulated by
permanent mesoscale features, which could be related,
amongst other, to bathymetry effects, upwellings and
baroclinic instabilities [6]. Along the southeastern Sicilian
Coast, on the downstream of the Malta plateau is an
upwelling site. Due to the AIS vein a mesoscale anticyclonic
eddy (Maltese Channel Crest - MCC) formation can come
into action and tends to reverse the flow to a North-West
direction closer to the coast.[7]
3. DATA AND METHOD
Figure 2 Density plot showing the number of ships per cell
used during the 10 days period of the study to calculate
ocean surface currents with e-Motion. The main ship routes
can be observed (red) and correspond to the area with the
highest number of gathered AIS messages.
The AIS data used in this study were gathered by e-Odyn in
April 2016, using several AIS receivers located along the
Sicily south and east coastline. Figure 2 presents the traffic
density in the area and an overview of the range of the AIS
receivers. These data were gathered at a one minute
sampling rate. For the study, we selected AIS messages of
merchant ships with a speed over ground superior to 6 knots
in order to exclude the impact of voluntary ship maneuvers
on our results, taking into account that voluntary ships
maneuvers change in speed and heading create strong bias
in e-Motion results.
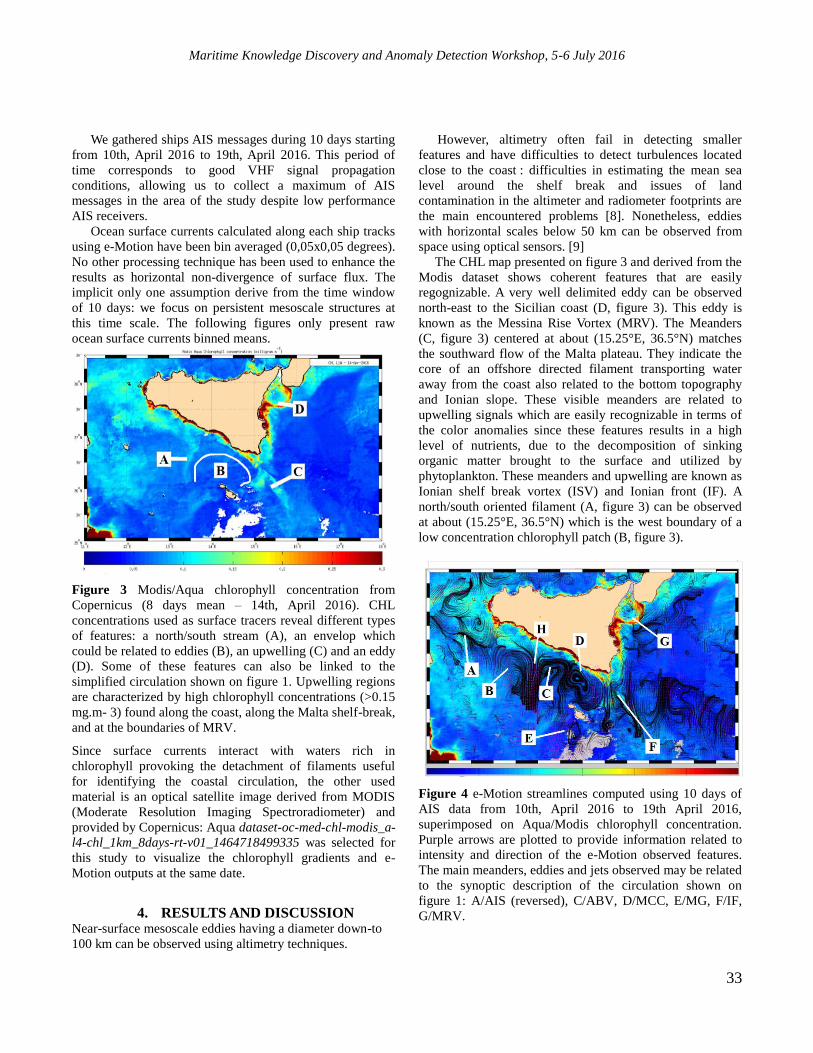
Maritime Knowledge Discovery and Anomaly Detection Workshop, 5-6 July 2016
33
We gathered ships AIS messages during 10 days starting
from 10th, April 2016 to 19th, April 2016. This period of
time corresponds to good VHF signal propagation
conditions, allowing us to collect a maximum of AIS
messages in the area of the study despite low performance
AIS receivers.
Ocean surface currents calculated along each ship tracks
using e-Motion have been bin averaged (0,05x0,05 degrees).
No other processing technique has been used to enhance the
results as horizontal non-divergence of surface flux. The
implicit only one assumption derive from the time window
of 10 days: we focus on persistent mesoscale structures at
this time scale. The following figures only present raw
ocean surface currents binned means.
Figure 3 Modis/Aqua chlorophyll concentration from
Copernicus (8 days mean – 14th, April 2016). CHL
concentrations used as surface tracers reveal different types
of features: a north/south stream (A), an envelop which
could be related to eddies (B), an upwelling (C) and an eddy
(D). Some of these features can also be linked to the
simplified circulation shown on figure 1. Upwelling regions
are characterized by high chlorophyll concentrations (>0.15
mg.m- 3) found along the coast, along the Malta shelf-break,
and at the boundaries of MRV.
Since surface currents interact with waters rich in
chlorophyll provoking the detachment of filaments useful
for identifying the coastal circulation, the other used
material is an optical satellite image derived from MODIS
(Moderate Resolution Imaging Spectroradiometer) and
provided by Copernicus: Aqua dataset-oc-med-chl-modis_a-
l4-chl_1km_8days-rt-v01_1464718499335 was selected for
this study to visualize the chlorophyll gradients and e-
Motion outputs at the same date.
4. RESULTS AND DISCUSSION Near-surface mesoscale eddies having a diameter down-to
100 km can be observed using altimetry techniques.
However, altimetry often fail in detecting smaller
features and have difficulties to detect turbulences located
close to the coast : difficulties in estimating the mean sea
level around the shelf break and issues of land
contamination in the altimeter and radiometer footprints are
the main encountered problems [8]. Nonetheless, eddies
with horizontal scales below 50 km can be observed from
space using optical sensors. [9]
The CHL map presented on figure 3 and derived from the
Modis dataset shows coherent features that are easily
regognizable. A very well delimited eddy can be observed
north-east to the Sicilian coast (D, figure 3). This eddy is
known as the Messina Rise Vortex (MRV). The Meanders
(C, figure 3) centered at about (15.25°E, 36.5°N) matches
the southward flow of the Malta plateau. They indicate the
core of an offshore directed filament transporting water
away from the coast also related to the bottom topography
and Ionian slope. These visible meanders are related to
upwelling signals which are easily recognizable in terms of
the color anomalies since these features results in a high
level of nutrients, due to the decomposition of sinking
organic matter brought to the surface and utilized by
phytoplankton. These meanders and upwelling are known as
Ionian shelf break vortex (ISV) and Ionian front (IF). A
north/south oriented filament (A, figure 3) can be observed
at about (15.25°E, 36.5°N) which is the west boundary of a
low concentration chlorophyll patch (B, figure 3).
Figure 4 e-Motion streamlines computed using 10 days of
AIS data from 10th, April 2016 to 19th April 2016,
superimposed on Aqua/Modis chlorophyll concentration.
Purple arrows are plotted to provide information related to
intensity and direction of the e-Motion observed features.
The main meanders, eddies and jets observed may be related
to the synoptic description of the circulation shown on
figure 1: A/AIS (reversed), C/ABV, D/MCC, E/MG, F/IF,
G/MRV.
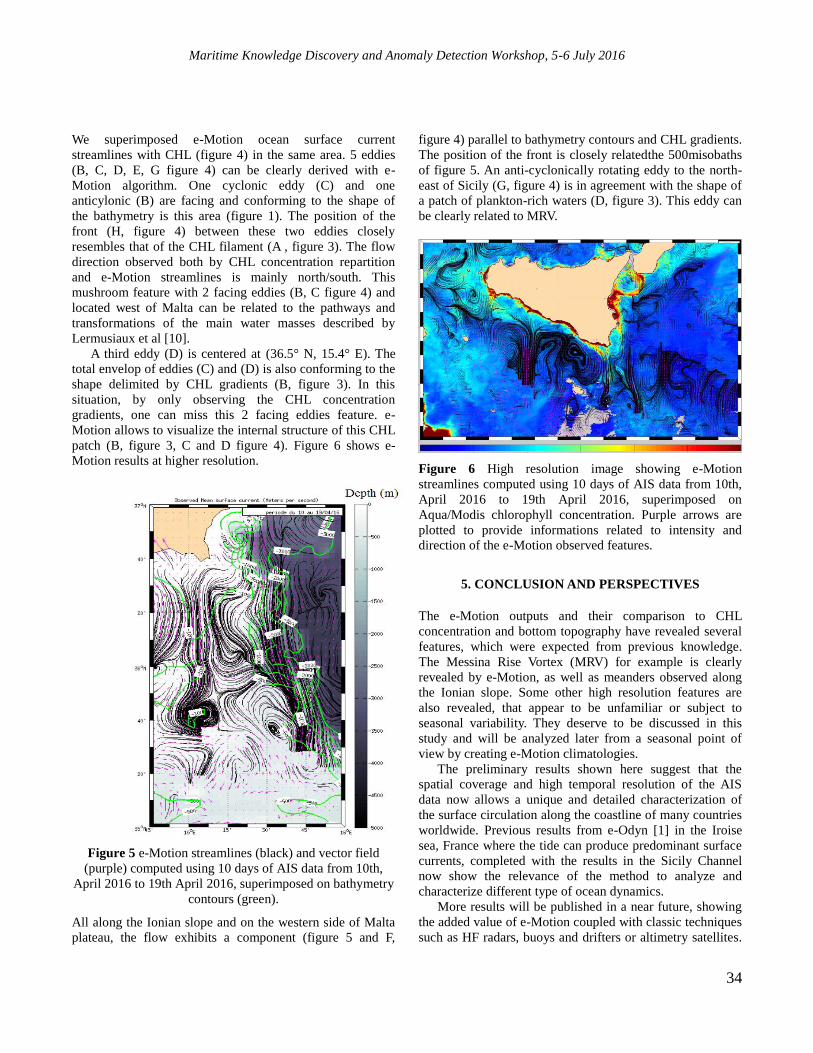
Maritime Knowledge Discovery and Anomaly Detection Workshop, 5-6 July 2016
34
We superimposed e-Motion ocean surface current
streamlines with CHL (figure 4) in the same area. 5 eddies
(B, C, D, E, G figure 4) can be clearly derived with e-
Motion algorithm. One cyclonic eddy (C) and one
anticylonic (B) are facing and conforming to the shape of
the bathymetry is this area (figure 1). The position of the
front (H, figure 4) between these two eddies closely
resembles that of the CHL filament (A , figure 3). The flow
direction observed both by CHL concentration repartition
and e-Motion streamlines is mainly north/south. This
mushroom feature with 2 facing eddies (B, C figure 4) and
located west of Malta can be related to the pathways and
transformations of the main water masses described by
Lermusiaux et al [10].
A third eddy (D) is centered at (36.5° N, 15.4° E). The
total envelop of eddies (C) and (D) is also conforming to the
shape delimited by CHL gradients (B, figure 3). In this
situation, by only observing the CHL concentration
gradients, one can miss this 2 facing eddies feature. e-
Motion allows to visualize the internal structure of this CHL
patch (B, figure 3, C and D figure 4). Figure 6 shows e-
Motion results at higher resolution.
Figure 5 e-Motion streamlines (black) and vector field
(purple) computed using 10 days of AIS data from 10th,
April 2016 to 19th April 2016, superimposed on bathymetry
contours (green).
All along the Ionian slope and on the western side of Malta
plateau, the flow exhibits a component (figure 5 and F,
figure 4) parallel to bathymetry contours and CHL gradients.
The position of the front is closely relatedthe 500misobaths
of figure 5. An anti-cyclonically rotating eddy to the north-
east of Sicily (G, figure 4) is in agreement with the shape of
a patch of plankton-rich waters (D, figure 3). This eddy can
be clearly related to MRV.
Figure 6 High resolution image showing e-Motion
streamlines computed using 10 days of AIS data from 10th,
April 2016 to 19th April 2016, superimposed on
Aqua/Modis chlorophyll concentration. Purple arrows are
plotted to provide informations related to intensity and
direction of the e-Motion observed features.
5. CONCLUSION AND PERSPECTIVES
The e-Motion outputs and their comparison to CHL
concentration and bottom topography have revealed several
features, which were expected from previous knowledge.
The Messina Rise Vortex (MRV) for example is clearly
revealed by e-Motion, as well as meanders observed along
the Ionian slope. Some other high resolution features are
also revealed, that appear to be unfamiliar or subject to
seasonal variability. They deserve to be discussed in this
study and will be analyzed later from a seasonal point of
view by creating e-Motion climatologies.
The preliminary results shown here suggest that the
spatial coverage and high temporal resolution of the AIS
data now allows a unique and detailed characterization of
the surface circulation along the coastline of many countries
worldwide. Previous results from e-Odyn [1] in the Iroise
sea, France where the tide can produce predominant surface
currents, completed with the results in the Sicily Channel
now show the relevance of the method to analyze and
characterize different type of ocean dynamics.
More results will be published in a near future, showing
the added value of e-Motion coupled with classic techniques
such as HF radars, buoys and drifters or altimetry satellites.

Maritime Knowledge Discovery and Anomaly Detection Workshop, 5-6 July 2016
35
Those studies will include quantitative information and error
estimations related to e-Motion outputs. The relevance of
using satellite AIS data to calculate ocean surface currents
and provide information at a global scale will be also
demonstrated.
6. ACKNOWLEDGEMENT
This work was supported by ESA through the Globcurrent
project. The authors would like to thank P. Garreau
(IFREMER), B. Chapron (IFREMER), A. Serpette (SHOM)
and B. Le Cann (CNRS) and OceanDataLab Company who
provided insight and expertise that greatly assisted our
work.
7. DISCLAIMER
All findings of this paper are based on the analysis of a
single AIS data set collected in April 2016. The situation
described is only representative for this month of that
particular year and it is not claimed that it represents any
“mean” or “seasonal” situation of this region.
REFERENCES
[1] Guichoux, Y., Ocean dynamics 2.0 poster, EURASC symposium,
October 2015.
[2] Recommendation, I.T.U. RM. 1371‐4. Technical characteristics for
an automatic identification system using time‐division multiple
access in the VHF maritime mobile, 2010.
[3]International Maritime Organization (IMO), "International
Convention for the Safety of Life at Sea (SOLAS)", Retrieved 6
April 2013.
[4] Molcard, A., Gervasio, L., Griffa, A., Gasparini, G. P., Mortier, L.,
& Özgökmen, T. M., “Numerical investigation of the Sicily
Channel dynamics: density currents and watermass advection”.
Journal of Marine Systems, 36(3), 219-238, 2002.
[5] Millot, C., “Some features of the algerian current”, Journal of
Geophysical Research 90, 7169–7176, 1985.
[6] Omrani, H., Arsouze, T., Béranger, K., Boukthir, M., Drobinski, P.,
Lebeaupin-Brossier, C., & Mairech, H. “Sensitivity of the sea
circulation to the atmospheric forcing in the Sicily Channel.”
Progress in Oceanography, 140, 54-68, 2016.
[7] Drago, A., Azzopardi, J., Gauci, A., Tarasova, R., Ciraolo, G.,
Capodici, F., & Gacic, M. Sea surface currents by HF radar in the
Malta channel. Rapp. Comm. Int. Mer Medit, 40, 144, 2013.
[8] Vignudelli, S., Snaith, H. M., Cipollini, P., Venuti, F., Lyard, F.,
Cretaux, J. F., ... & Ginzburg, A. “Extending the use of satellite
altimetry for coastal applications: the alticore project.”
[9] Alpers, W., Brandt, P., Lazar, A., Dagorne, D., Sow, B., Faye, S.,
...& Brehmer, P. . “A small-scale oceanic eddy off the coast of
West Africa studied by multi-sensor satellite and surface drifter
data.” Remote Sensing of Environment, 129, 132-143, 2013.
[10] Lermusiaux, P. F. J., & Robinson, A. R. “Features of dominant
mesoscale variability, circulation patterns and dynamics in the
Strait of Sicily”. Deep Sea Research Part I: Oceanographic
Research Papers, 48(9), 1953-1997, 2001.

Maritime Knowledge Discovery and Anomaly Detection Workshop, 5-6 July 2016
36
DETECTING ANOMALIES IN STREAMS OF AIS VESSEL DATA
DimitriosZissis1,2
1Dept. Product & Systems Design Engineering,
University of the Aegean
Greece 2MarineTraffic.com
ABSTRACT
Current state of the art techniques and technologies are
struggling with the growing volumes of high-speed, loosely
structured, spatiotemporal data streams, such as those
produced by the vessel tracking Automatic Identification
system (AIS). So as to generate actionable intelligence from
these streams of data, systems are required to face
challenges at a variety of levels, including fusion,
processing and storage. In this paper, we report on our
recent work regarding learning a vessel’s “normal”
behavior, so as to support situational assessment by
indicating dangerous deviations from this in the future.
Within this context, we report on early results, that validate
the potential of a novel solution leveraging the architectural
characteristics of edge (or fog) computing and employs
Support Vector Machines (SVM) on the perimeter of the
system, to perform low footprint unsupervised learning and
analysis of sensor data for anomaly detection purposes.
Index Terms—fog computing, AIS anomaly detection,
1-SVM
1. INTRODUCTION
The International Maritime Organization (IMO) requires
that all vessels over 299 Gross Tones carry an Automatic
Identification System (AIS) transponder on board, which
transmits data regarding their position, speed and course,
amongst other static information (such as a vessel’s name,
dimensions, voyage details and other). Networks of coastal
and satellite receivers are capable of receiving such
broadcasted messages. A combination of AIS data and other
spatial information can produce interactive map mashups
which attempt to provide a depiction of the state at sea for
port authorities, coast guards, vessel tracking services and
other interested parties. For example, ‘MarineTraffic.com’
which is one of the most popular vessel trackers, is at any
time tracking more than 80,000 vessels, while data is
collected from a network of over 1,800 coastal AIS stations,
located in 140 countries around the world.
Unfortunately, vessel tracking systems are vulnerable to
a number of malicious attacks, as they were not originally
designed with security in mind. Balduzzi presented a
method of spoofing a vessel by injected invalid data into
AIS gateways [1]. Ship spoofing involves creating a
nonexistent vessel, assigning it all the information relevant
to AIS (MMSI and call sign), and then transmitting
messages as if valid, e.g. changing position, speed etc. [2].
By implementing this technique, malicious attackers, were
able to trigger fake collision warning alerts, which could
potentially make surrounding vessels alter their course.
Another attack includes AIS hijacking, by which attackers
can maliciously modify information provided by the AIS
base station, eavesdropping on all transmissions (i.e. man-
in-the-middle) or modifying data. This method makes it
possible for attackers to alter any information broadcast by
existing AIS stations regarding real vessel data (e.g., cargo,
speed, location, and country). AIS transponders are also
susceptible to “insider attacks”, as in some occasions vessels
have been reported hacking their own AIS responder.
Recently an Iranian tanker was intendedly disguising itself
as a smaller capacity vessel to avoid been identified [3].
Erroneous and malicious data needs to be filtered out
prior to entering the database, so as not to affect data
accuracy and business intelligence. In many cases, one can
employ traditional approaches to filter out the data outliers
in batch mode, when the data has already entered the
database. But for a website such as MarineTraffic, which
receives thousands of streams of vessel data, with an
increase rate of approximately 5GB per day and over 1
million events triggered (port calls, collision detections etc.)
it is almost impossible. In this short paper, we report on
early results that validate the potential of a novel solution,
which leverages the architectural characteristics of edge (or
fog) computing and employs Support Vector Machines
(SVM) on the perimeter of the system, to perform low
footprint unsupervised learning and analysis of sensor data
for anomaly detection purposes.
2. SECURITY ON THE PERIMETER OF THE
SYSTEM

Maritime Knowledge Discovery and Anomaly Detection Workshop, 5-6 July 2016
37
For streaming data, of such volume and variety, novel
approaches are required for processing and storage. It is
necessary to delegate an increasing number of processes to
the IS itself, increasing its autonomy, while leveraging
administrators and stakeholders from repetitive low level
and complex intensive tasks. With the rise of the Internet of
Things combined with Big Data, we are in urgent need of
intelligent security mechanisms capable of anticipating,
detecting, identifying, and protecting the systems
autonomously. Artificial intelligence techniques have been
employed in security for some time now.
An IDS is a defense system which is capable of
monitoring and detecting hostile activities either across a
network (Network based IDS) or on a host system (Host
based IDS). In “big data” conditions a centralized IDS
system would be flooded by too much data, ultimately
missing hidden trends in the data. For such purposes,
detection components of the IDS can be moved to the
periphery of the system, delegating them with monitoring
their local surrounding, while moving centralized decisions
to the coordinating authority higher up in the hierarchy. Fog
computing architectures, a.k.a, edge computing have
recently emerged as an extension of cloud computing,
offering services including storage and processing, closer to
the end user, directly at the edge of the network [4]. It is a
highly virtualized environment located on devices at the
periphery of the network (e.g. access points), positioned for
real time analytics, supporting densely distributed data
collection points, low latency interactions and high
geographical distribution [5]. From its infancy, researchers
identified the potential benefits edge computing could bring
to security in IOT and cloud environments [6]. In our work,
we leverage the fog, to architect and develop a hierarchy of
intelligent anomaly detection systems for IOT
environments.
3. SELF-PROTECTING AIS RECEIVER STATIONS
The hypothesis of this work is that each single AIS station
in a network can be viewed as a single fog node. Normal
vessel traffic should be clustered around one or more
specific clusters and any traffic representing anomalous
behavior or suspicious behavior should potentially be
positioned outside these clusters. Each fog node (e.g. AIS
station), receiving only a partition of the overall dataset
streaming into the application databases, can potentially
learn the clusters relevant to that, which will contain clusters
of vessel paths, types, positions, destinations and speed, in
near or real time constraints. Any vessel data detected not
falling within these clusters can be labelled as a potential
anomaly, alerting a higher level centralized node, system or
operator. As the node will be operating on a small portion of
the overall data, only the minimum of processing and
memory will be sufficient.
To validate our hypothesis we developed an intelligent
fog node IDS and deploy it on an experimental AIS receiver
base station located in the Aegean Sea Greece. An AIS base
station can be build using simple components such as a
Raspberry Pi 2 board (900MHz quad-core ARM Cortex-A7
CPU with 1GB RAM) and related sensors, which provide
enough computational power and memory for successfully
deploying Yocto Linux [7]. For the classification of
incoming data as anomalous or not, in real time constraints,
we implement a One-Class Support Vector Machine [8].
One-class SVM (1-SVM), is a one class classification
unsupervised learning algorithm, which aims to find an
optimal hyperplane in a feature space separating the training
data (positive samples) from the origin (considered as
negative samples) with maximum margin (the distance from
the hyperplane to the origin). It essentially learns a decision
function for novelty detection: classifying new data as
similar or different to the training set. For training the
machine learning algorithm, we maintain a time window of
vessel data collected in the previous 12 hours. As our
primary focus in this work, is to validate the architectural
deployment and counter attacks such as spoofing a real
vessels position data by making it to appear inland or in
other anomalous location (an attack described in Balduzzi,
2014), we focus on the vessels location data (Latitude and
Longitude), while ignoring other data fields.
The 1-SVM was trained on 24,285 instances (data
received in several hours previously) on the AIS base
receiver (Rasberry Pi 2 900MHz quad-core ARM Cortex-
A7 CPU with 1GB RAM) running Yocto Linux in several
minutes (less than 3 minutes). During training the 1-SVM
Figure 1 A visualization of received data from a single AIS base
station. Each dot representing a vessel (x-axis is Latitude, while y-
axis Longitude). Centre circle, represents the learned decision
function by the 1-SVM depicting inliers and outliers.

Maritime Knowledge Discovery and Anomaly Detection Workshop, 5-6 July 2016
38
erroneously labelled 2,429 observations. After successful
training, the SVM was tested on real data, both regular
observations and abnormal observation such as that injected
by a spoofed AIS receiver. From the 5,000 regular
observations fed to the SVM, 583 were erroneously labelled
as potentially anomalous, while from the 500 abnormal data
injected, all were detected as anomalies. Most importantly,
the SVM was capable of operating in near real time
constraints, without overburdening the AIS base receiver.
4. CONCLUSION AND FUTURE WORK
Overall, results verify that based on a multivariate statistical
approach, the IDS is capable of detecting abnormal vessel
movements through moving temporal window of vessel
measurements. In a similar fashion, a machine learning
algorithm can be fed data so as to learn the most common
seen destinations, vessel flags, types and more complex
behaviors.
REFERENCES
[1] M. Balduzzi, AIS Exposed Understanding Vulnerabilities &
Attacks 2.0, in: BlackHat Asia, 2014.
[2] M. Balduzzi, K. Wilhoit, A. Pasta, Threats at Sea: A Security
Evaluation of AIS, 2014.
[3] R. Almeida, Iranian Tanker Hacks AIS to Disguise Itself Off
Singapore, (2013).
[4] S. Yi, Z. Qin, Q. Li, Security and Privacy Issues of Fog
Computing: A Survey, in: K. Xu, H. Zhu (Eds.), Wirel.
Algorithms, Syst. Appl., Springer International Publishing, Cham,
2015. doi:10.1007/978-3-319-21837-3.
[5] Y. Wang, T. Uehara, R. Sasaki, Fog Computing: Issues and
Challenges in Security and Forensics, in: 2015 IEEE 39th Annu.
Comput. Softw. Appl. Conf., IEEE, 2015: pp. 53–59.
doi:10.1109/COMPSAC.2015.173.
[6] K. Lee, D. Kim, D. Ha, U. Rajput, H. Oh, On security and privacy
issues of fog computing supported Internet of Things environment,
in: 2015 6th Int. Conf. Netw. Futur., IEEE, 2015: pp. 1–3.
doi:10.1109/NOF.2015.7333287.
[7] F. Cabrera, N. Molina, M. Tichavska, V. Arana, Design of a low
cost prototype of automatic identification system (AIS) receiver,
in: 2015 1st URSI Atl. Radio Sci. Conf. (URSI AT-RASC), IEEE,
2015: pp. 1–1. doi:10.1109/URSI-AT-RASC.2015.7303000.
[8] B. Schölkopf, A. Smola, Support Vector Machines, in: P.
Armitage, T. Colton (Eds.), Encycl. Biostat., John Wiley & Sons,
Ltd, Chichester, UK, 2005. doi:10.1002/0470011815.

Maritime Knowledge Discovery and Anomaly Detection Workshop, 5-6 July 2016
39
SECTION III: RESEARCH CENTRES & ACADEMIA

Maritime Knowledge Discovery and Anomaly Detection Workshop, 5-6 July 2016
40
REAL TIME INTELLIGENCE OF AIS DATA
Nikitas Nikitakos
Professor
Dept. of Shipping Trade and Transport
University of the Aegean – Chios - GREECE
ABSTRACT
A conceptual framework for real time deaccessioning for
AIS anomaly detection is presented. Inspired from airport
electronic data real time risk assessment for resilience, a
stream reasoning approach is introduced. Stream reasoning
is an approach that can be used if information (in the form
of assertions) arrives as a stream of (time stamped) inputs.
The approach has two features that could be helpful: the
knowledge base can be continuously updated and reasoning
goals continuously re-evaluated as new assertions arrive, the
reasoner considers events from a finite time window, and
not only at a single instant
Index Terms— AIS data, stream reasoning, decision
support system
1. INTRODUCTION
AIS [2,3] is now well recognized in maritime society and
widely used as several systems, including class A for
SOLAS vessels, class B for non-SOLAS vessels, Aids to
Navigation (AtoN), Search and Rescue Transmitter (AIS-
SART), Application Specific Messages (ASM). The
Automatic Identification System (AIS) is a mandatory piece
of navigational equipment for automatic data exchange
between ships and with shore-based facilities. The overall
aim of AIS is to improve safety at sea by assisting target
tracking, simplifying information exchange and enhancing
collision avoidance. AIS could be exploited more efficiently
to improve the situational awareness both on board and
ashore as well as reduce the manual workload.
In the context of information fusion and maritime
surveillance the AIS data plays a critical role. Using these
data an indication is derived related with anomaly detection
i.e. that deviation of vessels’ expected behavior and possibly
further investigation is required. This is very important for
achieving appropriate Situation Awareness. Several methods
and algorithms [4] have been proposed to attack the issue,
mainly correlating historical data with new data provided by
AIS receiver. The existing methods are mainly based on
neural networks using supervised and unsupervised learning
or statistical/probabilistic models.
In this paper inspired by air traffic control developed in
EU research project SERSCIS [1] a new concept of AIS
intelligence based on complex event processing and
particular on data stream reasoning is presented, where an
indication of risks related with anomaly detection could be
initially derived and the appropriate action initiated.
The paper is structured as follows, after the introduction
a brief description of reasoning technology is presented then
the proposed conceptual framework is discussed followed
by conclusions and further research.
2. STREAM REASONING TECNOLOGY
Stream reasoning [5], [6] is an approach that can be used if
information arrives as a stream of (time stamped) inputs.
The approach has two features that could be helpful:
• the knowledge base can be continuously updated and
reasoning goals continuously re-evaluated as new assertions
arrive;
• the reasoner considers events from a finite time window,
and not only at a single instant.
Introducing stream reasoning in AIS data processing could
therefore overcome some of the current limitations by:
• allowing the concrete system model to be continuously
updated, which should be faster than generating a
completely new model each time we need an update;
• reducing the time lag between the evolution of the real
system and that of the concrete system model, making it
possible to resolve recent and rapid changes in the real
system;
• representing protracted as well as instantaneously
observed behaviors in the model by including information
over an extended time window;
• allowing reasoning algorithms to take account of system
changes during the time window, target than only the
instantaneous system composition and status.
However it is important to appreciate the research on
stream reasoning is still in its infant. Recent research efforts
are still in early step and focus on the investigation of
architecture approaches to support stream reasoning. As
illustrated in Figure 1, stream reasoning consists of four
main processing steps:
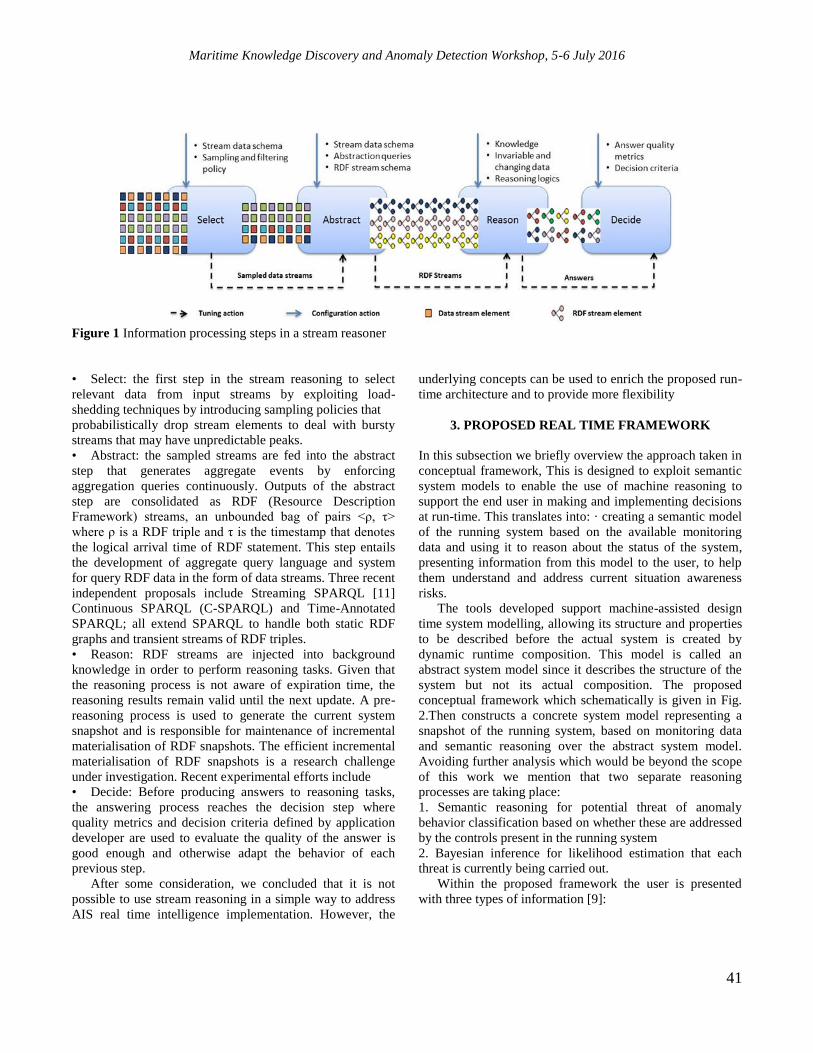
Maritime Knowledge Discovery and Anomaly Detection Workshop, 5-6 July 2016
41
Figure 1 Information processing steps in a stream reasoner
• Select: the first step in the stream reasoning to select
relevant data from input streams by exploiting load-
shedding techniques by introducing sampling policies that
probabilistically drop stream elements to deal with bursty
streams that may have unpredictable peaks.
• Abstract: the sampled streams are fed into the abstract
step that generates aggregate events by enforcing
aggregation queries continuously. Outputs of the abstract
step are consolidated as RDF (Resource Description
Framework) streams, an unbounded bag of pairs <ρ, τ>
where ρ is a RDF triple and τ is the timestamp that denotes
the logical arrival time of RDF statement. This step entails
the development of aggregate query language and system
for query RDF data in the form of data streams. Three recent
independent proposals include Streaming SPARQL [11]
Continuous SPARQL (C-SPARQL) and Time-Annotated
SPARQL; all extend SPARQL to handle both static RDF
graphs and transient streams of RDF triples.
• Reason: RDF streams are injected into background
knowledge in order to perform reasoning tasks. Given that
the reasoning process is not aware of expiration time, the
reasoning results remain valid until the next update. A pre-
reasoning process is used to generate the current system
snapshot and is responsible for maintenance of incremental
materialisation of RDF snapshots. The efficient incremental
materialisation of RDF snapshots is a research challenge
under investigation. Recent experimental efforts include
• Decide: Before producing answers to reasoning tasks,
the answering process reaches the decision step where
quality metrics and decision criteria defined by application
developer are used to evaluate the quality of the answer is
good enough and otherwise adapt the behavior of each
previous step.
After some consideration, we concluded that it is not
possible to use stream reasoning in a simple way to address
AIS real time intelligence implementation. However, the
underlying concepts can be used to enrich the proposed run-
time architecture and to provide more flexibility
3. PROPOSED REAL TIME FRAMEWORK
In this subsection we briefly overview the approach taken in
conceptual framework, This is designed to exploit semantic
system models to enable the use of machine reasoning to
support the end user in making and implementing decisions
at run-time. This translates into: · creating a semantic model
of the running system based on the available monitoring
data and using it to reason about the status of the system,
presenting information from this model to the user, to help
them understand and address current situation awareness
risks.
The tools developed support machine-assisted design
time system modelling, allowing its structure and properties
to be described before the actual system is created by
dynamic runtime composition. This model is called an
abstract system model since it describes the structure of the
system but not its actual composition. The proposed
conceptual framework which schematically is given in Fig.
2.Then constructs a concrete system model representing a
snapshot of the running system, based on monitoring data
and semantic reasoning over the abstract system model.
Avoiding further analysis which would be beyond the scope
of this work we mention that two separate reasoning
processes are taking place:
1. Semantic reasoning for potential threat of anomaly
behavior classification based on whether these are addressed
by the controls present in the running system
2. Bayesian inference for likelihood estimation that each
threat is currently being carried out.
Within the proposed framework the user is presented
with three types of information [9]:
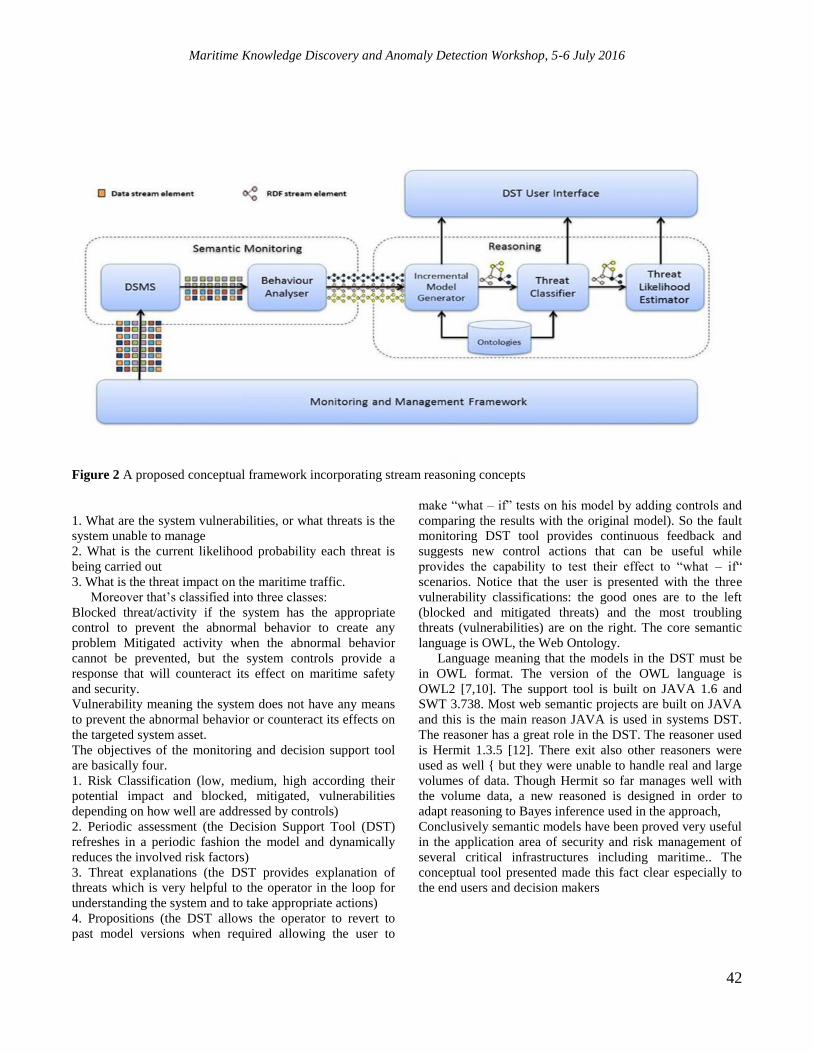
Maritime Knowledge Discovery and Anomaly Detection Workshop, 5-6 July 2016
42
Figure 2 A proposed conceptual framework incorporating stream reasoning concepts
1. What are the system vulnerabilities, or what threats is the
system unable to manage
2. What is the current likelihood probability each threat is
being carried out
3. What is the threat impact on the maritime traffic.
Moreover that’s classified into three classes:
Blocked threat/activity if the system has the appropriate
control to prevent the abnormal behavior to create any
problem Mitigated activity when the abnormal behavior
cannot be prevented, but the system controls provide a
response that will counteract its effect on maritime safety
and security.
Vulnerability meaning the system does not have any means
to prevent the abnormal behavior or counteract its effects on
the targeted system asset.
The objectives of the monitoring and decision support tool
are basically four.
1. Risk Classification (low, medium, high according their
potential impact and blocked, mitigated, vulnerabilities
depending on how well are addressed by controls)
2. Periodic assessment (the Decision Support Tool (DST)
refreshes in a periodic fashion the model and dynamically
reduces the involved risk factors)
3. Threat explanations (the DST provides explanation of
threats which is very helpful to the operator in the loop for
understanding the system and to take appropriate actions)
4. Propositions (the DST allows the operator to revert to
past model versions when required allowing the user to
make “what – if” tests on his model by adding controls and
comparing the results with the original model). So the fault
monitoring DST tool provides continuous feedback and
suggests new control actions that can be useful while
provides the capability to test their effect to “what – if“
scenarios. Notice that the user is presented with the three
vulnerability classifications: the good ones are to the left
(blocked and mitigated threats) and the most troubling
threats (vulnerabilities) are on the right. The core semantic
language is OWL, the Web Ontology.
Language meaning that the models in the DST must be
in OWL format. The version of the OWL language is
OWL2 [7,10]. The support tool is built on JAVA 1.6 and
SWT 3.738. Most web semantic projects are built on JAVA
and this is the main reason JAVA is used in systems DST.
The reasoner has a great role in the DST. The reasoner used
is Hermit 1.3.5 [12]. There exit also other reasoners were
used as well { but they were unable to handle real and large
volumes of data. Though Hermit so far manages well with
the volume data, a new reasoned is designed in order to
adapt reasoning to Bayes inference used in the approach,
Conclusively semantic models have been proved very useful
in the application area of security and risk management of
several critical infrastructures including maritime.. The
conceptual tool presented made this fact clear especially to
the end users and decision makers

Maritime Knowledge Discovery and Anomaly Detection Workshop, 5-6 July 2016
43
4. CONCLUSIONS – FUTURE RESEARCH
The concept of stream reasoning is useful for AIS data
intelligence to improve current limitations. However there
are still many research challenges. Some of them includes
the improvement of Behavior Analyzer component using
appropriate algorithms to convert raw monitoring data from
AIS into RDF streams improving the knowledge about
vessels adverse, the threat classifier also should be extended
to handle different types of classifications, but still defined
by SWRL rules and to examine the creation of specialized
classifier that would be faster than general purpose reasoner
and finally the Bayesian threat likelihood estimator
implementation should be optimized to reduce processing
time and abnormal activity hypothesis sampling should take
account of secondary effects. The performance of the
conceptual framework in real conditions and the
implementation of potential improvement is among the
objectives of future research.
REFERENCES
[1] SERSCIS ‘Semantically Enhanced Resilient & Secure Critical
Infrastructure Services’ European Community’s 7th Framework
Programme, Grant Agreement No. 225336,
[2] Technical characteristics for an automatic identification system
using time division multiple access in the VHF maritime mobile
band, Recommendation ITU-R M.1371-3, 2007.
[3] Guidance on the application of AIS binary messages, IMO,
SN/Circ.236, 2004.
[4] Michele Vespe, Giuliana Pallotta, Ingrid Visentini, Karna Bryan
and Paolo Braca ‘Maritime Trajectory Mining for Anomaly
Detection’ NATO RTO-MP-SCI-247 ,2009
[5] E. Valle, S. Ceri, D. F. Barbieri, D. Braga and A. Campi, “A First
Step Towards Stream Reasoning,” in Future Internet Symposium,
Vienna, Austria, 2008.
[6] H. Stuckenschmidt, S. Ceri, E. D. Valle and F. V. Harmenlen,
“Towards Expressive Stream Reasoning,” in the Dagstuhl Seminar
on Semantic Aspects of Sensor Networks, 2010.
[7] Pellet: OWL 2 Reasoner for Java. [Online]
http://clarkparsia.com/pellet/.
[8] ISO/IEC 27005:2011. Information technology -- Security
techniques --Information security risk management, International
Organization for Standardization, 2011.
[9] D. Kostopoulos, G. Leventakis1, V. Tsoulkas1 and N.
Nikitakos"An Intelligent Fault Monitoring and Risk Management
Tool for Complex Critical Infrastructures: The SERSCIS
Approach in Air-Traffic Surface Control," Uksim, pp.205-210,
2012 UKSim 14th International Conference on Modelling and
Simulation, 2012
[10] W3C OWL Working Group. OWL 2 Web Ontology Language:
Document Overview. W3C Recommendation, 27 October 2009.
Available at http://www.w3.org/TR/owl2-overview/.
[11] Davide Francesco Barbieri, Daniele Braga, Stefano Ceri,
Emanuele Della Valle, and Michael Grossniklaus. C-sparql: Sparql
for continuous querying. In Proceedings of the 18th international
conference on World wide web, WWW ’09, pages 1061–1062,
New York, NY, USA, 2009. ACM.
Maritime Knowledge Discovery and Anomaly Detection Workshop, 5-6 July 2016
44
VISUAL ANALYSIS OF VESSEL TRAFFIC SAFETY BY EXTRACTING
EVENTS AND ORCHESTRATING INTERACTIVE FILTERS
Gennady Andrienko1, 2
, Natalia Andrienko1,2
, Christophe Claramunt3, Georg Fuchs
1, Cyril Ray
3
1Fraunhofer IAIS, Sankt Augustin, Germany
2City University London, UK
3Naval Academy Research Institute (IRENav) Brest, France
ABSTRACT
Safety and security are constant concerns of maritime
navigation, especially when considering the continuous
growth of maritime traffic around the world and persistent
decrease of crews on-board. This favored and led to the
development of automated monitoring systems such as AIS
(Automatic Identification System).Beyond its position, an
AIS device also transmits navigation data such as ship
identification, course, speed, and destination. However, the
availability of this information does not by itself ensure the
safety of the maritime traffic. Officers on the watch and
monitoring authorities require the development of decision-
aid solutions that will take advantage of these
communication systems. Detection and analysis of
anomalous events occurring in movement of vessels is a
crucial asset for improving the security of vessel traffic.
This paper shows an example of interactive visual analysis
in which we extract anomalous events from vessel
trajectories and explore the spatial distribution of these
events.
Index Terms— Visual Analytics, trajectory analysis,
event detection, maritime situational awareness, AIS
1. INTRODUCTION
Safety and security are constant concerns of maritime
navigation, especially when considering the continuous
growth of maritime traffic around the world and persistent
decrease of crews on-board. This favored and led to the
development of automated monitoring systems such as AIS
(Automatic Identification System). AIS was created in
order to provide real-time positioning of a vessel to other
vessels and to shore stations located in its radio range. The
International Maritime Organization requires AIS to be
installed aboard international voyaging ships with gross
tonnage of 300 or more and all passenger ships regardless of
the size. Beyond its position, an AIS device also transmits
navigation data such as ship identification, course, speed,
and destination. However, the availability of this
information does not by itself ensure the safety of the
maritime traffic. Officers on the watch and monitoring
authorities require the development of decision-aid solutions
that will take advantage of these communication systems
[1]. Detection and analysis of anomalous events occurring
in movement of vessels is a crucial asset for improving the
security of vessel traffic [2]. The range of possible events of
interest is very large from collision at sea to illegal fishing
and illicit activities. This paper shows an example of
interactive visual analysis in which we extract anomalous
events from vessel trajectories and explore the spatial
distribution of these events. Our example AIS-collected
dataset consists of 5,244 trajectories of vessels that moved
in the bay of Brest (France) in the time period of 313 days
from the 11th of February till 21st of December, 2009. The
data are available not for all days within this time period.
Due to the large amount of data, we apply spatial
aggregation. We combine two approaches to spatial
aggregation of trajectories: discrete and continuous [3].
Continuous aggregation [4] can better preserve spatial
patterns by avoiding indispensable position distortions due
to space discretization. However, discrete aggregation
provides accurate numeric measures of aggregated
movements. Fig. 1, left, shows the study area and the
trajectories aggregated into a continuous density surface.
The density is represented by color variation from light blue
(low density) through yellow to dark red (high density).
The expressiveness is enhanced by adding illumination
effects (hill shading).
2. ANALYSIS EXAMPLE
Our analysis focuses on those vessels that moved through
the strait (1.8 km length) either into or out of the bay.
Using an interactive spatial filter, we select 2,411
trajectories of these vessels. The resulting density map is
shown on the right of Fig. 1 (the original density map has
been automatically updated according to the current filter).
We see that there are two nearly parallel lanes along the
strait in which the vessels mostly move.
In the context of traffic safety analysis, we want to detect
events when two vessels come too close to each other.

Maritime Knowledge Discovery and Anomaly Detection Workshop, 5-6 July 2016
45
Figure 1 The study area and the density of vessel trajectories. Left: all trajectories; right: trajectories going through the strait,
which are analyzed in the paper.
Instances of close approach may indicate near-collisions but
also other events of interest, such as tugging, boarding, or
smuggling. A near-location is commonly known as a
situation in which a closest point of approach (CPA)
between two vessels is identified or predicted.
Different approaches have been so far developed to evaluate
such situations such as a collision diameter [5] and critical
situations [6].
Our approach is based on a search of a spatio-temporal
nearest neighbor for each point in the trajectory of each
vessel: given the position 𝑝 of the vessel at moment 𝑡, the
tool determines the positions of all other vessels within the
time interval [𝑡 − ∆𝑡 , 𝑡 + ∆𝑡], measures the distances from p
to all these positions, and takes the minimum of the
distances. Here, ∆𝑡 is a temporal tolerance threshold that
compensates for possible differences in the time references
of the position records in different trajectories; we set it to
30 seconds. Then, we extract those trajectory segments
where the distance to the nearest neighbor is under 100
meters (these temporal and spatial thresholds are relatively
representative of aforementioned events). These extracted
segments, treated as independent spatio-temporal objects [3,
7], are further called near-location events. Some of the
events occurred in the harbor or in areas outside the main
traffic lanes. By applying spatial filtering to the events, we
select only those that happened within or near the lanes
(1,601 events out of 2,237).
Figure 2 Left: The traffic through the strait at the times of
occurrence of the near-location events. Right: The traffic in
the remaining times.
In the second step, we investigate the traffic at the times
when the near-location events happened in order to detect
any relevant pattern. The times of event occurrences are
dispersed over the period of almost a year. To select all time
intervals containing near-location events and only these
intervals, we apply a special kind of temporal filter, called
time mask. In response, only the parts of the trajectories that
took place within the selected 303 time intervals are
extracted. The trajectories that happened beyond the
selected intervals are completely filtered out. There are 681
trajectories that fully or partly satisfy the combination of the
spatial filter and time mask filter. The density map is
automatically updated to show only these trajectories and
parts (Fig. 2, left). The spatial pattern looks somewhat
different from that of the overall traffic (Fig. 1 right). To
better understand the differences, we invert the time mask
filter and look also at the traffic pattern in the times when
there were no near-location events (Fig. 2, right).
The image in Fig. 2, left, differs from that on the right in
relatively high density of trajectories that switched from one
lane to another. The occurrences of near-location events
may be related to this lane switching.
Figure 3 Discrete aggregation of the same data subsets as in
Fig. 2.
Applying discrete aggregation (Fig.3) allows us to see
the directions of the traffic flows and obtain numeric
information concerning the flow volumes. In Fig. 3, right,
we see that in the times when no near-locations happened
the total incoming and outgoing traffic flows are symmetric
(i.e., have approximately equal volumes). At the times of
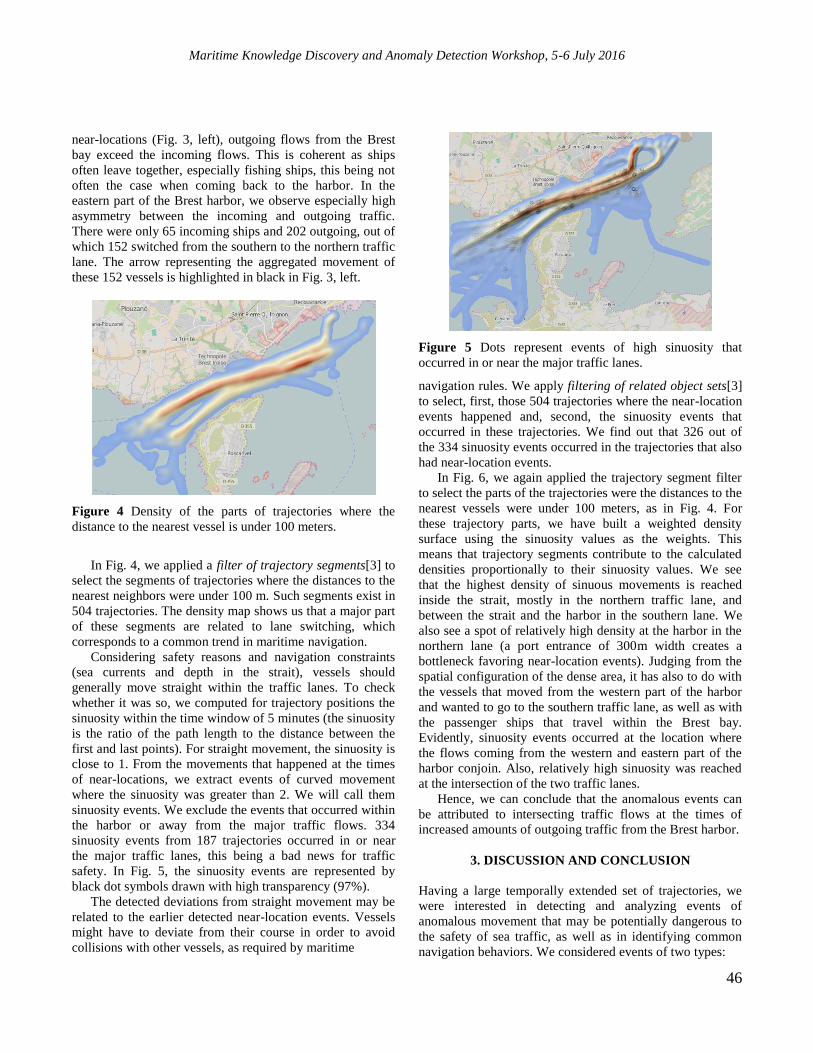
Maritime Knowledge Discovery and Anomaly Detection Workshop, 5-6 July 2016
46
near-locations (Fig. 3, left), outgoing flows from the Brest
bay exceed the incoming flows. This is coherent as ships
often leave together, especially fishing ships, this being not
often the case when coming back to the harbor. In the
eastern part of the Brest harbor, we observe especially high
asymmetry between the incoming and outgoing traffic.
There were only 65 incoming ships and 202 outgoing, out of
which 152 switched from the southern to the northern traffic
lane. The arrow representing the aggregated movement of
these 152 vessels is highlighted in black in Fig. 3, left.
Figure 4 Density of the parts of trajectories where the
distance to the nearest vessel is under 100 meters.
In Fig. 4, we applied a filter of trajectory segments[3] to
select the segments of trajectories where the distances to the
nearest neighbors were under 100 m. Such segments exist in
504 trajectories. The density map shows us that a major part
of these segments are related to lane switching, which
corresponds to a common trend in maritime navigation.
Considering safety reasons and navigation constraints
(sea currents and depth in the strait), vessels should
generally move straight within the traffic lanes. To check
whether it was so, we computed for trajectory positions the
sinuosity within the time window of 5 minutes (the sinuosity
is the ratio of the path length to the distance between the
first and last points). For straight movement, the sinuosity is
close to 1. From the movements that happened at the times
of near-locations, we extract events of curved movement
where the sinuosity was greater than 2. We will call them
sinuosity events. We exclude the events that occurred within
the harbor or away from the major traffic flows. 334
sinuosity events from 187 trajectories occurred in or near
the major traffic lanes, this being a bad news for traffic
safety. In Fig. 5, the sinuosity events are represented by
black dot symbols drawn with high transparency (97%).
The detected deviations from straight movement may be
related to the earlier detected near-location events. Vessels
might have to deviate from their course in order to avoid
collisions with other vessels, as required by maritime
Figure 5 Dots represent events of high sinuosity that
occurred in or near the major traffic lanes.
navigation rules. We apply filtering of related object sets[3]
to select, first, those 504 trajectories where the near-location
events happened and, second, the sinuosity events that
occurred in these trajectories. We find out that 326 out of
the 334 sinuosity events occurred in the trajectories that also
had near-location events.
In Fig. 6, we again applied the trajectory segment filter
to select the parts of the trajectories were the distances to the
nearest vessels were under 100 meters, as in Fig. 4. For
these trajectory parts, we have built a weighted density
surface using the sinuosity values as the weights. This
means that trajectory segments contribute to the calculated
densities proportionally to their sinuosity values. We see
that the highest density of sinuous movements is reached
inside the strait, mostly in the northern traffic lane, and
between the strait and the harbor in the southern lane. We
also see a spot of relatively high density at the harbor in the
northern lane (a port entrance of 300m width creates a
bottleneck favoring near-location events). Judging from the
spatial configuration of the dense area, it has also to do with
the vessels that moved from the western part of the harbor
and wanted to go to the southern traffic lane, as well as with
the passenger ships that travel within the Brest bay.
Evidently, sinuosity events occurred at the location where
the flows coming from the western and eastern part of the
harbor conjoin. Also, relatively high sinuosity was reached
at the intersection of the two traffic lanes.
Hence, we can conclude that the anomalous events can
be attributed to intersecting traffic flows at the times of
increased amounts of outgoing traffic from the Brest harbor.
3. DISCUSSION AND CONCLUSION
Having a large temporally extended set of trajectories, we
were interested in detecting and analyzing events of
anomalous movement that may be potentially dangerous to
the safety of sea traffic, as well as in identifying common
navigation behaviors. We considered events of two types:

Maritime Knowledge Discovery and Anomaly Detection Workshop, 5-6 July 2016
47
Figure 6 Weighted density of the trajectory segments where
the distances to the nearest vessels are below 100 meters.
Sinuosity values are used as the weights.
vessels coming too close to one another (near-locations) and
sinuous movements in the areas of major traffic flows. We
applied computational tools to calculate movement
attributes the values of which might be indicative of such
events, namely, the distance to the nearest neighbor and the
path sinuosity within a selected time window. Using an
interactive query tool, we extracted the events of interest
based on the values of these attributes.
To investigate where and under what traffic conditions
the extracted events happened, we used a variety of filters
separately and in combinations. To have an overall view of
the spatial distribution of the movements and events of
interest, we used visual spatial summaries (aggregations) in
the form of continuous density maps and discrete flow
maps. We have gained the following findings:
The near-location events most often occurred at the
times when the outgoing traffic from the Brest
harbor exceeded the incoming traffic.
A major part of the near-location events happened
to vessels that moved out of the harbor in the
southern traffic lane and then switched to the
northern lane before entering the strait, this
reflecting some navigation routes predefined in the
area.
The sinuosity events are closely related to the near-
location events.
Both types of anomalous events are related to
intersecting traffic flows between the harbour and
the strait and, possibly, narrow space and high
traffic density inside the strait, where the vessels
need to go in two parallel lanes.
In our analysis, we used the following types of filtering
performed by means of interactive tools:
Spatial filtering for selecting data within an area of
interest and for excluding analysis-irrelevant data
(e.g., events that occurred inside the harbor).
Time mask filter, which selects multiple disjoint
time intervals based on given conditions and
excludes the remaining time intervals. We used it
for selecting the times when near-location events
occurred.
Filter of trajectory segments, which selects parts of
trajectories based on movement attributes, either
pre-existing or derived, such as the distance to the
nearest neighbor and path sinuosity in a time
window.
Filter of related object sets, which allowed us to
select the trajectories in which near-location events
happened and then the sinuosity events that
occurred in the selected trajectories.
This combination of computation-supported extraction of
features of interest (events), spatial aggregation of data and
visual representation of the spatial summaries, and
interactive application and combination of various filters
allowed us to detect and investigate particular anomalies in
vessel movement. Similar approaches might be applied to
identify other maritime navigation events of interests.
REFERENCES
[1] C Claramunt, T Devogele, S Fournier, V Noyon, M Petit,and C
Ray, “Maritime GIS : From monitoring to simulationsystems,” in
Information Fusion and GIS, LNCS,pp. 34–44. Springer, 2007.
[2] T Devogele, L Etienne, and C Ray, “Maritime Monitoring,”in
Mobility Data: Modelling, Management, and Understanding,pp.
224–243. Cambridge University Press,Aug 2013.
[3] G Andrienko, N Andrienko, P Bak, D Keim, and S Wrobel,Visual
Analytics of Movement, Springer, 2013.
[4] N Willems, H Van De Wetering, and J Van Wijk, “Visualizationof
vessel movements,” Computer GraphicsForum, vol. 28, no. 3, pp.
959–966, 2009.
[5] Y Fujii, H Yamanouchi, and N Mizuki, “On the fundamentalsof
marine traffic control. Part 1, probabilities ofcollision and evasive
actions,” Electronic Navigation ResearchInstitute Papers, vol. 2,
pp. 1–16, 1970.
[6] P Pedersen, “Collision and grounding mechanics,” Proceedingsof
WEMT, vol. 95, no. 1995, pp. 125–157, 1995.
[7] G Andrienko, N Andrienko, Ch Hurter, S Rinzivillo, andS Wrobel,
“Scalable Analysis of Movement Data for Extractingand Exploring
Significant Places,” IEEE Transactionson Visualization and
Computer Graphics, vol. 19,no. 7, pp. 1078–1094, 2013.

Maritime Knowledge Discovery and Anomaly Detection Workshop, 5-6 July 2016
48
SCALABLE ESTIMATION OF PORT AREAS FROM AIS DATA
Leonardo M. Millefiori, Luca Cazzanti, Dimitris Zissis, Gianfranco Arcieri
NATO STO Centre for Maritime Research and Experimentation La Spezia, Italy
ABSTRACT
This paper discusses work in progress to estimate port
locations and operational areas in a scalable, data-driven,
unsupervised way. Knowing the extent of port areas is an
important component of larger maritime traffic analysis
systems that inform stakeholders and decision makers in the
maritime industry, governmental agencies, and international
organizations. The proposed approach uses Kernel Density
Estimator (KDE) and exploits the large volume of
Automatic Identification System (AIS) data to learn the
extent of port areas in a data-driven way. Example results
for the port of La Spezia, Italy, demonstrate the approach for
real data.
Index Terms— KDE, port location estimation, AIS,
map reduce, big data
1. INTRODUCTION
The Mediterranean hosts one of the most complex and dense
port networks in the world, a gateway to European
commerce and industry. A recent report published by the
European Commission calculated that 74% of goods
imported and exported and 37% of exchanges within the
European Union transit through the roughly 1200 seaports
along its 70,000 km of coastline [1, 2]. Decision makers,
policy advisors, trade partners, security experts, safety
agencies, international organizations, and vessel operators
are becoming more reliant on benchmark metrics of port
activities to carry out their duties. Examples of such metrics
include maritime and intermodal connectivity indicators,
volume of cargo throughput, proportion of different types of
goods transported, and fishing activity indicators. In
addition, stakeholders are becoming more reliant on
summary statistics and representative Patterns of Life
(PoLS) to characterize the ports according to their local and
regional traffic patterns and operational capabilities.
Generating valid and reliable measurements though, is a
complex task. We often overlook the fact that maritime
networks operate as “small worlds”, where content and size
vary over space and time, under the influence of the trade
and carrier patterns. In particular, port region, port system,
and port range are spatial entities that evolve over time [3],
yet their clear definitions are essential for obtaining accurate
metrics on port activities.
Manually collating and curating port area definitions is
not a realistic approach: subjective definitions of port areas
and system maintenance costs make it unreliable and
infeasible. Thus, the stepping stone for any useful port
analysis is an automatic, unsupervised, data-driven approach
to defining seaport locations and operational boundaries.
While in the past, sea transport surveillance had suffered
from a lack of data, current tracking technology such as
Automatic Identification System (AIS) [4] has transformed
the problem into one of extracting interpretable information
from an overabundance of maritime data. This introduces
the additional requirement that the algorithmic approaches
must be scalable to big data regimes.
The major challenge faced today, is developing the
ability to identify patterns emerging within these huge
datasets, fused from a variety of sources and generated from
monitoring a large number of vessels on a day-to-day basis.
The extraction of implicit and often unknown information
from these datasets belongs to the field of data mining and
data science. Progressively huge amounts of structured and
unstructured data, tracking vessels during their voyages
across the seas, have become available. These datasets
provide detailed insights into the patterns vessels follow,
while they can operate as benchmarking tools for port
authorities regarding the effectiveness and efficiency of
their ports.
To address the big data challenge in the maritime
domain, researchers have developed computational and
statistical approaches that rely on (AIS) data to
automatically monitor vessel activities and extract their
behavioral patterns [5, 6, 7, 8]. Previous work at the NATO
Science and Technology Organization Centre for Maritime
Research and Experimentation (STO-CMRE) has explored
how to extract stationary areas from (AIS) data based on the
spatial clustering algorithm DBSCAN [9, 10]. Building on
that initial work, this paper presents work-in-progress to
estimate port areas in a scalable, unsupervised, data-driven
way. Instead of DBSCAN, the approach relies on the Kernel
Density Estimator (KDE) to form density-based estimates of
port locations and operational areas from the location and
velocity data contained in the (AIS) messages transmitted by
the vessels. The approach is scalable because the operations
underlying (KDE) are decomposable into MapReduce
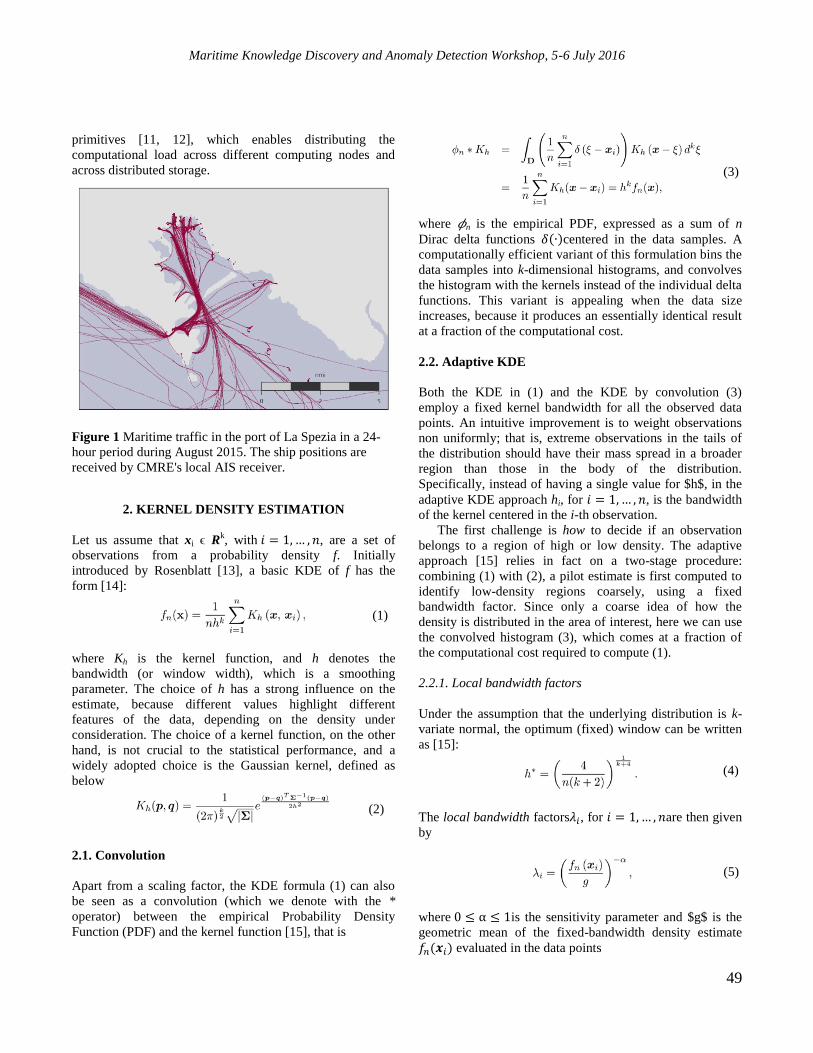
Maritime Knowledge Discovery and Anomaly Detection Workshop, 5-6 July 2016
49
primitives [11, 12], which enables distributing the
computational load across different computing nodes and
across distributed storage.
Figure 1 Maritime traffic in the port of La Spezia in a 24-
hour period during August 2015. The ship positions are
received by CMRE's local AIS receiver.
2. KERNEL DENSITY ESTIMATION
Let us assume that xi ϵ Rk, with 𝑖 = 1, … , 𝑛, are a set of
observations from a probability density f. Initially
introduced by Rosenblatt [13], a basic KDE of f has the
form [14]:
where Kh is the kernel function, and h denotes the
bandwidth (or window width), which is a smoothing
parameter. The choice of h has a strong influence on the
estimate, because different values highlight different
features of the data, depending on the density under
consideration. The choice of a kernel function, on the other
hand, is not crucial to the statistical performance, and a
widely adopted choice is the Gaussian kernel, defined as
below
2.1. Convolution
Apart from a scaling factor, the KDE formula (1) can also
be seen as a convolution (which we denote with the *
operator) between the empirical Probability Density
Function (PDF) and the kernel function [15], that is
where 𝜙n is the empirical PDF, expressed as a sum of n
Dirac delta functions 𝛿(∙)centered in the data samples. A
computationally efficient variant of this formulation bins the
data samples into k-dimensional histograms, and convolves
the histogram with the kernels instead of the individual delta
functions. This variant is appealing when the data size
increases, because it produces an essentially identical result
at a fraction of the computational cost.
2.2. Adaptive KDE
Both the KDE in (1) and the KDE by convolution (3)
employ a fixed kernel bandwidth for all the observed data
points. An intuitive improvement is to weight observations
non uniformly; that is, extreme observations in the tails of
the distribution should have their mass spread in a broader
region than those in the body of the distribution.
Specifically, instead of having a single value for $h$, in the
adaptive KDE approach hi, for 𝑖 = 1, … , 𝑛, is the bandwidth
of the kernel centered in the i-th observation.
The first challenge is how to decide if an observation
belongs to a region of high or low density. The adaptive
approach [15] relies in fact on a two-stage procedure:
combining (1) with (2), a pilot estimate is first computed to
identify low-density regions coarsely, using a fixed
bandwidth factor. Since only a coarse idea of how the
density is distributed in the area of interest, here we can use
the convolved histogram (3), which comes at a fraction of
the computational cost required to compute (1).
2.2.1. Local bandwidth factors
Under the assumption that the underlying distribution is k-
variate normal, the optimum (fixed) window can be written
as [15]:
The local bandwidth factors𝜆𝑖, for 𝑖 = 1, … , 𝑛are then given
by
where 0 ≤ α ≤ 1is the sensitivity parameter and $g$ is the
geometric mean of the fixed-bandwidth density estimate
𝑓𝑛(𝒙𝑖) evaluated in the data points
(1)
(2)
(3)
(4)
(5)

Maritime Knowledge Discovery and Anomaly Detection Workshop, 5-6 July 2016
50
The adaptive KDE of f can be finally expressed as
3. IMPLEMENTATION AND RESULTS
Let us indicate the full kinematic state of a vessel at a
generic time with𝝌𝑖 = [𝑎𝑖 , , 𝑏𝑖 , , 𝑣𝑖]𝑇 ∈ 𝑅3, where a and b
represent the longitude and latitude coordinates,
respectively, of the ship in a geographic coordinate system,
and 𝑣 ≥ 0 is the instantaneous speed of the vessel. We
introduce also a reduced vessel kinematic state that doesn't
include the instantaneous speed 𝒙𝑖 = [𝑎𝑖 , 𝑏𝑖] ∈ 𝑅2.Finally,
we observe the ship traffic in the neighborhood of a port in
the time interval [0, 𝑇], where 𝑇 can be hours, days or even
months, depending on the application.
Our objective is to determine the area of the port given
the set AIS of observations X that can be made up either by
the full or reduced kinematic states of the ships observed in
the area of interest. Assuming that the samples X are drawn
from a probability density function 𝑓, the proposed
approach consists of applying the KDE to the data samples,
and determining the port extent using horizontal cuts of the
resulting estimated probability density function.
Unfortunately, the direct computation of the fixed KDE
(1) is highly inefficient, especially for large or highly
dimensional data sets. In fact several approaches have been
proposed in the past to reduce the computational burden [16,
17, 18]. However, as the data set size and its dimensionality
increase, even the aforementioned approaches can easily
become computationally prohibitive and therefore
distributed approaches are necessary. Zheng et al. [12] have
recently proposed randomized and deterministic distributed
algorithms for efficient KDE with quality guarantees,
adapting them to the popular MapReduce programming
model. As in [12], our approach is to take advantage of the
linearity of the KDE to distribute the computation among
many different nodes using the MapReduce [11] distributed
programming model.
For our purposes, we consider the port as the extended
location where ships exhibit a very low speed.
Consequently, there are two possible approaches for
estimating the density function. The first one is to compute
the KDE in 𝑅3at a very high computational cost using the
complete kinematic states 𝝌𝑖 including also the ship speed,
and then compute the spatial density estimate𝑓�̅�(𝒙)by
marginalization of 𝑓�̅�(𝝌)
where 𝑣𝑇is the speed threshold that discriminates the
stationary ships from those under way.
The second approach is to form the KDE in 𝑅2 using
only the positional information 𝒙𝑖 of the ships that can be
considered stationary. In other words, given the set of all the
observations, we can build a subset of the positional states
of only those ships whose speed is below a desired
threshold 𝑣𝑇 , and compute the KDE on this subset.This
second approach can be also seen as an approximation to the
first one that trades some result accuracy for a more
affordable computational cost.
We applied these two approaches and the adaptive KDE
(7) to the data set shown in Fig. 1, which is made up by all
the AIS messages received by CMRE's local station during a
24-hour period in August 2015. The resulting kernel density
estimates are shown in Fig. 2, where we report: on the left
side, the fixed-bandwidth KDE computed in𝑅3 using the
kinematic states𝝌𝑖and marginalized on 𝑣; in the middle and
on the right side, the fixed-bandwidth and adaptive KDE,
respectively, both computed in𝑅2 and discarding all
kinematic states whose instantaneous speed was greater than
the threshold 𝑣𝑇, that was set, in all three cases, to 1 kn.
4. CONCLUSIONS AND FUTURE WORKS
Estimating port locations and operational areas is an
essential component for achieving MSA. The large volume
of AIS data imposes algorithmic approaches that require
minimal human intervention and scale with the increasing
data volumes. The KDE-based approaches presented here
address these challenges by combining MapReduce with
fixed or adaptive kernel bandwidths. The results presented
on the single port of La Spezia could be extended to other
ports worldwide, and a port analysis platform could be
developed that learns the port areas worldwide in an
unsupervised way. The proposed approach can be extended
to other types of areas besides ports: off-shore platforms,
anchorage areas, and fishing grounds can be detected
automatically and their extent estimated in a data-driven,
unsupervised fashion.
(6)
(7)

Maritime Knowledge Discovery and Anomaly Detection Workshop, 5-6 July 2016
51
Figure 2 Comparison of kernel density estimates computed with different approaches: fixed bandwidth with 𝒙𝒊 ∈ 𝑹𝟑(left)
and 𝒙𝒊 ∈ 𝑹𝟐 (middle), and adaptive bandwidth with𝒙𝒊 ∈ 𝑹𝟐. The fixed 𝑹𝟑 version produces the smoothest result, but is
unable to deal satisfactory with the low-density estimate regions, and has the highest computational cost. The fixed approach
in 𝑹𝟐is computationally more affordable, but is equally not able to produce satisfactory results in low-density regions.
Finally, the adaptive KDE in 𝑹𝟐on the right has a higher computational cost than the fixed KDE, but it is the only one that
produces a spikier estimate on low-density regions. All the three estimates have been computed on the AIS messages
received by CMRE's local base station in a 24-hour time span during August 2015, shown in Fig 1. The speed threshold that
discriminates stationary from non-stationary targets is set to 1 knot.
REFERENCES
[1] E. Commission, “Ports 2030 – Gateway for the trans European
transport network,” Tech. Rep., 2014.
[2] E. Commission, “Ports: an engine for growth, Com (2013) 295
Final,” Tech. Rep., 2013.
[3] C. Ducruet, C. Rozenblat, F. Zaidi, “Ports in multi-level maritime
networks: evidence from the Atlantic (1996–2006),” in Journal of
Transport Geography, Vol. 18, Issue 4, pp. 508-518 ,July 2010.
[4] International Communication Union, “Technical characteristics for
an automatic identification system using time division multiple access
in the VHF maritime mobile band (Rec. ITU-R M.1371-4)”, 2012.
[5] M. Tichavska, F. Cabrera, B. Tovar, V. Arana, “Use of the
Automatic Identification System in Academic Research,” in
EUROCAST 2015: 15th International Conference, Las Palmas de Gran
Canaria, Spain, February 8-13, 2015, Revised Selected Papers, pp. 33-
40.
[6] G. Pallotta, M. Vespe, and K. Bryan, “Article Vessel Pattern
Knowledge Discovery from AIS Data: A Framework for Anomaly
Detection and Route Prediction,” in Entropy, vol. 15, no. 6, pp. 2218-
2245, Jun 2013.
[7]B. Ristic, B. La Scala, M. Morelande and N. Gordon, “Statistical
analysis of motion patterns in AIS Data: Anomaly detection and
motion prediction,” in 11th International Conference on Information
Fusion, 2008, Cologne, 2008, pp. 1-7.
[8] F. Mazzarella, M. Vespe, D. Damalas and G. Osio, “Discovering
vessel activities at sea using AIS data: Mapping of fishing footprints,”
in 17th International Conference on Information Fusion, 2014,
Salamanca.
[9] L. Cazzanti and G. Pallotta, “Mining Maritime Vessel Traffic:
Promises, challenges, techniques,” in OCEANS IEEE/MTS, Genoa,
2015.
[10] M. Ester, H. Kriegel, J. Sander, and X. Xu, “A density-based
algorithm for discovering clusters in large spatial databases with
noise,” in Second International Conference on Knowledge Discovery
and Data Mining, Portland, 1996.
[11]J. Dean, and S. Ghemawat, “MapReduce: Simplified Data
Processing on Large Clusters,” in Communications of ACM, vol. 51,
no. 1, pp. 107-113, 2008.
[12] Y. Zheng, J. Jestes, J. M. Phillips, and F. Li, “Quality and
efficiency for kernel density estimates in large data,” in Proceedings of
the 2013 ACM SIGMOD International Conference on Management of
Data (SIGMOD '13).ACM, New York, NY, USA, 433-444.
[13] M. Rosenblatt et al., “remarks on some nonparametric estimates
of a density function,” in The Annals of Mathematical Statistics,vol.
27, no. 3, pp. 832-837, 1956.
[14] D.W. Scott, “Multivariate Density estimation: theory, practice and
visualisation,” in John Wiley and Sons, 2015.
[15] B. W. Silverman, “Density Estimation for Statistics and Data
Analysis,” in CRC press, vol. 26, 1986.
[16] B. W. Silverman, “Algorithm AS 176: Kernel Density Estimation
using the Fast Fourier Transform,” in Journal of the Royal Statistical
Society. Series C (Applied Statistics), vol. 31, no. 1, pp. 93-99, 1982.
[17] Y. Chen, M. welling, and A. Smola, “Super-samples from kernel
herding ,” in arXiv preprint arXiv:1203.3472, 2012.
[18] J. M. Phillips, B. Wang, and Y. Zheng, “Geometric inference on
kernel density estimates,” in CoRR, vol. abs/1307.7760, 2013.
Maritime Knowledge Discovery and Anomaly Detection Workshop, 5-6 July 2016
52
DATA REQUIREMENTS FOR ANOMALY DETECTION
Steven Horn*, Cheryl Eisler
*, Dr. Peter Dobias
*, Lt(N) Joe Collins
†
* Defence Research and Development Canada,
† Canadian Department of National Defence
© Her Majesty the Queen in Right of Canada, as represented by the Minister of National Defence, 2016
ABSTRACT
New processing techniques are being developed to extract
and highlight anomalous maritime behaviour by leveraging
the abundance of open source and/or commercially available
information on a global scale. This common approach to
data science relies on the exploitation of large datasets
through methods such as data analytics and data mining. In
the reverse aspect, one can instead explicitly consider the
definition and types of anomalies that a maritime security
operator would desire to know about to derive the quantity
of data required to achieve a given level of confidence in
detection. The requirements gap between the available
information and the desired effect can be identified by
working the problem of anomaly detection from both ends:
exploiting the data available, and quantifying the desired
end state. This work presents a framework for the definition
of data requirements for a set of operationally relevant
anomalies. By formally quantifying the data gaps, resource
investment for additional data can be better directed in order
to improve operational utility of the dataset.
Index Terms— Maritime, Surveillance, Anomaly
Detection, Requirements, Fusion, Information, Knowledge.
1. INTRODUCTION
The quantification of requirements for data which may be
used for multiple decision-making purposes is a challenging
task, which is further complicated if there is a wide
spectrum of available data. First, several concepts and
definitions are required to describe and conceptualize the
process from data to decision. This process is described
herein as a chain of derived utility, building on lower level
data in order to achieve higher-level awareness, and has
been previously described using multiple models such the
Data Fusion Information Group (DFIG) model [1], and the
Data, Information, Knowledge, Wisdom (DIKW) model [2].
In this paper, the concepts of data, information, and
knowledge from the latter model will be adopted,
acknowledging that the specific definition of each of these
elements often varies throughout the literature [3]. However,
it is noted here that there is generally a difference between
the concepts of data, information, and knowledge; wherein
information is something of value derived from data, and
knowledge is a yet higher level cognitive situational
understanding.
When considering the practical use of data, while it can
be argued that more data and, therefore, information is
desirable, it is not necessarily achievable if the cost to
extract useful information from the data increases with the
data volume faster than the actual information value of these
data. Consideration of these diminishing returns is of crucial
importance when resource costs are associated with data
collection.
Due to the volume and associated costs of both data
acquisition and data processing, it is highly desirable to
know what is the right amount of data that will enable
detection of anomalies with a desired confidence. In other
words, what is the minimum volume of data that will give
the operators a minimum desired confidence in their
surveillance and anomaly detection capabilities? This is the
question that this paper strives to answer.
The paper is organized as follows: First, the nature of
various types of anomalies and the data types and
information necessary to detect an anomaly are discussed in
Section 2. Then the detection algorithms are presented in
Section 3, followed by the description of the quantification
of the operational requirements in Section 4. Finally, the
methodology and results are given in Section 5, and a brief
summary is provided in Section 6.
2. TYPES OF ANOMALIES AND DATA
REQUIREMENTS
In this section, a review and description of types of
maritime anomalies is presented with the objective of
characterizing several fundamental properties of the
anomalies. It is important to note here that the objective is to
describe anomalies in the context of the ships2 that are being
described by the data, and not in the data itself, i.e.,
behavioural anomalies vice data anomalies. Maritime
anomalies are divided here into two categories: kinematic,
2 In the maritime environment, data are most commonly collected on surface ships, although data may also include submarines, aircraft, and any
unmanned forms of the aforementioned vessel types.

Maritime Knowledge Discovery and Anomaly Detection Workshop, 5-6 July 2016
53
meaning the anomaly is exhibited in the motion of a ship
(such as unusual maneuvering); and static, meaning that the
anomaly is exhibited by the properties of a ship (such as
with unusual crew or cargo). For the purposes of this paper,
the data requirements analysis will focus on the ability to
detect kinematic-type anomalies.
To be able to detect an anomaly, it is necessary to
collect both positional data and classification (ship type) or
identifying (ship name) data. Some information, if not
directly observed, can be estimated through classical
statistical filtering and estimation techniques, such as
Kalman filtering [7]. Previous work on the development of
maritime anomaly taxonomies [4]-[5], provides a foundation
for the classification of anomalies herein. The various sub-
types of anomalies are grouped into three general categories.
Maneuvering: Anomalies that involve the velocity
vector of a ship, such as an unexpected change of direction,
stopping or loitering, or travel at a speed unusual given the
type of ship or area. This includes maneuvering such as
change of direction inconsistent with expected pattern, or
change or lack of change of speed (stop/resume inconsistent
with expected pattern) over time observed. Examples of
anomalies in maneuver are grab and dash fishing [6] or
pickup of illicit cargo.
Location: Anomalies related to where a ship is located,
which include entering exclusion zones or restricted areas,
travelling outside of vessel traffic management schemes, or
travelling outside of normal historical routes. Governments
can have a variety of reasons to establish restricted areas, for
example security, environmental, or navigational concerns,
where vessels are not allowed to enter. Some examples
include operating: at trawling speed in a closed zone, in
proximity to critical infrastructure, in a closed zone, in non-
navigable waters, or in a zone inconsistent with the claimed
activity for the given ship type.
Interaction: Anomalies related to the unusual or illicit
interaction between ships or with other infrastructure.
Examples could include ship rendezvous in both open-ocean
and littoral waters. While there are potentially benign
reasons for ships to rendezvous at sea, it is a fairly rare
activity that could indicate illegal cross-transfer of resources
or personnel. Requirements for detecting rendezvous could
vary in the cluttered and more disordered littoral waters
versus open-ocean.
3. DETECTION OF ANOMALIES
Since there are many techniques described in the literature
for maritime anomaly detection [8], it is vital to consider the
performance and efficiency of the algorithm used
operationally. This leads to the question of where to invest
additional resources: should one invest in improving the
computational performance to detect anomalies using less
data or information, or should one invest in additional
sensors to collect more data to facilitate the anomaly
detection. Since the objective of the framework is to be
agnostic with regards to the type of processing that is being
used to detect the anomaly, the description of how to detect
the anomaly is presented from a fundamentals of detection
perspective.
Given a model for an anomaly one wishes to detect,
numerous sequential testing algorithms exist in the literature
which can be applied to test against an anomaly hypothesis.
It has been reported that good performance for target
maneuver detection (a type of anomaly) is achieved using
the classical cumulative sum algorithm first described by
Page [9], and the Shiryayev Sequential Probability Ratio
Test algorithm [10].
The set of data requirements for real-time anomaly
detection is not directly investigated in this paper.
Nonetheless, it is expected that the requirements for real-
time detection versus batch mode will be similar but with
added constraints due to the timeliness (latency) of the data,
and the effect of out-of-sequence observations.
For detections that are not time-critical, such as
regulatory enforcement or generation of intelligence cues, a
batch mode processing approach can be used. Some
examples of anomalies which are suitable for batch mode
processing include: the detection of ships which have left an
oil slick, or detecting ships which have entered an
environmental exclusion zone. Additionally, latency in the
reception of the data and out-of-sequence observations have
minimal impact on the ability to detect anomalies in batch
mode. For each of the three main categories of anomalies
identified in Section 2, a model is created to describe the
kinematics of the anomaly in the following subsections.
3.1. Detection of a ship stopping and loitering
The model for detecting a ship which stops, loiters, and
resumes course is illustrated in Figure 1 as model I. This
same model can be applied to the change of course anomaly
if the magnitude of course change is large, which is
reasonable since a small change of course is difficult to
declare as anomalous given that course changes are normal
events for ships, depending on the area they are in. The
anomalous pattern is shown in the upper set of arrows. A
ship at point a is moving at some initial velocity vi and
decelerates to a stop at point b. The ship loiters at point b
for a time period tstopped, and then accelerates at aship to
maximum velocity vmax to point c, travelling to point d at
vmax until resuming normal speed at point e. The non-
anomalous route is shown below, where the ship moves
from point a to e, maintaining constant velocity vi.
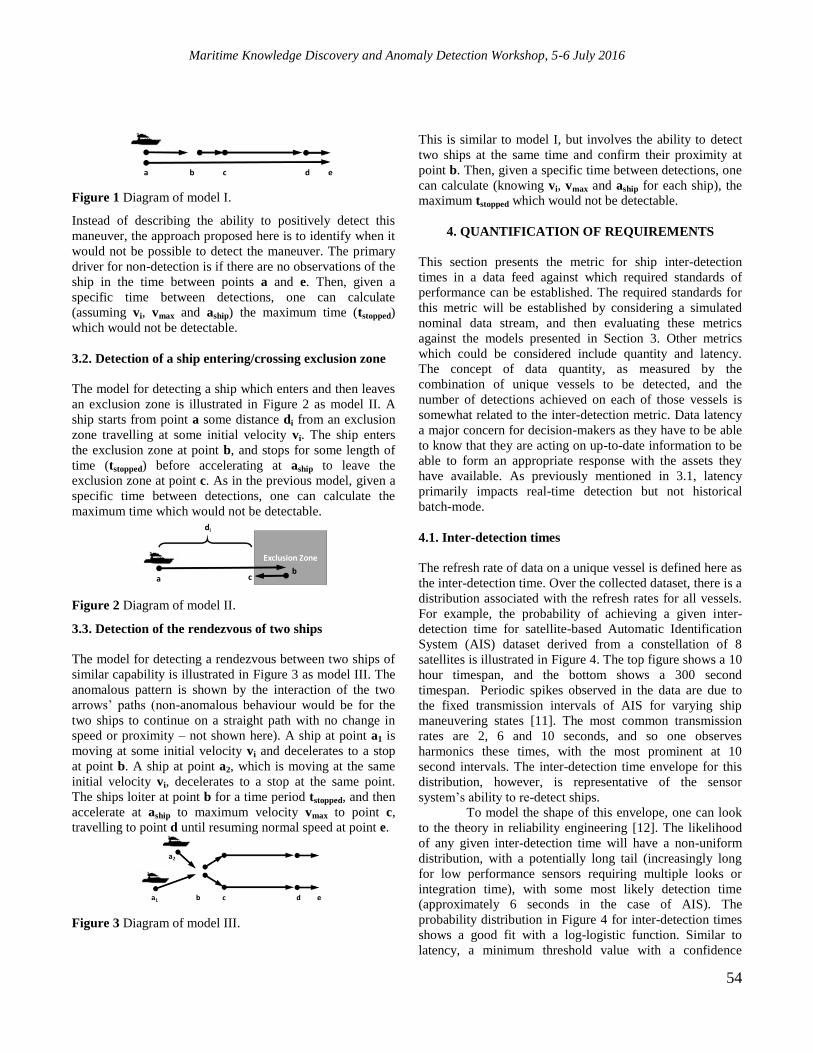
Maritime Knowledge Discovery and Anomaly Detection Workshop, 5-6 July 2016
54
Figure 1 Diagram of model I.
Instead of describing the ability to positively detect this
maneuver, the approach proposed here is to identify when it
would not be possible to detect the maneuver. The primary
driver for non-detection is if there are no observations of the
ship in the time between points a and e. Then, given a
specific time between detections, one can calculate
(assuming vi, vmax and aship) the maximum time (tstopped)
which would not be detectable.
3.2. Detection of a ship entering/crossing exclusion zone
The model for detecting a ship which enters and then leaves
an exclusion zone is illustrated in Figure 2 as model II. A
ship starts from point a some distance di from an exclusion
zone travelling at some initial velocity vi. The ship enters
the exclusion zone at point b, and stops for some length of
time (tstopped) before accelerating at aship to leave the
exclusion zone at point c. As in the previous model, given a
specific time between detections, one can calculate the
maximum time which would not be detectable.
Figure 2 Diagram of model II.
3.3. Detection of the rendezvous of two ships
The model for detecting a rendezvous between two ships of
similar capability is illustrated in Figure 3 as model III. The
anomalous pattern is shown by the interaction of the two
arrows’ paths (non-anomalous behaviour would be for the
two ships to continue on a straight path with no change in
speed or proximity – not shown here). A ship at point a1 is
moving at some initial velocity vi and decelerates to a stop
at point b. A ship at point a2, which is moving at the same
initial velocity vi, decelerates to a stop at the same point.
The ships loiter at point b for a time period tstopped, and then
accelerate at aship to maximum velocity vmax to point c,
travelling to point d until resuming normal speed at point e.
Figure 3 Diagram of model III.
This is similar to model I, but involves the ability to detect
two ships at the same time and confirm their proximity at
point b. Then, given a specific time between detections, one
can calculate (knowing vi, vmax and aship for each ship), the
maximum tstopped which would not be detectable.
4. QUANTIFICATION OF REQUIREMENTS
This section presents the metric for ship inter-detection
times in a data feed against which required standards of
performance can be established. The required standards for
this metric will be established by considering a simulated
nominal data stream, and then evaluating these metrics
against the models presented in Section 3. Other metrics
which could be considered include quantity and latency.
The concept of data quantity, as measured by the
combination of unique vessels to be detected, and the
number of detections achieved on each of those vessels is
somewhat related to the inter-detection metric. Data latency
a major concern for decision-makers as they have to be able
to know that they are acting on up-to-date information to be
able to form an appropriate response with the assets they
have available. As previously mentioned in 3.1, latency
primarily impacts real-time detection but not historical
batch-mode.
4.1. Inter-detection times
The refresh rate of data on a unique vessel is defined here as
the inter-detection time. Over the collected dataset, there is a
distribution associated with the refresh rates for all vessels.
For example, the probability of achieving a given inter-
detection time for satellite-based Automatic Identification
System (AIS) dataset derived from a constellation of 8
satellites is illustrated in Figure 4. The top figure shows a 10
hour timespan, and the bottom shows a 300 second
timespan. Periodic spikes observed in the data are due to
the fixed transmission intervals of AIS for varying ship
maneuvering states [11]. The most common transmission
rates are 2, 6 and 10 seconds, and so one observes
harmonics these times, with the most prominent at 10
second intervals. The inter-detection time envelope for this
distribution, however, is representative of the sensor
system’s ability to re-detect ships.
To model the shape of this envelope, one can look
to the theory in reliability engineering [12]. The likelihood
of any given inter-detection time will have a non-uniform
distribution, with a potentially long tail (increasingly long
for low performance sensors requiring multiple looks or
integration time), with some most likely detection time
(approximately 6 seconds in the case of AIS). The
probability distribution in Figure 4 for inter-detection times
shows a good fit with a log-logistic function. Similar to
latency, a minimum threshold value with a confidence

Maritime Knowledge Discovery and Anomaly Detection Workshop, 5-6 July 2016
55
interval is necessary to ensure that the data requirements are
being met for the majority of the data.
A hypothetical sensor system can then be modelled using
the log-logistic distribution by choosing the shape
parameters such that the mean of the distribution is equal to
some objective value. This is a straightforward task since
the log-logistic distribution is well described in closed form.
Figure 4 Log-logistic model for the inter-detection times of
satellite-based AIS detections over two time frames.
5. RESULTS
The data requirements for the three types of kinematic
anomalies are presented. Note here that the metrics have
been applied to positional data, which are common to all
anomaly types discussed. Also note that sensor false alarm
rates, depending on the performance of the data fusion
process, will also impact the data requirements. These
results, however, are still widely applicable to maritime
surveillance data from sources such as AIS.
5.1. Detection under models I, III, and III
In Figure 5, each subfigure consists of data for a total of 5
million Monte Carlo (MC) simulation runs consisting of
100,000 iterations for each of 50 distribution shapes chosen
by varying the mean inter-detection time. The upper plot in
each figure pair presents the distribution of the occurrences
where the anomaly could not be detected (tstopped) in the y-
axis for an inter-detection time with a mean shown in the x-
axis. The lower plot presents the same information, but with
the x-axis being the 95th
percentile for data in the log-
logistic sensor model inter-detection times. The curves
represent the frequency of occurrence where the anomaly
would not be detectable in 99.7%, 95%, on average, or in
50% of the MC evaluations. The visible blip on the on the
right end of the figures (most visible for the 50% line) is due
to the relatively small quantity of runs that populated that
region of the results.
(a) Model I
(b) Model II, di=20 nautical miles
(c) Model III
Figure 5 Plot of simulated bounds as a function of inter-
detection time distribution.

Maritime Knowledge Discovery and Anomaly Detection Workshop, 5-6 July 2016
56
5.2. Joint requirements
For each of the models presented in Figure 5, the maximum
undetected time (worst case) is selected for each MC run
and plotted in Figure 6. This represents the requirements to
achieve detection of all three anomalies investigated. Given
some operational requirements, such as being able to detect
a ship which is loitering for longer than Ts hours, being able
to detect a ship spending longer than Tz hours in an
exclusion zone, or to detect a potential rendezvous which
lasted longer than Tr hours, one can extract the minimum
required inter-detection times. By choosing a desired level
of detection, the corresponding acceptable mean and upper
tail for a required sensor performance can be directly chosen
(x-axes) from the upper and lower plot in the figure pair. For
example, given an objective of the maximum Ts, Tz, or Tr
being 1 hour, for 95% of inter-detection times, then the
mean time between updates must be less than 28 minutes,
and no more than 5% of updates should exceed 80 minutes.
Figure 6 Combined simulated bounds for models I-III.
6. SUMMARY
A framework for quantifying data requirements based on
operational processes has been presented. This method
enables identification of operational requirements for data
acquisition in a robust, objective, and repeatable manner.
Notably, it supports the optimization of the quantity of data
to meet operator requirements under constraints, thereby
preventing over-expenditure in procurement costs while
maximizing operational benefits. The results, when
considered in comparison to the data being collected, can
also be used to identify if there are any gaps in data
collection, which can then be directed to the investment of
additional data collection resources. In addition, this
approach helps to identify the confidence level that the
operators can achieve in the anomaly detections, and thus
provides an indicator of the associated risks.
Future work includes investigation of real-time
anomaly detection requirements, and the formalization of
the data and information requirements process which can be
generally applied for tasks such as the procurement of data
and information.
7. ACKNOWLEDGEMENTS
This work was conducted under the Defence Research and
Development Canada (DRDC) Project in Maritime
Information Warfare (MIW) 01da – Next Generation Naval
Command and Control Systems.
REFERENCES
[1] Blasch, E., Steinberg, A., Das, S., Llinas, J., Chong, C., Kessler,
O., Waltz, E., White, F., “Revisiting the JDL model for
information Exploitation,” in Information Fusion (FUSION),
2013 16th International Conference on, pp. 129-136. IEEE, 2013.
[2] Rowley, J. E., “The wisdom hierarchy: representations of the
DIKW hierarchy,” Journal of information science, 2007.
[3] Zins, C., “Conceptual approaches for defining data, information,
and knowledge,” Journal of the American society for information
science and technology, 58.4, pp. 479-493, 2007.
[4] Roy, J., Davenport, M., “Categorization of maritime anomalies
for notification and alerting purpose,” NATO workshop on data
fusion and anomaly detection for maritime situational awareness,
La Spezia, Italy, 2009.
[5] Martineau, E., Roy, J., “Maritime anomaly detection: Domain
introduction and review of selected literature,” DRDC-
VALCARTIER-TM-2010-460, Defence Research and
Development Canada, 2011.
[6] Food and Agriculture Organization of the United Nations, “Code
of conduct for responsible fisheries,” 1995.
[7] Bar-Shalom, Y., Willet, P. K, Tian, X., “Tracking and data
fusion: a handbook of algorithms,” 2012.
[8] Pallotta, G., Vespe, M., Bryan, K., "Vessel pattern knowledge
discovery from ais data: A framework for anomaly detection and
route prediction." Entropy vol. 15 no. 6 pp. 2218-2245, 2013.
[9] Page, E. S. “Continuous Inspection Schemes,” Biometrika 41, no.
1/2, pp. 100-115, 1954.
[10] Ru, J., Jilkov, V. P., Li, X. R., Bashi, A., “Detection of Target
Maneuver Onset,” in IEEE Transactions on Aerospace and
Electronic Systems, vol. 45, no. 2, pp. 536-554, April 2009.
[11] ITU-R M.1371-5, “Technical Characteristics for an automatic
identification system using time division multiple access in the
VHF maritime mobile band,” 2014.
[12] Kapur, P. K., Pham, H., Gupta, A., Jha, P. C., “Software
reliability assessment with OR applications,” London: Springer,
2011.

Maritime Knowledge Discovery and Anomaly Detection Workshop, 5-6 July 2016
57
A FISHING MONITORING USE CASE IN SUPPORT TO COLLABORATIVE
RESEARCH
A.-L. Jousselme1, E. Camossi
1, M. Hadzagic
1, C. Ray
2, C. Claramunt
2, E. Reardon
1, K. Bryan
1, M. Ilteris
1
1NATO STO Centre for Maritime Research and Experimentation La Spezia, Italy
2Naval Academy Research Institute (IRENav) Brest, France
ABSTRACT
This work reports on the design of a Maritime Use Case in
support to the Big Data Analytics for Time Critical Mobility
Forecasting (datAcron) project funded by the European
Union Horizon 2020 Programme, which aims to develop
novel methods to detect threats and abnormal activity
among a very large number of moving entities in large aerial
and maritime areas. The use case aligns with the European
Union Maritime Security Strategy (EUMSS) and both
scientists and operational partners participated in its design.
It focuses on the monitoring of fishing activities, which
encompass several maritime scenarios such as preventing
environmental destruction and degradation, maritime
accidents, Illegal, Unreported, and Unregulated (IUU)
fishing, Illegal migrations, as well as suspicious vessel
tracking.
Index Terms— Big spatio-temporal data, Maritime
Moving Objects, Maritime Situational Awareness, Vessel
Trajectories, Fishing Use case
1. INTRODUCTION
Reaching appropriate Maritime Situation Awareness (MSA)
for the decision maker requires monitoring the real time
maritime traffic and assessing it against contextual
information such as maritime routes or loitering areas
inferred from the analysis of historical data (e.g., [1]). This
requires not only detecting, tracking and classifying vessels
but also detecting, classifying and predicting their
behaviour.
Sensor networks mixing cooperative self-identification
systems (e.g., Automatic Identification System - AIS) and
non-cooperative systems (e.g., coastal radars or satellite
imagery) provide the necessary complementarity and
redundancy of information to help overcome signals
deception (e.g., GPS manipulation and spoofing are frequent
for AIS [2]) in order to increase the clarity and accuracy of
the maritime picture. In many cases, intelligence reports or
expert opinions can also be helpful in refining and guiding
the search in the huge amount of data to be processed,
filtered and analysed, as well as representing the contextual
information for decision support systems in MSA
applications [3].
Facing the huge volumeof various information with high
velocity which often lacks veracity, a system to
automatically process both historical and timely information
would greatly support the Vessel Traffic System (VTS)
operator such as the in monitoring and analysis tasks. This is
the aim of the three-year Big Data Analytics for Time
Critical Mobility Forecasting (datAcron) project3 that has
started in January 2016 and whose main research objectives
address the development of highly scalable methods for
advancing:
Obj.1 Spatio-temporal data integration and management
solutions;
Obj.2 Real-time detection and forecasting accuracy of
moving entities' trajectories;
Obj.3 Real-time recognition and prediction of important
events concerning these entities;
Obj.4 General visual analytics infrastructure supporting all
steps of the analysis through appropriate interactive
visualisations;
Obj.5 Producing streaming data synopses at a high-rate of
compression.
datAcron addresses two critical domains: maritime and
aerial traffic, which will guide the research and development
and will drive the assessment of the datAcron approach.
In this paper, we present the maritime use case of
datAcron, which describes possible operational uses of
datAcron for Fishing Activity Monitoring focusing on
relevant practical challenges and operational questions. It
emphasises a human-centric automatic processing of data,
stressing the role of the user (or decision maker) in his/her
interaction with the system.
The paper is organised as follows. In Section 2, the
methodology adopted to develop the use case is presented.
In particular, the use case requirements and how the use
case is aligned with the datAcron objectives and challenges
are described. In Section 3, the fishing monitoring use case
and six operative scenarios are described, discussing the
operational relevance of datAcron and how user and
operative information needs are formalised through a list of
relevant Maritime Situational Indicators (MSIs). In Section
4, the use case driven validation and assessment of
3 datAcron project website: http://www.datacron-project.eu

Maritime Knowledge Discovery and Anomaly Detection Workshop, 5-6 July 2016
58
datAcronis also presented. Finally, Section 5 concludes the
paper highlighting future directions.
2. USE CASE DESIGN
The methodology used to develop the use case described
herein relies on the previous experience of some of the
authors, where use cases were designed to support
collaborative research project on context-based reasoning in
high-level information fusion [4, 5], and adopts the
definition of use case given by McBreen et al. in [6], where
a use case describes the interaction of a user with a system
to be designed, to achieve a specific goal or accomplish a
specific task. The system requirements can then be derived
enabling the user to achieve his/her objectives in different
scenarios. The scenarios illustrate different usages of the
system, and eventually define success (if the goal is
achieved) or failure (if the goal is not achieved).
The resulting use case provides a tool to address different
aspects of a large research problem, describing users’ needs,
operational problems and underlying challenges. Illustrating
research findings on a common use case, sharing the same
datasets, and utilising outputs from other teams are all
benefits of having an integrated picture of the general
research problem.
As such, the datAcron use case has to satisfy the
following requirements, which drove the design of the use
case:
Req.1Address challenging problems deemed of interest for
the maritime operational community in general;
Req.2 Be aligned with the European Union maritime
policies and needs in particular;
Req.3Be aligned with datAcron research objectives and
expected outcomes such that the use case challenges the
datAcron's technical solutions to be developed, while
accommodating the research interests of the different
partners;
Req.4Describe the problem in a simple way as a kind of
“skeleton”, flexible enough to allow further evolution and
developments as possibly requested by partners' interests;
Req.5Provide the necessary information to understand the
user's goal, from which the corresponding sub-goals,
associated levels of granularity required, the information
needs and the desired output quality can be deduced;
Req.6Act as an ``integrator'' for the different aspects to be
pursued so that teams can illustrate their findings within a
common story;
Req.7Provide a background and support for close
interactions between the different work packages and teams
involved with the team in charge of the maritime use case;
Req.8Rely on the available datasets (unclassified, shareable)
among the teams and others of interest in the research
community (e.g., AIS data, radar datasets, databases of past
events, intelligence reports, etc).
Figure 1 Methodology for the maritime use case
development
The diagram displayed in Fig. 1 illustrates the idea
behind the methodology. The datAcron objectives (cf. Obj.1
to Obj.5 in the previous Section) describe the general goals
for the algorithms to be designed. They involve several
underlying challenges and may drive specific research foci
of interest for the project partners.
In particular, the design of systems supporting an
enhanced MSA needs to tackle Big Data challenges: it
requires processing in real-time a voluminous and high
velocity information of different nature (numerical, natural
language statements, objective or subjective assessments,
…), originating from a variety of sources (sensors and
humans - hard and soft), which often lacks veracity (data are
either uncertain, or imprecise, vague, ambiguous,
incomplete, conflicting, incorrect).
The datAcron Maritime Use Case comprises multiple
scenarios that describe how actors in the use case perform a
set of operations in order to achieve a specific goal.
Scenarios describe the current operations that will serve as a
basis for understanding and validating the datAcron
technology, while demonstrating how it can be effectively
used in the maritime domain.
The collaboration with the operational partners ensures
that the use case is operationally relevant. In particular, the
use case describes the general context of use of datAcron
algorithms. The operational information needs are captured
by relevant Maritime Situational Indicators (MSI), which
formalise events of interest for the operator and the
information required to detect them (cf. Table 1 in the next
Section). Operational performance criteria will need to be
defined to specify user expectations and to drive the
assessment of the datAcron prototype, closely tying the
experimental plan to the use case development (cf. Section
4). The use case requirements (Req.1-Req.8) may also be
used as qualitative system performance metrics, while, at the
implementation level, they may act as result validation
measures.

Maritime Knowledge Discovery and Anomaly Detection Workshop, 5-6 July 2016
59
3. MONITORING FISHING ACTIVITIES
The datAcron Maritime Use Case focuses on fishing activity
monitoring, which is a complex maritime surveillance
mission that encompasses several maritime risks and
environmental issues such as environmental destruction and
degradation but also maritime accidents, Illegal, Unreported,
and Unregulated (IUU) fishing and trafficking problems,
which will be addressed in different scenarios.
Ensuring security and control of fishing activities is one
of the most important aspect of the European Union
Maritime Security Strategy (EUMSS) - Action Plan4,
published in December 2014}, which defines several
strategic interests for the European Union and the Member
States in terms of maritime security. Europe, as the world's
biggest market for seafood wants to promote better
international governance across the world's seas and oceans
to keep them clean, safe and secure. Since fishing is an
activity that exploits common natural resources, it needs to
be regulated to safeguard fair access, sustainability and
profitability for all.
In particular, IUU fishing is a global threat to the marine
environment and honest fishermen alike, whose global cost
is estimated in about 10 Billion Euros per year. The
European Union, in collaboration with International
organisations, is committed to fighting IUU fishing
worldwide.
Besides the detection of IUU fishing activities, another
core issue of the EUMSS is safety. Fishing, in peace
situation, is known as one of most dangerous activity. An
issue here is that fishing vessels are intentionally switching
off their AIS devices while fishing. Therefore, ensuring
fishing safety requires processing and predicting fishing
trajectories in real-time, detecting fishing events, identifying
movement patterns, predicting possible collisions between
surrounding ships, within a typical time scale of 5 to 15
minutes.
datAcronwill support the European Union's control and
enforcement strategy, providing the necessary scientific
support for processing, analysis and visualisation of fishing
vessels at the European scale, together with the capability of
predicting the movement of maritime objects and the
identification of patterns of movement and navigational
events that shall improve existing solutions to monitor the
compliance to the European common fisheries policy.
In order to support datAcron's challenges within the
fishing monitoring use case six scenarios have been
considered.
4 EUMSS Action Plan:http://ec.europa.eu/maritimeaffairs/policy/maritime-
security/doc/20141216-action-plan_en.pdf
All scenarios highlight the need for continuous (real-time)
tracking of fishing vessels and surrounding traffic, as well as
contextually enhanced offline data analytics. They have
been elaborated in order to stress datAcron's algorithms in
terms of velocity, veracity, variety and volume. They should
provide a complete support for trajectory and event
detection, prediction and visualisation. For each scenario,
the user information needs are expressed through a
corresponding list of MSIs. In Table 1, scenarios are
summarised with corresponding objectives, possible actions,
and example MSIs.
Figure 2 Operational flow of the Maritime Use Case
The MSIs defined for fishing monitoring in datAcron
formalise the events of interest for the use case, capture the
required information while formalising the goals of
datAcron algorithms and driving the analysis. The list of the
MSIs used in datAcron is extracted from the outcomes of
different workshops held in Sweden [7], Canada [8] and a
recently updated NATO standard [9], abstracted to address
datAcron needs. Specifically, the MSIs have been filtered
out considering only (1) the MSIs thatdatAcron can provide,
(2) the MSIs that are relevant to the fishing monitoring
scenarios.
The conceptual diagram in Fig. 2 illustrates the
operational flow and the interaction of the datAcron
software in the fishing monitoring use case. Depending on
the scenario, the user may accomplish different tasks (i.e.,
monitoring, detecting or preventing the events described by
the scenario), and may express his/her information needs
through a list of MSIs of interest at a given time. He/she
selects the appropriate algorithms and parametrises them
accordingly to run the analysis. He/she is able to observe
results of the selected algorithms using the visualisation
tools and additional visual analytics, allowing to refine the
analysis varying the parameters of the MSIs (e.g. change the
areas of interest, speed thresholds).
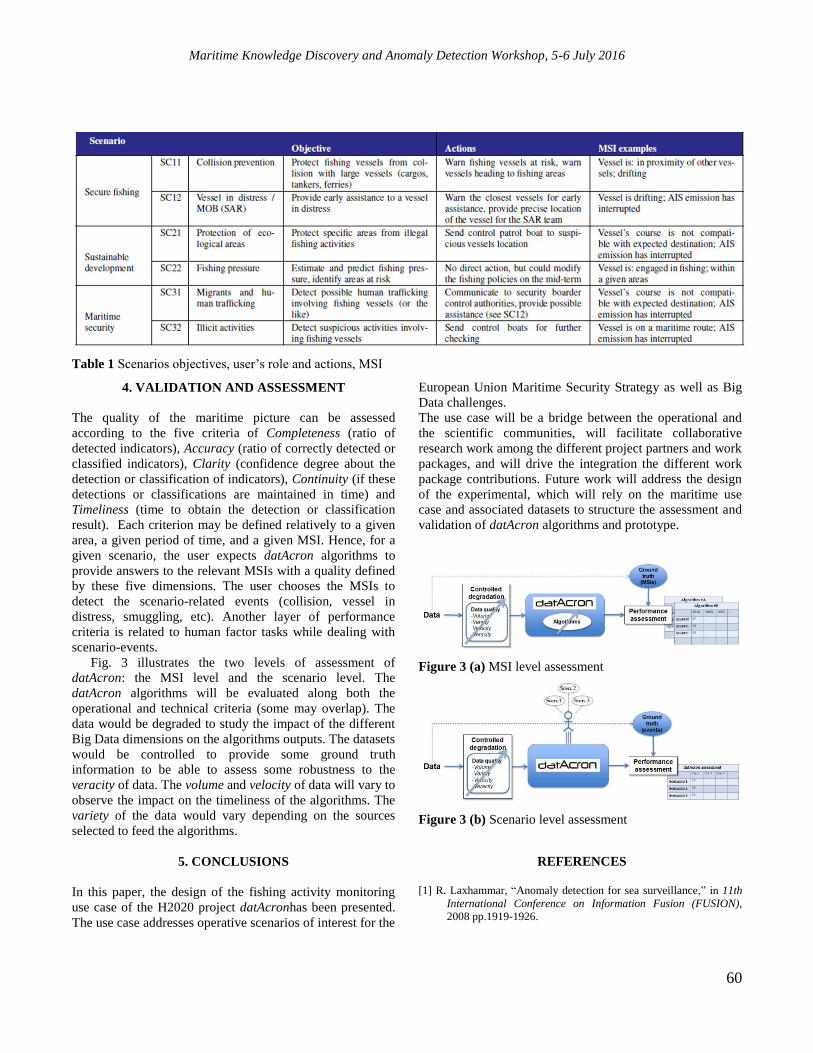
Maritime Knowledge Discovery and Anomaly Detection Workshop, 5-6 July 2016
60
Table 1 Scenarios objectives, user’s role and actions, MSI
4. VALIDATION AND ASSESSMENT
The quality of the maritime picture can be assessed
according to the five criteria of Completeness (ratio of
detected indicators), Accuracy (ratio of correctly detected or
classified indicators), Clarity (confidence degree about the
detection or classification of indicators), Continuity (if these
detections or classifications are maintained in time) and
Timeliness (time to obtain the detection or classification
result). Each criterion may be defined relatively to a given
area, a given period of time, and a given MSI. Hence, for a
given scenario, the user expects datAcron algorithms to
provide answers to the relevant MSIs with a quality defined
by these five dimensions. The user chooses the MSIs to
detect the scenario-related events (collision, vessel in
distress, smuggling, etc). Another layer of performance
criteria is related to human factor tasks while dealing with
scenario-events.
Fig. 3 illustrates the two levels of assessment of
datAcron: the MSI level and the scenario level. The
datAcron algorithms will be evaluated along both the
operational and technical criteria (some may overlap). The
data would be degraded to study the impact of the different
Big Data dimensions on the algorithms outputs. The datasets
would be controlled to provide some ground truth
information to be able to assess some robustness to the
veracity of data. The volume and velocity of data will vary to
observe the impact on the timeliness of the algorithms. The
variety of the data would vary depending on the sources
selected to feed the algorithms.
5. CONCLUSIONS
In this paper, the design of the fishing activity monitoring
use case of the H2020 project datAcronhas been presented.
The use case addresses operative scenarios of interest for the
European Union Maritime Security Strategy as well as Big
Data challenges.
The use case will be a bridge between the operational and
the scientific communities, will facilitate collaborative
research work among the different project partners and work
packages, and will drive the integration the different work
package contributions. Future work will address the design
of the experimental, which will rely on the maritime use
case and associated datasets to structure the assessment and
validation of datAcron algorithms and prototype.
Figure 3 (a) MSI level assessment
Figure 3 (b) Scenario level assessment
REFERENCES
[1] R. Laxhammar, “Anomaly detection for sea surveillance,” in 11th
International Conference on Information Fusion (FUSION),
2008 pp.1919-1926.
Maritime Knowledge Discovery and Anomaly Detection Workshop, 5-6 July 2016
61
[2] C. Ray, C. Iphar, A. Napoli, R. Gallen, and A. Bouju, ,”DeAIS
project: Detection of AIS spoofing and Resulting Risks” in
OCEANS15 MTS/IEEE, Genoa, Italy, 2015.
[3] J. Llinas, A.L. Jousselme, and G. Gross, “Context as an Uncertain
Source,” in Context Enhanced Information Fusion: Improving
real world performance with domain knowledge, Springer, 2015.
[4]A. L. Jousselme, K. Bryan, Karna, M. Ilteris, and E. Reardon,
Eric,”Selection of use cases to support Maritime Situation
Awareness algorithmic development,” inTechnical
Memorandum, NATO Centre for Maritime Research and
Experimentation (CMRE), 2016, to be published.
[5] L. Snidaro, L.Vaci, J. Garcia, E. D. Marti, A: L. Jousselme, K.
Bryan, D. D. Bloisi, and D. Nardi, “A framework for dynamic
context exploitation,” in 18 th International Conference on
Information Fusion (FUSION), Washington D.C. (USA), July
2015.
[6] P. McBreen, “Using Use Cases for requirements capture,” in
www.mcbreen.ab.ca, McBree Consulting, 1998.
[7] S. Andler, M. Fredin, F. Gustafsson, J. va Laere, m. Nilsson, and P.
Svenson , “SMARTracIn - A concept for spoof resistant tracking
of vessel and detection of adverse intentions,” in SPIE Defense,
Security, and Sensing,Orlando, FL, 2009.
[8] J.Roy, and M. Davenport, “Exploitation of maritime domain
ontologies for anomaly detection and threat analysis,” in Proc. of
the IEEE int. Waterside Security Conference (WSS), 2010.
[9] STANAG 4162, “Identification Data Combining Process (Edition
3) - AIDPP-01 Edition 1,” in Tech. Rep.NATO Standardization
Agency, 2015. NATO UNCLASSIFIED.

Maritime Knowledge Discovery and Anomaly Detection Workshop, 5-6 July 2016
62
CONTEXTUAL ANOMALOUS DESTINATION DETECTION FOR MARITIME
SURVEILLANCE
Melita HADZAGIC and Anne-Laure JOUSSELME
NATO STO Centre for Maritime Research and Experimentation, La Spezia, Italy
ABSTRACT
The paper presents a situational analysis model for maritime
anomaly detection in which we study the role of context and
the impact of the imperfection of information in detecting
vessel’s deviation from destination. The focus is on the
exploitation of non-kinematic information, contextual
information in the form of previously extracted routes, and
the predicted kinematic features as outputs of a vessel
tracking algorithm. An uncertainty graphical model example
is designed manually to represent expert knowledge and
measurement uncertainty. The evaluation of the situation is
performed in terms of availability and variability of
contextual information, and in terms of reliability (i.e.
observability and correctness) of non-kinematic information.
The results of the analysis show benefits of using the
position prediction algorithm, confirm the advantage of
using routes as contextual information, and highlight the
characteristics of AIS data in detecting the considered
anomaly. These results facilitate the requirements and
design specifications for the development of an efficient
system for maritime anomaly detection.
Index Terms— situation analysis, maritime anomaly
detection, deviation from destination, AIS, uncertainty
graphical models
1. INTRODUCTION
Maritime situation awareness (MSA) requires the process of
maritime situation analysis (SA) [1] commonly by
maintaining the recognized maritime picture (RMP), which
is compiled at different fusion levels from data acquired
from possibly multiple heterogeneous sources. Its
completeness and hence the MSA depend on the
effectiveness of the approaches used for assessing the states
of maritime situational items and their relationships with the
ultimate goal to alert decision makers about potential threat
and anomalous behaviour of vessels.
Vessel's anomalous behaviour is often described as a
deviation of some traffic characteristic from normal trend
which can be short-lived and rare event. It may be
accidental and innocuous (e.g. stopping due to vessel
failure, sailing at low speed due to bad weather conditions)
or deliberate and harmful (e.g. vessels' rendezvous for
illegal trafficking, oil spilling, or sailing off-route). In [2]
several taxonomies of maritime anomalies are presented.
One such anomaly is the ship's deviation from destination,
which may be an indicator of illicit activity or distress. This
anomaly is also of interest to the marine insurance industry
since the policies of insurance, on both vessel and its cargo,
would be void in the case of any deviation from the direct
course and the destination of the voyage without necessity
[3].
The significant challenges for compilation of the
complete RMP are the volume and the imperfect nature of
data to be processed under time-critical conditions. With the
advancement of the coastal and satellite-based AIS, the
internationally standardized cooperative vessel self-
reporting system, there are an abundance of data to be
processed in order to extract the knowledge about vessels'
tracks and their behaviours, since ships using Automated
Identification System (AIS) transponders automatically and
continually transmit up-to-date navigational data. These
include non-changing data such as ship's name, IMO and
MMSI numbers, and length, which are also called “static”
data, dynamic data such as current position, speed and
course over ground (SOG and COG), rate of turn (ROT),
and ”voyage-related” data, which include destination (or
next port of call (NPOC)), estimated time of arrival (ETA)
and draught. The dynamic data are taken from the ship's
own data being used for navigation. Position, SOG and
COG are commonly taken from the ship's Global
Navigation Satellite System (GNNS) such as GPS or
GLONASS. However, despite their availability and large
available volumes, AIS data are characterized to a great
degree with uncertainty [4, 5]. In particular, the voyage
related and static information may be incorrect, conflicting
or missing due to remote spoofing or deliberate
manipulation of the AIS unit on-board, among which
obscuring the final destination in the AIS transmissions is
one of the most common. With only 41% of vessels globally
reporting their destinations, it is suggested that this lack of
data could skew views of commodity flows worldwide [4].
Moreover, at open seas or at the border of exclusive
economic zones (200nm off-shore), AIS data may be sparse
or arrive hours after the observations due to either low
coverage or to multi-level processing issues. Hence, crucial
to an improved MSA is the ability of the maritime
Maritime Knowledge Discovery and Anomaly Detection Workshop, 5-6 July 2016
63
surveillance system to compensate for poor quality of AIS
data, their latency or variable temporal resolution by
appropriate modelling of uncertainty.
Furthermore, maritime SA requires assessing and
characterizing vessels’ states and their relationships within a
specific context. An appropriate consideration of contextual
information is expected to provide the maritime surveillance
system for decision support the necessary modularity and
flexibility to adapt to the user’s needs and limitations of
sources. Formally, context can be defined as the events or
circumstances that form (Context-of-X) or influence
(Context-for-X) the environment, within which something
exists or takes place, and where X represents any physical or
conceptual entity and event of interest, [6]. The selection
and representation of contextual variables at various times
and levels of details establish the context for reasoning
about a surveillance picture relevant to a specific decision
maker. In the maritime domain, contextual variables may
include physical contextual information directly related to
the zones of interest (e.g. restricted or fishing areas, borders,
harbours, shipping lanes), the previously identified traffic
patterns (e.g. routes), the environmental context (e.g. sea
conditions, weather) as well as the geopolitical context [7].
The estimated current or predicted future vessel kinematic
or behavioral features provided by a model based tracking
algorithm are also expected to be helpful.
1.1. Previous Work and Contribution
Previous works on extracting knowledge about motion
patterns from the AIS data in support to maritime
surveillance include numerous methods for supervised and
non-supervised clustering to other data mining techniques
[8, 9, 10]. Their use in maritime anomaly detection can be
found, for example in [11], where they have been used as
normalcy model, and in [12], where the extracted routes
have been incorporated as contextual information in the
form “context-for-X”. Here, as in [12], we make use of the
identified traffic patterns from the historical AIS data, the
so-called ``routes'' as the outputs of the CMRE TREAD tool
[10] for representing the contextual information in the
reasoning model about the considered maritime anomaly.
However here, we focus on the “context-of-X” or the
additional maritime situational elements in the form of
routes which add hypotheses in the chosen uncertainty
modelling framework. Additionally, besides kinematic AIS
information, we make use of non-kinematic information
from the field NPOC as well as the outputs of the tracking
and prediction algorithm from [13] in reasoning about the
maritime anomaly. In particular, we study the impact of the
imperfection of information and availability and variability
of contextual information on the reasoning under
uncertainty in the problem of detection of a vessel's
deviation from destination within a probabilistic graphical
model for representing and managing uncertainty of AIS
data.
2. DETECTION OF DEVIATION FROM
DESTINATION
Graphical models for uncertainty representation and
modelling in maritime situation analysis provide means for
structuring knowledge and propagating new information,
while managing the uncertainty and complexity of relations.
This approach also facilitates the requirements and design
specifications for the development of both an efficient
model and data driven system for maritime anomaly
detection by enabling inference from noisy and ambiguous
measurements and their coherent global interpretation while
also taking into account their spatio-temporal context, and
domain-specific contextual knowledge.
In our implementation of the graphical model example
we use a probabilistic graphical model, the Bayesian
network. For a given area of interest (AOI) and a given time
period of interest, it is assumed that there is a collection of
AIS data from which we consider both kinematic and non-
kinematic (i.e. voyage-related) information from AIS class
A unit: longitude, latitude, COG, SOG, NPOC, and ETA.
For the considered AOI, there exist information about
previously identified traffic patterns, the routes between
ports. Furthermore, it is assumed that the tracking algorithm
is part of our surveillance system which outputs the
estimated destination �̂� and the estimated time of arrival
𝐸𝑇�̂� according to the specific motion model, the
observation model, the data and the filtering algorithm from
[13]. All these comprise the network input nodes. From all
identified routes in the area by TREAD, we consider those
which have the exit points (i.e. the physical ports) equal to
the NPOC and those with the exit points equal to the
estimated destination. The term destination may indicate
three different entities: the NPOC field in the AIS message,
the physical port in the area, also being the exit point of the
route taken, and the predicted destination according to the
vessel's kinematic features at a given time instant.
According to the domain expert knowledge the existence of
the considered anomaly may be influenced by several
events: i) any inconsistency between the information in the
NPOC field in the AIS message and the course, the sailing
route information (i.e. the exit point of the route) and/or
estimated destination �̂� by the algorithm, ii) missing NPOC
information, iii) as the increase or decrease in the sailing
distance calculated as the difference between the destination
location and the current location, iv) position relative to the
route for which the exit point is the estimated destination
(e.g. sailing along that route or not); the chosen routes may
vary depending on the inconsistency with the NPOC and the
route length, or predicted destination and the route length,

Maritime Knowledge Discovery and Anomaly Detection Workshop, 5-6 July 2016
64
and v) the level of the course change if off or on route to
destination. The graphical model is designed so as to capture
and encode this knowledge within the created nodes
Distance From Destination, Course Change, and Route To NPOC which are used to test the above mentioned
inconsistencies. The time slice of the Bayesian network,
depicted in Fig. 1, illustrates the concept for reasoning about
the presence of deviation from destination. The possible
states and corresponding prior conditional probability
distributions (CPDs) for each created node are defined based
on the expert knowledge. The node Distance From Destination contains the states: increasing, decreasing, not-
changing. The destination is by default taken as NPOC,
while the predicted destination �̂� calculated on the basis of
the current motion features is used if NPOC information is
missing. The node Course Change can have three states:
small, moderate and large, while the node Route To NPOC
has two states: onRoute and offRoute, where onRoute
designates being on the route of which the exit point is the
destination. The states onRoute and offRoute depend on a
user defined distance threshold for the current position
relative to the route. The choice of route from all the routes
of interest may vary with respect to inconsistency with ETA
and remaining time on the route and the predicted ETA.
Figure 1 The model
Probability updating in the model is done using the chain
rule to calculate the joint probability table of the universe 𝑈 of variables (i.e. all node variables in BN), where d-
separation property used to avoid using the full table, i.e.
for 𝐴 ∈ 𝑈, and where {𝐞1, … , 𝐞m} are findings on 𝐴, and 𝑝𝑎
denote graphical model potentials, which in BNs are the
CPD tables [14].
2.1. Results
To evaluate the impact of contextual and non-kinematic
information on the inference about the considered anomaly,
the Bayesian network is implemented using GeNie5, the
open source application developed by the Decision Systems
Laboratory, University of Pittsburgh. This evaluation, for
two time slices, is carried out with respect to the availability
and the correctness of NPOC only (not ETA), the
availability and the variability of route information, and the
availability of information about the predicted destination
by the tracking algorithm for the situation in which the
deviation of the destination exists. We assume that there are
two possible port destinations, Genoa (correct destination)
and Livorno, for which the position coordinates in (lon, lat)
are known from the World Port Index table [15]. The results
are summarized in Table 1. The first set of results
corresponds to the analysis with no input from the tracking
algorithm. For example, assuming that we have the evidence
𝑒 = {𝑁𝑃𝑂𝐶 = 𝐿𝑖𝑣𝑜𝑟𝑛𝑜, 𝐷𝑖𝑠𝑡𝑎𝑛𝑐𝑒𝐹𝑟𝑜𝑚𝐷𝑒𝑠𝑡𝑖𝑛𝑎𝑡𝑖𝑜𝑛 = 𝑖𝑛𝑐𝑟𝑒𝑎𝑠𝑖𝑛𝑔, 𝑅𝑜𝑢𝑡𝑒 = 𝐵𝑎𝑠𝑡𝑖𝑎𝐺𝑒𝑛𝑜𝑎}, 𝑃(𝐷𝑒𝑣𝑖𝑎𝑡𝑖𝑜𝑛|𝑒) is
calculated by marginalizing the remaining node variables
using the variable elimination method: start with the set of
CPD tables S, and when marginalizing a node variable 𝐴,
select all the CPD tables with 𝐴, calculate their product,
marginalize 𝐴 out and place the resulting table back in 𝑆. In
the second part of the analysis, the outputs of the tracking
algorithm are added to the inputs of the network resulting in
improved results. In the absence of the NPOC information,
the predicted position is used to calculate the inconsistencies
regarding the motion features and the possible ports in the
area alleviating the problem of having a parent node with
unspecified probability when the data is not available.
Another way to solve this would be to associate a so-called
default potential with each input node (e.g. route
information). If the route information, the predicted position
and the correct NPOC are available then the model infers
higher probability of anomaly while the incorrect NPOC
increases the resulting posterior probability. The values
𝐶1(𝑅) and 𝐶2(𝑅) denote the correct and the incorrect routes,
respectively, where the correct route corresponds to the
route for which NPOC is the route's exit point. If the vessel
is sailing along the incorrect route then the probability of
anomaly is higher. The availability of route information and
the predicted position improve the inference in the lack of
NPOC information.
5http://genie.sis.pitt.edu
(1)
(2)
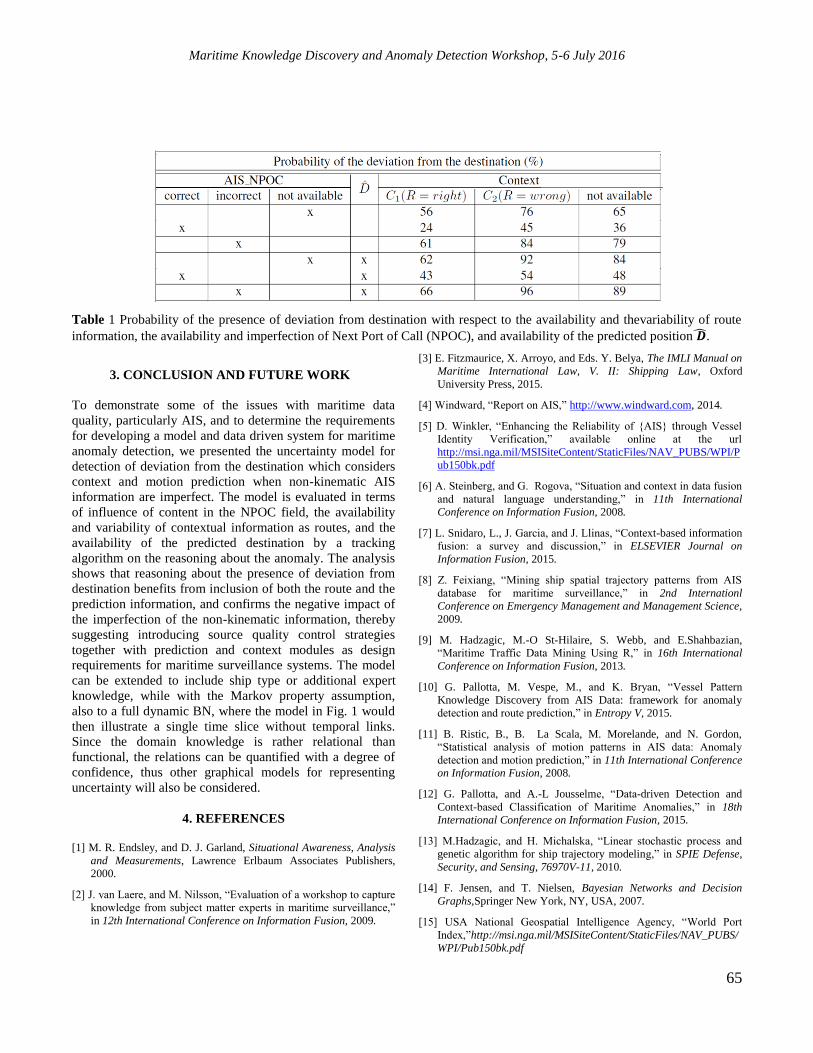
Maritime Knowledge Discovery and Anomaly Detection Workshop, 5-6 July 2016
65
Table 1 Probability of the presence of deviation from destination with respect to the availability and thevariability of route
information, the availability and imperfection of Next Port of Call (NPOC), and availability of the predicted position �̂�.
3. CONCLUSION AND FUTURE WORK
To demonstrate some of the issues with maritime data
quality, particularly AIS, and to determine the requirements
for developing a model and data driven system for maritime
anomaly detection, we presented the uncertainty model for
detection of deviation from the destination which considers
context and motion prediction when non-kinematic AIS
information are imperfect. The model is evaluated in terms
of influence of content in the NPOC field, the availability
and variability of contextual information as routes, and the
availability of the predicted destination by a tracking
algorithm on the reasoning about the anomaly. The analysis
shows that reasoning about the presence of deviation from
destination benefits from inclusion of both the route and the
prediction information, and confirms the negative impact of
the imperfection of the non-kinematic information, thereby
suggesting introducing source quality control strategies
together with prediction and context modules as design
requirements for maritime surveillance systems. The model
can be extended to include ship type or additional expert
knowledge, while with the Markov property assumption,
also to a full dynamic BN, where the model in Fig. 1 would
then illustrate a single time slice without temporal links.
Since the domain knowledge is rather relational than
functional, the relations can be quantified with a degree of
confidence, thus other graphical models for representing
uncertainty will also be considered.
4. REFERENCES
[1] M. R. Endsley, and D. J. Garland, Situational Awareness, Analysis
and Measurements, Lawrence Erlbaum Associates Publishers,
2000.
[2] J. van Laere, and M. Nilsson, “Evaluation of a workshop to capture
knowledge from subject matter experts in maritime surveillance,”
in 12th International Conference on Information Fusion, 2009.
[3] E. Fitzmaurice, X. Arroyo, and Eds. Y. Belya, The IMLI Manual on
Maritime International Law, V. II: Shipping Law, Oxford
University Press, 2015.
[4] Windward, “Report on AIS,” http://www.windward.com, 2014.
[5] D. Winkler, “Enhancing the Reliability of {AIS} through Vessel
Identity Verification,” available online at the url
http://msi.nga.mil/MSISiteContent/StaticFiles/NAV_PUBS/WPI/P
ub150bk.pdf
[6] A. Steinberg, and G. Rogova, “Situation and context in data fusion
and natural language understanding,” in 11th International
Conference on Information Fusion, 2008.
[7] L. Snidaro, L., J. Garcia, and J. Llinas, “Context-based information
fusion: a survey and discussion,” in ELSEVIER Journal on
Information Fusion, 2015.
[8] Z. Feixiang, “Mining ship spatial trajectory patterns from AIS
database for maritime surveillance,” in 2nd Internationl
Conference on Emergency Management and Management Science,
2009.
[9] M. Hadzagic, M.-O St-Hilaire, S. Webb, and E.Shahbazian,
“Maritime Traffic Data Mining Using R,” in 16th International
Conference on Information Fusion, 2013.
[10] G. Pallotta, M. Vespe, M., and K. Bryan, “Vessel Pattern
Knowledge Discovery from AIS Data: framework for anomaly
detection and route prediction,” in Entropy V, 2015.
[11] B. Ristic, B., B. La Scala, M. Morelande, and N. Gordon,
“Statistical analysis of motion patterns in AIS data: Anomaly
detection and motion prediction,” in 11th International Conference
on Information Fusion, 2008.
[12] G. Pallotta, and A.-L Jousselme, “Data-driven Detection and
Context-based Classification of Maritime Anomalies,” in 18th
International Conference on Information Fusion, 2015.
[13] M.Hadzagic, and H. Michalska, “Linear stochastic process and
genetic algorithm for ship trajectory modeling,” in SPIE Defense,
Security, and Sensing, 76970V-11, 2010.
[14] F. Jensen, and T. Nielsen, Bayesian Networks and Decision
Graphs,Springer New York, NY, USA, 2007.
[15] USA National Geospatial Intelligence Agency, “World Port
Index,”http://msi.nga.mil/MSISiteContent/StaticFiles/NAV_PUBS/
WPI/Pub150bk.pdf
Maritime Knowledge Discovery and Anomaly Detection Workshop, 5-6 July 2016
66
AUTOMATED PROCESSING SYSTEM FOR SAR TARGET DETECTION AND
IDENTIFICATION IN NEAR REAL TIME APPLICATIONS FOR MARITIME
SITUATIONAL AWARENESS
Sergey Voinov, Egbert Schwarz and Detmar Krause
German Aerospace Center (DLR), German Remote Sensing Data Center (DFD), Kalkhorstweg 53,
17235 Neustrelitz, Germany
ABSTRACT
Spaceborne Synthetic Aperture Radar (SAR) systems have
already proven their advantage in Maritime Situational
Awareness applications, including such task as targeted
vessel detection at sea. Today, involving multiple SAR
missions, it is possible to reduce limitations related to the
sensor’s spatial coverage as well as revisit time.
Complementary information from the Automatic
Identification System (AIS) offers a huge benefit; regardless
that AIS original was designed for collision avoidance only.
In particular, it enables to identify detected targets as well as
to perform AIS anomaly investigations. This paper describes
completely automated processing system of deriving SAR-
AIS data fusion products developed at the Maritime Security
Lab Neustrelitz, part of DLR’s German Remote Sensing
Data Center (DFD). Presented technology has been
implemented for operational use in Near Real Time (NRT)
Applications at DLR’s Ground Station in Neustrelitz. The
current implementation supports following SAR satellites:
TerraSAR-X/ TanDEM-X, Radarsat-2 and Sentinel 1. The
development is still ongoing and supported by different
projects, to increase the overall performance and to be
compliant to the user requirements.
Index Terms— Remote sensing, Synthetic Aperture
Radar (SAR), Automatic Identification System (AIS), data
fusion, Maritime Surveillance, Maritime Situational
Awareness.
1. INTRODUCTION
The major part of global transportation of goods is held over
the sea. Safe and secure shipping at sea is a guarantee of
world’s sustainable development, therefore maritime
surveillance applications are nowadays of global
importance.
Remote Sensing technologies are widely used in
different monitoring tasks including maritime situational
awareness. A special place, among the others, holds
Spaceborne Synthetic Aperture Radar (SAR) systems which
capable to cover huge areas and provide full picture
independently from time and weather conditions. Involving
multiple SAR satellites the revisit time drops down and
improves the efficiency of NRT-based services.
Depending on the resolution of the SAR sensors it is
possible not only to detect a target (vessel) at sea, but
estimate such parameters as objects width, length and
heading [1]. Integrating this information with additional
attributes acquired from Automatic Identification System
(AIS) opens new capabilities in the context of maritime
surveillances such like AIS anomaly investigations or
detection of malicious actions.
This paper describes the automated processing system
for SAR target detection and identification which was
developed and integrated for operational use at DLR’s
Ground Station Neustrelitz.
2. PROCESSING SYSTEM
The Ground Station Neustrelitz supports data reception from
different optical and SAR spaceborne sensors. Currently,
operational SAR missions are: TerraSAR-X/TanDEM-X,
Sentinel-1 and Radarsat-2.
The data processing starts automatically after its
reception by the ground station. The processing chain is
organized by means of the Processing System Management
(PSM) [2] which schedules different processors according to
predefined set of processing rules. Processors which inputs
are might be independent from each other can be run in
parallel order and wait till necessary steps are complete
prior running the next processing action. The overall
workflow of presenting system is illustrated on figure 1 and
main processing steps are described in the following sub-
sections.
2.1. Image Processing
Once the data has been ingested in the processing
environment, the system initialises first L0/L1b processor.
For every satellite a special processor transforms RAW data
into the image format, performs radiometric data calibration,
and extracts the L1b image metadata containing geolocation
information, imaging times, satellite positions and number
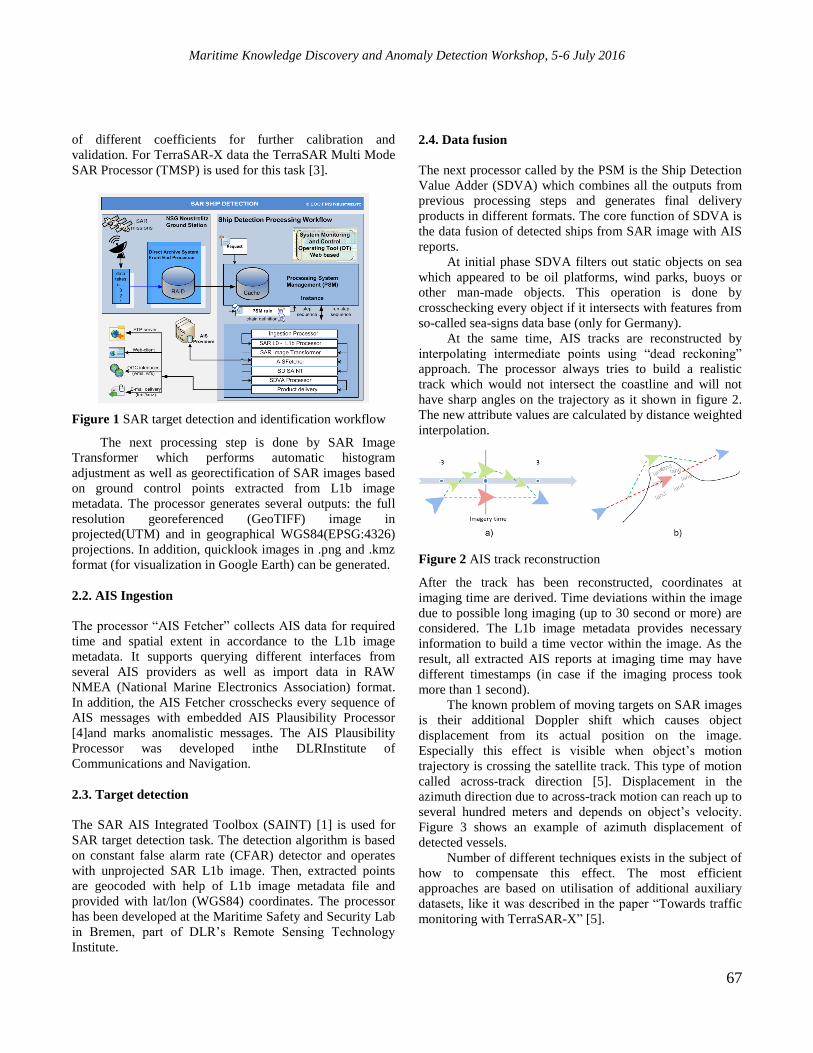
Maritime Knowledge Discovery and Anomaly Detection Workshop, 5-6 July 2016
67
of different coefficients for further calibration and
validation. For TerraSAR-X data the TerraSAR Multi Mode
SAR Processor (TMSP) is used for this task [3].
Figure 1 SAR target detection and identification workflow
The next processing step is done by SAR Image
Transformer which performs automatic histogram
adjustment as well as georectification of SAR images based
on ground control points extracted from L1b image
metadata. The processor generates several outputs: the full
resolution georeferenced (GeoTIFF) image in
projected(UTM) and in geographical WGS84(EPSG:4326)
projections. In addition, quicklook images in .png and .kmz
format (for visualization in Google Earth) can be generated.
2.2. AIS Ingestion
The processor “AIS Fetcher” collects AIS data for required
time and spatial extent in accordance to the L1b image
metadata. It supports querying different interfaces from
several AIS providers as well as import data in RAW
NMEA (National Marine Electronics Association) format.
In addition, the AIS Fetcher crosschecks every sequence of
AIS messages with embedded AIS Plausibility Processor
[4]and marks anomalistic messages. The AIS Plausibility
Processor was developed inthe DLRInstitute of
Communications and Navigation.
2.3. Target detection
The SAR AIS Integrated Toolbox (SAINT) [1] is used for
SAR target detection task. The detection algorithm is based
on constant false alarm rate (CFAR) detector and operates
with unprojected SAR L1b image. Then, extracted points
are geocoded with help of L1b image metadata file and
provided with lat/lon (WGS84) coordinates. The processor
has been developed at the Maritime Safety and Security Lab
in Bremen, part of DLR’s Remote Sensing Technology
Institute.
2.4. Data fusion
The next processor called by the PSM is the Ship Detection
Value Adder (SDVA) which combines all the outputs from
previous processing steps and generates final delivery
products in different formats. The core function of SDVA is
the data fusion of detected ships from SAR image with AIS
reports.
At initial phase SDVA filters out static objects on sea
which appeared to be oil platforms, wind parks, buoys or
other man-made objects. This operation is done by
crosschecking every object if it intersects with features from
so-called sea-signs data base (only for Germany).
At the same time, AIS tracks are reconstructed by
interpolating intermediate points using “dead reckoning”
approach. The processor always tries to build a realistic
track which would not intersect the coastline and will not
have sharp angles on the trajectory as it shown in figure 2.
The new attribute values are calculated by distance weighted
interpolation.
Figure 2 AIS track reconstruction
After the track has been reconstructed, coordinates at
imaging time are derived. Time deviations within the image
due to possible long imaging (up to 30 second or more) are
considered. The L1b image metadata provides necessary
information to build a time vector within the image. As the
result, all extracted AIS reports at imaging time may have
different timestamps (in case if the imaging process took
more than 1 second).
The known problem of moving targets on SAR images
is their additional Doppler shift which causes object
displacement from its actual position on the image.
Especially this effect is visible when object’s motion
trajectory is crossing the satellite track. This type of motion
called across-track direction [5]. Displacement in the
azimuth direction due to across-track motion can reach up to
several hundred meters and depends on object’s velocity.
Figure 3 shows an example of azimuth displacement of
detected vessels.
Number of different techniques exists in the subject of
how to compensate this effect. The most efficient
approaches are based on utilisation of additional auxiliary
datasets, like it was described in the paper “Towards traffic
monitoring with TerraSAR-X” [5].
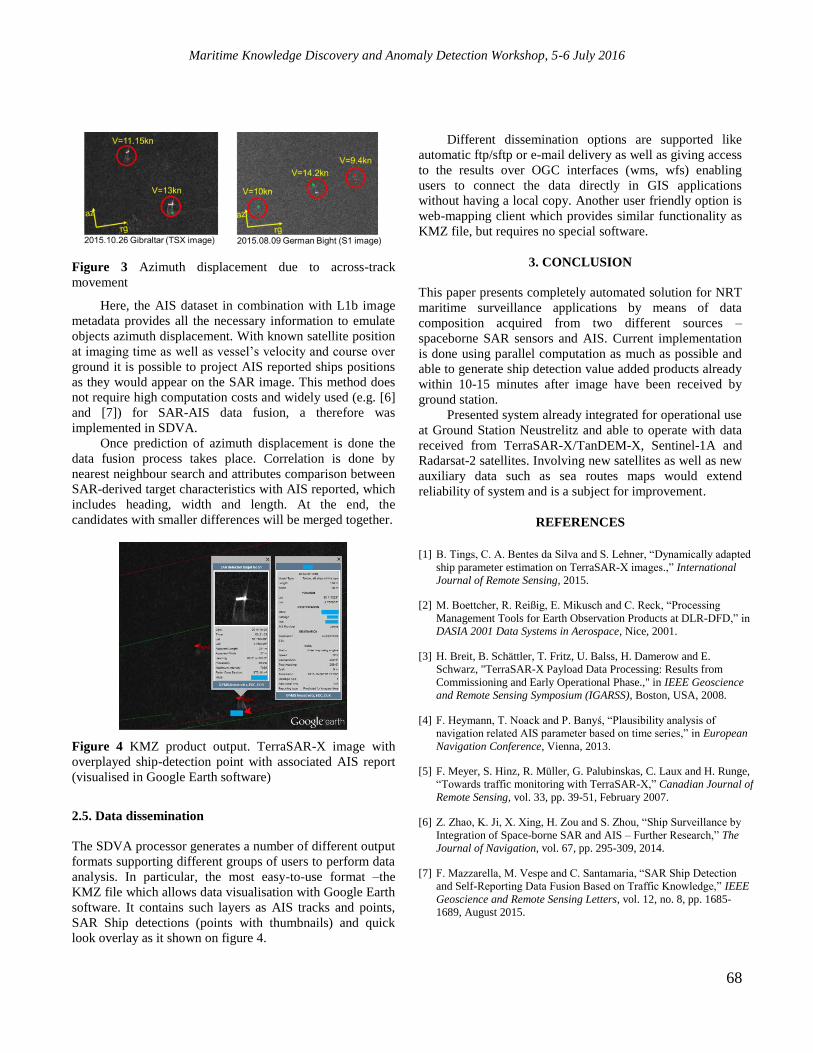
Maritime Knowledge Discovery and Anomaly Detection Workshop, 5-6 July 2016
68
Figure 3 Azimuth displacement due to across-track
movement
Here, the AIS dataset in combination with L1b image
metadata provides all the necessary information to emulate
objects azimuth displacement. With known satellite position
at imaging time as well as vessel’s velocity and course over
ground it is possible to project AIS reported ships positions
as they would appear on the SAR image. This method does
not require high computation costs and widely used (e.g. [6]
and [7]) for SAR-AIS data fusion, a therefore was
implemented in SDVA.
Once prediction of azimuth displacement is done the
data fusion process takes place. Correlation is done by
nearest neighbour search and attributes comparison between
SAR-derived target characteristics with AIS reported, which
includes heading, width and length. At the end, the
candidates with smaller differences will be merged together.
Figure 4 KMZ product output. TerraSAR-X image with
overplayed ship-detection point with associated AIS report
(visualised in Google Earth software)
2.5. Data dissemination
The SDVA processor generates a number of different output
formats supporting different groups of users to perform data
analysis. In particular, the most easy-to-use format –the
KMZ file which allows data visualisation with Google Earth
software. It contains such layers as AIS tracks and points,
SAR Ship detections (points with thumbnails) and quick
look overlay as it shown on figure 4.
Different dissemination options are supported like
automatic ftp/sftp or e-mail delivery as well as giving access
to the results over OGC interfaces (wms, wfs) enabling
users to connect the data directly in GIS applications
without having a local copy. Another user friendly option is
web-mapping client which provides similar functionality as
KMZ file, but requires no special software.
3. CONCLUSION
This paper presents completely automated solution for NRT
maritime surveillance applications by means of data
composition acquired from two different sources –
spaceborne SAR sensors and AIS. Current implementation
is done using parallel computation as much as possible and
able to generate ship detection value added products already
within 10-15 minutes after image have been received by
ground station.
Presented system already integrated for operational use
at Ground Station Neustrelitz and able to operate with data
received from TerraSAR-X/TanDEM-X, Sentinel-1A and
Radarsat-2 satellites. Involving new satellites as well as new
auxiliary data such as sea routes maps would extend
reliability of system and is a subject for improvement.
REFERENCES
[1] B. Tings, C. A. Bentes da Silva and S. Lehner, “Dynamically adapted
ship parameter estimation on TerraSAR-X images.,” International
Journal of Remote Sensing, 2015.
[2] M. Boettcher, R. Reißig, E. Mikusch and C. Reck, “Processing
Management Tools for Earth Observation Products at DLR-DFD,” in
DASIA 2001 Data Systems in Aerospace, Nice, 2001.
[3] H. Breit, B. Schättler, T. Fritz, U. Balss, H. Damerow and E.
Schwarz, "TerraSAR-X Payload Data Processing: Results from
Commissioning and Early Operational Phase.," in IEEE Geoscience
and Remote Sensing Symposium (IGARSS), Boston, USA, 2008.
[4] F. Heymann, T. Noack and P. Banyś, “Plausibility analysis of
navigation related AIS parameter based on time series,” in European
Navigation Conference, Vienna, 2013.
[5] F. Meyer, S. Hinz, R. Müller, G. Palubinskas, C. Laux and H. Runge,
“Towards traffic monitoring with TerraSAR-X,” Canadian Journal of
Remote Sensing, vol. 33, pp. 39-51, February 2007.
[6] Z. Zhao, K. Ji, X. Xing, H. Zou and S. Zhou, “Ship Surveillance by
Integration of Space-borne SAR and AIS – Further Research,” The
Journal of Navigation, vol. 67, pp. 295-309, 2014.
[7] F. Mazzarella, M. Vespe and C. Santamaria, “SAR Ship Detection
and Self-Reporting Data Fusion Based on Traffic Knowledge,” IEEE
Geoscience and Remote Sensing Letters, vol. 12, no. 8, pp. 1685-
1689, August 2015.

Maritime Knowledge Discovery and Anomaly Detection Workshop, 5-6 July 2016
69
DATA DRIVEN IDENTIFICATION OF MIGRANT VESSELS AT SEA
Chad Langford 1,2
, Tao Cheng 2, Michele Vespe
3
1
University of Salzburg, 2
SpaceTimeLab, Department of Civil, Environmental and Geomatic Engineering, University
College London, 3
European Commission, Joint Research Centre
ABSTRACT
There is an urgent migrant crisis in much of Europe, fueled
by conflict in the Middle East. With a rise of seaborne
migration from Turkey to Greece and Italy, there is a need
to save lives and secure external borders. This research sets
out to expand the foundation of knowledge available on
migrant vessels, and by doing so aids in the intervention of
migrant ships adrift at sea. This is achieved by using a data
driven approach to analyze the vessels’ AIS data in the
eastern Mediterranean Sea. A partially unsupervised
anomaly detection approach, affinity propagation clustering
is first-time used to analyze the AIS data, which identifies
the potential migrant vessels, and also identify when during
a vessel’s voyage it may be identified as a migrant vessel.
Index Terms— migrant, refugee, vessel, anomaly
detection
1. INTRODUCTION
Political turmoil in parts of Africa and the Middle East, and
particularly Syria, have caused the number of asylum
seekers in the European Union to grow 45% from 431090 in
2013 to 625920 in 2014 [1]. Unsurprisingly the nationality
with the most asylum seekers within the European Union is
Syrian with 122115 or 19.5% of all asylum seekers,
representing a 144.3% increase from 2013 to 2014 [1]. This
sharp increase in asylum seekers is mirrored in the number
of illegal border crossings that have occurred. Illegal border
crossings rose 164% from 2013 to 2014 with the largest
increase of 277% being via the Mediterranean Sea to Italy
and Malta [2].
This research aims to identify if and when migrant
vessels may be identified during their journey using vessel-
specific summary statistics. This is aligned to one of the
pillars of the EU Agenda on Migration on saving lives and
securing the external borders [3]. The sooner the model is
able to identify migrant vessels, the sooner authorities will
be able to intervene and offer assistance.
The datasets used in this research are GPS track data
(i.e. position, speed and course over ground) from vessels
carrying AIS (Automatic Identification System) and located
in the eastern Mediterranean Sea, including the Aegean,
Ionian, and Marmara Seas during December 2014. The
dataset includes 5804 unique vessels and over 6.75 million
records. Of the 5804 unique vessels, three are known to
have trafficked migrants and refugees from Turkey to the
EU and their track data are analyzed in this work.
2. METHODS
By using the spatio-temporal dataset of vessel
movements, existing anomaly detection methods (see e.g.
[4, 5]) would identify anomalous ranges of data within each
vessel’s track; this would be considered a collective
anomaly [6]. There are considerable strengths and
weaknesses to this approach. The primary strength is that
the approach may be able to identify the specific portion of
a vessel’s track that is unusual and potentially indicative of a
migrant vessel. This strength is, however, overshadowed by
the weaknesses that require sequential data to identify the
unusual subsequences and it is unable to consider the
relationships between multiple dimensions of data. Using
the collective anomaly approach also assumes domain
knowledge; that is, it assumes we are experts in the field of
migrant vessels and definitively know there is a specific,
unique subsequence that may be identified as an anomaly.
This is not the case. This analysis of vessel data is
preliminary to building a foundation of migrant vessel
knowledge, thus collective anomaly detection methods are
better suited once a better overall understanding of migrant
vessels exists. Instead, a dimensionally reduced point-based
anomaly detection method is applied to summary statistic
vessel data.

Maritime Knowledge Discovery and Anomaly Detection Workshop, 5-6 July 2016
70
2.1 Variable selection
The goal in selecting variables is to maximize the
dissimilarities between known migrant vessels and all other
(unknown) vessels. The correlogram in Figure 1 shows that
for migrant vessels all variables are highly positively or
negatively correlated, with the exception of the 0th quantile
break and 25th quantile break. Further exploration of the 0th
and 25th quantile breaks shows that these variables each
have a value of zero for all known migrant vessels. Figure 1
also shows that for most variables all other vessels are
weakly correlated. The mean, standard deviation, and 75th
quantile breaks SOG variables are the most highly
correlated with all other variables for all vessels; these
variables are omitted from further consideration. The
remaining variables (SOG kurtosis; latitudinal range;
longitudinal range; SOG skewness; and the 0th
, 25th
, 50th
,
and 100th
SOG quantile breaks) are also evaluated to
determine how information rich each variable is with respect
to the classification of migrant vessels.
Mutual information is a calculation that determines how
related a variable is to a label, such as migrant vessel.
Mutual information is calculated as the difference between
the independent entropy and conditional entropy of the
vessel type. That is, the mutual information value for each
variable is indicative of how much certainty is added to a
label (migrant or unknown) if the variable is present. The
mutual information of the remaining variables from the
previous step maximizing dissimilarities shows that all
variables, with the exception of the 0th
, and 100th
SOG
quantile breaks) provide equal amounts of information with
respect to the vessel label. Only the variables with the most
information among them will be considered further.
The remaining variables are information rich but
provide a set of variables that are biased towards
representing each vessel’s SOG more than the distance
travelled. In order to better balance the set of variables
skewness is omitted. Skewness is chosen as the omitted
variable due to its redundancy with the kurtosis variable.
Longitudinal and latitudinal ranges are also redundant with
respect to the other variables but removing either spatial
variable would once again bias the analysis towards
assuming that the SOG derived variables are more important
to the identification of migrant vessels. The latitudinal and
longitudinal ranges derived from the original latitude and
longitude variables as well as the kurtosis, 25th quantile
break, and 50th quantile break derived from the original
SOG variable represent a well-rounded selection of
information rich variables to be used in identifying migrant
vessels.
Figure 1 Correlation of variables

Maritime Knowledge Discovery and Anomaly Detection Workshop, 5-6 July 2016
71
2.2 Affinity propagation clustering
As an alternative to the commonly used K-means clustering
methods in which the user must define K number of clusters,
affinity propagation clustering requires no parameter
determination on the part of the user. The affinity
propagation algorithm has a number of advantages over K-
means methods: it is not sensitive to initial randomly
selected centroids or to the order of data, the user does not
determine the number of partitions in the data, and it is
generally robust with respect to noise and outliers. Affinity
propagation starts by considering all points as centroids, or
exemplars as they are called by this method; this is designed
to intentionally avoid the random start issues commonly
witnessed in K-means methods. Affinity propagation works
by using pairwise similarities to exchange responsibility and
availability messages between nodes (points) in a network,
these messages are used by points to essentially vote for
which point will be the exemplar. This data driven method
of determining the appropriate number of clusters and
cluster membership does not require manual input of
parameters. Instead the user of this algorithm must only first
create the similarity matrix from which points will be
associated.
The method used to calculate pairwise similarities is the
negative squared Euclidean distance, a standard method for
most algorithms that require similarity values between
points [7]. The matrix of similarities and the point data are
the only required input for the affinity propagation model.
Other parameters may be set by the user, such as maximum
number of iterations, but these are not required and the
default values have been shown to produce results more
accurately than alternative K-means methods [4]. The
default parameters and their values are: a maximum number
of iterations equal to 1000, and the number of iterations
required without cluster changes to terminate with
convergence equal to 100. If the algorithm returns an error,
that the model has not converged within 1000 iterations,
then these values will be revisited and adjusted accordingly.
Figure 2 Potential migrant vessels, December 2014

Maritime Knowledge Discovery and Anomaly Detection Workshop, 5-6 July 2016
72
As stated previously, it is imperative that migrant vessels
be identified as soon as possible in order to intervene and
provide assistance to possibly stranded migrants and
refugees upon drifting ships. To achieve this, the original
spatio-temporal data is first manipulated to remove portions
of the migrant vessel trajectory before rebuilding the point
data structure with the updated speed and locational
statistics. This process is completed 31 times for each
known migrant vessel for a total of 93 times. The three
known migrant vessels are necessarily considered separately
such that the remaining two migrant vessels may serve as
anchors in the migrant vessel cluster.
This results of this method show at which point (percent
journey data) all three known migrant vessels are clustered
together, and display how the known migrant vessels change
clusters through space-time.
Figure 4 Change in migrant vessel clusters over time
Figure 3 Portion of migrant vessel voyages clustered together
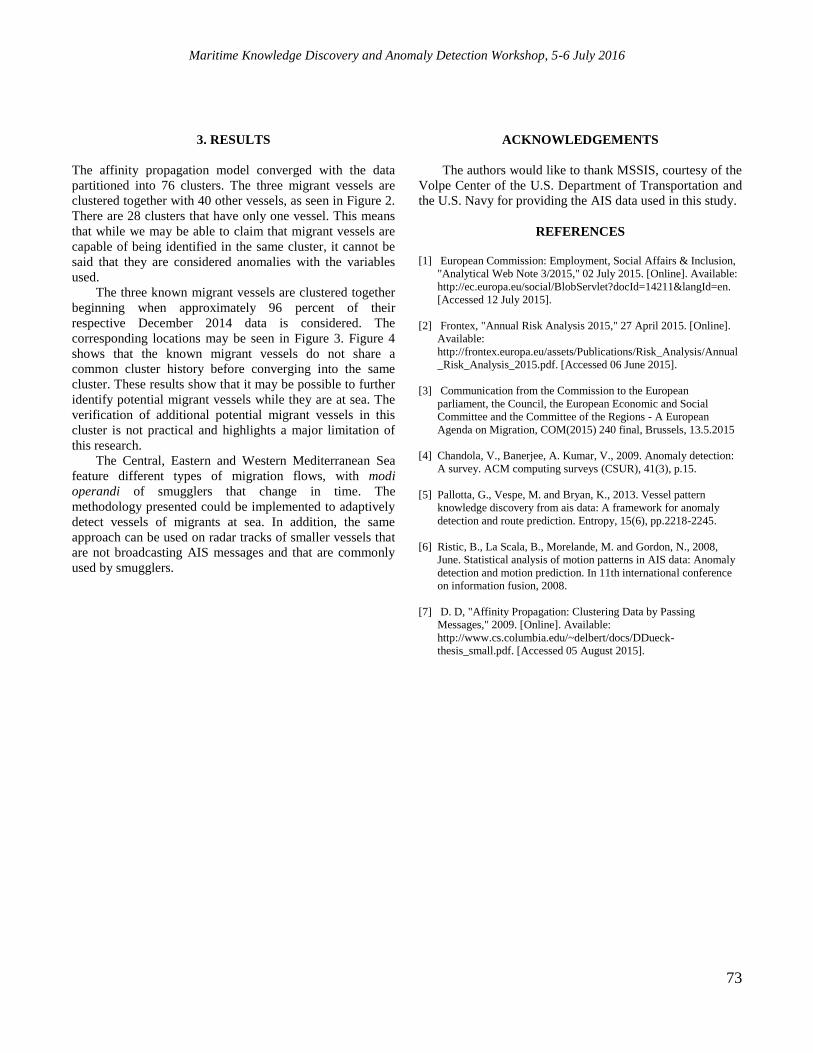
Maritime Knowledge Discovery and Anomaly Detection Workshop, 5-6 July 2016
73
3. RESULTS
The affinity propagation model converged with the data
partitioned into 76 clusters. The three migrant vessels are
clustered together with 40 other vessels, as seen in Figure 2.
There are 28 clusters that have only one vessel. This means
that while we may be able to claim that migrant vessels are
capable of being identified in the same cluster, it cannot be
said that they are considered anomalies with the variables
used.
The three known migrant vessels are clustered together
beginning when approximately 96 percent of their
respective December 2014 data is considered. The
corresponding locations may be seen in Figure 3. Figure 4
shows that the known migrant vessels do not share a
common cluster history before converging into the same
cluster. These results show that it may be possible to further
identify potential migrant vessels while they are at sea. The
verification of additional potential migrant vessels in this
cluster is not practical and highlights a major limitation of
this research.
The Central, Eastern and Western Mediterranean Sea
feature different types of migration flows, with modi
operandi of smugglers that change in time. The
methodology presented could be implemented to adaptively
detect vessels of migrants at sea. In addition, the same
approach can be used on radar tracks of smaller vessels that
are not broadcasting AIS messages and that are commonly
used by smugglers.
ACKNOWLEDGEMENTS
The authors would like to thank MSSIS, courtesy of the
Volpe Center of the U.S. Department of Transportation and
the U.S. Navy for providing the AIS data used in this study.
REFERENCES
[1] European Commission: Employment, Social Affairs & Inclusion,
"Analytical Web Note 3/2015," 02 July 2015. [Online]. Available:
http://ec.europa.eu/social/BlobServlet?docId=14211&langId=en.
[Accessed 12 July 2015].
[2] Frontex, "Annual Risk Analysis 2015," 27 April 2015. [Online].
Available:
http://frontex.europa.eu/assets/Publications/Risk_Analysis/Annual
_Risk_Analysis_2015.pdf. [Accessed 06 June 2015].
[3] Communication from the Commission to the European
parliament, the Council, the European Economic and Social
Committee and the Committee of the Regions - A European
Agenda on Migration, COM(2015) 240 final, Brussels, 13.5.2015
[4] Chandola, V., Banerjee, A. Kumar, V., 2009. Anomaly detection:
A survey. ACM computing surveys (CSUR), 41(3), p.15.
[5] Pallotta, G., Vespe, M. and Bryan, K., 2013. Vessel pattern
knowledge discovery from ais data: A framework for anomaly
detection and route prediction. Entropy, 15(6), pp.2218-2245.
[6] Ristic, B., La Scala, B., Morelande, M. and Gordon, N., 2008,
June. Statistical analysis of motion patterns in AIS data: Anomaly
detection and motion prediction. In 11th international conference
on information fusion, 2008.
[7] D. D, "Affinity Propagation: Clustering Data by Passing
Messages," 2009. [Online]. Available:
http://www.cs.columbia.edu/~delbert/docs/DDueck-
thesis_small.pdf. [Accessed 05 August 2015].
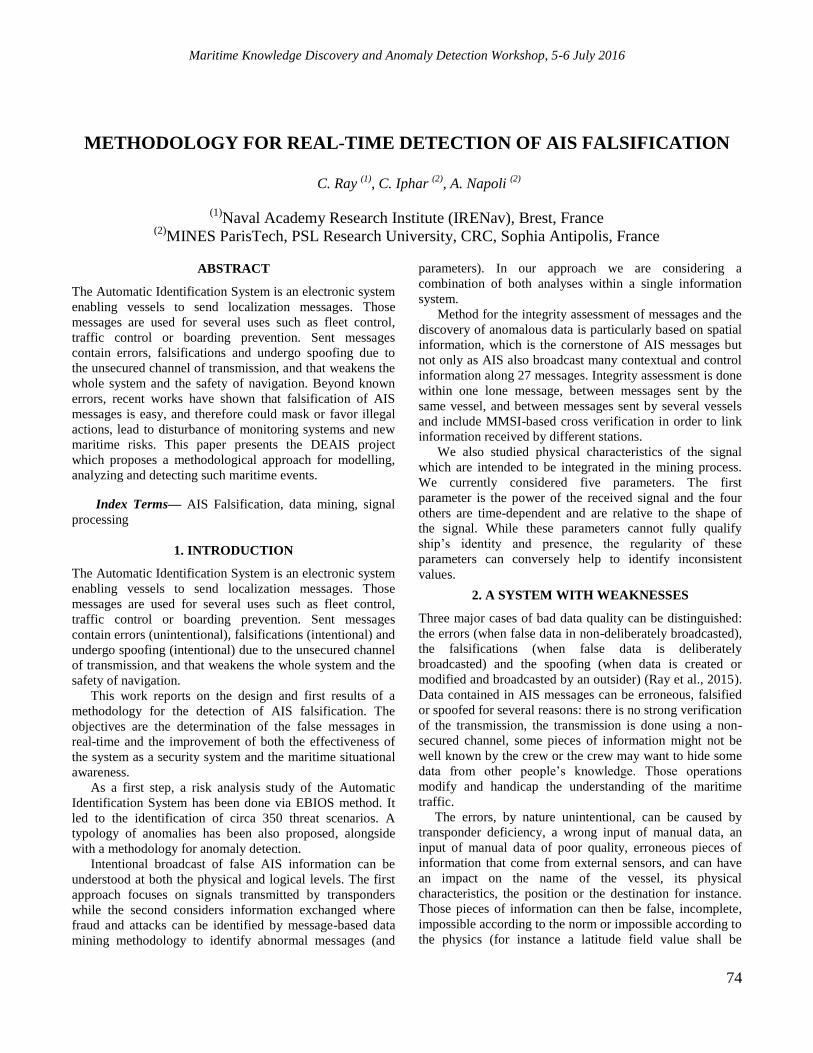
Maritime Knowledge Discovery and Anomaly Detection Workshop, 5-6 July 2016
74
METHODOLOGY FOR REAL-TIME DETECTION OF AIS FALSIFICATION
C. Ray (1)
, C. Iphar (2)
, A. Napoli (2)
(1)
Naval Academy Research Institute (IRENav), Brest, France (2)
MINES ParisTech, PSL Research University, CRC, Sophia Antipolis, France
ABSTRACT
The Automatic Identification System is an electronic system
enabling vessels to send localization messages. Those
messages are used for several uses such as fleet control,
traffic control or boarding prevention. Sent messages
contain errors, falsifications and undergo spoofing due to
the unsecured channel of transmission, and that weakens the
whole system and the safety of navigation. Beyond known
errors, recent works have shown that falsification of AIS
messages is easy, and therefore could mask or favor illegal
actions, lead to disturbance of monitoring systems and new
maritime risks. This paper presents the DEAIS project
which proposes a methodological approach for modelling,
analyzing and detecting such maritime events.
Index Terms— AIS Falsification, data mining, signal
processing
1. INTRODUCTION
The Automatic Identification System is an electronic system
enabling vessels to send localization messages. Those
messages are used for several uses such as fleet control,
traffic control or boarding prevention. Sent messages
contain errors (unintentional), falsifications (intentional) and
undergo spoofing (intentional) due to the unsecured channel
of transmission, and that weakens the whole system and the
safety of navigation.
This work reports on the design and first results of a
methodology for the detection of AIS falsification. The
objectives are the determination of the false messages in
real-time and the improvement of both the effectiveness of
the system as a security system and the maritime situational
awareness.
As a first step, a risk analysis study of the Automatic
Identification System has been done via EBIOS method. It
led to the identification of circa 350 threat scenarios. A
typology of anomalies has been also proposed, alongside
with a methodology for anomaly detection.
Intentional broadcast of false AIS information can be
understood at both the physical and logical levels. The first
approach focuses on signals transmitted by transponders
while the second considers information exchanged where
fraud and attacks can be identified by message-based data
mining methodology to identify abnormal messages (and
parameters). In our approach we are considering a
combination of both analyses within a single information
system.
Method for the integrity assessment of messages and the
discovery of anomalous data is particularly based on spatial
information, which is the cornerstone of AIS messages but
not only as AIS also broadcast many contextual and control
information along 27 messages. Integrity assessment is done
within one lone message, between messages sent by the
same vessel, and between messages sent by several vessels
and include MMSI-based cross verification in order to link
information received by different stations.
We also studied physical characteristics of the signal
which are intended to be integrated in the mining process.
We currently considered five parameters. The first
parameter is the power of the received signal and the four
others are time-dependent and are relative to the shape of
the signal. While these parameters cannot fully qualify
ship’s identity and presence, the regularity of these
parameters can conversely help to identify inconsistent
values.
2. A SYSTEM WITH WEAKNESSES
Three major cases of bad data quality can be distinguished:
the errors (when false data in non-deliberately broadcasted),
the falsifications (when false data is deliberately
broadcasted) and the spoofing (when data is created or
modified and broadcasted by an outsider) (Ray et al., 2015).
Data contained in AIS messages can be erroneous, falsified
or spoofed for several reasons: there is no strong verification
of the transmission, the transmission is done using a non-
secured channel, some pieces of information might not be
well known by the crew or the crew may want to hide some
data from other people’s knowledge. Those operations
modify and handicap the understanding of the maritime
traffic.
The errors, by nature unintentional, can be caused by
transponder deficiency, a wrong input of manual data, an
input of manual data of poor quality, erroneous pieces of
information that come from external sensors, and can have
an impact on the name of the vessel, its physical
characteristics, the position or the destination for instance.
Those pieces of information can then be false, incomplete,
impossible according to the norm or impossible according to
the physics (for instance a latitude field value shall be
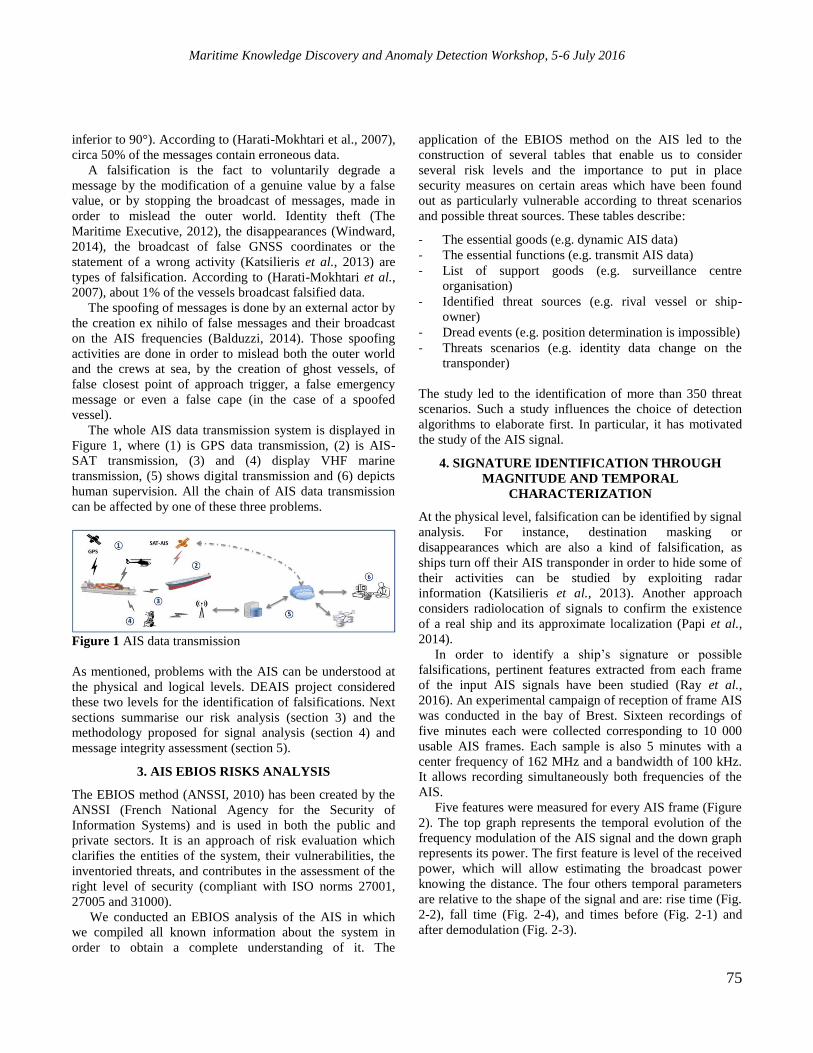
Maritime Knowledge Discovery and Anomaly Detection Workshop, 5-6 July 2016
75
inferior to 90°). According to (Harati-Mokhtari et al., 2007),
circa 50% of the messages contain erroneous data.
A falsification is the fact to voluntarily degrade a
message by the modification of a genuine value by a false
value, or by stopping the broadcast of messages, made in
order to mislead the outer world. Identity theft (The
Maritime Executive, 2012), the disappearances (Windward,
2014), the broadcast of false GNSS coordinates or the
statement of a wrong activity (Katsilieris et al., 2013) are
types of falsification. According to (Harati-Mokhtari et al.,
2007), about 1% of the vessels broadcast falsified data.
The spoofing of messages is done by an external actor by
the creation ex nihilo of false messages and their broadcast
on the AIS frequencies (Balduzzi, 2014). Those spoofing
activities are done in order to mislead both the outer world
and the crews at sea, by the creation of ghost vessels, of
false closest point of approach trigger, a false emergency
message or even a false cape (in the case of a spoofed
vessel).
The whole AIS data transmission system is displayed in
Figure 1, where (1) is GPS data transmission, (2) is AIS-
SAT transmission, (3) and (4) display VHF marine
transmission, (5) shows digital transmission and (6) depicts
human supervision. All the chain of AIS data transmission
can be affected by one of these three problems.
Figure 1 AIS data transmission
As mentioned, problems with the AIS can be understood at
the physical and logical levels. DEAIS project considered
these two levels for the identification of falsifications. Next
sections summarise our risk analysis (section 3) and the
methodology proposed for signal analysis (section 4) and
message integrity assessment (section 5).
3. AIS EBIOS RISKS ANALYSIS
The EBIOS method (ANSSI, 2010) has been created by the
ANSSI (French National Agency for the Security of
Information Systems) and is used in both the public and
private sectors. It is an approach of risk evaluation which
clarifies the entities of the system, their vulnerabilities, the
inventoried threats, and contributes in the assessment of the
right level of security (compliant with ISO norms 27001,
27005 and 31000).
We conducted an EBIOS analysis of the AIS in which
we compiled all known information about the system in
order to obtain a complete understanding of it. The
application of the EBIOS method on the AIS led to the
construction of several tables that enable us to consider
several risk levels and the importance to put in place
security measures on certain areas which have been found
out as particularly vulnerable according to threat scenarios
and possible threat sources. These tables describe:
- The essential goods (e.g. dynamic AIS data)
- The essential functions (e.g. transmit AIS data)
- List of support goods (e.g. surveillance centre
organisation)
- Identified threat sources (e.g. rival vessel or ship-
owner)
- Dread events (e.g. position determination is impossible)
- Threats scenarios (e.g. identity data change on the
transponder)
The study led to the identification of more than 350 threat
scenarios. Such a study influences the choice of detection
algorithms to elaborate first. In particular, it has motivated
the study of the AIS signal.
4. SIGNATURE IDENTIFICATION THROUGH
MAGNITUDE AND TEMPORAL
CHARACTERIZATION
At the physical level, falsification can be identified by signal
analysis. For instance, destination masking or
disappearances which are also a kind of falsification, as
ships turn off their AIS transponder in order to hide some of
their activities can be studied by exploiting radar
information (Katsilieris et al., 2013). Another approach
considers radiolocation of signals to confirm the existence
of a real ship and its approximate localization (Papi et al.,
2014).
In order to identify a ship’s signature or possible
falsifications, pertinent features extracted from each frame
of the input AIS signals have been studied (Ray et al.,
2016). An experimental campaign of reception of frame AIS
was conducted in the bay of Brest. Sixteen recordings of
five minutes each were collected corresponding to 10 000
usable AIS frames. Each sample is also 5 minutes with a
center frequency of 162 MHz and a bandwidth of 100 kHz.
It allows recording simultaneously both frequencies of the
AIS.
Five features were measured for every AIS frame (Figure
2). The top graph represents the temporal evolution of the
frequency modulation of the AIS signal and the down graph
represents its power. The first feature is level of the received
power, which will allow estimating the broadcast power
knowing the distance. The four others temporal parameters
are relative to the shape of the signal and are: rise time (Fig.
2-2), fall time (Fig. 2-4), and times before (Fig. 2-1) and
after demodulation (Fig. 2-3).

Maritime Knowledge Discovery and Anomaly Detection Workshop, 5-6 July 2016
76
Decoded frames, power of the received signal, and
temporal characteristics of the associated signals were then
gathered into a geographical database (cf. section 6) to
realize a reference database of ships’ id and allow statistical
studies.
Figure 2 Analysis of a received AIS frame
The study of these different parameters highlights particular
values which will allow us to relate with ships’ identity
signature. For example, Figure 3 proposes a representation
of time before modulation in the form of box-plot. The X-
Axis corresponds to the MMSI number of ships, the time
before modulation being on the Y-Axis. For each ship, the
values of “time before modulation” are in a given interval,
values that seem different from a ship in the other one.
Figure 3 Box plot “Time before modulation” distribution
for ’class A’ AIS systems
While temporal characterization cannot fully qualify ship’s
identity, the regularity of these parameters can conversely
help to identify inconsistent values. In addition, the study
showed that repeaters exhibit specific patterns easily
recognizable.
The perspective concerns the improvement of this
methodology with the definition of additional signal
parameters and the integration of data mining techniques
combining signal features with static and dynamic
information provided by AIS messages as described in the
following section.
5. AIS MESSAGES INTEGRITY ASSESSMENT
At the logical level, fraud and attacks can be identified by
message-based data mining methodology to identify
abnormal messages and navigational behaviours (Iphar et
al., 2015). For instance a ship navigating with a MMSI
number which is not the real one, allocated and
internationally recognized, can be identified by a correlation
with official ships’ registry and confirmed by a real-time
monitoring of AIS identities at the worldwide level.
Considering the data within the fields of the 27 AIS
messages, four ways to discriminate the inner integrity of
those data can be distinguished. The first way consists of the
control of the integrity of each field of each message taken
individually. The second way is at the scale of one single
message, and assesses the integrity, in this very message, of
all the fields with respect to one another. As there are 27
types of messages, message of the same type have the same
fields and it is thus possible to compare them and assess
their integrity, this makes the third way. Eventually, the
fourth way is the comparison and integrity assessment of the
fields of different messages. Indeed, although pieces of
information can come from different messages, it is possible
to assess their integrity as some fields are either the same or
linked or comparable (i.e. MMSI-based cross verification in
order to link information received by different stations).
Those four ways are referred as first-order, second-order,
third-order and fourth-order assessments, respectively.
Depending on the type of messages assessed and the
order of assessment, the number of item to check is fixed.
We established a list of 669 items for the 27 messages, and
an ad-hoc nomenclature has been established so that each
item can have a clear unique identifier.
An integrity coefficient is assessed by order, i.e. a
coefficient is computed for first-order items, another one for
second-order, and so on, depending on the type of
assessment wanted. Then a global coefficient can be
computed, by weighting the order-based coefficients and
other results from other methods as desired.
The perspective concerns the implementation of the
methodology together with first detection algorithms.
Amongst current developments, we are considering black
hole detection in AIS transmission in order to identify
possible masking. The following section introduces the
architecture designed for the detection of AIS falsification.
6. ARCHITECTURE FOR DATA PROCESSING
A synoptic diagram of the proposed architecture can be
found in the Figure 4. The signal can be received from
various sources, the parser provides messages parameters,
the data processing of the signal provides some signal
parameters and two different steps of data processing. All
this architecture is built around the database in order to fill it
and use it for knowledge discovery. Two implementations
are currently developed in parallel; one based on a relational
database (postgres/postgis) and a second one based on Flink
(Salmon et al., 2015) to cope with larger volume of data.
The data processing box number two corresponds to a
signal processing for the determination of aforementioned

Maritime Knowledge Discovery and Anomaly Detection Workshop, 5-6 July 2016
77
characteristics. These data are stored in the database with
the associated NMEA message and decoded AIS frame.
The data processing box number one is in charge of on-
the-fly analysis of first-order and second-order data
assessment, in order to have as output coefficients to store in
the database. Similarly, the data processing box number
three is in charge of the analysis of third-order and fourth-
order data assessment, in order to have as output coefficients
to be stored in the database. This part of the study, unless
the previous, needs to request historical data.
Figure 4 Proposed architecture
In the database itself, each new entry will lead to the
creation of a new item (i.e. a new line), with as attributes
shall have: a unique identifier, the time of reception, the raw
frame, all message field values and the various coefficient
obtained through assessments (the four orders and the signal
parameters).
The data processing box number four will be in charge of
integrity assessments between AIS data and external and
aggregated data, (e.g. cartographic information, weather
conditions, black hole computations). Of course, the types
of processing will vary according to the type of external
information available, and it is not possible to have a strictly
defined process in this part. A list of assessment items can
be created for each new database when its specifications are
known (i.e. its fields, their precision, their source and
reliability), and two similar databases (i.e. on the same
subject) are likely to have two different lists of assessment
items as their specifications will differ. Updating of the
external databases will, in certain cases, be necessary, as to
ensure information is not outdated and data quality
assessment is reliable.
7. CONCLUSION
This article proposes a method for analysing AIS data using
integrity of information as a key factor, with database
storage of information and an assessment done on the
message itself, on the message with respect to other
messages, on the message with respect to external databases
and on the signal itself with its physical characteristics. Such
an assessment is the consequence of the defects of this
system, transmitting erroneous and possibly falsified data.
This method is meant to be implemented and to provide
integrity-based confidence coefficient on data that will be
useful for the determination of erroneous and falsified data,
leading to a risk assessment and alert triggering in a
decision-support system and in the end provide an additional
tool for the enhancement of maritime security.
8. ACKNOWLEDGEMENT
This research is supported by The French National Research
Agency (ANR) and co-funded by DGA under reference
ANR-14-CE28-0028 and labelled by French clusters Pôle
Mer Bretagne Atlantique and Pôle Mer Méditerranée.
REFERENCES
ANSSI, 2010.http://www.ssi.gouv.fr/guide/ebios-2010-expression-des-
besoins-et-identification-des-objectifs-de-securite.
Balduzzi, M., Pasta, A. and Wilhoit, K.,A security evaluation of AIS
automated identification system. In: Proceedingsof the 30th annual computer security applications conference. ACSAC 2014, New Orleans,
USA, December 8-12, 2014.
Harati-Mokhari, A., Wall, A., Brooks, P. and Wang J., Automatic
Identification System (AIS): a human factors approach. J. Navig. Vol 60(3), Cambridge University Press, 2007.
Iphar, C., Napoli, A., Ray, C., Data Quality Assessment For Maritime
Situation Awareness, 9th ISPRS International Symposium on Spatial Data
Quality (ISSDQ 2015), Volume II-3/W5, pages 291-296, La Grande Motte - France, 29-30 September 2015
Kastilieris, F., Braca, P. and Coraluppi, S., Detection of malicious AIS
position spoofing by exploiting radar information. In: proceedings of the
16th international conference on information fusion. Istambul, 2013.
Papi, F., Tarchi, D., Vespe, M., Oliveri, F., Borghese, F., Aulicino, G., and Vollero, A., Radiolocation and tracking of automatic identification system
signals for maritime situational awareness. Radar, Sonar & Navigation,
IET, 9(5):568–580, 2014.
Ray, C., Iphar, C., Napoli, A., Gallen, R. and Bouju, A.. DeAIS project: Detection of AIS Spoofing and Resulting Risks In: The proceedings of
OCEANS’15. Genova, 2015.
Salmon, L., Ray, C., Design principles of a stream-based framework for
mobility analysis, Geoinformatica, Special Issue on GeoStreaming, 25 pages, April 2016 (DOI 10.1007/s10707-016-0256-z)
The Maritime Executive, Iran, Tanzania and falsifying AIS signals to trade
with Syria. Published in The Maritime Executive, December 7th, 2012.
Windward, AIS data on the high seas: an analysis of the magnitude and
implications of growing data manipulation at sea, 2014.

Maritime Knowledge Discovery and Anomaly Detection Workshop, 5-6 July 2016
78
IMPROVING THE MARITIME TRAFFIC SITUATION ASSESSMENT FOR A
SINGLE TARGET IN A MULTISENSOR ENVIRONMENT
Gregor Siegert, Paweł Banyś and Frank Heymann
Department of Nautical Systems
German Aerospace Center (DLR)
Neustrelitz, Germany
ABSTRACT
Exploiting the diversity of multiple on-board sensors is a
promising approach to generate a reliable picture of the
traffic situation in the vicinity of a particular vessel. This
work focuses on multi-sensor fusion for single target
tracking in a loosely-coupled architecture. An Interacting
Multiple Model Multi-Sensor Probabilistic Data Association
filter is designed to capture rapidly changing vessel
dynamics in the presence of possible clutter measurements.
The actual target tracking is made up of two Unscented
Kalman filters each being conditioned on radar and AIS
measurement updates. The benefits of the proposed method
will be demonstrated on behalf of real-world measurements
obtained from the Baltic Sea.
Index Terms— AIS, IMM-MSPDA filter, UKF, radar
image processing, sensor fusion, single target tracking
1. INTRODUCTION
The increasing challenges of the maritime traffic domain
call for advanced solutions to guarantee safety at sea. Nearly
80 % of the global trade traverses the seas and harbors
worldwide (see [1]) stressing the vital economic interests in
secure and efficient shipping. Key aspect to all mariners,
traffic management and security authorities is a reliable and
timely picture of the traffic situation not only in their close
vicinity but also with respect to vessels in greater distance.
For better identification and localization of maritime traffic
participants the Automatic Identification System (AIS) was
introduced by the International Maritime Organization
(IMO) as an ITU-R recommendation [2] in 2004, yielding a
mandatory standard for vessels greater than 300 GRT. AIS
can be understood as additional sensor that supports the use
of classical surveillance techniques for collision avoidance,
e.g., radar, that are used aboard or in shore-based Vessel
Traffic Service (VTS) monitoring stations. However, none
of the available sensors, neither AIS or radar, can constantly
provide sufficient data on their own to establish a reliable
and accurate traffic picture at all times. While radar may
detect vessels invisible in AIS, it is in general less accurate
and will always be subject to external weather phenomena
that may result in false echoes or clutter measurements. On
the contrary, AIS yields great precision of vessel positions,
but entirely relies on the cooperative nature of the system.
With its open standard AIS is vulnerable to a series of
threats, such as availability disruption, ship spoofing or AIS
hijacking, as discussed in [3]. Apart from that, unintentional
misuse or imperfect equipment may introduce additional
error sources compromising the reliability of the system, as
was also shown in a comprehensive AIS plausibility analysis
in [4]. To encounter these shortcomings, we propose to fuse
both, radar and AIS, to establish a more accurate and
reliable traffic picture by exploiting the complementary
nature of the two sensors. In the literature various
approaches have been published to augment maritime
surveillance or collision avoidance systems, mostly based on
radar target fusion with additional sensors like laser in [5] or
multiple radar systems for exploiting aspect diversity as in
[6]. The matter of AIS and radar fusion was mainly
addressed for anomaly detection, e.g., based on multi
hypothesis tests in [7] or by exploiting historical traffic route
knowledge for SAR/AIS fusion in [8]. In [9] an overview
was given for different AIS/radar fusion techniques
incorporating online covariance estimation.
The remainder of this article is structured as follows. In
section 2 the general methodology for single target tracking
in a radar/AIS environment will be outlined. Section 3
demonstrates the working principle of the proposed scheme
w.r.t. measurement data. A conclusion is given in section 4.
2. METHODOLOGY
In this section the proposed methodology for fusing radar
and AIS data for single target tracking will be presented in
more detail. By designing an Interacting Multiple Model
(IMM) Multi-Sensor Probabilistic Data Association
(MSPDA) filter that is conditioned on asynchronous radar
and AIS measurements a loosely-coupled architecture was
chosen.

Maritime Knowledge Discovery and Anomaly Detection Workshop, 5-6 July 2016
79
(a) Original radar image. (b) Image after background subtraction (c) Extracted target candidates (red cir-
and gray-scale conversion. cles) at time k after blob detection.
Figure 1 Processing chain for one radar image at time k to extract the target candidates.
2.1. Radar image based target extraction In order to fuse radar with AIS position data, the target
candidates need to be detected and extracted from radar
first, to feed them to the filter as measurement updates.
The utilized approach to extract radar target information
is based on image processing instead of directly working
on the radar signal level. This may introduce additional
error sources originating from mapping the radar signal to
image domain, but also yields the advantage of applying
the proposed technique to most commercial radar systems
by simply interfacing to the video output. To extract
target candidates from the current radar image at time k,
the following procedure is applied:
1. Masking the image eliminating static but
undesired features, e.g., colored heading lines,
blob in center, radar information tables.
2. Conversion of image from RGB to grayscale
(weighted average from color channels).
3. Blob detection with fixed range settings for
convexity, circularity, inertia, size and intensity
of expected tar-gets.
4. Each detected target candidate per frame is
expressed in range and bearing, relative to the
radar’s, i.e., ship’s, position.
The key aspect in this processing chain is certainly the
scale-invariant blob detection to eventually detect target
candidates. This algorithm is well described in literature
and finds many applications in image based target
detection and tracking such as described in [10]. For this
work the implementation provided by the OpenCV
framework was used1. Figures 1a to 1c show the different
radar processing stages.
2.2. AIS dynamic target data The typical AIS data set contains numerous static and
dynamic parameters, that are distributed over different
1 OpenCV 3.1.0: https://github.com/Itseez/opencv.git
AIS message types and specified in the ITU-R
recommendation [2]. The set of dynamic parameters
always comprises the vessel position in longitude and
latitude, course over ground (COG) and speed over
ground (SOG), but may also contain true heading and rate
of turn (ROT) information. The specified time intervals
between successive messages range from 2 s to 180 s,
depending on the dynamic state of the vessel. As was
shown in [4] these reporting rates are violated in a
considerable amount of cases, leading to outdated or
simply missing AIS messages.
2.3. IMM-MSPDA framework for single target
tracking In this work, an IMM-MSPDA filter was designed for
single target tracking in an AIS/radar environment. The
IMM, being first proposed in [11], is generally applied to
best capture rapidly changing motion dynamics by
running a bank of interacting Kalman filters in parallel,
with each filter being conditioned on a different process
model. The final IMM state estimate as well as the re-
initialization of the Kalman filters after each iteration is
based on a weighted combination of the individual state
estimates, whereas the transition between the models (or
modes) is governed by an underlying Markov process.
The combination with a Probabilistic Data Association
(PDA) filter yields a powerful scheme for associating
clutter measurements to the expected target state in a
dynamically challenging scenario. The basic steps of the
PDA filter are comprehensively described in [12].
Essentially, each sensor measurement gets validated
based on a validation region centered around the expected
state of the target. The final state update is then based on
the weighted sum of the residuals between validated and
expected measurements, with the weights being computed
from the likelihood of the measurement to origin from the
target. In contrast to the standard PDA approach in [12]
we apply Unscented Kalman Filtering (UKF) (see [15]) to
compensate especially for nonlinearities in the radar

Maritime Knowledge Discovery and Anomaly Detection Workshop, 5-6 July 2016
80
measurement domain. An algorithm combining both
approaches to form an IMM-PDA filter in a multi-sensor
environment was originally proposed in [13], outlining a
scheme to combine synchronous measurement updates
from 2 to 3 sensors sequentially. An extension to
incorporate multiple sensors providing asynchronous or
delayed measurements was published in [14]. In our
work, the latter is adopted to the particular scenario of
observing high rate radar measurements and low rate AIS
updates, both running asynchronously. In contrast to the
original algorithm, in our implementation the standard
IMM cycle is continued on arrival of any sensor
measurement. Otherwise, if low rate AIS messages would
solely trigger the update of the IMM model probabilities,
the IMM could not adopt to changing motion dynamics as
quickly as if radar measurements were also used for
initiating the model probability update of the IMM cycle.
2.4. UKF filter design
For the actual target tracking an Unscented Kalman
filter (UKF) was designed incorporating state
augmentation by the process noise during state prediction
and additive correction steps for each of the sensors.
Details on the basic idea of the unscented transform as
well as the implementation based on state augmentation
can be found in [15]. In our particular application the
UKF was found to outperform the Extended Kalman filter
(EKF) in the presence of highly nonlinear radar
measurement updates, as was already discussed in [6] and
[16]. In the context of vessel dynamics two dominant
motion scenarios were identified, that are nearly straight-
path and turn maneuver based motion. For that reason,
two process models were defined, namely the Constant
Velocity (CV) and the Constant Turn Rate Velocity
(CTRV), assuming the former to provide best fit to
straight-path and the latter to turn maneuver motion
respectively. Further details on the definition of CV and
CTRV process models can be found in [17].
Within each filter hat implements one of the modes
from above, the predicted state 𝒙𝑘|𝑘−1 and its associated
covariance will be based on measurements of sensor s ∈
{radar, ais}. The corresponding measurement models are
expressed as functions ℎ𝑠(𝒙(𝑘|𝑘−1), 𝝐𝑘𝑠 ), with
(1)
for s = ais and
(2)
for s = radar, mapping the target position fom state to
radar measurement domain. In that context, (𝑥𝑠, 𝑦𝑠)
denotes the radar reference position and (𝑥𝑘|𝑘−1, 𝑦𝑘|𝑘−1)
the predicted position in the target’s local ENU frame
respectively. The vector 𝝐𝑘𝑠 ~𝑁(𝟎, 𝑹𝑠) captures the
additive sensor measurement noise. Careful attention has
to be paid to the interaction of models with state spaces of
different dimensions within the IMM cycle. In this work
the strategy from [18] is followed, which is based on state
augmentation. In this context, the extra element from the
CTRV state space is essentially replicated to obtain a
combined IMM state estimate.
3. RESULTS
In this section the proposed algorithm for fusing AIS
with radar in an IMM-MSPDA filter shall be evaluated
based on a dynamically challenging measurement
scenario.
3.1. Baltic Sea experiments
Figure 3 Nautical chart depicting the area of the
measurement campaign at the Baltic Sea, zooming into
the selected test trajectory. The bottom right picture
shows the vessel to be tracked.
For validating the proposed method a dedicated
measurement campaign with two chartered vessels was
conducted in October 2015. The offshore supply ship
BALTIC TAUCHER II was conducting sea trial
maneuvers for two successive days in the Baltic Sea (see
Fig. 3). Its transmitted AIS messages were recorded at a
shore-based AIS station at the Darßer Ort Lighthouse,
Germany2. Additionally, this ship was equipped with a
multi-frequency GNSS receiver that allowed for
computation of a PPP reference trajectory in post-
processing. A second ship, the tug vessel AARON
remained anchored in the center of the sea trial area,
monitoring the scenery by radar at an interval of 1 Hz.
2 Courtesy of German Federal Waterways and Shipping Administration
(WSV)
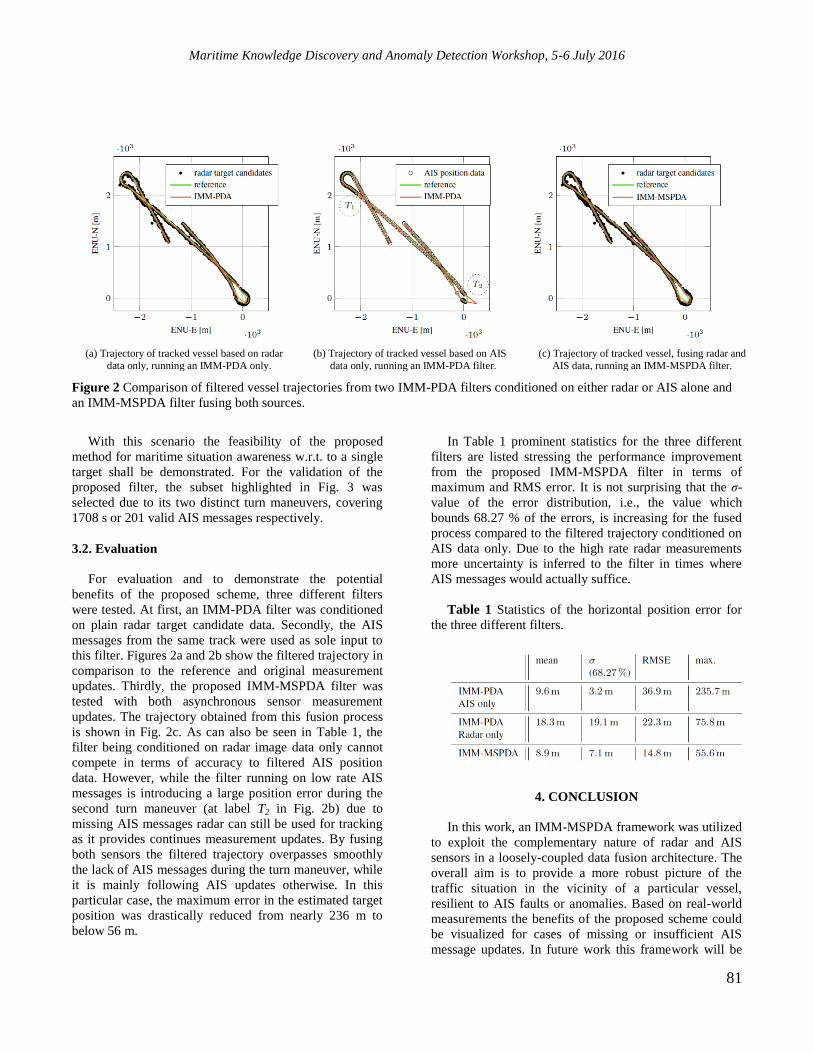
Maritime Knowledge Discovery and Anomaly Detection Workshop, 5-6 July 2016
81
(a) Trajectory of tracked vessel based on radar
data only, running an IMM-PDA only.
(b) Trajectory of tracked vessel based on AIS
data only, running an IMM-PDA filter.
(c) Trajectory of tracked vessel, fusing radar and
AIS data, running an IMM-MSPDA filter.
Figure 2 Comparison of filtered vessel trajectories from two IMM-PDA filters conditioned on either radar or AIS alone and
an IMM-MSPDA filter fusing both sources.
With this scenario the feasibility of the proposed
method for maritime situation awareness w.r.t. to a single
target shall be demonstrated. For the validation of the
proposed filter, the subset highlighted in Fig. 3 was
selected due to its two distinct turn maneuvers, covering
1708 s or 201 valid AIS messages respectively.
3.2. Evaluation
For evaluation and to demonstrate the potential
benefits of the proposed scheme, three different filters
were tested. At first, an IMM-PDA filter was conditioned
on plain radar target candidate data. Secondly, the AIS
messages from the same track were used as sole input to
this filter. Figures 2a and 2b show the filtered trajectory in
comparison to the reference and original measurement
updates. Thirdly, the proposed IMM-MSPDA filter was
tested with both asynchronous sensor measurement
updates. The trajectory obtained from this fusion process
is shown in Fig. 2c. As can also be seen in Table 1, the
filter being conditioned on radar image data only cannot
compete in terms of accuracy to filtered AIS position
data. However, while the filter running on low rate AIS
messages is introducing a large position error during the
second turn maneuver (at label T2 in Fig. 2b) due to
missing AIS messages radar can still be used for tracking
as it provides continues measurement updates. By fusing
both sensors the filtered trajectory overpasses smoothly
the lack of AIS messages during the turn maneuver, while
it is mainly following AIS updates otherwise. In this
particular case, the maximum error in the estimated target
position was drastically reduced from nearly 236 m to
below 56 m.
In Table 1 prominent statistics for the three different
filters are listed stressing the performance improvement
from the proposed IMM-MSPDA filter in terms of
maximum and RMS error. It is not surprising that the σ-
value of the error distribution, i.e., the value which
bounds 68.27 % of the errors, is increasing for the fused
process compared to the filtered trajectory conditioned on
AIS data only. Due to the high rate radar measurements
more uncertainty is inferred to the filter in times where
AIS messages would actually suffice.
Table 1 Statistics of the horizontal position error for
the three different filters.
4. CONCLUSION
In this work, an IMM-MSPDA framework was utilized
to exploit the complementary nature of radar and AIS
sensors in a loosely-coupled data fusion architecture. The
overall aim is to provide a more robust picture of the
traffic situation in the vicinity of a particular vessel,
resilient to AIS faults or anomalies. Based on real-world
measurements the benefits of the proposed scheme could
be visualized for cases of missing or insufficient AIS
message updates. In future work this framework will be

Maritime Knowledge Discovery and Anomaly Detection Workshop, 5-6 July 2016
82
extended for multiple target tracking including track
initialization based on candidate extraction from radar.
REFERENCES
[1] United Nations, World Economic Situation and Prospects 2012,
chapter 2, pp. 41–66, United Nations publication, 2012.
[2] ITU Radiocommunication Sector (ITU-R), “Technical
characteristics for an automatic identification system using time
division multiple access in the VHF maritime mobile band.,”
Recommendation M.1371-5, ITU, February 2014.
[3] Marco Balduzzi, Alessandro Pasta, and Kyle Wilhoit, “A
Security Evaluation of AIS Automated Identification System,”
in Proceedings of the 30th annual computer security
applications conference, ASAC, New Orleans, LA, USA,
December 2014.
[4] Frank Heymann, Thoralf Noack, and Paweł Banyś, “Plausibility
analysis of navigation related AIS parameter based on time
series,” in ENC, Vienna, Austria, 2013.
[5] Lokukaluge P. Perera, Victor Ferrari, Fernando P. Santos,
Miguel A. Hinostroza, and Carlos Guedes Soares,
“Experimental Evaluations on Ship Autonomous Navigation
and Collision Avoidance by Intelligent Guidance,” IEEE
JOURNAL OF OCEANIC ENGINEER-ING, vol. 40, APRIL
2015.
[6] Paolo Braca, Michele Vespe, Salvatore Maresca, and Jochen
Horstmann, “A Novel Approach to High Frequency Radar Ship
Tracking Exploiting Aspect Diversity,” Geoscience and Remote
Sensing Symposium (IGARSS), 2012 IEEE International, pp.
6895 – 6898, 2012.
[7] Marco Guerriero, Peter Willett, Stefano Coraluppi, and Craig
Carthel, “Radar/AIS Data Fusion and SAR tasking for Maritime
Surveillance,” in International Conference on Information
Fusion, 2008, vol. 11th.
[8] Fabio Mazzarella and Michele Vespe, “SAR Ship Detection and
Self-Reporting Data Fusion Based on Traffic Knowledge,”
IEEE GEOSCIENCE AND REMOTE SENSING LETTERS,
April 2015.
[9] Witold Kazimierski and Andrzej Stateczny, “Radar and
Automatic Identification System Track Fusion in an Electronic
Chart Display and Information System,”THE JOURNAL OF
NAVIGATION , no. 68, pp. 1141– 1154, 2015.
[10]Michael Isard and John MacCormick, “BraMBLe: A Bayesian
multiple-blob tracker,” in Eighth IEEE Inter-national
Conference on Computer Vision, 2001, vol. 2, pp. 34–41.
[11]Henk A. P. Blom and Yaakov Bar-Shalom, “The Interacting
Multiple Model Algorithm for Systems with Markovian
Switching Coefficients,” IEEE Transactions on Automatic
Control, vol. 33, 1988.
[12]Yaakov Bar-Shalom, Fred Daum, and Jim Huang, “The
Probabilistic Data Association Filter,” IEEE CONTROL
SYSTEMS MAGAZINE, December 2009.
[13]Yaakov Bar-Shalom, Fred Daum, and Jim Huang, “Multisensor
Tracking of a Maneuvering Target in Clutter,” IEEE
TRANSACTIONS ON AEROSPACE AND ELEC-TRONIC
SYSTEMS, vol. AES-25, March 1989.
[14]Soonho Jeong and Jitendra K. Tugnait, “Multisensor Tracking
of a Maneuvering Target in Clutter with Asynchronous
Measurements Using IMMPDA Filtering and Parallel Detection
Fusion,” in Proceeding of the 2004 American Control
Conference, Boston, Massachusetts, 2004.
[15] Simon J. Julier and Jeffrey K. Uhlmann, “A New Extension of
the Kalman Filter to Nonlinear Systems,” in Proc. of
AeroSense: The 11th Int. Symp. on Aerospace/Defence
Sensing, Simulation and Controls., 1997, pp. 182–193.
[16]Zhansheng Duan and X. Rong Li, “Sequential Unscented
Kalman Filter for Radar Target Tracking with Range Rate
Measurements,” in In Proc. 2005 International Conf. on
Information Fusion, 2005.
[17]Gregor Siegert, Paweł Banyś, Cristina Saez Martìnez, and Frank
Heymann, “EKF Based Trajectory Tracking and Integrity
Monitoring of AIS Data,” in IEEE/ION Position, Location and
Navigation Symposium - PLANS, Savannah, GA, April 2016,
IEEE.
[18]John D. Glass, W. D. Blair, and Yaakov Bar-Shalom, “IMM
Estimators with Unbiased Mixing for Tracking Targets
Performing Coordinated Turns,” Proceedings IEEE Aerospace
Conference, 2013.
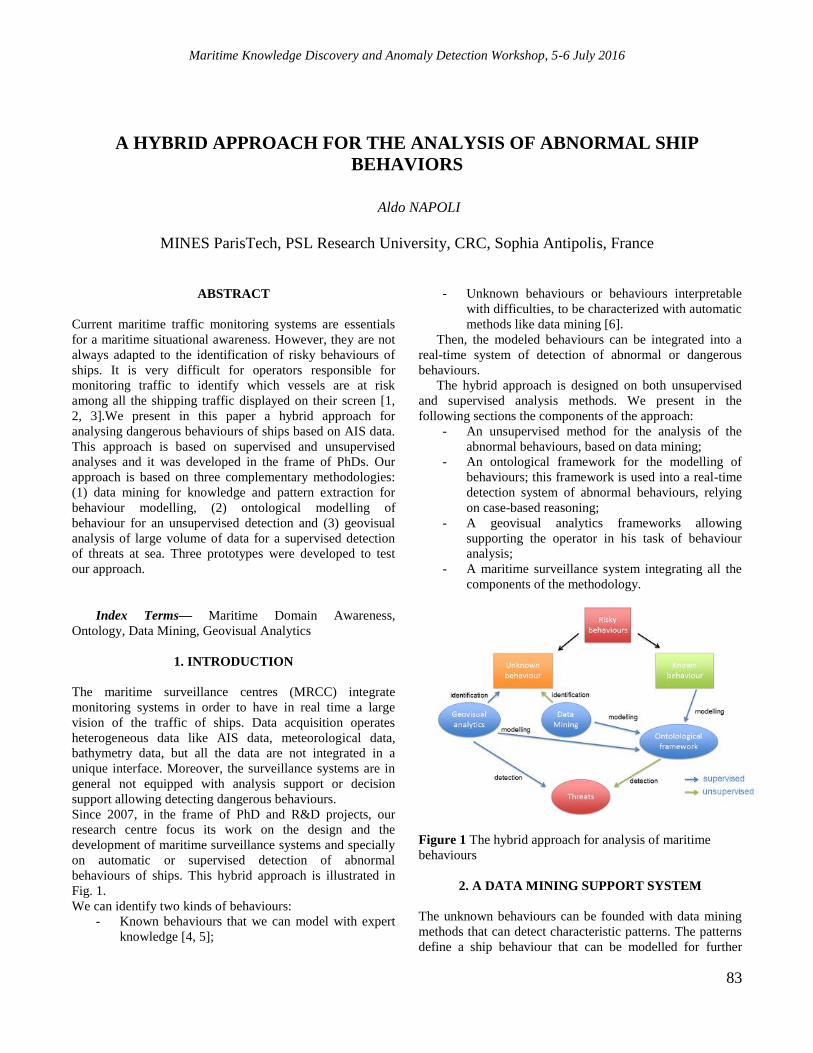
Maritime Knowledge Discovery and Anomaly Detection Workshop, 5-6 July 2016
83
A HYBRID APPROACH FOR THE ANALYSIS OF ABNORMAL SHIP
BEHAVIORS
Aldo NAPOLI
MINES ParisTech, PSL Research University, CRC, Sophia Antipolis, France
ABSTRACT
Current maritime traffic monitoring systems are essentials
for a maritime situational awareness. However, they are not
always adapted to the identification of risky behaviours of
ships. It is very difficult for operators responsible for
monitoring traffic to identify which vessels are at risk
among all the shipping traffic displayed on their screen [1,
2, 3].We present in this paper a hybrid approach for
analysing dangerous behaviours of ships based on AIS data.
This approach is based on supervised and unsupervised
analyses and it was developed in the frame of PhDs. Our
approach is based on three complementary methodologies:
(1) data mining for knowledge and pattern extraction for
behaviour modelling, (2) ontological modelling of
behaviour for an unsupervised detection and (3) geovisual
analysis of large volume of data for a supervised detection
of threats at sea. Three prototypes were developed to test
our approach.
Index Terms— Maritime Domain Awareness,
Ontology, Data Mining, Geovisual Analytics
1. INTRODUCTION
The maritime surveillance centres (MRCC) integrate
monitoring systems in order to have in real time a large
vision of the traffic of ships. Data acquisition operates
heterogeneous data like AIS data, meteorological data,
bathymetry data, but all the data are not integrated in a
unique interface. Moreover, the surveillance systems are in
general not equipped with analysis support or decision
support allowing detecting dangerous behaviours.
Since 2007, in the frame of PhD and R&D projects, our
research centre focus its work on the design and the
development of maritime surveillance systems and specially
on automatic or supervised detection of abnormal
behaviours of ships. This hybrid approach is illustrated in
Fig. 1.
We can identify two kinds of behaviours:
- Known behaviours that we can model with expert
knowledge [4, 5];
- Unknown behaviours or behaviours interpretable
with difficulties, to be characterized with automatic
methods like data mining [6].
Then, the modeled behaviours can be integrated into a
real-time system of detection of abnormal or dangerous
behaviours.
The hybrid approach is designed on both unsupervised
and supervised analysis methods. We present in the
following sections the components of the approach:
- An unsupervised method for the analysis of the
abnormal behaviours, based on data mining;
- An ontological framework for the modelling of
behaviours; this framework is used into a real-time
detection system of abnormal behaviours, relying
on case-based reasoning;
- A geovisual analytics frameworks allowing
supporting the operator in his task of behaviour
analysis;
- A maritime surveillance system integrating all the
components of the methodology.
Figure 1 The hybrid approach for analysis of maritime
behaviours
2. A DATA MINING SUPPORT SYSTEM
The unknown behaviours can be founded with data mining
methods that can detect characteristic patterns. The patterns
define a ship behaviour that can be modelled for further
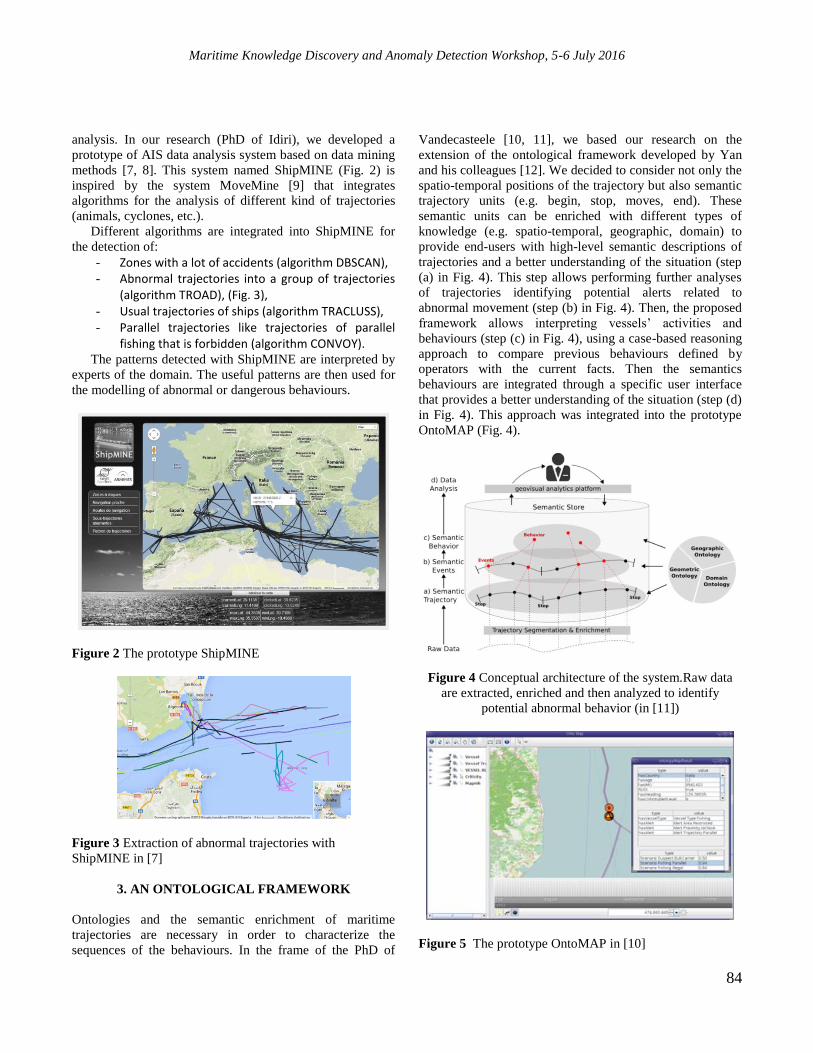
Maritime Knowledge Discovery and Anomaly Detection Workshop, 5-6 July 2016
84
analysis. In our research (PhD of Idiri), we developed a
prototype of AIS data analysis system based on data mining
methods [7, 8]. This system named ShipMINE (Fig. 2) is
inspired by the system MoveMine [9] that integrates
algorithms for the analysis of different kind of trajectories
(animals, cyclones, etc.).
Different algorithms are integrated into ShipMINE for
the detection of:
- Zones with a lot of accidents (algorithm DBSCAN), - Abnormal trajectories into a group of trajectories
(algorithm TROAD), (Fig. 3), - Usual trajectories of ships (algorithm TRACLUSS), - Parallel trajectories like trajectories of parallel
fishing that is forbidden (algorithm CONVOY). The patterns detected with ShipMINE are interpreted by
experts of the domain. The useful patterns are then used for
the modelling of abnormal or dangerous behaviours.
Figure 2 The prototype ShipMINE
Figure 3 Extraction of abnormal trajectories with
ShipMINE in [7]
3. AN ONTOLOGICAL FRAMEWORK
Ontologies and the semantic enrichment of maritime
trajectories are necessary in order to characterize the
sequences of the behaviours. In the frame of the PhD of
Vandecasteele [10, 11], we based our research on the
extension of the ontological framework developed by Yan
and his colleagues [12]. We decided to consider not only the
spatio-temporal positions of the trajectory but also semantic
trajectory units (e.g. begin, stop, moves, end). These
semantic units can be enriched with different types of
knowledge (e.g. spatio-temporal, geographic, domain) to
provide end-users with high-level semantic descriptions of
trajectories and a better understanding of the situation (step
(a) in Fig. 4). This step allows performing further analyses
of trajectories identifying potential alerts related to
abnormal movement (step (b) in Fig. 4). Then, the proposed
framework allows interpreting vessels’ activities and
behaviours (step (c) in Fig. 4), using a case-based reasoning
approach to compare previous behaviours defined by
operators with the current facts. Then the semantics
behaviours are integrated through a specific user interface
that provides a better understanding of the situation (step (d)
in Fig. 4). This approach was integrated into the prototype
OntoMAP (Fig. 4).
Figure 4 Conceptual architecture of the system.Raw data
are extracted, enriched and then analyzed to identify
potential abnormal behavior (in [11])
Figure 5 The prototype OntoMAP in [10]
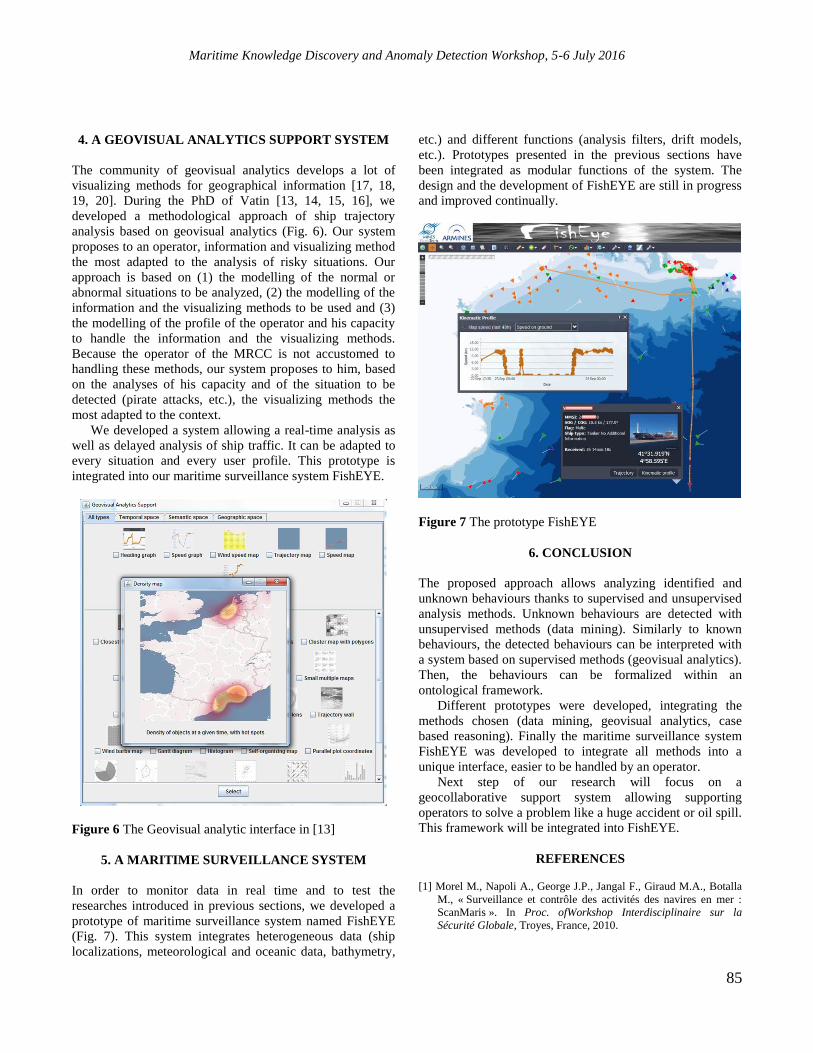
Maritime Knowledge Discovery and Anomaly Detection Workshop, 5-6 July 2016
85
4. A GEOVISUAL ANALYTICS SUPPORT SYSTEM
The community of geovisual analytics develops a lot of
visualizing methods for geographical information [17, 18,
19, 20]. During the PhD of Vatin [13, 14, 15, 16], we
developed a methodological approach of ship trajectory
analysis based on geovisual analytics (Fig. 6). Our system
proposes to an operator, information and visualizing method
the most adapted to the analysis of risky situations. Our
approach is based on (1) the modelling of the normal or
abnormal situations to be analyzed, (2) the modelling of the
information and the visualizing methods to be used and (3)
the modelling of the profile of the operator and his capacity
to handle the information and the visualizing methods.
Because the operator of the MRCC is not accustomed to
handling these methods, our system proposes to him, based
on the analyses of his capacity and of the situation to be
detected (pirate attacks, etc.), the visualizing methods the
most adapted to the context.
We developed a system allowing a real-time analysis as
well as delayed analysis of ship traffic. It can be adapted to
every situation and every user profile. This prototype is
integrated into our maritime surveillance system FishEYE.
Figure 6 The Geovisual analytic interface in [13]
5. A MARITIME SURVEILLANCE SYSTEM
In order to monitor data in real time and to test the
researches introduced in previous sections, we developed a
prototype of maritime surveillance system named FishEYE
(Fig. 7). This system integrates heterogeneous data (ship
localizations, meteorological and oceanic data, bathymetry,
etc.) and different functions (analysis filters, drift models,
etc.). Prototypes presented in the previous sections have
been integrated as modular functions of the system. The
design and the development of FishEYE are still in progress
and improved continually.
Figure 7 The prototype FishEYE
6. CONCLUSION
The proposed approach allows analyzing identified and
unknown behaviours thanks to supervised and unsupervised
analysis methods. Unknown behaviours are detected with
unsupervised methods (data mining). Similarly to known
behaviours, the detected behaviours can be interpreted with
a system based on supervised methods (geovisual analytics).
Then, the behaviours can be formalized within an
ontological framework.
Different prototypes were developed, integrating the
methods chosen (data mining, geovisual analytics, case
based reasoning). Finally the maritime surveillance system
FishEYE was developed to integrate all methods into a
unique interface, easier to be handled by an operator.
Next step of our research will focus on a
geocollaborative support system allowing supporting
operators to solve a problem like a huge accident or oil spill.
This framework will be integrated into FishEYE.
REFERENCES [1] Morel M., Napoli A., George J.P., Jangal F., Giraud M.A., Botalla
M., « Surveillance et contrôle des activités des navires en mer :
ScanMaris ». In Proc. ofWorkshop Interdisciplinaire sur la
Sécurité Globale, Troyes, France, 2010.

Maritime Knowledge Discovery and Anomaly Detection Workshop, 5-6 July 2016
86
[2] Riveiro M., Falkman G., “The role of visualization and interaction
in maritime anomaly detection”. In Proc. of SPIE-IS&T Electronic
Imaging, 7868:78680M, San Francisco, CA, USA: Chung Wong,
P. (Eds), 2011.
[3] Vatin G. and Napoli A., “Guiding the controller in geovisual
analytics to improve maritime surveillance”, In Proc. of
GEOProcessing 2013: The Fifth International Conference on
Advanced Geographic Information Systems, Applications,
andServices, Nice, France, 2013.
[4] Roy J., “Anomaly detection in the maritime domain” In Proc. of
Optics and Photonics in Global Homeland Security IV; 69550W.
Spie., 2008.
[5] Van Laere J. and Nilsson M., “Evaluation of a workshop to capture
knowledge from subject matter experts in maritime surveillance”,
In Proc. of the 12th
international Information Fusion Conference,
Seattle, USA, pp. 171-178, 2009.
[6] Pallotta G., Vespe M. and Bryan K., “Vessel pattern knowledge
discovery from AIS data: a framework for anomaly detection and
route prediction”, Entropy 2013, 15, pp. 22218-2245, 2013.
[7] Idiri B., « Méthodologie d’extraction de connaissances spatio-
temporelles par fouille de données pour l’analyse de
comportements à risques – Application à la surveillance
maritime », PhD thesis, MINES ParisTech, CRC, 2013.
[8]Idiri B. and Napoli A., “The automatic identification system of
maritime accident risk using rule-based reasoning”, In Proc. of the
7th International Conference on System Of Systems Engineering -
IEEE SOSE 2012, Jul 2012, Genoa, Italy. pp.125-130, 2012.
[9] Li Z., Ji M., Lee J.G., Tang L.A. and J. Han, “MoveMine: Mining
Moving Object Databases” In Proc. ofInternational Conference
On Management of data (SIGMOD), Indianapolis, 2010.
[10] Vandecasteele A., « Modélisation ontologique des connaissances
expertes pour l’analyse de comportements à risque – Application à
la surveillance maritime », PhD thesis, MINES ParisTech, CRC,
2012.
[11] Vandecasteele A., Devillers R. and Napoli A., “A semi-supervised
learning frameworkbas ed on spatio-temporal semantic events for
maritime anomaly detection and behavior analysis”. In Proc. of
CoastGIS 2013 - The 11th International Symposium for GIS and
Computer Cartography for Coastal Zone Management, Jun 2013,
Victoria, Canada.4 p., 2013.
[12]Yan Z., Chakraborty D., Parent C., Spaccapietra S. and Aberer K.,
“Semantic Trajectories: Mobility Data Computationand
Annotation”. ACM Transactions on Intelligent Systems and
technology, 9:1–34, 2012.
[13] Vatin G., “Formalisation d’un environnement d’aide à l’analyse
géovisuelle – Application à la sécurité et sûreté de la
maritimisation de l’énergie », PhD thesis, MINES ParisTech, CRC,
2014.
[14] Vatin G. and Napoli A., “High-Level Taxonomy of Geovisual
Analytics Tasks for Maritime Surveillance”, in Proc. 26th
International Cartographic Conference, Aug 2013, Dresde,
Germany. 14 p., 2013.
[15] Vatin G., Rigaud E. and Napoli A. “Geovisual Analytics
Environment for Supporting the Resilience of Maritime
Surveillance System”. In Proc. ofThe Council of Engineering
Systems Universities (CESUN). CESUN 2014, 4th
InternationalEngineering Systems Symposium, Jun 2014,
Hoboken, NJ, United States.7 p., 2014.
[16] Vatin G. and Napoli A., “Using Ontologies for Proposing
Adequate Geovisual Analytics Solutions in the Analysis of
Trajectories”. In proc. iV 2014 : 18th International Conference on
Information Visualisation, Jul 2014, Paris, France.IEEE, pp.176-
182, 2014.
[17] Kraak M.J., “Beyond geovisualization”, IEEE Computer Graphics
and Applications 26 (4): 6‑9, 2006
[18] Andrienko N. and Andrienko G., “Visual analytics of movement:
an overview of methods, tools and procedures”. Information
Visualization 12 (1): 3‑24, 2013.
[19] Willems N., « Visualization of vessel traffic ». Technische
Universiteit Eindhoven, 2011
[20] Riveiro M., “Visual analytics for maritime anomaly detection”.
University of Skövde, 2011.
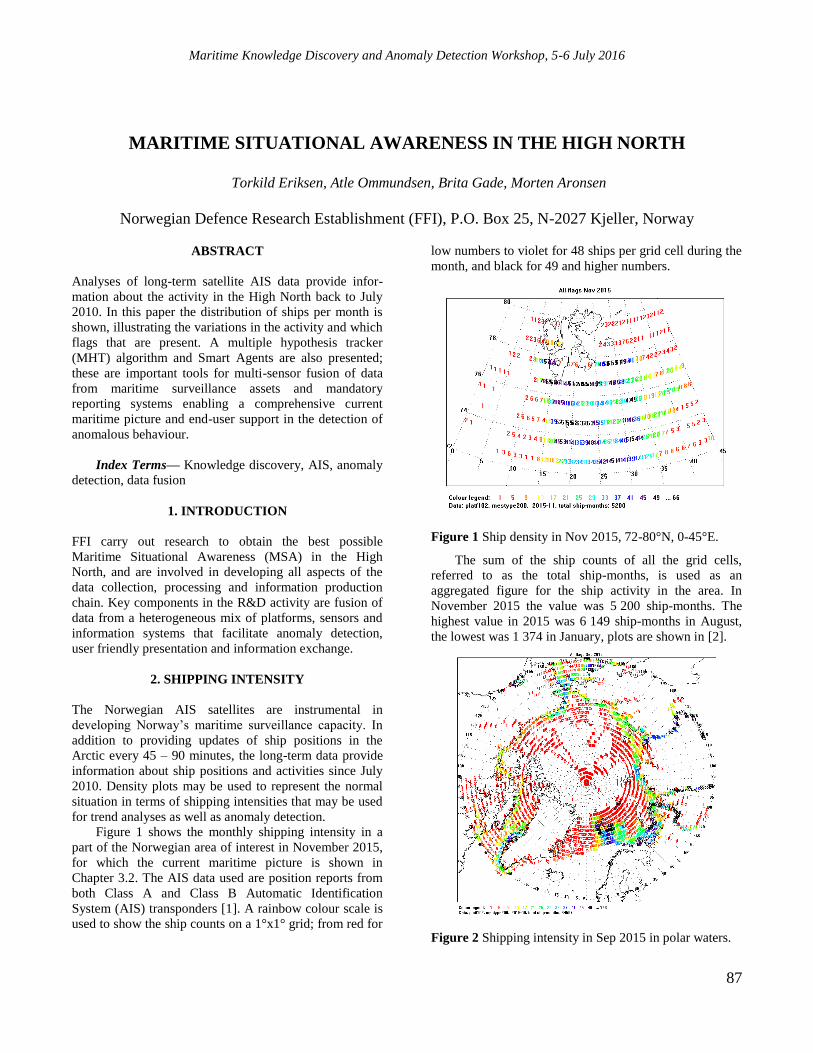
Maritime Knowledge Discovery and Anomaly Detection Workshop, 5-6 July 2016
87
MARITIME SITUATIONAL AWARENESS IN THE HIGH NORTH
Torkild Eriksen, Atle Ommundsen, Brita Gade, Morten Aronsen
Norwegian Defence Research Establishment (FFI), P.O. Box 25, N-2027 Kjeller, Norway
ABSTRACT
Analyses of long-term satellite AIS data provide infor-
mation about the activity in the High North back to July
2010. In this paper the distribution of ships per month is
shown, illustrating the variations in the activity and which
flags that are present. A multiple hypothesis tracker
(MHT) algorithm and Smart Agents are also presented;
these are important tools for multi-sensor fusion of data
from maritime surveillance assets and mandatory
reporting systems enabling a comprehensive current
maritime picture and end-user support in the detection of
anomalous behaviour.
Index Terms— Knowledge discovery, AIS, anomaly
detection, data fusion
1. INTRODUCTION
FFI carry out research to obtain the best possible
Maritime Situational Awareness (MSA) in the High
North, and are involved in developing all aspects of the
data collection, processing and information production
chain. Key components in the R&D activity are fusion of
data from a heterogeneous mix of platforms, sensors and
information systems that facilitate anomaly detection,
user friendly presentation and information exchange.
2. SHIPPING INTENSITY
The Norwegian AIS satellites are instrumental in
developing Norway’s maritime surveillance capacity. In
addition to providing updates of ship positions in the
Arctic every 45 – 90 minutes, the long-term data provide
information about ship positions and activities since July
2010. Density plots may be used to represent the normal
situation in terms of shipping intensities that may be used
for trend analyses as well as anomaly detection.
Figure 1 shows the monthly shipping intensity in a
part of the Norwegian area of interest in November 2015,
for which the current maritime picture is shown in
Chapter 3.2. The AIS data used are position reports from
both Class A and Class B Automatic Identification
System (AIS) transponders [1]. A rainbow colour scale is
used to show the ship counts on a 1°x1° grid; from red for
low numbers to violet for 48 ships per grid cell during the
month, and black for 49 and higher numbers.
Figure 1 Ship density in Nov 2015, 72-80°N, 0-45°E.
The sum of the ship counts of all the grid cells,
referred to as the total ship-months, is used as an
aggregated figure for the ship activity in the area. In
November 2015 the value was 5 200 ship-months. The
highest value in 2015 was 6 149 ship-months in August,
the lowest was 1 374 in January, plots are shown in [2].
Figure 2 Shipping intensity in Sep 2015 in polar waters.

Maritime Knowledge Discovery and Anomaly Detection Workshop, 5-6 July 2016
88
Figure 2 shows the shipping intensity in the area given by
the polar-waters definition in the Polar Code [4]. The
highest number of ship-months in 2015 occur in
September; 34 597 ship-months. The annual variation in
the number of ship-months (red) as well as the number of
ships (blue) is shown in Figure 3; 1 719 ships contributed
to the activity in September.
Figure 3 Variation of shipping in polar waters 2015.
The number of ships per flag state in September is shown
in Figure 4. Russia has the highest number of AIS-
reporting ships, 805; the USA is second with 258 ships;
Norway third, 120; Greenland fourth, 70; and Canada
fifth, 65. It can be noted that 84MMSI’s cannot be
associated with a flag state. It is 55 flags states observed.
Figure 4 Number of ships per flag state in Sep 2015.
3. ANOMALY DETECTION AND DATA FUSION
Anomaly detection is performed by Smart Agents
(Chapter 3.1), and by an in-house developed target
tracking algorithm; the Multi Hypothesis Tracker(MHT)
using data fusion for automatic identification of ships
detected in radar satellite images (Chapter 3.2).Several
Smart Agents implemented to facilitate the anomaly
detection are shown in Figure 5.
Figure 5 Smart Agents flow chart.
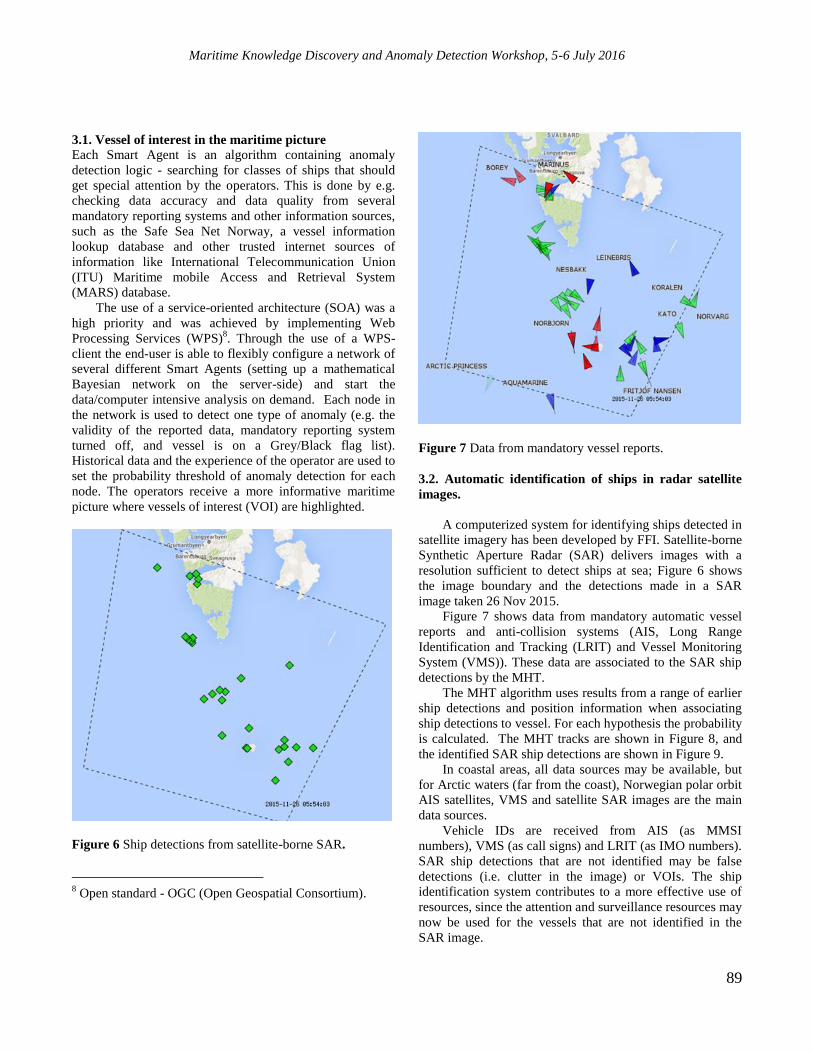
Maritime Knowledge Discovery and Anomaly Detection Workshop, 5-6 July 2016
89
3.1. Vessel of interest in the maritime picture Each Smart Agent is an algorithm containing anomaly
detection logic - searching for classes of ships that should
get special attention by the operators. This is done by e.g.
checking data accuracy and data quality from several
mandatory reporting systems and other information sources,
such as the Safe Sea Net Norway, a vessel information
lookup database and other trusted internet sources of
information like International Telecommunication Union
(ITU) Maritime mobile Access and Retrieval System
(MARS) database.
The use of a service-oriented architecture (SOA) was a
high priority and was achieved by implementing Web
Processing Services (WPS)8. Through the use of a WPS-
client the end-user is able to flexibly configure a network of
several different Smart Agents (setting up a mathematical
Bayesian network on the server-side) and start the
data/computer intensive analysis on demand. Each node in
the network is used to detect one type of anomaly (e.g. the
validity of the reported data, mandatory reporting system
turned off, and vessel is on a Grey/Black flag list).
Historical data and the experience of the operator are used to
set the probability threshold of anomaly detection for each
node. The operators receive a more informative maritime
picture where vessels of interest (VOI) are highlighted.
Figure 6 Ship detections from satellite-borne SAR.
8 Open standard - OGC (Open Geospatial Consortium).
Figure 7 Data from mandatory vessel reports.
3.2. Automatic identification of ships in radar satellite
images.
A computerized system for identifying ships detected in
satellite imagery has been developed by FFI. Satellite-borne
Synthetic Aperture Radar (SAR) delivers images with a
resolution sufficient to detect ships at sea; Figure 6 shows
the image boundary and the detections made in a SAR
image taken 26 Nov 2015.
Figure 7 shows data from mandatory automatic vessel
reports and anti-collision systems (AIS, Long Range
Identification and Tracking (LRIT) and Vessel Monitoring
System (VMS)). These data are associated to the SAR ship
detections by the MHT.
The MHT algorithm uses results from a range of earlier
ship detections and position information when associating
ship detections to vessel. For each hypothesis the probability
is calculated. The MHT tracks are shown in Figure 8, and
the identified SAR ship detections are shown in Figure 9.
In coastal areas, all data sources may be available, but
for Arctic waters (far from the coast), Norwegian polar orbit
AIS satellites, VMS and satellite SAR images are the main
data sources.
Vehicle IDs are received from AIS (as MMSI
numbers), VMS (as call signs) and LRIT (as IMO numbers).
SAR ship detections that are not identified may be false
detections (i.e. clutter in the image) or VOIs. The ship
identification system contributes to a more effective use of
resources, since the attention and surveillance resources may
now be used for the vessels that are not identified in the
SAR image.

Maritime Knowledge Discovery and Anomaly Detection Workshop, 5-6 July 2016
90
Figure 8 Association of ship detections to MHT tracks.
Figure 9 Identification of detected ships.
4. SUMMARY AND CONCLUSION
This paper has shown that up to 1700 ships were observed
with SAT-AIS in the polar-waters polygon in the Polar
Code [4]. Earlier work has shown that almost 2300 ships
were observed north of 67°N, a majority of them in
Norwegian waters [3].
Detection of anomalous behaviour in a maritime
context forms a natural part of the surveillance in the High
North. Its main purpose is to distinguish abnormal activity
from the normal background. It enables efficient use of
surveillance assets, necessary for timely response to
incidents threatening safety or security. FFI is presently
working on further development and refinement of the MHT
and Smart Agents to support operation of decision makers.
More sophisticated algorithms to support decision
support will be explored further in future work. Machine
learning, or pattern classification, provides a suitable
theoretical framework and a wide range of general
algorithms that may be applied to detect anomalies in the
maritime domain. An on-going survey of methods of
anomaly detection published in open literature will be an
important input for evaluating current and future activities
within this area. Adding new types of sensors as input to the
MHT algorithm will result in a more complete maritime
picture, thereby enhancing the situational awareness in the
high north.
Ship density figures can serve as background
information about the normal situation, basis for sailing
plans, as well as the likelihood of observing a ship in given
position for anomaly detection.
REFERENCES
[1] International Telecommunication Union, “Technical
Characteristics for a Universal Shipborne Automatic Identification
System using Time Division Multiple Access in the VHF Maritime
Mobile Bad”, ITU-R M.1371-4.
[2] Carlos Santamaria, Harm Greidanus, Mélanie Fournier, Torkild
Eriksen, Michele Vespe, Marlene Alvarez, Virginia Fernandez
Arguedas, Conor Delaney, Pietro Argentieri, “Sentinel-1
Contribution to Monitoring Maritime Activity in the Arctic”. Proc.
ESA Living Planet Symposium 2016, 9-13 May 2016, Prague,
Czech Republic.
[3] Eriksen, T. and Olsen, Ø.. “Vessel tracking using Automatic
Identification System data in the Arctic”, In Proc. Joint WMU-
IMO-Arctic Council International Conference on Safe and
Sustainable Shipping in a Changing Arctic Environment (ShipArc
2015), 25-27 Aug 2015, Malmö, Sweden, under revision.
[4] IMO, International Code For Ships Operating in Polar Waters
(Polar Code), MEPC 68/21/Add.1, Annex 10.

Maritime Knowledge Discovery and Anomaly Detection Workshop, 5-6 July 2016
91
ANOMALY DETECTION AND KNOWLEDGE DISCOVERY
USING VESSEL TRACKING DATA
A. Alessandrini, M. Alvarez, H. Greidanus, V. Gammieri, V. Fernandez Arguedas, F. Mazzarella, C.
Santamaria, M. Stasolla, D. Tarchi and M. Vespe
European Commission, Joint Research Centre
ABSTRACT
The information available to understand what is happening
at sea is nowadays enabling many monitoring applications.
Nevertheless, the size of the areas to be controlled and the
amount of tracking data collected by a multitude of sensors
and systems in real-time make the effective detection of
illegal activities a challenging goal since often left to human
operators. This work will introduce recent JRC research
activities relevant to automatic anomaly detection and
knowledge discovery in the maritime domain. Data mining,
data analytics and predictive analysis examples are
introduced using real data. In addition, this paper presents
approaches to detect reporting messages anomalies and
unexpected behaviours at sea.
Index Terms— Maritime Surveillance, Knowledge
Discovery, Anomaly Detection
1. INTRODUCTION
The overwhelming amount of information made available
by the recent build-up of real time tracking systems can be
used to extract knowledge and perform predictive analysis
and automatic anomaly detection. The paper offers a list of
research areas explored by the JRC Blue Hub team to
improve Maritime Situational Awareness (MSA). Such
activities range from Knowledge Discovery (mapping
activities at sea including fishing and shipping, coverage
analysis), predictive analysis (knowledge based Estimated
Time of Arrival - ETA, long term route prediction), and data
analytics. In addition, this paper presents approaches to
detect reporting messages anomalies (AIS On/Off, spoofing
and malfunctioning) and unexpected behaviours at sea (low-
likelihood event detection).
2. KNOWLEDGE DISCOVERY
The term Knowledge Discovery in this paper refers to the
“overall process of discovering useful knowledge from
data” [1]. In the maritime domain, Knowledge Discovery
can be applied to map activities at sea, predict future vessel
positions or to build the basis for model based anomaly
detection.
2.1. Mapping Human Activities at Sea
The value of maritime Big Data has been recently
demonstrated for better understanding maritime activities at
sea. Historical vessel tracking data from systems such as
Automatic Identification System (AIS)9 or Long Range
Identification and Tracking (LRIT)10
can help in building
context of maritime uses, especially in remote areas where
the information is difficult to access or unavailable [2]-[5].
2.1.1. Mapping Maritime Routes
The knowledge of maritime routes is particularly needed in
areas where the traffic is highly regulated. Specific methods
to extract maritime patterns have been developed and
refined (e.g.[2], [3]). The underpinning model is based on
waypoints detections (“entry”, “exit”, “port” areas). Such
waypoints are then collectively connected by vessel tracks
that shape the “normal” patterns at sea by clustering
common trajectories as shown in Figure 1.
Figure 1 Dover Strait traffic: (left) two-weeks of AIS data and (right) the
resulting maritime traffic routes connecting previously detected waypoints (green: ports, magenta: exit and cyan: entry areas).
9IMO (1998) Resolution MSC.74(69), Recommendation on Performance Standards for Universal
Automatic Identification System (AIS), Annex 3; adopted on 12 May 1998. 10IMO MSC.210(81), Performance Standards and Functional Requirements for the Long Range
Identification and Tracking of Ships. Resolution adopted on 19 May 2006.
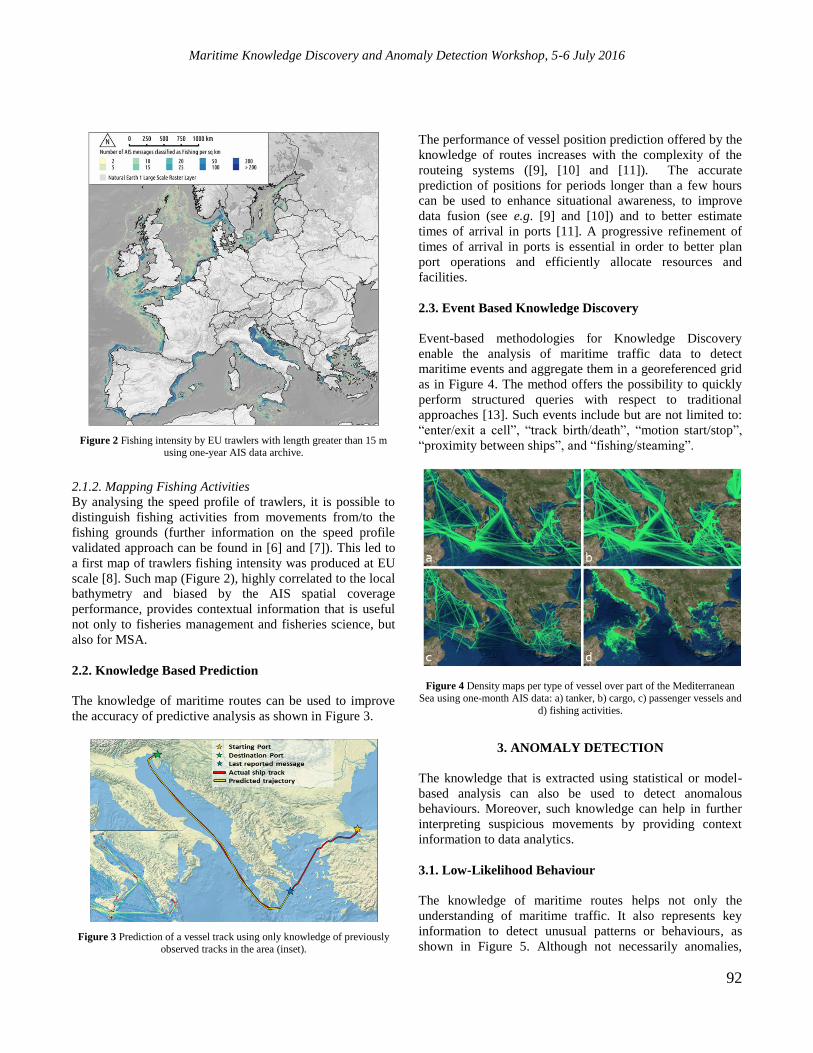
Maritime Knowledge Discovery and Anomaly Detection Workshop, 5-6 July 2016
92
Figure 2 Fishing intensity by EU trawlers with length greater than 15 m using one-year AIS data archive.
2.1.2. Mapping Fishing Activities
By analysing the speed profile of trawlers, it is possible to
distinguish fishing activities from movements from/to the
fishing grounds (further information on the speed profile
validated approach can be found in [6] and [7]). This led to
a first map of trawlers fishing intensity was produced at EU
scale [8]. Such map (Figure 2), highly correlated to the local
bathymetry and biased by the AIS spatial coverage
performance, provides contextual information that is useful
not only to fisheries management and fisheries science, but
also for MSA.
2.2. Knowledge Based Prediction
The knowledge of maritime routes can be used to improve
the accuracy of predictive analysis as shown in Figure 3.
Figure 3 Prediction of a vessel track using only knowledge of previously
observed tracks in the area (inset).
The performance of vessel position prediction offered by the
knowledge of routes increases with the complexity of the
routeing systems ([9], [10] and [11]). The accurate
prediction of positions for periods longer than a few hours
can be used to enhance situational awareness, to improve
data fusion (see e.g. [9] and [10]) and to better estimate
times of arrival in ports [11]. A progressive refinement of
times of arrival in ports is essential in order to better plan
port operations and efficiently allocate resources and
facilities.
2.3. Event Based Knowledge Discovery
Event-based methodologies for Knowledge Discovery
enable the analysis of maritime traffic data to detect
maritime events and aggregate them in a georeferenced grid
as in Figure 4. The method offers the possibility to quickly
perform structured queries with respect to traditional
approaches [13]. Such events include but are not limited to:
“enter/exit a cell”, “track birth/death”, “motion start/stop”,
“proximity between ships”, and “fishing/steaming”.
Figure 4 Density maps per type of vessel over part of the Mediterranean
Sea using one-month AIS data: a) tanker, b) cargo, c) passenger vessels and
d) fishing activities.
3. ANOMALY DETECTION
The knowledge that is extracted using statistical or model-
based analysis can also be used to detect anomalous
behaviours. Moreover, such knowledge can help in further
interpreting suspicious movements by providing context
information to data analytics.
3.1. Low-Likelihood Behaviour
The knowledge of maritime routes helps not only the
understanding of maritime traffic. It also represents key
information to detect unusual patterns or behaviours, as
shown in Figure 5. Although not necessarily anomalies,

Maritime Knowledge Discovery and Anomaly Detection Workshop, 5-6 July 2016
93
such low-likelihood activities represent a first filtered set of
behaviours to be further investigated [12].
Figure 5 Local anomaly example extracted from the Dover Strait. The
vessel deviates from the known route (red dots), approaching a port without stopping and finally returning to its declared route.
3.2. Data Analytics
Recent news11
reported about an anomalous vessel track in
the Mediterranean Sea. By analysing AIS data, LRIT
archive data (Figure 6) and remote sensing images (Figure
7), through the Blue Hub it was demonstrated that the
behaviour could have been a consequence of a route
planning mistake.
Figure 6 AIS data (grey circles) of the ship. The track (red dashed line) is
estimated by interpolating the available data and using the density of
shipping in the area (derived from historical LRIT data).
11 Financial Times, Europe’s ports vulnerable as ships sail without oversight:
https://next.ft.com/content/4d71dc5e-c8ec-11e5-be0b-b7ece4e953a0
Figure 7 Sentinel-1 images showing signatures compatible with the size of
the target of interest.
In particular, the vessel probably did not switch off its AIS:
the North African area is characterised by low terrestrial
AIS coverage and this is why there is a lack of information.
AIS messages from the ship were in fact captured by
satellites and a compatible signature is visible from remote
sensing images. The vessel then sailed avoiding shallow
waters (as the LRIT density of previous tracks shows) to
cross the Sicily Channel, directed towards the Tyrrhenian
Sea. Finally, the vessel slowed down and made a sharp turn
towards the Port of Pozzallo. In that specific moment, by as
seen in the voyage related data, the declared destination
changed from “Pozzouoli” (in the Tyrrhenian Sea) to
“Pozzallo”, highlighting a possible mistake in the planned
route. This example shows how, after an anomaly is
detected, the data must more deeply analyised before a true
threat can be confirmed.
3.3. Spoofing Detection
The AIS standard allows the recording of the timestamp of
the received messages at the base station.
Figure 8 Spoofing case of a vessel located in port (top right) and
broadcasting messages more than 100 km away from its actual position.
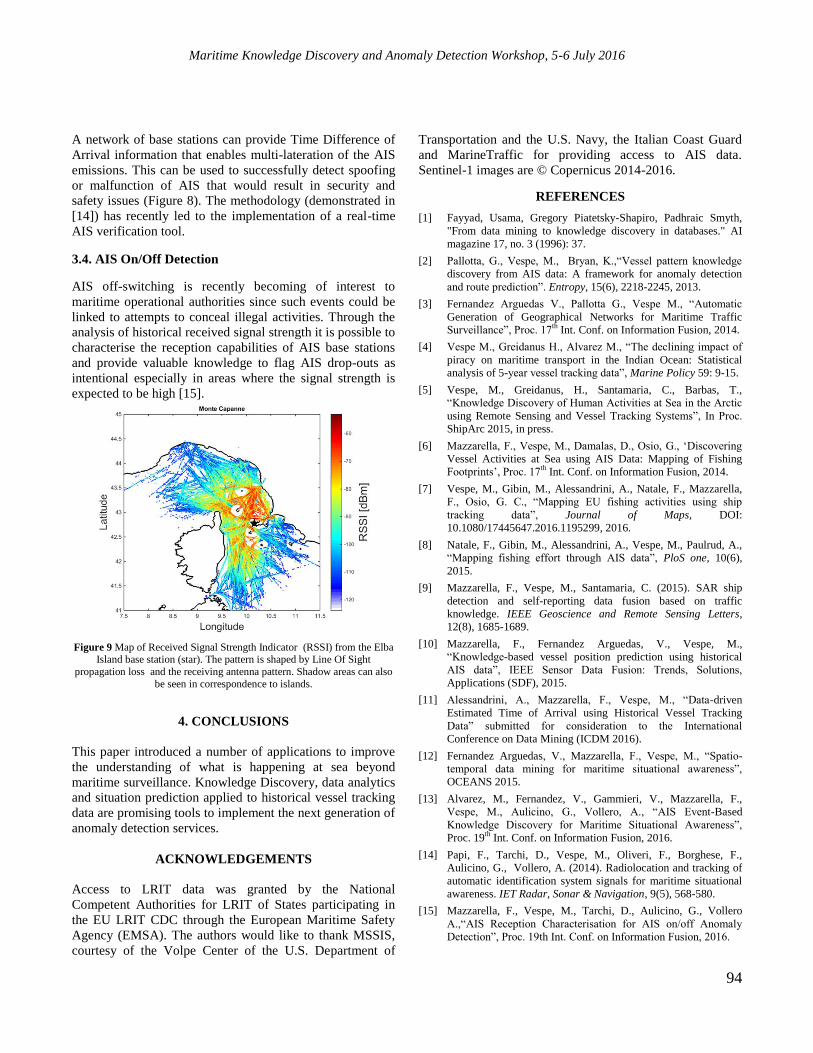
Maritime Knowledge Discovery and Anomaly Detection Workshop, 5-6 July 2016
94
A network of base stations can provide Time Difference of
Arrival information that enables multi-lateration of the AIS
emissions. This can be used to successfully detect spoofing
or malfunction of AIS that would result in security and
safety issues (Figure 8). The methodology (demonstrated in
[14]) has recently led to the implementation of a real-time
AIS verification tool.
3.4. AIS On/Off Detection
AIS off-switching is recently becoming of interest to
maritime operational authorities since such events could be
linked to attempts to conceal illegal activities. Through the
analysis of historical received signal strength it is possible to
characterise the reception capabilities of AIS base stations
and provide valuable knowledge to flag AIS drop-outs as
intentional especially in areas where the signal strength is
expected to be high [15].
Figure 9 Map of Received Signal Strength Indicator (RSSI) from the Elba Island base station (star). The pattern is shaped by Line Of Sight
propagation loss and the receiving antenna pattern. Shadow areas can also
be seen in correspondence to islands.
4. CONCLUSIONS
This paper introduced a number of applications to improve
the understanding of what is happening at sea beyond
maritime surveillance. Knowledge Discovery, data analytics
and situation prediction applied to historical vessel tracking
data are promising tools to implement the next generation of
anomaly detection services.
ACKNOWLEDGEMENTS
Access to LRIT data was granted by the National
Competent Authorities for LRIT of States participating in
the EU LRIT CDC through the European Maritime Safety
Agency (EMSA). The authors would like to thank MSSIS,
courtesy of the Volpe Center of the U.S. Department of
Transportation and the U.S. Navy, the Italian Coast Guard
and MarineTraffic for providing access to AIS data.
Sentinel-1 images are © Copernicus 2014-2016.
REFERENCES
[1] Fayyad, Usama, Gregory Piatetsky-Shapiro, Padhraic Smyth,
"From data mining to knowledge discovery in databases." AI
magazine 17, no. 3 (1996): 37.
[2] Pallotta, G., Vespe, M., Bryan, K.,“Vessel pattern knowledge
discovery from AIS data: A framework for anomaly detection
and route prediction”. Entropy, 15(6), 2218-2245, 2013.
[3] Fernandez Arguedas V., Pallotta G., Vespe M., “Automatic
Generation of Geographical Networks for Maritime Traffic
Surveillance”, Proc. 17th Int. Conf. on Information Fusion, 2014.
[4] Vespe M., Greidanus H., Alvarez M., “The declining impact of
piracy on maritime transport in the Indian Ocean: Statistical
analysis of 5-year vessel tracking data”, Marine Policy 59: 9-15.
[5] Vespe, M., Greidanus, H., Santamaria, C., Barbas, T.,
“Knowledge Discovery of Human Activities at Sea in the Arctic
using Remote Sensing and Vessel Tracking Systems”, In Proc.
ShipArc 2015, in press.
[6] Mazzarella, F., Vespe, M., Damalas, D., Osio, G., ‘Discovering
Vessel Activities at Sea using AIS Data: Mapping of Fishing
Footprints’, Proc. 17th Int. Conf. on Information Fusion, 2014.
[7] Vespe, M., Gibin, M., Alessandrini, A., Natale, F., Mazzarella,
F., Osio, G. C., “Mapping EU fishing activities using ship
tracking data”, Journal of Maps, DOI:
10.1080/17445647.2016.1195299, 2016.
[8] Natale, F., Gibin, M., Alessandrini, A., Vespe, M., Paulrud, A.,
“Mapping fishing effort through AIS data”, PloS one, 10(6),
2015.
[9] Mazzarella, F., Vespe, M., Santamaria, C. (2015). SAR ship
detection and self-reporting data fusion based on traffic
knowledge. IEEE Geoscience and Remote Sensing Letters,
12(8), 1685-1689.
[10] Mazzarella, F., Fernandez Arguedas, V., Vespe, M.,
“Knowledge-based vessel position prediction using historical
AIS data”, IEEE Sensor Data Fusion: Trends, Solutions,
Applications (SDF), 2015.
[11] Alessandrini, A., Mazzarella, F., Vespe, M., “Data-driven
Estimated Time of Arrival using Historical Vessel Tracking
Data” submitted for consideration to the International
Conference on Data Mining (ICDM 2016).
[12] Fernandez Arguedas, V., Mazzarella, F., Vespe, M., “Spatio-
temporal data mining for maritime situational awareness”,
OCEANS 2015.
[13] Alvarez, M., Fernandez, V., Gammieri, V., Mazzarella, F.,
Vespe, M., Aulicino, G., Vollero, A., “AIS Event-Based
Knowledge Discovery for Maritime Situational Awareness”,
Proc. 19th Int. Conf. on Information Fusion, 2016.
[14] Papi, F., Tarchi, D., Vespe, M., Oliveri, F., Borghese, F.,
Aulicino, G., Vollero, A. (2014). Radiolocation and tracking of
automatic identification system signals for maritime situational
awareness. IET Radar, Sonar & Navigation, 9(5), 568-580.
[15] Mazzarella, F., Vespe, M., Tarchi, D., Aulicino, G., Vollero
A.,“AIS Reception Characterisation for AIS on/off Anomaly
Detection”, Proc. 19th Int. Conf. on Information Fusion, 2016.

Maritime Knowledge Discovery and Anomaly Detection Workshop, 5-6 July 2016
95
CONCLUSIONS AND RECOMMENDATIONS
Operational Authorities
Today’s ship reporting data – for the most part AIS – are used on a routine basis by maritime operational
authorities to find situations that need attention. A common view of anomalies was identified among the
authorities including loitering, rendezvous, location, unusual speed or change of direction. The
transformation of available maritime data into information and the reduction of false alarms are essential
among the main needs of the authorities. This is particularly true in view of the wide extent of
Exclusive-Economic-Zone and Search-And-Rescue areas to be monitored.
Operational authorities also stated the importance of further investigating suspicious events as they often
are not linked to illegal activities. This can be done by considering all available data and by factoring
expert knowledge in the process.
A regulatory gap on the meaning of “monitoring” in the maritime domain is currently faced by
operational authorities. In particular, dealing with alerts originating from areas or behaviours that are not
explicitly included in the mandate of an authority presents issues.
Operational authorities welcome the idea to further characterise sea areas in terms of type of use by
mapping activities in order to provide context and a-priori information for situational awareness.
Additional emerging needs include the capacity to detect AIS spoofing or malfunctioning and AIS On-
Off switching: both events might be indication of illegal activities and pose threats to security and
safety. Also vessel profiling to improve risk index with respect to safety, security and Illegal Unreported
or Unregulated fishing were listed among the most pressing needs for more effective operations at sea.
Private Sector
During the research and development (private sector) session, technical aspects related to knowledge
discovery and anomaly detection were introduced. As an example, it is possible to recognise fishing
vessels up to the level of fishing gear (e.g. trawling, purse seine or longline) based on their trajectory,
provided that enough data points are available (see page 22 for additional information).
The role of AIS was acknowledged as “revolutionary”, since it opens the doors to MSA applications that
in the past would have been unimaginable. A similar role is seen for the future VHF Data Exchange
System (VDES), which right now presents a window of opportunity to define new functionalities, such
as e.g. enabling a ship to become a sort of in-situ suite of sensors (page 24 and page 40).
The value of historical data when analysing real time streams was recognised as a future direction that
has already started to be explored spawning many Knowledge Discovery projects (page 28). Innovative
uses of AIS data include the extraction of sea surface currents in real-time (page 31), remotely and
accurately. This is an essential element for Search-And-Rescue operations.
Finally, this session offered the opportunity to demonstrate how research can generate commercial and
operational systems as well as innovative ideas to counter spoofing attempts (page 36).

Maritime Knowledge Discovery and Anomaly Detection Workshop, 5-6 July 2016
96
Research Centres and Academia
The session was opened by stating the need for a literature review in the field of anomaly detection and
Knowledge Discovery. This is a relatively young subject where there has been a rapid increase of
publications and it is the right time to start a survey on what is available, also to identify the most
promising areas.
The presentations highlighted new data streams and platforms (e.g. page 40), methods and also different
ways to look at the subject such as the definition of sensing requirements based on the specific
behaviours at sea to be detected (page 52).
Ways to model complex events such as encounters at sea were presented, together with approaches to
filter them using visual interaction with the data (pages 44 and 83). In addition, similar techniques can
be applied to many different domains including aviation, or to the tracking of people on a football pitch.
Data-driven approaches were discussed to detect and characterise port areas taking into account the new
trend of limiting human intervention in appropriately setting the parameters of the implemented solution
(page 48).
During the session the process of designing use cases to ensure the security and control of fishing
activities was introduced (page 57). In addition, the estimation of destination, time of arrival and the
detection of inconsistencies are promising research areas (pages 62 and 91).
Remote Sensing and radar also play a key role in anomaly detection since delivering independent
information that complements self-reporting systems (pages 66 and 87). The fusion of such data is also
fundamental to obtain a more reliable maritime picture (page 78) and therefore more effective anomaly
detection.
It is now recognised that the errors in the AIS information cannot be ignored. There is an increase also
of intentional AIS manipulation, both kinematics and voyage related data. This can be tackled by
message analysis (page 74) or by means of radiolocation techniques (page 91). The need to better
quantify AIS performance and reliability was underscored (page 52).
A preliminary work also demonstrated how vessel reporting data can be processed to point to suspicious
behaviours of migrants smuggling vessels and what type of features can be used to identify potential
“ghost ships” in the Mediterranean Sea (page 69).
Finally, recent results over the Arctic region show how contextual information on human activities at sea
can be quantitatively extracted also in remote and seasonally variable regions using vessel tracking data
(page 87).
Concluding Remarks
Operational authorities stressed the need to involve the users as early as possible in the design,
implementation and quality assessment of anomaly detection and knowledge discovery tools. This is
driven not only by the need to align the development objectives to tackle real issues, but also by a strong
technology push. Indeed, often users have not enough insight of what becomes feasible in such a fast
evolving research and innovation field: a continuous dialogue between authorities, industry and research
would be extremely beneficial to the three communities.

Europe Direct is a service to help you find answers to your questions about the European Union
Freephone number (*): 00 800 6 7 8 9 10 11
(*) Certain mobile telephone operators do not allow access to 00 800 numbers or these calls may be billed.
A great deal of additional information on the European Union is available on the Internet.
It can be accessed through the Europa server http://europa.eu
How to obtain EU publications
Our publications are available from EU Bookshop (http://bookshop.europa.eu),
where you can place an order with the sales agent of your choice.
The Publications Office has a worldwide network of sales agents.
You can obtain their contact details by sending a fax to (352) 29 29-42758.

doi:10.2788/025881
ISBN 978-92-79-61301-2
LB
-02-1
6-907-E
N-N