mark hambliin - preparing for analytics - extracting meaningful data from physical processes
DESCRIPTION
ÂTRANSCRIPT

Preparing for Analytics
Extracting Meaningful Data from Physical
Processes
Mark Hamblin, Dynamic Manufacturing Solutions
Introduction
• Today we will discuss:
◦ The different types of manufacturers and their
different data requirements
◦ Obtaining data in low-tech environments
◦ How this data can be used to generate
competitive advantages
Manufacturing Sectors
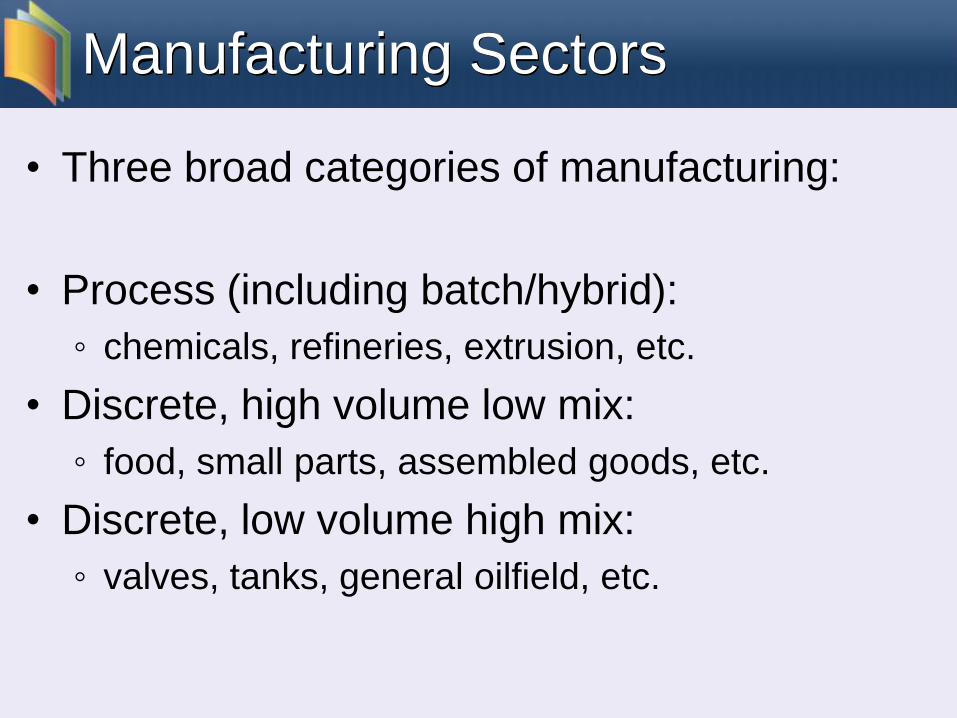
• Three broad categories of manufacturing:
• Process (including batch/hybrid):
◦ chemicals, refineries, extrusion, etc.
• Discrete, high volume low mix:
◦ food, small parts, assembled goods, etc.
• Discrete, low volume high mix:
◦ valves, tanks, general oilfield, etc.
Data in Process Manufacturing
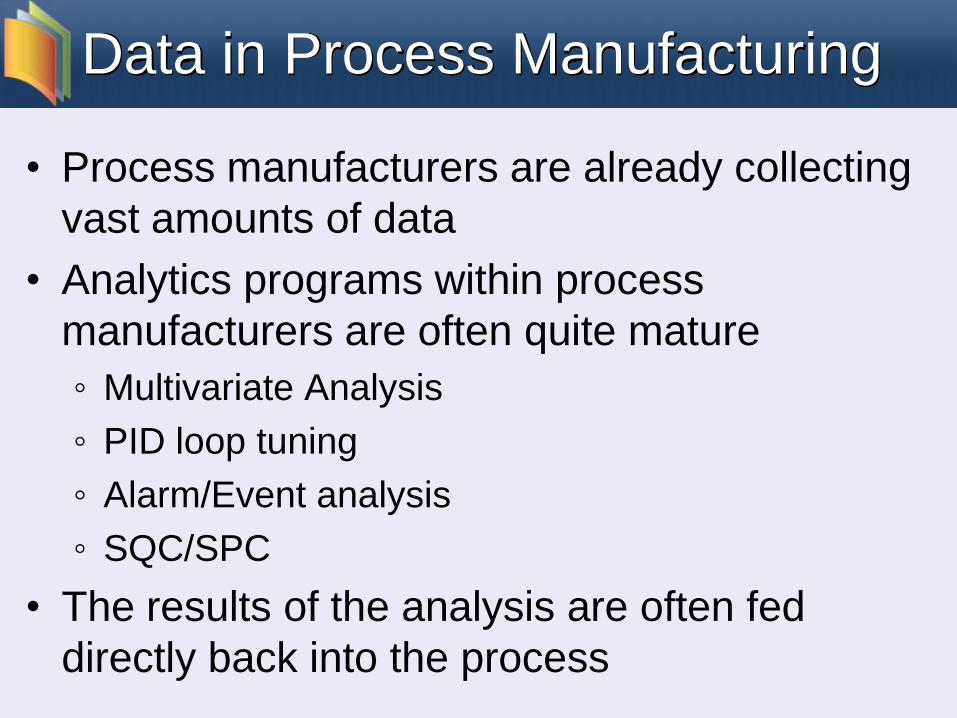
• Process manufacturers are already collecting
vast amounts of data
• Analytics programs within process
manufacturers are often quite mature
◦ Multivariate Analysis
◦ PID loop tuning
◦ Alarm/Event analysis
◦ SQC/SPC
• The results of the analysis are often fed
directly back into the process
Data in Discrete Manufacturing
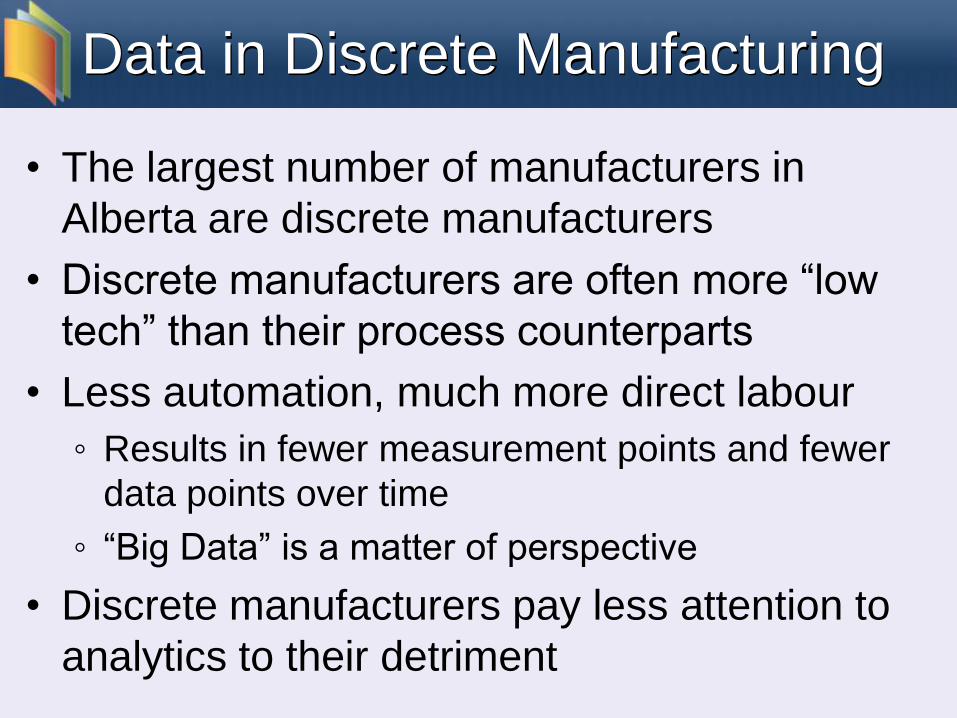
• The largest number of manufacturers in
Alberta are discrete manufacturers
• Discrete manufacturers are often more “low
tech” than their process counterparts
• Less automation, much more direct labour
◦ Results in fewer measurement points and fewer
data points over time
◦ “Big Data” is a matter of perspective
• Discrete manufacturers pay less attention to
analytics to their detriment

Value of Analytics in Discrete
• Proper analysis often results in:
◦ Reduced expediting costs
◦ Higher margins and fewer bad receivables
◦ Reduced office overhead
◦ Improved customer service
◦ Lower inventory levels
◦ Improved shop productivity
◦ Improved asset utilization
◦ Improved quality
Existing Enterprise Data
• Whether using Excel or SAP, everyone stores
electronic data
◦ Inventory levels
◦ Purchase orders
◦ Shipping documents
◦ Invoices
◦ Payroll data
◦ Customer and vendor contacts
• The key for manufacturers is to bring in shop
floor data as well
Capturing Additional Data
• To move toward formal analytics,
manufacturers must convert their physical
transactions to an electronic form
• Many are still recording transactions on paper
◦ Handwritten receipt confirmations
◦ Parts issued to jobs
◦ Completion of finished goods
◦ Manual time cards
◦ Inventory counts
◦ Etc.
Improving Data Collection
• How do “low-tech” discrete mfg environments
improve data management?
• Capture the data for the physical transaction
when and where it happens
◦ Reduce delays and the potential for lost
information
• Automate the collection of data
◦ Make it easy to record the information you need
for future analysis
Options for Collecting Data
• Software interfaces to machines
◦ OPC, Modbus, etc.
• Computers at point-of-use
◦ Still require manual input
• Hand-held / Hands-free scanners
◦ Simplify data collection and improve accuracy
◦ Convert physical movement to electronic data
• RFID
◦ Can completely automate some data collection
◦ Can still be costly and technically challenging
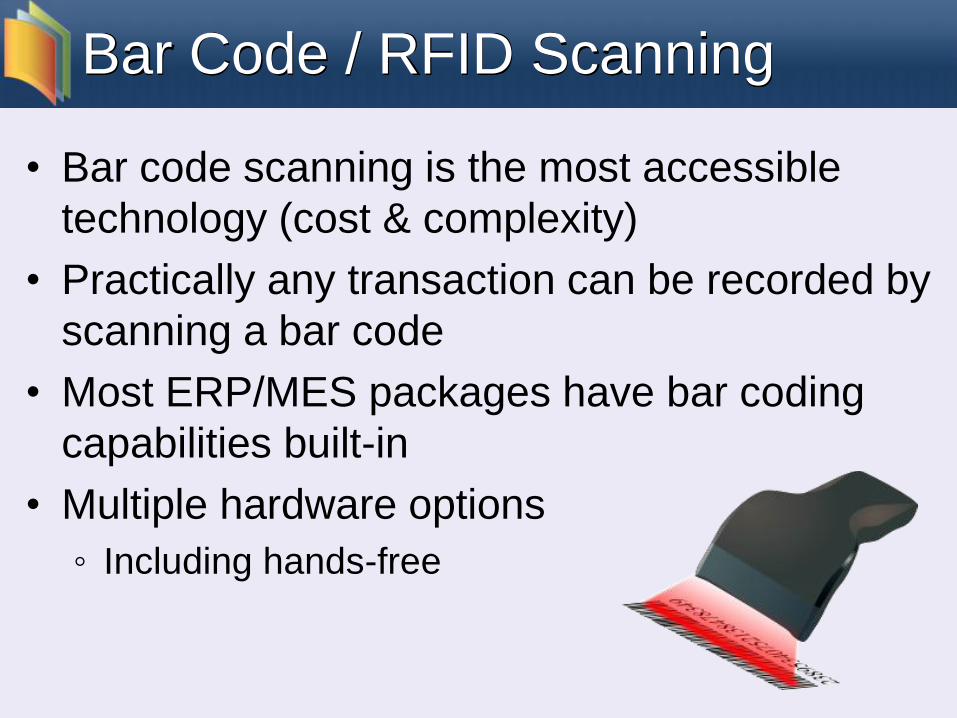
Bar Code / RFID Scanning
• Bar code scanning is the most accessible
technology (cost & complexity)
• Practically any transaction can be recorded by
scanning a bar code
• Most ERP/MES packages have bar coding
capabilities built-in
• Multiple hardware options
◦ Including hands-free

Case Study 1 – Quality
• Manufacturer was getting product sporadically
returned with bad welds
• At the “sales” level, no pattern was discernible
◦ different products, different customers, different
delivery dates, even different welders
• The installed MES had been capturing
numerous data points for production activities
Case Study 1 – Quality (cont)
• An analysis of the shop floor data was
undertaken
• Bad welds came from different welders,
regardless of product type
• The common factor was the weld bay used
when producing the product
• A physical investigation of the bay found that
the wind breaks were not sufficient when the
overhead door was opened

Case Study 2 – Routing Analysis
• Manufacturer builds standard product and has
expected times for each build operation
• All labour activities (time, work type,
completions) are captured on shop floor
• Planners are able to do statistical analysis on
actual versus expected times to identify:
◦ Deviations from expected time/cost
◦ Tasks where rework is prevalent
◦ Tasks where reengineering may be required
Case Study 3 – Recalls
• Manufacturer records lot information (heat
numbers) for all produced items
• A major recall for almost 1000 heat numbers
required identifying products and customers
that were affected
• Resulting analysis data set included 20,000
affected items and 50 customers
• MES coded to prevent accidental use or
shipment of bad product
Conclusion
• Analytics can significantly improve operational
efficiency and profitability
• The first step in being able to properly analyse
data is to collect the data
• Alberta discrete manufacturers have a
number of options to improve data collection

Q & A
• Questions?